1
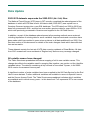
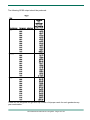
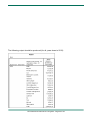
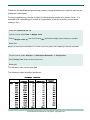
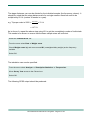
UK Data Archive SN 5340 - National Travel Survey, 2002-2012 National Travel Survey: Data Extract User Guide, 2002-2012 Contents Data Update 2 Key Issues 3 Survey Overview 4 Using NTS Data 7 Key Definitions 8 Weighting 9 Revisions 14 Sample Sizes 15 Annex A – example tabulation 16 Annex B – example tabulation 23 Annex C – example tabulation – Multi-coded data 28 NTS data extract 2002-2012 user guide - Page 1 of 32 Data Update 2002-2012 datasets supersede the 2002-2010 (SN: 5340) files: The National Travel Survey (NTS) team in DfT recently completed the redevelopment of the database in which all NTS data is held. All historic data (2002-2007) was copied from a Quantum Quanvert system into a new SQL database. The NTS data from 2008 to 2012 has been fully processed in SQL, and this has over written previous data for years 2008 to 2010 which was previously processed in Quantum and supplied to the UK Data Service. In addition, as part of the database redevelopment all processing methods were reviewed, including imputation of missing data for some variables. Improvements and corrections have been made which has resulted in some minor revisions to all data published from 2002. See Revision section of this document for details of the main changes made which have affected time series results. These datasets contain the last set of NTS data covering residents of Great Britain. All data from 2013 onwards will cover residents of England only as the survey coverage changed. All variable names have changed: The Table Structures spreadsheet includes a mapping of old to new variable names. This change also affects the variables used for merging files together, see section on Key identifier variables below. The data file containing all trip records is now called Trip.sav; in the 20022010 version it was named Journey.sav. A significant number of extra variables have been supplied to the UK Data Service for the End User Licence dataset. Further additional variables are available to users via Special Licence and the Secure Access Portal. The Table Structures spreadsheet indicates which variables are available and in which survey years – in this document ‘Full’ represents DfT’s own version of the database. NTS data extract 2002-2012 user guide - Page 2 of 32 Key issues to consider when analysing NTS data The NTS is primarily designed to measure long-term trends in travel in Great Britain and is not suitable for monitoring short-term trends. Careful attention should be paid to sample sizes for all analyses. (See section on Sampling errors) Appropriate 'short walk' weights should be applied to all trip/stage-level analysis to account for the fact that short walks are only recorded on the seventh day of the travel week. (See section on 'Short walk weighting') In addition, there is a weighting strategy to adjust for non-response and 'drop-off', appropriate weights should be applied to all analyses of data. (See section on 'Non-response and "drop-off" weighting') All analyses of data from the travel diary should be based on fully co-operating households only. Analysis at the individual, household and vehicle level should be based on the interview sample which includes data from additional 'partially cooperating' households. (See section on 'Weighting') Before carrying out any analysis, all users should first try to reproduce the examples in the annexes of this document and some published results tables to ensure they are using the data and applying the weights correctly. The 2012 NTS publication is available at: https://www.gov.uk/government/publications/national-travel-survey-2012 In addition, users should be familiar with the survey methodology to ensure data is analysed and interpreted correctly. See details below and the NTS technical information, available at: https://www.gov.uk/government/collections/national-travel-survey-statistics When analysing the data users should be aware that, although the core survey has remained consistent over time, some relatively minor changes are made to the survey each year, e.g. addition/removal of questions, changes to filters and variable categories. The appendix of the annual Technical Reports (see link above) give details of questionnaire changes since 2002. For advice on using and interpreting the NTS data, please contact: [email protected] NTS data extract 2002-2012 user guide - Page 3 of 32 Survey Overview Survey background The NTS is carried out in order to monitor long-term changes in personal travel and provide a better understanding of the use of transport facilities made by different sectors of the population. Individuals in sampled households are interviewed face-to-face to collect personal information, such as age, gender, working status, car access and driving licence holding. They are also asked to complete a seven day travel diary and provide details of trips undertaken, including purpose, method of travel, time of day and trip length. The first NTS survey was commissioned by the Ministry of Transport in 1965 with further periodic surveys being carried out in 1972/73, 1975/76, 1978/79 and 1985/86. There are a number of differences between the current survey and surveys up to 1978/79. These are detailed in Chapter 7 of the National Travel Survey 2008 Technical Report, which is available on the archived NTS website at: http://webarchive.nationalarchives.gov.uk/20091203140650/http://www.dft.gov.uk/pgr/statistic s/datatablespublications/personal/methodology/ntstechreports/ntstechrep2008 Conducting the survey Prior to the interviewer’s first call, letters are sent out to the sampled addresses. These introduce the survey and explain that an interviewer will call. The interviewer then arranges an appointment for a ‘placement interview'. During this visit, the interviewer obtains information on the household, each household member and on all vehicles to which the household has access, via a computer assisted personal interview (CAPI). The procedures for the seven day travel diary record are then explained. Each household is given a randomly assigned start date for the seven day travel diary. The placement call is generally followed by a reminder call, just before the start of the travel week, to remind the household to begin their travel records, and by a midweek call during the travel week to check that records are being completed correctly. Within six days of the end of the travel week the interviewer will make a 'pick-up call' to collect the travel records and to check the information recorded with the informants. Data types The data is hierarchical in nature and consists of several record types or 'levels'. Most significantly, data is held about households, vehicles, individuals, trips and stages. Data from each level are linked to make cross-level analysis possible. NTS methodology determines that vehicles belong to households and not individuals. Vehicle data, therefore, can only be analysed by household or vehicle attributes. NTS data extract 2002-2012 user guide - Page 4 of 32 Levels in the NTS database PSU (Primary Sampling Unit) Household Individual Ticket LDJ (Long Distance Journey) Vehicle Day Trip PSU – Primary Sampling Units (PSU) are used to provide a list of areas from which to select a sample of addresses from. In this case each PSU is a postcode sector. Stage Key identifier variables To enable the linking of data from each level of the dataset hierarchy, a set of identifier variables are attached to each data file. The combination of identifier variables that uniquely identifies a record at each level of the database are: PSU Household Vehicle Individual LDJ Day Trip Stage Ticket - PSUID HouseholdID VehicleID IndividualID LDJID DayID TripID StageID IndTicketID To link levels together the identifier variables from the highest analysis level should match those at the lower level. These identifier variables are new unique IDs which allow for linkage between data levels (without requiring linkage on multiple variables, as in previous versions of the datasets held by the UK Data Service). NTS data extract 2002-2012 user guide - Page 5 of 32 Example: To link an individual to the trips they made, merge the individual and trip level files and ensure that the individual level identifier, IndividualID, matches on both files: Individual.IndividualID=Trip.IndividualID If merging datasets together, users should remove unwanted variables to reduce the file sizes and length of time it takes to merge. See examples in Annex A and B for detailed instructions of how to merge data files. NTS data extract 2002-2012 user guide - Page 6 of 32 Using NTS Data Distance The length of any trip stage is the distance actually covered, as reported by the traveller, and not the distance as the crow flies. Distance is measured in miles (previous versions of the datasets held by the UK Data Service used tenth of mile). Distance by mode Average distance travelled results are calculated based on the stage distance for each mode and are presented as ‘average distance travelled by ‘mode’ – see table NTS0305. Trip rates are usually presented as ‘main mode’, i.e. based on the mode that is the longest stage distance – see table NTS0303. Time Unit = minutes. Denominator It is standard NTS methodology to include all respondents in the denominator not just those making trips. For example children should be included when calculating driver trips rates. Number of records There are less records in 2011 due to the GPS experiment which was conducted using a sub sample and data collected was not incorporated into the main database. Mode: Taxi/minicab When using main mode or mode variables the split between taxi and minicab should not be used as it is not accurate. Results should be presented combined like published tables, e.g. NTS0303 Mode: Walking Short walks (those under one mile) are only collected on day 7 of the travel diary. ‘Short walk weights’ account for this and should be applied when producing analysis – see ‘Weighting’ section below. For detailed walking trip analysis it may be necessary to limit the base sample to day 7 only data, e.g. NTS9909. NTS data extract 2002-2012 user guide - Page 7 of 32 Key Definitions Trip A trip is defined as a one-way course of travel having a single main purpose, e.g. a walk to school or a trip to work without any break in travel. Usually the respondent is clear what the single main purpose of a particular trip is. However, sometimes people go out for a number of reasons, or go out for one main reason but carry out a number of different activities, perhaps at different places. Complex travel like this is broken into separate trips so that the data can be analysed. Where a stop is entirely secondary to the main purpose (such as a stop to buy a newspaper on the way to work), the stop is disregarded. Stage A trip consists of one or more stages. A new stage is defined when there is a change in the form of transport or when there is a change of vehicle requiring a separate ticket. In order to reduce the burden on respondents, travel involving a number of stops for the same main purpose and using the same form of transport are treated as one continuous ‘series of calls’ trip from the first such call to the last one. Only shopping and ‘in course of work’ travel can be treated in this way. A doctor’s round could therefore consist of one trip to the first patient, one series of calls trip to the other patients and one trip from the last call back to the surgery or home. A full list of definitions is available in the 2012 Notes and Definitions document available at: https://www.gov.uk/government/uploads/system/uploads/attachment_data/file/226817/nts201 2-notes.pdf NTS data extract 2002-2012 user guide - Page 8 of 32 Weighting Short walk weighting Because trips of less than one mile in distance are recorded only on the seventh day of the travel week, these trips must be weighted by a factor of seven when analysed. Also, for consistency with earlier surveys, 'series of calls' trips are excluded from analysis of stage and trip counts and time. Therefore, one of the following 'short walk weights' must be applied to any tabulations using trip or stage counts, distance or time: SSXSC Number of stages to be counted, grossed for short walks and excluding ‘series of calls’ trips. SD Stage distance travelled, grossed for short walks. STTXSC Stage travelling time grossed for short walks and excluding ‘series of calls’ trips. JJXSC Number of trips to be counted, grossed for short walks and excluding ‘series of calls’ trips. JD Trip distance travelled, grossed for short walks. JOTXSC Overall trip time (includes travelling and waiting time), grossed for short walks and excluding ‘series of calls’ trips. JTTXSC Trip travelling time, grossed for short walks and excluding ‘series of calls’. These weighted variables have been constructed as follows: SSXSC If 'series of calls' SSXSC = 0 If not 'series of calls' and 'short walk stage' SSXSC = 7 If not 'series of calls' and not 'short walk stage' SSXSC = 1 NTS data extract 2002-2012 user guide - Page 9 of 32 STTXSC If 'series of calls' STTXSC = 0 * StageTime If not 'series of calls' and 'short walk stage' STTXSC = 7 * StageTime If not 'series of calls' and not 'short walk stage' STTXSC = 1 * StageTime SD If 'short walk stage' SD = 7 * StageDistance If not 'short walk stage' SD = 1 * StageDistance JJXSC If 'series of calls' JJXSC = 0 If not 'series of calls' and 'short walk trip' JJXSC = 7 If not 'series of calls' and not 'short walk trip' JJXSC = 1 JOTXSC If 'series of calls' JOTXSC = 0 * TripTotalTime If not 'series of calls' and 'short walk trip' JOTXSC = 7 * TripTotalTime If not 'series of calls' and not 'short walk trip' JOTXSC = 1 * TripTotalTime JTTXSC If 'series of calls' JTTXSC = 0 * TripTravTime If not 'series of calls' and 'short walk trip' JTTXSC = 7 * TripTravTime If not 'series of calls' and not 'short walk trip' JTTXSC = 1 * TripTravTime JD JD = Sum(SD) Stage distances NTS data extract 2002-2012 user guide - Page 10 of 32 Non-response and "drop-off" weighting In addition to the short walk weights described above, a weighting strategy for the NTS was developed following a recommendation in the 2000 National Statistics Quality Review of the NTS. For the first time, the 2005 NTS results were based on weighted data. The weighting methodology was applied to data back to 1995 and all NTS figures for 1995 onwards which are published or released are now based on weighted data. As well as adjusting for non-response bias, the weighting strategy for the NTS also adjusts for the drop-off in the number of trips recorded by respondents during the course of the travel week; for uneven recording of short walks by day of the week and for the short-fall in reporting of long distance trips. Further information on the weighting methodology is available in the 2012 Technical Report at the link below. Please note that “W” notation in the Technical Report is not the same as the “W” notation in the NTS datasets as described in the ‘Weighting matrices’ section below). https://www.gov.uk/government/uploads/system/uploads/attachment_data/file/225735/nts201 2-technical.pdf Therefore, there are several sets of weights which apply to different levels of the database; household, trip and long distance journey. It is important to select the correct weights for each analysis. Initial results should be checked against published data to ensure weights are being applied correctly. There are two samples which can be used for analysis: Diary sample Analysis of travel data is based on the diary sample. This comprises all 'fully co-operating households', defined as households for which the following information is available: a household interview, an individual interview for each household member, a seven day travel diary for each individual and, where applicable, at least one completed vehicle section. Weights were produced to adjust for non-response and, at the trip-level, they were also produced for drop-off in recording observed during the seven day travel week. Interview sample Analyses at household, individual and vehicle level are based on the interview sample. This sample comprises all fully co-operating households included in the diary sample, together with some additional 'partially co-operating households'. Generally these partially co-operating households had co-operated fully with the various interviews but not all household members had completed the travel diary. Prior to the introduction of the weighting methodology, data from partially co-operating households was not included in NTS analyses but this expanded dataset is now used for analyses which do not require data from the seven day travel record. NTS data extract 2002-2012 user guide - Page 11 of 32 Fully co-operating households (Interview data + travel data) } Diary sample Partially co-operating households (Interview data only) } It is important to use the correct sample for all analysis. The weighting methodology produces weights at the household, LDJ and trip level. The household weights apply to all individuals and vehicles within the household, and they have therefore been attached to the individual and vehicle files for ease of use. Similarly, the trip level weights apply to all stages within trips and have therefore been attached to the stagelevel records for ease of use. The variable ' OutCom_B02ID' (1=fully productive, 0=partially productive) is included on the household file to enable users to select the diary sample. This variable can be merged into other files if necessary, e.g. individual file. Weighting matrices The following weighting matrices are available and should be used on the appropriate level data for the analysis being produced: W1 Unweighted diary sample - this gives unweighted results for the diary sample only. (This is equivalent to the results produced before the weighting strategy was introduced and can be used to generate unweighted sample sizes for analysis of the diary sample. It is effectively the same as the OutCom_B02ID variable mentioned above – formerly named the ‘status’ variable). W2 Diary sample household weight – (adjusts for non-response) apply to all analysis of the diary sample at household, individual and vehicle level. W3 Interview sample household weight - apply to all analysis of the interview sample at household, individual and vehicle level. W4 LDJ weight incorporating household weight - apply to all analysis at LDJ level NTS data extract 2002-2012 user guide - Page 12 of 32 W4xhh LDJ weight excluding household weight – apply only if also applying a household weight (i.e. W2 or W3) W5 Trip/stage weight - apply to all analysis of trip and stage data W5xhh Trip/stage weight excluding household weight - apply only if also applying a household weight (i.e. W2 or W3) No weighting matrix or W0 If no weighting matrix is applied, this gives unweighted results for the interview sample. For most analyses at household, individual and vehicle level, w3 should be applied. For most analyses of travel patterns, w5 should be applied to trip/stage data and w2 should be applied at the individual level in order to calculate rates. In addition, the short walk weights should be applied (see 'Short walk weighting' above). Examples of applying weights: To generate trip rates - apply w5 to trip data and apply w2 to individual data (i.e. Diary sample) To calculate household car ownership - apply w3 to the household data (Interview sample) To calculate the proportion of driving licence holders - apply w3 to the individual data (Interview sample) To determine the unweighted sample size for trip rate analysis - apply w1 to the trip data and w1 to the individual data (Diary sample) To determine the unweighted sample size for household car ownership or driving licence figures - apply no weights or w0 (Interview sample) Long distance journey (LDJ) weights Long distance journeys (trips over 50 miles) are collected in two ways in the NTS – via the travel diary and in the interview. From 2002-2005 long distance trips were collected during the interview for an additional period of 3 weeks prior to the start of the travel diary. From 2006 onwards, they have been collected during the single week prior to the placement interview. Analysis of the LDJ data a few years ago highlighted concerns over the quality of the interview recall data compared to the data collected during the travel week via the diary. Therefore the LDJ weighting methodology was revised back to 2006 to take account of the NTS data extract 2002-2012 user guide - Page 13 of 32 systematic under-reporting of shorter long distance journeys. The re-weighting had little impact upon the overall LDJ trip rates. However, it resulted in a downward adjustment to distance estimates. Revisions The following are the main changes made to the 2002-2012 datasets which account for the difference in the datasets for 2002-2010 previously available from the UK Data Service. SQL processing of 2008-2012 raw data Due to changed imputation methodologies for key variables, e.g. trip mode and purpose, the trip data processed in SQL for 2008-2010 needed to be re-weighted. In most cases the overall results have changed very little from those processed in the old database. Geographic data A full recode of all geographic variables at all levels was conducted so that there was a consistent time series available from 2002-2012 at household level. This included creating a new Area Type variable which now correctly allocates households in South Yorkshire to the Metropolitan built-up areas category. This recoding also now makes the allocation of Scottish postcodes to an area type prior to 2007 consistent with 2007 onwards. More information on Area type can be found in the 2012 Notes & Definitions document. All published results tables by region and area type are now all based on household geographies rather than at the PSU level so there are some minor differences. Ticket data The data on tickets used and the associated costs for each stage have been re-processed in a consistent way for all years from 2002. These data are now available in a separate ticket file – previously they were within the individual data file. Corrections Whilst working on the database redevelopment project some errors were found in the processing of some NTS data in Quantum Quanvert. These errors have been corrected in the new SQL database and therefore the 2002-2012 raw datasets. The allocation of ‘missing’ (NA) and ‘does not apply’ (DNA) cases has also been made consistent over all years. Imputation indicators The NTS now includes imputation indicators in the data files for Household, Vehicle, Individual, Trip and Stage for some key variables from 2008 to 2012. These indicators inform users if the value was originally missing and hence imputed. NTS data extract 2002-2012 user guide - Page 14 of 32 Weighted and unweighted sample sizes, 1995-2012 Sample numbers on which analyses are based: Great Britain, 1995 to 2012 1 Number 1995 1996 1997 1998 1999 2000 2001 2002r 2003r 2004r 2005r 2006r 2007r 2008r 2009r 2010r 2011r Household sample Unweighted diary Unweighted interview Weighted diary Weighted interview 3,211 3,491 3,209 3,490 3,210 3,505 3,211 3,506 3,139 3,465 3,139 3,463 2,935 3,300 2,938 3,303 3,020 3,376 3,018 3,374 3,435 3,783 3,431 3,782 3,469 3,760 3,472 3,761 7,437 8,849 7,437 8,849 8,258 9,196 8,258 9,196 8,122 8,991 8,122 8,991 8,430 9,453 8,430 9,453 8,297 9,261 8,297 9,261 8,431 9,278 8,431 9,278 8,094 8,924 8,094 8,924 8,384 9,128 8,384 9,128 8,097 8,775 8,097 8,775 7,741 8,461 7,741 8,461 8,201 8,972 8,201 8,972 Individual sample Unweighted diary Unweighted interview Weighted diary Weighted interview 7,723 8,521 7,675 8,348 7,665 8,504 7,704 8,405 7,473 8,452 7,487 8,258 6,842 7,945 6,986 7,857 6,970 8,000 7,109 7,945 8,056 9,054 8,114 8,942 7,978 8,833 8,132 8,811 16,886 20,827 17,494 20,789 19,467 21,990 19,578 21,795 19,199 21,588 19,302 21,369 19,904 22,702 20,103 22,539 19,490 22,141 19,794 22,098 19,735 21,931 19,940 21,959 18,983 21,165 19,253 21,219 19,914 21,835 19,918 21,706 19,072 20,839 19,210 20,819 18,069 19,988 18,339 20,057 19,154 21,243 19,547 21,385 Child (<16 yrs) sample Unweighted diary Unweighted interview Weighted diary Weighted interview 1,744 1,945 1,602 1,741 1,666 1,869 1,634 1,782 1,650 1,917 1,547 1,704 1,433 1,708 1,447 1,626 1,466 1,703 1,467 1,631 1,731 1,971 1,666 1,835 1,659 1,860 1,624 1,764 3,413 4,398 3,523 4,181 4,178 4,702 3,900 4,336 4,129 4,690 3,815 4,222 4,150 4,776 3,963 4,443 3,938 4,497 3,848 4,296 3,971 4,408 3,759 4,141 3,804 4,260 3,684 4,057 4,042 4,414 3,790 4,118 3,865 4,193 3,660 3,962 3,540 3,921 3,524 3,852 3,661 4,115 3,718 4,060 Adult (16+) sample Unweighted diary Unweighted interview Weighted diary Weighted interview 5,979 6,576 6,074 6,606 5,999 6,635 6,069 6,623 5,823 6,535 5,940 6,553 5,409 6,237 5,539 6,231 5,504 6,297 5,640 6,315 6,325 7,083 6,447 7,107 6,319 6,973 6,508 7,047 13,473 16,429 13,971 16,608 15,289 17,288 15,678 17,459 15,070 16,898 15,487 17,147 15,754 17,926 16,141 18,097 15,552 17,644 15,945 17,801 15,764 17,523 16,181 17,818 15,179 16,905 15,569 17,162 15,872 17,421 16,128 17,587 15,207 16,646 15,550 16,857 14,529 16,067 14,815 16,206 15,493 17,128 15,829 17,325 Motor vehicle sample Unweighted diary Unweighted interview Weighted diary Weighted interview 3,296 3,642 3,339 3,629 3,301 3,691 3,374 3,694 3,238 3,653 3,313 3,663 3,121 3,608 3,201 3,601 3,217 3,681 3,270 3,664 3,772 4,240 3,843 4,237 3,707 4,081 3,780 4,090 8,195 9,954 8,391 9,959 9,264 10,452 9,408 10,465 9,065 10,190 9,261 10,270 9,847 11,228 10,059 11,264 9,758 11,118 9,875 11,028 9,898 10,975 10,005 10,995 9,511 10,588 9,655 10,636 9,985 10,911 9,956 10,841 9,750 10,675 9,790 10,594 9,192 10,136 9,214 10,079 9,702 10,678 9,664 10,569 126,088 124,748 122,397 112,867 114,501 130,179 129,998 278,916 314,845 310,065 322,500 312,347 305,077 295,791 306,743 290,803 272,208 289,573 156,729 153,366 150,403 137,851 138,233 155,644 155,789 326,495 369,664 363,692 379,315 369,072 353,191 341,529 358,500 337,402 316,494 335,288 . 129,356 . . 133,896 127,242 . 120,996 . 123,182 . 137,689 . 139,240 . 302,796 . 333,833 . 326,869 . 345,996 . 336,802 . 324,882 . 319,902 . 320,257 . 308,431 . 291,072 . 310,732 159,163 162,418 154,703 Trip sample Unweighted diary Unweighted diary (short walks grossed up & excluding series of calls) Unweighted interview Weighted diary Weighted diary (short walks grossed up & excluding series of calls) Weighted interview Stage sample Unweighted diary Unweighted diary (short walks grossed up & excluding series of calls) Unweighted interview Weighted diary Weighted diary (short walks grossed up & excluding series of calls) Weighted interview 2012 146,148 147,271 162,950 165,284 351,123 388,152 379,887 402,356 393,812 371,823 366,326 371,473 354,900 337,029 357,616 . . . . . . . . . . . . . . . . 131,548 129,690 127,273 117,269 119,072 136,324 134,036 289,048 327,230 322,602 335,940 326,076 318,996 309,722 320,858 304,942 284,718 303,436 174,261 169,384 166,421 150,833 151,978 172,463 167,939 349,251 396,761 391,871 408,775 399,973 384,402 371,642 390,741 370,279 345,030 367,019 . 135,017 . . 139,423 132,494 . 125,838 . 128,346 . 144,406 . 143,953 . 314,728 . 348,024 . 341,321 . 361,449 . 352,392 . 340,520 . 335,877 . 335,727 . 324,118 . 305,012 . 326,477 177,225 180,055 172,061 160,462 162,999 181,506 179,767 378,777 419,996 412,966 437,211 430,032 407,550 401,690 408,304 392,572 370,194 395,017 . . . . . . . . . . . . . . . . . . . . 1 Data for 1995 to 2001 is based on calendars years. Data for 2002 to 2012 is based on survey years which run mid-January to mid-January. https://www.gov.uk/government/uploads/system/uploads/attachment_data/file/225736/nts201 2-sample.xls Note: Between 1995 and 2001 published NTS analysis is based on the calendar year in which a household started completing their travel diary. Analysis from 2002 onwards is based on the survey year (mid-January to mid-January) in which the household was sampled. NTS data extract 2002-2012 user guide - Page 15 of 32 Annex A: Example tabulation 1 NTS data users should replicate analysis produced by DfT to ensure that they understand the methodology of weighting and the grossing up of short walks. Trips per person per year by gender and survey year Load the journey level SPSS data file ‘Trip.sav’ Load the individual level SPSS data file ‘Individual.sav’ Before performing the analysis you should ensure that both files are sorted based on the key identifier variables at each level. Select the Trip file. From the menu select Data -> Sort Cases Highlight TripID and move over to the ‘Sort by’ list. Ensure that ascending is checked. The ‘Sort by’ list should contain: TripID (A) Select OK. Select the Individual file. From the menu select Data -> Sort Cases Highlighting IndividualID and move over to the ‘Sort by’ list. Ensure that ascending is checked. The ‘Sort by’ list should contain IndividualID (A) Select OK. NTS data extract 2002-2012 user guide - Page 16 of 32 To disaggregate the data by the gender of the individual making the trip, individual level data needs to be attached to the trip file. Select the Trip file. From the menu select Data -> Merge files -> Add variables Select ‘An open dataset’ and then select file ‘Individual.sav’ Select continue. Data should be linked using the identifier variable at individual level – IndividualID. Check ‘Match cases on key variables’ and ‘Cases are sorted in order of key variables in both datasets’ Check ‘Non-active dataset is keyed table’ From the excluded variables list highlight IndividualID and move to the key variables box Select OK. A message will appear ‘Warning: Keyed match will fail if data are not sorted in ascending order of key variables’ This can be ignored as we have already ensured the correct sorting order. The individual characteristics of the person making each trip will now be attached to the journey data. Before producing the tabulation of gender by survey year, the weighting must be specified: From the menu select Data -> Weight cases Check ‘Weight cases by’ and move across W5 (trip weight) as the frequency variable. Select OK. NTS data extract 2002-2012 user guide - Page 17 of 32 The tabulation can now be specified. From the menu select Analyze -> Compare Means -> Means To gross up short walks we must use variable JJXSC as the dependent list variable. Move JJXSC across to ‘Dependent List’ Select Gender as the layer 1 variable by moving Sex_B01ID across to the independent list selection Select ‘Next’ to choose the 2nd layer variable Select Survey Year as the layer 2 variable by moving SurveyYear across to the independent list selection Select ‘Options’ to determine the type of statistics to perform. Move ‘Sum’ across to the ‘Cell statistics’ box. Remove all other statistics. Select continue. Select OK. NTS data extract 2002-2012 user guide - Page 18 of 32 The following SPSS output should be produced: These are the weighted and grossed up number of trips per week for each gender/survey year combination. NTS data extract 2002-2012 user guide - Page 19 of 32 For each gender/survey year the weighted number of individuals also needs to be known. Note – it is standard NTS methodology to include all respondents in the denominator not just those making a trip. Select the ‘Individual.sav’ file. Before producing the tabulation of gender by survey year, the weighting must be specified From the menu select Data -> Weight cases Check ‘Weight cases by’ and move across W2 (household non-response weight) as the frequency variable. Select OK. The tabulation can now be specified. From the menu select ‘Analyze’ -> ‘Descriptive Statistics’ -> ‘Crosstabs’ Move Survey Year across to the row specification box Move Sex_B01ID across to the column specification box Select Cells and in the Non-integer weights section select ‘No adjustments’ Select OK. The following SPSS output should be produced: NTS data extract 2002-2012 user guide - Page 20 of 32 The trip counts can now be divided by the individual sample. It should be noted that the trip counts are for a single week so therefore need to be multiplied by 52.14 (number of weeks in a year). e.g. Trips per male in 2002 The following results should be calculated showing trips per person per year by gender: Male Female Total Year Trip rate 2002 1037 2003 1027 2004 1013 2005 1031 2006 1014 2007 950 2008 969 2009 947 2010 938 2011 935 2012 935 2002/12 average 981 2002 1055 2003 1040 2004 1039 2005 1056 2006 1060 2007 994 2008 1014 2009 997 2010 988 2011 981 2012 972 2002/12 average 1018 2002 1047 2003 1034 2004 1026 2005 1044 2006 1037 2007 972 2008 992 2009 972 2010 963 2011 958 2012 954 2002/12 average 1000 NTS data extract 2002-2012 user guide - Page 21 of 32 Finally, repeat the above step using W1 to get the unweighted number of individuals. This needs to be known to ensure that the base sample sizes are sufficient. Select the ‘Individual.sav’ file. Before producing the tabulation of gender by survey year, the weighting must be specified From the menu select Data -> Weight cases Check ‘Weight cases by’ and move across W1 (unweighted diary weight) as the frequency variable. Select OK. The tabulation can now be specified. From the menu select ‘Analyze’ -> ‘Descriptive Statistics’ -> ‘Crosstabs’ Move Survey Year across to the row specification box Move Sex_B01ID across to the column specification box Select OK. The following SPSS output should be produced: NTS data extract 2002-2012 user guide - Page 22 of 32 Annex B: Example tabulation 2 Miles per person per year, by mode (at stage level) Load the stage level data file ‘Stage.sav’ Load the individual level data file ‘Individual.sav’ Before performing the analysis you should ensure that both files are sorted based on the key identifier variables at each level. Select the Stage file. From the menu select Data -> Sort Cases Highlight StageID and move over to the ‘Sort by’ list. Ensure that ascending is checked. Select OK. Select the Individual file. From the menu select Data -> Sort Cases Highlighting IndividualID and move over to the ‘Sort by’ list. Ensure that ascending is checked. Select OK. NTS data extract 2002-2012 user guide - Page 23 of 32 Before producing the tabulation of stage distance by survey year and mode, the weighting must be specified. Select the Stage file From the menu select Data -> Weight cases Check ‘Weight cases by’ and move across W5 (stage weight) as the frequency variable. Select OK. The tabulation can now be specified. From the menu select Analyze -> Compare Means -> Means To gross up short walks we must use variable SD as the dependent list variable. Move SD across to ‘Dependent List’ Select SurveyYear as the layer 1 variable by moving it across to the independent list selection Select ‘Next’ to choose the 2nd layer variable Select Stage Mode as the layer 2 variable by moving StageMode_B01ID across to the independent list selection Select ‘Options’ to determine the type of statistics to perform. Move ‘Sum’ across to the ‘Cell statistics’ box. Remove all other statistics. Select continue. Select OK. NTS data extract 2002-2012 user guide - Page 24 of 32 The following output should be produced (for all years down to 2012): NTS data extract 2002-2012 user guide - Page 25 of 32 These are the weighted and grossed up number of stage distances per week for each survey year/mode combination. For each mode/survey year the number of individuals also needs to be known. Note – it is standard NTS methodology to include all respondents in the denominator not just those making a trip. Select the ‘Individual.sav’ file. From the menu select Data -> Weight cases Check ‘Weight cases by’ and move across W2 (household weight) as the frequency variable. Select OK. Before producing the tabulation of mode by survey year, the weighting must be specified. From the menu select ‘Analyze’ -> ‘Descriptive Statistics’ -> ‘Frequencies’ Move Survey Year across to the Column box Select OK. The tabulation can now be specified. The following output should be produced: NTS data extract 2002-2012 user guide - Page 26 of 32 The stage distances can now be divided by the individual sample (the frequency column). It should be noted that the stage distances are for a single week so therefore need to be multiplied by 52.14 (number of weeks in a year). e.g. Trips per male in 2002 As in Annex A, repeat the above step using W1 to get the unweighted number of individuals. This needs to be known to ensure that the base sample sizes are sufficient. Select the ‘Individual.sav’ file. From the menu select Data -> Weight cases Check ‘Weight cases by’ and move across W1 (unweighted diary weight) as the frequency variable. Select OK. The tabulation can now be specified. From the menu select ‘Analyze’ -> ‘Descriptive Statistics’ -> ‘Frequencies’ Move Survey Year across to the Column box Select OK. The following SPSS output should be produced: NTS data extract 2002-2012 user guide - Page 27 of 32 In addition, the unweighted number of stages for each mode should be obtained to ensure that the sample sizes on which the miles are based are sufficient. Annex C: Example tabulation 3 – Multi-coded data Reasons for not learning to drive by age Load the individual level data file ‘Individual.sav’ Before producing the tabulation of individuals and their reasons for not learning to drive by age, the weighting must be specified. NTS data extract 2002-2012 user guide - Page 28 of 32 From the menu select Data -> Weight cases Check ‘Weight cases by’ and move across W3 (interview sample weight) as the frequency variable. Select OK. In this case we are only interested in data for 2012. To restrict the data file to cases for 2012 From the menu select Data -> Select cases Check ‘If condition is satisfied’ and select If… Move SurveyYear across to the definition box and enter ‘=2012’. The box should read ‘SurveyYear=2012’. Select OK. only: Any outputs will now only use individuals from the 2012 survey. The tabulation can now be specified. From the menu select ‘Analyze’ -> ‘Descriptive Statistics’ -> ‘Crosstabs’ Move ResNDN_A_B01ID across to the row specification box Repeat this step for all ResNDN variables (B to P). Move Age_B04ID across to the column specification box Select Cells and in the Non-integer weights section select ‘No adjustments’ Select OK. The following SPSS output should be produced (for each response variable – there are 16 possible responses, A-P): NTS data extract 2002-2012 user guide - Page 29 of 32 The weighted number of individuals also needs to be known. From the menu select Data -> Weight cases Check ‘Do not weight cases’ Select OK. First, turn the weighting off: Next, we must ensure that we are only counting individuals who have been asked their From the menu select Data -> Select cases Select If… condition. Edit the definition to select individuals answering the question. The box should read ‘SurveyYear=2012 & (ResNDN_NA_B01ID=2 & ResNDN_DNA_B01ID=2 & ResNDN_DEAD_B01ID=2)’. Select OK. reasons for not learning to drive. NTS data extract 2002-2012 user guide - Page 30 of 32 From the menu select Analyze -> Compare Means -> Means To count the weighted number of individuals we need to count W3. Move W3 across to ‘Dependent List’ Select Age_B04ID as the layer 1 variable by moving it across to the independent list selection Select ‘Options’ to determine the type of statistics to perform. Move ‘Sum’ across to the ‘Cell statistics’ box. Remove all other statistics. Select continue. Select OK. The tabulation can now be specified: The following SPSS output should be produced: To calculate all percentages (as in NTS0203) divide the weighted number of individuals for each response and age group by the relevant total number of individuals. e.g. Percentage of individuals aged 17-20 with the reason ‘Family or friends can drive me when necessary’ given = Repeat, the above step with W0 (no weight) to get the unweighted number of individuals. NTS data extract 2002-2012 user guide - Page 31 of 32 The following SPSS output should be produced: NTS data extract 2002-2012 user guide - Page 32 of 32