1
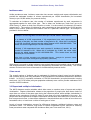
Statistics and Research Branch The Northern Ireland Crime Survey: User Guide April 2012 1 Northern Ireland Crime Survey: User Guide CONTENTS 1. Background to the NICS 1 1.1 About the NICS 1.2 The need for both recorded crime and the NICS 1 1 2. Methodology 3 2.1 Sample design and fieldwork 2.2 Questionnaire 2.3 Reference period 2.4 Measuring victimisation 2.5 Offence coding 2.6 Incident classification 3 3 4 5 5 6 3. NICS Analysis - Experience of Crime 7 3.1 Types of analysis 3.2 Rates-based analysis 3.3 Repeat and multiple victimisation 7 7 8 4. NICS Analysis - Perceptions of Crime 9 4.1 Worry about crime indicators 4.2 Likelihood of victimisation indicators 4.3 Anti-social behaviour indicators 4.4 Perceptions of the crime rate 9 9 10 10 5. Statistical conventions and methods 11 5.1 Weighting 5.2 Design effect 5.3 Base numbers 5.4 Confidence intervals and statistical significance 5.5 Don’t know and refusal responses 11 11 11 12 12 6. Classifications 13 6.1 Geographical 6.2 Household 6.3 Personal 13 13 14 7. Methodological limitations 15 8. NICS publications 16 APPENDIX A: Classification of NICS incidents and offence categories 18 References 19 i Northern Ireland Crime Survey: User Guide 1. Background to the NICS 1.1 About the NICS The Northern Ireland Crime Survey (NICS) is a representative, continuous, personal interview survey in which people aged 16 and over living in private households in Northern Ireland are asked about their experiences of crime in the 12 months prior to interview as well as their perceptions of crime-related issues, including policing and justice, crime and anti-social behaviour. Self-completion modules are used to elicit information on sensitive topics, such as drug misuse and domestic violence. The survey was first conducted in 1994/95, with further cycles in 1998, 2001 and 2003/04. In 2005, in light of the discontinuation of the Community Attitudes Survey and the requirement to have a more robust vehicle to track progress against Public Service Agreement (PSA) and other targets related to the criminal justice sector, the NICS moved to an annual format with continuous fieldwork. Since 2006/07, its reporting cycle has been aligned with the financial year. While the NICS closely mirrors the format and core content of the British Crime Survey (BCS), which covers England and Wales, some modification is necessary to reflect local issues and the fact that the smaller sample size would not generate robust results for follow-up questions asked of small sub-sections. Its results play an important role in informing and monitoring government policies and targets, for example, strategies relating to public confidence, crime reduction, community safety and domestic violence. An alternative, but complementary, measure of crime to offences recorded by the police, the main aims of the NICS are to: measure crime victimisation rates experienced by people living in private households, whether or not these crimes were reported to or recorded by the police; monitor trends in the level of crime, independent of changes in reporting levels or police recording practices; measure people’s perceptions about and reactions to crime (for example, the level and causes of crime, the extent to which they are concerned about crime and the effect of crime on their quality of life); identify the characteristics and circumstances of people most at risk from and affected by different types of crime; measure public confidence in policing and the wider criminal justice system; and collect sensitive information, using self-completion modules, on people’s experiences regarding crime-related issues, such as drug misuse and domestic violence. 1.2 The need for both recorded crime and the NICS Recorded crime statistics are produced by the Police Service of Northern Ireland (PSNI) in line with Home Office counting rules and the National Crime Recording Standard (NCRS), and are broadly comparable with those supplied by police forces in England and Wales. They provide year-on-year changes for the full range of notifiable offence categories, typically the more serious types of offence, provide a good measure of trends in well-reported crimes as well as the less common but more serious crimes (in particular, homicide, which is not covered by the NICS), are 1 Northern Ireland Crime Survey: User Guide an important indicator of police workload, and provide data for small geographic areas (Chaplin et al., 2011). The level of recorded crime can, however, be affected by changes in both police recording and counting practices and in levels of reporting incidents to the police. For example, in April 1998 the Home Office Counting Rules were expanded to include certain additional summary offences, and crime counts became more victim-based. This resulted in a substantial increase in the number of crimes recorded in 1998/99 when compared with 1997/98. In addition, in April 2001 PSNI introduced a new crime recording system which improved data collection and coverage. As a result more low level crime was identified and included in the recorded crime statistics. NCRS was then introduced by the Home Office in April 2002 but, as the impact of this new guidance was mainly experienced within PSNI through the new system introduced the previous year, crime levels were less affected. Further information on recorded crime statistics can be found in the PSNI Crime Statistics User Guide (http://www.psni.police.uk/user_guide.pdf). While recorded crime statistics do not include the high proportion of offences that are not reported to the police or that the police do not record, they include a wider range of crime types. The NICS excludes, for instance, fraud, crimes against children, crime against businesses and other organisations, and those crimes termed as ‘victimless’, for example, possession of drugs. In addition, the NICS does not cover the population living in group residences, for example, care homes or halls of residence, although this is thought to have little effect on estimates (see Pickering et al., 2007). Recorded crime figures cannot, by their nature, provide an impression of the extent of concern about crime (often described as ‘fear of crime’) among different sections of the community. Hence, it is necessary to complement the police figures with information drawn from the NICS, which, for the crime types it covers, provides a more complete measure of the extent and impact of crime against private households and their adult occupants. Due to methodological consistencies between sweeps, and the fact that the data collected are unaffected by police reporting and recording practices, the NICS has the potential to become a more reliable device for measuring trends in crimes against households and their adult occupants. It would, however, require a much larger sample size to facilitate the tracking of small, statistically significant changes in the levels of particular types of crime. Hence, to date, recorded crime figures have been used to track progress towards the achievement of crime reduction targets. 2 Northern Ireland Crime Survey: User Guide 2. Methodology 2.1 Sample design and fieldwork The NICS sample is designed to be representative of the population of households in Northern Ireland and adults aged 16 or over living in those households. The target achieved sample size has been 4,000 since 2005, up from 3,000 in earlier sweeps. Based on an expected response rate of 68%, an initial sample of 6,750 addresses is randomly selected from a list of private addresses managed by the Land and Property Services Agency, which is used for most of the main government surveys conducted in Northern Ireland. At each sampled address, the interviewer is required to establish whether the address is eligible (ineligible addresses include vacant properties, second homes, non-residential addresses and establishments where people are living in group residences). Where an address contains two or more households, the interviewer randomly selects which household to approach. Once the household is determined to be eligible, individuals aged 16 or over in the selected household are listed by alphabetical order of first name and then one is randomly selected for interview. No substitutes are permitted. Selecting only one person at each address means that individuals living in large households have a lower chance of being included in the sample than those living in small households. Accordingly, data relating to personal victimisation and perceptions are weighted by household size to prevent a bias towards smaller households. The NICS is a face-to-face interview survey carried out by the Northern Ireland Statistics and Research Agency’s (NISRA) Central Survey Unit (CSU), primarily using computer-assisted personal interviewing (CAPI), where interviewers record responses to the questionnaire on laptop computers. CAPI allows plausibility and consistency checks to be incorporated to improve data quality. The interviews typically last just under an hour for non-victims, although those involving respondents who disclose several crimes can last much longer. 2.2 Questionnaire The NICS questionnaire consists of a core set of modules, asked of the whole sample, and selfcompletion modules, asked of all respondents aged 16 to 64. While the victimisation-based questions have not changed and are included every year, the precise set of modules asked in each survey year varies, partly to enable rotation and partly to reflect emerging policy priorities. A self-completion module on drug misuse was included in each sweep of the NICS from 1994/95 to 2008/09. A domestic violence self-completion module has been included since NICS 2001 (to date), while a sexual violence and abuse module was included in NICS 2008/09. Mainly due to the sensitivity of the topics, and the increased risk that respondents may not wish to continue with the interview, these sensitive, self-completion modules are placed at the end of the questionnaire, after the core CAPI element with respondents personally completing the modules on the interviewer’s laptop by themselves (CASI, computer-assisted self-interviewing) and, when finished, their answers are hidden. This allows respondents, particularly victims, to feel more at ease when answering such questions due to increased confidence in the privacy and confidentiality of the survey. 3 Northern Ireland Crime Survey: User Guide Respondents are assured in advance of the interviews that any information they provide is treated as entirely confidential and that the level of detail produced in publications or in any subsequent analyses will not allow for identification of individuals. Respondents to self-completion modules are given additional assurances, as well as the option to skip questions they do not wish to answer. Leaflets on services available to victims of crime are given to each respondent. 2.3 Reference period In the NICS sweeps from 1994/95 to 2001, respondents were asked about their crime-related experiences in the previous calendar year (a ‘fixed’ reference period). Since NICS 2003/04, respondents have been asked to recall all relevant incidents in the 12 previous full calendar months and the month of interview. To ensure consistency between the lengths of these ‘floating’ reference periods, regardless of the date of interview, data on incidents occurring during the month of interview are removed from consideration. Otherwise, those interviewed later in the month would have a longer reference period than those interviewed at the start of the month. After studying the effects of the fixed and floating approaches running in parallel in early 2001, the Home Office concluded that the change had little effect on BCS victimisation rates. In addition, by bringing the reference period closer to the date of interview, it took the view that the floating approach should actually increase the accuracy of recall of incidents. As respondents are now interviewed on a rolling basis, the time period covered by the data is not directly comparable with any calendar or financial year. For instance, for respondents to NICS 2010/11, the valid reference periods commenced for some respondents as early as 1 April 2009 and finished for others as late as 28 February 2011 (a spread of 23 months). This makes it hard to compare the resulting victimisation rates with any specific set of annual recorded crime figures. As depicted in Figure 1, the centre point of the period for reporting crime (in this example) is March 2010, the only month to be included in all respondents’ reference periods. Averaging over the moving reference period of the NICS generates estimates that are most closely comparable with annual police recorded crime figures to the end of the September during the fieldwork year. For example, NICS figures from the 2010/11 survey are most closely comparable with police recorded crime statistics for the 12 months ending September 2010 (Figure 1). For NICS questions relating to the perceptions of the respondent, for example, confidence in policing, the data correspond to the year in which the respondent was interviewed. Figure 1: The reference period in one year of NICS interviews (Apr-Mar) Month of interview Apr May Jun Jul Aug Sep Oct Nov Dec Jan Feb Mar 12 month reference period Apr May Jun Jul Aug Sep Oct Nov Dec Jan Feb Mar Apr May Jun Jul Mid-point for survey estimates Aug Sep Oct Nov Dec Jan Feb Mar Interview year Time period most closely comparable with recorded crime 4 Northern Ireland Crime Survey: User Guide 2.4 Measuring victimisation The NICS provides estimates of the levels of household and personal crimes experienced by respondents. Household crimes are considered to be vehicle- and other property-related crimes, and respondents are asked whether anyone currently residing in the household has experienced any such incidents within the reference period, for example, criminal damage to a car, the owner of which could be anyone in the household. Personal crimes relate solely to respondents’ experiences, not those of other people in the household, for example, assaults and personal thefts. There are two stages to the questionnaire for measuring experiences of victimisation. Initially, respondents are asked a series of screener questions within the main section of the questionnaire to assess if they have been a victim of crime. The wording of the screener questions has been kept consistent since the NICS began to ensure comparability across the surveys. Screener questions do not ask respondents if they have been a victim of explicit crime types, but ask about different experiences, such as whether they have had anything stolen in the last 12 months. This design ensures the inclusion of all incidents within the scope of the NICS, including relatively minor ones. Following the screener questions, those who have been victimised are asked detailed questions about exactly what happened. Details of experiences of crime are recorded on a maximum of six victim forms. The first three victim forms include detailed questions relating to each incident, although they are somewhat shorter than their BCS equivalents; the others are slightly shorter, to reduce the risk of respondent fatigue during the interview. The order in which the victim forms are asked depends on the type of crime – more serious and rarer crimes are prioritised in order to collect as much detailed information as possible. Most incidents reported are one-off, single occurrences, but in a minority of cases, respondents may have been victimised a number of times in succession. In these cases, respondents are asked whether they consider these incidents to be a ‘series’, that is, “the same thing, done under the same circumstances, and probably by the same people”. Where incidents are determined to be in a series, the number of incidents is recorded, but with only one victim form being completed, based on the most recent incident. NICS estimates only include the first five incidents in each ‘series’ of victimisations in the count of crime. As with the BCS, the restriction to the first five incidents in a series ensures estimates are not affected by a very small number of respondents who report an extremely high number of incidents and which are highly variable between survey years. The inclusion of such victims could undermine the ability to measure trends consistently. This sort of capping is consistent with other surveys of crime and other topics. Prevalence rates are not affected by this procedure (see Bolling et al., 2009 for information on the measurement of BCS series data). 2.5 Offence coding Based on information collected from the victim forms, NISRA’s coding team determines whether the incident that has been reported constitutes a crime, and if so, what offence code should be assigned to the crime (see Appendix A for list of offence categories). This process is subject to checks by NISRA and Department of Justice statisticians. Only those incidents designated as ‘valid’ (for example, incidents that took place within Northern Ireland and during the recall period) are included in standard NICS analyses. NICS crime statistics are produced from these data and presented as incidence or prevalence rates, based on incidents or victims (see Section 3). The final offence code may not correspond to the screener question from which the Victim Form arose: for example, an incident elicited from the burglary screener may turn out to be a case of 5 Northern Ireland Crime Survey: User Guide vandalism. An incident may also be double counted on the screener questions – despite careful wording of the questions respondents may report a single incident on two different screener questions. The coding process ensures that incidents are recorded as accurately as possible. Since 2003/04, victim forms have not been completed for incidents outside of Northern Ireland. Previously, although a short victim form was completed, such offences were coded as not valid. 2.6 Incident classification Similar offence codes are then grouped together for the purpose of reporting on the incidence and prevalence rates for different crime types (see Section 3). A list of incident classifications together with their corresponding offence categories is included in Appendix A. 6 Northern Ireland Crime Survey: User Guide 3. NICS ANALYSIS - EXPERIENCE OF CRIME 3.1 Types of analysis Three main types of analysis can be carried out on NICS data: individual-based, household-based and incident-based. Both individual and household analysis can be used to produce incidence and prevalence rates for different crime types. Individual-based analysis Individual-based analysis is carried out when the intention is to make statements about the characteristics, attitudes or experiences of adults in the sample. It is important to recognise that statements about the characteristics of victims are not the same as incident-based analysis in which statements are made about incidents (see incident-based analysis). This is because a victim can experience more than one incident. Household-based analysis Household based analysis is carried out when the intention is to make statements about the characteristics or experiences of households in the sample. Again, the characteristics of the households are not the same as incident-based analysis in which statements are made about incidents as a household can experience more than one incident. The most common type of household-based analysis is analysis in which statements are made about households who were victims of household crimes. Incident-based analysis (victim form analysis) This comprises analyses where the intention is to make statements about the nature of incidents of crime using the information collected on the Victim Form. Incident-based analysis usually examines the nature of specific offence types or compares different types of offence. 3.2 Rates-based analysis (incidence rates and prevalence rates) Within the annual National Statistics Publication ‘Experience of Crime’, the Department of Justice produces three main NICS measures of the extent of crime in Northern Ireland: prevalence rates; incident rates; and crime count. Prevalence rates Prevalence rates (also known as risks) give the proportions of the population who were victims of each offence type once or more during the recall period. Prevalence rates are calculated using either individual- or household-based analysis. Unlike incidence rates, prevalence rates only take account of whether a household or person was a victim of a specific crime once or more during the reference period, not the number of times they were victimised. Respondents and their households are thus designated as victims or non-victims. The proportions who are victims provide the prevalence rates, equivalent to the risk of being a victim of crime. The overall number of victims can also be estimated based on the prevalence rate and using estimates of the population of households and adults in Northern Ireland. In this case, the proportion of households (in the case of household crimes) or adults (in the case of personal crimes) that were victims should be multiplied by the total number of households or adults in Northern Ireland to produce an estimate of the number of households or adults who were victims of a specific crime type. While there is no need to weight prevalence rate analysis based on household crimes, all prevalence rate analysis based on personal crimes are weighted accordingly. 7 Northern Ireland Crime Survey: User Guide Incidence rates Unlike prevalence rates, incidence rates take into account multiple and repeat victimisation and provide the estimated number of crimes experienced per 10,000 households (for household crimes) or per 10,000 adults (for personal crimes). To calculate an incidence rate, the number of incidents experienced by each respondent is aggregated together for each crime type. This is either one incident per victim form (up to six victim forms) or, where a victim form contains a ‘series’, it is the number of incidents in the series (capped at 5). The number of incidents for each respondent is then multiplied by 10,000 and the mean of this number produces the incidence rate for a particular offence type. An example is provided in the box below. Example: Producing NICS incident rates per 10,000 adults / households In a dataset of 4,000 respondents, if 30 respondents have each reported three incidents of burglary, the total number of burglaries is 90. When this is multiplied by 10,000, the mean value across the whole dataset is 225 (900,000/4,000). This works out at 225 burglaries per 10,000 households. Similarly, if 40 respondents have each reported 2 incidents of assault, the total number of assaults is 80. When this is multiplied by 10,000, the mean value across the whole dataset is 200 (800,000/4,000). This means there are 200 assaults per 10,000 adults. Note: Both of these examples use unweighted figures. Analysis for personal crimes against the respondent are weighted appropriately (see below). While there is no need to weight incidence rate analysis based on household crimes, all incidence rate analysis based on personal crimes are weighted by household size (see below). The overall number of crimes is the sum of the totals for household and personal crimes. Crime count The overall number of incidents can be estimated for Northern Ireland, based on the incidence rate (outlined above) and using estimates of the populations of households and adults in Northern Ireland. In 2010/11, population estimates of 706,400 households (occupied domestic housing stock) and 1,417,370 adults (mid-year population estimate) were used to provide estimates of the number of NICS incidents. 3.3 Repeat and multiple victimisation The NICS datasets contain variables which allow users to examine rates of repeat and multiple victimisation. Repeat victimisation relates to the proportion of people who have been victims of more than one crime of the same type during the reference period, while multiple victimisation is defined as the experience of being a victim of more than one crime regardless of the type. So, people who have experienced multiple victimisation include those who have been a victim of more than one personal crime, or have been resident in a household that was a victim of more than one household crime, or have been a victim of both types of crime. Levels of repeat victimisation account for differences between published incidence rates and prevalence rates. For instance, high levels of repeat victimisation will be reflected in relatively lower prevalence rates compared with incidence rates (see Toner and Freel, 2011). 8 Northern Ireland Crime Survey: User Guide 4. NICS ANALYSIS - PERCEPTIONS OF CRIME 4.1 Worry about crime indicators The worry about crime indicator in the NICS has three components: worry about burglary; car crime; and violent crime. Each of these components is measured by asking respondents how worried they are about becoming a victim of the following seven types of crime using a four-point scale, ranging from ‘very worried’ to ‘not at all worried’: 1. 2. 3. 4. 5. 6. 7. home being burgled; being mugged and robbed; physical attack by a stranger; race or sectarian attack; rape; theft of a car; and theft from a car. Two composite indicators for worry about car crime and violent crime are constructed from the responses to the individual car crime (numbers 6 and 7, above) and violent crime (numbers 2 through 5) questions. These additional indicators, together with the proportion of respondents who claimed to be ‘very worried’ about burglary (number 1) form the three components. For the worry about car crime indicator, responses to each car crime question of ‘very worried’ are awarded 2 points and ‘fairly worried’ 1 point. Those respondents scoring a combined 3 or 4 points are considered to have a high level of worry about car crime. This measure refers only to respondents residing in households owning, or with regular use of, a vehicle. A similar approach is used to determine the worry about violent crime indicator, with responses to each violent crime question of ‘very worried’ being awarded 2 points and ‘fairly worried’ 1 point. In this instance, the scale ranges from 0 to 8 points and those scoring 4 or more points are deemed to have a high level of worry about violent crime. 4.2 Likelihood of victimisation indicators In addition to questions on worry about crime (above), the NICS asks respondents how likely they think it is that they will be a victim of the following offences in the next 12 months, using a fourpoint scale ranging from ‘very likely’ to ‘very unlikely’: 1. 2. 3. 4. 5. home being burgled; theft of a car; theft from a car; being mugged and robbed; and physical attack by a stranger. Two composite indicators to measure the perceived likelihood of being a victim of car crime and violent crime are again constructed from the responses to the individual car crime (numbers 2 and 3, above) and violent crime (numbers 4 and 5) questions. These additional indicators, together with the proportion of respondents who say they are very or fairly likely to have their home burgled in the next year, comprise the three component groups (burglary; car crime; and violent crime). The perceived likelihood of being a victim of car crime is a composite measure of respondents who think they are very or fairly likely to either have a car/van stolen or have something stolen from a car/van in the next year, or both. This measure refers only to respondents residing in households owning, or with regular use of, a vehicle. 9 Northern Ireland Crime Survey: User Guide Similarly, the perceived likelihood of being a victim of violent crime is a composite measure of anyone who thinks they are very or fairly likely to be either mugged/robbed or physically attacked by a stranger in the next year, or both. These questions are asked of all respondents, irrespective of whether they have been a victim of crime in the previous 12 months. 4.3 Anti-social behaviour indicators The NICS measures the perceived level of anti-social behaviour (ASB) through asking respondents to rate how much of a problem the following seven types of ASB are in their local area, using a four-point scale ranging from ‘very big problem’ to ‘not a problem at all’: 1. 2. 3. 4. 5. 6. 7. abandoned or burnt-out cars; noisy neighbours or loud parties; people being drunk or rowdy in public places; people using or dealing drugs; teenagers hanging around on the streets; rubbish or litter lying around; and vandalism, graffiti and other deliberate damage to property. Responses to these seven individual strands are used to form a composite measure to gauge the overall perceived level of ASB in the local area as follows: responses of ‘very big problem’ are awarded 3 points, ‘fairly big problem’ 2 points, ‘not a very big problem’ 1 point and ‘not a problem at all’ 0 points. In turn, the maximum score for the seven questions is 21. Respondents with a score of 11 or more on this scale are classified as having a high level of perceived anti-social behaviour, while those scoring 10 or less are considered to have a low level of ASB. This scale can only be calculated from NICS 2003/04 onwards as the question on ‘people being drunk or rowdy’ was only introduced in 2003/04. Measures of perceptions of each of the seven individual types (or strands) of ASB, such as ‘rubbish or litter lying around’, are based on the proportion of NICS respondents who consider that particular strand to be a very or fairly big problem in their local area. 4.4 Perceptions of the crime rate Questions on the perception of change in the local and regional (Northern Ireland level) crime rates have been included in the NICS since 1998 and 2003/04 respectively. With the focus on change in the level of crime during the two years prior to interview, and for trend comparisons, the question on local crime is asked only of respondents who have lived at their address for more than three years. In contrast, the question covering crime in Northern Ireland as a whole is asked of all respondents. 10 Northern Ireland Crime Survey: User Guide 5. Statistical conventions and methods 5.1 Weighting Weighting is used to ensure the representativeness of the NICS sample and, thus, to compensate for unequal probabilities of selection as the individual's chance of participation is inversely proportional to the number of adults living in the household. Selecting only one person at each address means that individuals living in large households have a lower chance of being included in the sample than those living in small households. Accordingly, to prevent a bias towards smaller households, all NICS data presented in relation to personal victimisation (as opposed to household victimisation) and attitudinal (perception) data are weighted in relation to the number of eligible adults at the address, derived from the details of the household structure recorded by interviewers on the questionnaire. This weighting process adjusts the results to those which would have been achieved if the sample had been drawn as a systematic random sample of adults rather than of addresses. A further effect of this weighting is that the proportions of males and young people, which are typically under-represented in household surveys, more closely match those in the population. Unlike the BCS, calibration weighting, to allow for variation in response rates by sex and age, is not applied to the NICS. While it is acknowledged that, for instance, young people are less likely to participate in such surveys and are more likely to be victims of personal crime, tests involving the application of calibration weighting have shown little appreciable impact on prevalence rates. It has, therefore, been decided that it would not be an effective use of available staffing resource to recalculate the NICS experience of crime time series. 5.2 Design effect As outlined above, selecting one individual for interview at the sampled address means that each person in the sample has a different probability of selection, depending on the size of household in which they live. A design effect therefore exists for those parts of the survey data which relate to the selected respondent, namely crimes against the person (such as violent crime and personal theft) and all attitudinal components (such as worry about crime and confidence in policing). For analyses that cover the whole sample, the design effect for NICS 2010/11 is 1.2, and the design factor is 1.1. It is worth noting that prior to NICS 2009/10, a design effect was not considered to exist in the NICS as its sample is drawn using simple random sampling (Norris and Palmer, 2010). However, following examination, and subsequent recommendation, by National Audit Office as part of the CSR 2007 PSA review, it was reluctantly accepted by NISRA CSU that a design effect does exist. In turn, a design effect and associated design factor have been estimated for subsequent annual sweeps of the survey and reported on within the respective Technical Report. 5.3 Base numbers NICS publications include the base numbers alongside tabular output within the Tabular Annex of each report. The base numbers presented are unweighted and represent the sample upon which each relevant output is based. As these base numbers reflect the achieved sample size they are adjusted to take account of the NICS design effect (see above), to obtain the effective sample size required for carrying out tests for significant change and confidence intervals relating to individual analyses, such as personal victimisation (e.g. assault and mugging) or attitudinal elements (e.g. worry about crime and levels of public confidence). 11 Northern Ireland Crime Survey: User Guide The number of cases upon which analysis is based is important as it influences the precision (standard error) of the estimates. The Department of Justice does not routinely publish NICS estimates where the unweighted base is less than 100 cases, although, where felt merited, it may lower the threshold to 50, subject to a cautionary note. 5.4 Confidence intervals and statistical significance Like any sample-based survey, the NICS may produce estimates that differ from the figures that would have been obtained if the whole population had been interviewed, rather than a representative proportion. The extent of this difference depends on the sample size, the size and variability of the estimate and the design of the survey. It is, however, possible to calculate the range of values between which the population figures are estimated to lie, known as the confidence interval (sometimes referred to as margin of error). At the 95 per cent confidence level, when assessing the results of a single survey it is assumed that there is a one in 20 chance that the true population value will fall outside the 95 per cent confidence interval calculated for the survey estimate. Similarly, over many repeats of a survey under the same conditions, one would expect that the confidence interval would contain the true population value in 95 times out of 100. Because of this variation, changes in estimates between survey years or between population subgroups may occur by chance. In other words, the change may simply be due to which adults were randomly selected for interview. We are able to measure whether this is likely to be the case using standard statistical tests and conclude whether differences are likely to be due to chance or represent a real difference. Only increases or decreases that are statistically significant at the five per cent level (p<0.05), and are therefore likely to be real, are described as changes within NICS publications. Within the Tabular Annex and figures these are typically identified by asterisks. 5.5 Don’t know and refusal responses In most Department of Justice analyses, refusal codes are excluded. Don’t know codes are also usually excluded unless there is interest in these responses, for example, in the case of some attitudinal questions. Where appropriate, Department of Justice publications exclude these responses from unweighted bases quoted and include reference to them in accompanying footnotes. 12 Northern Ireland Crime Survey: User Guide 6. Classifications 6.1 Geographical Urban-rural definition Within the NICS, the urban-rural definition is derived at Local Government District (LGD) and, primarily, Ward level. In determining urban and rural classifications the NICS uses the guidelines set out in the Report of the Inter-Departmental Urban-Rural Definition Group 'Statistical Classification and Delineation of Settlements' (NISRA, 2005). There are 8 broad settlement bands specified within this report, with those most densely populated (bands A through E) classified as urban and the remainder classified as rural. Northern Ireland Multiple Deprivation Measure Since 2007/08, NICS data have been broken down and presented on the basis of local area deprivation. The NICS measure of deprivation is the Northern Ireland Multiple Deprivation Measure (NIMDM) 2010 (NISRA, 2010), which replaced the NIMDM 2005 as the official measure of spatial deprivation in Northern Ireland. The NIMDM 2010 provides information on seven types or ‘domains’ of deprivation (income; employment; health and disability; education skills and training; proximity to services; living environment; and crime and disorder) as well as an overall multiple deprivation measure comprising a weighted combination of the seven domains. The majority of results are presented at the Super Output Area geography. In order to examine the relationship between experiences / perceptions of crime and deprivation the local areas are ranked according to their scores on the overall deprivation domain. The 20 per cent of areas with the highest deprivation scores are identified as the most deprived areas (1st quintile) and the 20 per cent of areas with the lowest deprivation scores are identified as the least deprived areas (5th quintile). 6.2 Household Household reference person (HRP) For property offences, such as domestic burglary, vehicle-related theft and vandalism, it is necessary to select one person in the household to indicate the characteristics of the household more generally. Following the National Statistics harmonised classifications, the NICS replaced head of household with household reference person (HRP) in 2006/07. The HRP is the member of the household in whose name the accommodation is owned or rented, or is otherwise responsible for the accommodation. Where this responsibility is joint within the household, the HRP is the person with the highest income. If incomes are equal, then the oldest person is considered the HRP. Household structure The classification of households in the NICS is based on the number and combination of adults and children living within a household. While households with a HRP (see above) aged 60 and over are treated separately, those with a HRP aged under 60 are divided into those with: one adult and one or more children (under 16); more than one adult with one or more children (under 16); and one or more adults with no children (under 16). 13 Northern Ireland Crime Survey: User Guide Household Income Total household income is the combined income of all members of the household. It includes income from all sources including earnings from employment and self-employment, pensions (both state and private), benefits and tax credits, interest from savings and investments, maintenance, student grants and rent payments received. Due to the nature of the question, around 15% of NICS 2010/11 respondents gave insufficient information to classify their household income or declined to answer the question. Those cases with insufficient information may include respondents who did not know the income of other household members. Tenure The following definition of tenure is used by the NICS, based on the National Statistics harmonised classification: owners: households who own their homes outright, or are buying with a mortgage (includes shared owners, who own part of the equity and pay part of the mortgage/rent); social-rented sector tenants: households renting from a council, housing association or other social-rented sector; and private-rented sector tenants: households privately renting unfurnished or furnished property. This includes tenants whose accommodation comes with their job, even if their landlord is a housing association or local authority. 6.3 Personal Experience of crime reported to the police The NICS asks respondents whether they have ever been a victim of crime that was reported to the police and, if so, whether this was within the previous two years (prior to interview). In addition to collecting victimisation data, this experience of crime variable enables a respondent’s ‘fear of crime’, such as their level of worry about crime and perceived risk of (future) victimisation, to be classified in terms of their previous victimisation history as follows: never been a victim; victim; victim within last two years; and victim more than two years ago. 14 Northern Ireland Crime Survey: User Guide 7. Methodological limitations It must be noted that the figures derived from the NICS are estimates. As with any sample survey, the NICS estimates are subject to sampling error and a range of other methodological limitations. Non-response As in any voluntary survey, the NICS is subject to non-response error. The NICS has managed to achieve a response rate (68%) that is high compared with other similar household surveys. However, non-response has implications for the measurement of crime if non-respondents have different experiences of victimisation to respondents. Recall The NICS asks respondents to recall their experiences of crime in the previous 12 months. The NICS crime measure is thus dependent on respondents’ ability to accurately remember their experiences in the reference period. The accuracy of NICS estimates could be affected by recall if a respondent simply forgets a relevant incident, reports an incident that occurred outside the reference period as having happened within the reference period or fails to report an incident that occurred within the reference period because they thought it happened outside the reference period. Unwillingness to report Respondents may be unwilling to disclose victimisation experiences in a face-to-face interview setting. This is more likely to be the case for domestic incidents (particularly if the offender is in the room during interview), rape and sexual assault. Due to the unreliability of these reports, the Department of Justice estimates of personal crime have never included incidents of rape and sexual assault reported on the victim form. Rather than continue to ask respondents about such a sensitive topic without putting the data to useful purpose, the NICS no longer contains a screener question for sexual offences. Instead, topics such as domestic violence and sexual victimisation are reported on using responses to self-completion modules. Definitions of crime Incidents which are legally offences may not be reported to the survey if the respondent does not view them as such. In an attempt to overcome this problem the NICS screener questions ask whether the respondent has experienced certain types of events. They do not refer to ‘crimes’, use legal terminology or refer to specific offences. The definitional problem is particularly relevant to minor incidents and some forms of violence. Moreover, different social groups may have different perceptions of what does and does not constitute an incident. Evidence suggests that better-off groups have a lower threshold of tolerance and are therefore more likely to report minor incidents to the survey (Sparks et al., 1977). 15 Northern Ireland Crime Survey: User Guide 8. NICS publications The Department of Justice publishes a number of web-only bulletins containing analyses from the Northern Ireland Crime Survey, all of which can be downloaded in PDF format at: http://www.dojni.gov.uk/index/statistics-research/stats-research-publications/northern-irelandcrime-survey-s-r.htm Experience of Crime Focusing on crime victimisation (prevalence and incidence) rates in both Northern Ireland and England and Wales, this pre-announced National Statistics publication is released towards the end of each calendar year. Containing extensive socio-demographic data, the latest of these reports, drawn from NICS 2010/11, together with accompanying Microsoft Excel data tables can be found at: http://www.dojni.gov.uk/index/statistics-research/stats-research-publications/northern-irelandcrime-survey-s-r/r-s-bulletin-3-2011-experience-of-crime--findings-from-the-2010-11-northernireland-crime-survey.htm Perceptions of Crime Focusing on perceptions of the causes and levels of crime, anti-social behaviour and concern about crime, this pre-announced National Statistics publication is released around the start of each calendar year. Containing extensive socio-demographic data, the latest report, drawn from NICS 2010/11, together with accompanying Microsoft Excel data tables can be found at: http://www.dojni.gov.uk/index/statistics-research/stats-research-publications/northern-irelandcrime-survey-s-r/perceptions-of-crime-findings-from-the-2010-11-northern-ireland-crimesurvey.htm Perceptions of Policing, Justice and Organised Crime Focusing on levels of public confidence in policing, the wider criminal justice system and the perceived level of harm caused by organised crime in Northern Ireland, this is an annual Official Statistics publication. Containing extensive socio-demographic data, the latest report, drawn from NICS 2009/10 can be found at: http://www.dojni.gov.uk/index/statistics-research/stats-research-publications/northern-irelandcrime-survey-s-r/r-s-bulletin-3-2010_-perceptions-of-policing__-justice-and-organised-crime_findings-from-the-2009-10-northern-ireland-crime-survey-.htm Quarterly Update Focusing on headline statistics covering perceptions of policing, justice and anti-social behaviour, in support of 2011-15 Programme for Government (PfG) commitments and other Departmental targets, this Official Statistics publication is released quarterly with results based on a rolling 12month period. The latest of these reports, covering January to December 2011, can be found at: http://www.dojni.gov.uk/index/statistics-research/stats-research-publications/northern-irelandcrime-survey-s-r/r-s-quarterly-update-perceptions-of-policing-justice-and-anti-social-behaviourquarterly-update-to-december-2011.htm Experience of Drug Misuse Focusing on lifetime and recent prevalence of drug misuse, the latest of these Official Statistics publications, drawn from NICS 2008/09, can be found at: http://www.dojni.gov.uk/index/statistics-research/stats-research-publications/northern-irelandcrime-survey-s-r/r-s-bulletin-1-2010--experience-of-drug-misuse--findings-from-the-2008-09northern-ireland-crime-survey.htm 16 Northern Ireland Crime Survey: User Guide Experience of Domestic Violence Focusing on lifetime and recent prevalence of domestic violence victimisation, this Official Statistics publication supports the Domestic Violence Strategy. The latest of these reports, drawn from NICS 2007/08, can be found at: http://www.nio.gov.uk/08_northern_ireland_crime_survey.pdf Experience of Sexual Violence and Abuse Focusing on lifetime and recent prevalence of sexual violence and abuse victimisation, this Official Statistics publication supported the Domestic Violence Strategy. Drawn from NICS 2008/09, it can be found at: http://www.nio.gov.uk/09_northern_ireland_crime_survey-3.pdf For all Department of Justice statistics and research publications, please go to: http://www.dojni.gov.uk/index/statistics-research/stats-research-publications.htm 17 Northern Ireland Crime Survey: User Guide APPENDIX A: Classification of NICS incidents and offence categories Incident classification Individual offence category Vandalism All vandalism offences below Vehicle vandalism Criminal damage to a vehicle Other vandalism Arson Criminal damage to the home Other criminal damage Burglary (including attempts) All burglary offences below Burglary with entry Burglary in a dwelling (nothing taken) Burglary in a dwelling (something taken) Attempted burglary Attempted burglary in a dwelling Vehicle-related theft All vehicle-related theft offences below Theft of a vehicle Theft of a car or van Theft of a motor-bike, -scooter or moped Theft from a vehicle Theft from a car or van Theft from a motor-bike, -scooter or moped Attempted theft of or from a vehicle Attempted theft of or from a car or van Attempted theft of or from a motor-bike, -scooter or moped Bicycle theft Bicycle theft Other household theft Attempted or actual burglary of non-connected domestic garage or outhouse Theft inside / outside a dwelling Stealth theft from the person Other (non-snatch) theft from the person Attempted theft from the person Other thefts of personal property Other theft (item may not be held by person) Other attempted theft All NICS violent crime All violent offences below Common assault Assault with minor injury Assault with no injury Attempted assaults Wounding Serious wounding (including sexual motive) Other wounding (including sexual motive) Mugging Robbery Attempted robbery Snatch theft from the person 18 Northern Ireland Crime Survey: User Guide REFERENCES Bolling, K., Grant, C. and Donovan, J. (2009) 2008-09 British Crime Survey (England and Wales) Technical Report Volume I. http://www.homeoffice.gov.uk/rds/pdfs09/NICS0809tech1.pdf NISRA (2005) Statistical Classification and Delineation of Settlements. Report of the InterDepartmental Urban-Rural Definition Group. Belfast. http://www.nisra.gov.uk/demography/default.asp26.htm NISRA (2010) Northern Ireland Multiple Deprivation Measure 2010. Belfast. http://www.nisra.gov.uk/deprivation/archive/Updateof2005Measures/NIMDM_2010_Report.pdf Norris, P and Palmer, J. (2010) Comparability of the Crime Surveys in the UK: A Comparison of Victimisation and Technical Details. SCCJR Research Report No. 1/2010. University of Edinburgh. http://www.sccjr.ac.uk/pubs/Comparability-of-the-Crime-Surveys-in-the-UK-A-Comparison-ofVictimisation-and-Technical-Details/250 Pickering, K., Smith, P., Bryson, C. and Farmer, C. (2008) British Crime Survey: options for extending the coverage to children and people living in communal establishments. Home Office Research Report 06. London: Home Office. http://www.homeoffice.gov.uk/rds/pdfs08/horr06c.pdf PSNI (2011) Police Service of Northern Ireland: User Guide to Police Recorded Crime Statistics in Northern Ireland (Revised December 2011) http://www.psni.police.uk/user_guide.pdf Sparks, R. F., Genn, H. and Dodd, D. J. (1977) Surveying victims. London: John Wiley. Toner, S. and Freel, R. (2011) Experience of Crime: Findings from the 2010/11 Northern Ireland Crime Survey. DOJ Research and Statistical Bulletin 3/2011. Belfast: DOJ. http://www.dojni.gov.uk/index/statistics-research/stats-research-publications/northern-irelandcrime-survey-s-r/nics-2010-11-experience-of-crime.pdf 19 Department of Justice Access to Justice Directorate Statistics and Research Branch Massey House Stormont Estate Belfast BT4 3SX Email: [email protected] Telephone: 028 9052 2658 www.dojni.gov.uk