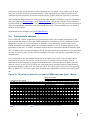
1
UK Data Archive Study Number 7252 - Crime Survey for England and Wales, 2011-2012 CRIME SURVEY FOR ENGLAND AND WALES (CSEW) DATASET USER GUIDE: ADULTS AGED 16 AND OVER 2011/12 CRIME STATISTICS AND ANALYSIS OFFICE FOR NATIONAL STATISTICS 1 Contents Chapter 1 Background to the CSEW ............................................................................... 4 Chapter 2 Methodology ................................................................................................... 6 2.1 Sample design .......................................................................................... 6 2.2 Fieldwork .................................................................................................. 7 2.3 Questionnaire ........................................................................................... 7 2.4 Time periods covered ............................................................................... 8 2.5 Measures of crime .................................................................................... 9 2.6 Offence coding........................................................................................ 10 2.7 Incident classification .............................................................................. 10 Chapter 3 CSEW data files............................................................................................ 11 3.1 Datasets available .................................................................................. 11 3.2 Victim and non-victim form...................................................................... 11 3.3 Case identification .................................................................................. 11 3.4 Variable names ....................................................................................... 11 3.5 Multiple response variables .................................................................... 12 3.6 Derived variables .................................................................................... 12 3.7 Don’t know and refusal codes ................................................................. 12 Chapter 4 CSEW analysis ............................................................................................. 13 4.1 Individual-based analysis ........................................................................ 13 4.2 Household-based analysis ...................................................................... 13 4.3 Incident-based analysis .......................................................................... 13 4.4 Incidence rates ....................................................................................... 13 4.5 Prevalence rates ..................................................................................... 14 4.6 Repeat and multiple victimisation ........................................................... 15 4.7 Weighting ................................................................................................ 15 4.8 Complex sample structure and statistical significance ............................ 16 Chapter 5 CSEW drugs module .................................................................................... 19 5.1 Background............................................................................................. 19 5.2 Limitations............................................................................................... 19 5.3 Measures of drug use ............................................................................. 19 5.4 Analysis of CSEW drug use module ....................................................... 20 2 Chapter 6 Methodological limitations ............................................................................. 21 6.1 Non-response ......................................................................................... 21 6.2 Recall ...................................................................................................... 21 6.3 Unwillingness to report ........................................................................... 21 6.4 Definitions of crime ................................................................................. 21 Chapter 7 CSEW publications ....................................................................................... 23 Appendix 1 Comparing the CSEW cycles ....................................................................... 24 Appendix 2 CSEW offence codes.................................................................................... 25 Appendix 3 Classification of incidents ............................................................................. 27 Appendix 4 2011/12 CSEW design factors ...................................................................... 34 Bibliography ...................................................................................................................... 36 3 Chapter 1: Background to the CSEW The Crime Survey for England and Wales (CSEW), formerly known as the British Crime Survey (BCS), is a face-to-face victimisation survey in which people resident in households in England and Wales are asked about their experiences of a range of crimes in the 12 months prior to the interview. Respondents to the survey are also asked about their attitudes towards different crimerelated issues such as the police and criminal justice system, and perceptions of crime and antisocial behaviour. Following crime statistics reviews (Smith, 2006; Statistics Commission, 2006) and feasibility work (Pickering et al., 2008) the CSEW was extended to include 10 to 15 year olds from January 2009. The first results for this age group were published in Millard and Flatley, 2010 as experimental statistics. The survey was first conducted in 1982, with further cycles in 1984, 1988, 1992, 1994, 1996, 1998, 2000 and 2001. In 2001, the then BCS moved to an annual format with continuous sampling. The first and third surveys were carried out in England, Wales and Scotland (hence ‘British’ Crime Survey). The survey now only covers England and Wales as Scotland now has its own survey, as does Northern Ireland. The key aim of the CSEW is to provide robust trends for the crime types and population it covers; the survey does not aim to provide an absolute count of crime and has notable exclusions. The CSEW excludes fraud and those crimes often termed as victimless (for example, possession of drugs). As a survey that asks people whether they have experienced victimisation, homicides cannot be included. The CSEW does not cover the population living in group residences (for example, care homes or halls of residence) or other institutions, nor does it cover crime against commercial or public sector bodies. Following a recommendation of the National Statistician’s review of crime statistics (National Statistician, 2011), the Home Office has commissioned a new survey of business crime which is scheduled to run in 2012, 2013 and 2014. Fieldwork on the 2012 Commercial Victimisation Survey (CVS) began in August 2012 and first results have been published by the Home Office. For the crime types and population it covers, the CSEW provides a better reflection of the true extent of crime experienced by the population resident in households in England and Wales than police recorded statistics because the survey includes crimes that are not reported to or recorded by the police. The primary purpose of the CSEW is to provide national level analysis but some high-level analysis is possible at regional and police force area level. The CSEW is also a better indicator of long-term trends, for the crime types and population it covers, than police recorded crime because it is unaffected by changes in levels of reporting to the police or police recording practices. The victimisation methodology and the crime types included in the main count of crime have remained comparable since the survey began in 1981. As a result, the CSEW does not capture relatively new crimes, such as plastic card fraud, in its main crime 4 count. However, additional questions have been added to the survey to investigate the extent and trends of such issues and these are reported separately to the main CSEW crime count. The booklet ‘Measuring crime for 25 years’ was published in 2007 and examines how the CSEW (then BCS) has changed and what has happened to trends in crime and people’s perceptions over 25 years of the survey. 5 Chapter 2: Methodology 2.1 Sample design The core sample is designed to be representative of the population of households in England and Wales and people living in those households. As such, it is possible to use the small users’ Postcode Address File (PAF) which is widely accepted as the best general population sampling frame in England and Wales1. As mentioned earlier, the Crime Survey for England and Wales (CSEW) does not cover the population living in group residences or other institutions, although excluding the minority of the population that lives in such establishments is thought to have little effect on CSEW estimates see Pickering et al., 2008). The core sample size has increased over the years from around 11,000 in the earlier cycles to 46,031 in the 2011/12 CSEW. The CSEW has a high response rate (75% in 2011/12) and the survey is weighted to adjust for possible non-response bias and ensure the sample reflects the profile of the general population (see Chapter 4). Since January 2009 the survey also includes children aged 10 to 15, through screening at sampled addresses, and is available in a separate dataset, with separate documentation, to the main sample through the UK Data Service. The CSEW has previously included a young people (16 to 24) and an ethnic boost sample, although these are no longer used. For more information on changes in the CSEW sample over time, see Appendix 1. In 2004/05 the sample was re-designed to achieve 1,000 interviews in each police force area (PFA), involving substantial over-sampling in less populous PFAs. The impact of changes in the CSEW sample design over time has been examined (see Tipping et al., 2010). This concluded that under all designs the survey has generated estimates of victimisation with low levels of variance and the changes in the sample design have not affected the ability of the survey to identify trends in victimisation. As well as stratifying2 disproportionately by PFA, the sample is stratified by other sociodemographic variables in order to ensure a representative sample. The stratifiers used in 2011/12 (as for previous surveys) were PFA, population density, deprivation and household characteristics. For further details of sample stratification and clustering see TNS-BMRB, 2012. The overall sample size for the CSEW is gradually being reduced from April 2012. The sample size will decrease from an achieved sample of 46,000 households per year in the year ending March 2012 to 35,000 households in the year ending March 2013. The sample size reduction will take 12 months to implement. 1 The small users’ PAF has been the sampling frame for the CSEW since 1992 – it lists all postal delivery points in England and Wales (almost all households have one delivery point or letterbox). 2 Stratification essentially means dividing the sampling frame into groups (strata) before sampling. The process reduces the risk of drawing an extreme sample, unrepresentative of the population, and hence improves the precision of survey estimates. 6 2.2 Fieldwork At each sampled address the interviewer is required to establish that the address is eligible; ineligible addresses include vacant properties, second homes, non-residential addresses and establishments where people are living in group residences (for example, care homes or halls of residence). In the rare situations where one PAF address leads to two households, the interviewer randomly selects which household to approach. Once the household is determined to be eligible, individuals aged 16 or over in the selected household are listed by alphabetical order of first name and then one is randomly selected for interview. No substitutes are permitted. Children aged 10 to 15 are interviewed in households that have taken part in the main survey; where an eligible child is identified (according to age), one is selected at random to take part3. Again, no substitutes are permitted. CSEW estimates are based on analysis of structured face-to-face interviews carried out using computer-assisted personal interviewing (CAPI) where interviewers record responses to the questionnaire on laptop computers. The mode of interview changed in the 1994 CSEW from a paper-based questionnaire to CAPI. CAPI allows logic and consistency checks to be incorporated into the survey to improve data quality. For example, the interviewer is unable to move on to the next question until a discrepancy or inconsistency has been resolved. 2.3 Questionnaire The main CSEW questionnaire has a complex structure consisting of a core set of modules asked of the whole sample, a set of modules asked only of different sub-samples, and self-completion modules asked of all respondents aged 16 to 59. Modules include, for example: victimisation; performance of the criminal justice system (CJS); contact with and attitudes to the police and the CJS; mobile phone theft; anti-social behaviour; plastic card fraud; and demographic characteristics of the respondent and household. Survey development is carried out on an annual basis to reflect emerging issues. While the wording of victimisation questions has not changed and these are included every year, the precise set of modules asked in each survey year varies. Within some modules there may be further filtering so that some questions are only asked of smaller-sub samples. Respondents are randomly allocated into one of four subsamples, A, B, C or D which each represent around a quarter of the overall sample. When a question is only asked of a sub-sample of respondents this is indicated on the questionnaire. Self-completion modules are used in the CSEW to collect information on topic areas that respondents could feel uncomfortable talking about to an interviewer. The use of self-completion on laptops allows respondents to feel more at ease when answering questions on sensitive issues due to increased confidence in the privacy and confidentiality of the survey. Respondents can complete these modules on the interviewer’s laptop by themselves (CASI, computer-assisted selfinterviewing) and, when finished, their answers are hidden. Children also have the option of AudioCASI, which allows them to listen to questions via headphones and can help those with literacy problems (65 per cent did not use this option at all in the 2011/12 CSEW). The self-completion 3 Data from interviews with 10-15 year olds are available separately to the main 2011/12 CSEW dataset. 7 modules are at the end of the face-to-face interviews and, for adults, cover topics such as illicit drug use, domestic violence and sexual assault. Child respondents are asked a limited set of questions by self-completion on issues such as bullying, truancy and use of alcohol or cannabis. Self-completion modules were first included in the 1996 and 2001 CSEWs to improve estimates of domestic violence (Mirrlees-Black, 1999; Walby and Allen, 2004) and a similar module has been included since the 2004/05 CSEW. The self-completion module on illicit drug use was introduced in 1996 and comparable questions have been asked since then. These questions are not asked of children on the CSEW. Questionnaires are available via the UK Data Service. 2.4 Time periods covered Prior to 2001/02, CSEW respondents were asked about their crime-related experiences in the previous calendar year but when the CSEW changed to a continuous survey, respondents were asked about crime in the 12 months prior to interview. Since becoming a continuous survey, CSEW estimates are published based on interviews carried out over a 12-month period; for the publication of the 2011/12 CSEW, estimates are derived from interviews carried out between April 2011 and March 2012 (year ending March 2012). As respondents are interviewed on a rolling basis over the course of a year, the time period covered by the data is not directly comparable with any calendar year. Since respondents are interviewed at different times within each month, they are asked about experiences of crime in the current month plus in the 12 months prior to interview. Crimes experienced in the ‘interview’ month are excluded from the 12-month reference period used for analysis. Hence for the 2011/12 CSEW, the reference period includes incidents experienced by respondents between April 2010 and February 2012. The centre point of the period for reporting crime is March 2011, the only month to be included in all respondents’ reference periods (Figure 2a). Figure 2a: The reference period in one year of CSEW interviews (April – March) Month of interview Apr May Jun Jul Aug Sep Oct Nov Dec Jan Feb Mar Apr May Jun Jul Aug Sep Oct Nov Dec Jan Feb Mar 12 month reference period Apr May Jun Jul Aug Sep Oct Nov Dec Jan Feb Mar Interview year Mid-point for survey estimates Time period most closely comparable with recorded crime 8 Averaging over the moving reference period of the CSEW generates estimates that are most closely comparable with annual police recorded crime figures to the end of the September six months earlier. For example, CSEW figures from the 2011/12 survey are most closely comparable with police recorded crime statistics for the 12 months to the end of September 2011. The Home Office commissioned methodological work to consider the use of an alternative method of presenting the data based on crimes experienced in a particular year. Tipping et al., 2010, compared the trajectory of a range of crime types presenting the data based on the year the interview took place compared with the year the incident took place. There was no evidence that this different basis for reporting would have produced different findings over the period of 2001 to 2009. However, during this period a steady decline in crime was experienced. Tipping et al. also noted that moving to presenting data based on the year that the incident took place would mean that analysts would have to wait an additional year before a complete dataset would be available to them. No changes were made to the CSEW as a result of this study. 2.5 Measures of crime The CSEW provides estimates of the levels of household and personal crimes experienced by respondents. Household crimes are considered to be all vehicle and property-related crimes and respondents are asked whether anyone currently residing in the household has experienced any incidents within the reference period. An example of a household crime would be criminal damage to a car (the owner could be anyone in the household). Personal crimes relate to all crimes against the individual and only relate to the respondents’ own personal experience (not that of other people in the household). An example of a personal crime would be an assault. There are two stages to the questionnaire for measuring experiences of victimisation. First, respondents are asked a series of screener questions on the main part of the questionnaire to assess if they have been a victim of crime. The wording of the screener questions has been kept consistent since the CSEW began to ensure comparability across the surveys. Screener questions do not ask respondents if they have been a victim of explicit crime types, but ask about different experiences, such as whether the respondent has had anything stolen in the last 12 months. This design ensures that all incidents of crime within the scope of the CSEW, including relatively minor ones, are included. Following the screener questions, those who have been victimised are asked detailed questions about exactly what happened. Details of experiences of crime are recorded in a series of victim modules. The first three victim modules include detailed questions relating to each incident; the last three victim modules are shorter modules, designed to be much quicker to complete to avoid respondent fatigue during the interview. The order in which the victim modules are asked depends on the type of crime – less common crimes are prioritised in order to collect as much detailed information as possible. Respondents are asked about their experiences of crime in the 12-month reference period and up to six victim modules can be completed by each respondent. Most incidents reported are one-off, single occurrences, but in a minority of cases, respondents may have been victimised a number of times in succession. In these cases respondents are asked whether they consider these incidents to be a ‘series’; that is “the same thing, done under the same circumstances and probably by the same people”. Where incidents are determined to be in a 9 series, the number of incidents is recorded, but with only one victim module being completed based on the most recent incident. CSEW estimates only include the first five incidents in this ‘series’ of victimisations in the count of crime. Overall, each adult respondent can have a maximum of 30 incidents contained in the count of crime; a maximum of six victim modules with a maximum of five incidents on each victim module4. In practice, most adult respondents have far fewer than this. For details on victimisation data collection see TNS-BMRB, 2012. The restriction to the first five incidents in a series has been applied since the CSEW began in order to ensure that estimates are not affected by a very small number of respondents who report an extremely high number of incidents and which are highly variable between survey years. The inclusion of such victims could undermine the ability to measure trends consistently. This sort of capping is in line with other surveys of crime and other topics. Prevalence rates are not affected by this procedure (see TNS-BMRB, 2012 for information on the measurement of series data). 2.6 Offence coding Based on information collected and processed from the victim modules, specially trained coders determine whether what has been reported constitutes a crime, and if so, what offence code should be assigned to the crime. The full list of CSEW offence codes is shown in Appendix 2; only those designated as ‘valid’ are included in standard CSEW analysis. CSEW crime statistics are produced from these data and presented as incidence or prevalence rates, based on incidents or victims (see Chapter 4). The final offence code may not correspond to the screener question from which the victim module arose: for example, an incident elicited from the burglary screener may turn out to be a case of vandalism. It is also possible that an incident can be double counted on the screener questions – despite careful wording of the questions respondents may report a single incident on two different screener questions. The coding process ensures that incidents are recorded as accurately as possible. 2.7 Incident classification Offence codes are included in the victim form dataset alongside each incident. However, before these codes are added to the non-victim form dataset, similar offences are grouped together for the purpose of reporting on the incidence and prevalence rates for different crime types (see Chapter 4). A list of incident classifications and their corresponding offence codes is included in Appendix 3. 4 A victim module is completed for every incident, or series of incidents, that the respondent or their household has been a victim of, and collects details of the offence such as the severity of injury sustained and the offender characteristics. 10 Chapter 3: CSEW data files The Crime Survey for England and Wales (CSEW) is a large and complex data set which provides a rich source of data for analysis. However, it is important that anyone undertaking analysis understands the structure of the data. Listed below are some general points about the data and how Office for National Statistics (ONS) analysts use it. 3.1 Datasets available From the 2008-09 CSEW onwards, under the End-user License, analysts can download the following CSEW datasets from the UK Data Service: Non-victim form; and Victim form. Data from the self-completion modules and some low-level geographic variables have been removed from these datasets. Analysts who need to access these data for their research can request access under the terms of the ONS Approved Researcher method through the UK Data Service. These requests will be sent to the ONS for approval. The datasets available under this procedure are: Drug use; Drinking behaviour; Low-level geographic variables. Inter-personal violence (years to 2010/11) Data from the Inter-personal violence and sexual victimisation module can only be accessed using the ONS Virtual Microdata Laboratory (VML) and the Secure Data Service from 2011/12. Analysts who require access to the VML and the Secure Data Service must be accredited as an ONS Approved Researcher and will need to attend training on the relevant system prior to use. Each of these datasets contains the addition variables as well as the ‘rowlabel’ variable which can be used to match the data to the non-victim forms datasets. 3.2 Victim form and non-victim form The CSEW dataset is made up of two files – the victim form (VF) and the non-victim form (NVF). Each case on the non-victim form refers to an individual respondent, whereas each case on the victim form refers to an individual incident reported by a respondent. 3.3 Case identification Each individual respondent has a unique case identifier ‘rowlabel’ consisting of an eight digit number. This identifier is the same on each data file on which information is held about the respondent and allows files to be combined by matching on this variable. 11 3.4 Variable names CSEW variable names can be found in the questionnaire alongside the question to which they refer. In the 1984, 1988 and 1992 CSEW, variable names are the question numbers prefixed by a letter to indicate which part of the questionnaire it refers to. So variables on the main section are prefixed M, those on the victim form V, those on the demographic form D, and those on the selfcompletion section SC. Variables on the 1982 data set have names. 3.5 Multiple response variables Multiple response variables are those questions which permit respondents to choose more than one answer from the list of available options. From the 2001 CSEW onwards, multiple response variables are constructed so a set of variables (equal to the full number of possible answers that could be given) hold the responses to the question. The first variable records whether or not the first option was selected; the second records whether or not the second option was selected, and so on. So for example, the variable ‘Nowalk3’ has eighteen values, ‘Nowalk3A’ to ‘Nowalk3R’. If the respondent answers codes 4 and 5, ‘Nowalk3D’ and ‘Nowalk3E’ will be coded 1 and the remaining sixteen variables will be coded 0. From the 1994 survey up to and including the 2000 survey, multiple response variables were coded differently: in the same way as above, the same number of variables as there are possible answers are set up. However, the first variable recorded the first answer given; the second recorded the second answer given, and so on. So in the example above there would be eighteen variables called ‘Nowalk00’ to ‘Nowalk17’. If a respondent answered codes 4 and 5 in response to this question, ‘Nowalk00’ would hold the code `4' and ‘Nowalk01’ `5'. All the other variables would be system missing. Prior to the 1994 CSEW, multiple response variables are denoted by the ‘mr’ suffix. 3.6 Derived variables In addition to the questions directly asked of respondents, the CSEW data files also include derived variables. There are two sets of derived variables; those produced by the survey contractor (can be found in TNS-BMRB, 2012) and those produced by Home Office/ONS analysts. From 2006/07, the derived variables produced by Home Office/ONS analysts have been included on the datasets so researchers can replicate the analysis produced in various publications. 3.7 Don’t know and refusal codes Respondents are not usually explicitly given the options ‘don’t know’ or ‘refusal’. However, for every question respondents may say they do not know or refuse to answer and these are valid responses. The code for refusal is ‘8’ for code frames up to 7 and ‘98’ for code frames up to 97. The code for don’t know is ‘9’ for code frames up to 7 and ‘99’ for code frames up to 97. Prior to the 1994 CSEW the reverse holds. ‘9’, ‘99’ and so on denote refusals or question not completed in error; ‘8’, ‘98’ and so on denote ‘don’t know’. 12 In most Home Office/ONS analysis refusal codes are excluded. ‘Don’t know’ codes are also usually excluded unless there is interest in these responses, for example in the case of attitudinal questions. 13 Chapter 4: CSEW analysis There are three main types of analysis that can be carried out on Crime Survey for England and Wales (CSEW) data: individual-based analysis, household-based analysis and incident-based analysis. Both individual and household analysis can be used to produce incidence and prevalence rates for different crime types. Each of these types of analysis needs to take into account the appropriate weighting of the data. 4.1 Individual-based analysis Individual-based analysis is carried out when the intention is to make statements about the characteristics, attitudes or experiences of adults in the sample. Analysis of attitudinal questions is individual-based, as is analysis of victims of personal crimes (such as assault). All individual-based analysis should be weighted by ‘indivwgt’ (‘weighta’ prior to 1996 survey). 4.2 Household-based analysis Household based analysis is carried out when the intention is to make statements about the characteristics or experiences of households in the sample. The most common type of householdbased analysis is analysis in which statements are made about households who were victims of household crimes. All household-based analysis should be weighted by ‘hhdwgt’ (‘weightb’ prior to 1996 survey). 4.3 Incident-based analysis Incident-based analysis is carried out when the intention is to make statements about characteristics of incidents of crime, such as the timing, location or perceived seriousness of offences. Incident-based analysis is always carried out on the victim form dataset. All incidentbased analysis should be weighted by ‘weighti’. A change was made to the way in which ‘weighti’ was calculated in 2006/07. If using the ‘weighti’ variable prior and post 2006/07, it should be divided by 10,000 in the datasets prior to 2006/07 for consistency. Since 1992, although incidents occurring outside of England and Wales have been given a valid offence code (see Chapter 2), for incident-based analysis only those incidents which occurred within England and Wales should be retained. This should be done by selecting cases based on responses to the variable ‘wherhapp’. 4.4 Incidence rates Incident rates give the number of crimes experienced per 1,000 households – for household crimes, or per 1,000 adults – for personal crimes from 2011/12 onwards (per 10,000 households or per 10,000 adults prior to 2011/12). Incidence rates are calculated using either individual or household-based analysis. To calculate an incident rate, the number of incidents experienced by respondents is aggregated together for each crime type. This is either one incident per victim module (up to six victim modules), or where one of these victim modules contains a ‘series’, it is the number of incidents in 14 the series (capped at five). The number of incidents for each respondent is then multiplied by 1,000 (or 10,000 prior to 2011/12) and added to the non-victim form. A mean of this number produces the incidence rate for a particular offence type. See Appendix 3 for an explanation of the variables used to calculate incidence rates. Incidence variables for each of the offence groups are included on the non-victim form dataset and the variable names include the suffix ‘_i’. Example5 – producing rates per 1,000 adults/households On a dataset of 50,000 respondents, if 500 respondents have each reported three incidents of burglary, the total number of burglaries is 1,500. When this is multiplied by 1,000, the mean value across the whole dataset is 30 (1,500,000/50,000). This means that there are 30 burglaries per 1,000 households. Similarly, if 500 respondents have each reported two incidents of assault, the total number of assaults is 1,000. When this is multiplied by 1,000, the mean value across the whole dataset is 20 (1,000,000/50,000). This means there are 20 assaults per 1,000 adults. The overall number of incidents can be estimated for England and Wales based on the incident rate and using estimates of the populations of households and adults in England and Wales. For the financial year April 2011 to March 2012 population estimates of 23,724,882 households and 45,278,539 adults were used to provide estimates of the number of incidents. All incidence rate analysis based on household crimes should be weighted by ‘hhdwgt’ (‘weightb’ prior to 1996 survey) and all incidence rate analysis based on personal crimes should be weighted by ‘indivwgt’ (‘weighta’ prior to 1996 survey). When performing analysis confined to 16-24 year olds on datasets that include a young adult boost (see Appendix 1 for the datasets that include the youth boost), a weight based on 16-24 year olds from the main sample and those in the young adults boost sample should be used (‘ypcwgt’). 4.5 Prevalence rates Prevalence rates give the proportion of the population who were victims of an offence once or more. Prevalence rates are calculated using either individual or household-based analysis. Unlike incidence rates, prevalence rates only take account of whether a household or person was a victim of a specific crime once or more during the reference period, not the number of times they were victimised. Respondents and their households are thus designated as victims or non-victims. The proportion of these who are victims provides the prevalence rate, equivalent to the risk of being a victim of crime. See Appendix 3 for an explanation of the variables used to calculate prevalence rates. Prevalence variables for each of the offence groups are included on the nonvictim form dataset and the variable names include the suffix ‘_p’. The overall number of victims can also be estimated for England and Wales based on the prevalence rate and using estimates of the population of households and adults in England and Wales. In this case, the proportion of households (in the case of household crimes) or adults (in the case of personal crimes) that were victims should be multiplied by the total number of households 5 Note that both of these examples use unweighted figures. Analysis should always be weighted appropriately. 15 or adults in England and Wales to produce an estimate of the number of households or adults who were victims of a specific crime type. All prevalence rate analysis based on household crimes should be weighted by ‘hhdwgt’ (‘weightb’ prior to 1996 survey) and all prevalence rate analysis based on personal crimes should be weighted by ‘indivwgt’ (‘weighta’ prior to 1996 survey). When performing analysis confined to 1624 year olds on datasets that include a young adult boost (see Appendix 1), a weight based on 1624 year olds from the main sample and those in the young adults boost sample should be used (‘ypcwgt’). 4.6 Repeat and multiple victimisation From 2006/07 the CSEW datasets contain information which allow users to examine rates of repeat and multiple victimisation. Multiple victimisation is the estimated percentage of adults who have been a victim of more than one personal crime or have been resident in a household that was a victim of more than one household crime or have been a victim of both types of crime. Repeat victimisation (a subset of multiple victimisation) is defined as being a victim of the same type of crime more than once in the last 12 months (for example, vandalism). Levels of repeat victimisation account for differences between incidence rates and prevalence rates. For instance, high levels of repeat victimisation will be reflected in relatively lower prevalence rates compared with incidence rates. Repeat victimisation variables for each offence group are included on the non-victim form dataset and the variable names include the suffixes ‘_r’ or ‘_r2’. 4.7 Weighting Two types of weighting are used to ensure the representativeness of the CSEW sample. First, the raw data are weighted to compensate for unequal probabilities of selection. These include: the individual's chance of participation being inversely proportional to the number of adults living in the household; the over-sampling of smaller police force areas; and the selection of multi-household addresses6. Second, calibration weighting is used to adjust for differential non-response. A review of the CSEW by survey methodology experts at the Office for National Statistics (ONS) and the National Centre for Social Research (NatCen) recommended that the calibration weighting method be adopted in the CSEW (Lynn and Elliot, 2000). The weighting is designed to make adjustments for known differentials in response rates between different regions and different age by sex subgroups and also households with different age and sex composition. For example, a household containing a man aged 24 living alone may be less likely to respond to the survey than a household containing a man aged 24 living with a partner and a child. The procedure therefore gives different weights to different household types based on their age/sex composition in such a way that the weighted distribution of individuals in the responding households matches the known distribution in the population as a whole and also matches the known distribution of the regional population. 6 See TNS-BMRB, 2012, for further details about how the weights are constructed to compensate for unequal selection probability. 16 The weights are generated using an algorithm that minimises the differences between the weights implied by sampling and the final weights subject to the weighted data meeting the population controls. They are based on calibrating on population figures provided by the Labour Force Survey (LFS) from ONS. Calibration weights were applied from the 1996 CSEW onwards using CALMAR (a SAS-based macro); since 2006/07 the CSEW has used g-Calib within a new SPSS-based data processing system (the weights produced by g-Calib are the same as those from CALMAR). The effects of calibration weights are generally small for household crime, but are more important for estimates of personal crime, where young respondents generally have much higher crime victimisation rates than average but also lower response rates to the survey. However, crime trends since the 1996 survey did not change to any great extent with the introduction of calibration weighting. In addition to a weight for individuals and households, the dataset also includes a weight for incidents. This is a simple multiplication of the number of incidents on a given victim module by the individual or household weight depending on whether the incident is classified as a personal or household crime. The individual and household design weights are calibrated to produce the individual weight ‘indivwgt’, which is used for individual based analysis (attitudinal questions and estimates of personal crime rates) and the household weight ‘hhdwgt’, which is used for household based analysis (estimates of household crime rates). For incident-based analysis, the weight ‘weighti’ is used. When performing analysis confined to 16-24 year olds on datasets that include a young adult boost (see Appendix 1), a weight based on 16-24 year olds from the main sample and those in the young adults boost sample should be used (‘ypcwgt’). 4.8 Complex sample design and statistical significance The main CSEW estimates are based on a representative sample of the population of England and Wales aged 16 and over each year. A sample, as used in the CSEW, is a small-scale representation of the population from which it is drawn. Any sample survey may produce estimates that differ from the figures that would have been obtained if the whole population had been interviewed. The size of this difference depends on the sample size, the size and variability of the estimate, and the design of the survey. The number of cases upon which analysis is based is important as it influences the precision (standard error) of the estimates. CSEW estimates where the unweighted base is less than 50 cases are not generally published. Because of this variation, changes in estimates between survey years or between population subgroups may occur by chance. In other words, the change may simply be due to which adults were randomly selected for interview. It is possible to measure whether this is likely to be the case using standard statistical tests and conclude whether differences are likely to be due to chance or represent a real difference. Analysts should be familiar with how to carry out such tests before conducting analysis on CSEW data. The CSEW is not based on a simple random sample and instead uses a stratified and partially clustered sample design. The design of the survey means that confidence intervals on the CSEW 17 are based on complex standard errors (CSEs) around estimates, which reflect the stratified and semi-clustered design of the survey and are calculated using the SPSS Complex Sample Module (www.spss.com). The variable ‘psuid’ identifies the primary sampling unit (PSU) and is based on a numeric nomenclature calculated in such a way to ensure that each PSU identifier can be guaranteed to be unique. The stratum reference taking into account all levels of stratification of the sample design is encapsulated within the variable ‘fin_stra2’. A full description of the CSEW sample design including a description of PSU and the survey stratifiers appears in the report: ‘The 2011/12 Crime Survey for England and Wales: Technical Report, Volume One’. Analysis of CSEW data taking into consideration the complex sample design can be carried out using standard statistical packages which include statistical procedures that take into account clustering and stratification. For analysts who do not have access to statistical packages that take into consideration complex sample design, the CSE for an estimate can also be estimated using the design effect. The design effect is the ratio of the actual standard error for the complex design to the standard error from a simple random sample of the equivalent size. A design effect of 1.2 is used for ad-hoc CSEW analysis. It should be noted that popular statistical software packages, such as SPSS, tend to use the weighted number of respondents instead of the actual number in the sample when performing calculations where the sample size is used. Users of the CSEW face two possible outcomes if they overlook this issue when deciding whether to apply weights: when using weights, standard errors will be severely under estimated; and ignoring the weights will produce estimates that are not representative of the population of England and Wales. A popular technique to deal with this is to calculate standard errors manually using weighted percentages and rates and unweighted sample sizes. This will still underestimate error and overestimate significance with the CSEW due to the complex sample design where a design effect mentioned above may be implemented or a higher threshold of statistical significance used. If greater precision is required many statistical software packages have features for analysing data from complex samples and these should be used. Statistical significance for change in CSEW estimates for overall crime cannot be calculated in the same way as for other CSEW estimates. This is because there is an extra stage of sampling used in the personal crime rate (selecting the adult respondent for interview) compared with the household crime rate (where the respondent represents the whole household), so, technically, these are estimates from two different, though obviously highly related, surveys. The ONS methodology group has provided an approximation method to use to overcome this problem. The approach involves producing population-weighted variances associated with two approximated estimates for overall crime. The first approximation is derived by apportioning household crime equally among adults within the household (in other words, converting households into adults) and the second by apportioning personal crimes to all household members (converting adults into households). The variances are calculated in the same way as for the standard household or personal crime rates (taking into account the complex sample design). An average is then taken of 18 the two estimates of the population-weighted variances. The resulting approximated variance is then used in the calculation of confidence intervals for the estimate of all CSEW crime and in the calculation of the sampling error around changes in estimates of all CSEW crime to calculate whether such differences are statistically significant. This method incorporates the effect of any covariance between household and personal crime. By taking an average of the two approximations, it also counteracts any possible effect on the estimates of differing response rates (and therefore calibration rates) by household size. 19 Chapter 5: CSEW drugs module 5.1 Background Since 1996 the CSEW has included a self-completion module of questions on illicit drug use. The use of self-completion on laptops allows respondents to feel more at ease when answering questions on illicit behaviour due to increased confidence in the privacy and confidentiality of the survey. The self-completion module is restricted to those respondents aged 16 to 59 years (the decision to exclude those aged 60 and over was an economy measure, reflecting their very low prevalence rates for the use of prohibited drugs). Although questions on drug misuse were included in the 1994 CSEW, these figures are not considered comparable to those from later rounds of the survey. Comparable figures for drug use were introduced in 1996 and since then there have been few changes made to the questions asked. 5.2 Limitations As a household survey, the CSEW provides an effective measure of the more commonly used drugs for which the majority of users are contained within the household population. However, the CSEW does not cover some small groups, potentially important given that they may have relatively high rates of drug use: notably the homeless, and those living in certain institutions such as prisons or student halls of residence. Nor, in practice, will any household survey necessarily reach those problematic drug users whose lives are so busy or chaotic that they are hardly ever at home or are unable to take part in an interview7. As a result, the CSEW is likely to underestimate the overall use of drugs such as opiates and crack cocaine, and possibly also frequent cocaine powder users, where the majority of users are concentrated within small sub-sections of the population not covered or reached by the survey. However, this is likely to have only a marginal impact on overall estimates of drug use within the household population. In tracking changes in the level of drug use through the CSEW, arguably what matters most, is that irrespective of any strengths or weaknesses relating to coverage of the survey, it is a consistent instrument deployed in the same manner for each round of the survey. 5.3 Measures of drug use Questions on whether a respondent has used illicit drugs are asked of three time periods – use of a drug ever, use of a drug in the last year and use of a drug in the last month. ‘Use of a drug ever’ indicates whether a respondent has taken one or more drugs in their lifetime; however, it says little about the patterns of current drug use. Some respondents will have taken these drugs ten or twenty years ago, others in the last month. ‘Use of a drug in the last month’ is a good indicator of very recent drug use but it is more subject to variation due to the small number of last month users. For these reasons, ‘Use of a drug in the last year’ is deemed to be the best indicator available to measure recent drug use. Questions about frequent drug use (previously only asked of 16 to 24 7 The Home Office has published work to provide local estimates of problematic drug users using statistical techniques involving indirect estimation from a number of different data sources (Hay et al., 2008). 20 year olds), use of skunk (the stronger form of cannabis) and the age at which cannabis, cocaine and ecstasy were first taken were added to the 2009/10 CSEW. 5.4 Analysis of CSEW drug use module Respondents who refuse to take part in the drug use module are coded as system missing on the dataset. In addition, the survey asks about the use of Semeron, a fictional drug. Cases which include Semeron ‘use’ should be excluded from any analysis. Estimates of drug use are based on two population groups – all adults aged 16 to 59 and young people aged 16 to 24. Analysis of drug use among all adults aged 16 to 59 should be weighted by ‘indivwgt’. Questions on drug use were also asked of the ‘young adult boost’ when this was included (see Chapter 2 and Appendix 1) and these respondents can therefore be included in analysis of drug use among 16 to 24 year olds to increase the sample size and therefore the reliability of any estimates. Analysis of drug use among those aged 16 to 24 should be done using the youth dataset and weighted by ‘ypcwgt’. There is no young adult boost in the 2009/10, 2010/11 or 2011/12 datasets. 21 Chapter 6: Methodological limitations It should be noted that the figures derived from the Crime Survey for England and Wales (CSEW) are estimates. As with any sample survey, the CSEW estimates are subject to sampling error and a range of other methodological limitations. 6.1 Non-response As in any voluntary survey, the CSEW is subject to non-response error. The CSEW has managed to maintain a response rate (75%) that is high compared with other similar household surveys. However, non-response has implications for the measurement of crime if non-respondents have different experiences of victimisation to respondents. The CSEW adopted calibration weighting in 2001/02 to account for differing rates of non-response between people of different sex, ages and regions (see Chapter 4). Re-weighting using calibration weighting was carried out on all survey years back to and including 1996. To account for nonresponse all CSEW analysis should be appropriately weighted. 6.2 Recall The CSEW asks respondents to recall their experiences of crime in the previous 12 months. The CSEW measure of crime is thus dependent on respondents’ ability to accurately remember their experiences in the reference period. The accuracy of CSEW estimates could be affected by recall if a respondent simply forgets a relevant incident, reports an incident that occurred outside the reference period as having happened within the reference period or fails to report an incident that occurred within the reference period because they thought it happened outside the reference period. 6.3 Unwillingness to report Respondents may be unwilling to disclose victimisation experiences in a face-to-face interview setting. This is more likely to be the case for some crimes such as domestic violence (particularly if the offender is in the room during interview), rape and sexual assault8. Self-completion modules are used to collect sensitive information which alleviates this problem to some extent. Estimates of personal crime do not include incidents of sexual assault reported on the victim modules due to the unreliability of these reports. Instead, sexual victimisation is reported on using answers to the questions in the self-completion module. 6.4 Definitions of crime Incidents which are legally offences may not be reported to the survey if the respondent does not view them as such. In an attempt to overcome this problem the CSEW screener questions ask 8 Procedures are used to try to overcome this problem. The question is on a show card and interviewers are instructed that this section of the interview can be postponed if others are present during the interview. 22 whether the respondent has experienced certain types of events. They do not refer to ‘crimes’, use legal terminology or refer to specific offences. The definitional problem is particularly relevant to minor incidents and some forms of violence. Moreover, different social groups may have different perceptions of what does and does not constitute an incident. Evidence suggests that better-off groups have a lower threshold of tolerance and are therefore more likely to report minor incidents to the survey (Sparks et al., 1977). 23 Chapter 7: CSEW publications Throughout the year the Office for National Statistics (previously the Home Office) publishes a number of bulletins containing analysis from the Crime Survey for England and Wales (CSEW): Crime in England and Wales - A full statistical bulletin, published on a quarterly basis (in January, April, July and October of each year); the July bulletin (which covers the financial year period: April to March) currently containing more content than the other three. Focus On – A set of three supplementary bulletins published across the year which report on additional analysis not included in the main quarterly bulletins. Exact content is agreed each year, although typically one publication is on property crime, one is on violent crime, and one is on perceptions of crime. Nature of Crime – A set of supplementary tables relating to the financial year (April to March) data detailing information regarding: time and location of incidents; items stolen; costs of items stolen / damage to property; injuries sustained; weapons used; emotional impact on victim, etc, that are not included in the July ‘Crime in England and Wales’ bulletin. The Home Office also publish: Drug Misuse Declared – An annual bulletin covering drug misuse as reported on the CSEW; the latest covering the 2011/12 CSEW. The above references are intended only to illustrate the types of reports and findings that are produced from the CSEW. For more details on all publications associated with the CSEW, see the ONS website and the Home Office website. 24 Appendix 1: Comparing the CSEW cycles 1982 1984 1988 SPCR NOP SCPR/ NOP SCPR OPCS 10,905 11,030 10,392 10,059 Response rate 81% 77% 77% Sampling frame ER ER Survey company Core sample size Ethnic boost sample Young adults boost sample Weights used CAPI/ PAPI No. of victim forms Selfcompletion element Sample type 1992 1994 1998 2000 2001 2001/02 2002/03 2003/04 2004/05 2005/06 2006/07 2007/08 2008/09 2009/10 2010/11 2011/12 SPCR SPCR SPCR & ONS TNSBMRB TNSBMRB TNSBMRB TNSBMRB TNSBMRB TNSBMRB TNSBMRB TNSBMRB TNSBMRB TNSBMRB TNSBMRB TNSBMRB 14,520 16,348 14,947 19,411 8,973 32,787 36,450 37,931 45,120 47,796 47,203 46,983 46,286 44,638 46,754 46,031 77% 77% 83% 79% 74% 73% 73% 74% 75% 75% 75% 75% 76% 76% 76% 76% 75% ER PAF PAF PAF PAF PAF PAF PAF PAF PAF PAF PAF PAF PAF PAF PAF PAF PAF Weighta Weightb Weighti Weighta Weightb Weighti Weighta Weightb Weighti Weighta Weightb Weighti Weighta Weightb Weighti Indivwgt Hhdwgt Weighti Indivwgt Hhdwgt Weighti Indivwgt Hhdwgt Weighti Indivwgt Hhdwgt Weighti Indivwgt Hhdwgt Weighti Indivwgt Hhdwgt Weighti Indivwgt Hhdwgt Weighti Indivwgt Hhdwgt Weighti Indivwgt Hhdwgt Weighti Indivwgt Hhdwgt Weighti Indivwgt Hhdwgt Weighti Indivwgt Hhdwgt Weighti Indivwgt Hhdwgt Weighti Indivwgt Hhdwgt Weighti Indivwgt Hhdwgt Weighti PAPI PAPI PAPI PAPI CAPI CAPI CAPI CAPI CAPI CAPI CAPI CAPI CAPI CAPI CAPI CAPI CAPI CAPI CAPI CAPI 4 4 4 5 5 6 6 6 6 6 6 6 6 6 6 6 6 6 6 6 Over sampled in inner city areas 1996 Proportional sample Over sampled in less populous PFAs (minimum = 600) Over sampled in less populous PFAs (minimum = 1,000) SCPR – Social and Community Planning Research has now changed its name to National Centre for Social Research (NCSR) OPCS merged with the Central Statistical Office (CSO) in 1998 to form the Office for National Statistics (ONS) TNS-BMRB – Taylor Nelson Sofres - British Market Research Bureau ER – Electoral Register; PAF – (Small Users) Postcode Address File PAPI – Paper and Pencil Interviewing; CAPI – Computer Assisted Personal Interviewing 25 Appendix 2: CSEW offence codes Category Miscellaneous Assault Attempted assault Sexual offences Robbery, Snatch theft, Theft from person Burglary, Attempted burglary, Theft in a dwelling Code Description Valid? 01 Refer to Home Office 02 Duplicate victim form 96 Invalid victim form (no information/no offence) 11 Serious wounding 12 Other wounding 13 Common assault 19 Other assault outside the survey’s coverage 21 Attempted assault 31 Rape 32 Serious wounding with sexual motive 33 Other wounding with sexual motive 34 Attempted rape 35 Indecent assault 39 Sexual offence outside the survey’s coverage 41 Robbery 42 Attempted robbery 43 Snatch theft from the person 44 Other theft from the person 45 Attempted theft from the person 48 Possibly theft but could have been loss/possibly attempted theft, but could have been innocent 49 Other robbery or theft from the person outside the survey’s coverage 50 Attempted burglary to non-connected domestic garage/outhouse 51 Burglary in a dwelling (nothing taken) 52 Burglary in a dwelling (something taken) 53 Attempted burglary in a dwelling 54 Possible attempted burglary (insufficient evidence to be sure) 55 Theft in a dwelling 56 Theft from a meter 57 Burglary from non-connected domestic garage/outhouse - nothing taken 58 Burglary from non-connected domestic garage/outhouse - something taken 26 Theft Attempted theft Vandalism Threats 59 Other burglary, attempted burglary, theft in a dwelling falling outside the survey’s coverage 60 Theft of car/van 61 Theft from car/van 62 Theft of motorbike, motorscooter or moped 63 Theft from motorbike, motorscooter or moped 64 Theft of pedal cycle 65 Theft from outside dwelling (excluding theft of milk bottles) 66 Theft of milk bottles from outside dwelling 67 Other personal theft 68 Possible theft, possible lost property 69 Other theft/attempted theft falling outside the survey’s coverage 71 Attempted theft of/from car/van 72 Attempted theft of/from motorcycle, motorscooter or moped 73 Other attempted theft 80 Arson 81 Criminal damage to a motor vehicle (£20 or under) 82 Criminal damage to a motor vehicle (over £20) 83 Criminal damage to the home (£20 or under) 84 Criminal damage to the home (over £20) 85 Other criminal damage (£20 or under) 86 Other criminal damage (over £20) 87 Possibly criminal/possibly accidental damage/nuisance with no damage 88 Attempted criminal damage (no damage actually achieved) 89 Other criminal damage outside survey’s coverage 91 Threat to kill/assault made against, but not necessarily to respondent 92 Sexual threat made against, but not necessarily to respondent 93 Other threat or intimidation made against, but not necessarily to respondent 94 Threats against others, made to the respondent 95 Obscene and nuisance telephone calls 97 Other threats/intimidation outside survey’s coverage 27 Appendix 3: Classification of incidents Once incidents from the Crime Survey for England and Wales (CSEW) non-victim forms have been coded, they are then classified into groups of incidents. A list of these groupings and the offence codes included in each group is below. These groups are used to calculate incidence and prevalence rates from the CSEW. The letters in brackets after the group name are the root of the variable name for that group. This is followed by ‘_i’ to give the variable name for the incidence rate for that group and ‘_p’ to give the variable name for the prevalence rate for that group. For example, the name of the variable for the offence groups from which to calculate rates of incidence for vandalism is ‘vandal_i’; the variable from which to calculate rates of incidence for vandalism is ‘vandal_p’; Household crimes All household offences (‘totalh’) 50. 51. 52. 53. 55. 56. 57. 58. 60. 61. 62. 63. 64. 65. 71. 72. 80. 81. 82. 83. 84. 85. 86. Attempted burglary to non-connected domestic garage/outhouse Burglary in a dwelling (nothing taken) Burglary in a dwelling (something taken) Attempted burglary in a dwelling Theft in a dwelling Theft from a meter Burglary from non-connected domestic garage/outhouse-nothing taken Burglary from non-connected domestic garage/outhouse-something taken Theft of car/van Theft from car/van Theft of motorbike, motorscooter or moped Theft from motorbike, motorscooter or moped Theft of pedal cycle Theft from outside dwelling (excl. theft of milk bottles) Attempted theft of/from car/van, Attempted theft of/from motorcycle Arson Criminal damage to a motor vehicle (£20 or under) Criminal damage to a motor vehicle (over £20) Criminal damage to the home (£20 or under) Criminal damage to the home (over £20) Other criminal damage (£20 or under) Other criminal damage (over £20) Comparable household crime (‘tohhcl’) 51. 52. Burglary in a dwelling (nothing taken) Burglary in a dwelling (something taken) 28 53. 60. 61. 62. 63. 64. 71. 72. 80. 81. 82. 83. 84. 85. 86. Attempted burglary in a dwelling Theft of car/van Theft from car/van Theft of motorbike, motorscooter or moped Theft from motorbike, motorscooter or moped Theft of pedal cycle Attempted theft of/from car/van Attempted theft of/from motorcycle Arson Criminal damage to a motor vehicle (£20 or under) Criminal damage to a motor vehicle (over £20) Criminal damage to the home (£20 or under) Criminal damage to the home (over £20) Other criminal damage (£20 or under) Other criminal damage (over £20) Acquisitive crime against household (‘hhacq’) 50. 51. 52. 53. 55. 56. 57. 58. 60. 61. 62. 63. 64. 65. 71. 72. Attempted burglary to non-connected domestic garage/outhouse Burglary in a dwelling (nothing taken) Burglary in a dwelling (something taken) Attempted burglary in a dwelling Theft in a dwelling Theft from a meter Burglary from non-connected garage/outhouse (nothing taken) Burglary from non-connected garage/outhouse (something taken) Theft of car/van Theft from car/van Theft of motorbike, motorscooter or moped Theft from motorbike, motorscooter or moped Theft of pedal cycle Theft from outside dwelling (excluding theft of milk bottles) Attempted theft of/from car/van Attempted theft of/from motorcycle, motorscooter or moped Vandalism (‘vandal’) 80. 81. 82. 83. 84. 85. 86. Arson Criminal damage to a motor vehicle (£20 or under) Criminal damage to a motor vehicle (over £20) Criminal damage to the home (£20 or under) Criminal damage to the home (over £20) Other criminal damage (£20 or under) Other criminal damage (over £20) Vehicle vandalism (‘mv.van’) 81. 82. Criminal damage to a motor vehicle (£20 or under) Criminal damage to a motor vehicle (over £20) 29 Other vandalism (‘homeva’) 80. 83. 84. 85. 86. Arson Criminal damage to the home (£20 or under) Criminal damage to the home (over £20) Other criminal damage (£20 or under) Other criminal damage (over £20) All vehicle thefts (‘allmvt’) 60. 61. 62. 63. 71. 72. Theft of car/van Theft from car/van Theft of motorbike, motorscooter or moped Theft from motorbike, motorscooter or moped Attempted theft of/from car/van Attempted theft of/from motorcycle Theft from vehicle (‘theftf’) 61. 63. Theft from car/van Theft from motorbike, motorscooter or moped Theft of a vehicle (‘thefto’) 60. 62. Theft of car/van Theft of motorbike, motorscooter or moped Attempted theft of & from vehicle (‘attmvt’) 71. 72. Attempted theft of/from car/van Attempted theft of/from motorcycle Burglary (‘burgla’) 51. 52. 53. Burglary in a dwelling (nothing taken) Burglary in a dwelling (something taken) Attempted burglary in a dwelling Burglary with entry (‘burgen’) 51. 52. Burglary in a dwelling (nothing taken) Burglary in a dwelling (something taken) Burglary attempts (‘burgat’) 53. Attempted burglary in a dwelling Burglary with loss (‘burglo’) 52. Burglary in a dwelling (something taken) Burglary with no loss (including attempts) (‘burgno’) 51. 53. Burglary in a dwelling (nothing taken) Attempted burglary in a dwelling 30 Theft from a dwelling (‘theftd’) 55. Theft in a dwelling Bicycle theft (‘biketh’) 64. Theft of pedal cycle Other household thefts (‘othhhc’) 50 55 56 57 58 65 Attempted burglary to non-connected domestic garage/outhouse Theft in a dwelling Theft from a meter Attempted burglary to non-connected domestic garage/outhouse – nothing taken Attempted burglary to non-connected domestic garage/outhouse – something taken Theft from outside dwelling (excluding theft of milk bottles) Personal crimes All personal (not including rape and indecent assault9) (‘totper’) 11. Serious wounding 12. Other wounding 13. Common assault 21. Attempted assault 32. Serious wounding with sexual motive 33. Other wounding with sexual motive 41. Robbery 42. Attempted robbery 43. Snatch theft from the person 44. Other theft from the person 45. Attempted theft from the person 67. Other theft 73. Other attempted theft Comparable personal (‘topthc’) 11. 12. 32. 33. 41. 42. 43. 44. 45. Serious wounding Other wounding Serious wounding with sexual motive Other wounding with sexual motive Robbery Attempted robbery Snatch theft from the person Other theft from the person Attempted theft from the person 9 Due to the small numbers of rape, attempted rape and indecent assault offences identified by face-to-face CSEW interviews, results from the main CSEW are too unreliable to report; these data are not included within the overall count of violence (except for the categories of serious wounding with sexual motive and other wounding with sexual motive which are included in the offence type of wounding). 31 All CSEW violence (‘alviol’) 11. 12. 13. 21. 32. 33. 41. 42. Serious wounding Other wounding Common assault Attempted assault Serious wounding with sexual motive Other wounding with sexual motive Robbery Attempted robbery Comparable violence (‘compvi’) 11. 12. 13. 21. 32. 33. 41. 42. Serious wounding Other wounding Common assault Attempted assault Serious wounding with sexual motive Other wounding with sexual motive Robbery Attempted robbery Common assault (‘common’) 13. 21. Common assault Attempted assault Wounding (‘wound’) 11. 12. 32. 33. Serious wounding Other wounding Serious wounding with sexual motive Other wounding with sexual motive Robbery (‘robber’) 41. 42. Robbery Attempted robbery Mugging (‘mugg1’) 41. 42. 43. Robbery Attempted robbery Snatch theft from the person Acquisitive crime against the individual (‘peracq’) 41. 42. 43. 44. 45. 67. Robbery Attempted robbery Snatch theft from the person Other theft from the person Attempted theft from the person Other theft 32 73. Other attempted theft Theft from the person (‘theftp’) 43. 44. 45. Snatch theft from the person Other theft from the person Attempted theft from the person Stealth theft from the person (‘stealt’) 44. 45. Other theft from the person Attempted theft from the person Snatch theft from the person (‘snatch’) 43. Snatch theft from the person Other theft of personal property (‘othpth’) 67. 73. Other theft Other attempted theft Threats (‘threat’) 91. 92. 93. 94. Threat to kill/assault made against, but not necessarily to respondent Sexual threat made against, but not necessarily to respondent Other threat or intimidation made against, but not necessarily to respondent Threats against others, made to the respondent Total CSEW crime (not including rape and sexual assaults10) (‘totalb’) 11. 12. 13. 21. 32. 33. 41. 42. 43. 44. 45. 50. 51. 52. 53. 55. 56. Serious wounding Other wounding Common assault Attempted assault Serious wounding with sexual motive Other wounding with sexual motive Robbery Attempted robbery Snatch theft from the person Other theft from the person Attempted theft from the person Attempted burglary to non-connected domestic garage/outhouse Burglary in a dwelling (nothing taken) Burglary in a dwelling (something taken) Attempted burglary in a dwelling Theft in a dwelling Theft from a meter 10 Due to the small numbers of rape, attempted rape and indecent assault offences identified by face-to-face CSEW interviews, results from the main CSEW are too unreliable to report; these data are not included within the overall count of violence (except for the categories of serious wounding with sexual motive and other wounding with sexual motive which are included in the offence type of wounding). 33 57. 58. 60. 61. 62. 63. 64. 65. 67. 71. 72. 73. 80. 81. 82. 83. 84. 85. 86. Attempted burglary to non-connected domestic garage/outhouse – nothing taken Attempted burglary to non-connected domestic garage/outhouse – something taken Theft of car/van Theft from car/van Theft of motorbike, motorscooter or moped Theft from motorbike, motorscooter or moped Theft of pedal cycle Theft from outside dwelling (excluding theft of milk bottles) Other theft Attempted theft of/from car/van Attempted theft of/from motorbike, motorscooter or moped Other attempted theft Arson Criminal damage to a motor vehicle (£20 or under) Criminal damage to a motor vehicle (over £20) Criminal damage to the home (£20 or under) Criminal damage to the home (over £20) Other criminal damage (£20 or under) Other criminal damage (over £20) 34 Appendix 4: 2011/12 CSEW design factors Crime measure Design factor Incidents All household offences 1.29 Burglary 1.24 All vehicle theft (all households) 1.51 All household acquisitive 1.44 Vandalism 1.19 Vehicle vandalism 1.23 Other vandalism 1.12 Bicycle theft 1.20 Other household theft 1.32 All personal offences (not including sexual) 1.49 All CSEW violence (not including snatch theft) 1.37 - with injury 1.28 without injury 1.43 All personal acquisitive 1.66 Theft from the person 1.65 Robbery 1.49 Other theft of personal property 1.38 - Prevalence Burglary 1.17 All vehicle theft (all households) 1.40 Vandalism 1.23 All household crime 1.26 Theft from the person 1.72 Violent crime (not including snatch theft) 1.48 - with injury 1.38 without injury 1.54 All personal crime (not including sexual) 1.71 All CSEW crime (not including sexual) 1.52 - 35 Fear of crime Burglary 1.86 Car crime 1.48 Violent crime 1.72 Disorder Perceived high level of anti-social behaviour 1.63 Disorder (1): teenagers hanging around 1.41 Disorder (2): vandalism, graffiti, etc. 1.43 Disorder (4): people using/dealing drugs 1.51 Disorder (5): people being drunk or rowdy 1.64 Disorder (6): noisy neighbours 1.50 Disorder (7): litter/rubbish 1.64 Disorder (8): abandoned cars 1.65 Confidence in local police Police in local area doing good or excellent job 1.40 Police in local area can be relied on to be there when needed 1.43 Police in local area would treat you with respect 1.60 Police in local area treat everyone fairly 1.48 Police in local area understand issues that affect the community 1.56 Police in local area are dealing with things that matter in the community 1.41 Police and local councils are dealing with matters in this area 1.50 Confidence in the criminal justice system Confidence in the effectiveness of the criminal justice system 1.39 Confidence in the fairness of the criminal justice system 1.33 36 Bibliography Hay, G., Gannon, M., MacDougall, J., Millar, T., Williams, K., Eastwood, C., and McKeganey, N., 2008, ‘National and regional estimates of the prevalence of opiate use and/or crack cocaine use 2006/07: a summary of key findings’. Home Office Research Report 9. http://webarchive.nationalarchives.gov.uk/20110218135832/rds.homeoffice.gov.uk/rds/pdfs08/horr 09.pdf Jansson, K., 2006, ‘British Crime Survey – Measuring crime for 25 years’. http://webarchive.nationalarchives.gov.uk/20100528142817/http://homeoffice.gov.uk/rds/pdfs07/bc s25.pdf Lynn, P. and Elliot, D., 2000, ‘The British Crime Survey: A review of methodology’. National Centre for Social Research. http://webarchive.nationalarchives.gov.uk/20110218135832/http://rds.homeoffice.gov.uk/rds/pdfs0 8/bcs-methodology-review-2000.pdf Millard, B. and Flatley, J, 2010, ‘Experimental statistics on victimisation of children aged 10 to 15: Findings from the British Crime Survey for the year ending December 2009’. Home Office Statistical Bulletin 11/10. http://webarchive.nationalarchives.gov.uk/20110220105210/rds.homeoffice.gov.uk/rds/pdfs10/hosb 1110.pdf Mirrlees-Black, C, 1999, ‘Domestic violence: findings from a new British Crime Survey selfcompletion questionnaire’. Home Office Research Study 191. http://webarchive.nationalarchives.gov.uk/20110218135832/http://rds.homeoffice.gov.uk/rds/pdfs/h ors191.pdf National Statistician, 2011, ‘National Statistician’s Review of Crime Statistics: England and Wales’. http://www.statisticsauthority.gov.uk/national-statistician/ns-reports--reviews-andguidance/national-statistician-s-reviews/national-statistician-s-review-of-crime-statistics.html Pickering, K., Smith, P., Bryson, C. and Farmer, C., 2008, ‘British Crime Survey: options for extending the coverage to children and people living in communal establishments’. Home Office Research Report 06. http://webarchive.nationalarchives.gov.uk/20110218135832/http://rds.homeoffice.gov.uk/rds/pdfs0 8/horr06c.pdf Smith, A., 2006, ‘Crime statistics: An independent review’. Home Office independent report. http://webarchive.nationalarchives.gov.uk/20110218135832/http://rds.homeoffice.gov.uk/rds/pdfs0 6/crime-statistics-independent-review-06.pdf Statistics Commission, 2006, ‘Crime statistics: User perspectives’. Statistics Commission Report No. 30. http://www.statisticsauthority.gov.uk/reports---correspondence/archive/statistics-commissionarchive/research/index.html 37 Tipping, S., Hussey, D., Wood, M. and Hales, J., 2010, ‘British Crime Survey: Methods Review 2009’. National Centre for Social Research. http://webarchive.nationalarchives.gov.uk/20110218135832/rds.homeoffice.gov.uk/rds/pdfs10/bcs methods2009.pdf TNS-BMRB, 2012, ‘The 2011/12 Crime Survey for England and Wales: Technical Report, Volume One http://www.ons.gov.uk/ons/guide-method/method-quality/specific/crime-statisticsmethodology/2011-12-crime-survey-for-england-and-wales-technical-report-volume-one.pdf Walby, S. and Allen, J., 2004, ‘Domestic violence, sexual assault and stalking: findings from the British Crime Survey’. Home Office Research Study 276. http://webarchive.nationalarchives.gov.uk/20110218135832/http://rds.homeoffice.gov.uk/rds/pdfs0 4/hors276.pdf 38