1
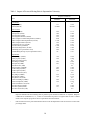
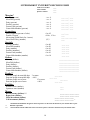
USER’S MANUAL FOR
“SUPERMARKET UNIVERSITY”
by
Emerson M. Babb
and
Kim E. Leburg
Staff Paper #97-6
April 1997
Department of Agricultural Economics
Purdue University
West Lafayette, IN 47907-1145
*
This is one of two publications relating to Supermarket University. There is also an
Instruction Manual for students (Staff Paper 97-5).
Purdue University is committed to the policy that all persons shall have equal access to its programs and
employment without regard to race, color, creed, religion, national origin, sex, age, marital status, disability,
public assistance status, veterans status, or sexual orientation.
USER’S MANUAL FOR
“SUPERMARKET UNIVERSITY”
by
Emerson M. Babb and Kim E. Leburg
Dept. of Agricultural Economics, Purdue University
[email protected]
Staff Paper #97-6
February 1997
Abstract
This manual describes procedures for processing Supermarket University on a personal
computer and some of the factors affecting sales, margins, and costs. The programs for entering and
editing team decisions, processing decisions, and graphing results utilize prompts and menus.
Keywords: supermarket simulator, supermarket management, financial management
Copyright © Emerson M. Babb. Permission is granted to make unlimited copies of this manual
without modifications for use with Supermarket University.
i
Table of Contents
Abstract
Processing Supermarket University
Using Control Program (SM)
Entering and Editing Data (ED)
Creating a New File
Adding a Quarter
Processing Team Decisions (SMCS)
Graphing Team Results on Screen/Printer (GRAPH)
Recovery from Errors
Page
i
1
2
2
3
5
6
7
8
Organizing the Training Session
8
Determination of Sales
Total Market
Store
Grocery Department
Meat Department
Produce Department
Dairy Department
Frozen Food Department
General Merchandise Department
9
9
11
12
12
13
13
13
13
Determination of Gross Margins
Shrink
Specials
Double Coupons
14
14
14
15
Determination of Costs
Non-Controllable Cost
Other Expenses
Store Hours
Sales Volume
Part-Time Persons
Other Income
Income Tax
Interest
Ratios
Inventory
Blank Decision Forms
15
15
15
15
15
15
16
16
16
16
17
18
ii
USER’S MANUAL FOR
“SUPERMARKET UNIVERSITY”
by
Emerson M. Babb and Kim E. Leburg
Dept. of Agriculural Economics, Purdue University
West Lafayette, Indiana 47907-1145
[email protected]
Staff Paper #97-5
February 1997
Processing Supermarket University
This manual contains instructions about the use of Supermarket University and information
concerning response functions or “how it works.” It assumes that you are familiar with the operation
of a microcomputer and the associated disk operating system. You may not need to read all of this
manual because the computer programs employ prompts and menus to guide you through data entry
and processing. You may rely only on the Quick Reference Sheet after you have used the simulation
a few times--or nothing at all. We suggest that you glance through succeeding sections to get a feel
of what is there so you can find items if you need to refer to them later.
There are four programs you will be using:
Supermarket Chain Simulator Control Program (SM) which is used to load ED,
SMCS, and GRAPH described below.
Supermarket Chain Simulator Editor (ED) which is used to enter and edit team
decisions.
Supermarket Chain Simulator Processor (SMCS) which is used to process team
decisions and print results of decisions.
Supermarket Chain Simulator Graphics for Printer (GRAPH) which is used to create
graphs of team performance on the screen which can then be produced on the printer.1
You may need to use a Screen Print Package such as EGAD published by LS Software, 8139
East Mawsen, Mesa, AZ 85207, phone (602) 380-9175 to print copies of graphs on the screen on
your printer.
1
The following instructions are used to run all Supermarket University programs:
1.
Start DOS (Version 5.0 or higher). If you have a hard drive, C > indicates the system is ready
for a command. Otherwise your default drive is usually A >. Program execution will be
faster if you load programs in a directory on your hard disk and operate from that directory.
2.
Enter EGAD with the appropriate printer suffix if you want to print copies of the graphs from
your screen. These can be used to make transparencies. Use /T to put EGAD in memory and
/U to remove it. For example, if you use an HP laser printer, enter “EGADHP/T.”
3.
Enter A: to change default drive.
4.
Insert SM diskette in drive A.
5.
In response to prompt A>, enter SM or enter SM from the directory on your hard disk in
which the programs are stored.
Using the Control Program (SM)
SM is a control program which lets you load any one of the three programs (editor, processor,
graphics) from a menu. Each of these three programs can be loaded directly by entering ED, SMCS,
GRAPH, but it is quicker to go through the menu in SM. You can then do the tasks in sequence.
At the DOS prompt (A/B/C), enter <SM>.
After SM is loaded, the main menu will appear on the screen and you have four choices:
1.
2.
3.
4.
Enter/Edit Team Decisions
Process Decisions
Graph Team Results on Screen
Exit to DOS
At the prompt Task: enter the number of the task you want to perform. After the appropriate
program is loaded, you will have a menu for that task to guide you through its execution. To stop
program execution and return to the SM menu, use Ctrl-Break.
Entering and Editing Data (ED)
ED is used to create a data file for decisions to be processed for teams in a trade area. You
will either be starting an exercise and thus need to create a new file or adding decisions for
subsequent quarters to that file (or editing data for some quarters). We will outline the steps for
2
these two situations. To run, enter <1> if you are operating from the menu in SM, or enter ED at
the DOS prompt.
Creating a New File
You respond to the following prompts to start a new file for a trade area for quarter 1.
1.
File Name?
<filename>2
Enter the name of the file you are going to create such as TRADE1, TRADE2, etc.
Each trade area or competing teams must have a distinct filename. You can have data
for many trade areas on the same diskette but each must have a unique filename.
2.
Disk Drive?
<A/B/C>
Several messages now appear on the screen. One explains that a number in brackets
following a prompt is the default value, i.e., it remains the same if you enter a
<RETURN>.
3.
Option?
Enter N to indicate that you are creating a new file of team decisions. If you enter
H(elp), a menu explaining all options for ED will appear on the screen.
4.
Trade Area? <nbr>
This number is used to identify the trade area in this file.
5.
Number of Stores per Firm n < 99? <nbr>
Enter 3 which corresponds with the starting position shown in the instruction manual.
If you want to start with a different number of stores per firm, teams must be made
aware of this.
6.
Number of Teams 2 < n < 5?
<nbr>
The number of teams that are competing in this trade area. At this point you can
move the cursor up or down to correct entries or enter <CTRL-END> to go to the
next screen.
2
Words in script indicate computer prompts or messages and < > indicate what you are
to enter in response to prompt.
3
7.
Enter Print Control Data
This screen has default settings for the various print options, but these can be changed
as desired by use of the cursor. When you are satisfied with the reports to be printed,
enter <CTRL-END> which takes you to the next screen.
8.
Quarter (k)-Market Growth from Last Quarter (%)?
<nbr>
Enter desired percentage change in the market sales growth from the previous quarter
(due to external forces). In general, 0/ is recommended so that total market sales
changes are due to decisions made by teams. See page 10 for further discussion of
growth factor.
9.
<A/M>
Automatic/Manual Entry, A/M
If you enter A, decisions regarding margins, promotions, and specials are entered as
in Table 1 in the student manual. Some teachers want students to make only decisions
regarding orders, people, facilities, and money during the first quarter or two. This
“A” option speeds data entry in this case. If “M” is entered, all decisions are manually
entered.
10.
Team Number <nbr>
11.
Enter Decisions for Team (k) Quarter (K)
The decisions for teams are now entered in the order they appear on the decision
form, as called for by prompts. In normal circumstances, decimals are not used. If
values are outside the allowable range, you will get a message to reenter the decisions.
After margins, promotions, and specials are entered, you can use the cursor to correct
data entry problems and then enter <CTRL-END> to go to the next screen where
orders, people, facility, and money decisions are entered as in the previous screen.
Decisions for the next team are then entered.
12.
Input Option Character:
<E>
After all decisions are entered, you will get a screen with various options listed. Enter
<E> to end creation of the new file. It will be stored under the filename you
designated in 1, e.g., TRADE1, etc. A historical file will also be created which will
be the filename with an H before it, e.g., HTRADE1.
THAT’S IT!: You get a message that creation of your file is complete and you are ready to process
decisions for quarter 1 with SMCS.
Adding a Quarter
4
The steps below are used to add decisions for quarters after the first quarter, when the file was
created for the trade area.
1.
File Name?
<filename>
Enter the name of the existing file, e.g., TRADE1.
2.
Disk Drive?
3.
Option?
<A/B/C>
Enter R to indicate a quarter is to be added.
4.
Quarter (k)-Market Growth from Last Quarter (%)?
<nbr>
Enter 0/ normally. See page 10 for further discussion of growth factor.
5.
Team Decisions. The decisions for teams are entered as called for by prompts--same as for
creating a new file.
6.
Option?
Enter E to indicate you have finished entering data and are ready to exit the editor.
THAT’S ALL!: You get a message that editing of your file is complete and you are ready to process
decisions for the current quarter with SMCS.
There are other options which are identified below. The option C--change data, will be the
second most used option. Under that option you can change any data in the file (administrative data,
print control data, and team decisions for any quarter).
A - Add a team to the trade area
C - Change data
D - Delete a team from the trade area
E - End edit (change made to the file)
H - Help (list editor options)
Q - Quit (abort) edit (changes NOT made to file)
N - New file creation
P - Print current file contents (screen or printer)
R - Add a quarter to the trade area
X - Delete a quarter from the trade area
5
SMCS must be started from quarter 1 if one of the following conditions is met:
1. A team is added or deleted
2. A quarter is deleted.
If changes are made in decisions for a prior quarter, SMCS must be restarted from that quarter. For
example, you are at quarter 6 but some changes are made in decisions for one team in quarter 3. You
must start from quarter 3 to update data and you will get correct results for quarter 6.
Processing Team Decisions (SMCS)
To run, enter <2> from SM menu or enter SMCS at the DOS prompt. Some messages will
appear on the screen after which you respond to the prompts discussed below.
1.
Selection of Output
You enter <1> at Your Choice if you want to write results to a file and <2> if you want to
print results. If you write the output to a file, you can review the results on screen to see if
they seem reasonable before printing results. If you enter <2>, results are printed as soon as
processing is complete.
2.
File Name for Output (include Path)
If you want to write output to file, you must designate a file name and path, e.g.,
C:EXAMPLE. After the team decisions are processed, you can exit SM by entering <4> and
then type results on the screen with the command TYPE EXAMPLE MORE.
3.
Input File Name?
<filename>
Enter the name of the file to be processed, e.g., TRADE1.
4.
Input Driver? <A/B/C>
5.
Quarter to Run?
<nbr>
Enter the number of the quarter to be processed, i.e., the most recent quarter. In some cases
where changes were made in the data you may start processing for a quarter prior to the most
recent quarter, but that is the exception.
6.
Team to Print (0=All)
<0>
You would normally enter <0> to process all teams, but you can designate a single team to
be printed.
6
THE PRINTER STARTS TO SING! Processing of decisions starts and messages appear on the
screen indicating progress towards a completed job.
Graphing Team Results on Screen/Printer (GRAPH)
GRAPH is used to create graphs of team performance on the screen. Hard copies of these
graphs can be made on the printer from which transparencies can be produced. To run, enter <3>
at SM menu or GRAPH at the DOS prompt.
1.
Input File Name?
<filename>
Enter the name of the file you used when you ran SMCS, i.e., TRADE1, TRADE2, etc.
2.
Input Driver? <A/B/C>
3.
The menu below appears. In response to Choice?, enter the number corresponding to the
graph you want to create. If you want a hard copy of the graph which appears on the screen,
press the ‘PrtSc’ and shift keys simultaneously.
Graphs to be Created
1.
2.
3.
4.
5.
6.
7.
8.
9.
10.
11.
All Graphs
Total Sales $
Profit $
Equity $
Gross Margin %
Total Expense %
Wage Expense %
Market Share % (line)
Market Share % (pie)
Team Operating Performance
Exit
Enter the number of the graph to be created.
Choice?
The Market Share-Pie Graph (%) and the Team Operating Performance Graph (10) result in prompts
to specify quarter and team wanted.
Market Share Quarter?
Team to Graph?
<quarter number>
<team number>
7
Enter 0/ to return to the menu or press the Enter key. To see a graph for a different team or quarter,
press the space bar.
When you are ready to exit the program, enter <11> in response to Graph?.
Recovery from Errors
One problem you may encounter when running the editor is exiting it without entering the
END or QUIT option (the power may be turned off, a Control-Break entered, and so on). If you are
creating a file, you lose ALL the data that have been entered. If you are editing a file, you lose only
the changes that have been made.
When editing an existing file, “backup” copy of the file is made. This backup file contains the
file’s contents before any changes were made. If something should happen while you are editing a
file, you can use the backup file. However, before you can edit the backup file, you must rename it.
(The backup file has a .BAK extension--a file with this extension cannot be edited.)
The following is an example of the procedure to follow when you prematurely exit the editor.
1.
2.
3.
4.
You decide to edit the file TEST.
Upon specifying TEST as the file to edit, the backup file TEST.BAK is created.
While editing TEST, something goes wrong and the DOS prompt appears on the
screen (you have exited the editor without entering END or QUIT).
Before you can continue, you must change the backup file name (you must NOT be
in the editor at this time). Enter the following command:
RENAME TEST.BAK TEST
This renames the backup file to the name originally specified when the file was
created. You should note that:
a.
b.
5.
the disk drive must be specified (if it differs from the default drive) and
the new name does not necessarily need to be the same as the old name.
The file is now renamed and ready to exit.
Organizing the Training Session
Supermarket University can be used in many teaching situations: intensive one-day training
sessions to once-a-week classroom use where decisions are made outside of the class and merely
turned in. It is very helpful if the student reads the instruction manual prior to introducing the game.
This can save up to an hour of class time and enhances understanding of the simulator early in the
session. If students have read the instruction manual, it should only take about 20 minutes to
introduce the simulator and 10 minutes to organize teams and start decision-making.
There is no fixed rule as to how many students can be on a team, but 3 to 5 seems to work
8
best. There can be from 2 to 5 teams competing with one another in a trade area. You can organize
as many trade areas for the session as needed. Each trade area will be completely independent of
others, i.e., decisions made by teams in one trade area do not influence sales or performance for teams
in another. You do not need to have the same number of teams in each trade area. You could have
3 teams in one trade area and 5 in another.
When teams turn in their decision form, it should be checked for accuracy. It is better to find
errors here and get them corrected than for the computer to find them at the point of data entry. Be
sure the form is completely filled in and decisions are logical--i.e., no doubling or tripling of
advertising, etc.
Processing time is 1 to 2 minutes per team, depending on printer speed. The instructor may
prepare a variety of lectures or other events to be presented while the decisions are being processed.
The simulator can be used to reinforce business or economics principles and tools being taught.
Determination of Sales
Sales are affected by factors at the total market, store, and departmental levels (Table 1). The
effects of some of these factors carry over from one quarter to the next and nearly all factors affect
sales in a multiplicative way. There is interaction among factors. For example, the impact of specials
on sales varies directly with the level of advertising and vice versa. The effect of each factor on sales
described below is for the situation where all other factors are at a normal level, i.e., set at a value
equal to 1. Sales response functions are generally nonlinear.
Total Market
A.
Margins. Total sales for the market as a whole could increase as much as 26 percent or
decline as much as 51 percent, depending on the joint decisions of teams regarding gonig in
margins.
B.
Growth factor. The game administrator has the option to increase or decrease total market
sales each quarter by any percentage change. This factor would represent changes in sales
due to exogenous factors such as changes in population, entry of new competitors, and the
like. If the factor is left at 0, sales changes for the market area will be due to decisions of
teams. If the factor is set at some other level (-10, +15, etc.), teams should be told that
external forces are changing market sales in order to avoid confusion. A major reason to use
a market growth factor other than 0 is to discipline a market where teams have jointly raised
margins to unreasonable levels and are experiencing unrealistic profits. In such cases, the
game administrator can model the entry of new competitors attracted by the excessive profits.
It is recommended that the initial reduction in market potential sales be
9
Table 1. Impact of Factors Affecting Sales in Supermarket University
Response Coefficient1
Factor
Minimum
Maximum
.511
No limit
1.262
No limit
Store or Team
Advertising (CAE)
Total Specials (CTSP)
Store Programs (CSTP)
Store Programs Dilution (CPSTP)
Double Coupon in Affected Department (CHCOU)
Double Coupon Other Departments (CLCOU)
Double Coupon Dilution (PCOU)
Promotional Carryover (CCAR)
Store Hour Policy (CHOUR)
Store Labor Image Factor (CLAB)
Remodeling (not representative store)
No Remodeling after Qtr 4 (not representative store)
.860
.940
.800
.975
1.000
1.000
.950
.952
1.000
.880
.880
.02
1.115
1.088
1.162
1.025
1.190
1.020
1.050
1.071
1.150
1.000
1.300
0.27
Departmental
Grocery Margin (CDPA)
Grocery Special (CSPA)
Grocery Stock Turn (STA)
Meat Margin (CDPB)
Meat Special (CSPB)
Meat Stock Turn (STB)
Meat Overtime (CMLAB)
Produce Margin (CDPC)
Produce Special (CSPC)
Produce Stock Turn (STC)
Dairy Margin (CDPD)
Dairy Special (CSPD)
Dairy Stock Turn (STD)
Frozen Food Margin (CDPE)
Frozen Food Special (CSPE)
Frozen Food Stock Turn (STE)
Gen. Mer. Margin (CDPF)
Gen. Mer. Special (CSPF)
Gen. Mer. Stock Turn (STF)
.780
.959
.800
.867
.900
.944
.950
.876
.930
.888
.938
.932
.977
-
1.220
1.084
0.6 2
1.200
1.197
0.5 2
1.000
1.056
1.065
0.3 2
1.124
1.136
0.3 2
1.112
1.076
0.4 2
1.068
1.069
0.3 2
Total Market
Margins (CMKT)
Growth (GROW)
1
Response coefficients for factors affecting sales are printed if “print calculated coefficients” is requested. Response
coefficients are normalized on 1, i.e., a value of 1.0 would have no positive or negative effect on sales. Variable
names in the computer program are shown in parentheses beside each factor.
2
Each stock turn above the prescribed maximum stock turn for the department results in a decrease in sales of the
percentage shown.
10
10 percent (enter -10 in response to market growth factor query) and teams be told that a new
competitor has captured 10 percent of the market. You can indicate that the new competitor
will leave the market if margins are reduced, making the market less attractive from the
standpoint of profits. If teams continue to raise margins, an additional 10 percent loss of
market to new competitors could be modeled (enter -20). In general, a 10 percent decrease
in market potential sales offsets about a 1 percent increase in overall margins. The market
growth factor for each quarter is independent of other quarters. Thus, entering -10 for one
quarter reduces market potential in that quarter only. To continue this reduction, -10 must
be entered in subsequent quarters. Entry of 0 returns market potential to the original level.
Again, it is important to tell teams about each change in the market growth factor and reasons
for this change.
Store
A.
Advertising. Advertising can increase sales in all departments of the store by as much as 12
percent and result in loss of sales of as much as 14 percent if there is no advertising
expenditure.
B.
Total specials. Specials in one department affect sales in others. Total specials for the store
can reduce sales by as much as 6 percent and increase sales as much as 9 percent.
C.
Store programs. There are four types of store programs listed in the student manual, but only
a total percentage of sales is entered on the decision form. One type of program is thus not
more effective than another in the simulator. Sales are 36 percent greater at the maximum
expenditure of 4.5 percent of sales for store programs than at 0 expenditure. There is a
dilution effect as the number of teams using store programs increases, however. The
maximum dilution effect is a five percent reduction in store program effectiveness.
D.
Double coupons. Double coupons may be used for grocery, frozen, and general merchandise
items. If given, sales are increased by 19 percent in those departments and by 2 percent in the
other three departments. The effectiveness of double coupons is diluted if more than one
team uses them. Their effectiveness is reduced by 1 percent for each 10 percent increase in
teams using double coupons. The maximum dilution effect is 10 percent for the grocery,
frozen food and general merchandise departments and 2 percent for other departments.
E.
Promotional carryover. The use of specials, store programs, and double coupons in one
quarter affects sales in the following quarter. Total number of specials, advertising, store
programs and double coupons have an equal weight for this factor which can result in sales
decreases of as much as 4.8 percent and increases of as much as 7.1 percent in the following
quarter.
F.
Store hours. Store hour policy 2 results in a 10 percent increase in sales compared to store
hour policy 1. There is an additional 5 percent increase in sales with store hour policy 3.
G.
Labor image factor. Excessive overtime resulting in waiting lines at checkout points can
reduce sales as much as 12 percent the following quarter.
11
H.
Remodeling. The representative store for which decisions are made is never remodeled, but
remodeling does result in a 20 percent decrease in sales at the store which is remodeled during
the quarter in which work is being done. Sales increase by 30 percent in quarters following
completion of the remodeling job. If no store has been remodeled by the fifth quarter
(decision to remodel made in the fourth quarter), sales in one store gradually decline until it
is remodeled. Sales at the old store decline 2 percent in quarter 5 (which has the effect of
reducing sales for a three store chain by 0.67 percent), and subsequently decline by as much
as an additional 7 percent in quarter 10 ( which has the effect of reducing sales for a three
store chain by 2.3 percent). The accumulative effects of not remodeling by quarter 10 reach
27 percent for the old store and 8.99 percent for a three store chain.
Grocery Department
A.
Margins. Deviations from the average going in margin for all teams can result in sales
increases or decreases of as much as 22 percent (4 percent difference from average margin).
B.
Specials. Grocery specials can affect sales in that department by as much as 13 percent. The
effectiveness of specials decreases as the number of specials increases.
C.
Stock turns. Sales are reduced 0.6 percent for each turn that stock turns are above 20.
Meat Department
A.
Margins. Deviations from the average going in margin for all teams can result in sales
increases or decreases of as much as 20 percent.
B.
Specials. Meat specials can affect sales in that department by as much as 33 percent.
C.
Stock turns. Sales are reduced by 0.5 percent for each turn that stock turns are above 45.
The maximum reduction is $3500.
D.
Overtime. If there is excessive overtime in the meat department, meat sales will decline 0.1
percent for each $1 that meat sales per hour worked is above 100. The maximum sales
decline is 10 percent.
12
Produce Department
A.
Margins. Deviations from the average going in margin for all teams can result in sales
increases or decreases of as much as 6 percent.
B.
Specials. Product specials can affect sales in that department by as much as 12 percent.
C.
Stock turns. Sales are reduced by 0.3 percent for each turn that stock turns are above 65.
The maximum reduction is $1500.
Dairy Department
A.
Margins. Deviations from the average going in margin for all teams can result in sales
increases or decreases of as much as 12 percent.
B.
Specials. Dairy specials can affect sales in that department by as much as 21 percent.
C.
Stock turns. Sales are reduced by 0.3 percent for each turn that stock turns are above 50.
The maximum reduction is $2200.
Frozen Food Department
A.
Margins. Deviations from the average going in margin for all teams can result in sales
increases or decreases of as much as 11 percent.
B.
Specials. Frozen food specials can affect sales in that department by as much as 14 percent.
C.
Stock turns. Sales are reduced 0.4 percent for each turn that stock turns are above 20. The
maximum reduction is $2000.
General Merchandise Department
A.
Margins. Deviations from the average going in margin for all teams can result in sales
increases or decreases of as much as 7 percent.
B.
Specials. General merchandise specials can affect sales in that department by as much as 9
percent.
C.
Stock turns. Sales are reduced by 0.3 percent for each turn that stock turns are above 12.
The maximum reduction is $1500.
13
Determination of Gross Margins
Initial gross margins (going in) are reduced by shrink, specials, and double coupons.
Shrink
A normal shrink is computed for each department and this shrink is increased if stock turns
are below a specified level (Table 2). The dollar loss of shrink is based on the cost of goods, but the
shrink percentage is reported as a percentage of sales.
Table 2. Departmental Shrink Percentage in Supermarket University, Based on Cost of Goods Sold.
Excess Shrink/Stock Turn
Department
Normal
Grocery
Meat
Produce
Dairy
Frozen Foods
General Merchandise
1
1.04
5.90
11.4
2.60
2.90
2.10
Below
Added Amount1
16
50
55
35
16
8
.04
.03
.03
.05
.05
.04
The normal shrinkage is increased by the percentages below for each stock turn below that specified.
Specials
Specials represent sales below the initial departmental gross margin. Each special in the
following departments reduces the overall sales dollars in that department by the following
approximate percentages (dollars), compared to a given physical volume at the initial gross margin:
Grocery
Meat
Produce
- 0.08 (49)
- 0.24 (58)
- 0.53 (43)
Dairy
Frozen Food
Gen. Merchandise
14
- 0.41 (53)
- 0.62 (44)
- 0.61 (35)
The above figures are approximate as they vary with margin and other policies. For example, if you
gave store programs, you would sell more of the grocery item on special and the dollar reduction
associated with one special would be greater than $49.
Double Coupons
If double coupons are given, the overall gross margins in the three departments are reduced
by the following percentages:
Grocery
Frozen Food
Gen. Merchandise
- 3.0
- 3.65
- 3.5
Determination of Costs
Wage rates and many other cost factors are described in the instruction manual. Some of the
factors affecting cost are described in greater detail below.
Non-Controllable Cost
These costs consist of management costs of $3200 per week, store rental of 1 ½ percent of
sales with a minimum of $2500 per week, depreciation of $1923 per week (6-year schedule), and
$110 per week for utilities, repairs, property taxes, and the like.
Other Expenses
These are variable costs and amount to 5.0 percent of total cost of goods sold.
Store Hours
Labor productivity is about 3 percent higher under store hour policy 2 than for policy 1.
Labor productivity under store hour policy 3 is about 4.5 percent higher than for policy 1.
Sales Volume
Labor productivity increases with store volume. A 20 percent increase in store volume results
in an improvement in labor productivity of about 1 percent. Of course, excess labor and overtime
further impact labor cost.
15
Part-Time Persons
Labor productivity declines as the proportion of part-time persons (based on total full time
equivalent excluding persons in the meat department) increases from 25 percent to 60 percent.
Each percentage increase in part-time labor reduces total labor productivity about 0.6 percent.
Other Income
This is computed on the basis of 0.3 percent of total cost of goods sold.
Income Tax
The 1995 U.S. corporate income tax rate is used plus 2 percent for state and local taxes.
Interest
A minimum cash balance of $5000 per store is required. In one special case, the minimum
balance may be above $5000 per store. If a profit is anticipated, cash is held for income tax payment.
The anticipated profit may disappear if loans from Friendly Finance are needed. Thus, cash reserved
for tax payments may appear in addition to the minimum balance.
Ratios
Financial ratios computed in the game are standard, but several are defined below. Ratios
which use balance sheet and operating statement numbers are annualized, i.e., quarter ratios
multiplied by 4.
- Debt to Equity =
Liabilities
Net Worth
- Current Ratio =
Current Assets
Current Liabilities
- Asset Turnover =
Sales
Assets
x 4
- Return on Total Assets =
Profit AT
Assets
- Return on Equity (ROE) =
Profit AT
x 4
Net Worth
x 4
- Ave. Return on Equity = Ave. Return on Equity for Quarters Completed =
16
M
Q
i
1
ROE
Qi
Inventory
Inventory for the supermarket chain is the ending inventory for the representative store times
the number of stores in the chain. Total inventory is not affected by the decision to remodel. This
means that inventory in the remodeled store is first higher, then lower than at the representative store.
Inventory control for the representative store is still reflected in overall inventory management. The
procedure of multiplying inventory at the representative store times number of stores simplifies cash
flow analysis.
17
SUPERMARKET UNIVERSITY DECISION FORM
Trade Area Number
Team Number
Quarter Number
____
____
____
Margins*
Grocery (percent)
Meat/Deli (percent)
Dairy (percent)
Produce (percent)
Frozen Food (percent)
General Merchandise (percent)
+ or - 4
+ or - 4
+ or - 4
+ or - 4
+ or - 4
+ or - 4
____ ____. ____
____ ____. ____
____ ____. ____
____ ____. ____
____ ____. ____
____ ____. ____
0 to 4.5
0=No, 1=Yes
1,2,3
____.____
____
____ ____ ____ ____
____
0 to 40
0 to 20
0 to 10
0 to 10
0 to 10
0 to 10
____ ____
____ ____
____ ____
____ ____
____ ____
____ ____
Promotions
Store Programs (percent of sales)
Double Coupons
Advertising ($6000 basic for # stores)
Store Hour Policy (number)
Specials
Grocery (number)
Meat/Deli (number)
Dairy (number)
Produce (numbers)
Frozen Food (number)
General Merchandise (number)
Orders
Grocery (dollars)
Meat/Deli (dollars)
Dairy (dollars)
Produce (dollars)
Frozen Food (dollars)
General Merchandise (dollars)
____ ____ ____ ____ ____
____ ____ ____ ____ ____
____ ____ ____ ____ ____
____ ____ ____ ____ ____
____ ____ ____ ____ ____
____ ____ ____ ____ ____
People**
Full time people in meat/deli dept. 3 or more
Part time people in meat/deli dept. < 60%
Full time people rest of store
15 or more
Part time people rest of store
< 60%
____ ____
____ ____
____ ____
____ ____
Facilities
Remodel store (number)
Open new store (number)
____
____
Money
Borrow money (dollars)***
Repay loan (dollars)
Make investment (dollars)
Call investment (dollars)
**
***
_____ _____ _____ _____
_____ _____ _____ _____
_____ _____ _____ _____
_____ _____ _____ _____ *
Maximum and minimum margins for the next quarter are shown at the bottom of your market share report.
Full time equivalents
The maximum amount which can be borrowed next quarter is shown at the bottom of your balance sheet.
18