1
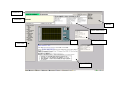
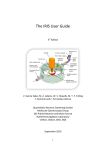
SECI USER MANUAL
Version 1.31
For SECI versions 1.1.48+
Comments/suggestions to Matt Clarke
1.
Introduction............................................................................................................1
1.1. What is SECI?.....................................................................................................1
2. Using SECI ............................................................................................................2
2.1. Accounts .............................................................................................................2
2.2. Configurations.....................................................................................................2
2.2.1. Opening a configuration ..............................................................................3
2.2.2. Adding a Display page (a tree-view node) ..................................................3
2.2.3. Removing a Display page ............................................................................3
2.2.4. Renaming a Display page ............................................................................3
2.2.5. Adding a LabVIEW panel to an existing configuration ..............................4
2.2.6. Removing a LabVIEW panel from an existing configuration .....................4
2.2.7. Changing a LabVIEW panel’s associated files............................................4
2.2.8. Moving a LabVIEW Panel to a different Display page ...............................4
2.2.9. Editing the start-up order of the LabVIEW panels ......................................4
2.2.10. Setting the visibility of the LabVIEW Panels............................................5
2.2.11. Setting a LabVIEW panel to run automatically.........................................5
2.2.12. Adding other (non-LabVIEW) programmes to a configuration ................5
2.2.13. Removing other programmes.....................................................................6
2.2.14. Adding a web viewer to a configuration....................................................6
2.2.15. Removing a web viewer.............................................................................6
2.2.16. Set DAE Options........................................................................................6
2.2.17. Saving, Viewing and Deleting Configurations ..........................................6
2.2.18. Adding another configuration to the current configuration .......................7
2.2.19. Closing the configuration...........................................................................7
3. SECI options ..........................................................................................................7
3.1. Adding or editing custom blocks and log values ................................................7
3.2. Dashboard page options......................................................................................8
3.3. Logging display values .....................................................................................10
3.4. Web/WAP dashboard options...........................................................................10
4. SECI.ini settings ..................................................................................................10
5. SECI examples.....................................................................................................11
5.1. Creating a simple configuration........................................................................11
6. OpenGENIE.........................................................................................................12
6.1. What is OpenGENIE?.......................................................................................12
6.2. SECI and OpenGENIE .....................................................................................12
6.3. Basic OpenGENIE commands..........................................................................12
6.4. Simple scripting in OpenGENIE ......................................................................14
6.5. Advanced scripting in OpenGENIE..................................................................15
6.5.1. Variables ....................................................................................................15
6.5.2. Loops..........................................................................................................15
6.5.3. Accessing a variable in LabVIEW.............................................................16
6.5.4. Pushing a button in LabVIEW...................................................................16
6.6. Summary of OpenGENIE commands...............................................................17
Dashboard
Error Box
Blocks
Main Status Panel
Graph
Display Boxes
Tree-view
Open GENIE
1. Introduction
The Sample Environment Control Interface (SECI) programme’s main role is to
manage the instrument control software; essentially, SECI is responsible for
organising and displaying the software that actually runs the experiment, such as
LabVIEW etc.
SECI was developed in-house at ISIS in an attempt to meet the unique
requirements of the experiments carried out on-site.
1.1. What is SECI?
In basic terms SECI is made up of three parts, these are the dashboard, the tree-view
and the configuration files.
The dashboard appears at the top of the screen and provides an overview of
the instrument status. The dashboard itself is divided up into three main parts (from
left to right):
• The error box - any errors that occur in the experiment are listed in this box
• The main status panel - lists a number of experimental values (examples: runtime, beam current, number of counts etc) which are updated every two
seconds.
• The block list – this area can be customised to list experimental values which
are not included in the main status panel.
The tree-view groups the experiment in to manageable pieces, which can be viewed
separately from each other. By selecting the appropriate node on the tree, SECI hides
all the other nodes and only displays the selected one. The contents of the nodes are
customisable, for example: all the control panels for the experiment can be grouped
under one node or alternatively, they could be grouped by type or even individually.
The configuration files are text files that are used to set-up SECI for different
experiments or instruments. The configurations are created by the instrument
scientists through SECI. The configuration file principally determines which nodes
are available in the tree-view, which programmes populate these nodes and which – if
any – experimental values are listed in the block list.
1
2. Using SECI
2.1. Accounts
The File menu is used for adding or removing user accounts and for logging in or out.
To log in you must have an SECI account and know the relevant password. There are
three types of account (in order of power): Administrator, Instrument Scientist and
User. Of these, the user and instrument scientist accounts are the most used.
The Administrator accounts have the following privileges:
•
•
•
•
•
•
•
Create Administrator, Instrument Scientist and User accounts.
Remove instrument scientist and user accounts.
Overwrite or delete configurations saved by Administrators, Instrument
Scientists and Users.
Open any saved configuration.
Create new configurations.
Edit configurations and save them under a different filename.
Minimise SECI.
The Instrument Scientist accounts have the following privileges:
•
•
•
•
•
Overwrite or delete configurations saved by Instrument Scientists and Users.
Open any saved configuration.
Create new configurations.
Edit configurations and save them under a different filename.
Minimise SECI.
The User accounts have the following privileges:
•
•
•
•
Overwrite or delete configurations saved by other Users.
Open any saved configuration.
Create new configurations.
Edit configurations and save them under a different filename.
To add an account, select ‘Add User’ from the File menu (Administrator only). In the
dialog panel enter in the new account name and password, then select the type of
account required and click ‘OK.’ The new account is now added to the account
database. Note: this account will be valid for all instruments.
To remove an account, select ‘Remove User’ from the File menu (Administrator
only). In the dialog panel select the group of the user and then the user’s name from
the list. To delete the account click ‘OK.’
2.2. Configurations
As stated previously, configurations are used to configure SECI for different
experimental set-ups. They determine which programmes SECI loads (LabVIEW,
2
OpenGENIE and so on), which initial values equipment take, and which nodes are
available on the tree-view. Through SECI it is possible to open different
configurations, modify existing configurations and create new configurations.
2.2.1. Opening a configuration
To open a configuration it is necessary to be logged in with a valid account. From the
Configuration menu select ‘Open Configuration,’ this will open a dialog form which
lists all the available configurations for the current instrument. From the list select the
required configuration and click ‘OK,’ SECI will now shutdown and restart in the
new configuration. This may take a minute or so.
2.2.2. Adding a Display page (a tree-view node)
To add a node to the tree-view, select ‘Display Pages’ from the Configuration menu
then from the sub-menu select ‘Add Display Page.’ A ‘New Display Page’ dialog
form will now be shown. The top list box shows the main nodes, the new page will be
a sub-node of one of these nodes. From the list of nodes select the required node, next
it is necessary to name the new sub-node. Finally, it is necessary to choose the page
type, the options are:
•
•
•
VI – this is short for Virtual Instrument, this means the display page will be
used for displaying LabVIEW panels.
Web – the page will be used for displaying web-pages.
Other – the page will be used other kinds of programmes.
Next, click ‘OK,’ the new page should now appear as a sub-node of one of the main
nodes. To make this change permanent the configuration will need to be saved.
2.2.3. Removing a Display page
Firstly to remove a Display page it is necessary to remove any programmes (see
section 2.2.13) or LabVIEW panels (see sections 2.2.6 and 2.2.8) from the page first.
Then select ‘Display Pages’ from the Configuration menu then from the sub-menu
select ‘Remove Display Page.’ From the new window select the display page to
remove then click ‘OK.’ The page should now be removed, to make this removal
permanent it is necessary to save the configuration.
2.2.4. Renaming a Display page
To rename an existing Display page select ‘Display Pages’ from the Configuration
menu then from the sub-menu select ‘Rename Display Page.’ From the new window
select the Display page to rename and then enter a new name, to finish click ‘OK.’
The Display name will now have been changed, to make this change permanent the
configuration must be saved.
3
2.2.5. Adding a LabVIEW panel to an existing configuration
To add a LabVIEW panel to a configuration, it is necessary to have a node on the
tree-view for LabVIEW panels, to do this see section 2.2.2.
To add a LabVIEW panel select ‘LabVIEW Panels’ from the Configuration menu and
from the sub-menu select ‘Add LabVIEW Panel.’ A new ‘Add LabVIEW’ dialog
panel will open from which the display page for the new LabVIEW panel can be
selected. When a display page is chosen a File dialog box will open, from this select
the desired LabVIEW VI file and click ‘Open.’ The location of the new VI file will
now be listed in the ‘Add LabVIEW’ dialog panel, click ‘Add’ to add the new
LabVIEW panel. A new dialog panel will open; from this dialog panel it is possible to
configure the behaviour of the LabVIEW panel. The first option is whether to add any
associated INI files to the LabVIEW panel. The INI files contain data for initialising
and configuring the LabVIEW panels. The two other options available for the new
LabVIEW panel are whether to start the panel running upon loading or to hide the
panel. The configuration will need to be saved to make this change permanent.
2.2.6. Removing a LabVIEW panel from an existing configuration
To remove a LabVIEW select ‘LabVIEW Panels’ from the Configuration menu and
from the sub-menu select ‘Remove LabVIEW Panel.’ A dialog panel will open; from
this panel select the Display page from which the LabVIEW panel will be removed
and then select the VI to remove. Click ‘OK’ and the panel is removed from this
instance of the configuration. The configuration will need to be saved to make this
change permanent.
2.2.7. Changing a LabVIEW panel’s associated files
From the Configuration menu select ‘LabVIEW Panels’ and then select ‘Change
Associated files’ from the sub-menu. A new dialog window will open, from this select
the Display page of the LabVIEW panel to be edited and then select the actual VI. It
is now possible to add or delete the associated INI file for the panel. To make any
changes permanent the configuration will need to be saved.
2.2.8. Moving a LabVIEW Panel to a different Display page
First it is necessary to select the Display page containing the LabVIEW panel which is
to be moved. Then from the Configuration menu select ‘LabVIEW Panels’ and then
select ‘Move LabVIEW Panel to Another Page’ from the sub-menu. The new window
will list the LabVIEW panels available in the selected Display page, select the panel
to move then choose which Display page to move it to. Click ‘OK’ and the LabVIEW
panel will now be shown on the chosen Display page. To make the change permanent
the configuration will need to be saved.
2.2.9. Editing the start-up order of the LabVIEW panels
The behaviour of one LabVIEW panel may depend on one or more other LabVIEW
panels, and subsequently the order in which the panels are loaded may be of
4
significance. To set the start-up order of the panels select from the Configuration
menu ‘LabVIEW Panels’ and then choose ‘Set Properties for Panels’ from the submenu. A new window appears containing a chart of the LabVIEW panels in the
configuration. In this chart it is possible to set the order in which the LabVIEW panels
are loaded. Each panel must have a unique value for the order. Any panels that have
not been explicitly set an order number will be assigned an order number greater than
10,000 by SECI. It is also possible to set a wait time for each panel, this indicates how
long after the previous panel has loaded should the panel wait before loading. Once
any editing has been completed click ‘OK’ to finish. To make any changes permanent
it is necessary to save the configuration.
2.2.10. Setting the visibility of the LabVIEW Panels
It is possible to hide LabVIEW panels when the user does not need to know about
them. The visibility of all the panels can be edited or reviewed in one window. To do
this, select from the Configuration menu ‘LabVIEW Panels’ and then choose ‘Set
Properties for Panels’ from the sub-menu. A new window will appear (the same as in
section 2.2.9). The checkboxes in the ‘Visible?’ column show whether a panel is
visible or not – checked for visible, unchecked for not. The visibility of a LabVIEW
panel can be set by clicking on the checkbox. When finished click ‘OK’ to close the
window. The configuration will then have to be saved to make any changes
permanent.
2.2.11. Setting a LabVIEW panel to run automatically
LabVIEW panels can be set to run automatically after loading or not when SECI. This
property is set in the same window as discussed in sections 2.2.9 and 2.2.10. To open
this window, select from the Configuration menu ‘LabVIEW Panels’ and then choose
‘Set Properties for Panels’ from the sub-menu. In the new window there is a column
called ‘Run at Start-up?’ If the checkbox is checked for a LabVIEW panel then it will
start running when it is loaded, if it is unchecked then it will load but will require the
user to start it. By clicking the checkbox this setting can be changed from on
(checked) to off (unchecked). Click ‘OK’ to keep the changes and close the window.
To make these changes permanent the configuration will need to be saved.
2.2.12. Adding
configuration
other
(non-LabVIEW)
programmes
to
a
To add non-LabVIEW programmes to a configuration it is necessary to add a Display
page for these programmes as shown in section 2.2.2. If this has been done then select
‘Other Programmes’ from the Configuration menu, in the sub-menu select ‘Add
Programme.’ In the new window select the Display page to add the new programme
to this will open a file dialog window for selecting the new programme. Choose the
programme to add then click ‘Open,’ this will close the file dialog window. Click
‘Add’ and the new programme will be added to the Display page. The configuration
will need to be saved to make this change permanent.
5
2.2.13. Removing other programmes
To remove a non-LabVIEW programme from a configuration select ‘Other
programmes’ from the Configuration menu, in the sub-menu select ‘Remove
Programme.’ In the new window select the Display page of the programme to be
removed then select the actual programme. Click ‘OK’ to remove the programme.
The configuration will then need to be saved to make this change permanent.
2.2.14. Adding a web viewer to a configuration
To add a web viewer to a configuration it is necessary to add a Display page for web
pages as discussed in section 2.2.2. Then select ‘Web Viewers’ from the
Configuration menu, in the sub-menu choose ‘Add Web Viewer.’ In the new form
select the Display page to add the viewer to and then type in the URL of the web-site
to display. Finally, enter a title for the web viewer window and click ‘Add.’ The new
web viewer should now appear. To add this web viewer permanently the
configuration will need to be saved.
2.2.15. Removing a web viewer
To remove a web viewer, first select the Display page with the web viewer in. Then
select ‘Web Viewers’ from the Configuration menu, in the sub-menu choose ‘Remove
Web Viewer.’ From the dialog box select the web viewer to remove and click ‘OK.’
To remove this viewer permanently the configuration will need to be saved.
2.2.16. Set DAE Options
Not sure what this does!
2.2.17. Saving, Viewing and Deleting Configurations
The options to save, view and delete configurations are all grouped together under the
‘Save/Delete/View Configurations’ option on the Configuration menu. Choosing this
will open a new window offering the choices for saving, viewing and deleting
configurations.
There are three different options for saving a configuration, these are:
•
•
•
Save Current Config – this will save the current configuration without
changing the configuration name (i.e., it will overwrite the configuration).
This is permission based, for example: a User use ‘Save Current Config’ is the
current configuration was created or saved by an Instrument Scientist.
Save Current Config As – this will enable the current operator to save the
current configuration under a different or new name. Again this is permission
based: a User would be able to save a configuration under a new name, but
may not be able to save over an existing configuration.
Save As Other User – this allows an Instrument Scientist or Administrator to
save the current configuration as a lower permissions group. For example: an
Instrument Scientist could save a configuration as a User, thus the User will be
able to overwrite the configuration.
6
To use ‘Save Current Config,’ click that button; the configuration will then be saved
depending on the permissions.
To use ‘Save Current Config As,’ click that button, the window will then change. In
the changed window type in a new configuration name or select an existing one, then
click ‘OK.’ The configuration will then by saved if the permissions are correct.
To use ‘Save As Other User,’ click that button, the window will then change. In the
changed window either enter in a new configuration name or select an existing one.
Then select the permission group and username with which the configuration is to be
saved. Finally, click ‘OK’ and the configuration will be saved provided the
permissions are right.
Viewing a configuration allows the operator to view the LabVIEW panels in a chosen
configuration. To do this click the ‘View A Config’ button, this will change the
window. In the changed window select the configuration to be viewed, after a few
seconds the list of LabVIEW panels will be displayed. Click ‘OK’ to exit.
Deleting a configuration allows the operator to delete a chosen configuration.
Clicking the ‘Delete A Config’ button changes the window form, then from the
changed form select the configuration to be deleted and click ‘OK.’ The
configuration will then be deleted provided the current operator has the correct
permissions to delete the chosen configuration.
2.2.18. Adding another configuration to the current configuration
It is possible to add one configuration to the current configuration. To do this, from
the Configuration menu select ‘Add Configuration’ this will open a window with a list
of available configurations. From the list select a configuration and click ‘OK,’ the
chosen configuration should now get added to the current configuration. The new
combined configuration will have to be saved for the changes to be permanent.
2.2.19. Closing the configuration
Selecting ‘Close Configuration’ from the Configuration menu will cause the current
configuration to be closed and the current operator to be logged out.
3. SECI options
3.1. Adding or editing custom blocks and log values
SECI allows the operator to customise the dashboard so that it can monitor
experiment values (known as blocks) which are not included in the main status panel.
These blocks are added via the ‘Monitor and Log Values’ option on the Options
menu. Selecting this option opens a new window form which contains a grid
containing the current blocks. Select an existing block and click ‘Change’ to edit it or
click ‘Add’ to create a new block, both methods will cause a new windows form to
appear. This new form allows the block to be configured, it is recommended that
when configuring a new block to start from the top-left and work down to the bottom
right. This guide will provide a walkthrough for creating a new block starting from the
top-left:
7
1. Choose a Display page from the available LabVIEW Display pages; this will
create a list of the panels (VIs) available.
2. From the list of panels choose the panel which contains the value to be
monitored. Once a panel has been chosen, the three lists on the next row down
will be populated.
3. The first list (working from left to right) contains all the values (and their
type, i.e., Boolean, integer etc.) that can be monitored on the chosen panel.
Highlight the required variable to continue.
4. (Optional) The second list allows a set variable to be assigned. This allows
OpenGENIE to send new values for this variable to the LabVIEW panel.
5. (Optional) If a set variable is assigned it may be necessary for OpenGENIE to
push a LabVIEW button to send the new value. The third list chooses which
button to press.
6. A name for the block must be entered and the option to include is also
available.
7. The next three parameters to set are the frequencies for logging the block
values and for updating the blocks in the dashboards. This is done by setting
the intervals, in seconds, which SECI will wait before logging the value or
updating the dashboard. A value of zero will mean that the logging or
updating will be disabled.
8. The next option is to decide whether to turn ‘Run Control’ on, by default it is
off. Run control determines a range of values between which data is collected,
for example: if there was a temperature block, it may be possible that only
data for temperatures between 10°C and 20°C needs to be recorded. It is
recommended that the block name is appended with (R) for clarity if run
control is used.
9. There is an option to save the block value (toggle on or off), this is for when a
block does not change during the experiment, rather than logging an
unchanging value, the value of the block is saved once at the end of the run.
(THIS CURRENTLY DOES NOT WORK AS SECI DOES NOT KNOW
WHEN AN EXPERIMENT ENDS!)
10. The final option is to enable or disable the block. If the block is disabled it
will no longer log or update the values. The dashboard will still show the
block name but with disabled written next to it.
When the block has been configured, click ‘OK’ to finish.
Blocks can also be deleted; to do this select the block in the grid and then click
“Delete.” The order in which blocks appear on the dashboard can also be set by
clicking “Change Order.” This will open a new window in which the all the blocks are
listed. By selecting a block and clicking the “Up” or “Down” button the block’s
position can be changed, as required. Click “OK” to accept the changes.
To make any changes permanent it is necessary to save the configuration.
3.2. Dashboard page options
This section refers to the dashboard page node of the tree-view, not the SECI
dashboard. To access the Dashboard page options, select ‘Dashboard Page Options’
8
from the Options menu. This will opened the Dashboard options window; from this
window the following options are available:
•
•
•
•
•
•
•
•
Add A Graph – this option sets up a graph plot to monitor a block value.
Change A Graph – this option allows the properties of an existing graph to be
changed.
Delete A Graph – this option will remove an existing graph from the
Dashboard page.
Show or hide the big dashboard – choose whether to show the big version of
the SECI dashboard on the Dashboard page.
Show or hide the OpenGENIE scripting window – choose whether to add the
OpenGENIE scripting window to the Dashboard page.
Add A Block Display Box – this option will add a window box to the
Dashboard page which contains the value(s) for a chosen block or blocks.
Change A Block Display Box – this option allows the properties of an existing
display box to be changed.
Delete A Block Display Box – this option will remove an existing display box
from the Dashboard page.
When ‘Add A Graph’ is selected a new window opens, from this window select the
block to be plotted. Next, choose whether to plot the set point then enter a label for the
Y-axis and a name for the graph. Finally, choose whether to show another block on
the same graph and whether to increase or decrease the graph buffer size (the number
of points stored). Click ‘OK’ to add the graph.
Choosing ‘Change A Graph’ will open a new window, in this window all the values
set for the graph when adding the graph can be changed. Click ‘OK’ to accept the
changes.
Selecting ‘Delete A Graph’ will open a window listing the existing graphs. Select the
graph to delete and click ‘OK.’ The graph will now be deleted.
When ‘Add A Block Display Box’ is selected a new window opens, first add a name
for the new display box and then choose which blocks to add to the box. To select a
block to add, choose the block from the list then click ‘Add Selected Block Now.’ If a
wrong block is added it can be removed by selecting it in the ‘Blocks To Be
Displayed’ list and click ‘Remove Selected Block.’ When all the required blocks have
be added click ‘OK’ to create the display box.
Choosing ‘Change A Block Display Box’ will open a new window. In this window
select the display box to be added, then blocks can be added or removed from this
box. Click ‘OK’ when finished to accept the changes.
Selecting ‘Delete A Block Display Box’ will open a new window. In the list of
display boxes chose the box to be deleted and click ‘OK’ to delete it.
For all the options in the ‘Dashboard Page Options’ it is necessary to save the
configuration afterwards to make the changes permanent.
9
3.3. Logging display values
It is possible to log the values listed in the main status panel. To do this, select ‘Log
Display Values’ from the options menu. A new dialog window will appear, in this
window select the value to log and click ‘Add.’ This can be repeated for as many
values as required. Click ‘OK’ when finished. The values will now be logged every
10 seconds in C:\data\InstName_RunNum_ValueName.txt.
3.4. Web/WAP dashboard options
The status of an experiment being run by SECI can be viewed on the web, either
through a standard internet browser or a WAP equipped mobile phone can be used.
However, there may be occasions when an experiment is of a sensitive nature and the
user wants to limit the web access. There are two web options that can be enable or
disabled on SECI:
• Display web dashboard (by default this is enabled). This option sets whether
the web dashboard will show any information on the web/WAP page.
• Show title (by default this is disabled). This sets whether the title is shown on
the web/WAP page. Thus it is possible to display the experiment status (which
anyone can see) for remote viewing but not the title which may contain
sensitive information.
These options can be set under ‘Web/WAP Dashboard Options’ in the ‘Options’
menu by checking the choices on the sub-menu. These settings are stored in the
SECI.ini file.
4. SECI.ini settings
There are number of options in SECI that can only be configured using the SECI.ini
file. These options are:
•
•
•
•
•
•
•
•
last_user_config – this keeps a record of the last configuration used\set before
SECI was closed. SECI will automatically load this configuration on start-up.
If a configuration causes SECI to crash on starting then a different
configuration can be set here.
username_file – this sets which user file is used to check passwords against.
This should never need to be changed.
last_run_number – this records the last run number before SECI was closed.
This should never need to be changed.
status_colours – this determines whether the status colours on the SECI
dashboard are activated. It must be set to true or false.
last_user – this keeps a record of who was logged in when SECI was closed.
SECI will start with this user logged in.
UseNewDAE – some instruments are using a newer version of the DAE
software, this Boolean determines whether this is the case.
RunningICP – this Boolean determines whether ICP is being run.
IsMuons – this Boolean is used to set whether the experiment is a Muon
experiment. If this is true then the monitor values are not shown on the SECI
dashboard.
10
These options should only be changed if you are certain you know what you are
doing.
5. SECI examples
5.1. Creating a simple configuration
In this example a simple dummy configuration will be created. Starting from a blank
configuration (no extra pages or LabVIEW panels):
1. Select Configurations->Display Pages->Add Display Page. In the new
window do the following:
• Select Instrument as the Page Group.
• Type in ‘Eurotherm Page’ as the Display Name to Create.
• Choose ‘VI’ as the page type.
• Click ‘OK.’
2. Select Configurations->LabVIEW Panels->Add LabVIEW Panel. In the new
window do the following:
• Choose ‘Eurotherm Page’ as the display page.
• In the file dialog window navigate to ‘Muon Eurotherm Front Panel,’ in
this directory select ‘Eurotherm Front Panel.vi’ and click ‘Open.’
• Click ‘Add’ and a new window opens. Select ‘Run VI When Loaded’ and
click ‘OK.’ The LabVIEW panel should now appear.
3. Repeat 1 but call the new page ‘ITC Page.’
4. Repeat 2 but for the ‘ITC Page and navigate to the
‘SOLOITCFRONTPANEL’ directory in the ‘Oxford Software’ directory and
choose ‘SoloITC503 – 2.vi.’ Again, select ‘Run VI When Loaded.’
5. For this example it is necessary that the SoloITC503 – 2.vi always loads first.
Select Configuration->LabVIEW Panels->Set Panels Startup Order. A new
window will appear with the two VIs listed, change the order for the
SoloITC503 – 2.vi from 10001 to 1 and click ‘OK.’
6. It is decided that it would be useful to display the Sample temperature from
the Eurotherm panel on the SECI dashboard. It is also required that the values
are logged in a text file. From the Options menu select ‘Monitor and Log
Values’ a new window will open. Click the ‘Add’ button and do the following
(starting from the top-left):
• Choose ‘Eurotherm Page’ from the list of display pages then select the VI.
• Select ‘Sample Temperature (Numeric)’ from the ‘Value to Read’ list.
• Ignore the optional parameters and enter ‘Sample_Temp’ as the name and
K as the units.
• Leave the remaining settings as their default values and click ‘OK,’ then
click ‘OK’ again to close the final window.
11
The Sample Temperature should now be displayed in the dashboard and be
logged in c:\data\.
7. It is now decided that plotting a graph of the Samp_Temp on the Dashboard
page would be useful, to do this:
• Select Option->Dashboard Page Options.
• In the new window, click ‘Add A Graph.’
• Choose the Sample_Temp block and enter ‘Temperature’ for the Y-axis
name and Sample_Temp for the graph name. Then click OK.
The graph should now appear on the Dashboard page of the tree-view.
A simple configuration has now been created and this can be saved.
Warning: do not use this configuration on an instrument as it is only an example.
6. OpenGENIE
6.1. What is OpenGENIE?
OpenGENIE is an in-house programme written mainly for analysing neutron
scattering data at ISIS; however, it is also used as a scripting language for running
experiments. This document is only concerned with OpenGENIE as a scripting
language running as part of SECI.
6.2. SECI and OpenGENIE
In the SECI environment, OpenGENIE can be found in the ‘Scripting/Logging’ node
of the tree-view under the ‘Open Genie’ [sic] sub-node. On non-muon instruments
there are two OpenGENIE windows present, one is the scripting window and the
other is concerned with control of the DAE and can be ignored. It is also possible to
set SECI to display the scripting window in the ‘Dashboard’ sub-node (see Section
3.2).
6.3. Basic OpenGENIE commands
At the simplest level, OpenGENIE can just be used to send simple commands, as
shown below. Note that the commands are shown in upper-case for clarity.
BEGIN – begins an experimental run.
END – ends an experimental run.
PAUSE – pauses the current experimental run.
RESUME – resumes a pause experimental run.
ABORT – aborts the current experimental run.
OpenGENIE has a CHANGE command, which can be used to change simple settings,
such as the experiment title, or more important settings, such as the period. Some
examples of the use of the CHANGE command as shown below.
12
CHANGE title=”Test Experiment” - changes the experiment title.
CHANGE user=”John Smith” – changes the user name.
CHANGE rbno==123456 – changes the RB number.
It is important to be able to set experimental values via OpenGENIE; this is done
using the CSET command. To be able to set a value, the value needs to be declared as
a block in SECI (see Section 3.1). A typical CSET command looks like:
CSET Temperature1=10 – requests that Temperature1 is set to 10.
It is also possible to add run control to a variable; this allows an upper and lower limit
to be set. If the variable exceeds the range then data is not collected (vetoing) and
SECI will go in to a waiting state until the variable goes back in to range. This is also
done by a CSET command, as shown in the following example.
CSET /control Temperature1=10 lowlimit=9 highlimit=11
As discussed in Section 3.1, run control can also be set in SECI. Technically there is
no difference between the two methods; however, it is recommended that only one of
the methods is used to avoid confusion.
To cancel run control, use the /nocontrol parameter:
CSET /nocontrol Temperature1=10.
To view a variable’s current value use the CSHOW command, as shown below.
CSHOW Temperature1 – shows the value of Temperature1.
It should be noted for both CSET and CSHOW, if a block has been added to SECI
since SECI was started CSET and CSHOW may not recognise the block name. This
problem is solved by using the GETBLOCKS command, which causes OpenGENIE
to refresh its internal list of blocks.
Another useful command is PRINTN; this will display a value in the OpenGENIE
interface, for example:
PRINTN “Hello World” – displays “Hello World” in OpenGENIE.
The final basic command is WAITFOR; this command instructs OpenGENIE to wait
until a certain condition is met before doing the next task. Typically, OpenGENIE is
asked to wait until the SECI dashboard displays that a certain number of µA, frames,
or seconds have been achieved. An example of a WAITFOR command looks like:
WAITFOR uamps=300.5 – wait for 300.5µA before continuing.
When the WAITFOR command is used for µA or frames, it does not wait for, say,
300µA to be collected from when the command was issued; instead, it will wait until
the total µA collected exceeds 300µA. For example: if the SECI dashboard displays
13
that a sample has received 300µA, then the command ‘WAITFOR uamps=200’ will
not cause OpenGENIE to wait; however, the command ‘WAITFOR uamps=400’ will
wait until another 100µA are collected.
6.4. Simple scripting in OpenGENIE
It is possible to combine a number of OpenGENIE commands in to a script file using
a simple text editor, such as NotePad. The script can be loaded into OpenGENIE via
the load command, as shown below.
LOAD “C:\\example_script.gcl”
A simple script might look like the following:
PROCEDURE example_script
CHANGE title=”Sample1, Run number 1”
BEGIN
WAITFOR uamps=100
END
CHANGE title=”Sample1, Run number 2”
BEGIN
WAITFOR uamps=200
END
END PROCEDURE
The above script will perform two runs on the same sample, one waiting for 100µA
and one waiting for 200µA. The script is contained between the PROCEDURE and
END PROCEDURE lines, these lines are necessary if the LOAD command is to be
used to load a script. To run the script type the procedure name and press return.
A more advanced script may look like this:
PROCEDURE example_script2
CHANGE title=”Sample2”
CSET Magnet_Field1=10
SLEEP 30
BEGIN
CSET /control Temperature1=100 lowlimit=98 highlimit=102
WAITFOR uamps=50
CSET /control Temperature1=50 lowlimit=48 highlimit=52
WAITFOR uamps=50
END
END PROCEDURE
This script will perform one run where it collects data at two different temperatures. It
will only collect data if the temperature is within two degrees of the chosen
temperature. Notice that a new command has been introduced: the SLEEP command.
This command will make OpenGENIE wait for a specified number of seconds before
continuing the script. In the above script, the SLEEP command is used to give the
magnet time to reach its target value.
14
6.5. Advanced scripting in OpenGENIE
It is possible to produce complicated scripts in OpenGENIE and this section lists
some of the features of OpenGENIE which are used to do this.
6.5.1. Variables
It is possible to declare both local and global variables in OpenGENIE; this is done in
the following way:
LOCAL i – declares a local variable called i.
GLOBAL date – declares a global variable called date.
More than one variable can be declared in a line of code, see below.
LOCAL i j k – declares three local variables.
6.5.2. Conditional statements
It is possible to have conditional statements in an OpenGENIE script using the IF
command, an example of which is shown below.
LOCAL i
i = CSHOW Var1
IF i > 100
PAUSE
ENDIF
In the above script if the value of Var1 is greater than 100 then the run is paused.
6.5.3. Loops
Control loops can be scripted in OpenGENIE using the following syntax.
LOOP
‘Do something
END LOOP
The above loop will continue indefinitely; however, it is more common to require the
loop to be completed a certain number of times. The following loop will cause
OpenGENIE to print to screen the square of i.
LOCAL i
LOOP i FROM 1 TO 10
PRINTN i*i
END LOOP
Loops can also be escaped from using the EXITIF command, as the following code
shows:
15
LOCAL i
LOOP i FROM 1 TO 10
EXITIF i = 5
END LOOP
PRINTN “i is equal to “ i
6.5.4. Accessing a variable in LabVIEW
Occasionally, it is necessary to get a value from the LabVIEW directly as opposed to
using the CSHOW command via SECI. This is done by the GETLABVIEWVAR
command, the syntax of which is shown below.
GETLABVIEWVAR( “vi name”, “variable name”)
Typically, this command would be used in the following way:
LOCAL i
i = GETLABVIEWVAR(“EurothermController.vi”, “SetPoint – 1”)
It is also possible to change the value of a variable from an OpenGENIE command
using the SETLABVIEWVAR command
SETLABVIEWVAR “vi name” “variable name” value
6.5.5. Pushing a button in LabVIEW
OpenGENIE can be command to ‘push’ a button in LabVIEW, for example: it may be
necessary to push a ‘Go’ or ‘Initialisation’ button from a script. The command to do
this is PUSHLABVIEWBUTTON, and the syntax is as follows.
PUSHLABVIEWBUTTON “vi name” “button name”
16
6.6. Summary of OpenGENIE commands
Command
Action
CHANGE title=String
CHANGE title=”new title”
CHANGE user=String
CHANGE user=”new user”
CHANGE rbno=Integer
CHANGE rbno=1236
UPDATESTORE
CHANGE period=Integer
CHANGE period=2
WAITFOR uamps=Real
WAITFOR uamps=5.3
WAITFOR frames=Integer
WAITFOR frames=4000
WAITFOR seconds=Integer
WAITFOR seconds=10
SLEEP integer
BEGIN
END
PAUSE
RESUME
ABORT
GETRUNSTATE()
CSHOW block_name
CSHOW temp1
CSET block=value
CSET temp1=5.0
CSET/CONTROL block=value
lowlimit=low highlimit=high
CSET/CONTROL temp1=5.0 lowlimit=4.8
highlimit=5.2
CSET/NOCONTROL block=value
CSET/WAIT block=value
GETLABVIEWVAR(“vi name”,“variable
name”)
SETLABVIEWVAR “vi name” “variable
name” value
PRINTN “message”
GETBLOCKS
Changes the current title of the run
Changes the user name for the run
Changes the RB number
Changes the period
Wait for x µA before continuing
Wait for x frames
Wait for x seconds
Wait for x seconds
Begin the run
End the run
Pause the run
Resume the run
Abort the run
Get the status of the DAE
Display the value of the block in
OpenGENIE
Set the value of the block
Set run control limits on the block
Removes run control
Wait until the block reaches a certain value
Get a LabVIEW variable value
Set a LabVIEW variable value
Display a message in OpenGENIE
OpenGENIE will refresh its block list
17
7. Common problems and possible solutions
Q. Every time SECI restarts, a ‘COM Surrogate Error’ or .NET error occurs,
what do I do?
This error is usually the result of two possible problems. Firstly, the instrument DAE
may not be turned on or connected; if this is the case then the DAE will need to be
turned on or reconnect by someone who knows how to do this (i.e., instrument
scientist or a member of the support staff). The second common cause of these errors
is that a configuration has been corrupted or contains an error; to check that this is the
case carry out the following steps:
1. In Windows Explorer navigate to C:\Documents and Settings\All
Users\Application Data\seci.
2. Open the SECI.ini file in Notepad.
3. Find the line starting with last_used_config and set last_used_config=none
and save the changes.
4. Restart SECI by closing the error box.
If SECI now loads correctly then it seems that the configuration it was trying to load
previously was corrupted in some way. To have this configuration fixed phone
computing support.
Q. I have just opened a different configuration and none of the LabVIEW VIs
seems to work after SECI has reloaded, what do I do?
There can be a number of reasons for this, but it is usually a result of LabVIEW
failing to communicate with the sample environment equipment. First check that the
VIs are running; if a VI is not running then it will display a menu bar at the top, as
shown below (1).
1
2
18
To start the VI running, click the arrow button on the left-hand side of the toolbar (2).
If the VI still does not work then the problem is probably due to a communications
fault; the next solution to try is restarting SECI. Restart SECI by clicking ‘Exit’ on the
‘File’ menu, this will cause SECI (and LabVIEW) to close down then reload. When
SECI reloads, all the connections to the sample environment are created afresh; this
may solve the problem.
If neither of the previous solutions work then it will be necessary to have someone
check the physical connections to the sample environment equipment.
Q. SECI is showing an error that says ‘Had to restart indicator thread,’ is this a
serious problem?
This error usually occurs because SECI fails to read a value from the DAE or a
LabVIEW VI. If the numbers in the SECI dashboard are still being updated after this
error occurs, then SECI has handled this error and the error can be ignored. However,
if the SECI dashboard has frozen, then this is a problem and computing support
should be informed. If the error occurs out of normal working hours, it is probably
worthwhile restarting SECI to see if that will fix the problem.
If the error keeps occurring regularly, but it does not cause the SECI dashboard to
freeze, then when convenient inform computing support of the problem and how often
it occurs.
Q. SECI has locked up during the middle of an experimental run, should I
restart it and what are the consequences?
If SECI freezes during an experimental run then the DAE will still collect data, unless
SECI has frozen because of the DAE failing (this is very unlikely); so, although SECI
has frozen the experiment will still continue. Unfortunately, it is likely that any script
running will also freeze and SECI will have to be restarted and the script may need to
be altered to start from the position where SECI froze.
If SECI freezes and no script is running, then is should be safe to restart SECI as the
DAE will still be collecting data at the same sample environment settings that were
set before SECI froze; however, be aware that restarting SECI also restarts LabVIEW,
so any VIs that require initialisation will need to be re-initialised. Only re-initialise the
VIs if data collection at the current settings has been finished.
Q. SECI is in the waiting state, but I have not set any run control, what do I do?
It may be that somebody else has set run control via SECI rather than OpenGENIE
and this has been saved as part of the configuration. To check this, go to ‘Monitor and
Log Values’ option on the Options menu, and select the first block row in the table
and click the ‘Change’ button. In the new window, check that run control is set to off,
if it is not then set it to off and click ‘OK.’ Repeat this for all the blocks listed in the
table. If this does not solve the problem, then it may be that run control has been set in
OpenGENIE without your knowledge, for example: it may be set in a script that was
19
run previously. To solve this, for each block enter the following command in to
OpenGENIE:
CSET/NOCONTROL “blockname”=”Required value”.
This will turn off any run control that has been set via OpenGENIE.
Q. For some reason the SECI dashboard is all squashed up, why is this and what
can I do to fix it?
The instrument control computer can only be accessed via remote desktop (or VNC)
and the screen resolution of the control computer is set to 1280x1024. If the control
computer is accessed via remote desktop from a computer with a lower screen
resolution than this then the SECI dashboard will be squashed up. When the control
computer is accessed later from a computer with the correct screen resolution SECI is
still the wrong size. Restarting SECI will fix this problem; in more recent versions of
SECI, double-clicking on a grey part of the dashboard will return SECI to its correct
size.
20