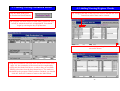
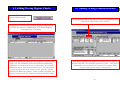
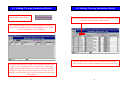
1
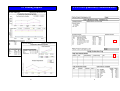
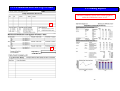
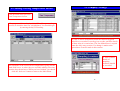
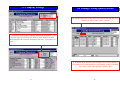
Quality and Sanitation Log
User Manual
Further Help
Contents
0.0 Introduction
0.1
0.2
0.3
0.4
0.5
Who is the Software Aimed at?
What can the Software do?
How is the Software Used?
Example of Benefits
Software Overview
3
3
3
4
5
1.0 General Concepts
1.1 Navigation
1.2 Viewing and Printing
1.3 Logging On and Main Menu
6
8
9
2.0 Blank Forms
2.1 Data Collection for Set Up
2.2 Daily Production
2.3 Daily Sanitation
2.4 Log of Events
10
11
11
12
12
3.0 Setting Up
3.1 Standard Settings
3.2 Company Settings
13
14
15
4.0 Logging Information
4.1 Adding/Viewing Production Details
4.2 Adding/Viewing Sanitation Details
4.3 Adding/Viewing Hygiene Checklist
4.4 Adding/Viewing Quality Details
4.5 Adding/Viewing Temperature Details
18
20
22
24
26
5.0 Printing Reports and Graphs
5.1 Printing Summary and Detailed Reports
5.2 Printing Graphs
28
32
6.0 Exporting to Excel
35
7.0 Log of Events
36
Further Help
39
For further information on this or other available software tools
please contact:
Mike Dillon Associates Ltd.
32a Hainton Avenue
Grimsby
North East Lincolnshire
DN32 9BB
United Kingdom
Phone/Fax +44 (0) 1472 348852
Fax +44 (0) 1472 356838
Email: [email protected]
39
Notes
0.0 Introduction
0.1 Who is the software aimed at?
Although initially developed for the African Fishing industry,
this software could be used by anyone who has an interest
producing daily records of production information.
0.2 What can the software do?
This program is designed to capture different types of useful
factory information on a daily basis, providing a diary of
production details, such as quality and quantity.
It can be used to log the quantities of resources used by a factory
for sanitation on a daily basis. The costs of resources are also
entered and a cost of sanitation then calculated.
Other information relating to quality and yield can also be
logged in the program, including time/temperature and
assessments of the product through the chain.
Daily record sheets can be generated by the program and used
for data collection, or in-house data collection systems can be
used.
Reports can be printed which give a summary of information
entered into the program. It is possible to keep track of each
batch through the factory if a traceability system is in place, so
allowing performance of quality and yields to be monitored.
0.3 How is the software used?
The rest of this manual explains how to use the software.
38
3
0.4 Example of Benefits
Notes
In the food industry, it is often important for companies to be
able to keep good written records. Especially when a company
is hoping to be able to export it’s products.
This software can benefit a company in this type situation by
providing them with the forms to collect data, and also a
program to store it in.
4
37
0.5 Program Overview
7.0 Log of Events
From the Main menu press the
Log of Events button
End Products
Collect Generic Data
Common to Industry
Quality Tests
Factory Areas
Resources
used
Collect Data Specific
To a Company
Production
Collect Daily Records
(used for other program)
Sanitation
36
Time and
Temperature
Hygiene
Quality Assessments
Using the information collected in the Log of Events form (page
10), this is where a log can be made describing activities which
may affect cost of control in the factory on a daily basis.
This can be used to document when changes are being made,
such as cleaning methods, production flow, icing, handling or
storing of product.
Using the graphs and reports, the impact of the change can be
analysed and referenced to the event log.
Sampling
Points
Bacteriological
Losses
Other
5
Organoleptic
1.1 Navigation
Whilst using the software, these are some of the buttons and
features you will come across.
6.0 Exporting to Excel
From the Main menu press the
Export to Excel 5 button
Back to the previous screen
Add a new record
Delete the selected record
Go to the Maintenance Menu
View and print options
See page 28
If you have Excel 5 available on your computer, the data that
has been entered into the software can be sent to an Excel file.
The file will be created in the directory shown.
The name of the current data set being looked at is also shown.
Different types of data can be exported separately as listed, or
alternatively all data can be sent together.
6
35
5.1 Printing Graphs
1.1 Navigation
Scroll up or down text
Go to first or previous
4
Go to next or last
To delete a row, click on the
arrow head and press delete
on the keyboard.
Selected record (arrow head)
New Record (star)
Drop-down menu selection
5
An alternative to ‘point and click’ with the mouse is to use
the keyboard ‘tab’ key to move between fields.
6
34
7
1.2 Viewing and Printing
5.1 Printing Graphs
Whenever the ‘print preview’ button is available on a
menu you can view and print report(s) .
Drop-down menu: Click file then close to return to the previous
menu. Click file then print to print the report you are viewing.
1
To close,
press the
X
Use the left and
right arrows to
move between
the available
2
Use the
side and
bottom
‘scroll bars’
to view all
of the page.
Zoom in for a closer view.
3
8
33
1.3 Logging On and Main Menu
5.1 Printing Graphs
To start : Double click system icon on desk top, wait for logon
screen
Enter name ‘A N Other’ and password ‘letmein’, press enter on
the keyboard and then click continue button.
From the Main menu press the
Print/View Graphs button
This shows which
data set is currently
loaded and where
it is saved. This
can be changed at
manager level.
1
2
3
4
5
6
Page 18
Page 10
Page 20
Page 28
Page 22
Page 32
See page 28
Page 24
Page 35
Page 26
Manager access only
32
Page 36
9
2.0 Blank Forms
5.1 Printing Reports
From the Main menu press the
print Blank Forms button.
1
2
3
4
5
These forms are used to collect production, sanitation and
other information by hand from the factory. The information
from these forms is later entered into the software.
10
31
5.1 Printing Reports
2.1/2.2 Set Up and Daily Production Data
1
2
30
11
2.3/2.4 Sanitation Data and Log of Events
5.1 Printing Reports
The three summary reports also contain graphs to
make the information easier to see.
3
4
5
12
29
5.1 Printing Reports
From the Main menu press the
Print/View Reports button
3.0 Setting Up
If you have access, from the Main
menu press the Set Up Menu Button
The first thing to do, is to enter the company name
here. Then use the information gathered using the
Data Collection for Set Up form (page 10) into the
following tables.
There are four summary
reports available from
here, which are suitable
for date ranges (page 29).
There are also two more
detailed reports that are
better suited to single
dates (page 31).
1
3
2
4
5
7
6
The reports available here can be applied to different date
ranges and the current range is displayed at the top of the screen.
To change the dates press the Reset Date Range button, this
brings up a screen where dates can be entered into the boxes and
the OK button pressed, or pressing the Reset Dates button will
set the range to 01/01/1990 – 01/01/2050.
28
Note: These tables must be set up before any information
can be entered into the logging sections of the software.
The information entered into these tables is used in the
drop down box selections for the rest of the software
13
3.1 Standard Settings
4.5 Adding/Viewing Temperature Details
1) This is
where details
of quality tests
used in the
factory should
be entered.
By changing the date at the top of the screen, data that has been
entered on earlier dates can be viewed.
2) This is where
details of end
products
produced by the
factory should
be recorded.
3) This is where details of
factory areas should be
recorded, with an order of
cleaning. If increments of 10
are used, this allows extra
areas to be added in between
at a later date.
14
27
4.5 Adding/Viewing Temperature Details
3.2 Company Settings
From the Main menu press the
Time/Temperature button.
The program will then display a blank Time/Temperature Log
record, in which the date box is highlighted. You should begin
by entering the day of recording.
4) This is where information about the factories hygiene
checklist is recorded. It can be given a code, and also details
of how often it is carried out. The list defined here is copied
onto the daily entry section. If a change is made to the
procedures it can be made in this section.
5) This is where
details of
sampling
locations should
be recorded.
The remainder of the record can be completed by typing into the
blank field boxes, or where they are available making selections
from the drop-down boxes. When you have finished, you should
click the ‘back one’ button to return to the Main Menu.
26
15
3.2 Company Settings
4.4 Adding/Viewing Quality Details
By changing the date at the top of the screen, data that has been
entered on earlier dates can be viewed.
6) Resources used by the company should be listed here. First
select the type of resource you wish to enter details for and
then complete the sections for names and also, if possible, for
costs.
If the batch ID is unknown, the sample time could be entered.
Fish losses are best measured as a percentage, as this will show
the relative trend when grouping quality data.
16
25
4.4 Adding/Viewing Quality Details
3.2 Company Settings
From the Main menu press the
Quality Assessment button.
The program will then display a blank Quality Assessment Log
record, a type of test needs to be selected from the list.
7) A report is also available which lists all of the quality tests
used in factories and also end products.
The remainder of the record can be completed by typing into the
blank field boxes, or where they are available making selections
from the drop-down boxes. When you have finished, you should
click the ‘back one’ button to return to the Main Menu.
24
17
4.1 Adding/Viewing Production Details
From the Main menu press
the Production Details button.
4.3 Adding/Viewing Hygiene Checks
By changing the date at the top of the screen, data that has been
entered on earlier dates can be viewed.
The program will then display a blank Daily production Log
record, in which the date box is highlighted. You should
begin by entering the day of production.
More information is available by pressing the arrow to move
across the screen
Using the information collected in the Production Details form
(page 10), the remainder of the record can be completed by
typing into the blank field boxes, or where they are available
making selections from the drop-down boxes. The totals are
calculated by the program. When you have finished, you should
click the ‘back one’ button to return to the Main Menu.
18
23
4.3 Adding/Viewing Hygiene Checks
From the Main menu press the
Hygiene Checks button.
4.1 Adding/Viewing Production Details
By changing the date at the top of the screen, data that has been
entered on earlier dates can be viewed.
The program will then display a blank Hygiene checks record,
in which the date box is highlighted. You should begin by
entering the day of cleaning.
Using the information collected in the Hygiene Checklist form
(page 10), the remainder of the record can be completed by
typing into the blank field boxes, or where they are available
making selections from the drop-down boxes. To enter details
as per the check list in the set up section, press the “Build
Checklist for Data Entry button”. When you have finished, you
should click the ‘back one’ button to return to the Main Menu.
22
Raw material intakes and production details can be related by
unique batch ID if a traceability system is in place . This allows
performance of each batch to be assessed. In practical terms
only the main product may be documented.
19
4.2 Adding/Viewing Sanitation Details
From the Main menu press the
Sanitation Resources button.
4.2 Adding/Viewing Sanitation Details
By changing the date at the top of the screen, data that has been
entered on earlier dates can be viewed.
The program will then display a blank Sanitation Resources
Log record, in which the date box is highlighted. You should
begin by entering the day of cleaning.
Using the information collected in the Sanitation Details form
(page 10), the remainder of the record can be completed by
typing into the blank field boxes, or where they are available
making selections from the drop-down boxes. When you have
finished, you should click the ‘back one’ button to return to the
Main Menu.
20
Ideally, the resources used per area should be documented.
Stores indicates the quantity withdrawn for the whole factory.
21