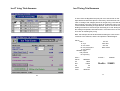
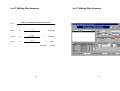
1
Acknowledgements
We would firstly like to thank Hector Lupin from the Fishery Industries
Division at the Food and Agricultural Organisation, for his continued
support throughout the project. The technical Manual 351 was used
extensively as a reference source and blueprint for much of the work.
We’d also like to thank Ib Kollavik-Jensen for his constant enthusiasm and
support for the economic approach to improved control.
Our appreciation also goes to Dr John Ryder from the National Resources
Institute International, now with Eastfish of Denmark, who commissioned
this work, for his enthusiasm and input in the early stages.
Our thanks also goes to Mr E. Spencer Garret, Director of the National
Seafood Inspection Laboratory USA , for providing the American approach
and economic data.
Finally, we would like to thank Vance McEachern and John Emberley, from
the Government of Canada, Department of Fisheries and Oceans, for
commissioning parallel studies from 1995-1999 which enabled some
methods to be refined and tested.
Contents
1.
Introduction
2.
CD Contents / Installation Instructions
3.
Registration Forms and Review Sheets
4.
Beginners Guide to Computing
5.
User Manual - Cleanse-IT
6.
User Manual - Ice-IT
7.
User Manual - Log-IT
8.
Workshop Activities
Cleanse-IT
Ice-IT
Log-IT
9.
10.
Example Protocols and Extra Exercises
Acknowledgements
CD Contents
Project Overview
The main objective of the project was to produce appropriate and
replicable methodologies for identifying the magnitude and source of postharvest losses in coastal fisheries.
The purpose of the project was to develop the local capacity to adapt and
implement cost effective control measures targeted at the critical loss
areas
within
a
defined
fisheries
chain.
The understanding and practical development of methods utilisation of the
predictive costing software will enable the policy makers to promote
effective strategies to control loss and maintain quality. Commercial
decision-makers, local advisors and fishing communities will also benefit
through cost analysis of their relevant control options.
The software and associated methodologies will assist in the future
planning of cost-effective control systems within Uganda and Ghana thus
benefiting fisherfolk, processors, exporters and purchasers of fish products
This Manual is one of several outputs associated with the DFID Post
Harvest Fisheries Research Programme’s Fish Loss Assessment and
Control (FLAC) initiative. Other FLAC tools are Costing Control Methods.
FishLoss (Database of loss information), Predictive Model (Assessing the
impact of intervention), Trials Database (Assessing the impact of quality
intervention), Ice Calculator and Sanitation Control (monitoring factorybased quality control) computer software
When the CD enclosed within this pack is placed into your
computer you will see an introductory menu. From here you have
the option to:
!
Review the Features of the Software
!
View Software Demonstrations
!
Run Worked Examples
!
Run Programs from CD
!
View Videos of the Programs
!
Install Programs to a Hard Disk
!
View Contacts
Disclaimer
This document is an output from the Post Harvest Fisheries Research
programme of the UK Department for International Development (DFID) for
the benefit of developing countries. The views expressed are not
necessarily those of DFID.
DFID
Projects:
R5027
Natural Resources Institute
!
R7008,
R6817
Fish Loss Assessment and Control Project
Outputs
Using the CD
You will then see the screen below:
After selecting the Cleanse-IT, Ice-IT and Log-IT option from the initial
menu, the next screen you will see is shown below:
Press one of the three buttons to see information about that program.
To see more about what the software can do, press the “demos” button
and choose a program.
The different sections of
the CD become available
by clicking on the buttons
down the left side.
(features, demos, software
install, contact, exit)
The name of the current
section is shown at the
bottom Left of the Screen
(Main Menu in this example)
To have a look at some information about the main features of each of the
programs, press the “features” button on the left.
Installation Instructions
Installing from Floppy Disks:
To install Log-IT, Cleanse-IT or Ice-IT to your computer you can use the
CD provided. If for any reason you are unable to use the CD, please
contact Mike Dillon Associates Ltd. for a set of floppy disks.
1. If Applicable Switch on computer (WIN 95 will automatically load)
ELSE load windows 3.11.from the MSDos prompt by typing “WIN”
the “Enter”(c:>WIN)
Installing from the CD:
2. Windows for Workgroups or Windows 3.11 - From the Program
Manager Select File from Menu (ALT+F)
Win 95/98 or NT4.0 - Select START button, button left of screen
First choose the Install option from the left side of the screen.
3. Select Run (or press R) from the drop down box
4. A window will open with the Title Run (The Title Bar - Usually
5. Place Disk 1 in Drive A:.
6. You will now be asked for a command line, within this window. (Text
may already exist)
Type a: set-up (not case sensitive)
7. Press Enter or single click on OK
8. The Set up window will appear. Please Wait.
9. Screen changes to Blue/Black, Set-up in top Left Hand corner
10. Select OK Button with mouse or press Enter.
11. The next screen will ask for the directory for files to be stored in.
Press Enter or Select OK button with the mouse.
12. Do not change this directory unless
1. The default directory conflicts with the current system
2. The software is to be placed on drive other than C:
Then choose the program you want to install to your hard drive.
13. The next screen will allow you to Exit Set-up or Change Directory.
Use the mouse to select the Picture of the Computer or Press
ALT+C to begin Installation.
Follow the instructions for installing from floppy disks from step 8.
14. You will then be asked to Choose Program Group. Use the already
highlighted Program Group name and Select Continue with the
mouse or Press ALT+C.
15. Please Wait for Screen Prompts to ask you to remove and place
each disk in drive a in the order the system requests.
16. When complete select OK button with mouse or Press Enter.
17. The program is now ready to run. To begin select the Icon in the
chosen program group by Double Clicking with the mouse.
Software Support and Registration
Software Registration Form
For further help and support with using the Log-IT, Ice-IT
and Cleanse-IT software, please contact:
Name
Mike Dillon Associates Ltd.
Position
32a Hainton Avenue
Company
Grimsby,
Address
N.E. Lincolnshire
DN32 9BB
United Kingdom.
Tel.
Tel: +44 (0)1472 348852 (2 Lines)
Fax
Fax: +44 (0)1472 356838
Email
email: [email protected]
Which software do you want to register?
Log-IT
Cleanse-IT
To register your software, please fill in the Registration
Form and return it to address above.
Ice-IT
Any data entered into the software should be backed up
by attaching the data set to an email and sending it to the
above email address.
Comments
Please attach your business card if possible.
Software Registration Form
Software Registration Form
Name
Name
Position
Position
Company
Company
Address
Address
Tel.
Tel.
Fax
Fax
Email
Email
Which software do you want to register?
Which software do you want to register?
Log-IT
Log-IT
Cleanse-IT
Cleanse-IT
Ice-IT
Ice-IT
Comments
Comments
Please attach your business card if possible.
Please attach your business card if possible.
Review: CLEANSE IT – Cleaning Methods
Review: CLEANSE IT – Cost Predictions
We are grateful for your assistance in this evaluation, please use this form
& indicate the most appropriate number against each category. We would
also welcome any additional comments you wish to make:
We are grateful for your assistance in this evaluation, please use this
form & indicate the most appropriate number against each category.
We would also welcome any additional comments you wish to make:
a) Installation and Set up
You are given guidance into set up – can you follow and install?
a) Installation and Set up
You are given guidance into set up – can you follow and install?
Not Possible/Errors
Not Possible/Errors
1
2
3
4
5
6
7
Very Easy, No Problems
1
2
3
4
5
6
7
Very Easy, No Problems
Additional
Comments:
Additional
Comments:
b) Support from the Workshop Activities and User Manual
Can you see what the software does from the manual?
b) Support from the Workshop Activities and User Manual
Can you see what the software does from the manual?
Confusing, Insufficient
information
Additional
Comments:
Confusing, Insufficient
information
Additional
Comments:
1
2
3
4
5
6
7
Clear with sufficient
information
1
2
3
4
5
6
7
Clear with sufficient
information
c) Ease of use
How easy is it to perform the calculations using the software?
c) Ease of use
How easy is it to perform the calculations using the software?
Very Difficult
Very Difficult
1
2
3
4
5
6
7
Simple and Clear
1
2
3
4
Additional
Comments:
Additional
Comments:
d) Relevance to your country
Is this software tool useful to you?
d) Relevance to your country
Is this software tool useful to you?
Little/No relevance
1
2
3
4
5
6
7
Highly relevant
Little/No relevance
1
2
3
4
5
6
7
Simple and Clear
5
6
7
Highly relevant
Additional
Comments:
Additional
Comments:
e) Report layouts/content
Are they what you need, can you understand the content?
e) Report layouts/content
Are they what you need, can you understand the content?
Not Possible/Errors
Not Possible/Errors
Additional
Comments:
1
2
3
4
5
6
7
Very Easy, No Problems
Additional
Comments:
1
2
3
4
5
6
7
Very Easy, No Problems
Review: ICE IT – Ice melting Rate Trials
Review: ICE IT –Ice Trials
We are grateful for your assistance in this evaluation, please use this form
& indicate the most appropriate number against each category. We would
also welcome any additional comments you wish to make:
We are grateful for your assistance in this evaluation, please use this
form & indicate the most appropriate number against each category.
We would also welcome any additional comments you wish to make:
a) Installation and Set up
You are given guidance into set up – can you follow and install?
a) Installation and Set up
You are given guidance into set up – can you follow and install?
Not Possible/Errors
Not Possible/Errors
1
2
3
4
5
6
7
Very Easy, No Problems
1
2
3
4
5
6
7
Very Easy, No Problems
Additional
Comments:
Additional
Comments:
b) Support from the Workshop Activities and User Manual
Can you see what the software does from the manual?
b) Support from the Workshop Activities and User Manual
Can you see what the software does from the manual?
Confusing, Insufficient
information
Additional
Comments:
Confusing, Insufficient
information
Additional
Comments:
1
2
3
4
5
6
7
Clear with sufficient
information
1
2
3
4
5
6
7
Clear with sufficient
information
c) Ease of use
How easy is it to perform the calculations using the software?
c) Ease of use
How easy is it to perform the calculations using the software?
Very Difficult
Very Difficult
1
2
3
4
5
6
7
Simple and Clear
1
2
3
4
Additional
Comments:
Additional
Comments:
d) Relevance to your country
Is this software tool useful to you?
d) Relevance to your country
Is this software tool useful to you?
Little/No relevance
1
2
3
4
5
6
7
Highly relevant
Little/No relevance
1
2
3
4
5
6
7
Simple and Clear
5
6
7
Highly relevant
Additional
Comments:
Additional
Comments:
e) Report layouts/content
Are they what you need, can you understand the content?
e) Report layouts/content
Are they what you need, can you understand the content?
Not Possible/Errors
Not Possible/Errors
Additional
Comments:
1
2
3
4
5
6
7
Very Easy, No Problems
Additional
Comments:
1
2
3
4
5
6
7
Very Easy, No Problems
Review: ICE IT - Calculator
Review: LOG IT
We are grateful for your assistance in this evaluation, please use this form
& indicate the most appropriate number against each category. We would
also welcome any additional comments you wish to make:
We are grateful for your assistance in this evaluation, please use this
form & indicate the most appropriate number against each category.
We would also welcome any additional comments you wish to make:
a) Installation and Set up
You are given guidance into set up – can you follow and install?
a) Installation and Set up
You are given guidance into set up – can you follow and install?
Not Possible/Errors
Not Possible/Errors
1
2
3
4
5
6
7
Very Easy, No Problems
1
2
3
4
5
6
7
Very Easy, No Problems
Additional
Comments:
Additional
Comments:
b) Support from the Workshop Activities and User Manual
Can you see what the software does from the manual?
b) Support from the Workshop Activities and User Manual
Can you see what the software does from the manual?
Confusing, Insufficient
information
Additional
Comments:
Confusing, Insufficient
information
Additional
Comments:
1
2
3
4
5
6
7
Clear with sufficient
information
1
2
3
4
5
6
7
Clear with sufficient
information
c) Ease of use
How easy is it to perform the calculations using the software?
c) Ease of use
How easy is it to perform the calculations using the software?
Very Difficult
Very Difficult
1
2
3
4
5
6
7
Simple and Clear
1
2
3
4
Additional
Comments:
Additional
Comments:
d) Relevance to your country
Is this software tool useful to you?
d) Relevance to your country
Is this software tool useful to you?
Little/No relevance
1
2
3
4
5
6
7
Highly relevant
Little/No relevance
1
2
3
4
5
6
7
Simple and Clear
5
6
7
Highly relevant
Additional
Comments:
Additional
Comments:
e) Report layouts/content
Are they what you need, can you understand the content?
e) Report layouts/content
Are they what you need, can you understand the content?
Not Possible/Errors
Not Possible/Errors
Additional
Comments:
1
2
3
4
5
6
7
Very Easy, No Problems
Additional
Comments:
1
2
3
4
5
6
7
Very Easy, No Problems
Program:_________________________________
Program:_______________________________
We are grateful for your assistance in this evaluation, please use this form
& indicate the most appropriate number against each category. We would
also welcome any additional comments you wish to make:
We are grateful for your assistance in this evaluation, please use this
form & indicate the most appropriate number against each category.
We would also welcome any additional comments you wish to make:
a) Installation and Set up
You are given guidance into set up – can you follow and install?
a) Installation and Set up
You are given guidance into set up – can you follow and install?
Not Possible/Errors
Not Possible/Errors
1
2
3
4
5
6
7
Very Easy, No Problems
1
2
3
4
5
6
7
Very Easy, No Problems
Additional
Comments:
Additional
Comments:
b) Support from the Workshop Activities and User Manual
Can you see what the software does from the manual?
b) Support from the Workshop Activities and User Manual
Can you see what the software does from the manual?
Confusing, Insufficient
information
Additional
Comments:
Confusing, Insufficient
information
Additional
Comments:
1
2
3
4
5
6
7
Clear with sufficient
information
1
2
3
4
5
6
7
Clear with sufficient
information
c) Ease of use
How easy is it to perform the calculations using the software?
c) Ease of use
How easy is it to perform the calculations using the software?
Very Difficult
Very Difficult
1
2
3
4
5
6
7
Simple and Clear
1
2
3
4
Additional
Comments:
Additional
Comments:
d) Relevance to your country
Is this software tool useful to you?
d) Relevance to your country
Is this software tool useful to you?
Little/No relevance
1
2
3
4
5
6
7
Highly relevant
Little/No relevance
1
2
3
4
5
6
7
Simple and Clear
5
6
7
Highly relevant
Additional
Comments:
Additional
Comments:
e) Report layouts/content
Are they what you need, can you understand the content?
e) Report layouts/content
Are they what you need, can you understand the content?
Not Possible/Errors
Not Possible/Errors
Additional
Comments:
1
2
3
4
5
6
7
Very Easy, No Problems
Additional
Comments:
1
2
3
4
5
6
7
Very Easy, No Problems
Program:_________________________________
Terms of Reference
We are grateful for your assistance in this evaluation, please use this form
& indicate the most appropriate number against each category. We would
also welcome any additional comments you wish to make:
Read user manuals and make suggestions, if necessary, as to how it
could be improved in terms of layout and user friendliness. At the
same time highlight what other information, if any, the manual
should contain.
a) Installation and Set up
You are given guidance into set up – can you follow and install?
Input a sample of data (See Workshop Activities). Comment on the
strengths and weaknesses of the data entry facility. Please use the
Screen number references, to enable an accurate means of
identifying a link between computer and notes.
Not Possible/Errors
1
2
3
4
5
6
7
Very Easy, No Problems
Additional
Comments:
b) Support from the Workshop Activities and User Manual
Can you see what the software does from the manual?
Confusing, Insufficient
information
Additional
Comments:
1
2
3
4
5
6
7
Clear with sufficient
information
Outline other issues that should be addressed in both the software and
manual which are not covered in 1. or 2.
Forms are provided for your comments and feedback
Please return on Completion
Workshop Activities Checklist
General
c) Ease of use
How easy is it to perform the calculations using the software?
Activity
Very Difficult
Cleanse- IT
1
2
3
4
5
6
7
Simple and Clear
Additional
Comments:
Activity
d) Relevance to your country
Is this software tool useful to you?
Little/No relevance
0.1
1
2
3
4
5
6
7
Highly relevant
Description
Register Software for Support
Time Scale
5 mins
Description
Time Scale
1.1
View the Software being used (video)
5-10 mins
1.2
View examples of cleaning methods used in
Uganda
5-10 mins
1.3
Practice Setting up and Entering Cleaning
Methods
15-20 mins
Additional
Comments:
1.4
Complete Cleanse-IT Cleaning Methods
Review Sheet.
e) Report layouts/content
Are they what you need, can you understand the content?
2.1
Examples of how cost predictions are entered
and Calculated (video)
5-10 mins
Not Possible/Errors
2.2
View examples of cost predictions made in
Uganda
5-10 mins
Additional
Comments:
1
2
3
4
5
6
7
Very Easy, No Problems
Done
5 mins
2.3
Practice Data entry for Cost predictions
15-20 mins
2.4
Practice Data entry for Cost predictions
5-10 mins
2.5
Complete Cleanse-IT Cost Predictions Review
Sheet.
1
5 mins
Done
2.6
Discuss in your group your opinions of
Cleanse-IT.
Workshop Activities
5-10 mins
Ice-IT
Activity
Done
1.
Cleaning Methods (Cleanse-IT)
1.1
Theoretical – Computer based activity
Description
Time Scale
3.1
View the Software being used (video)
5-10 mins
•
From the CD, press the Software button (left-hand side of screen)
3.2
See examples of Melting trials performed in
Uganda/Morocco
10-15 mins
•
Now press the Cleanse-IT button and select Cleaning Methods from
the options and press OK.
3.3
Entering Ice Melting Trials Data
10-15 mins
•
Next select the Theoretical option and press ok.
3.4
Complete the Ice-IT Melting Trials Review
Sheet
5 mins
•
After a short delay, you will see a video of the software being used.
4.1
See an example of how Icing trials are entered
(video)
•
4.2
See examples of Icing Trials performed in
Uganda/Ghana.
10-15 mins
Use the control panel to pause, stop and fast forward the video.
When the video has finished, press the X in the top right corner to
close the control panel.
4.3
Entering Ice Trials Data
10–15 mins
•
From the CD, press the Software button (left-hand side of screen).
4.4
Complete the Ice-IT Icing Trials Review Sheet.
5 mins
•
5.1
Entering Data using Ice Calculator
Now press the Cleanse-IT button and select Cleaning Methods from
the options and press OK.
5.2
Complete the Ice-IT Ice Calculator Review
Sheet
•
Next select the Practical option and press ok.
5.3
Discuss in your group your opinions of Ice-IT
5-10 mins
•
Description
Time Scale
After a short delay, Cleanse-IT is loaded with data from Uganda.
First, information about the Programs and Data’s location is
displayed, Press OK. There is no need to update the calculations,
select “No”
6.1
Example of how factory data is entered (video)
5-10 mins
•
6.2
Entering Log IT data
You can view the Cleaning Methods via a Report. Select “Cleaning
Methods Unit Costs” to close the report click on “File”, then “Close”.
6.3
Complete the Log-IT Review Sheet
•
6.4
Discuss in your group your opinions of Log-IT
Press the Global Settings button (spanner), and then the Cleaning
Methods button you can now see some real data.
•
Select any Data Level / Cleaning Method, Examine the methods,
resources, validation etc. as shown in the video from Activity 1.1.
•
To exit from Cleanse-IT, press the door button on the Main Menu.
5-10 mins
1.2
5-10 mins
5 mins
Log-IT
Activity
10-15 mins
5 mins
5-10 mins
Done
1.3
2
Practical – Computer based activity
User Example – Computer based activity
•
From the CD, press the Software button (left-hand side of screen)
•
Now press the Cleanse-IT button and select Cleaning Methods from
the options and press OK.
•
Next select the Blank Data set option and press ok.
3
•
After a short delay, Cleanse-IT is loaded with an empty data set. First,
information about the Programs and Data’s location is displayed, press
OK. There is no need to update the calculations, select “No”
•
Press the Global Settings button (spanner), You are now ready to start
setting up and entering data for a new data set.
Step 1 - Units of Measurement
Throughout the program, references are made to resources, areas and key
items. Before starting to build a cleaning methods list these must be
defined. Later they can be added to and amended as required.
As we are starting a new data set, no information will exist.
The Units of Measurement are already declared. Select the buttons,
“Production Frequency, “ Declare Std Units” and “Conversion Factors” to
see these settings, if required they can be changed now.
Select “Declare Std Units”, modify Currency to = $
Step 2 - Companies, Areas and Key Items
Defining Companies, Areas and Key Items. These can be identified first
then entered or built up as and when data entry requires them.
Company Name:
Unique ID:
Name:
BigCo
Big Company
Floor
Drain
T100
T200
T500
PC20
PC50
Ftab01
FB01
Floor
Drains (In Floor)
100 Litre S.Steel Tubs
200 Litre S.Steel Tubs
500 Litre S.Steel Tubs
20 Litre Plastic Crate
50 Litre Plastic Tubs
Filleting Table Frame
Plastic Filleting Board
Area
Length
Units
Units
Units
Units
Units
Units
Area
Note that Tubs / Filleting Tables can be measured in two ways, in units
(Only for Similar Key Items) or by Volume which would assume a 200L
tub uses twice as much resources than a 100 Litre Tub, or a 2 Sq.M
table uses four times as a ½ Sq M table.
Step 3 - Resources
Identify the Common Resources, Water, Labour and Chemicals. There
is no need to declare chemical dilution at this stage.
Water: The most common sources of water have been entered, select
“Water” and view the options. These can be amended
Modify the Description of “Supplied Water” to read “Municipal Water”
Enter a Cost of $1.48 per Cubic Metre. Ignore all other water types as
these will not be used in this example.
Select “Areas”, The order is incremented in 10’s to allow easy insertion of
an additional area, if necessary.
Labour:
Factory Areas
If the payment of labour is in units other than Hours or Minutes, such a
Monthly, then the hourly cost will need to be calculated, or the number
of hours working in that month estimated. The above example shows a
weekly wage being entered, as a 40 Hr Week
10
20
30
40
Reception
Processing
Packing
Crate Washing
Return to the Global Settings Menu, Select “Key Items in Factory”. Here
we will enter just a couple of Key Items, remembering they can be added
to at any time. The Units of Measurement relate to the “Standard Units”
defined earlier. Different examples are given below. The Unique Key can
sometimes be similar to the description
Key Items
Wall01
Wall02
Terrazzo Wall
Plastic Coated Walls
4
Area
Area
Lab01
Lab02
Labour Rate 1
Labour Rate 2
$300 per 40 Hr
$12 per Hr
Chemicals require more information to allow the calculation of dilutions
and unit cost of a diluted chemical. As some chemicals are based on
“Active Ingredients” such as ppm of Chlorine. The original strength of
the chemical will require defining. For Example
10 Litres diluted to 100 Litres = 10% Dilution, whilst a ppm chlorine
solution requires more investigation.
100g in 40 Litres = 100ppm solution we can work backwards to
calculate the original ppm of the undiluted chemical,
5
We assume 40 Litres = 40,000 g(s), Giving a 1 in 400 dilution, as this gives
100ppm the original strength of the chemical would be 100ppm * 400 =
40,000 ppm Chemicals:
LS
CaOH
Liquid Soap
Calcium Hypochlorite
%
ppm
100%
40,000ppm
$14 per 5 Litre
$40 per 10 Kg
The resources required for the example have now been declared. Return
to the Global Settings menu
Step 4 - Sanitation Details
The Cleaning Equipment is for reference only and does not form part of the
equation for unit costing. Enter the suggested equipment below.
Cleaning Equipment
Bowl
Bucket
PH
SB
LB
Scrub
3 Litre Plastic Bowl
5 Litre Plastic Bucket
Power Hose
Short Handled Brush
Long Handled Brush
Scrubbing Brush
The Chemical dilution can now be declared as the chemicals and related
details have previously been entered in Step 3.
Declare the following dilutions
Liquid Soap (Looked up value from “Chemicals”) - 5%, 15% 100%
Calcium Hypochlorite - 10ppm, 50ppm 100ppm, 40,000ppm (undiluted)
Note that ppm calculation are recalculated as a % of the original strength
to allow financial calculation to work out the unit costs per dilution
All the common details required to enter cleaning methods have been
declared. We are ready to enter the Cleaning Methods.
Press the Cleaning Methods button, and then choose Key Item and press
OK.
Select the “Add” button to create a new Cleaning Method
Cleaning Method:
Reference Code:
Enter Resources Required:
Key Item:
Wall01
Yes
Terrazzo Wall
6
Description of Cleaning Method:
1. Scrub wall with brush to remove debris
2. Rinse
2. Apply Detergent and Wash
3. Rinse
4. Apply Sanitiser
Note that no mention of specific chemical quantities or names have
been refered to, these are specified in the resources section.
Method Applied to:
50 Sq Metres
Only Area measurments will be seen as the Key Item -Terrazzo Wall
has been declared as an “Area” based measurement.
Resources Used
Water
Municipal Water
Labour
Labour Rate 1
Labour Rate 2
Chemicals
10% Liquid Soap
100ppm Calcium Hypochlorite
Cleaning Equipment
50 Litres
2 persons
1 persons
15 Mins
2 Mins
15 Litres
5 Litres
25 Litre Plastic Bucket
2 Scrubbing Brush
Verification / Validation Method / Classification of Resources
For the purpose of this exercise, these can be ignored, but in reality
they are important references to demonstrate that the cleaning method
works and how the data has been verified, and to allow idenification of
similar cleaning methods and resource.
Step 5 - Calculate the Costs
On leaving the “Cleaning Method” data entry screen, the costs are not
calculated until the calculation is requested. This is due to the time
required for calculating. To activate the calculation routine, return to the
main menu.
On reaching of the Main Menu, you will be asked if you wish to
recalculate - Press the YES button, then wait.
The total cost should be $35.77 which is approx $0.70 per Metre
7
To exit from Cleanse-IT, press the door button on the Main Menu.
1.4
•
Review – Paper based activity
Complete the Cleanse-IT Cleaning Methods review sheet.
•
Press the Global Settings button (spanner), you can now enter the
required set up data to enable the cost predictions to be examined.
The data collection protocols and methodology are contained in the
Field manual (under development Sept 2000)
2.
Cost Predictions (Cleanse-IT)
Step 1 – Define Currency and Company
2.1
Theoretical – Computer based activity
Using the Global Settings,
•
From the CD, press the Software button (left-hand side of screen)
Select “Declare Std Units” and change Currency to Ug.Sh
•
Now press the Cleanse-IT button and select Cost Predictions from the
options and press OK.
Select “Companies” enter “An Example Company”
•
Next select the Theoretical option and press ok.
•
After a short delay, you will see a video of the software being used.
•
Use the control panel to pause, stop and fast forward the video. When
the video has finished, press the X in the top right corner to close the
control panel.
Step 2 – Define Key Items
Key Items
ID
Env
Equip
Description
Environment
Equipment
How Measured
Area
Units
•
From the CD, press the Software button (left-hand side of screen)
The assumption here is that all the cleaning methods will be matched
with like equipment. For example if two cleaning methods exist for a
Filleting Table, it is assumed they are of similar construction and size.
•
Now press the Cleanse-IT button and select Cost Predictions from the
options and press OK.
Alternately size can be the factor, but for this example units will be
used.
•
Next select the Practical option and press ok. First, information about
the Programs and Data’s location is displayed, press OK. There is no
need to update the calculations, Select “No”.
We are now ready to enter the Cleaning Methods
•
After a short delay, Cleanse-IT is loaded with data from Uganda.
•
Press the Costs and Predictions per Co. button, you can now see
some real data.
To save time, we will assume the costs of the following cleaning
methods have been calculated or derived as per the previous activity.
2.2
•
2.3
Practical Example – Computer based activity
To exit from Cleanse-IT, press the door button on the Main Menu.
User Example – Computer based activity
Step 3 – Define Cleaning Methods
The quick way to enter the cleaning Methods is by not having to define
the resources required. Enter the following three methods for cleaning a
wall. The difference of cost can be due to several reasons: Different
chemicals, different equipment (powered, manual), levels of staff
training. Normally this would be documented but we will assume this
has been entered.
•
From the CD, press the Software button (left-hand side of screen).
•
Now press the Cleanse-IT button and select Cost Predictions from the
options and press OK.
Press the Cleaning Methods button. All these Methods are “Key Items”
•
Next select the Blank Data Set options and press ok.
Select the “Add” button to create a new Cleaning method
•
After a short delay, Cleanse-IT is loaded with an empty data set. First,
information about the Programs and Data’s location is displayed, press
OK. There is no need to update the calculations, select “No”.
Reference Code:
Enter Resources Required
Key Item:
8
Wall01
No
Environment
9
Desc of Cleaning Method:
Method Applied to:
Cost
Optional
50 Sq Metres
6000 Ug.Sh
•
Return to the Cost Prediction Screen (Back One Screen)
•
Notice the Prediction has been calculated, but as no actual figures
have been entered, we do not have anything for comparison
Reference Code:
Enter Resources Required
Key Item:
Desc of Cleaning Method:
Method Applied to:
Cost
Wall02
No
Environment
Optional
100 Sq Metres
2500 Ug.Sh
•
View the Report to see the cost predictions output.
•
Press “File” then “Close” to close the report.
Reference Code:
Enter Resources Required
Key Item:
Desc of Cleaning Method:
Method Applied to:
Cost
Wall03
No
Environment
Optional
50 Sq Metres
4000 Ug.Sh
Method Wall01, could be a standard cleaning procedure, whilst Wall02,
requires capital investment, Wall03 could represent a method which uses
less detergent and sanitiser but still allows a valid clean.
Data collection for Cleaning methods is covered in the Field Manual
•
Go back to the main menu, Reply “Yes” to update calculations, and
press the “Costs and Predictions per Co.” button.
•
Select the Company “An Example Company”
•
Select “Cost Predictions” button
•
Select “Key Item”, then OK
•
Press “Add New” Button to create a cost prediction
•
Type in a Code: Eg01a (TAB to move to next field)
•
Enter Description “Clean twice a day, using Method 01” (TAB to move
to next field)
•
Enter Dates : 01/05/2000 to 01/06/2000
•
•
The report shows the predicted costs based on manual entries,
therefore the quantities used are unknown, as resources were not
entered into the Cleaning Methods.
This can be used to quickly look at different cost predictions that are
perhaps based on average cost of cleaning similar surfaces or other
mathematical permutation.
We can create several more predictions to demonstrate the use of
comparing different cleaning schedules and methods. Here we assume
that no comparison will be required
•
Press “Add New” button, Code: EG02a
•
Enter Description “Clean twice a day, using Method 02” (TAB to
move to next field)
•
Enter Dates : 01/05/2000 to 01/06/2000
•
Select the “Notes” Button to Enter/Edit the Cleaning Schedule
•
Enter the following (Copy & Paste from EG01 can be used):
Reception Walls, Method Wall02, 200 Sq. M, Cleaned 2 x a Day
Process Walls, Method Wall02, 400 Sq. M, Cleaned 2 x a Day
Packing Room Walls, Method Wall02, 250 Sq. M, Cleaned 2 x a Day
•
Return to the Cost Prediction Screen (Back One Screen)
Now enter a Third Prediction
•
Press “Add New” button, Code: EG03a
•
Enter Description “Clean twice a day, using Method 03” (TAB to
move to next field)
Select the “Notes” Button to Enter/Edit the Cleaning Schedule
•
Enter Dates : 01/05/2000 to 01/06/2000
Enter the following:
•
Select the “Notes” Button to Enter/Edit the Cleaning Schedule
•
Enter the following (Copy & Paste from EG01 can be used):
Reception Walls, Method Wall01, 200 Sq. M, Cleaned 2 x a Day
Process Walls, Method Wall01, 400 Sq. M, Cleaned 2 x a Day
Packing Room Walls, Method Wall01, 250 Sq. M, Cleaned 2 x a Day
10
11
Reception Walls, Method Wall03, 200 Sq. M, Cleaned 2 x a Day
Process Walls, Method Wall03, 400 Sq. M, Cleaned 2 x a Day
Packing Room Walls, Method Wall03, 250 Sq. M, Cleaned 2 x a Day
LS
CaH
•
Liquid Soap
Calcium Hypo.
%
ppm
100%
40,000
1000
600
1 Litres
1 Litres
Next, press the Labour button and enter;
•
Return to the “Cost & Predictions” screen
Lab
•
View the Reports, - Company Reports – All Cost Predictions (Update
Calculation: Yes)
•
•
Use the arrows at the bottom of then screen to change pages. Press
“File” then “Close” to close the report.
Step 2 – Enter Cleaning Method Information
•
Return to the Main Menu, (Update Calculation: No), View the Report:
All Cost Predictions
The Little Fishy Company are considering a change in it’s cleaning
methods. Here is a list of the new methods they hope to use.
•
This shows the different costs for the three predictions
•
Next Return to the “Cost Predictions Screen” and enter three more
Prediction, naming these EG01b, EG02b, EG03b. These are identical
to EG01a, EG02a, EG03a but only cleaning once a Day instead of
twice a Day.
Method
Wall
Floor
Table
•
The Reports will now show all six predictions
•
To exit from Cleanse-IT, press the door button on the Main Menu.
2.4
User Example – Computer based activity
Cleaning Staff
400
1 hr
Press the Chemical Dilutions button and add information for 100%
Liquid Soap and 40,000 ppm Calcium Chloride.
Cost
1000
1500
175
Size
15 sq metres
10 sq metres
1 sq metre
•
Press the Cleaning Methods button, then choose Key Item and
press OK.
•
Now enter the above cleaning methods, by pressing the Add New
button.
•
The resources required do not need to be entered.
•
From the CD, press the Software button (left-hand side of screen).
Step 3 – Enter Company Actuals
•
Now press the Cleanse-IT button and select Cost Predictions from the
options and press OK.
•
Return to the Main Menu, and press Yes to update the calculations.
•
Next select the Blank Data Set options and press ok.
•
•
Now, press the Costs and Prediction per CO button and select The
Little Fishy Company.
After a short delay, Cleanse-IT is loaded with an empty data set. First,
information about the Programs and Data’s location is displayed, press
OK. There is no need to update the calculations, select “No”.
•
Press the Labour button and enter the costs, as above.
•
Press the Chemicals button, and enter the cost as above.
Press the Global Settings button (spanner), you can now enter the
required set up data to enable the cost predictions to be examined.
The data collection protocols and methodology are contained in the
Field manual (under development Sept 2000)
•
Return to the Main Menu and press No.
•
Now press the Actual Resources Used per Co button, and select
The Little Fishy Company.
•
Select Key Item and press OK.
•
Enter the information from below:
•
Step 1 – Define Set up Information.
•
Press the Companies button and add The Little Fishy Company.
•
Now press the Key Items in Factory button and add Wall, Table and
Floor, all measured by area.
•
Now press the Chemicals button and add the following:
12
2/2/00
2/2/00
All Areas
Records
All Areas
Records
All items
100% Liquid Soap
31 Litres
All Items
40,000 CaHypo
20 Litres
13
•
•
Select Labour from the top and enter:
2/2/00
All Areas
All Items
Cleaning Staff
80 Hrs Records
Step 4 – Enter Cost Prediction
3.2
Use the control panel to pause, stop and fast forward the video.
When the video has finished, press the X in the top right corner to
close the control panel.
Practical – Computer based activity
•
Return to the Main menu and press Yes to update the calculations.
•
•
From the CD, press the Software button (left-hand side of screen)
Now press the Cost and Predictions per Co button and select The
Little Fishy Company.
•
•
Now press the Ice-IT button and select Melting Rates from the
options and press OK.
Press the Cost Predictions button, choose Key Item and press OK.
•
•
Next select one of the Practical options and press ok.
To add a new prediction, press the add new button.
•
•
Enter a code “Predict 1” and relate to actuals form 2/2/2000 – 2/2/2000
After a short delay, Ice-IT is loaded with data from
Uganda/Morocco.
•
Press the notes button, and enter the information below,
•
Press the Container Information & Melting Rate Trials button, you
can now see some real data from melting rate trials.
12 walls total size = 120 sq metre cleaned twice a day with Wall method
3 floors total size = 50 sq metres cleaned four times a day with Floor
method
6 tables total size = 15 sq metres cleaned six times a day with Table
method.
3.3
User Example – Computer based activity
•
From the CD, press the Software button (left-hand side of screen)
•
The factory currently spend 75,000 Ug Sh on cleaning a day. Is it worth
their while to change methods? How much money would they save in a
year?
Now press the Ice-IT button and select Melting Rates from the
options and press OK.
•
Next select the Blank Data set option and press ok.
•
After a short delay, Ice-IT is loaded with an empty data set.
•
Press the Report button to see the variances. Press “File” then “Close”
to close the report.
Step 1 – Define Container Details
•
To exit from Cleanse-IT, press the door button on the Main Menu.
2.5
Software Review – Paper based activity
• Complete the Cleanse-IT Cost Predictions review sheet
3.
Melting Rates (Ice-IT)
3.1
Theoretical – Computer based activity
•
Press the Container Information & Melting Rate Trials button
•
Press the “Add new” button, you can now enter the following data to
o
calculate the average melting rate in Kgs/ C/Hr.
Code
Construction
Volume
Surface Area.
EG1 Example container
Polypropylene 5mm thick
50 Litres
1 Sq. Metres
•
From the CD, press the Software button (left-hand side of screen)
•
Cost and life span information is not needed for this example.
Now press the Ice-IT button and select Melting Rates from the options
and press OK.
Step 2 - Trial Details
•
Next select the Theoretical option and press ok.
See Ice Trial Protocol for how these results are obtained.
•
After a short delay, you will see a video of the software being used.
Note: following the protocol gives real times and weights of ice plus
container. These then need to be converted to time passed and Kgs of
ice melted to be entered in the software
14
15
•
Press the Add/Edit Ice Melting Rate Trials button.
4.2
•
Now press the Add new button and enter information for Trial 1 from
the table below.
•
From the CD, press the Software button (left-hand side of screen)
•
•
Press the Add new button again and enter the data from trials 2 and 3.
Now press the Ice-IT button and select Trials from the options and
press OK.
•
Next select one of the Practical options and press ok.
•
After a short delay, Ice-IT is loaded with data from Uganda/Ghana.
•
Press the Icing Trials Data button, you can now see some real data
from icing trials.
From the main menu, press the door button to exit Ice-IT
15Kg flake iced used, Avg. temp 15°C
Trial1
Trial2
Trial3
Practical Example – Computer based activity
Hrs
kg ice left
Hrs
Ice left
Hrs
Ice left
0.0
15 Kgs
0.0
15 Kgs
0.0
15 Kgs
0.5
11.4 Kgs
0.5
11 Kgs
0.5
12.4 Kgs
•
1.0
8.3 Kgs
1.0
7.8 Kgs
1.0
9.5 Kgs
4.3
1.5
5.9 Kgs
1.5
5.4 Kgs
1.5
7.4 Kgs
•
From the CD, press the Software button (left-hand side of screen)
2.0
3.4 Kgs
2.0
2.3 Kgs
2.0
5.2 Kgs
2.5
1 Kgs
2.5
1.4 Kgs
2.5
2.1 Kgs
•
Now press the Ice-IT button and select Trials from the options and
press OK.
User Example – Computer based activity
•
Press the report button to see the trial information.
•
•
Next select the Blank Data Set options and press ok.
To close the report, press “File” then “Close”.
•
•
After a short delay, Ice-IT is loaded with an empty data set.
Return to the Container Information screen and see the average
Melting Rate displayed 0.360Kgs/C/hr
•
Enter the following information to calculate the cost of a trip.
•
From the main menu, press the door button to exit Ice-IT
4.4
•
Review – Paper based activity
Complete the Ice-IT Melting Rate Trials Review Sheet.
Step 1 – Enter Set-Up Information
•
Press the Maintenance Menu button (spanner).
Some Quality Tests, Insulation Materials, Raw Material, and Types of
Ice information is already entered.
4.
Icing Trials (Ice-IT)
•
Change the Currency Symbol to Ug Sh
4.1
Theoretical – Computer based activity
•
Press the Company names button and enter:
•
From the CD, press the Software button (left-hand side of screen)
Code BigB
•
Now press the Ice-IT button and select Trials from the options and
press OK.
•
•
Next select the Theoretical option and press ok.
Code
Fuel
•
After a short delay, you will see a video of the software being used.
•
•
Use the control panel to pause, stop and fast forward the video. When
the video has finished, press the X in the top right corner to close the
control panel.
Code
Description
Net
Motor
Fishing net
Motor
•
16
Name Big Boat Company
Press the Other Direct Costs button and enter the following:
Description
Motor Fuel
Unit Cost
1000
Units Used
Litre(s)
Now enter this information into Indirect Costs:
Unit Cost Units Used
500
6500
net(s)
motor(s)
Press the Transportation button and enter:
17
Life Span Avg Journey
10
50
12
12
NA
•
Next, press the End Products button and enter:;
Red
•
Note: only one motor was used, the fish cost nothing to start with, the
transport should be described as “Not Applicable”, and the end product
is Red Snapper.
Not applicable
Red Snapper
2500 Ug Sh
Now press the Journey stages button and enter:
00
10
20
The gross profit from the trip should be 219,653 Ug Sh.
•
Start
Island
Landing Site
4.4
•
From the main menu, press the door button to exit Ice-IT
Review – Paper based Activity
Complete the Ice-IT Icing Trials Review Sheet.
Increments of ten are used, so a new stage can easily be added if
necessary.
5.
Ice Calculator (Ice-IT)
5.1
User Example – Computer based activity
Step 2 – Container Information
•
•
From the CD, press the Software button (left-hand side of screen)
Return to the main menu and press the Container Information and
Melting Rate Trials button.
•
•
Now press the Ice-IT button and select Ice Calculator from the
options and press OK.
Now press the Add new button, and enter the following information:
•
Next select the Blank Data Set options and press OK.
•
After a short delay, Ice-IT is loaded with an empty data set.
Code
Description
Volume
Surface Area
Layer 1
Layer 2
Layer 3
Cost
Life Span
Avg Journey
Canoe
Lined canoe
500L
8 Sq M
Wood 8mm
Polystyrene 15mm
Aluminum 2mm
1,000,000 Ug Sh
150 journies
12 hrs
Trial No.1
Effect of Ambient Temperature and Journey Time on Ice Usage
Step 3 – Enter Trial Details
•
Go back to the main menu, and select the Icing Trials Data button.
•
Press the Add new button, and read the information below. Enter the
information into the Details, Journey and Costs screens.
th
A canoe from the Big Boat Company set out to sea at 6am on the 4 April
2000 and returned at 6pm the same day. The fisherman took his catch of
100kg of red snapper (which he caught using a net and had been keeping
in the fish hold of his boat) to an island at 12pm. Here he covered the fish
with 85kg of large flake ice. He then set off back to the landing site where
he arrived at 6pm with 20kg of ice left. During the trip the average
temperature was 29C and 15L of fuel was used. He sold all of his fish for
2,500Ug Sh per kg.
18
•
From the main menu, press the Container Information and Melting
Rate Trials button.
•
Press the add new button and enter information for the following
container:
Code
Description
Volume
Surface Area
Layer 1
Layer 2
Layer 3
Box1
Lined Vegetable fibre box
65L
1 Sq M
Wood 10mm
Vegetable Fibre 5mm
Aluminum 1mm
•
Select Theoretical and press the Recalculate button. The melting
rate should be 0.0679.
•
Go back to the main menu, and press the ice Calculator button.
•
Enter the information below
Fish Temperature:
Product:
15 °C
White Fish
19
Amount:
Ice:
Wastage:
•
1,000 Kgs
Crushed Ice
4%
20 Hours and 25 hours
Vary from 20°C to 25°C
•
Press the View results button to see what effect they have on Total Ice
Required.
•
To close the report, press “File”, then “Close”.
Trial No.2 - Effect of thickness of Insulation material
•
From the Main Menu, press the Container Information and Melting
Rate Trials button.
Press the add new button and enter information for the following
containers;
Code
Description
Volume
Surface Area
Layer 1
•
Choose Theoretical and press Recalculate. The melting rate should be
0.0269
Code
Description
Volume
Surface Area
Layer 1
•
•
Box2
Foam Insulated Box
65L
1 Sq M
Polyurethane 10mm
Box3
Vegetable Fibre Box
65L
1 Sq M
Vegetable Fibre 5mm
Choose Theoretical and press Recalculate. The melting rate should be
0.1032
Go to the main menu and press the Ice Calculator button, then enter
the following information
Fish Temperature:
Ambient Temperature
Journey Time:
Product:
Amount:
15 °C
25°C
12 Hours
Red Snapper
1,000 Kgs
20
Flake Ice
4%
•
Press the View results button and look at the amount of ice needed
for the different containers.
•
Now go back to the Container Information screen and try varying
the thicknesses of the polypropylene in the Foam insulated box
from 10mm-50mm, and the Vegetable fibre in the Lined Vegetable
Fibre box from 10-50mm.
•
See what effect this has by using the Ice Calculator again.
•
From the main menu, press the door button to exit Ice-IT
Try the following times and temperatures
Journey Time:
Ambient Temperature
•
Ice:
Wastage:
5.2
•
Review – Paper based activity
Complete the Ice-IT Ice Calculator review sheet.
6.
Log IT
6.1
Theoretical – Computer based activity
•
From the CD, press the Software button (left-hand side of screen)
•
Now press the Log-IT button and select Theoretical from the
options and press OK.
•
After a short delay, you will see a video of the software being used.
•
Use the control panel to pause, stop and fast forward the video.
When the video has finished, press the X in the top right corner to
close the control panel.
6.2
User Example – Computer based activity
•
From the CD, press the Software button (left-hand side of screen)
•
Now press the Log-IT button and select Blank Data Set from the
options and press OK.
•
After a short delay, Log-IT is loaded with an empty data set.
•
You can now enter the following data
Step 1 – Setting Up
•
From the main menu, press the Set Up Menu button.
The Quality Tests are already set up, Sampling Locations aren’t needed
for this example.
•
Press the End Product button and enter;
21
•
Now return to the main menu and press the Hygiene Checks
button.
•
Press the Build Checklist for Data Entry button, this will copy the list
that has been set up.
First Class Fishery:
•
Now enter the following:
Consists of an intake, processing and a packaging area.
The factory was inspected at 09:00 and at 20:00. All areas except the
Stores passed the first inspection. The floor there needed a re-clean
and a request for one was put in. This was later re-checked and
passed.
Hless
•
Headless fish
250/kg
75% yield
Now read the following information and enter it into the factory Areas,
Hygiene Checklist and Company Resources areas. The name of the
factory can be entered at the top of the Set Up Menu screen.
All items in each area are checked twice daily by the hygiene supervisor,
Mr Thomas Jones.
100% Liquid Soap and 40,000 ppm Calcium Hypochlorite are bought by
the litre at a cost of 600 and 350 respectively.
Production staff are paid 350/hour.
Cleaning staff are paid 400/hour.
•
All areas passed the second inspection.
•
6.3
Now return to the main menu. Press the production Details button, and
then enter the following information;
•
Enter similar data for another day’s production and take a look at
the reports.
Review – Paper based activity
Complete the Log-IT software review sheet.
th
On the 5 of June 2000 the following production took place:
Batch 1 15,000kgs of Nile Perch and 20,000kgs of ice
Batch 2 17,500kgs of Nile Perch and 15,000kgs of ice
Batch 3 8,000kgs of Nile Perch and 12,000kgs of ice
From all of these batches 31,995kg of end product was produced.
25 production staff were used that day
•
Now return to the main menu, and press the Sanitation Resources
button. This information can be added here:
Time
Area
Resource
Amount
12:00
12:00
12:00
12:00
12:00
13:00
13:00
13:00
17:00
17:00
17:00
Stores
Stores
Intake
Intake
Intake
Processing
Processing
Processing
Packaging
Packaging
Packaging
Liquid Soap
Calcium Hypochlorite
Liquid Soap
Calcium Hypochlorite
Cleaning Staff
Liquid Soap
Calcium Hypochlorite
Cleaning Staff
Liquid Soap
Calcium Hypochlorite
Cleaning Staff
25 Litres
12 Litres
4 Litres
2 Litres
1 hour
15 Litres
7 Litres
4 hours
6 Litres
3 litres
2 hours
22
23
Ice-IT Ice Calculator Examples Sheet
Name
Name
Using the information given,
calculate the fish:ice ratio needed
for the following scenario:
A trip is being planned to take (Mf) 100kg of Red Snapper
from one island to the next. The journey will last (T) 3 hours and the
fish will be carried in blue 50L plastic boxes.The average air
temperature (Te) is 32C and the fish will be taken from a chiller
which cools the fish to (Tf) 5C. Large flakes of ice are available
for the journey, and (PCLoss) 3% wastage is expected.
Fish
specific heat of fish (Cpf) = 0.78
Fish volume (Vf)= 1466.8
Ice
Equilibrium water (% wgt/wgt) = 16
Ice volume (Vi) = 1731
Box
material = 8mm polypropylene
melting rate (k) = 0.1849
Volume (Vc) = 50L
S.A. = 0.86 sqm
IceReqd = Cpf * Tf * Mf /80
x = (Mf * Vf + IceReqd * Vi) / (1000 * Vc - k * Te * t * Vi)
BoxesReqd = (x + 1)
IceMelted = k * Te * t * BoxesReqd
IceLoss = (IceReqd + IceMelted) * PCLoss / 100
TotalIce = IceReqd + IceMelted + IceLoss
IceRatio = TotalIce / Mf
2
1
Ice-IT Icing Trials Examples Sheet
Name
Name
From the information given below,
Calculate the cost of the trip.
th
A canoe from the Big Boat Company set out to sea at 6am on the 4 April
2000 and returned at 6pm the same day. The fisherman took his catch of
100kg of red snapper (which he caught using a net and had been keeping
in the fish hold of his boat) to an island at 12pm. Here he covered the fish
with 85kg of large flake ice. He then set off back to the landing site where
he arrived at 6pm with 20kg of ice left. During the trip the average
temperature was 29C and 15L of fuel was used. He sold all of his fish for
2,500Ug Sh per kg.
Note: the transport should be described as being the same as the
container in the software, and the end product is Red Snapper.
Canoe:
Ice costs 100 UgSh per kg
500L Volume
Fuel costs 1000Ug Sh per litre
8 sq m Surface area.
Fishing net 500 Ug Sh life span
8mm wood
of 10 journies
15 mm polystyrene
Motor costs 6500 Ug Sh life
2mm aluminium
span of 50 journies
Cost 1,000,000 Ug Sh
Life span 150 journies
3
4
Ice-IT Melting Rate Examples Sheet
Name
Name
Calculate the Average Melting rate
o
in kgs/ C/Hr, by hand and by using
the software.
Box Details
Plastic box 5mm thick
Volume S.A.
50L
1Sqm
Trial Details
- see Ice Trial Protocol for how these reults are obtained.
Note: following the protocol gives real times and weights of ice plus
container. These then need to be converted to time passed and kgs
of ice melted to be entered in the software
15Kg flake iced used
Avg temp 15C
Trial1
Hrs
0.0
0.5
1.0
1.5
2.0
2.5
Trial2
Hrs
0.0
0.5
1.0
1.5
2.0
2.5
K =
kg ice left
15
11.4
8.3
5.9
3.4
1
kg ice left
15
11
7.8
5.4
2.3
1.4
Trial3
Hrs
0.0
0.5
1.0
1.5
2.0
2.5
kg ice left
15
12.4
9.5
7.4
5.2
2.1
Mass of ice melted in given time interval
(time interval) x Environment temperature
5
6
Cleanse-IT Cleaning Method
Examples Sheet
Name
Name
From the information given below, calculate the cost for
cleaning one sq metre of a wall.
The cleaning procedure used in the Big Company factory for cleaning their
50 sq metre wall is as below:
1. Scrub wall with brush using 15L of 10% Liquid Soap for 15 mins
2. Rinse wall using hose for 5 mins
3. Spray wall with 5L of 100ppm Calcium Hypochlorite for 5 mins
100% Liquid Soap costs 2000 Ug Sh per litre
100ppm Calcium Hypochlorite costs 500 Ug Sh per litre
Labour costs 500 Ug Sh per hour
Water costs 650 Ug Sh per 1000 Litres
7
8
Cleanse-IT Cost Predictions
Example Sheet
Name
Name --------------------------------Using the information given below, predict the cost of cleaning the
factory.
The Little Fishy Company are considering a change in it’s cleaning
methods. Here is a list of what needs cleaning and the new methods they
hope to use.
12 walls total size = 120 sq metre cleaned twice a day
3 floors total size = 50 sq metres cleaned four times a day
6 tables total size = 15 sq metres cleaned six times a day
Method
Cost
Size
Wall
1000
15 sq metres
Floor
1500
10 sq metres
Table
175
1 sq metre
The factory currently spend 75,000 Ug Sh on cleaning a day. Is it worth
their while to change methods? How much money would they save in a
year if they work 250 days a year?
9
10
Log-IT Data Logging
Examples Sheet
On the 5th of June 2000 the following production took place:
Batch 1 15000kgs of Nile Perch and 20000kgs of ice
Batch 2 17500kgs of Nile Perch and 15000kgs of ice
Batch 3 8000kgs of Nile Perch and 12000kgs of ice
Log the following factory data into the program:
First Class Fishery:
From all of these batches 31995kg of end product was
produced.
25 production staff were used that day
Consists of an intake, processing and a packaging area.
All items in each area are checked daily by the hygiene
supervisor, Mr Thomas Jones.
25 Litres of 100% liquid soap, 12 litres of Calcium
hypochlorite were used.
100% Liquid Soap and 40,000 ppm Calcium Hypochlorite are
bought by the litre.
The hygiene checklist was carried out and all areas passed.
Headless fish are sold.
Enter similar data for another day’s production and take a
look at the reports.
.
11
12
ANSWER SECTION
13
Ice-IT Ice Calculator Answers
A trip is being planned to take (Mf) 100kg of Red Snapper from one island to the next.
The journey will last (T) 3 hours and the fish will be carried in blue 50L plastic boxes.
The average air temperature (Te) is 32C and the fish will be taken from a chiller which
cools the fish to (Tf) 5C
Large flakes of ice are available for the journey, and (PCLoss) 3% wastage is expected.
Fish
specific heat of fish (CF) = 0.78
Fish volume (VF)= 1466.8
Ice
Equilibrium water (% wgt/wgt) = 16
Ice volume (VI) = 1731
Box
material = 8mm polypropylene
melting rate (K) = 0.1849
Volume (VC) = 50L
S.A. = 0.86 sqm
IceReqd = Cpf * Tf * Mf /80
x = (Mf * Vf + IceReqd * Vi) / (1000 * Vc - k * Te * t * V
BoxesReqd = (x + 1)
IceMelted = k * Te * t * BoxesReqd
IceLoss = (IceReqd + IceMelted) * PCLoss / 100
TotalIce = IceReqd + IceMelted + IceLoss
4.875
8.048052373
9.048052373
160.6065488
4.964446465
170.4459953
1.704459953
IceRatio = TotalIce / Mf
4.48057
4hr journey -
14
15
Ice-IT Icing Trial Answers
Ice-IT Icing Trial Answers
A canoe from the Big Boat Company set out to sea at 6am on the 4th
April 2000 and returned at 6pm the same day. The fisherman took his
catch of 100kg of red snapper (which he caught using a net and had
been keeping in the fish hold of his boat) to an island at 12pm. Here he
covered the fish with 85kg of large flake ice. He then set off back to the
landing site where he arrived at 6pm with 20kg of ice left. During the trip
the average temperature was 29C and 5L of fuel was used. He sold all
of his fish for 2,500Ug Sh per kg.
Note: the transport should be described as being the same as the
container in the software, and the end product is Red Snapper.
Canoe
500
8
8
15
2
1000000
150
12
16
L
sq m
mm wood
mm polystyrene
mm alumin
UgSh
journies
hr/journey
Cost =
Canoe
ice
6666.667
8500
fuel
net
motor
Total
15000
50
130
30346.67
100
1000
500
6500
Income =
ice
fuel
net
motor
250000
Profit = 219653
17
10
50
Ice-IT Melting Rate Answers
K =
Ice-IT Melting Rate Answers
Mass of ice melted in given time interval
(time interval) x Environment temperature
Trial 1
K=
14
2.5 x 15
=
0.373333
Trial 2
K=
13.6
2.5 x 15
=
0.362667
Trial 3
K=
12.9
2.5 x 15
=
0.344
Average =
18
0.3600
19
Cleanse-IT Cleaning Methods Answer
Cleanse-IT Cleaning Method Answers
The cleaning procedure used in the Big Company factory
for cleaning their 50 sq metre wall is as below:
1. Scrub wall with brush using 15L of 10% Liquid Soap for 15 mins
2. Rinse wall using hose for 5 mins
3. Spray wall with 5L of 100ppm Calcium Hypochlorite for 5 mins
Costs
2000
500
500
650
100% LS
Cal
lab
water
amount
10%
100ppm
water
lab
litre
litre
hour
1000 litres
unit cost total
15
200
3000
5
500
2500
50 8.333333 416.666667
25
0.65
16.25
Total for 50 sqm 5932.91667
118.658
Unit cost
20
21
Cleanse-IT Cost Predictions Answers
Cleanse-IT Cost Prediction Answers
The Little Fishy Company are considering a change in it’s cleaning
methods. Here is a list of what needs cleaning and the new methods they
hope to use.
12 walls total size = 120 sq metre cleaned twice a day
3 floors total size = 50 sq metres cleaned four times a day
6 tables total size = 15 sq metres cleaned six times a day
Method
W all
Floor
Table
Cost
Size
15 sq metres
10 sq metres
1 sq metre
1000
1500
175
The factory currently spend 75,000 Ug Sh on cleaning a day. Is it worth
their while to change methods? How much money would they save in a
year if they work 250 days a year?
to clean
W alls
floor
table
size
unit costs
240 66.666667
200
150
90
175
cost
16,000
30,000
15,750
Total
61,750
yearly
15,437,500
current per year =
18,750,000
saving = 3,312,500
22
23
24
25
26
27
Acknowledgements
Our appreciation goes to following organisations and companies for their
contributions towards this project:
•
The Fishery Industries Division at the Food and Agricultural
Organisation
•
Department For International Development, London, UK
•
Natural Resources Institute, Chatham Maritime, UK
Uganda
•
Project Leaders - NARO / Food Science Research Institute, Kampala,
•
National Bureau of Standards, Kampala
•
Greenfields (Uganda) Ltd, Entebbe
•
Marine and Agro Exports Ltd, Jinja
•
Byansi Ltd, Masaka
•
Masese Ltd, Kampala
•
Gomba Fishing Industries Ltd, Jinja
•
Hwan Sung Ltd, Kampala
•
Uganda Fish Packers Ltd, Kampala
•
Uganda Marine Products Ltd, Kampala
•
Nge-Ge Ltd, Kampala
•
Victoria Foods Ltd, Kampala
•
Members of the fishing community – Landing Sites and Islands
•
Fisheries Training Institute, Entebbe
Ghana
•
Project Leaders – Department of Fisheries
•
Ghana Standards Board, Accra
•
Divine Seafood’s Company, Accra
•
IT Ghana, Accra
•
Members of the fishing community