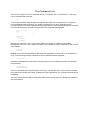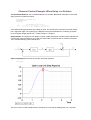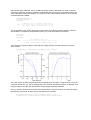
1
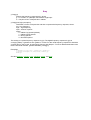
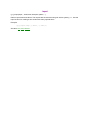
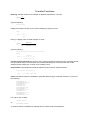
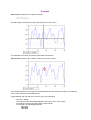
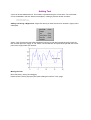
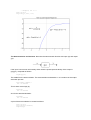
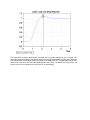
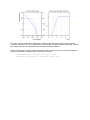
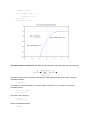
= -4*exp(-t) for t < 0
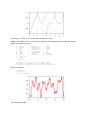
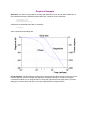
CC>t=-3:.05:3
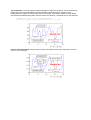
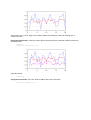
CC>y=ilt(g,t,'roc',-1.5)
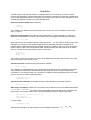
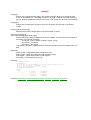
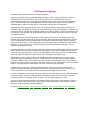
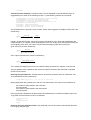
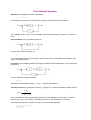
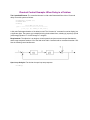
The Autocorrelation and Variance: Now take the same transfer function with input u(s) and output
y(s):
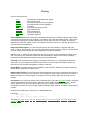
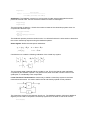
If the input is zero-mean unit-intensity white noise the power-spectral-density of the output is
g(s)g(-s), computed as follows:
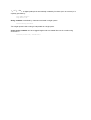
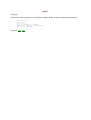
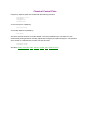
CC>yd=g*g(-s)
The stable ilt is the autocorrelation. The autocorrelation evaluated at t = 0 is variance of the output
stochastic process:
CC>ilt(yd,0,'stable')
ans = 1.3333333
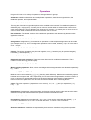
This is done more simply by:
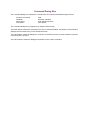
CC>var(g)
ans = 1.3333333
And for the standard deviation:
CC>std(g)
ans = 1.1547005
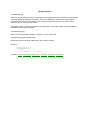
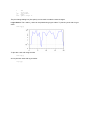
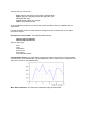
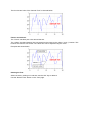
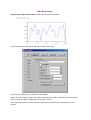
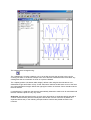
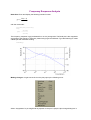
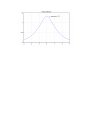
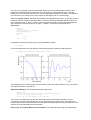
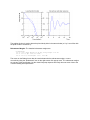
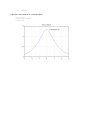
A plot of the autocorrelation is created as follows:
CC>t=-3:.05:3
CC>y=ilt(yd,t,'stable')
CC>plot(t,y)