1
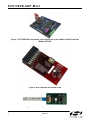
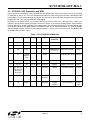
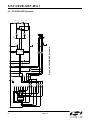
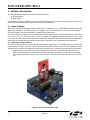
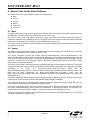
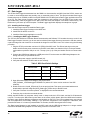
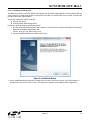
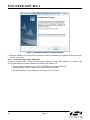
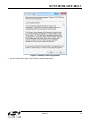
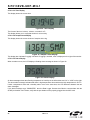
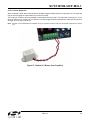
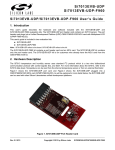
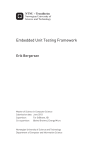
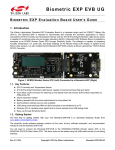
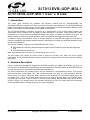
Si7013EVB-UDP-M3L1 S i 7 0 1 3 E V B - U D P - M 3 L 1 U s e r ’s G u i d e 1. Introduction This user's guide describes the hardware and software included with the Si7013EVB-UDP and Si7013EVB-UDP-M3L1 evaluation kits. This user's guide is included in the evaluation kit. The Si7013EB-UDP port header card contains an Si7013 sensor. The port header card plugs into a Unified Development Platform (UDP) SiM3L1xx 32-bit MCU card with Multiplexed LCD (SiM3L1xxLCD-B-DK). The Si7013EVB-UDP-M3L1 evaluation kit serves as a demonstration of the Si7013 Digital Humidity and Temperature Sensor combined with the SiM3L1xx High-Performance, Low-Power, 32-Bit Precision32™ MCU functioning as a battery operated temperature/humidity data logger. It includes the software running on the SiM3L1xx MCU as well as a PC-based application used to configure the data logger and retrieve the data. In addition to being a demonstration of and an example design for a low-power data logger, this evaluation kit contains the hardware and software needed to begin the development of virtually any application designed around the Si7013 and SiM3L1xx. The two main hardware components of Si7013EVB-UDP-M3L1 kit are: UDP SIM3L1XX-LCD MCU Unified Development Platform (UDP) SiM3L1xx MCU card with multiplexed LCD Si7013EB-UDP port header card Note: Si7013EB-UDP refers to the board, and Si7013EVB-UDP refers to the kit. The port header card contains an Si7013 sensor; it plugs into the MCU card, which acts as the system motherboard. The Si7013EVB-UDP-M3L1 kit also includes a CD containing software and documentation, including this manual. 2. Hardware Description Figure 1 shows the Si7013EB-UDP plugged into an SiM3L1xx MCU card (SiM3L1xxLCD-B-DK). Figure 2 is a close-up of the Si7013EB-UDP port header card. As will be explained in more detail below, the Si7013EB-UDP can be used with other Silicon Laboratories unified development platforms. The Si7013 temperature and humidity sensor uses the standard I2C communications protocol. This two-wire bidirectional bus has a clock signal, “SCL”, and a bi-directional data line, “SDA”. For more information about the Si7013 and its I2C interface, refer to the Si7013 data sheet. Two independent I2C buses are implemented on the port header card - one for the on-board Si7013 and one for an optional “postage stamp” size evaluation board connected via a flex cable. Figure 3 shows an external “postage stamp” size evaluation board for the Si7013, Si7020, or Si7021. The “postage stamp” size evaluation boards and a 3-foot, flat, flexible cable are included with the Si7013USB-DONGLE evaluation kit and can be ordered separately. Rev. 0.2 9/13 Copyright © 2013 by Silicon Laboratories Si7013EVB-UDP-M3L1 Si7013EVB-UDP-M3L1 Figure 1. Si7013EB-UDP Port Header Card Plugged into a UDP SiM3L1xx MCU Card with Multiplexed LCD Figure 2. Si7013EB-UDP Port Header Card Figure 3. Si7013 Postage Stamp Evaluation Board 2 Rev. 0.2 Si7013EVB-UDP-M3L1 2.1. Si7013EB—UDP Schematics and BOM Figure 4 shows the schematics of the Si7013EB-UDP port header card. VDD is connected to port pin 17 and GND is connected to port pin 16. This is the standardized location for power and ground on Silicon Laboratories UDP port headers. For port headers with only 8 port pins, the card can be offset with power and ground pins connecting properly and pins 1–8 of the Si7013EB-UDP overhanging. By default, the on board Si7013 (U1) connects SDA to port pin P1.5, SCL to P1.6 and CS to P1.7. There is an optional 6 pin flat flexible header connector J2 that can connect to an external “postage stamp” size evaluation board for the Si7013, Si7020, or Si7021. The “postage stamp” size evaluation boards and a 3-foot flat flexible cable are included with the Si7013USB-DONGLE evaluation kit and can be ordered separately. The optional postage stamp evaluation boards would have SDA connect to port pin 1.3 SCL to P1.4 and CS to P1.2. The BOM for the Si7013EB-UDP is shown in Table 1. Table 1. Si7013-UDP Bill of Materials Qty Ref Value Rating Tol Type PCB Footprint Mfr Part Number Mfr 1 C1 4.7uF 6.3 V ±20% X5R C0603 C0603X5R6R3-475M Venkel 3 C2, C3 0.1uF 0V ±20% X7R C0402 C0402X7R160-104M Venkel 1 J2 FH12 FH12 CONN6N-FPC/ FFC-P0.5 FH12-6S-0.5SH(55) Hirose 1 J3 CONN SOCKET 2x9 Socket SSW-109-02-F-D-RA Samtec 3 R1, R2, R13 10K 1/16 W ±5% ThickFilm R0402 CR0402-16W-1002J Venkel 2 R3, R4 2K 1/16 W ±5% ThickFilm R0402 CR0402-16W-2001J Venkel 10 R5, R6, R7, R8, R9, R10, R11, R12, R15, R16 0 1A ThickFilm R0402 CR0402-16W-000 Venkel 1 R14 10K NTC thermistor R0603 NCP18XH103F03RB Murata 1 U1 Si7013 Humidity QFN24 4x4P0.5 Si7013-A-GM1 Silicon Labs Rev. 0.2 3 VIO 1 2 3 J3 4 5 6 7 8 9 10 11 12 13 14 15 16 17 18 2 4 6 8 10 12 14 16 18 CONN SOCKET 2x9 1 3 5 7 9 11 13 15 17 GND TP20 TP27 TP19 TP18 TP17 TP16 TP15 TP14 TP13 TP12 TP11 TP10 TP9 TP8 TP7 0 R15 0 R16 0 R10 0 R6 R11 0 R12 0 TP31 GND TP30 CS2 SCL2 SDA2 CS1 TP26 TP25 TP24 TP23 TP22 SCL1 TP21 SDA1 Rev. 0.2 R2 10K R3 2K R4 2K R13 10K C1 4.7uF C2 0.1uF Si7013 10 1 U1 SCL SDA R9 0 0 0 R7 R8 0 R5 5 TP3 TP4 CS/INTb SDA 2 6 7 SCL ADD/VOUT VINP VINN VSNS Figure 4. Si7005EB-UDP Schematic R1 10K 8 9 VDDA VDDD GNDD GNDA EPAD 4 3 4 11 TP6 VDD TP1 VDD TP2 GND TP5 R19 0 TPV7 6 5 4 3 2 1 J2 6 5 4 3 2 1 FH12 NC J5 NC J4 TP29 VINN Remote Thermistor Remote Thermistor TP28 VINP C3 0.1uF C4 0.1uF R17 24.3K J6 NC thermistor interface R14 10K R18 24.3K Si7013EVB-UDP-M3L1 2.2. Si7013EB-UDP Schematic -t° Si7013EVB-UDP-M3L1 2.3. Extending Battery Life The data logger demo will work for several days on a fresh battery once disconnected from the PC. At the default sample rate of once per two minutes, the 8192 point storage buffer will fill at about 11.4 days; so, generally, the buffer will not fill before the battery runs out. In a real application where it might be desirable to extend battery life and record data for longer time periods, the following steps are recommended: 1. Reduce the interval between samples so the buffer will not fill during the time period desired. 2. Although powered down, the USB interface and level translators (U4 and U5 of the SiM3L1xx MCU Card with Multiplexed LCD MCU) consume power and are not needed in operation. (See Figure 12 of the SiM3L1xx LCD User’s Guide.) These can be disconnected from the power supply except when the data log is being read or configured. Rev. 0.2 5 Si7013EVB-UDP-M3L1 3. Software Description The Si7013EVB-UDP-SiM3L1xx contains two software projects: Demo Software Logger The purpose of the Demo Software is to provide simple example code. The Data Logger project provides a more full featured demonstration of the capability of the Si7013 and SiM3L1xx. Data 3.1. Demo Software The Si7013 Unified Development Platform (UDP) Demo software runs on a UDP SiM3L1xx MCU card (UDP SIM3L1XX-LCD MCU). The MCU card may be plugged into a UDP motherboard, but this is not necessary. A Si7013 port header card (Si7013EB-UDP) is plugged into the MCU card. The demo reads the temperature and humidity from the Si7013 port header card and displays them on the MCU card’s LCD. The user may press the S1 button to toggle the displayed temperature between Celsius and Fahrenheit. The user may press the S2 button to switch the displayed temperature from the internal temperature sensor and the external thermistor. When the thermistor is displayed, a dot is shown after the temperature. 3.1.1. Running the Demo Software The “Si7013 UDP SiM3L1xx Evaluation Board Documentation and Software” CD contains the source code for the Demo Software. However, you do not need to build the Demo Software, because the CD also contains a pre-built image file and a batch file to download the image file to the MCU card. This is done using the following procedure: 1. Plug the Si7013 port header card onto J21 (PB0) of the MCU card. The Silicon Labs logo on the port header card faces the power connector on the MCU card. Make sure that the VIO pin on the port header card matches up with the VIO pin on J21. The top 4 pins (1–4) of the port header card do not connect with J21. Figure 5. Si7013 Port Header Card 6 Rev. 0.2 Si7013EVB-UDP-M3L1 2. Connect the USB Debug Adapter to a USB port on the PC and connect the USB Debug Adapter to the debug connector (J14) on the MCU card. 3. Connect the power supply to the MCU board (J6). 4. Verify that the switches on MCU card are set correctly: Table 2. MCU Card Switch Settings Switch Label Number Setting VBAT Sel SW2 +3.3 V_VREG (center) VIORF Sel SW9 VBAT (down) VIO Sel SW8 VBAT (down) 5. Open Windows Explorer and change to the project folder: \UDP_Software_vX.X\Demo\SiM3L1xx\ (where vX.X is the version number of the UDP software). 6. Double click on the “Install_Si70xx.bat” file in the project folder. This opens a command window and downloads the pre-built image file (UDP_Demo_Si70xx.hex) to the MCU card. 7. Verify that “Success. No errors reported.” is displayed in the command window. 8. Press any key to close the command window. The demo software displays temperature and humidity on the LCD. The LCD is updated twice a second with new temperature and humidity readings. If you prefer the temperature to be displayed in Fahrenheit, then press the S1 button. The demo software is now installed on the MCU card and the USB Debug Adapter is no longer needed. Disconnect the USB Debug Adapter from the debug connector on the MCU card. Rev. 0.2 7 Si7013EVB-UDP-M3L1 4. Source Code for the Demo Software The source code for the demo software consists of six components: Main Sensor Timeout Button LCD 2 I Driver C Driver 4.1. Main The Main component is the entry point for the demo software and it calls routines in the other components to run the application. The Main component is implemented in the “main.c” file. The main() routine calls enter_default_mode_from_reset() and Sensor_enter_default_mode_from_reset() to initialize the hardware and to initialize the sensor. The main() routine then enters an infinite loop where it reads the temperature and humidity from the sensor, and then displays them on the LCD. The main component contains the PutTemperataure() and PutHumidity() routines which display the temperature and humidity on the LCD. 4.2. Sensor The Sensor component provides routines for reading temperature and humidity from a Si7013 device. The Sensor component is implemented in the “mySensor_Si70xx.c” file. The Sensor component provides the routines Sensor_ReadTemperature(), Sensor_ReadThermistor(), and Sensor_ReadHumidity(). These routines call the Sensor_Measure() routine to take a measurement and return the value from the Si7013's Data register. The Sensor_ReadTemperature() and Sensor_ReadThermistor() routines convert the returned value to deci-degrees Celsius. The Sensor_ReadHumidity() routine converts the returned value to deci-percent relative humidity. The Si7013 must contain a thermistor correction coefficient table before the thermistor can be read. The Sensor component contains the routines, Sensor_ReadCoefficient() and Sensor_WriteCoefficient(), for reading and writing coefficients in the Si7013. The Sensor_enter_default_mode_from_reset() routine calls the Sensor_ReadCoefficient() routine to check if the Si7013 contains the thermistor correction coefficient table. If the table has not been programmed, the Sensor_enter_default_mode_from_reset() routine calls the Sensor_WriteCoefficient() routine to write the coefficients to the Si7013. The coefficient table only needs to be programmed once. The Sensor component also provides the Sensor_Sleep() and Sensor_WakeUp() routines. These routines are now needed by the Si7013 because the Si7013 automatically sleeps between commands. The demo software does not use floating point numbers because the floating point library is large and slow. The demo software avoids floating point numbers by using deci-units. A deci-unit is one tenth of a unit. The Sensor_ReadHumidity() routine returns the humidity in deci-percent RH and the Sensor_ReadTemperature() routine returns the temperature in deci-degrees Celsius. For example, 43.7 percent RH is 437 deci-percent RH. Likewise, 25.4 degrees Celsius is 254 deci-degrees Celsius. The demo software uses equations that are derived from the equations in the Si7005 data sheet. The derived equations are modified to use deci-units. 8 Rev. 0.2 Si7013EVB-UDP-M3L1 4.3. Timeout The Timeout component provides delay and timeout capabilities. The Timeout component is implemented in the “myCPU.c” file. The AppBuilder generated “gCPU.c” file implements a tick counter called “msTicks”. The tick counter is incremented once a millisecond. The current value of the tick counter is obtained by calling get_msTicks(). Timeouts are implemented by calling get_msTicks() to get a starting time and then repeatedly calling ElapsedTime() to get the number of milliseconds that have elapsed since the starting time. The Delay() routine does not return until the specified number of milliseconds have elapsed. 4.4. Button The Button component changes the temperature scale between Celsius and Fahrenheit when the user presses the S1 button. In addition, the S2 button switches the temperature readings between the internal sensor and the external thermistor. The Button component is implemented in the “myPB.c” file. The S1 button on the MCU board is connected to bit 4 of port bank 1 (PB1.4). This bit is high when the button is not pressed, but when the button is pressed the bit goes low. The S2 button is connected to bit 5 of port bank 1 (PB1.5). The MCU is configured to generate a port match interrupt when a button is pressed. When the port match interrupt handler detects that a button has been pressed, then the interrupt handler reconfigures the port match to detect when the button is released. This prevents a large number of useless port match interrupts while the button is held down. 4.5. LCD Driver The LCD driver contains routines for displaying characters, strings and numbers on the LCD. The LCD driver is implemented in the “myLCD0.c” file. The LCD driver provides the routines myLCD0_put_char(), myLCD0_put_string() and myLCD0_put_number() for displaying characters, strings and numbers on the LCD. The myLCD0_put_number() displays a number in decimal and right justified within a specified field width. The demo software does not use the printf() routine, because the printf() routine is very large and slow. Instead, the PutHumidity() and PutTemperature() routines call the myLCD0_put_number() routine, which is much smaller and quicker. 4.6. I2C Driver The I2C driver provides routines for reading and writing registers on an I2C slave device. The I2C driver is implemented in the “myI2C0.c” file. The I2C0_ReadByte() routine and the I2C0_WriteByte() routine read and write 8-bit registers on an I2C slave device. The demo software uses these routines to access most registers on the Si7013. The I2C0_ReadData() routine and I2C0_WriteData() routine perform multi-byte reads and writes from an I2C slave device. The demo software uses the I2C0_ReadData() routine to read the 16-bit Data register on the Si7013. The Si7013 port header card has two I2C buses. The first bus is connected to the onboard Si7013 device. The second bus is connected to the flat flexible cable (FFC) connector (J2) on the side of the board. A second Si7013 device can be attached to the FFC connector. The “Bus” parameter in each of the I2C routines selects which bus to use (I2C_BUS_1 or I2C_BUS_2). Rev. 0.2 9 Si7013EVB-UDP-M3L1 4.7. Data Logger The Si70xx Data Logger demonstrates how the SiM3L1xx microcontroller unit (MCU) and the Si7013 sensor can be used to record temperature and humidity over an extended period of time. This project includes Data Logger firmware that runs on a SiM3L1xx MCU card (UDP SIM3L1XX-LCD MCU) and a Data Logger application that runs on a PC. The Data Logger firmware reads the temperature and humidity from the Si7013 port header card (Si7013EB-UDP), which is plugged into the MCU card, and stores the samples in the MCU’s flash memory. The flash memory can store up to 8192 samples. The Data Logger application displays the samples on a graph. 4.7.1. Installing the Data Logger There are three steps required to install the Data Logger: 1. Install the Data Logger firmware on the MCU card. 2. Install CP210x drivers on the PC. 3. Install the Data Logger application on the PC. 4.7.1.1. Installing the Data Logger Firmware The “Si7013 UDP SiM3L1xx Evaluation Board Documentation and Software” CD contains the source code for the Data Logger firmware. However, you do not need to build the Data Logger firmware, because the CD also contains a pre-built image file and a batch file to download the image file to the MCU card. This is done using the following procedure: 1. Plug the Si7013 port header card onto J21 (PB0) of the MCU card. The Silicon Labs logo on the port header card faces the power connector on the MCU card. Make sure that the VIO pin on the port header card matches up with the VIO pin on J21. The top 4 pins (1-4) of the port header card do not connect with J21. 2. Connect the USB Debug Adapter to a USB port on the PC and connect the USB Debug Adapter to the debug connector (J14) on the MCU card. 3. Connect the power supply to the MCU board (J6). 4. Verify that the switches on MCU card are set correctly: Table 3. MCU Card Switch Settings Switch Label Number Setting VBAT Sel SW2 +3.3 V_VREG (center) VIORF Sel SW9 VBAT (down) VIO Sel SW8 VBAT (down) 5. Open Windows Explorer and change to the project folder: \UDP_Software_vX.X\DataLogger\FW\SiM3L1xx\ (where vX.X is the version number of the UDP software). 6. Double click on the “Install_Si70xx.bat” file in the project folder. This opens a command window and downloads the pre-built image file (UDP_DataLogger_Si70xx.hex) to the MCU card. 7. Verify that “Success. No errors reported.” is displayed in the command window. 8. Press any key to close the command window. Initially, the MCU board is in low-power “sleep” mode. In sleep mode, the LCD is blank, and the S1-S3 buttons do not work. To wake up the MCU board, press down on the center joystick button. When the MCU board is awake, the Data Logger firmware displays temperature and humidity on the LCD. The LCD is updated every two minutes with new temperature and humidity readings. If you prefer the temperature to be displayed in Fahrenheit, then press the S2 button. If no button is pressed within 15 seconds, the MCU board goes back to sleep. The Data Logger firmware is now installed on the MCU card and the USB Debug Adapter is no longer needed. Disconnect the USB Debug Adapter from the debug connector on the MCU card. 10 Rev. 0.2 Si7013EVB-UDP-M3L1 4.7.1.2. Installing CP210x Drivers The MCU card contains a CP2103 USB-to-UART bridge chip. The Data Logger application uses a virtual COM port (VCP) on the PC to send serial packets to the CP2103 over USB. The CP2103 then uses its UART to forward the packets to the Data Logger firmware. This section installs two drivers on the PC: CP210x VCP Driver CP210x USB-to-UART Bridge Driver Perform the following steps to install these drivers: 1. Run the following program from the “UDP_Software_v2.0” folder of the “Si7013 UDP SiM3L1xx Evaluation Board Documentation and Software” CD: CP210x_VCP_Win_XP_S2K3_Vista_7.exe 2. Use the InstallShield Wizard to install the VCP driver. Figure 6. InstallShield Wizard 3. At the “InstallShield Wizard Complete” window, make sure that “Launch the CP210x VCP Driver Installer” is checked; then click on the “Finish” button. This begins the installation of the USB-to-UART bridge driver. Rev. 0.2 11 Si7013EVB-UDP-M3L1 Figure 7. InstallShield Wizard Complete Window 4. When the installation of the bridge driver is complete, finalize the installation by connecting the MCU card to the PC with a USB cable. 4.7.1.3. Installing the Data Logger Application Perform the following steps to install the Data Logger application from the “UDP_Software_vX.X” folder of the “Si7013 UDP SiM3L1xx Evaluation Board Documentation and Software” CD. 1. Run the following program from the “Si7013 UDP SiM3L1xx Evaluation Board” CD: DataLoggerSetup_vX.X.exe (where X.X is the current version number). 2. Accept the Software License Agreement by clicking on the “Yes” button. 12 Rev. 0.2 Si7013EVB-UDP-M3L1 Figure 8. Software License Agreement 3. Use the Si70xx Data Logger Setup Wizard to install the application. Rev. 0.2 13 Si7013EVB-UDP-M3L1 Figure 9. Si70xx Data Logger Setup Wizard 4.7.2. Using the Data Logger When running the Data Logger firmware for the first time, the firmware takes a sample every two minutes but does not store the samples in the log. To start storing samples, press the S3 button. Each sample includes temperature, humidity, and a time stamp. The firmware’s clock has not yet been set; so, time stamps begin at midnight January first 2000. You may use the Data Logger application to display the stored samples. The application can also set the firmware’s clock and adjust the time between samples. The typical procedure for using the Data Logger is as follows: 1. Connect the MCU card to the PC with a USB cable. 2. Use the Data Logger application to stop logging and erase the log. 3. Set the time and the desired sample interval. 4. Ensure the MCU card is set up to use the onboard battery (refer to the UDP SiM3L1xx user's guide). 5. Disconnect the MCU card from the PC and take it to the location where you want to take samples. 6. Press the S3 button on the MCU card to start logging. 7. Wait while samples are logged. 8. Press the S3 button on the MCU card to stop logging. 9. Take the MCU card back to the PC and reconnect it to the PC. 10. Use the Data Logger application to display the log data. 11. Save the log data to a file. The Data Logger firmware can generate alarms when the temperature or humidity gets too high or too low. When an alarm occurs, the Data Logger firmware displays a flashing message on the LCD and pulses an output pin. If a buzzer is connected to the output pin, an audible alarm is produced. The Data Logger application can configure the thresholds for the alarms. 14 Rev. 0.2 Si7013EVB-UDP-M3L1 4.7.2.1. Using the Data Logger Application The Data Logger application runs on a PC and is used to configure the Data Logger firmware. The Data Logger application can also display the log data. To run the Data Logger application from the Start menu, select Start Silicon Laboratories Si70xx Data Logger. This opens up the Data Logger application shown in Figure 10. Figure 10. Data Logger Application The left side of the application window is used to configure the Data Logger firmware. The right side of the application window is used to display log data. 4.7.2.1.1. Data Logger Status The Data Logger Status box shown in Figure 11 displays the status of the Data Logger firmware. Figure 11. Data Logger Status Box If there are no alarms or errors, this box displays “OK”. If there is an alarm, this box displays an alarm message. If the status is “Communications Error”, this means the MCU card cannot communicate with the Si7005 port header card. Rev. 0.2 15 Si7013EVB-UDP-M3L1 4.7.2.1.2. Sensor Data The Sensor Data box shown in Figure 12 displays the current humidity and temperature. Figure 12. Sensor Data Box This box displays the temperature and humidity from the most recent sample. The Celsius and Fahrenheit radio buttons select whether the temperatures displayed in this box, the Thresholds box, and the Log Data box are in Celsius or Fahrenheit. These radio buttons do not affect how temperatures are displayed in the LCD. 4.7.2.1.3. Data Logger Time The Data Logger Time box shown in Figure 13 is used to set the time in the Data Logger firmware. Figure 13. Data Logger Time Box The upper part of this box displays the current time and current time zone of the Data Logger firmware. The 12 Hour and 24 Hour radio buttons select the format of the time displayed in this box and in the Log Data box. The “Set Data Logger to PC Time” button sets the time of the Data Logger firmware to the time of the PC. This button also sets the time zone in the Data Logger firmware to the time zone of the PC. The Data Logger firmware does not use the time zone information; it is simply used to document the context of the time stamps in case the Data Logger travels to different time zones. 4.7.2.1.4. Sample Interval The Sample Interval box shown in Figure 14 is used to configure how often samples are taken. Figure 14. Data Logger Time Box This text box displays the current setting of the sample interval. To change the sample interval, enter a number into the text box, select “Seconds” or “Minutes”, and then click on the “Set” button. The sample interval may be from 1 second to 1092 minutes (18 hours). 16 Rev. 0.2 Si7013EVB-UDP-M3L1 4.7.2.1.5. Logging The Logging box shown in Figure 15 is used to control the log in the Data Logger firmware. Figure 15. Logging Box The upper part of this box displays the current number of samples in the log. The Data Logger firmware constantly takes samples and displays them on the LCD. If logging is enabled, the samples are also saved in the log. Samples continue to be taken when logging is disabled. If logging is enabled, the left button says “Stop Logging”, and logging is disabled if this button is clicked. If logging is disabled, the left button says “Start Logging”, and logging is enabled if this button is clicked. Note: Logging may also be enabled and disabled with the SW3 button on the MCU card. The “Erase Log” button deletes all the samples in the log. 4.7.2.1.6. Information The Information box displays version and identification information. Figure 16. Information Box 4.7.2.1.7. Thresholds The Thresholds box is used to configure alarm thresholds. A humidity alarm occurs if the humidity is greater than the high humidity threshold or less than the low humidity threshold. A temperature alarm occurs if the temperature is greater than the high temperature threshold or less than the low temperature threshold. The Thresholds box displays the current threshold settings. If a text box is empty, that threshold is not used. If all text boxes are empty, then no humidity or temperature alarms are generated by the Data Logger firmware. To set the thresholds, enter numbers into the text boxes and then click on the “Set Thresholds” button. If you do not want to use a particular threshold, then make that text box empty, and click on the “Set Thresholds” button. A humidity threshold may be from 0 to 100. A temperature threshold may be from –40 to 85 if the Celsius radio button is selected and from –40 to 185 if the Fahrenheit radio button is selected. Rev. 0.2 17 Si7013EVB-UDP-M3L1 4.7.2.1.8. Log Data The Log Data box shown in Figure 17 displays log data in humidity and temperature graphs. Figure 17. Log Data Box Temperature and Humidity Graphs The “Get Log Data” button transfers all of the samples from the MCU card to the PC and displays them in the humidity and temperature graphs. The application also displays the minimum, maximum, and average values for temperature and humidity. The “Save Log Data” button saves the log data to a file in comma-separated value (CSV) format. A dialog box allows you to specify the name and location of the file. The “Restore Log Data” button allows you to redisplay a CSV file that was previously saved with this application. If you want to zoom into an area of a graph, then create a dashed box around the area by dragging the left mouse button across the graph as shown in Figure 18. 18 Rev. 0.2 Si7013EVB-UDP-M3L1 Figure 18. Zooming in on a Portion of the Graph The graph will zoom in to the selected area. You may pan around the graph by first holding the Ctrl key, then dragging the graph with the left mouse button. You may also use the mouse wheel to zoom in and out. If you click a graph with the right mouse button, a context menu is displayed as shown in Figure 19. Figure 19. Context Menu The context menu allows you to unzoom the graph. The context menu also lets you save and print images of the graph. If you select “Show Point Values” from the context menu and hover the mouse over the graph line, a tool tip displays the time and value for that point on the graph as shown in Figure 20. Rev. 0.2 19 Si7013EVB-UDP-M3L1 Figure 20. Sample Time and Value 4.7.2.2. Using the Data Logger Firmware The Data Logger firmware runs on an MCU card where it logs temperature and humidity data. The Data Logger firmware also generates alarms if the temperature or humidity become too high or too low. The user interface for the Data Logger firmware uses buttons, LCD displays, and an output pin to sound a buzzer. The Data Logger firmware is normally in sleep mode. In sleep mode, the firmware enters low-power mode between samples; the LCD is blank, and buttons S1–S3 do not work. In awake mode, the firmware does not enter low-power mode; the LCD is not blank, and the buttons work normally. 4.7.2.2.1. Buttons The Data Logger firmware uses three buttons and an LED as shown in Figure 21. Figure 21. Data Logger Firmware Buttons 20 Rev. 0.2 Si7013EVB-UDP-M3L1 To wake up the Data Logger firmware, press down on the center of the joystick button (U9). The buttons, S1-S3, do not work unless the firmware is awake. If no button is pressed within 15 seconds, the firmware goes back to sleep. S1 changes the information that is displayed on the LCD. The LCD rotates through the following displays: Temperature and Humidity Date Time Sample Count If there is an alarm, the Data Logger firmware displays a flashing alarm message on the LCD. The alarm message can be dismissed by pressing S1. This allows the normal displays to be seen (until the next alarm occurs). S2 toggles the displayed temperature between Celsius and Fahrenheit. S3 starts and stops logging. If logging is disabled, pressing S3 enables logging. If logging is enabled, pressing S3 disables logging. If logging is enabled, samples are stored in the log. The Data Logger firmware blinks DS8 when a sample is taken. This allows you to verify that samples are being taken at the expected rate. If the Data Logger application is not connected to the MCU card, then DS8 is off (except for occasional blinks). If the Data Logger application is connected to the MCU card, then DS8 is on (except for occasional blinks). This allows you to verify that the Data Logger application is successfully communicating with the Data Logger firmware. 4.7.2.2.2. LCD Displays There are five LCD displays for temperature and humidity, date, time, sample count, and alarm. The LCD is blank while the Data Logger is sleeping. To see information on the LCD, press down on the center of the joystick button. 4.7.2.2.2.1. Temperature and Humidity Display This display shows the temperature and humidity from the most recent sample. Figure 22. Temperature and Humidity Display You can press the S2 button to switch the temperature between Celsius and Fahrenheit. 4.7.2.2.2.2. Date Display This display show the current date. Figure 23. Date Display The date is formatted as month/day-of-month/year. Rev. 0.2 21 Si7013EVB-UDP-M3L1 4.7.2.2.2.3. Time Display This display shows the current time. Figure 24. Time Display The format of the time is hours : minutes : seconds A or P. This display allows you to verify that the time is set correctly. 4.7.2.2.2.4. Sample Count Display This display shows the current number of samples in the log. Figure 25. Sample Count Display This display also indicates if logging is enabled. If logging is enabled, a dot is displayed to the right of the number. 4.7.2.2.2.5. Alarm Display When an alarm occurs, the LCD displays a flashing alarm message as shown in Figure 26. Figure 26. Alarm Display An alarm message shows the offending temperature or humidity on the left and the word “HI” or “LOW” on the right. The above alarm message indicates that there is high temperature alarm and that the high temperature is 35.0°C. If both a temperature alarm and a humidity alarm occur at the same time, the LCD alternates between the two alarm messages. If the alarm message says “COMM ERR”, then the Data Logger firmware has failed to communicate with the Si7005 port header card. Please, verify that the port header card is properly plugged into the MCU card. 22 Rev. 0.2 Si7013EVB-UDP-M3L1 4.7.2.2.3. Alarm Output Pin When a sample is taken that causes an alarm, the Data Logger firmware pulses the output pin low. The output pin may be used to signal an external device or to sound a buzzer. The output pin is PB0.6, which is available on the analog connector (J20). The output pin is normally 3.3 V, but, when an alarm occurs, it goes to 0 V for 500 ms. The Data Logger firmware configures the output pin for high drive strength, so it can sink up to 80 mA. Note: A buzzer is not included with the evaluation kit. If you purchase a buzzer, make sure the buzzer works with 3 V and not 12 V. Figure 27. Optional 3 V Buzzer (User Supplied) Rev. 0.2 23 Si7013EVB-UDP-M3L1 5. Additional Reference Resources Si7013 data sheet AN607: Si70xx Humidity Sensor Designers Guide Si7013USB-Dongle users guide SiM3L1xx data sheet UDP SiM3L1xx LCD MCU Card User's Guide SiM3L1xx Reference Manual 24 Rev. 0.2 Si7013EVB-UDP-M3L1 NOTES: Rev. 0.2 25 Si7013EVB-UDP-M3L1 CONTACT INFORMATION Silicon Laboratories Inc. 400 West Cesar Chavez Austin, TX 78701 Tel: 1+(512) 416-8500 Fax: 1+(512) 416-9669 Toll Free: 1+(877) 444-3032 Please visit the Silicon Labs Technical Support web page: https://www.silabs.com/support/pages/contacttechnicalsupport.aspx and register to submit a technical support request. Patent Notice Silicon Labs invests in research and development to help our customers differentiate in the market with innovative low-power, small size, analog-intensive mixed-signal solutions. Silicon Labs' extensive patent portfolio is a testament to our unique approach and world-class engineering team. The information in this document is believed to be accurate in all respects at the time of publication but is subject to change without notice. Silicon Laboratories assumes no responsibility for errors and omissions, and disclaims responsibility for any consequences resulting from the use of information included herein. Additionally, Silicon Laboratories assumes no responsibility for the functioning of undescribed features or parameters. Silicon Laboratories reserves the right to make changes without further notice. Silicon Laboratories makes no warranty, representation or guarantee regarding the suitability of its products for any particular purpose, nor does Silicon Laboratories assume any liability arising out of the application or use of any product or circuit, and specifically disclaims any and all liability, including without limitation consequential or incidental damages. Silicon Laboratories products are not designed, intended, or authorized for use in applications intended to support or sustain life, or for any other application in which the failure of the Silicon Laboratories product could create a situation where personal injury or death may occur. Should Buyer purchase or use Silicon Laboratories products for any such unintended or unauthorized application, Buyer shall indemnify and hold Silicon Laboratories harmless against all claims and damages. Silicon Laboratories and Silicon Labs are trademarks of Silicon Laboratories Inc. Other products or brandnames mentioned herein are trademarks or registered trademarks of their respective holders. 26 Rev. 0.2