1
HP LoadRunner
for the Windows operating systems
Software Version: 11.00
Controller User Guide
Document Release Date: October 2010
Software Release Date: October 2010
Legal Notices
Warranty
The only warranties for HP products and services are set forth in the express warranty
statements accompanying such products and services. Nothing herein should be construed as
constituting an additional warranty. HP shall not be liable for technical or editorial errors or
omissions contained herein.
The information contained herein is subject to change without notice.
Restricted Rights Legend
Confidential computer software. Valid license from HP required for possession, use or copying.
Consistent with FAR 12.211 and 12.212, Commercial Computer Software, Computer Software
Documentation, and Technical Data for Commercial Items are licensed to the U.S.
Government under vendor's standard commercial license.
Copyright Notices
© 1993 - 2010 Hewlett-Packard Development Company, L.P.
Trademark Notices
Java™ is a US trademark of Sun Microsystems, Inc.
Microsoft® and Windows® are U.S. registered trademarks of Microsoft Corporation.
Oracle® is a registered US trademark of Oracle Corporation, Redwood City, California.
UNIX® is a registered trademark of The Open Group.
2
Documentation Updates
The title page of this document contains the following identifying information:
•
Software Version number, which indicates the software version.
•
Document Release Date, which changes each time the document is updated.
•
Software Release Date, which indicates the release date of this version of the software.
To check for recent updates, or to verify that you are using the most recent edition of a
document, go to:
http://h20230.www2.hp.com/selfsolve/manuals
This site requires that you register for an HP Passport and sign-in. To register for an HP
Passport ID, go to:
http://h20229.www2.hp.com/passport-registration.html
Or click the New users - please register link on the HP Passport login page.
You will also receive updated or new editions if you subscribe to the appropriate product
support service. Contact your HP sales representative for details.
3
Support
Visit the HP Software Support web site at:
http://www.hp.com/go/hpsoftwaresupport
This web site provides contact information and details about the products, services, and
support that HP Software offers.
HP Software online support provides customer self-solve capabilities. It provides a fast and
efficient way to access interactive technical support tools needed to manage your business. As
a valued support customer, you can benefit by using the support web site to:
•
Search for knowledge documents of interest
•
Submit and track support cases and enhancement requests
•
Download software patches
•
Manage support contracts
•
Look up HP support contacts
•
Review information about available services
•
Enter into discussions with other software customers
•
Research and register for software training
Most of the support areas require that you register as an HP Passport user and sign in. Many
also require a support contract. To register for an HP Passport ID, go to:
http://h20229.www2.hp.com/passport-registration.html
To find more information about access levels, go to:
http://h20230.www2.hp.com/new_access_levels.jsp
4
Table of Contents
Welcome to LoadRunner Controller .....................................................5
How This Guide Is Organized ...............................................................5
Who Should Read This Guide ...............................................................6
Documentation Library Guides.............................................................6
Searching and Navigating the Documentation Library........................9
Topic Types..........................................................................................10
Additional Online Resources...............................................................12
Documentation Updates .....................................................................13
PART I: INTRODUCING HP LOADRUNNER
Chapter 1: Understanding LoadRunner..............................................17
Concepts..............................................................................................18
Application Load Testing Overview ....................................................18
The HP LoadRunner Solution .............................................................18
HP LoadRunner Terminology .............................................................19
The HP LoadRunner Testing Process - Overview ................................21
HP LoadRunner Vuser Technology .....................................................23
HP LoadRunner Vuser Types ...............................................................23
Vuser Technology................................................................................25
Reference.............................................................................................27
Controller Window .............................................................................27
PART II: DESIGNING LOAD TEST SCENARIOS
Chapter 2: Planning Load Test Scenarios ...........................................33
Concepts..............................................................................................34
Load Test Planning Overview .............................................................34
Load Testing Objectives ......................................................................34
5
Table of Contents
Tasks ....................................................................................................39
How to Plan a Load Test......................................................................39
How to Analyze the Application .........................................................40
How to Define the Load Test Objectives.............................................43
How to Plan the LoadRunner Implementation ..................................44
Reference.............................................................................................49
Examining Load Testing Objectives....................................................49
Chapter 3: Designing Scenarios .........................................................53
Concepts..............................................................................................54
Load Test Scenarios Overview ............................................................54
Manual Scenarios ................................................................................54
Goals Types for Goal-Oriented Scenarios............................................56
Tasks ....................................................................................................60
How to Design a Goal-Oriented Scenario ...........................................60
How to Design a Manual Scenario ......................................................62
How to Change the Scenario Mode (Manual Scenario)......................65
How to View/Modify Scripts in the Scenario......................................65
Reference.............................................................................................70
Relative Paths for Scripts .....................................................................70
Vuser Statuses ......................................................................................71
Design View User Interface .................................................................72
Chapter 4: Load Generators..............................................................101
Concepts............................................................................................102
Load Generators Overview ................................................................102
Load Balancing ..................................................................................102
Tasks ..................................................................................................104
How to Connect to a UNIX Load Generator Without Using RSH ...104
How to Add Load Generators to a Scenario ......................................105
How to Modify Load Generator Details ............................................106
How to Connect/Disconnect a Load Generator ...............................106
Reference...........................................................................................107
UNIX Environment Variables ...........................................................107
Load Generators - User Interface.......................................................107
6
Table of Contents
Chapter 5: Scheduling Manual Scenarios .........................................127
Concepts............................................................................................128
Scheduling Manual Scenarios Overview ..........................................128
Scheduling by Scenario or Group......................................................128
Schedule Run Modes .........................................................................130
Tasks ..................................................................................................132
How to Define a Schedule for the Scenario - Workflow ...................132
How to Add Actions to the Scenario Schedule .................................136
How to Edit Schedule Actions ...........................................................139
Reference...........................................................................................142
Schedule Actions ...............................................................................142
Scheduler User Interface....................................................................146
Chapter 6: Service Level Agreements ..............................................161
Concepts............................................................................................162
Service Level Agreements Overview ..................................................162
Tracking Period..................................................................................163
Tasks ..................................................................................................164
How to Define Service Level Agreements..........................................164
How to Define Service Level Agreements - Use-Case Scenario .........166
Reference...........................................................................................171
Service Level Agreements User Interface...........................................171
Chapter 7: Multiple IP Addresses......................................................183
Concepts............................................................................................184
Multiple IP Addresses Overview ........................................................184
Tasks ..................................................................................................185
How to Add IP Addresses to a Load Generator ...............................185
How to Configuring Multiple IP Addresses on UNIX ......................187
Reference...........................................................................................190
IP Wizard ...........................................................................................190
7
Table of Contents
Chapter 8: Configuring Terminal Services Settings .........................193
Concepts............................................................................................194
Terminal Services Overview ..............................................................194
Tasks ..................................................................................................196
How to Use the Terminal Services Manager .....................................196
How to Configure Terminal Sessions Over a Firewall.......................197
Chapter 9: Configuring WAN Emulation Settings............................199
Concepts............................................................................................200
WAN Emulation Overview................................................................200
Typical Network Emulation Settings.................................................200
Emulated Locations Overview...........................................................201
Viewing WAN Emulation Monitors ..................................................202
Excluding Machines from WAN Emulation .....................................202
Tasks ..................................................................................................204
How to Integrate WAN Emulation Into Your Scenario ....................204
Reference...........................................................................................206
WAN Emulation Best Practices..........................................................206
P A R T I I I: R U N N I N G L O A D T E S T S C E N A R I O S
Chapter 10: Configuring Scenario Options ......................................211
Concepts............................................................................................212
Configuring Scenario Options Overview .........................................212
Expert Mode ......................................................................................212
Run-Time File Storage Locations.......................................................213
Path Translation ................................................................................214
Tasks ..................................................................................................216
How to Configure Scenario Options ................................................216
Reference...........................................................................................219
Path Translation Table ......................................................................219
Configuring Scenario Options User Interface ...................................221
8
Table of Contents
Chapter 11: Before Running Your Scenario......................................237
Tasks ..................................................................................................238
How to Prepare a Scenario to Run.....................................................238
Reference...........................................................................................243
Scenario Pre-Run Configuration User Interface ................................243
Chapter 12: Running Scenarios ........................................................247
Concepts............................................................................................248
Running Scenarios Overview ............................................................248
Tasks ..................................................................................................249
How to Run a Scenario ......................................................................249
Control Vusers During a Scenario Run - Use-Case Scenario .............252
Reference...........................................................................................270
Run View User Interface ....................................................................270
Chapter 13: Online Monitor Graphs ................................................289
Concepts............................................................................................290
Online Monitor Graphs Overview ....................................................290
Tasks ..................................................................................................291
How to Display Online Monitor Graphs ..........................................291
How to Customize Online Graph and Measurement Settings ........293
How to Manage Online Graphs .......................................................296
Reference...........................................................................................298
Online Monitor Graphs User Interface .............................................298
Available Graphs Tree........................................................................305
Chapter 14: Rendezvous Points ........................................................313
Concepts............................................................................................314
Rendezvous Points Overview ...........................................................314
Tasks ..................................................................................................315
How to Set Up a Rendezvous in a Scenario ......................................315
Reference...........................................................................................317
Rendezvous User Interface ................................................................317
9
Table of Contents
Chapter 15: After the Scenario Run..................................................321
Concepts............................................................................................322
Post Scenario Run Procedures - Overview.........................................322
Collating Run Data............................................................................322
Tasks ..................................................................................................324
How to Collate Scenario Run Results................................................324
Reference...........................................................................................325
Results Directory File Structure .........................................................325
Collating Results User Interface ........................................................327
Chapter 16: Using QuickTest Scripts in LoadRunner........................329
Concepts............................................................................................330
Using QuickTest Scripts in LoadRunner Overview ...........................330
About GUI Vuser Scripts....................................................................330
Guidelines for Using QuickTest Scripts in LoadRunner ...................333
Tasks ..................................................................................................335
How to Add a QuickTest Script to a Load Test Scenario...................335
Chapter 17: Managing Scenarios Using Application Lifecycle
Management.................................................................................337
Concepts............................................................................................338
Managing Scenarios Using Application Lifecycle Managment
Overview .......................................................................................338
Tasks ..................................................................................................339
How to Work with Scenarios in ALM Projects..................................339
How to Save Scenarios to ALM Projects ............................................340
How to Add Vuser Scripts from a Application Lifecycle
Management Project .....................................................................341
Reference...........................................................................................343
Application Lifecycle Management User Interface ...........................343
10
Table of Contents
PA RT I V : W O RK IN G W I T H F I R E W A L L S
Chapter 18: Working with Firewalls in LoadRunner.........................349
Concepts............................................................................................350
About Using Firewalls in LoadRunner ..............................................350
Monitors Over a Firewall ...................................................................353
Tasks ..................................................................................................355
How to Set Up Your System to Use Firewalls ....................................355
How to Configure the Over-Firewall System ....................................357
How to Configure the System to Monitor Servers Over a Firewall...361
How to Configure the LoadRunner Agent on Each Monitor
Over Firewall Machine ..................................................................362
How to Configure Monitors Over a Firewall.....................................365
Reference...........................................................................................368
Working With Firewalls in LoadRunner - User Interface .................368
Chapter 19: LoadRunner ERP/CRM Diagnostics Modules................381
Concepts............................................................................................383
ERP/CRM Diagnostics Modules Overview ........................................383
ERP/CRM Diagnostics Modules Architecture....................................383
Connecting the Mediator to a Remote Server...................................385
Siebel and Siebel DB Diagnostics Modules Overview .......................387
Oracle 11i Diagnostics Module Overview .........................................387
SAP Diagnostics Module Overview ...................................................387
Tasks ..................................................................................................389
How to Configure Siebel Diagnostics................................................389
How to Configure Siebel DB Diagnostics..........................................396
How to Configure Oracle 11i Diagnostics.........................................401
How to Configure SAP Diagnostics ...................................................406
How to Enable and Disable Logging on the Siebel Server ................407
How to Enable Logging on the Oracle Server ...................................409
How to Set and Disable the Oracle Server Diagnostics Password .....410
How to View Diagnostics Results ......................................................411
Reference...........................................................................................413
LoadRunner Diagnostics Modules User Interface .............................413
11
Table of Contents
Chapter 20: Configuring J2EE/.NET Diagnostics ..............................429
Concepts............................................................................................430
J2EE/.NET Diagnostics Overview ......................................................430
Monitoring Server Requests ..............................................................430
Tasks ..................................................................................................431
How to Specify J2EE/.NET Diagnostics Server Details in
the Launcher .................................................................................431
How to Configure a LoadRunner Scenario to use J2EE/.NET
Diagnostics....................................................................................432
How to View J2EE/.NET Diagnostics Data in LoadRunner
During a Scenario Run ..................................................................433
How to View Offline J2EE/.NET Diagnostics Results ........................434
Reference...........................................................................................435
LoadRunner J2EE/.NET Diagnostics Module User Interface .............435
P A R T V : M O N I T O R I N G L O A D T E S T S C E N A RI O S
Chapter 21: Working with LoadRunner Online Monitors ................441
Concepts............................................................................................442
Monitoring Process Overview ...........................................................442
Tasks ..................................................................................................443
How to Set Up the Monitoring Environment – Workflow ...............443
Reference...........................................................................................448
Monitor Types ...................................................................................448
Configuring Monitors User Interface................................................450
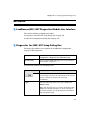
Chapter 22: Web Resource Monitors................................................463
Concepts............................................................................................464
Web Resource Monitoring Overview ...............................................464
Reference...........................................................................................469
HTTP Status Codes ............................................................................469
12
Table of Contents
Chapter 23: Run-Time and Transaction Monitoring .......................471
Concepts............................................................................................472
Run-Time Graphs Overview .............................................................472
Transaction Monitor Graphs Overview ............................................474
Chapter 24: System Resource Monitoring .......................................477
Concepts............................................................................................478
System Resource Monitors Overview ...............................................478
Windows Resource Monitoring.........................................................478
UNIX Resource Monitoring...............................................................479
Server Resource Monitoring ..............................................................479
SNMP Resource Monitoring ..............................................................480
SiteScope Resource Monitoring ........................................................481
Firewall Server Performance Monitoring .........................................481
Tasks ..................................................................................................482
How to Set up the UNIX Monitoring Environment .........................482
Reference...........................................................................................485
Check Point FireWall-1 Performance Counters ................................485
Server Resources Performance Counters ...........................................485
UNIX Resources Performance Counters............................................486
Windows Resource Performance Counters .......................................488
System Resource Monitors User Interface .........................................491
Chapter 25: Network Delay Monitoring ...........................................497
Concepts............................................................................................498
Network Monitoring Overview ........................................................498
Tasks ..................................................................................................500
How to Set Up the Network Monitoring Environment ....................500
How to Configure the UNIX Source Machine for Network
Monitoring ....................................................................................502
Reference...........................................................................................505
Network Delay Monitoring User Interface........................................505
Chapter 26: Web Server Resource Monitoring ................................513
Concepts............................................................................................514
Web Server Resource Monitoring Overview ....................................514
13
Table of Contents
Tasks ..................................................................................................515
How to change the Apache default server properties .......................515
Reference...........................................................................................516
Apache Performance Counters..........................................................516
Microsoft IIS Performance Counters .................................................516
Web Server Resource Monitoring User Interface ..............................517
Chapter 27: Web Application Server Resource Monitoring .............521
Concepts............................................................................................522
Web Application Server Resource Monitoring Overview .................522
Tasks ..................................................................................................523
How to Set Up the WebLogic (SNMP) Monitoring Environment ....523
Reference...........................................................................................525
MS Active Server Pages Performance Counters .................................525
WebLogic (SNMP) Performance Counters ........................................525
Web Application Server Resource Monitoring User Interface ..........527
Chapter 28: Database Resource Monitoring ....................................531
Concepts............................................................................................532
Database Resource Monitoring Overview ........................................532
Tasks ..................................................................................................533
How to Set Up the DB2 Monitoring Environment ...........................533
How to Set Up the Oracle Monitoring Environment .......................534
Reference...........................................................................................538
DB2 Performance Counters...............................................................538
Oracle Performance Counters ...........................................................552
SQL Server Performance Counters ....................................................554
Configuring Oracle JDBC Monitor Dialog Box ................................555
Chapter 29: Streaming Media Monitoring .......................................557
Concepts............................................................................................558
Streaming Media Monitoring Overview ...........................................558
14
Table of Contents
Reference...........................................................................................559
RealPlayer Client Performance Counters ..........................................559
Media Player Client Performance Counters......................................561
Chapter 30: ERP/CRM Server Resource Monitoring ........................563
Concepts............................................................................................564
ERP/CRM Server Resource Monitoring Overview .............................564
Tasks ..................................................................................................565
How to Set Up the PeopleSoft (Tuxedo) Resource Monitor..............565
How to Set Up the SAPGUI Server Resource Monitor.......................567
Reference...........................................................................................569
PeopleSoft (Tuxedo) Performance Counters .....................................569
SAPGUI Performance Counters .........................................................572
Siebel Server Manager Performance Counters ..................................573
ERP/CRM Server Resounce Monitoring User Interface .....................575
Chapter 31: Application Component Monitoring ............................583
Concepts............................................................................................584
Application Component Monitoring Overview ...............................584
Reference...........................................................................................586
Microsoft COM+ Performance Counters ..........................................586
Chapter 32: Application Deployment Solution Monitoring.............589
Concepts............................................................................................590
Application Deployment Solution Monitoring Overview ................590
Tasks ..................................................................................................591
How to Set up the Citrix Monitoring Environment .........................591
Reference...........................................................................................593
Citrix MetaFrame Performance Counters .........................................593
Citrix Monitor Dialog Box ...............................................................600
Chapter 33: Middleware Performance Monitoring..........................601
Concepts............................................................................................602
Middleware Performance Monitoring Overview .............................602
15
Table of Contents
Tasks ..................................................................................................603
How to Set Up the Tuxedo Monitor .................................................603
How to Set Up the IBM WebSphere MQ Monitor ............................605
Reference...........................................................................................608
IBM WebSphere MQ Performance Counters ....................................608
IBM WebSphere MQ Queue Attributes .............................................611
Tuxedo Performance Counters..........................................................613
Tuxedo tpinit.ini File.........................................................................615
Middleware Performance Monitoring User Interface .......................615
Chapter 34: Infrastructure Resources Monitoring............................621
Concepts............................................................................................622
Infrastructure Resources Monitoring Overview ................................622
Reference...........................................................................................623
Network Client Performance Counters.............................................623
PART VI: APPENDIXES
Chapter 35: Secure Host Communication .......................................627
Concepts............................................................................................628
Secure Host Communication Overview............................................628
Host Security Configuration .............................................................629
Remote Security Configuration.........................................................630
Host Security Best Practices ...............................................................632
Tasks ..................................................................................................633
How to Configure Security Settings Locally on Hosts ......................633
How to Register Hosts in Host Security Manager .............................634
How to Update Host Security Settings Remotely..............................635
Reference...........................................................................................638
Secure Host Communication Interface .............................................638
Chapter 36: Controller Command Line Arguments .........................647
Concepts............................................................................................648
Controller Command Line Arguments Overview.............................648
16
Table of Contents
Tasks ..................................................................................................649
Invoke the Controller from the command Line ...............................649
Reference...........................................................................................650
Command Line Arguments - Rules ...................................................650
Application Lifecycle Management Arguments................................651
Run Time Arguments ........................................................................652
Chapter 37: Working with Digital Certificates ................................653
Concepts............................................................................................654
Digital Certificates Overview.............................................................654
Using Digital Certificates with Firewalls ...........................................654
Tasks ..................................................................................................656
Create and Use Digital Certificates ...................................................656
Appendix A: Troubleshooting Online Monitors ...............................659
Concepts............................................................................................660
Troubleshooting Online Monitors Overview....................................660
Reference...........................................................................................661
17
Table of Contents
18
Welcome to LoadRunner Controller
Welcome to the HP LoadRunner Controller User Guide. This guide presents an
overview of the HP LoadRunner testing process, and describes how to create
and run HP LoadRunner scenarios using HP LoadRunner Controller in a
Windows environment.
HP LoadRunner is HP’s tool for application performance testing.
LoadRunner stresses your entire application to isolate and identify potential
client, network, and server bottlenecks.
How This Guide Is Organized
This guide contains the following parts:
Part I
Introducing HP LoadRunner
Introduces HP LoadRunner Controller, and describes how you use it for load
testing.
Part II
Designing Load Test Scenarios
Explains how to create a scenario for load testing.
Part III
Running Load Test Scenarios
Explains how to run a scenario, and how to view the system’s performance
during the scenario.
Part IV
Working with Firewalls
Explains how to use HP LoadRunner Controller in an environment that
includes firewalls.
5
Welcome to This Guide
Part V
Working with Diagnostics
Explains how to use LoadRunner’s Diagnostics modules to identify and
pinpoint performance problems in Siebel, Oracle, SAP, J2EE, and .NET
environments.
Part VI
Monitoring Load Test Scenarios
Explains how to monitor scenario execution using the LoadRunner online
monitors.
Part VII Appendixes
Contains additional information about using LoadRunner.
Who Should Read This Guide
This guide is for the following users of HP LoadRunner:
➤
Performance Engineers
➤
Project Manager
This document assumes that you are moderately knowledgeable about
enterprise application development and highly skilled in enterprise system
and database administration.
Documentation Library Guides
The Documentation Library consists of the following guides and references,
available online, in PDF format, or both. PDFs can be read and printed using
Adobe Reader, which can be downloaded from the Adobe Web site (http://
www.adobe.com).
Using this Documentation Library explains how to use the Documentation
Library and how it is organized.
Accessing the Documentation
You can access the documentation as follows:
6
Welcome to This Guide
➤
From the Start menu, click Start > LoadRunner > Documentation and
select the relevant document.
➤
From the Help menu, click Documentation Library to open the merged
help.
Getting Started Documentation
➤
Readme. Provides last-minute news and information about
LoadRunner. You access the Readme from the Start menu.
➤
HP LoadRunner Quick Start provides a short, step-by-step overview
and introduction to using LoadRunner. To access the Quick Start from
the Start menu, click Start > LoadRunner > Quick Start.
➤
HP LoadRunner Tutorial. Self-paced printable guide, designed to lead
you through the process of load testing and familiarize you with the
LoadRunner testing environment. To access the tutorial from the Start
menu, click Start > LoadRunner > Tutorial.
LoadRunner Guides
➤
HP Virtual User Generator User Guide. Describes how to create scripts
using VuGen. The printed version consists of two volumes, Volume I Using VuGen and Volume II - Protocols, while the online version is a
single volume. When necessary, supplement this user guide with the
online HP LoadRunner Online Function Reference.
➤
HP LoadRunner Controller User Guide. Describes how to create and
run LoadRunner scenarios using the LoadRunner Controller in a
Windows environment. Also describes how to set up the server
monitor environment and configure LoadRunner monitors for
monitoring data generated during a scenario.
➤
HP LoadRunner Analysis User Guide. Describes how to use the
LoadRunner Analysis graphs and reports after running a scenario to
analyze system performance.
➤
HP LoadRunner Installation Guide. Explains how to install
LoadRunner and additional LoadRunner components, including
LoadRunner samples.
7
Welcome to This Guide
LoadRunner References
8
➤
LoadRunner Function Reference. Gives you online access to all of
LoadRunner’s functions that you can use when creating Vuser scripts,
including examples of how to use the functions.
➤
Analysis API Reference. This Analysis API set can be used for
unattended creating of an Analysis session or for custom extraction of
data from the results of a test run under the Controller. You can access
this reference from the Analysis Help menu.
➤
Error Codes and Troubleshooting. Provides clear explanations and
troubleshooting tips for Controller connectivity and Web protocol
errors. It also provides general troubleshooting tips for Winsock,
SAPGUI, and Citrix protocols.
Welcome to This Guide
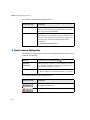
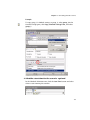
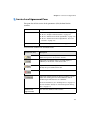
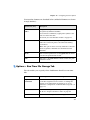
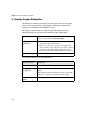
Searching and Navigating the Documentation Library
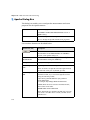
The following functionality is available from the Documentation Library:
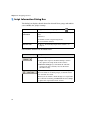
Option
Description
Search and Navigate. Displays the navigation pane. This
button is displayed only when the navigation pane is closed.
The navigation pane includes the following tabs:
➤ Contents tab. Organizes topics in a hierarchical tree,
enabling you to directly navigate to a specific guide or
topic.
➤ Index tab. Displays a detailed alphabetical listing of topics,
along with the numbers of the pages on which they are
mentioned. Double-click an index entry to display the
corresponding topic. If your selection occurs in multiple
documents, the right pane displays a list of possible
locations, enabling you to select a context.
➤ Search tab. Enables you to search for specific topics or
keywords. Results are returned in ranked order. You can
limit your search to a specific guide by selecting a value
from the scope drop-down list.
Note: The search looks for each individual word in the
phrase and not for full phrases, regardless of whether you
use quotations (").
➤ Favorites tab. Enables you to bookmark specific topics for
quick reference.
The Favorites tab is available only when using the Java
implementation of the Help. If your browser does not
support Java, the JavaScript implementation is
automatically used and the Favorites tab is not displayed.
Show in Contents. Displays the Contents tab in the
navigation pane, and highlights the entry corresponding to
the currently displayed page.
This button is displayed only when the navigation pane is
open.
Previous and Next. Navigates to the previous or next page in
the currently displayed guide.
9
Welcome to This Guide
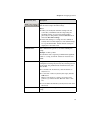
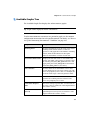
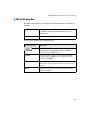
Option
Description
Send Documentation Feedback to HP. We welcome your
feedback. Use this button in any topic to open an email
addressed to us, containing the page reference. Send us your
comments, ideas for improvement, and any errors you find.
Print. Prints the currently displayed page. To print a complete
guide, access the printer-friendly link from the
Documentation Library Home page.
Back
You can use your browser's Back function to return to the
previously displayed page. In most browsers, you can
right-click and select Back from the shortcut menu.
Using This
Documentation
Library
Located on the lower-left corner of each content page.
Glossary
Located on the lower-left corner of each content page.
Opens this section.
Opens a glossary containing definitions of terms and
acronyms.
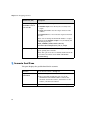
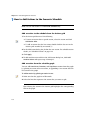
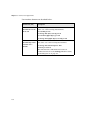
Topic Types
Note: This section applies to the LoadRunner Controller, VuGen, and
Analysis User Guides only.
10
Welcome to This Guide
The content in the above mentioned LoadRunner guides is organized by
topics. Three main topic types are in use: Concepts, Tasks, and Reference.
The topic types are differentiated visually using icons.
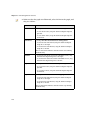
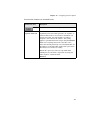
Topic Type
Description
Usage
Concepts
Background, descriptive, or
conceptual information.
Learn general information
about what a feature does.
Tasks
Instructional Tasks.
Step-by-step guidance to help
you work with the application
and accomplish your goals.
➤ Learn about the overall
Task steps can be with or
without numbering:
➤ Numbered steps. Tasks that
are performed by following
each step in consecutive
order.
workflow of a task.
➤ Follow the steps listed in
a numbered task to
complete a task.
➤ Perform independent
operations by
completing steps in a
non-numbered task.
➤ Non-numbered steps. A list
of self-contained operations
that you can perform in any
order.
Use-case Scenario Tasks.
Examples of how to perform a
task for a specific situation.
Learn how a task could be
performed in a realistic
scenario.
11
Welcome to This Guide
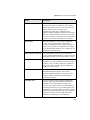
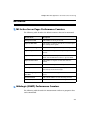
Topic Type
Description
Usage
Reference
General Reference. Detailed
lists and explanations of
reference-oriented material.
Look up a specific piece of
reference information
relevant to a particular
context.
User Interface Reference.
Specialized reference topics
that describe a particular user
interface in detail. Selecting
Help on this page from the
Help menu in the product
generally open the user
interface topics.
Look up specific
information about what to
enter or how to use one or
more specific user interface
elements, such as a
window, dialog box, or
wizard.
Troubleshooting and
Limitations. Specialized
reference topics that describe
commonly encountered
problems and their solutions,
and list limitations of a feature
or product area.
Increase your awareness of
important issues before
working with a feature, or
if you encounter usability
problems in the software.
Troubleshooting
and Limitations
Additional Online Resources
Troubleshooting & Knowledge Base accesses the Troubleshooting page on
the HP Software Support Web site where you can search the Self-solve
knowledge base. Choose Help > Troubleshooting & Knowledge Base. The
URL for this Web site is http://h20230.www2.hp.com/troubleshooting.jsp.
HP Software Support accesses the HP Software Support Web site. This site
enables you to browse the Self-solve knowledge base. You can also post to
and search user discussion forums, submit support requests, download
patches and updated documentation, and more. Choose Help > HP Software
Support. The URL for this Web site is www.hp.com/go/hpsoftwaresupport.
12
Welcome to This Guide
Most of the support areas require that you register as an HP Passport user
and sign in. Many also require a support contract.
To find more information about access levels, go to:
http://h20230.www2.hp.com/new_access_levels.jsp
To register for an HP Passport user ID, go to:
http://h20229.www2.hp.com/passport-registration.html
HP Software Web site accesses the HP Software Web site. This site provides
you with the most up-to-date information on HP Software products. This
includes new software releases, seminars and trade shows, customer support,
and more. Choose Help > HP Software Web site. The URL for this Web site
is www.hp.com/go/software.
Documentation Updates
HP Software is continually updating its product documentation with new
information.
To check for recent updates, or to verify that you are using the most recent
edition of a document, go to the HP Software Product Manuals Web site
(http://h20230.www2.hp.com/selfsolve/manuals).
13
Welcome to This Guide
14
Part I
Introducing HP LoadRunner
16
2
Understanding LoadRunner
This chapter includes:
Concepts
➤
Application Load Testing Overview on page 18
➤
The HP LoadRunner Solution on page 18
➤
HP LoadRunner Terminology on page 19
➤
The HP LoadRunner Testing Process - Overview on page 21
➤
HP LoadRunner Vuser Technology on page 23
➤
HP LoadRunner Vuser Types on page 23
➤
Vuser Technology on page 25
Reference
➤
Controller Window on page 27
17
Chapter 2 • Understanding LoadRunner
Concepts
Application Load Testing Overview
Modern system architectures are complex. While they provide an
unprecedented degree of power and flexibility, these systems are difficult to
test. Whereas single-user testing focuses primarily on functionality and the
user interface of a system component, application testing focuses on
performance and reliability of an entire system.
For example, a typical application testing scenario might depict 1000 users
that log in simultaneously to a system on Monday morning. What is the
response time of the system? Does the system crash? To be able to answer
these questions, and more, a complete application performance testing
solution must do the following:
➤
Test a system that combines a variety of software applications and
hardware platforms
➤
Determine the suitability of a server for any given application
➤
Test the server before the necessary client software has been developed
➤
Emulate an environment where multiple clients interact with a single
server application
➤
Test an application under the load of tens, hundreds, or even thousands
of potential users
The HP LoadRunner Solution
Traditional or manual testing methods offer only a partial solution to load
testing. For example, you can test an entire system manually by
constructing an environment where many users work simultaneously on
the system. Each user works at a single machine and submits input to the
system. However, this manual testing method has the following drawbacks:
➤
18
It is expensive, requiring large amounts of both personnel and machinery
Chapter 2 • Understanding LoadRunner
➤
It is complicated, especially coordinating and synchronizing multiple
testers
➤
It involves a high degree of organization, especially to record and analyze
results meaningfully
➤
The repeatability of the manual tests is limited
LoadRunner addresses the drawbacks of manual performance testing:
➤
LoadRunner reduces personnel requirements by replacing human users
with virtual users or Vusers. These Vusers emulate the behavior of real
users operating real applications.
➤
Because numerous Vusers can run on a single computer, LoadRunner
reduces the amount of hardware required for testing.
➤
The HP LoadRunner Controller allows you to easily and effectively
control all the Vusers from a single point of control.
➤
LoadRunner monitors the application performance online, enabling you
to fine-tune your system during test execution.
➤
LoadRunner automatically records the performance of the application
during a test. You can choose from a wide variety of graphs and reports to
view the performance data.
➤
LoadRunner checks where performance delays occur: network or client
delays, CPU performance, I/O delays, database locking, or other issues at
the database server. LoadRunner monitors the network and server
resources to help you improve performance.
➤
Because LoadRunner tests are fully automated, you can easily repeat them
as often as you need.
HP LoadRunner Terminology
➤
Scenario. A scenario is a sequence of events that emulate the hypothetical
actions of real users on your application.
19
Chapter 2 • Understanding LoadRunner
20
➤
Vusers. In the scenario, LoadRunner replaces real users with virtual users
or Vusers. While a workstation accommodates only a single human user,
many Vusers can run concurrently on a single workstation. In fact, a
scenario can contain tens, hundreds, or even thousands of Vusers.
➤
Vuser Scripts. The actions that a Vuser performs during the scenario are
described in a Vuser script. When you run a scenario, each Vuser executes
a Vuser script. The Vuser scripts include functions that measure and
record the performance of your application’s components.
➤
Transactions. To measure the performance of the server, you define
transactions. A transaction represents an action or a set of actions that
you are interested in measuring. You define transactions within your
Vuser script by enclosing the appropriate sections of the script with start
and end transaction statements. For example, you can define a
transaction that measures the time it takes for the server to process a
request to view the balance of an account and for the information to be
displayed at the ATM.
➤
Rendezvous points. You insert rendezvous points into Vuser scripts to
emulate heavy user load on the server. Rendezvous points instruct Vusers
to wait during test execution for multiple Vusers to arrive at a certain
point, so that they may simultaneously perform a task. For example, to
emulate peak load on the bank server, you can insert a rendezvous point
instructing 100 Vusers to deposit cash into their accounts at the same
time.
➤
Controller. You use the HP LoadRunner Controller to manage and
maintain your scenarios. Using the Controller, you control all the Vusers
in a scenario from a single workstation.
➤
Load Generator. When you execute a scenario, the Controller distributes
each Vuser in the scenario to a load generator. The load generator is the
machine that executes the Vuser script, enabling the Vuser to emulate the
actions of a human user.
➤
Performance analysis. Vuser scripts include functions that measure and
record system performance during load-testing sessions. During a scenario
run, you can monitor the network and server resources. Following a
scenario run, you can view performance analysis data in reports and
graphs.
Chapter 2 • Understanding LoadRunner
The HP LoadRunner Testing Process - Overview
The following section provides a general overview of the HP LoadRunner
testing process.
This section also includes:
➤
"Planning the Test" on page 21
➤
"Creating the Vuser Scripts" on page 21
➤
"Designing the Scenario" on page 22
➤
"Running the Scenario" on page 22
➤
"Monitoring the Scenario" on page 22
➤
"Analyzing Test Results" on page 22
1 Planning the Test
Successful load testing requires that you develop a thorough test plan. A
clearly defined test plan will ensure that the LoadRunner scenarios that
you develop will accomplish your load testing objectives. For more
information, see "Planning Load Test Scenarios" on page 33.
2 Creating the Vuser Scripts
Vusers emulate human users interacting with your Web-based
application. A Vuser script contains the actions that each Vuser performs
during scenario execution.
In each Vuser script, you determine the tasks that will be:
➤
Performed by each Vuser
➤
Performed simultaneously by multiple Vusers
➤
Measured as transactions
For more information on creating Vuser scripts, see the HP Virtual User
Generator User Guide.
21
Chapter 2 • Understanding LoadRunner
3 Designing the Scenario
A scenario describes the events that occur during a testing session. A
scenario includes a list of machines on which Vusers run, a list of scripts
that the Vusers run, and a specified number of Vusers or Vuser groups that
run during the scenario. When designing the scenario, you set the
scenario configuration and scheduling which determines how all the load
generators and Vusers behave while the scenario runs.
You design scenarios using the Controller. For information about
LoadRunner scenarios, see "Designing Scenarios" on page 53.
4 Running the Scenario
You emulate user load on the server by instructing multiple Vusers to
perform tasks simultaneously. While the scenario runs, LoadRunner
measures and records the transactions that you defined in each Vuser
script. You can set the level of load by increasing and decreasing the
number of Vusers that perform tasks at the same time and you can also
monitor your system’s performance online. For more information, see
"Running Scenarios" on page 247.
5 Monitoring the Scenario
You configure the LoadRunner monitoring components to identify
bottlenecks on the system and determine which element is causing
performance degradation, for example, file locking, resource contention,
and network overload. Use LoadRunner in conjunction with the new
network and machine monitoring tools to create load and measure
performance at different points in the system. For more information on
monitoring, see "Working with LoadRunner Online Monitors" on
page 441.
6 Analyzing Test Results
During scenario execution, LoadRunner records the performance of the
application under different loads. You use LoadRunner’s graphs and
reports to analyze the application’s performance. For more information
about LoadRunner’s reports and graphs, see the HP LoadRunner Analysis
User Guide.
22
Chapter 2 • Understanding LoadRunner
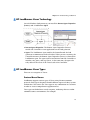
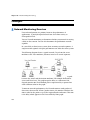
HP LoadRunner Vuser Technology
On each Windows load generator, you install the Remote Agent Dispatcher
(Process) and a LoadRunner Agent.
➤
Remote Agent Dispatcher. The Remote Agent Dispatcher (Process)
enables the Controller to start applications on the load generator.
➤
Agent. The LoadRunner Agent enables the Controller and the load
generator to communicate with each other. When you run a scenario, the
Controller instructs the Remote Agent Dispatcher (Process) to launch the
LoadRunner agent. The agent receives instructions from the Controller to
initialize, run, pause, and stop Vusers. At the same time, the agent also
relays data on the status of the Vusers back to the Controller.
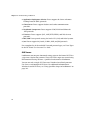
HP LoadRunner Vuser Types
There are two categories of Vusers:
Protocol Based Vusers
LoadRunner supports various types of Vusers using the most common
protocols. Each type is designed to handle different aspects of today’s system
architectures. You can use the Vuser types in any combination in a scenario
in order to create a comprehensive application test.
Vuser types are divided into several categories, indicating their use within
common business environments. For example:
23
Chapter 2 • Understanding LoadRunner
➤
Application Deployment Solution Vusers support the Citrix or Remote
Desktop Protocol (RDP) protocols.
➤
Client/Server Vusers support database and socket communication
protocols.
➤
Distributed Components Vusers support COM/DCOM and Microsoft
.NET protocols.
➤
E-business Vusers support AJAX, AMF, HTTP/HTML, and Web Services
protocols.
➤
ERP/CRM Vusers provide testing for Oracle NCA, SAP, and Siebel systems.
➤
Java Vusers support the Jacada, CORBA, RMI, and JMS protocols.
For a complete list of the available Vuser and protocol types, see Vuser Types
in the HP Virtual User Generator User Guide.
GUI Vusers
LoadRunner can integrate functional testing scripts in the form of GUI Vuser
scripts into a load testing scenario. These GUI Vuser scripts are created using
HP Functional Testing software - QuickTest Professional or WinRunner.
You can run only a single GUI Vuser on a Windows-based load generator.
Use Citrix to run multiple GUI Vusers. For additional information on
Windows-based GUI Vusers, see "Using QuickTest Scripts in LoadRunner" on
page 329.
24
Chapter 2 • Understanding LoadRunner
Vuser Technology
Vusers (except for GUI Vusers) generate load on a server by submitting input
directly to the server. Vusers do not operate client applications—they access
the server using LoadRunner API functions. These API functions emulate the
input from an actual application.
Because Vusers are not reliant on client software, you can use Vusers to test
server performance even before the client software has been developed.
Further, since Vusers do not have a user interface, the amount of system
resources required is minimal. This allows you to run large numbers of
Vusers on a single workstation.
The following example illustrates the use of Vusers: Suppose that you have a
Web-based database server that maintains your customer information. The
information is accessed by numerous customer service personnel who are
located throughout the country. The server receives the queries, processes
the requests, and returns responses via the Web to field personnel.
You want to test the response times of the entire system when numerous
service personnel simultaneously access the server. Using LoadRunner, you
could create several hundred Vusers, each Vuser accessing the server
database. The Vusers enable you to emulate and measure the performance of
your database and Web servers under the load of many users.
You develop a Vuser script to define the actions of a Vuser. A Vuser script
includes functions that control the script execution, specify the input that
the Vuser submits to the server, and measure the server performance.
You develop Vuser scripts either by recording with HP Virtual User
Generator (VuGen) or by using LoadRunner’s Vuser script templates.
25
Chapter 2 • Understanding LoadRunner
For the database server example above, you could create a Vuser script that
performs the following actions:
➤
Logs in to the Web application
➤
Connects to the database server
➤
Submits an SQL query
➤
Retrieves and processes the server response
➤
Disconnects from the server and the Web
You can create Vuser scripts on a Windows-based platform, or program them
on a UNIX platform. For a list of the supported UNIX platforms, see the HP
LoadRunner Readme file. For more information about Vusers, see the HP
Virtual User Generator User Guide.
26
Chapter 2 • Understanding LoadRunner
Reference
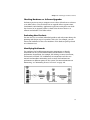
Controller Window
The Controller window enables you to design and run load test scenarios,
and view Diagnostics for J2EE/.NET data.
27
Chapter 2 • Understanding LoadRunner
To access
Start > Program Files > LoadRunner > LoadRunner > Load
Testing tab > Run Load Test
Start > Program Files > LoadRunner > Applications >
Controller
Important
information
By default, upon opening the Controller the New
Scenario dialog box is displayed. To disable this option,
clear the Show at Startup option. For details, see "New
Scenario Dialog Box" on page 84.
Relevant tasks
➤ "How to Design a Goal-Oriented Scenario" on page 60
➤ "How to Design a Manual Scenario" on page 62
➤ "How to Run a Scenario" on page 249
➤ "How to Set Up the Monitoring Environment –
Workflow" on page 443
User interface elements are described below:
UI Elements (A-Z)
Description
New Scenario. Opens New Scenario dialog box. For user
interface details, see "New Scenario Dialog Box" on
page 84.
Open Scenario. Enables you to open an existing scenario.
Save Scenario. Enables you to save the active scenario.
(Goal-oriented
scenario; Run view
only)
Edit scenario goal. Opens the Edit Scenario Goal dialog
box where you define goals for a goal-oriented scenario.
For user interface details, see "Edit Scenario Goal Dialog
Box" on page 78.
Load Generators. Opens the Load Generators dialog box
where you can add new load generators and view details
about existing load generators. For user interface details,
see "Load Generators Dialog Box" on page 124.
28
Chapter 2 • Understanding LoadRunner
UI Elements (A-Z)
(Run view only)
Description
Initialize Vusers. Initializes all Vusers (ar those that are
still in the Down state) in a selected Vuser group. The
group’s status changes from Down to Pending to
Initializing to Ready. If the group fails to initialize, the
status changes to Error.
By initializing all of the Vusers in a group before running
them, you can ensure that they all begin executing the
scenario at the same time.
(Run view only)
Run Vusers Until Complete. Runs all Vusers in a selected
Vuser group until completion. If you run a Vuser group
in the Down or Error state, LoadRunner initializes and
then runs the group.
Note: You can instruct LoadRunner to randomly run
only one Vuser in a Vuser group by right-clicking the
group and selecting Run one Vuser Until Complete. A
Vuser script log opens, displaying run-time information
about the Vuser. For more information, see "Vuser Script
Log" on page 287
(Run view only)
Gradual Stop. Gradually stops a Vuser group in the Run
state if you selected the Wait for the current iteration to
end before exiting or Wait for the current action to end
before exiting options in the Run-Time Settings tab of
the Options dialog box.
Stop Vusers. Immediately stops all Vusers in selected
Vuser groups from executing their scripts.
(Run view only)
Analyze Results. Opens diagnostics results.
(Run view only)
Invoke VuGen. Invokes HP Virtual User Generator.
Invoke Analysis. Invokes HP LoadRunner Analysis.
29
Chapter 2 • Understanding LoadRunner
UI Elements (A-Z)
Description
Design tab
Enables you to design scenarios. For details, see "Design
View User Interface" on page 72.
Diagnostics for
J2EE/.NET tab
Enables you to view J2EE/.NET diagnostics data collected
from a scenario run. For details, see the HP Diagnostics
User Guide.
Run tab
Enables you to run and monitor scenario runs. For
details, see "Run View User Interface" on page 270.
<Status bar>
Displays the following features of Controller (if enabled):
➤ Application Lifecycle Management Connection
➤ IP Spoofer
➤ Auto Collate Results
➤ Auto Load Analysis
30
Part II
Designing Load Test Scenarios
32
3
Planning Load Test Scenarios
This chapter includes:
Concepts
➤
Load Test Planning Overview on page 34
➤
Load Testing Objectives on page 34
Tasks
➤
How to Plan a Load Test on page 39
➤
How to Analyze the Application on page 40
➤
How to Define the Load Test Objectives on page 43
➤
How to Plan the LoadRunner Implementation on page 44
Reference
➤
Examining Load Testing Objectives on page 49
33
Chapter 3 • Planning Load Test Scenarios
Concepts
Load Test Planning Overview
As in any type of system testing, a well-defined test plan is the first essential
step to successful testing. Planning your load testing helps you to:
➤
Build test scenarios that accurately emulate your working environment.
Load testing means testing your application under typical working
conditions, and checking for system performance, reliability, capacity,
and so forth.
Before running your load test, it is important to:
➤
Understand which resources are required for testing.
Application testing requires hardware, software, and human resources.
Before you begin testing, you should know which resources are available
and decide how to use them effectively.
➤
Define success criteria in measurable terms.
Focused testing goals and test criteria ensure successful testing. For
example, it is not enough to define vague objectives like “Check server
response time under heavy load.” A more focused success criterion would
be “Check that 50 customers can check their account balance
simultaneously, and that the server response time will not exceed one
minute.”
Load Testing Objectives
Your test plan should be based on a clearly defined testing objective.
34
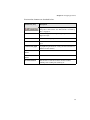
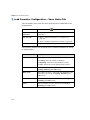
Chapter 3 • Planning Load Test Scenarios
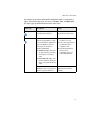
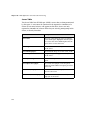
The following table presents common application testing objectives that
LoadRunner helps you test, as described in Robert W. Buchanan, Jr’s The Art
of Testing Network Systems (John Wiley & Sons, Inc., 1996). More details on
these objectives appear after the table.
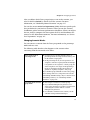
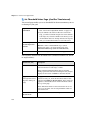
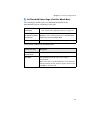
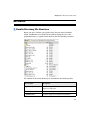
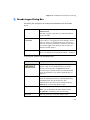
Objective
Answers the Question
Measuring end-user response
time
How long does it take to complete a business
process?
Defining optimal hardware
configuration
Which hardware configuration provides the
best performance?
Checking reliability
How hard or long can the system work without
errors or failures?
Checking hardware or software
upgrades
How does the upgrade affect performance or
reliability?
Evaluating new products
Which server hardware or software should you
choose?
Measuring system capacity
How much load can the system handle
without significant performance degradation?
Identifying bottlenecks
Which element is slowing down response
time?
This section also includes:
➤
"Measuring End-User Response Time" on page 36
➤
"Defining Optimal Hardware Configuration" on page 36
➤
"Checking Reliability" on page 36
➤
"Checking Hardware or Software Upgrades" on page 37
➤
"Evaluating New Products" on page 37
➤
"Identifying Bottlenecks" on page 37
➤
"Measuring System Capacity" on page 38
35
Chapter 3 • Planning Load Test Scenarios
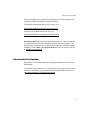
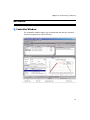
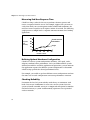
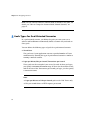
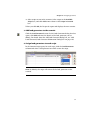
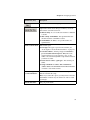
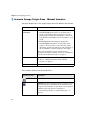
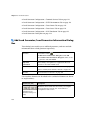
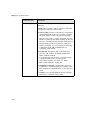
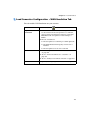
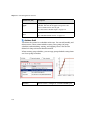
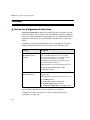
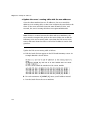
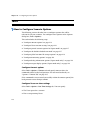
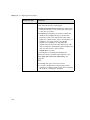
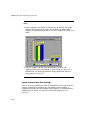
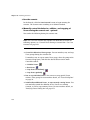
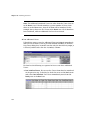
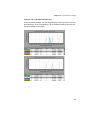
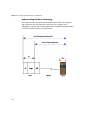
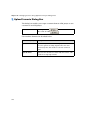
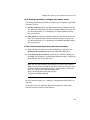
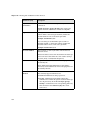
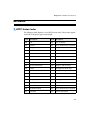
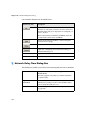
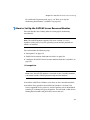
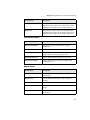
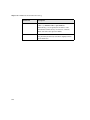
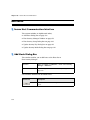
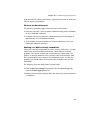
Measuring End-User Response Time
Check how long it takes for the user to perform a business process and
receive a response from the server. For example, suppose that you want to
verify that while your system operates under normal load conditions, the
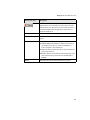
end users receive responses to all requests within 20 seconds. The following
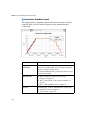
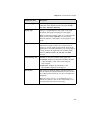
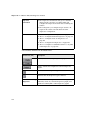
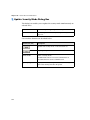
graph presents a sample load vs. response time measurement for a banking
application:
80
Response
Time
(seconds)
Check account
information
60
40
Login
20
0
0
10
20
30
40
50
Number of Users
Defining Optimal Hardware Configuration
Check how various system configurations (memory, CPU speed, cache,
adaptors, modems) affect performance. Once you understand the system
architecture and have tested the application response time, you can measure
the application response for different system configurations to determine
which settings provide the desired performance levels.
For example, you could set up three different server configurations and run
the same tests on each configuration to measure performance variations.
Checking Reliability
Determine the level of system stability under heavy or continuous work
loads. You can use LoadRunner to create stress on the system: force the
system to handle extended activity in a compressed time period to simulate
the kind of activity a system would normally experience over a period of
weeks or months.
36
Chapter 3 • Planning Load Test Scenarios
Checking Hardware or Software Upgrades
Perform regression testing to compare a new release of hardware or software
to an older release. You can check how an upgrade affects response time
(benchmark) and reliability. Application regression testing does not check
new features of an upgrade; rather it checks that the new release is as
efficient and reliable as the older release.
Evaluating New Products
You can run tests to evaluate individual products and subsystems during the
planning and design stage of a product’s life cycle. For example, you can
choose the hardware for the server machine or the database package based
on evaluation tests.
Identifying Bottlenecks
You configure the LoadRunner monitoring components to identify
bottlenecks on the system and determine which element is causing
performance degradation, for example, file locking, resource contention,
and network overload. Use LoadRunner in conjunction with the new
network and machine monitoring tools to create load and measure
performance at different points in the system. For more information on
monitoring, see "Monitoring Process Overview" on page 442.
37
Chapter 3 • Planning Load Test Scenarios
Measuring System Capacity
Measure system capacity, and determine how much excess capacity the
system can handle without performance degradation. To check capacity,
you can compare performance versus load on the existing system, and
determine where significant response-time degradation begins to occur. This
is often called the “knee” of the response time curve.
Once you determine the current capacity, you can decide if resources need
to be increased to support additional users.
38
Chapter 3 • Planning Load Test Scenarios
Tasks
How to Plan a Load Test
This task describes how to plan a load test.
This task includes the following steps:
➤
"Analyze the application" on page 39
➤
"Define the load testing objectives" on page 39
➤
"Plan LoadRunner implementation" on page 39
1 Analyze the application
You should become thoroughly familiar with the hardware and software
components, the system configuration, and the typical usage model. This
analysis ensures that the testing environment you create using
LoadRunner will accurately reflect the environment and configuration of
the application under test. For task details, see "How to Analyze the
Application" on page 40.
2 Define the load testing objectives
Before you begin testing, you should define exactly what you want to
accomplish. For task details, see "How to Define the Load Test Objectives"
on page 43.
3 Plan LoadRunner implementation
Decide how to use LoadRunner to achieve your testing goals. For task
details, see "How to Plan the LoadRunner Implementation" on page 44.
39
Chapter 3 • Planning Load Test Scenarios
How to Analyze the Application
This task describes how to analyze the application under test as part of the
load test planning process. Each step in this task contains example
information relating to an online banking system.
This task includes the following steps:
➤
"Identify system components" on page 40
➤
"Describe the system configuration" on page 41
➤
"Analyze the usage mode" on page 42
➤
"Examine task distribution" on page 42
1 Identify system components
Draw a schematic diagram to illustrate the structure of the application. If
possible, extract a schematic diagram from existing documentation. If the
application under test is part of a larger network system, you should
identify the component of the system to be tested. Make sure the diagram
includes all system components, such as client machines, network,
middleware, and servers.
40
Chapter 3 • Planning Load Test Scenarios
Example
The following diagram illustrates an online banking system that is
accessed by many Web users. The Web users each connect to the same
database to transfer funds and check balances. The customers connect to
the database server through the Web, using multiple browsers.
2 Describe the system configuration
Enhance the schematic diagram with more details. Describe each system
component’s configuration. You should be able to answer the following
questions:
➤
How many users are anticipated to connect to the system?
➤
What is the application client’s machine configuration (hardware,
memory, operating system, software, development tool, and so forth)?
➤
What types of database and Web servers are used (hardware, database
type, operating system, file server, and so forth)?
➤
How does the server communicate with the application client?
➤
What is the middleware configuration and application server between
the front-end client and back-end server?
➤
What other network components may affect response time (modems
and so forth)?
➤
What is the throughput of the communications devices? How many
concurrent users can each device handle?
41
Chapter 3 • Planning Load Test Scenarios
Example
The schematic diagram of the online banking system specified that there
are multiple application clients accessing the system.
Front-End Client Configuration
Anticipated number of application
clients
50 concurrent application clients
Hardware / Memory
Pentium IV/ 1GB
Operating system & version
Windows 2003
Client browser
Internet Explorer 6.0 SP1
3 Analyze the usage mode
Define how the system is typically used, and decide which functions are
important to test. Consider who uses the system, the number of each type
of user, and each user’s common tasks. In addition, consider any
background load that might affect the system response time.
Example
Suppose 200 employees log on to the accounting system every morning,
and the same office network has a constant background load of 50 users
performing various word processing and printing tasks. You could create a
LoadRunner scenario with 200 virtual users signing in to the accounting
database, and check the server response time.
To check how background load affects the response time, you could run
your scenario on a network where you also simulate the load of
employees performing word processing and printing activities.
4 Examine task distribution
In addition to defining the common user tasks, examine the distribution
of these tasks.
42
Chapter 3 • Planning Load Test Scenarios
Example
Suppose the bank uses a central database to serve clients across many
states and time zones. The 250 application clients are located in two
different time zones, all connecting to the same Web server. There are 150
in Chicago and 100 in Detroit. Each begins their business day at 9:00 AM,
but since they are in different time zones, there should never be more
than 150 users signing in at any given time. You can analyze task
distribution to determine when there is peak database activity, and which
activities typically occur during peak load time.
How to Define the Load Test Objectives
This task describes how to define the load test objectives as part of the load
test planning process.
This task includes the following steps:
➤
"Decide on general objectives" on page 43
➤
"State the objectives in measurable terms" on page 43
➤
"Decide when to test" on page 44
1 Decide on general objectives
For a list of suggested testing objectives, see "Examining Load Testing
Objectives" on page 49.
2 State the objectives in measurable terms
Once you decide on your general load testing objectives, you should
identify more focused goals by stating your objectives in measurable
terms. To provide a baseline for evaluation, determine exactly what
constitutes acceptable and unacceptable test results.
Example
General Objective. Product Evaluation: choose hardware for the Web
server.
43
Chapter 3 • Planning Load Test Scenarios
Focused Objective. Product Evaluation: run the same group of 300 virtual
users on two different servers, HP and NEC. When all 300 users
simultaneously browse the pages of your Web application, determine
which hardware gives a better response time.
3 Decide when to test
Load testing is necessary throughout the product life cycle. The following
table illustrates what types of tests are relevant for each phase of the
product life cycle:
Planning
and Design
Development
Deployment
Production
Evolution
Evaluate new
products
Measure
response time
Check
reliability
Measure
response
time
Check HW or
SW upgrades
Measure
response
time
Check optimal
hardware
configuration
Measure
response time
Identify
bottlenecks
Measure
system
capacity
Check HW or
SW upgrades
Measure
system
capacity
Check
reliability
How to Plan the LoadRunner Implementation
This task describes how to plan the LoadRunner implementation as part of
the load test planning process.
This task includes the following steps:
44
➤
"Define the scope of performance measurements" on page 45
➤
"Define Vuser activities" on page 47
➤
"Select Vusers" on page 47
➤
"Choose testing hardware/software" on page 48
Chapter 3 • Planning Load Test Scenarios
1 Define the scope of performance measurements
You can use LoadRunner to measure response time at different points in
the application. Determine where to run the Vusers and which Vusers to
run according to the test objectives:
➤
Measuring end-to-end response time. You can measure the response time
that a typical user experiences by running a GUI Vuser at the front end.
GUI Vusers emulate real users by submitting input to and receiving
output from the client application.
You can run GUI Vusers at the front end to measure the response time
across the entire network, including a terminal emulator or GUI front
end, network, and server.
➤
Measuring network and server response times. You can measure network
and server response time, excluding response time of the GUI front end,
by running Vusers (not GUI) on the client machine. Vusers emulate client
calls to the server without the user interface. When you run many Vusers
from the client machine, you can measure how the load affects network
and server response time.
➤
Measuring GUI response time. You can determine how the client
application interface affects response time by subtracting the previous
two measurements:
45
Chapter 3 • Planning Load Test Scenarios
GUI response time = end-to-end - network and server
46
➤
Measuring server response time. You can measure the time it takes for the
server to respond to a request without going across the network. When
you run Vusers on a machine directly connected to the server, you can
measure server performance.
➤
Measuring middleware-to-server response time. You can measure
response time from the server to middleware if you have access to the
middleware and its API. You can create Vusers with the middleware API
and measure the middleware-server performance.
Chapter 3 • Planning Load Test Scenarios
2 Define Vuser activities
Create Vuser scripts based on your analysis of Vuser types, their typical
tasks, and your test objectives. Since Vusers emulate the actions of a
typical end-user, the Vuser scripts should include the typical end-user
tasks. For example, to emulate an online banking client, you should
create a Vuser script that performs typical banking tasks. You would
browse the pages that you normally visit to transfer funds or check
balances.
You decide which tasks to measure based on your test objectives and
define transactions for these tasks. Transactions measure the time that it
takes for the server to respond to tasks submitted by Vusers (end-to-end
time). For example, to check the response time of a bank Web server
supplying an account balance, define a transaction for this task in the
Vuser script.
In addition, you can emulate peak activity by using rendezvous points in
your script. Rendezvous points instruct multiple Vusers to perform tasks
at exactly the same time. For example, you can define a rendezvous to
emulate 70 users simultaneously updating account information.
3 Select Vusers
Before you decide on the hardware configuration to use for testing,
determine the number and type of Vusers required. To decide how many
Vusers and which types to run, look at the typical usage model, combined
with the testing objectives. Some general guidelines are:
➤
Use one or a few GUI users to emulate each type of typical user
connection.
➤
Run multiple Vusers to generate the rest of the load for each user type.
For example, suppose that you have five kinds of users, each performing a
different business process:
Usage Model
GUI
Other
100 customer service users in New York (LAN connection)
2
98
30 customers in Europe (dial-in ISDN connection)
2
28
47
Chapter 3 • Planning Load Test Scenarios
Usage Model
GUI
Other
5 background batch processes
_
5
150 customers (terminal connection)
_
_
6 managers
2
4
4 Choose testing hardware/software
The hardware and software should be powerful and fast enough to
emulate the required number of virtual users. Refer to the HP LoadRunner
Installation Guide for specific hardware requirements.
To decide on the number of machines and correct configuration, consider
the following:
➤
It is advisable to run HP LoadRunner Controller on a separate
machine.
➤
Each GUI Vuser requires a separate Windows-based machine; several
GUI Vusers can run on a single UNIX machine.
➤
Configuration of the test machine for GUI Vusers should be as similar
as possible to the actual user’s machine.
Note: The results file requires a few MB of disk space for a long scenario
run with many transactions. The load generators also require a few MB of
disk space for temporary files if there is no NFS. For more information
about run-time file storage, see "Run-Time File Storage Locations" on
page 213.
48
Chapter 3 • Planning Load Test Scenarios
Reference
Examining Load Testing Objectives
Your test plan should be based on a clearly defined testing objective. This
section presents an overview of common testing objectives:
This section includes:
➤
Measuring End-User Response Time
➤
Defining Optimal Hardware Configuration
➤
Checking Reliability
➤
Checking Hardware or Software Upgrades
➤
Evaluating New Products
➤
Identifying Bottlenecks
➤
Measuring System Capacity
49
Chapter 3 • Planning Load Test Scenarios
Measuring End-User Response Time
Check how long it takes for the user to perform a business process and
receive a response from the server. For example, suppose that you want to
verify that while your system operates under normal load conditions, the
end users receive responses to all requests within 20 seconds. The following
graph presents a sample load vs. response time measurement for a banking
application:
80
Response
Time
(seconds)
Check account
information
60
40
Login
20
0
0
10
20
30
40
50
Number of Users
Defining Optimal Hardware Configuration
Check how various system configurations (memory, CPU speed, cache,
adaptors, modems) affect performance. Once you understand the system
architecture and have tested the application response time, you can measure
the application response for different system configurations to determine
which settings provide the desired performance levels.
For example, you could set up three different server configurations and run
the same tests on each configuration to measure performance variations.
Checking Reliability
Determine the level of system stability under heavy or continuous work
loads. You can use LoadRunner to create stress on the system: force the
system to handle extended activity in a compressed time period to simulate
the kind of activity a system would normally experience over a period of
weeks or months.
50
Chapter 3 • Planning Load Test Scenarios
Checking Hardware or Software Upgrades
Perform regression testing to compare a new release of hardware or software
to an older release. You can check how an upgrade affects response time
(benchmark) and reliability. Application regression testing does not check
new features of an upgrade; rather it checks that the new release is as
efficient and reliable as the older release.
Evaluating New Products
You can run tests to evaluate individual products and subsystems during the
planning and design stage of a product’s life cycle. For example, you can
choose the hardware for the server machine or the database package based
on evaluation tests.
Identifying Bottlenecks
You can run tests that identify bottlenecks on the system and determine
which element is causing performance degradation, for example, file
locking, resource contention, and network overload. Use LoadRunner in
conjunction with the new network and machine monitoring tools to create
load and measure performance at different points in the system. For more
information, see Part VI, "Monitoring a Scenario."
?
?
ISDN
WAN
Modem
Clients
?
?
Router
Application Server
Database
Server
51
Chapter 3 • Planning Load Test Scenarios
Measuring System Capacity
Measure system capacity, and determine how much excess capacity the
system can handle without performance degradation. To check capacity,
you can compare performance versus load on the existing system, and
determine where significant response-time degradation begins to occur. This
is often called the “knee” of the response time curve.
Once you determine the current capacity, you can decide if resources need
to be increased to support additional users.
52
4
Designing Scenarios
This chapter includes:
Concepts
➤
Load Test Scenarios Overview on page 54
➤
Manual Scenarios on page 54
➤
Goals Types for Goal-Oriented Scenarios on page 56
Tasks
➤
How to Design a Goal-Oriented Scenario on page 60
➤
How to Design a Manual Scenario on page 62
➤
How to Change the Scenario Mode (Manual Scenario) on page 65
➤
How to View/Modify Scripts in the Scenario on page 65
Reference
➤
Relative Paths for Scripts on page 70
➤
Vuser Statuses on page 71
➤
Design View User Interface on page 72
53
Chapter 4 • Designing Scenarios
Concepts
Load Test Scenarios Overview
To test your system with LoadRunner, you must create a load test scenario.
A scenario defines the events that occur during each testing session. It
defines and controls the number of users to emulate, the actions that they
perform, and the machines on which they run their emulations.
Before you design a scenario, you should have a a well-defined test plan in
mind. For more details, see "Planning Load Test Scenarios" on page 33.
You design scenarios in the Design tab of the Controller. After you design
the scenario, LoadRunner saves the information in a scenario file (.lrs).
You can design the following types of scenarios:
➤
Manual Scenarios
➤
Goals Types for Goal-Oriented Scenarios
Manual Scenarios
You build a manual scenario by selecting scripts to run, assigning load
generators on which to run the scripts, and distributing Vusers to run
among the scripts.
You can design a manual scenario in one of the following modes:
54
➤
Vuser group mode. In this mode, each script you select for the scenario is
assigned to a Vuser group. You assign a number of Vusers to each Vuser
group that you create. You can instruct all Vusers in a group to run the
same script on the same load generator, or you can assign different scripts
and load generators to the various Vusers in a group.
➤
Percentage mode. In this mode, you define a total number of Vusers to be
used in the scenario, and assign load generators and a percentage of the
total number of Vusers to each script.
Chapter 4 • Designing Scenarios
After you define which Vuser groups/scripts to run in the scenario, you
select or build a schedule by which to run the scenario. For more
information, see "Scheduling Manual Scenarios" on page 127.
You can also create service level agreements (SLAs) which are specific goals
that you define for your load test scenario. When you run the scenario,
LoadRunner gathers and stores performance-related data. When you analyze
the run, Analysis compares this data against the SLAs and determines SLA
statuses for the defined measurements. For more information, see "Service
Level Agreements" on page 161.
Changing Scenario Modes
You can convert a scenario from the Vuser group mode to the percentage
mode and vice versa.
The following table describes what happens to the scenario when
converting from the one mode to the other:
Vuser group mode to
percentage mode
➤ If a Vuser group contains multiple scripts, in
percentage mode the scripts are listed one by one
in the Scenario Scripts pane.
➤ In the percentage mode, all load generators are
assigned to all Vuser scripts by default. If multiple
load generators are assigned to a Vuser group, the
Vusers assigned to the scripts in the percentage
mode are distributed evenly among the load
generators originally assigned to the group.
If you defined group schedules for the Vuser groups,
these settings will be lost. All profiles will contain
schedule by scenario settings only. For details about
scheduling scenarios, see "Scheduling Manual
Scenarios" on page 127.
Percentage mode to Vuser
group mode
➤ Each script is converted to a Vuser group.
➤ If you defined multiple load generators for a
Vuser script, the Vuser group that is created when
converting the scenario will also contain
multiple load generators.
➤ If a schedule is defined for the scenario, all the
schedule settings remain unchanged.
55
Chapter 4 • Designing Scenarios
Note: You can convert from one scenario mode to another at any time. For
details, see "How to Change the Scenario Mode (Manual Scenario)" on
page 65.
Goals Types for Goal-Oriented Scenarios
In a goal-oriented scenario, you define the goals you want your test to
achieve and LoadRunner automatically builds a scenario for you based on
these goals.
You can define the following types of goals for a goal-oriented scenario:
➤
Virtual Users
This goal tests if your application can run a specified number of Vusers
simultaneously. Running this type of goal-oriented scenario is similar to
running a manual scenario.
➤
Pages per Minute/Hits per Second/Transactions per Second
These goals test the strength of your server. For each of these goal types,
you specify a minimum-maximum range of Vusers for the scenario to run,
and in the case of the Transactions per Second goal type, you also specify
a transaction name.
Note:
56
➤
Pages per Minute and Hits per Second goals are for Web Vusers only.
➤
Hits per second relates to HTTP requests per second.
Chapter 4 • Designing Scenarios
When you define one of these goal type, the Controller divides the target
defined by the minimum number of Vusers specified, and determines the
target number of hits/transactions per second or pages per minute that
each Vuser should reach.
The Controller then begins loading the Vusers according to the load
behavior settings you defined, as follows:
➤
If you selected to run the Vusers automatically, LoadRunner loads 50
Vusers in the first batch. If the maximum number of Vusers defined is
less than 50, LoadRunner loads all of the Vusers simultaneously.
➤
If you chose to reach your target after a certain period of the scenario
elapses, LoadRunner attempts to reach the defined target within this
period of time. It determines the size of the first batch of Vusers based
on the time limit you defined and the calculated target number of hits,
transactions, or pages per Vuser.
➤
If you chose to reach your target by gradation (x number of pages/hits
every x amount of time), LoadRunner calculates the target number of
hits or pages per Vuser and determines the size of the first batch of
Vusers accordingly. (Not relevant for the Transactions per Second goal
type).
After running each batch of Vusers, LoadRunner evaluates whether the
target for the batch was achieved. If the batch target was not reached,
LoadRunner recalculates the target number of hits, transactions, or pages
per Vuser, and readjusts the number of Vusers for the next batch to be
able to achieve the defined goal. By default, a new batch of Vusers is
released every two minutes.
If the goal has not been reached after the Controller has launched the
maximum number of Vusers, LoadRunner attempts to reach the defined
target once more by recalculating the target number of hits, transactions,
or pages per Vuser, and running the maximum number of Vusers
simultaneously.
A Pages per Minute or Hits/Transactions per Second goal-oriented
scenario is assigned a Failed status if:
➤
The Controller has twice attempted to reach the goal using the
maximum number of Vusers specified, and the goal could not be
reached
57
Chapter 4 • Designing Scenarios
➤
➤
No pages per minute or hits/transactions per second were registered
after the first batch of Vusers was run
➤
The number of pages per minute or hits/transactions per second did
not increase after the Controller ran a certain number of Vuser batches
➤
All the Vusers that ran failed
➤
There were no available load generators for the type of Vusers you
attempted to run
Transaction Response Time
This goal tests how many Vusers can be run simultaneously without
exceeding a desired transaction response time. You specify the name of
the transaction in your script that you want to test, and a
minimum-maximum range of Vusers for LoadRunner to run. The
transaction response time you specify should be a predefined threshold
value.
For example, if you do not want a customer to wait more than five
seconds to log in to your e-commerce site, specify a maximum acceptable
transaction response time of five seconds. Set the minimum and
maximum number of Vusers to the minimum-maximum range of
customers you want to be able to serve simultaneously.
If the scenario does not reach the maximum transaction response time
that you defined, your server is capable of responding within a reasonable
period of time to the number of customers you want to be able to serve
simultaneously. If the defined response time is reached after only a
portion of the Vusers has been executed, or if you receive a message that
the defined response time will be exceeded if the Controller uses the
maximum number of Vusers defined, you should consider revamping
your application and/or upgrading your server software and hardware.
58
Chapter 4 • Designing Scenarios
Notes about Transactions per Second or Transaction Response Time
goals:
➤
To achieve a Transactions per Second or Transaction Response Time
goal, your script must contain transactions. For each of these goal
types, you define the transaction in the script that you want to test.
➤
For a Transaction Response Time goal-oriented scenario to be effective,
you must choose your transaction carefully, ensuring that it performs
effective hits on the server.
59
Chapter 4 • Designing Scenarios
Tasks
How to Design a Goal-Oriented Scenario
This task describes how to design a goal-oriented scenario. In this type of
scenario, you define the goals you want your test to achieve and
LoadRunner automatically builds a scenario for you based on these goals.
This task includes the following steps:
➤
"Prerequisites" on page 60
➤
"Open a new goal-oriented scenario" on page 60
➤
"Add load generators to the scenario" on page 61
➤
"Assign load generators to each script" on page 61
➤
"Define a goal for the scenario" on page 62
➤
"Assign each script a percentage of the total scenario target" on page 62
➤
"Define service level agreements for the scenario - optional" on page 62
1 Prerequisites
➤
Before setting up the scenario, decide which goal you want the
scenario to reach. For details on types of scenario goals, see "Goals
Types for Goal-Oriented Scenarios" on page 56.
➤
Before you start designing the scenario, record the VuGen scripts that
will run in the scenario. For details, see the HP Virtual User Generator
User Guide.
2 Open a new goal-oriented scenario
a On the Controller toolbar, click the New Scenario button.
b In the New Scenario dialog box that opens, select Goal-oriented
Scenario.
60
Chapter 4 • Designing Scenarios
c Select scripts to run in the scenario. Select scripts in the Available
Scripts box, and click Add to move them to the Scripts in Scenario
box.
When you click OK, the Design tab opens and displays the new scenario.
3 Add load generators to the scenario
Click the Load Generators button. In the Load Generators dialog box that
opens, click Add and enter the details of the load generator you are
adding. For details about the Add Load Generator dialog box, see "Add
Load Generator/Load Generator Information Dialog Box" on page 108.
4 Assign load generators to each script
In the Scenario Scripts pane, for each script, click the Load Generators
column and select a load generator on which to run the script.
Note: By default, the script will run on all the load generators in the
scenario.
61
Chapter 4 • Designing Scenarios
5 Define a goal for the scenario
In the Scenario Goal pane, click the Edit Scenario Goal button. In the
dialog box that opens, define the goal the scenario should reach. For
details about filling in the scenario goal details, see "Edit Scenario Goal
Dialog Box" on page 78.
6 Assign each script a percentage of the total scenario target
In the Scenario Scripts pane’s % of Target column, enter the percentage of
the total goal you want each script to reach during the scenario.
Note: Assign percentages to the scripts starting with the first script in the
list and moving down the list.
7 Define service level agreements for the scenario - optional
You can define service level agreements (SLAs) to measure scenario goals
over time intervals, or over a whole scenario run. When you later analyze
the run using HP LoadRunner Analysis, this data is compared against the
SLAs and SLA statuses are determined for the defined measurements. To
define SLAs, see "How to Define Service Level Agreements" on page 164.
How to Design a Manual Scenario
This task describes how to design a manual scenario.
This task includes the following steps:
62
➤
"Open a scenario, or create a new one" on page 63
➤
"Add Vuser groups/scripts to the scenario" on page 64
➤
"Define a schedule for the scenario" on page 64
➤
"Define service level agreements for the scenario - optional" on page 65
Chapter 4 • Designing Scenarios
1 Prerequisites
➤
When designing a manual scenario, plan how you want to distribute
the Vusers in the scenario. For more details, see "Manual Scenarios" on
page 54.
➤
Before you start designing the scenario, record the VuGen scripts that
will run in the scenario. For details, see the HP Virtual User Generator
User Guide.
2 Open a scenario, or create a new one
a On the main Controller toolbar, click the New Scenario button.
b In the New Scenario dialog box, select Manual Scenario.
c (Optional) To distribute the Vusers by percentage, select the Use the
Percentage mode... option.
Note: You can convert from one scenario mode to another at any time.
For details, see "How to Change the Scenario Mode (Manual Scenario)"
on page 65.
d (Optional) Select scripts to participate in the scenario. If you do not
select the scripts here, you can select them in the step.
When you click OK, the scenario opens in the Design tab.
3 Add load generators to the scenario
Click the Load Generators button. In the Load Generators dialog box that
opens, click Add and enter the details of the load generator you are
adding. For details about adding load generators, see "Add Load
Generator/Load Generator Information Dialog Box" on page 108.
63
Chapter 4 • Designing Scenarios
4 Add Vuser groups/scripts to the scenario
Vuser Group Mode: In the Scenario Groups pane, create Vuser groups to
participate in the scenario. To create a group:
a Click the Add Group button.
b In the Add Group dialog box:
➤
Give the group a name and assign a number of Vusers to the group.
➤
Select a load generator on which to run the Vusers.
➤
Select a Vuser script.
Percentage Mode: In Scenario Scripts pane, add groups to participate in
the scenario as follows:
a Click the Add Group button and select a Vuser script from the list.
b In the Scenario Scripts pane’s Load Generator column, select load
generators on which to run the scripts.
Note: By default, the script will run on all the load generators in the
scenario.
c When you have selected all the scripts for the scenario, in the Scenario
Scripts pane’s % column assign a percentage of the total number of
Vusers to each script. Assign percentages to the scripts starting with the
first script in the table and moving down the list.
Note: The total number of Vusers for the scenario is defined in the
scenario schedule. See below.
5 Define a schedule for the scenario
Define a schedule by which to run the Vusers in the scenario. For details,
see "How to Define a Schedule for the Scenario - Workflow" on page 132.
64
Chapter 4 • Designing Scenarios
6 Define service level agreements for the scenario - optional
You can define service level agreements (SLAs) to measure scenario goals
over time intervals, or over a whole scenario run. When you later analyze
the run using HP LoadRunner Analysis, this data is compared against the
SLAs and SLA statuses are determined for the defined measurements. To
define SLAs, see "How to Define Service Level Agreements" on page 164.
How to Change the Scenario Mode (Manual Scenario)
This task describes how to change a manual scenario from Vuser group
mode to percentage mode, and vice versa.
For details about the scenario modes and the effects of changing from one to
another, see "Manual Scenarios" on page 54.
➤
To convert the scenario from Vuser group mode to percentage mode,
select Scenario > Convert Scenario to the Percentage Mode.
➤
To convert the scenario from percentage mode to Vuser group mode,
select Scenario > Convert Scenario to the Vuser Group Mode.
Note: By default, every time you convert from one mode to another, a
message appears warning you that scenario and schedule settings may
change. To show/hide this warning message, select Scenario > Show
Convert Scenario Mode Warning.
How to View/Modify Scripts in the Scenario
This section describes how to view and modify scripts used in your load test
scenario.
You view/modify the details of the scripts in the Group Information dialog
box (see "Group Information Dialog Box" on page 81) or in the Script
Information dialog box (see "Script Information Dialog Box" on page 94).
65
Chapter 4 • Designing Scenarios
➤
"View script details" on page 66
➤
"Modify a script’s run-time settings" on page 67
➤
"View/Edit a script in VuGen" on page 68
➤
"Specify command line options" on page 68
➤
"View rendezvous points included in the script" on page 69
➤
"View Vusers associated with the script" on page 69
➤
"View files associated with the script" on page 69
View script details
You can view the details of a script by right-clicking the script in the
Scenario Groups/Scripts pane and selecting Details.
In the Group/Script Information dialog box that opens, you can:
➤
View details about the script, including:
Note: If you do not see some of the details listed below, click More.
➤
66
➤
Script path
➤
Command line options (see "Specify command line options" on
page 68)
➤
Rendezvous points included in the script (see "View rendezvous points
included in the script" on page 69)
➤
Vusers associated with the script (see "View Vusers associated with the
script" on page 69)
➤
Files associated with the script (see "View files associated with the
script" on page 69)
Open the script in VuGen by clicking the View Script button (see "View/
Edit a script in VuGen" on page 68)
Chapter 4 • Designing Scenarios
➤
View the script’s run-time settings by clicking the Run-Time Settings
button (see "Modify a script’s run-time settings" on page 67 and "Modify
multiple scripts’ run-time settings" on page 67).
Modify a script’s run-time settings
➤
To view or modify a script’s run-time settings, in the Scenario Groups/
Scripts pane right-click the script and select Run-Time Settings.
➤
To view or modify run-time settings of a script associated with a particular
Vuser, in the Vusers dialog box (Scenario Groups pane > Vusers)
right-click the Vuser and select Run-Time Settings.
Modifying the run-time settings for one Vuser in a group modifies the
run-time settings for all the Vusers in that group that are using the same
script.
➤
To modify run-time settings for multiple scripts, see "Modify multiple
scripts’ run-time settings" below).
Note:
➤
For details about specific run-time settings, see the HP Virtual User
Generator User Guide.
➤
When you modify the run-time settings from the Controller,
LoadRunner runs the script using the modified settings.
Modify multiple scripts’ run-time settings
This section describes how to modify run-time settings of multiple scripts or
of a Vuser group that includes multiple scripts.
1 In the Scenario Groups/Scripts pane select multiple scripts or the Vuser
group that includes multiple scripts.
2 Right-click the selection and select Run-Time Settings.
67
Chapter 4 • Designing Scenarios
3 In the Multiple Run-Time Settings Mode dialog box that opens:
➤
To modify run-time settings for all of the scripts simultaneously, click
Shared RTS.
➤
To modify run-time settings per script, click Individual RTS.
For user interface details, see "Multiple Run-Time Settings Mode Dialog
Box" on page 83.
Note:
➤
For details about specific run-time settings, see the HP Virtual User
Generator User Guide.
➤
When you modify the run-time settings from the Controller,
LoadRunner runs the script using the modified settings.
View/Edit a script in VuGen
To view/edit a script included in your scenario, right-click the script and
select View Script. The script opens in VuGen. For more information on
editing scripts, see the HP Virtual User Generator User Guide.
Specify command line options
You can specify command line options to use when running a script.
1 In the Scenario Groups/Scripts pane, right-click the script and select
Details.
2 In the Group/Script Information dialog box that opens, if Command line
is not displayed near the bottom, click More.
3 Enter a command in the command line, for example: -x value -y value.
For information about passing command line argument values to a script,
see the HP Virtual User Generator User Guide.
68
Chapter 4 • Designing Scenarios
View rendezvous points included in the script
1 In the Scenario Groups/Scripts pane, right-click the script and select
Details.
2 In the Group/Script Information dialog box, if the Rendezvous tab is not
displayed near the bottom, click More.
If there are rendezvous points included in the script, they are displayed in
the Rendezvous tab. For details about rendezvous points, see "Rendezvous
Points Overview" on page 314.
View Vusers associated with the script
1 In the Scenario Groups/Scripts pane, right-click the script and select
Details.
2 In the Group/Script Information dialog box, if the Vusers tab is not
displayed near the bottom, click More.
The Vusers tab displays the Vusers associated with the script.
View files associated with the script
1 In the Scenario Groups/Scripts pane, right-click the script and select
Details.
2 In the Group/Script Information dialog box, if the Files tab is not
displayed near the bottom, click More.
By default, the Files tab lists all the files in the script’s directory (only after
your script has been added to the script list). These files include the
configuration settings file, the init, run, and end portions of the script,
the parameterization definitions file, and the .usr file. To add a file to the
list, click Add.
Example
To run Visual C++ Vusers on a remote load generator, you must add the
.dll of the Vuser to the list of files.
You can delete the files that you add, but not the other files listed.
69
Chapter 4 • Designing Scenarios
Reference
Relative Paths for Scripts
You can specify a relative location for a script in your scenario. The location
can be relative to the current scenario directory, or relative to the
LoadRunner installation directory.
When you run a scenario, the script is automatically copied from this
relative location to a temporary directory on the load generator running the
script. This enables the load generator to access the script locally instead of
over a network.
To specify a path relative to the current scenario director, type either of the
following notations at the start of the script path:
Notation
Description
.\
Indicates that the path is relative to the location of
the scenario directory
..\
Indicates that the path is relative to the location of
the parent directory of the scenario directory
For example, if the current scenario is located at F:\scenarios, to specify that
the script, user1, is located in F:\scenarios\scripts, you could type:
.\scripts\user1
To specify a path relative to the LoadRunner installation directory, type a
percent sign (%) at the beginning of the script path. For example, if the
LoadRunner installation directory is located at F:\LoadRunner, to specify
that the script, user1, is located in F:\LoadRunner\scripts, you could type:
%\scripts\user1
70
Chapter 4 • Designing Scenarios
Note: When specifying a relative path, you can include standard DOS
notation (.\ and ..\) inside the path, as shown in the following example:
M:\LR\my_tests\..\..\test.usr.
Vuser Statuses
The following table describes the possible statuses of Vusers before, during,
and after a scenario run.
Status
Description
Down
The Vuser is down.
Pending
The Vuser is ready to be initialized and is waiting for an
available load generator, or is transferring files to the load
generator. The Vuser will run when the conditions set in its
scheduling attributes are met.
Initializing
The Vuser is being initialized on the remote machine.
Ready
The Vuser already performed the init section of the script
and is ready to run.
Running
The Vuser is running. The Vuser script is being executed on
a load generator.
Rendezvous
The Vuser has arrived at the rendezvous point and is
waiting to be released by LoadRunner.
Done.Passed
The Vuser has finished running. The script passed.
Done.Failed
The Vuser has finished running. The script failed.
Error
A problem occurred with the Vuser. Check the Status field
on the Vuser dialog box or the output window for a
complete explanation of the error.
Gradual Exiting
The Vuser is completing the iteration or action it is running
(as defined in Tools > Options > Run-Time Settings) before
exiting.
71
Chapter 4 • Designing Scenarios
Status
Description
Exiting
The Vuser has finished running or has been stopped, and is
now exiting.
Stopped
The Vuser stopped when the Stop command was invoked.
Design View User Interface
This section includes (in alphabetical order):
72
➤
Add Group Dialog Box on page 73
➤
Add Script Dialog Box on page 74
➤
Add Vusers Dialog Box on page 75
➤
Design Tab on page 77
➤
Edit Scenario Goal Dialog Box on page 78
➤
Group Information Dialog Box on page 81
➤
Multiple Run-Time Settings Mode Dialog Box on page 83
➤
New Scenario Dialog Box on page 84
➤
Scenario Goal Pane on page 86
➤
Scenario Groups/Scripts Pane - Manual Scenarios on page 88
➤
Scenario Scripts Pane - Goal-Oriented Scenarios on page 91
➤
Script Information Dialog Box on page 94
➤
Vuser Information Dialog Box on page 96
➤
Vusers Dialog Box on page 98
Chapter 4 • Designing Scenarios
Add Group Dialog Box
This dialog box enables you to add Vuser groups to participate in a scenario.
To access
Manual scenario > Design tab > Scenario Groups/Scripts
pane > Add Group
Important
information
While a scenario is running, you can add Vuser groups to
the scenario and enable them. However, if you add a
Vuser group after all the Vusers in the scenario have
started running, the new group will not run in the
scenario.
Relevant tasks
"How to Design a Manual Scenario" on page 62
User interface elements are described below:
UI Elements (A-Z)
Description
Enables you to add Vuser scripts to the list of scripts.
Note: To add a VB Vuser script, select the .usr file.
Opens VuGen where you can record a Vuser script. For
more information on recording Vuser scripts, see the HP
Virtual User Generator User Guide.
Group Name
The name of the Vuser group.
When you select a script the Vuser group is automatically
given the same name as the script. You can modify the
group name.
Note: The name is limited to a maximum of 55
characters.
Load Generator
Name
The load generator assigned to the Vuser group.
To add a load generator to this list, select Add from the
list. For user interface details, see "Add Load Generator/
Load Generator Information Dialog Box" on page 108.
73
Chapter 4 • Designing Scenarios
UI Elements (A-Z)
Description
Select Script
Lists the available scripts that have been added to the
scenario. When you select a script, its name and path are
displayed above the list.
To display the scripts with their full paths, right-click the
list area and select Show Paths.
Note: If a script uses Unique file parameterization,
running more than one Vuser group with that script in
the same scenario may cause unexpected scenario results.
For more information about Unique file
parameterization, see the HP Virtual User Generator User
Guide.
Vuser Quantity
The number of Vusers to add to the group.
Add Script Dialog Box
This dialog box enables you to add Vuser scripts to a scenario.
To access
Use one of the following:
➤ All scenarios: Design tab > Right-click in Scenario
Scripts pane > Add Script
➤ Goal-oriented scenario: Design tab > Scenario Scripts
pane > Add Script
➤ Manual scenario (percentage mode): Design tab > Add
Group
Important
information
While a scenario is running, you can add scripts to the
scenario and enable them. However, if you add a script
after all the Vusers in the scenario have started running,
the added script will not run in the scenario.
Relevant tasks
➤ "How to Design a Manual Scenario" on page 62
➤ "How to Design a Goal-Oriented Scenario" on page 60
74
Chapter 4 • Designing Scenarios
User interface elements are described below:
UI Elements (A-Z)
Description
Enables you to add Vuser scripts to the list of scripts.
Note: To add a VB Vuser script, select the .usr file.
Opens VuGen where you can record a Vuser script. For
more information on recording Vuser scripts, see the HP
Virtual User Generator User Guide.
Select Script
Lists the scripts available for the scenario. When you
select a script, its name and path are displayed above the
list.
To display the scripts with their full paths, right-click the
list area and select Show Paths.
Add Vusers Dialog Box
This dialog box enables you to add Vusers to a Vuser group.
To access
➤ Design tab > Scenario Groups pane > Vusers
>
Add Vusers
Important
information
➤ Relevant for manual scenarios in Vuser group mode
only.
➤ Available when a group is selected in the Scenario
Groups pane.
See also
"Run/Stop Vusers Dialog Box" on page 279
75
Chapter 4 • Designing Scenarios
User interface elements are described below (unlabeled elements are shown
in angle brackets):
UI Elements (A-Z)
Description
Enables you to add Vuser scripts to the list of scripts.
Note: To add a VB Vuser script, select the .usr file.
Opens VuGen where you can record a Vuser script. For
more information on recording Vuser scripts, see the HP
Virtual User Generator User Guide.
Opens the Run-Time Settings dialog box, where you can
edit the script’s run-time settings.
When you modify the run-time settings from the
Controller, LoadRunner runs the script using the
modified settings.
Opens the Parameter list in VuGen where you can create,
view, modify, and delete script parameters. For details,
see the HP Virtual User Generator User Guide.
Group Name
The name of the group to which to add Vusers.
Load Generator
Name
The load generator assigned to the Vuser group.
Quantity to add
The number of Vusers to add to the Vuser group.
Select Script
Lists the scripts available for the scenario. When you
select a script, its name and path are displayed above the
list.
To add a load generator to this list, select Add from the
list. For user interface details, see "Add Load Generator/
Load Generator Information Dialog Box" on page 108.
To display the scripts with their full paths, right-click the
list area and select Show Paths.
76
Chapter 4 • Designing Scenarios
Design Tab
The Design tab enables you to design load test scenarios.
To access
Design tab
Relevant tasks
➤ "How to Design a Manual Scenario" on page 62
➤ "How to Design a Goal-Oriented Scenario" on page 60
➤ "How to Define a Schedule for the Scenario -
Workflow" on page 132
➤ "How to Define Service Level Agreements" on page 164
➤ "How to Change the Scenario Mode (Manual
Scenario)" on page 65
➤ "How to View/Modify Scripts in the Scenario" on
page 65
User interface elements are described below:
UI Elements (A-Z)
Description
Scenario Goal pane
In goal-oriented scenarios, displays information
regarding the scenario goal.
(Goal-oriented
scenario)
Scenario Groups
pane
(Manual scenario in
Vuser Group mode)
Scenario Scheduler
pane
(Manual scenario)
For user interface details, see "Scenario Goal Pane" on
page 86.
Displays the Vuser groups created for the scenario.
For user interface details, see "Scenario Groups/Scripts
Pane - Manual Scenarios" on page 88.
Displays the scenario schedule.
For user interface details, see "Scenario Schedule Pane" on
page 149.
77
Chapter 4 • Designing Scenarios
UI Elements (A-Z)
Description
Scenario Scripts pane
Displays the Vuser scripts selected for the scenario.
For user interface details:
➤ See "Scenario Groups/Scripts Pane - Manual Scenarios"
on page 88
➤ See "Scenario Scripts Pane - Goal-Oriented Scenarios"
on page 91
Service Level
Agreement pane
Lists the service level agreements defined for the
scenario.
For user interface details, see "Service Level Agreement
Pane" on page 173.
Edit Scenario Goal Dialog Box
This dialog box enables you to set goals for your scenario.
To access
Goal-oriented scenario > Design tab > Scenario Goal
pane > Edit Scenario Goal
Important
information
➤ Available for goal-oriented scenarios only.
➤ When you run a goal-oriented scenario, the goal you
defined is displayed in the appropriate graph, along
with the scenario results. This enables you to compare
the results with your target goal.
Relevant tasks
"How to Design a Goal-Oriented Scenario" on page 60
User interface elements are described below:
UI Elements (A-Z)
Description
Enables you to rename the selected goal profile.
Enables you to delete the selected goal profile.
78
Chapter 4 • Designing Scenarios
UI Elements (A-Z)
Description
Enables you to define a new goal profile.
Opens the Scenario Start dialog box where you can set
the scenario start time as follows:
➤ Without delay. As soon as the Start Scenario command
is issued.
➤ With a delay of HH:MM:SS. The specified time after
the Start Scenario command is issued.
➤ At HH:MM:SS on <date>. At a specified time on a
specified date.
Define Scenario Goal
The scenario goal:
➤ Goal Type. The type of goal. For more details, see
"Goals Types for Goal-Oriented Scenarios" on page 56.
➤ Transaction Name. (When goal type is Transactions
per second/Transaction Response Time) The static
script transaction for your scenario to test, or the
name of an automatic/dynamic script transaction that
you have recorded.
➤ Reach Goal of <value> <goal type>. The desired goal
limits.
➤ Using a minimum of <value> and a maximum of
<value> Vusers. The minimum and maximum number
of Vusers to use in the scenario.
Do not change
recorded think time
If selected, LoadRunner runs the scenario using the think
time recorded in the script.
Note: If you select this option, you may need to increase
the number of Vusers in your scenario in order to reach
your target.
Goal Profile Name
The goal profile name.
79
Chapter 4 • Designing Scenarios
UI Elements (A-Z)
Description
Load Behavior tab
Enables you to specify how and when the Controller
should reach the target.
Ramp Up. How the Vusers should start running.
➤ Automatic. The Controller starts running the default
number of Vusers in a batch, that is, 50 Vusers every
two minutes. If the maximum number of Vusers
defined is less than 50, then it runs all the Vusers.
➤ Reach target X after. The amount of scenario time
after which Controller should reach the target.
➤ Step up by. How rate at which the Controller should
reach the target (x number of Vusers/hits/pages every
x amount of time). (Not available for the Transactions
per Second and Transaction Response Time goal
types.)
Load Preview graph
A graphical representation of the goal and load behavior
defined for the scenario.
Scenario Settings tab
Enables you to specify the actions to take when the target
is reached, or if the target is not reached:
➤ Run Time. The amount of time (in hours, minutes, and
seconds) to run the scenario after the target has been
reached.
➤ If target cannot be reached. The action to be taken if
the target cannot be reached.
➤ Receive Notification. If selected, the Controller
sends an error message indicating that the target
could not be reached.
80
Chapter 4 • Designing Scenarios
Group Information Dialog Box
This dialog box displays details about the selected Vuser group, and enables
you to modify the group’s settings.
To access
Manual Scenario > Design tab > Scenario Groups pane >
Details
Important
information
➤ Relevant for manual scenarios in Vuser group mode
only.
➤ Available when a group is selected in the Scenario
Groups pane.
Relevant Tasks
➤ "How to Design a Manual Scenario" on page 62
➤ "How to View/Modify Scripts in the Scenario" on
page 65
User interface elements are described below:
UI Elements (A-Z)
Description
Updates script settings as follows:
➤ Script. If a script was modified during a scenario run,
updates the script details in the scenario.
➤ Run-Time Settings. If you modified a script’s run-time
settings from the Controller, restores the initial
run-time settings.
Opens VuGen where you can view and edit the script. For
more information on editing scripts, see the HP Virtual
User Generator User Guide.
Opens the Run-Time Settings dialog box, where you can
edit the Vuser script’s run-time settings.
When you modify the run-time settings from the
Controller, LoadRunner runs the script using the
modified settings. To restore the initial settings
previously set using VuGen, click the Refresh button and
select Run-Time Settings.
81
Chapter 4 • Designing Scenarios
UI Elements (A-Z)
Description
Command Line
The command line options to use when running the
script.
Example: -x value -y value.
For information about passing command line argument
values to a script, see the HP Virtual User Generator User
Guide.
Files tab
Displays all files used by the script, including the
configuration settings file, the init, run, and end portions
of the script, the parameterization definitions file, and
the .usr file.
➤ To exclude a file from the list, clear the check box
adjacent to it.
➤ To add a file or directory used by the script, click the
Add button.
Note: To run Visual C++ Vusers on a remote load
generator, you must add the .dll of the Vuser to this
list.
➤ You can delete the files that you add, but not the other
files listed.
Group Name
The name of the Vuser group.
To modify, type a new name in the Group Name box.
The name is limited to a maximum of 55 characters.
82
Load Generator
Name
The load generator assigned to the Vuser group.
Rendezvous tab
Displays the rendezvous points defined for the selected
script.
Script
The name, path, and type of the Vuser script selected for
the Vuser group.
Vusers tab
Displays all Vusers associated with the selected script.
To add a load generator to this list, select Add from the
list. For user interface details, see "Add Load Generator/
Load Generator Information Dialog Box" on page 108.
Chapter 4 • Designing Scenarios
Multiple Run-Time Settings Mode Dialog Box
This dialog box enables you to select the mode for modifying run-time
settings of multiple selected scripts.
To access
Use one of the following:
➤ In the Scenario Groups/Scripts pane, right-click a
multiple selection of scripts, and select Run-Time
Settings
➤ Right-click a Vuser group that includes multiple scripts
and select Run-Time Settings
Important
information
➤ If one of the selected scripts does not support shared
run-time settings, then you will only have the option
of modifying each script’s individual run-time settings
(Individual RTS).
➤ Shared RTS mode is disabled for GUI or Astra LoadTest
Vusers.
➤ Some run-time settings cannot be modified in Shared
RTS mode. These settings will not appear in the
Run-Time Settings window. To modify them, open the
run-time settings for each individual script.
The following nodes will not appear in Shared RTS
mode:
➤ Run Logic node - for protocols which support the
Run Logic node, the Iterations box appears in the
Pacing node
➤ Additional Attributes node
➤ Internet Protocol:ContentCheck node
➤ Java Environment Settings:Classpath node
➤ Nodes with tables in the format Property, Value for
the protocols: Citrix ICA, Oracle NCA, and WAP
For example: Oracle NCA:Client Emulation node
Relevant tasks
"Modify multiple scripts’ run-time settings" on page 67
83
Chapter 4 • Designing Scenarios
User interface elements are described below:
UI Elements (A-Z)
Description
Individual RTS
Opens a separate Run-Time Settings dialog box (one at a
time) for each selected script. In this mode, you modify
each script’s settings individually.
Shared RTS
Opens the Run-Time Settings Shared Mode dialog box
containing all of the run-time settings in blank mode. In
this mode, any settings that are change are applied to all
selected scripts. All other run-time settings remain
unchanged.
See Important information above.
New Scenario Dialog Box
This dialog box enables you to create a new scenario and select Vuser scripts
to run in the scenario.
To access
Controller toolbar > New Scenario
Important
information
Before you create a scenario, you should have a good idea
as to the type of scenario you want to create. See "Load
Test Scenarios Overview" on page 54.
Relevant tasks
➤ "How to Design a Manual Scenario" on page 62
➤ "How to Design a Goal-Oriented Scenario" on page 60
User interface elements are described below:
UI Elements (A-Z)
Description
Moves the script selected in the Available Scripts box to
the Scripts in Scenario box.
Removes the selected script from the Scripts in Scenario
box.
84
Chapter 4 • Designing Scenarios
UI Elements (A-Z)
Description
Enables you to add scripts to the list of available scripts.
Note: To add a VB Vuser script, select the .usr file.
Opens VuGen where you can record a Vuser script. For
more information on recording Vuser scripts, see the HP
Virtual User Generator User Guide.
Opens the Connection to HP ALM dialog box, where you
can connect to Application Lifecycle Management to
download scripts.
Select Scenario Type
Select the type of scenario to create. For details, see "Load
Test Scenarios Overview" on page 54.
➤ Manual Scenario. You manually build the scenario
creating Vuser groups and specifying the script, load
generators, and the number of Vusers to include in
each Vuser group.
➤ Use the Percentage mode... You define the total
number of Vusers to be used in the scenario and
assign a percentage of the total number of Vusers to
each Vuser script.
Note: You can convert from one scenario mode to
another at any time. For details, see "How to Change
the Scenario Mode (Manual Scenario)" on page 65.
➤ Goal-Oriented Scenario. You define the goals you
want your test to achieve, and LoadRunner
automatically builds a scenario for you, based on these
goals.
85
Chapter 4 • Designing Scenarios
UI Elements (A-Z)
Description
Select the scripts you
would like to use in
your scenario
(Optional) Select the scripts to use in the scenario.
➤ Available Scripts. Lists the fifty most recently used
scripts.
➤ Scripts in Scenario. Lists the scripts selected for the
scenario.
Click Add/Remove to move selected scripts between the
two lists.
Note: You can change the maximum number of scripts
displayed in the Available Scripts box by modifying the
following registry key:
HKEY_CURRENT_USER\Software\Mercury
Interactive\RecentScripts\max_num_of_scripts
Show at startup
When selected, the New Scenario dialog box is displayed
upon opening the Controller.
Note: This option can also be enabled/disabled from the
Controller’s View menu. Select View > Show New
Scenario Dialog.
Scenario Goal Pane
This pane displays the goals defined for the scenario.
To access
Goal-oriented scenario > Design tab
Important
information
➤ Available for goal-oriented scenarios only.
➤ The goal profiles include the type of goal, the
minimum and maximum number of Vusers that
should be used in the scenario, the duration of the
scenario, and the load behavior.
Relevant tasks
86
"How to Design a Goal-Oriented Scenario" on page 60
Chapter 4 • Designing Scenarios
User interface elements are described below:
UI Elements (A-Z)
Description
Opens the Edit Scenario Goal dialog box, where you set
the goals for the scenario. See "Edit Scenario Goal Dialog
Box" on page 78.
Goal
The defined goal, including the type of goal and the
expected target.
Goal Profile Name
The name of the goal profile.
Load Behavior
How and when the Controller should reach the defined
goal.
Load Preview graph
A graphical representation of the goal and load behavior
defined for the scenario.
Max Number of
Vusers
The maximum number of Vuser to run in the scenario.
Min Number of
Vusers
The minimum number of Vuser to run in the scenario.
Scenario Duration
The amount of time the scenario should continue
running after reaching the defined goal.
87
Chapter 4 • Designing Scenarios
Scenario Groups/Scripts Pane - Manual Scenarios
This pane displays the Vuser groups/scripts that were added to the scenario.
To access
Manual Scenario > Design tab
Important
information
➤ Vuser group mode: The Design tab displays the
Scenario Groups pane where you can define Vuser
groups to run Vuser scripts in a scenario. It lists all
Vuser groups, together with their paths, as well as the
load generators and number of Vusers assigned to each
group.
➤ Percentage mode: The Design tab displays the
Scenario Scripts pane where you can define Vuser
scripts to run in a scenario. It lists all Vuser scripts,
their paths, and the load generators and percentage of
the total number of Vusers assigned to each script.
Note: You can change from one scenario mode to
another at any time. For details, see "How to Change the
Scenario Mode (Manual Scenario)" on page 65.
Relevant tasks
➤ "How to Design a Manual Scenario" on page 62
➤ "How to Change the Scenario Mode (Manual
Scenario)" on page 65
See also
"Load Test Scenarios Overview" on page 54
User interface elements are described below:
UI Elements (A-Z)
Description
Start Scenario. Starts running the scenario.
Virtual Users. Opens the Vusers dialog box where you can
define properties for individual Vusers within the Vuser
groups you have defined. To each Vuser you can assign a
different Vuser script and/or load generator.
For user interface details, see "Vusers Dialog Box" on
page 98.
88
Chapter 4 • Designing Scenarios
UI Elements (A-Z)
Description
Add Group.
➤ Vuser group mode: Opens the Add Group dialog box
where you create Vuser groups for the scenario. See
"Add Group Dialog Box" on page 73.
➤ Percentage mode: Opens the Add Script dialog box
where you select Vuser scripts for the scenario. See
"Add Script Dialog Box" on page 74.
Remove Group. Deletes the selected Vuser group/script.
Opens the Run-Time Settings dialog box, where you can
edit the Vuser script’s run-time settings.
Notes:
➤ When you modify the run-time settings from the
Controller, LoadRunner runs the script using the
modified settings. To restore the initial settings
previously set using VuGen, click the Refresh button
and select Run-Time Settings.
➤ If run-time settings for a script were not defined in
VuGen, the Controller displays its own default settings
for Log and Think Time. Default VuGen settings are
displayed for all other nodes.
Details. Opens the Group/Script Information dialog box
where you can view and modify the Vuser group/script’s
settings.
For details, see "Group Information Dialog Box" on
page 81 or "Script Information Dialog Box" on page 94
where respectively.
View Script. Opens the script in VuGen where you can
view and edit the Vuser script. For more information on
editing scripts, see the HP Virtual User Generator User
Guide.
89
Chapter 4 • Designing Scenarios
UI Elements (A-Z)
Description
<Groups/Scripts
table>
Displays the following information about the Vuser
groups/scripts selected for the scenario:
➤
. Indicates that the Vuser group/script is
participating in the scenario.
➤ Group/Script Name. The name of the Vuser group/
script.
➤ Script Path. The path of the Vuser script.
In Vuser group mode, if the Vuser group includes more
than one script, the scripts’ names are listed. Clicking
the cell’s drop down arrow displays the scripts’ full
paths.
If you want to access the script from a location that is
relative to the current scenario directory, you can
replace the actual path with the relative path. For
details, see "Relative Paths for Scripts" on page 70.
➤ Quantity. (Vuser group mode) The number of Vusers
assigned to the Vuser group.
This column is read-only when the defining a
real-world schedule (default schedule). In this case, the
quantity of Vusers is defined when designing the
scenario schedule.
➤ %. (Percentage mode) The percentage of Vusers
assigned to run the Vuser script.
If you modify the percentage assigned to one group,
the percentages assigned to the other scripts change to
create a total of 100% for all of the Vuser scripts.
Note: Modify percentages to the scripts starting with
the first script in the list and moving down the list.
90
Chapter 4 • Designing Scenarios
UI Elements (A-Z)
Description
<Groups/Scripts
table>
➤ Load Generators. The load generators assigned to the
(continued)
Vuser group/script.
If you select multiple load generators for a group/
script, the Vusers assigned to the Vuser group/script
are distributed evenly among the load generators.
Default value (in percentage mode): All Load
Generators
Note: To add a load generator to this list, select Add
from the list. For more details, see "Add Load
Generator/Load Generator Information Dialog Box"
on page 108.
<Right-click menu>
➤ Auto Sort. When adding a Vuser group/script,
automatically sorts the table according to the defined
sort.
➤ Sort Groups/Scripts. Enables you to sort the table by
Vuser group/script name, script path, quantity/
percentage of Vusers, or load generator. To sort the
table in ascending/descending order, click the relevant
table heading.
Scenario Scripts Pane - Goal-Oriented Scenarios
This pane lists the Vuser scripts selected for the goal-oriented scenario.
To access
Goal-oriented scenario > Design tab
Relevant tasks
"How to Design a Goal-Oriented Scenario" on page 60
See also
"Load Test Scenarios Overview" on page 54
91
Chapter 4 • Designing Scenarios
User interface elements are described below:
UI Elements (A-Z)
Description
Starts running the scenario.
Opens the Load Generators dialog box where you can
add new load generators and view details about existing
load generators. See "Load Generators Dialog Box" on
page 124.
Opens the Add Script dialog box where you can select
Vuser scripts to add to the scenario. See "Add Script
Dialog Box" on page 74.
Deletes the selected Vuser script.
Opens the Run-Time Settings dialog box, where you can
edit the Vuser script’s run-time settings.
Notes:
➤ When you modify the run-time settings from the
Controller, LoadRunner runs the script using the
modified settings.
➤ If run-time settings for a script were not defined in
VuGen, the Controller displays its own default settings
for Log and Think Time. Default VuGen settings are
displayed for all other nodes.
Opens the Script Information dialog box where you can
view the Vuser script’s settings. See "Script Information
Dialog Box" on page 94.
Opens the script in VuGen where you can view and edit
the Vuser script. For more information on editing scripts,
see the HP Virtual User Generator User Guide.
92
Chapter 4 • Designing Scenarios
UI Elements (A-Z)
Description
<Right-click menu>
➤ Auto Sort. When adding a script, automatically sorts
the table according to the defined sort.
➤ Sort Scripts. Enables you to sort the table by Vuser
script name, script path, percentage of Vusers, or load
generator. To sort the table in ascending/descending
order, click the relevant table heading.
<Scripts table>
Displays the following information about the
Vuser scripts selected for the scenario:
➤
. Indicates that the script is participating in the
scenario.
➤ Script Name. The name of the Vuser script.
➤ Script Path. The path of the Vuser script.
If you want to access the script from a location that is
relative to the current scenario directory, you can
replace the actual path with the relative path. For
details, see "Relative Paths for Scripts" on page 70.
➤ % of Target. The percentage of the overall target
number of Vusers, pages per minute, hits per second,
transactions per second, or transaction response time
that is automatically distributed to each Vuser script.
➤ Load Generators. The load generators assigned to the
script. If you select multiple load generators for a
script, the Vusers assigned to the script are distributed
evenly among the load generators.
Default value: All Load Generators
Note: To add a load generator to this list, select Add
from the list. For more details, see "Add Load
Generator/Load Generator Information Dialog Box"
on page 108.
93
Chapter 4 • Designing Scenarios
Script Information Dialog Box
This dialog box displays details about the selected Vuser group, and enables
you to modify the group’s settings.
To access
Design tab > Scenario Scripts pane > Details
Important
information
Available when a script is selected in the Scenario Scripts
pane.
Relevant to:
➤ Manual scenarios in percentage mode
➤ Goal-oriented scenarios
Relevant tasks
➤ "How to View/Modify Scripts in the Scenario" on
page 65
User interface elements are described below:
UI Elements (A-Z)
Description
Updates script settings as follows:
➤ Script. If the script was modified during a scenario
run, updates the script details in the scenario.
➤ Run-Time Settings. If you modified the run-time
settings from the Controller, restores the initial
run-time settings.
Opens VuGen where you can view and edit the script. For
more information on editing scripts, see the HP Virtual
User Generator User Guide.
Note: If you use VuGen to make changes to a script while
the Controller is running, click Refresh and select Script
to update the script details in the scenario.
94
Chapter 4 • Designing Scenarios
UI Elements (A-Z)
Description
Opens the Run-Time Settings dialog box, where you can
edit the Vuser script’s run-time settings.
Notes:
➤ When you modify the run-time settings from the
Controller, LoadRunner runs the script using the
modified settings. To restore the initial settings
previously set using VuGen, click the Refresh button
and select Run-Time Settings.
➤ If run-time settings for a script were not defined in
VuGen, the Controller displays its own default settings
for Log and Think Time. Default VuGen settings are
displayed for all other nodes.
Command Line
The command line options to use when running the
script.
Example: -x value -y value.
For information about passing command line argument
values to a script, see the HP Virtual User Generator User
Guide.
Files tab
Displays all files used by the script, including the
configuration settings file, the init, run, and end portions
of the script, the parameterization definitions file, and
the .usr file.
➤ To exclude a file from the list, clear the check box
adjacent to it.
➤ To add a file or directory used by the script, click the
Add button.
Note: To run Visual C++ Vusers on a remote load
generator, you must add the .dll of the Vuser to this
list.
➤ You can delete the files that you add, but not the other
files listed.
Rendezvous tab
Displays the rendezvous points defined for the selected
script.
95
Chapter 4 • Designing Scenarios
UI Elements (A-Z)
Description
Script
The name, path, and type of the selected Vuser script.
Vusers tab
Displays all Vusers associated with the selected script.
Vuser Information Dialog Box
This dialog box displays details about a specific Vuser in a group, and lets
you modify the load generator and script settings for the Vuser.
To access
Use one of the following:
➤ Manual scenario > Design tab > Scenario Groups pane
> Vusers
>
➤ In Vusers dialog box, double-click Vuser.
Relevant tasks
➤ "How to View/Modify Scripts in the Scenario" on
page 65
➤ "How to Run a Scenario" on page 249
User interface elements are described below (unlabeled elements are shown
in angle brackets):
UI Elements (A-Z)
Description
Enables you to add Vuser scripts to the list of scripts.
Note: To add a VB Vuser script, select the .usr file.
Opens VuGen where you can record a Vuser script. For
more information on recording Vuser scripts, see the HP
Virtual User Generator User Guide.
96
Chapter 4 • Designing Scenarios
UI Elements (A-Z)
Description
Opens the Run-Time Settings dialog box, where you can
edit the Vuser script’s run-time settings.
Notes:
➤ Modifying the run-time settings for one Vuser
modifies the run-time settings for all the Vusers in the
group that are using the same script.
➤ When you modify the run-time settings from the
Controller, LoadRunner runs the script using the
modified settings.
➤ If run-time settings for a script were not defined in
VuGen, the Controller displays its own default settings
for Log and Think Time. Default VuGen settings are
displayed for all other nodes.
Opens the Parameter list in VuGen where you can create,
view, modify, and delete Vuser script parameters. For
details, see the HP Virtual User Generator User Guide.
Group Name
The name of the group to which the selected Vuser
belongs.
Load Generator
Name
The load generator assigned to the Vuser’s Vuser group.
Select Script
Lists the available scripts that have been added to the
scenario. When you select a script, its name and path are
displayed above the list.
To add a load generator to this list, select Add from the
list. For user interface details, see "Add Load Generator/
Load Generator Information Dialog Box" on page 108.
To display the scripts with their full paths, right-click the
list area and select Show Paths.
Vuser Name
The name of the selected Vuser.
97
Chapter 4 • Designing Scenarios
Vusers Dialog Box
This dialog box displays the status of the Vusers in the selected Vuser group.
To access
Manual scenario > Design tab > Scenario Groups pane >
Vusers
Relevant tasks
➤ "How to Run a Scenario" on page 249
➤ "Control Vusers During a Scenario Run - Use-Case
Scenario" on page 252
User interface elements are described below:
UI Elements (A-Z)
Description
Show the Selected Vusers. Opens a Run-Time Viewer for
each selected Vuser.
Hide the Selected Vusers. Closes the Run-Time Viewers
that were opened.
Show Vuser Log. Displays a log containing run-time
information about the Vuser that is refreshed, by default,
every 1000 milliseconds. For more information, see
"Vuser Script Log" on page 287.
Hide Vuser Log. Closes the Vuser log.
Starts running the selected Vuser.
Instructs the Controller to complete the current iteration
or action before stopping the Vuser.
Note: This option is only available when the Vuser is in
the Run state, and if you selected the Wait for the current
iteration to end before exiting or Wait for the current
action to end before exiting option in the Run-Time
Settings tab of the Options dialog box.
Stops running the selected Vuser immediately.
98
Chapter 4 • Designing Scenarios
UI Elements (A-Z)
Description
Resets the status of the Vuser to Down.
Opens the Vuser Information dialog box, where you can
view details about the selected Vuser.
Opens the Add Vusers dialog box where you can add
more Vusers to the Vuser group.
<Filter by script>
Filters the Vusers table by the selected script.
<Filter by status>
Filters the Vusers table by the selected Vuser status. For
details, see "Vuser Statuses" on page 71.
<Right-click menu>
➤ Filter Vusers. Enables you filter the Vuser list by Vuser
status.
➤ Renumber. Renumbers the list of Vusers in sequential
order, starting from 1.
➤ Sort Vusers. Enables you to sort the table by a selected
column. To sort the table in ascending/descending
order, click the relevant table heading.
<Vusers table>
Displays the following information about the Vusers:
➤ ID. The Vuser’s ID number
➤ Status. The Vuser’s status. For details, see "Vuser
Statuses" on page 71.
➤ Script. The script run by the Vuser.
➤ Load Generator. The load generator on which the
Vuser is running.
➤ Elapsed Time. Amount of time that has elapsed in the
scenario since the Vuser began running.
99
Chapter 4 • Designing Scenarios
100
5
Load Generators
This chapter includes:
Concepts
➤
Load Generators Overview on page 102
➤
Load Balancing on page 102
Tasks
➤
How to Connect to a UNIX Load Generator Without Using RSH
on page 104
➤
How to Add Load Generators to a Scenario on page 105
➤
How to Modify Load Generator Details on page 106
➤
How to Connect/Disconnect a Load Generator on page 106
Reference
➤
UNIX Environment Variables on page 107
➤
Load Generators - User Interface on page 107
101
Chapter 5 • Load Generators
Concepts
Load Generators Overview
Load generators are the machines that run the Vuser scripts in your
scenario.
When you add a load generators to the list of load generators in the
Controller, you define its attributes. You can modify these attributes at any
time.
You can enable load generators to take part in the scenario, and then
indicate which specific load generators will run Vuser scripts in the scenario.
If an enabled load generator is unavailable for a particular scenario run, you
can exclude it temporarily instead of removing it entirely from your list of
load generators. You can also disable load generators to isolate a specific
machine to test its performance.
To set attributes for a specific load generator, see "Add Load Generator/Load
Generator Information Dialog Box" on page 108.
To set global settings for all the load generators participating in the scenario,
see "Options Dialog Box" on page 221.
Load Balancing
Load balancing evenly distributes the load generated by Vusers among the
requested load generators, ensuring an accurate load test.
When a Windows load generator’s CPU usage becomes overloaded, the
Controller stops loading Vusers on the overloaded load generator, and
automatically distributes them among load generators taking part in the
scenario. Only where there are no other load generators in the scenario does
the Controller stop loading Vusers.
102
Chapter 5 • Load Generators
You can monitor the status of a machine’s CPU usage using the icons in the
Load Generators dialog box (see "Load Generators Dialog Box" on page 124).
When the CPU usage of a load generator becomes problematic, the icon to
the left of the load generator name contains a yellow bar. When the
machine becomes overloaded, the icon contains a red bar.
Note: Load balancing is only available in manual scenarios in the
percentage mode and in goal-oriented scenarios.
103
Chapter 5 • Load Generators
Tasks
How to Connect to a UNIX Load Generator Without
Using RSH
This task describes how to connect to a UNIX load generator without using
RSH.
1 On the UNIX load generator, make sure that the agent daemon
(m_agent_daemon) is running. If not, launch it by running the following
command from <load generator installation directory>/bin:
m_daemon_setup -install
If successful, you will receive the following message:
m_agent_daemon <process ID>
The agent now keeps running, even if the user is logged off. It only stops
running if you run the command explained below, or if you reboot the
machine.
Note: If you look at the log file m_agent_daemon[xxx].log in the temp
directory, you may see communication errors, even if the installation
succeeded. These messages appear because the LoadRunner agent always
tries to open Port #443 (because any agent can be an MI Listener, and the
MI Listener always listens to this port), and in UNIX machines, this port
cannot be opened by any user except for the root user. However, this does
not interfere with using this agent for the load generator.
2 In the Controller, in the Load Generator Information dialog box > UNIX
Environment tab, select the Don’t use RSH option. Connect as usual.
104
Chapter 5 • Load Generators
For details, see "Load Generator Configuration > UNIX Environment Tab"
on page 118.
To stop the agent daemon:
➤
Run the following command from the <LR_root>/bin directory:
m_daemon_setup -remove
This stops the m_agent_daemon. If successful, you receive the following
message:
m_agent_daemon is down.
How to Add Load Generators to a Scenario
The following steps describe how to add load generators to a scenario.
Note: When you add a load generator, it remains in the Down state until it
is connected.
For details about the Load Generator configuration tabs, see "Add Load
Generator/Load Generator Information Dialog Box" on page 108.
To add a load generator:
1 Open the scenario.
➤
Click to open a new scenario.
➤
Click to open an existing scenario.
The scenario is displayed in the Design tab.
2 Click the Load Generators button.
3 Click Add, and enter the details of the load generator.
105
Chapter 5 • Load Generators
4 (Optional) Click More to display the configuration tabs and configure
other load generator’s details.
How to Modify Load Generator Details
The following steps describe how to edit load generator settings.
5 Open the scenario. The scenario is displayed in the Design tab.
6 Click the Load Generators button.
7 Select the load generator, and click Details.
8 Modify the details displayed in the configuration tabs. For details, see
"Load Generator Configuration Tabs" on page 109.
How to Connect/Disconnect a Load Generator
This task describes how to connect or disconnect a load generator.
9 On the Controller toolbar, click Load Generators.
10 Select the load generator in the list and click Connect/Disconnect.
106
Chapter 5 • Load Generators
Reference
UNIX Environment Variables
To work with a load generator in a UNIX environment, your UNIX startup
configuration file needs to include specific environment variables. To set the
environment variables, users need to add the env.csh script to their startup
configuration file.
UNIX Users
Startup Configuration File
C shell
.cshrc
Bourne and Korn shell
.profile
Add the following line in the startup configuration file:
source <load generator installation directory>/env.csh
For example:
source /opt/HP/HP_LoadGenerator/env.csh
Load Generators - User Interface
This section includes:
➤
Add Load Generator/Load Generator Information Dialog Box on page 108
➤
Load Generator Configuration > Connection Log Tab on page 111
➤
Load Generator Configuration > Run-Time File Storage Tab on page 112
➤
Load Generator Configuration > Run-Time Quota Tab on page 113
➤
Load Generator Configuration > Security Tab on page 114
➤
Load Generator Configuration > Status Tab on page 116
107
Chapter 5 • Load Generators
➤
Load Generator Configuration > Terminal Services Tab on page 116
➤
Load Generator Configuration > UNIX Environment Tab on page 118
➤
Load Generator Configuration > Vuser Limits Tab on page 121
➤
Load Generator Configuration > Vuser Status Tab on page 122
➤
Load Generator Configuration > WAN Emulation Tab on page 123
➤
Load Generators Dialog Box on page 124
Add Load Generator/Load Generator Information Dialog
Box
These dialog boxes enable you to add load generators, and view and edit
information about a load generator respectively.
To access
Controller toolbar >
➤ Add New Load Generator dialog box: Click Add
➤ Load Generator Information dialog box: Select a load
generator and click Details
Important
information
After adding a load generator, it appears in the Load
Generators list with a Down status.
Relevant tasks
"How to Add Load Generators to a Scenario" on page 105
"How to Modify Load Generator Details" on page 106
See also
"Load Generators Overview" on page 102
User interface elements are described below (unlabeled elements are shown
in angle brackets):
UI Elements (A-Z)
(Add New Load
Generator dialog box
only)
108
Description
More/Less. Shows/hides the tabs where you configure
the load generator’s details. See "Load Generator
Configuration Tabs" below.
Chapter 5 • Load Generators
UI Elements (A-Z)
Description
Enable load
generator to take
part in the scenario
When selected, enables the load generator to participate
in the scenario.
When cleared, the load generator is disabled. This is
useful in the following cases:
➤ If an enabled load generator is unavailable for a
particular scenario run, you can exclude it temporarily
instead of removing it entirely from your list of load
generators.
➤ You can disable load generators to isolate a specific
machine to test its performance.
Name
The name of the load generator.
Platform
The platform on which the load generator is installed.
Temporary directory
The location, on the load generator, where the Controller
can store temporary files.
Default: If left empty, during a scenario run LoadRunner
stores temporary files on the load generator in a
temporary directory specified by the load generator’s
TEMP or TMP environment variables.
Load Generator Configuration Tabs
UI Elements (A-Z)
Description
Connection Log tab
Displays the standard output and standard errors
generated as the Controller connects to the selected
UNIX load generator. You can change the command that
the Controller sends to the remote bridge in order to
connect to the load generator. See "Load Generator
Configuration > Connection Log Tab" on page 111.
(Load Generator
Information dialog
box only)
Note: Available in Expert mode only
Run-Time File
Storage tab
Enables you to specify the result directory for the
performance data that LoadRunner gathers from each
load generator during a scenario. See "Load Generator
Configuration > Run-Time File Storage Tab" on page 112.
109
Chapter 5 • Load Generators
UI Elements (A-Z)
Description
Run-Time Quota tab
Enables you to specify a maximum number of Vuser
types that the load generator should initialize or stop
simultaneously. See "Load Generator Configuration >
Run-Time Quota Tab" on page 113.
Security tab
Enables monitoring or running Vusers over a firewall. See
"Load Generator Configuration > Security Tab" on
page 114.
Status tab
Status. Displays details about the status of the load
generator. See "Load Generator Configuration > Status
Tab" on page 116.
Terminal Services tab
The Terminal Services Manager which enables you to
distribute Vusers running in your load testing scenario
on terminal servers. See "Load Generator Configuration >
Terminal Services Tab" on page 116.
UNIX Environment
tab
Enables you to configure the login parameters and shell
type for each UNIX load generator. See "Load Generator
Configuration > UNIX Environment Tab" on page 118.
Vuser Limits tab
Enables you to modify the maximum number of GUI,
RTE, and other Vusers that the load generator can run.
See "Load Generator Configuration > Vuser Limits Tab"
on page 121.
(Add New Load
Generator dialog box
only)
Vuser Status tab
(Load Generator
Information dialog
box only)
WAN Emulation tab
110
Displays the status of all the Vusers connected to the load
generator. See "Load Generator Configuration > Vuser
Status Tab" on page 122.
Enables WAN Emulation on your scenario. See "Load
Generator Configuration > WAN Emulation Tab" on
page 123.
Chapter 5 • Load Generators
Load Generator Configuration > Connection Log Tab
This tab displays the standard output and standard errors generated as the
Controller connects to the selected UNIX load generator and enables you
change the command that the Controller sends to the remote bridge in
order to connect to the load generator.
To access
Controller toolbar >
> Details
Important
information
This tab is displayed only when the Controller is in
Expert mode.
Relevant tasks
➤ "How to Add Load Generators to a Scenario" on
page 105
➤ "How to Modify Load Generator Details" on page 106
See also
➤ "Load Generators Overview" on page 102
➤ "Expert Mode" on page 212
User interface elements are described below:
UI Elements (A-Z)
Description
Bridge cmd
The command sent by the Controller to the remote
bridge in order to connect the UNIX load generator.
Note: This command replaces the default bridge
command sent by the Controller.
Rsh standard errors
Displays rsh standard errors as the Controller connects to
the selected UNIX load generator.
Rsh standard output
Displays rsh standard output as the Controller connects
to the selected UNIX load generator.
111
Chapter 5 • Load Generators
Load Generator Configuration > Run-Time File Storage
Tab
This tab enables you to specify the results directory for the performance data
that LoadRunner gathers from this load generator during a scenario run.
To access
Controller toolbar >
> Add or Details
Important
information
➤ The directory specified here stores the result files
gathered on the selected load generator.
A global results directory for all load generators is
specified in the Tools > Options dialog box. For details,
see "Options > Run-Time File Storage Tab" on
page 231.
Note: If the settings specified here differ to the global
load generator settings, the settings specified here take
preference for this particular load generator.
➤ If the load generator is localhost, then LoadRunner
stores the scripts and results on a shared network
drive, and the options on this tab are all disabled.
➤ If you are monitoring over a firewall, the settings in
this tab are not relevant.
Relevant tasks
➤ "How to Add Load Generators to a Scenario" on
page 105
➤ "How to Modify Load Generator Details" on page 106
See also
➤ "Run-Time File Storage Locations" on page 213
➤ "Options > Run-Time File Storage Tab" on page 231
112
Chapter 5 • Load Generators
User interface elements are described below:
UI Elements (A-Z)
Description
Scripts and results
stored
Select where to store the results of the scenario run and/
or Vuser scripts gathered from the selected load generator
during a scenario run:
➤ As defined in Tools > Options > Run-Time File Storage.
Stores the results as specified in the global settings.
➤ In temporary directory on <load generator name>.
Instructs the Controller to save the run-time files on a
hard drive of the load generator machine.
➤ On a shared network drive. Instructs the Controller to
save the scenario results and/or the Vuser scripts on a
shared network drive. A shared network drive is a drive
to which the Controller and all the load generators in
the scenario have read and write permissions.
Load Generator Configuration > Run-Time Quota Tab
This tab enables you to specify a maximum number of Vuser types that the
load generator should initialize or stop simultaneously, so as to reduce load
on the load generator.
To access
Controller toolbar >
> Add or Details
Important
Information
The settings specified here are relevant for the selected
load generator.
You can set run-time quotas for all load generators in a
scenario from the Tools > Options > Run-Time Settings
tab. For details on setting global run-time quotas, see
"Options > Run-Time Settings Tab" on page 232
Note: If the settings specified here differ to the global
load generator settings, the settings specified here take
preference for this particular load generator.
113
Chapter 5 • Load Generators
Relevant tasks
➤ "How to Add Load Generators to a Scenario" on
page 105
➤ "How to Modify Load Generator Details" on page 106
See also
➤ "Options > Run-Time Settings Tab" on page 232
User interface elements are described below:
UI Elements (A-Z)
Description
Resets values to their defaults.
Vuser Quota
➤ Number of Vusers that may be initialized at one time -
<current load generator>. The maximum number of
Vusers that the current load generator can initialize
simultaneously.
Default: 50
Maximum value: 999
➤ Limit the number of users that may be stopped at one
time to. The maximum number of Vusers that the
current load generator can stop simultaneously.
Default: 50
Load Generator Configuration > Security Tab
Enables monitoring or running Vusers over a firewall.
To access
114
Controller toolbar >
> Add or Details
Chapter 5 • Load Generators
Important
information
➤ If the load generator is connected, you cannot change
values in the Security tab. To disconnect a load
generator, select the load generator in the Load
Generators dialog box and click Disconnect. The load
generator status changes to Down, and you can
change the settings.
➤ If the load generator is localhost, this tab is disabled.
Relevant tasks
➤ "How to Add Load Generators to a Scenario" on
page 105
➤ "How to Modify Load Generator Details" on page 106
User interface elements are described below:
UI Elements (A-Z)
Description
Enable firewall
Enables LoadRunner to monitor or run Vusers over a
firewall.
Note: If this option is selected, the Temporary directory
box in the load generator’s details area (at the top of the
dialog box) is disabled and if a location was defined, it is
erased.
Enable SSL Support
Enables an encrypted connection between the Controller
and load generator.
Firewall Settings
➤ Enable running Vusers over Firewall. Enables
LoadRunner to run Vusers on a load generator outside
the firewall.
➤ Enable Monitoring over Firewall. Enables LoadRunner
to monitor the load generator over a firewall.
➤ MI Listener. The name of the MI Listener that the load
generator uses to communicate over the firewall.
115
Chapter 5 • Load Generators
Load Generator Configuration > Status Tab
This tab displays details about the status of the load generator.
To access
Controller toolbar >
> Details
Relevant tasks
"How to Modify Load Generator Details" on page 106
User interface elements are described below:
UI Elements (A-Z)
Description
Details
Error and other run-time information about the selected
load generator.
Load Generator
Status
The status of the load generator.
Load Generator Configuration > Terminal Services Tab
This tab displays the Terminal Services Manager which enables you to
distribute Vusers running in your load testing scenario on terminal servers.
To access
Controller toolbar >
> Add or Details
Important
information
This feature is not supported if the load generator is
located over a firewall.
Relevant tasks
➤ "How to Add Load Generators to a Scenario" on
page 105
➤ "How to Modify Load Generator Details" on page 106
See also
116
"Terminal Services Overview" on page 194
Chapter 5 • Load Generators
User interface elements are described below (unlabeled elements are shown
in angle brackets):
UI Elements (A-Z)
Description
Resets values to their defaults.
<Connection
Options>
➤ Connect to existing Terminal Services Sessions.
Enables connection to existing (open) terminal
sessions.
Note: If you select this option, you must open a
terminal client session manually for each terminal
that you want to run Vusers on during the scenario.
➤ Create new Terminal Services Sessions. Enables the
Controller to open and close terminal sessions
automatically using a user name, password, and
domain for the Terminal Services session.
➤ Show Terminal Services clients on the Controller
machine. Enables interaction with new Terminal
Services sessions using the RDP client.
Enable Terminal
Services Manager
Enables the Controller to manage load automatically
using terminal sessions on the load generator.
Note:
When enabled, you can see the load generator’s name
only, without adding any extra references.
Example:
If you need to use three load generator sessions,
my_machine, my_machine:1, and my_machine:2, then in
the load generator list, you need only insert the load
generator, my_machine, and enable the Terminal Services
Manager for three terminals (Number of terminals = 3
- see below).
If not enabled, you need to insert each of the three
terminals as separate load generators: my_machine,
my_machine:1, and my_machine:2.
117
Chapter 5 • Load Generators
UI Elements (A-Z)
Description
Maximum number of
Vusers per terminal
The maximum number of Vusers that you want to run in
a terminal session. This depends on the Vuser type used
in the script.
Default: 50
Example: For GUI Vusers, the maximum is one Vuser for
each terminal session.
Number of terminals
The number of terminals you want to use in your
scenario. You must open a terminal client session for
each terminal on which you want to run Vusers during
the scenario.
Default: 2
Load Generator Configuration > UNIX Environment Tab
This tab enables you to configure the login parameters and shell type for
each UNIX load generator.
To access
Controller toolbar >
> Add or Details
Important
information
➤ This tab is not available for a load generator running
Vusers or monitoring over a firewall.
➤ Editable only when the load generator is on a UNIX
platform.
Relevant tasks
➤ "How to Add Load Generators to a Scenario" on
page 105
➤ "How to Modify Load Generator Details" on page 106
➤ "How to Connect to a UNIX Load Generator Without
Using RSH" on page 104
118
Chapter 5 • Load Generators
User interface elements are described below:
UI Elements (A-Z)
Description
Login as
The user’s credentials for logging in to the UNIX
environment:
➤ Name. If the load generator is UNIX-based, set the
login information for the load generator.
Default: LoadRunner uses your Windows user name
for the UNIX login. That is, if your Windows login is
lrunner, the Controller logs in to the load generator as
lrunner. To log in to a UNIX-based load generator
using a different login name, select Name and specify
the desired UNIX login name.
Using this option, you can log in to the Windows
Controller as bill and connect to the UNIX load
generator as mike. However, you should make sure
that mike allows bill to log in using his name. This can
be done by adding the line "+ bill" at the beginning of
mike's .rhosts file.
➤ Use lower case for login names. Instructs LoadRunner
to use lower case names during login to avoid
case-sensitive issues with the UNIX operation system.
Local User. (Expert mode only) UNIX load generators
that use the rsh shell to establish a connection as the
current Windows user (due to security considerations).
To “mislead” rsh and log in as a user other than the
current Windows login, select Local user and specify
the desired UNIX login name. Because modifying the
local user name is a security breach for rsh, this option
should be used only when you encounter a problem
connecting to the remote machine.
119
Chapter 5 • Load Generators
UI Elements (A-Z)
Description
Shell Settings
The UNIX shell settings for the remote UNIX load
generator.
Default: The Controller connects remotely to the UNIX
load generator using rsh (remote shell).
➤ Don’t use RSH. Connects to the remote load generator
without using RSH. In this case, you need to activate
the agent daemon on the load generator manually.
Note: If you do want to connect using RSH, clear this
check box, make sure that RSH is enabled on the load
generator, and make sure that the agent daemon is not
already running on the load generator. If the agent
daemon is running, stop it by running the following
command from the <LR_root>/bin directory:
m_daemon_setup -remove
➤ Default shell. The default shell on the UNIX load
generator: csh (C Shell—the default), bsh (Bourne
Shell), or ksh (Korn Shell).
To work with the load generator, your UNIX startup
configuration file needs to include specific
environment variables. For details, see "UNIX
Environment Variables" on page 107.
➤ Initialization command. Command line options for
LoadRunner to use when logging in to a UNIX system.
This initialization command runs as soon as the shell
opens.
Example: You could select ksh and use the following
initialization command: source .profile;
120
Chapter 5 • Load Generators
Load Generator Configuration > Vuser Limits Tab
This tab enables you to modify the maximum number of GUI, RTE, and
other Vusers that the load generator can run.
To access
Controller toolbar >
> Add or Details
Relevant tasks
➤ "How to Add Load Generators to a Scenario" on
page 105
➤ "How to Modify Load Generator Details" on page 106
User interface elements are described below:
UI Elements (A-Z)
Description
Resets values to their defaults.
Available Types
The types of Vusers the load generator should run.
The types of vusers are:
➤ GUI-WinRunner
➤ RTE
➤ Other Vusers
Maximum Active
The maximum number of each type of Vuser that the
load generator should run.
Defaults:
➤ GUI-WinRunner: 1
➤ RTE: 1000
➤ Other Vusers: 5000
Note: The maximum number of active Vusers that you
specify must not exceed the number of Vusers that you
are licensed to run. To check your Vuser licensing
limitations, in the LoadRunner launcher window (Start >
Programs > LoadRunner > LoadRunner), select
Configuration > LoadRunner License.
121
Chapter 5 • Load Generators
Load Generator Configuration > Vuser Status Tab
This tab enables you to view the status of all the Vusers connected to the
load generator.
To access
Controller toolbar >
> Add or Details
Important
information
This tab is visible only when the load generator is
connected.
Relevant tasks
➤ "How to Add Load Generators to a Scenario" on
page 105
➤ "How to Modify Load Generator Details" on page 106
See also
Chapter 10, "Configuring WAN Emulation Settings"
User interface elements are described below (unlabeled elements are shown
in angle brackets):
UI Elements (A-Z)
Description
<Vuser Status>
The status of the Vusers:
➤ Pending. Vusers are waiting to initialize.
➤ Initializing. Vusers are in the initialization state.
➤ Active. Vusers are actively running in the scenario.
122
GUI/WinRunner
The number of GUI/WinRunner Vusers that are in the
Pending, Initializing, and Active states.
Other Vusers
The number of Vusers—other than GUI/WinRunner and
RTE Vusers—that are in the Pending, Initializing, and
Active states.
RTE
The number of RTE Vusers that are in the Pending,
Initializing, and Active states.
Totals
The total number of Vusers that are in the Pending,
Initializing, and Active states.
Chapter 5 • Load Generators
Load Generator Configuration > WAN Emulation Tab
This tab enables WAN Emulation on your scenario.
To access
Controller toolbar >
> Add or Details
Important
information
➤ To enable the WAN Emulator, the load generator must
be disconnected. If the load generator is connected,
select it in the Load Generators dialog box and click
Disconnect. The load generator status changes to
Down.
➤ This tab is disabled if:
➤ The load generator is running on a UNIX platform
➤ The WAN Emulation third party software is not
installed
➤ The load generator is also the Controller
Relevant tasks
➤ "How to Integrate WAN Emulation Into Your Scenario"
on page 204
➤ "How to Add Load Generators to a Scenario" on
page 105
➤ "How to Modify Load Generator Details" on page 106
See also
Chapter 10, "Configuring WAN Emulation Settings"
123
Chapter 5 • Load Generators
User interface elements are described below:
UI Elements (A-Z)
Description
Opens the third party software WAN Emulation Settings
dialog box. For detailed information on configuring
WAN Emulation using this dialog box, see the relevant
third party software documentation.
For information on some typical network emulation
settings, see "Typical Network Emulation Settings" on
page 200.
Note: If several load generators are being configured to
emulate a specific location, make sure that each load
generator is configured with the same settings.
Auto Monitoring
User Details
If you are connecting to the load generator remotely, but
do not have the necessary permissions to retrieve
third party monitors, you can retrieve these monitors
with additional credentials that do have the necessary
permissions. If you have these additional credentials,
enter them in the User Name and Password boxes.
Emulated Location
The name of the emulated location.
For details, see "Emulated Locations Overview" on
page 201.
Enable WAN
Emulation on Load
Generator
Enables the WAN Emulator on the load generator.
Load Generators Dialog Box
This dialog box enables you to manage the load generators defined for the
scenario.
To access
124
Controller toolbar >
Chapter 5 • Load Generators
Relevant tasks
"How to Add Load Generators to a Scenario" on page 105
"How to Modify Load Generator Details" on page 106
See also
"Load Generators Overview" on page 102
"Load Balancing" on page 102
User interface elements are described below (unlabeled elements are shown
in angle brackets):
UI Elements (A-Z)
Description
Opens the Add New Load Generator dialog box where
you define a new load generator.
See "Add Load Generator/Load Generator Information
Dialog Box" on page 108.
Note: When you add a load generator, its status is set to
Down until it is connected.
➤ Connect. Instructs the Controller to connect the load
generator for the scenario. The status of the load
generator changes from Down to Ready.
➤ Disconnect. When the load generator is connected,
the button automatically changes to Disconnect.
When clicked, the status of the load generator changes
to Down.
Removes the load generator from the list. The load
generator can be removed when it is disconnected only.
Opens the Load Generator Information dialog box where
you can view and modify information about the load
generator selected in the list. See "Add Load Generator/
Load Generator Information Dialog Box" on page 108.
Instructs the Controller to disable or enable the load
generator. When a load generator is disabled, its Name,
Status, Platform, and Details appear in gray.
Attempts to reset a failed connection.
125
Chapter 5 • Load Generators
UI Elements (A-Z)
Description
<Icons>
The Controller monitors a Windows load generator’s
CPU usage and automatically stops loading Vusers on a
load generator when it becomes overloaded.
You can monitor the status of a machine’s CPU usage as
follows:
The load generator is ready.
There is a problem with the CPU usage of the load
generator.
The load generator is overloaded.
<Load Generator
table>
Displays the following information:
➤ Name. The name of the load generator.
➤ Status. The status of the load generator:
➤ Ready. The load generator is connected.
➤ Connecting. The load generator is in the process of
connecting.
➤ Active. The load generator is running Vusers.
➤ Down. The load generator is not connected.
➤ Failed. A connection with the load generator could
not be established.
➤ Platform. The type of platform on which the load
generator is running.
➤ Details. If the connection fails, displays details about
why it failed.
<Right-click menu>
➤ Filter Hosts. Enables you filter the load generator list
by status.
➤ Load Default List. Loads the default list of load
generators.
➤ Save List As Default. Saves the current list of load
generators as the default list.
➤ Sort Hosts. Enables you to sort the Load Generator
table by a selected column. To sort the table in
ascending/descending order, click the relevant table
heading.
126
6
Scheduling Manual Scenarios
This chapter includes:
Concepts
➤
Scheduling Manual Scenarios Overview on page 128
➤
Scheduling by Scenario or Group on page 128
➤
Schedule Run Modes on page 130
Tasks
➤
How to Define a Schedule for the Scenario - Workflow on page 132
➤
How to Add Actions to the Scenario Schedule on page 136
➤
How to Edit Schedule Actions on page 139
Reference
➤
Schedule Actions on page 142
➤
Scheduler User Interface on page 146
127
Chapter 6 • Scheduling Manual Scenarios
Concepts
Scheduling Manual Scenarios Overview
An important factor in the creation of a manual scenario is developing a test
that accurately portrays user load behavior—the type of load and the timing
of the load.
After you create a scenario, you schedule the scenario to start running at a
specified time. You can limit the execution duration of the scenario or of a
Vuser group within the scenario.
You can also stipulate how many Vusers to start and stop running within a
certain time frame. You can specify whether LoadRunner should start or
stop running all Vusers in a scenario simultaneously, or only a certain
number of Vusers within a specified amount of time.
Note: Rendezvous points in a Vuser script interfere with a scheduled
scenario run. If your script contains rendezvous points, your scenario will
not run as scheduled. For details on rendezvous points, see "Rendezvous
Points" on page 313.
Scheduling by Scenario or Group
After you have designed a manual scenario, you can schedule the
participating Vuser groups/scripts to run as part of a scenario schedule.
You can schedule all the groups/scripts to run together on one schedule, or
you can define a separate schedule for each Vuser group.
For details about manual scenario modes, see "Manual Scenarios" on
page 54.
128
Chapter 6 • Scheduling Manual Scenarios
Scheduling By Scenario
When you schedule by scenario, LoadRunner runs all the Vuser groups
participating in the scenario simultaneously. That is, the schedule defined
for running the scenario is applied to all the Vuser groups concurrently, and
LoadRunner applies each action proportionately to all the Vusers groups.
For example, take a scenario that includes 3 participating Vuser groups as
follows:
Group Name
Number of Vusers
Group1
10
Group2
20
Group3
30
Total
60
When scheduling by scenario, if the schedule instructs LoadRunner to load
30 Vusers when it starts running, LoadRunner loads a proportional number
of Vusers from each group as follows:
Group Name
Number of Vusers
Group1
5
Group2
10
Group3
15
Total
30
Note: The same principle applies when viewing the scenario in percentage
mode.
129
Chapter 6 • Scheduling Manual Scenarios
Scheduling By Vuser Group
Note: For scenarios in Vuser group mode only.
When you schedule by Vuser group, each Vuser group participating in the
scenario runs on its own separate schedule. That is, for each Vuser group,
you can specify when to start running the Vuser group, how many Vusers in
the group to start and stop running within specified time intervals, and how
long the group should continue running.
Schedule Run Modes
You can schedule a scenario to run according to the run-time settings
defined in the Vuser groups, or you can let the groups run over and over
again until the scenario schedule instructs them to stop running.
You can schedule a scenario to run in one of the following modes:
➤
Real-world schedule. (Default) The scenario runs according to a
user-defined group of actions that simulate a real-world schedule of
events. Vuser groups run according to the iterations defined in their
run-time settings, but you can define how many Vusers to run at a time,
how long Vusers should continue to run, and how many Vusers to stop
running at a time.
➤
Basic schedule. All enabled Vuser groups run together on one schedule,
each according to its own run-time settings. You can schedule how many
Vusers to start running at a time, and how long they should run before
stopping.
Note: You can change the default run mode in the Tools > Options >
Execution tab.
130
Chapter 6 • Scheduling Manual Scenarios
The following table illustrates how the given schedule types run in
real-world vs basic run mode:
Run Mode
Schedule by
Real-world
Basic
Scenario
All participating Vuser groups
run together on one schedule.
The scenario runs according to
a user-defined group of actions
that emulate a true-to-life
schedule of events. You can
schedule how many Vusers to
start running at a time, how
long to run the Vusers, and
how many Vusers to stop
running at a time.
All participating Vuser groups
run together on one schedule,
each according to its own
run-time settings. You can
schedule the Vusers to start and
stop running simultaneously or
gradually, and you can specify
how long they should run
before stopping.
Group
Each participating Vuser group
runs according to its own
defined schedule that emulates
a true-to-life schedule of events
for that Vuser group. You can
schedule when to start
running the Vuser group, how
many Vusers to run at a time,
how long to run the Vusers,
and how many Vusers to stop
running at a time.
Each participating Vuser group
runs according to its own
schedule, each according to its
own run-time settings. For each
Vuser group, you can schedule
how many Vusers in the group
to start and stop running
simultaneously or gradually,
and you can specify how long
they should run before
stopping.
(Not
applicable
when
viewing
scenario in
Percentage
mode)
131
Chapter 6 • Scheduling Manual Scenarios
Tasks
How to Define a Schedule for the Scenario - Workflow
This task describes how to define a schedule for a scenario.
This task includes the following steps:
➤
"Prerequisite" on page 132
➤
"Define the schedule" on page 132
➤
"Define actions for the schedule" on page 133
➤
"Vuser group schedules only: Copy a group’s schedule settings to other
groups - optional" on page 134
➤
"Schedule a start time for the scenario - optional" on page 135
1 Prerequisite
Make sure that a scenario is open, or create a new one, and that scripts
have been selected for the scenario.
For more details, see "How to Design a Manual Scenario" on page 62.
2 Define the schedule
In the Scenario Schedule pane, select a schedule from the list, or define a
new schedule by clicking New Schedule.
132
Chapter 6 • Scheduling Manual Scenarios
Define the schedule in the definition area as follows:
a (Optional) To rename the schedule, type a new name in the Schedule
Name box and click Save New Name.
b Select the type of schedule: Scenario or Group. For details, see
"Scheduling by Scenario or Group" on page 128.
c Select a run mode: Real-world or Basic. For details, see "Schedule Run
Modes" on page 130.
Note: The default run mode for all schedules is Real-world. You can
change the default to Basic in the Tools > Options > Execution tab.
3 Define actions for the schedule
The Actions Grid displays the default actions that correspond to the type
of schedule you selected in step 2 above.
For schedule action details, see "Schedule Actions" on page 142.
➤
For details about how to add actions, see "How to Add Actions to the
Scenario Schedule" on page 136.
➤
For details about how to edit actions, see "How to Edit Schedule
Actions" on page 139.
133
Chapter 6 • Scheduling Manual Scenarios
4 Vuser group schedules only: Copy a group’s schedule settings
to other groups - optional
When scheduling by Vuser group, you can copy a Vuser group’s schedule
settings to other Vuser groups.
Note: Schedule settings copied include the schedule run mode (basic or
real-world) and the set of schedule actions.
134
Chapter 6 • Scheduling Manual Scenarios
Example:
To copy group_1’s schedule settings to group_2, select group_2 in the
Scenario Groups pane, click Copy Schedule Settings From, and select
group_1.
5 Schedule a start time for the scenario - optional
In the Schedule Definition area, click the Start Time button and select
when to start running the scenario.
135
Chapter 6 • Scheduling Manual Scenarios
How to Add Actions to the Scenario Schedule
Note: You can add actions to a real-world schedule only.
Add an action to the schedule from the Actions grid
1 In the Action grid do one of the following:
➤
To insert an action after a specific action, select the action and click
Add Action After.
➤
To add an action after the last action, double-click the last row in the
Actions grid—marked by an asterisk (*).
2 In the Add Action dialog box, define the new action. For schedule action
details, see "Schedule Actions" on page 142.
3 Click Apply.
4 To add another action while in the Add Action dialog box, click Add
Another Action and repeat steps 2 through 3.
Add an action from the schedule graph
You can add Start Vusers, Duration, and Stop Vusers actions from the graph
by splitting an action into two actions, or appending a new action after the
last action in the graph.
To add an action by splitting an action in two:
1 Make sure that the graph is in Edit mode.
2 Select the line that represents the action that you want to split.
Tip: Selecting the action in the Actions grid highlights the corresponding
line in the graph.
136
Chapter 6 • Scheduling Manual Scenarios
3 Click the Split Action button. The selected line splits in two. In the
Actions grid, the original action splits into two equivalent actions, each
representing half of the original action. For example:
➤
Splitting a Duration action of 5 minutes results in two Duration
actions of 2.5 minutes each.
➤
Splitting a Start Vusers action that starts 20 Vusers results in two
Start Vusers actions, each starting 10 Vusers.
4 (Optional) Edit each of the actions. For details, see "How to Edit Schedule
Actions" on page 139.
To append an action after the last action:
1 Make sure that the graph is in Edit mode.
2 In the graph toolbar, click New Action.
3 Append new actions as follows:
➤
Start Vusers action. Click the graph anywhere above and to the right
of the endpoint of the last line of the graph.
For example:
➤
Duration action. Click the graph anywhere directly to the right of the
endpoint of the last line of the graph.
137
Chapter 6 • Scheduling Manual Scenarios
For example:
➤
Stop Vusers action. Click the graph anywhere below and to the right
of the endpoint of the last line of the graph.
For example:
4 Edit the actions. For details, see "How to Edit Schedule Actions" on
page 139.
138
Chapter 6 • Scheduling Manual Scenarios
How to Edit Schedule Actions
This task describes how to edit schedule actions, both in the Actions grid
and from the schedule graph.
This task includes the following steps:
➤
"Edit an action from the Actions grid" on page 139
➤
"Edit an action from the schedule graph" on page 139
Edit an action from the Actions grid
Double-click the action (or select it), click Edit Action, and edit the action as
desired.
You can also edit other actions before closing the Edit Action dialog box.
Click Previous or Next to navigate between the actions.
Edit an action from the schedule graph
You can edit real-world schedules from the graph: you can edit Start Vusers,
Stop Vusers, and Duration actions. When you edit actions from the graph,
the action’s details in the Actions grid are updated accordingly.
To edit an action from the graph, do one of the following:
➤
Double-click the line in the graph representing the action you want to
edit. Edit the action in the Edit Action dialog box that opens. Click
Previous or Next to edit other actions.
139
Chapter 6 • Scheduling Manual Scenarios
➤
Make sure that the graph is in Edit mode, select the line in the graph, and
drag it as follows:
Action
Modification
Start Vusers
To change the number of Vusers to start running:
➤ To start more Vusers, drag the diamond-shaped endpoint
upwards.
➤ To start fewer Vusers, drag the diamond-shaped endpoint
downwards.
Start Vusers
To change the time interval between starting Vusers:
➤ To increase the time interval, drag the diamond-shaped
endpoint to the right.
➤ To decrease the time interval, drag the diamond-shaped
endpoint to the left.
Note: A vertical line indicates that the Vusers start running
simultaneously.
Duration
➤ To increase the duration between scheduled actions, drag
the diamond-shaped endpoint to the right.
➤ To decrease the duration between scheduled actions, drag
the diamond-shaped endpoint to the left.
Stop Vusers
To change the number of Vusers to stop running:
➤ To stop fewer Vusers, drag the diamond-shaped endpoint
upwards.
➤ To stop more Vusers, drag the diamond-shaped endpoint
downwards.
Stop Vusers
To change the time interval between stopping Vusers:
➤ To increase the time interval, drag the diamond-shaped
endpoint to the right.
➤ To decrease the time interval, drag the diamond-shaped
endpoint to the left.
Note: A vertical line indicates that the Vusers stop running
simultaneously.
140
Chapter 6 • Scheduling Manual Scenarios
Tip: To fine-tune any of the details of the selected action line, use the
arrow keys on your keyboard, or edit the action in the Actions grid.
141
Chapter 6 • Scheduling Manual Scenarios
Reference
Schedule Actions
A scenario schedule contains a series of actions that instruct the scenario
when to start running a Vuser group, how to initialize Vusers, when to start
and stop running Vusers, and how long to run an action.
The following sections describe the available schedule actions.
➤
"Start Group" on page 142
➤
"Initialize" on page 143
➤
"Start Vusers" on page 144
➤
"Duration" on page 145
➤
"Stop Vusers" on page 146
Start Group
The Start Group action defines when to start running a Vuser group.
Options
Description
Start immediately after the scenario
begins
LoadRunner starts running the Vuser
group as soon as the scenario starts
running.
(Default)
142
Start <00:00:00> (HH:MM:SS) after the
scenario begins
After the scenario starts running,
LoadRunner waits the specified time
(in hours, minutes, and seconds)
before it starts running the Vuser
group.
Start when group <group name>
finishes
LoadRunner starts running the Vuser
group immediately after the Vuser
group specified in this option has
finished running.
Chapter 6 • Scheduling Manual Scenarios
Note:
➤
The Start Group action is available for group schedules only, and always
appears as each group’s first schedule action.
➤
The Start Group action is always followed by the Initialize action.
➤
The Start Group action cannot be deleted.
Initialize
The Initialize action instructs LoadRunner to prepare the Vusers so that they
are in the Ready state and can run.
Options
Description
Initialize all Vusers simultaneously
LoadRunner initializes all the Vusers
together before running them.
Initialize XX Vusers every
<00:00:00> (HH:MM:SS)
LoadRunner initializes the specified
number of Vusers gradually, according to
the specified time interval (in hours,
minutes, and seconds), before running
them.
Initialize each Vuser just before it
runs
LoadRunner initializes each Vuser just
before it starts running.
(Default)
Note: This option is not available for group
schedules when the Wait for all groups to
initialize option is selected. For details, see
page 158.
Note:
➤
The Initialize action appears in the Actions grid for all schedule types.
➤
The Initialize action cannot be deleted.
143
Chapter 6 • Scheduling Manual Scenarios
Start Vusers
The Start Vusers action instructs LoadRunner to start running Vusers.
Options
Description
Start XX Vusers: Simultaneously
LoadRunner runs the specified number
of Vusers simultaneously.
(Default)
Start XX Vusers: YY Vusers every
<00:00:00> (HH:MM:SS)
LoadRunner runs the specified number
of Vusers (XX) gradually. That is,
LoadRunner runs YY Vusers, and waits
the specified time (in hours, minutes,
and seconds) before running another
YY Vusers.
Note:
144
➤
LoadRunner starts running Vusers only when they have reached the
Ready state.
➤
In a basic schedule, LoadRunner always runs all the Vusers, whether
simultaneously or gradually. In a real-world schedule, you can select how
many Vusers to start running.
➤
While a scenario is running, you can add Vuser groups/scripts to
participate in the scenario. When starting the Vusers gradually, if you add
a Vuser group to the scenario after all the original Vusers have already
started running, the new group starts running immediately.
Chapter 6 • Scheduling Manual Scenarios
Duration
The Duration action instructs LoadRunner to continue running the scenario
in the current state, for the specified amount of time.
Options
Description
Run until completion
The scenario runs until all the Vusers
have finished running.
Note: In real-world schedules, this
option is available after the first Start
Vusers action only, and if selected,
causes all subsequent actions to be
deleted.
Run for XX days and <00:00:00>
(HH:MM:SS)
The scenario runs in its current state
for the specified amount of time (in
days, hours, minutes, and seconds)
before continuing with the next
action.
Default: 5 minutes.
Note: In a real-world schedule, if you
select this option, and this Duration
action is not followed by any other
action, the scenario continues to run
indefinitely.
Run indefinitely
The scenario runs indefinitely.
(Basic schedule only)
145
Chapter 6 • Scheduling Manual Scenarios
Stop Vusers
The Stop Vusers action instructs LoadRunner to stop running Vusers.
Options
Description
Stop XX Vusers: Simultaneously
LoadRunner stops running the
specified number of Vusers at once.
(Default)
Stop XX Vuser: YY Vusers every
<00:00:00> (HH:MM:SS)
LoadRunner stops running the
specified number of Vusers gradually.
That is, LoadRunner stops YY Vusers,
and waits the specified time (in hours,
minutes, and seconds) before stopping
another YY Vusers, until all XX Vusers
have stopped running.
Scheduler User Interface
This section includes (in alphabetical order):
146
➤
Add Action Dialog Box on page 147
➤
Edit Action Dialog Box on page 148
➤
Scenario Schedule Pane on page 149
Chapter 6 • Scheduling Manual Scenarios
Add Action Dialog Box
This dialog box enables you to add actions to a real-world scenario schedule
to simulate a more true-to-life schedule by which to run your scenario.
To access
In the Design tab > Scenario Schedule pane > Actions
grid, do one of the following:
➤ Double-click the last row in the Actions grid—marked
by an asterisk (*).
➤ In the Actions grid, select the action after which you
want to add a new action, and click Add Action After
.
Important
information
➤ Available for real-world schedules only.
➤ You can add Start Vusers, Duration, and Stop Vusers
actions only.
Relevant tasks
"How to Define a Schedule for the Scenario - Workflow"
on page 132
See also
➤ "Actions Grid" on page 150
➤ "Schedule Actions" on page 142
User interface elements are described below (unlabeled elements are shown
in angle brackets):
UI Elements (A-Z)
Description
Resets the Add Action dialog box so that you can add
another action.
Available only after clicking Apply when adding an
action.
Adds the defined action to the Actions grid. Leaves the
Add Action dialog box open, in edit mode, so that you
can make changes to the action you added or add
another action.
147
Chapter 6 • Scheduling Manual Scenarios
UI Elements (A-Z)
Description
<Action details area>
The details of the new action.
For details about the schedule actions, see "Schedule
Actions" on page 142.
Action type
The type of action to add.
Edit Action Dialog Box
This dialog box enables you to edit schedule actions.
To access
Use one of the following:
➤ Double click an action in the Actions grid or in the
interactive graph.
➤ Design tab > Scenario Schedule pane > Actions grid/
Schedule graph > Edit Action
Important
information
➤ In the Actions grid, you can edit all actions.
➤ In the interactive graph, you can edit Start/Stop Vusers
and Duration actions only.
Relevant tasks
➤ "How to Define a Schedule for the Scenario -
Workflow" on page 132
➤ "How to Edit Schedule Actions" on page 139
See also
➤ "Actions Grid" on page 150
➤ "Schedule Actions" on page 142
➤ "Interactive Schedule Graph" on page 154
148
Chapter 6 • Scheduling Manual Scenarios
User interface elements are described below (unlabeled elements are shown
in angle brackets):
UI Elements (A-Z)
Description
Displays the details of the previous/next action in the
Actions grid.
<Action details area>
Displays the current details of the selected action.
Action type
Displays the type of action selected.
Scenario Schedule Pane
This pane enables you to define a schedule for running your scenario.
To access
Manual scenario > Design tab
Relevant tasks
"How to Define a Schedule for the Scenario - Workflow"
on page 132
See also
➤ "Scheduling Manual Scenarios Overview" on page 128
➤ "Scheduling by Scenario or Group" on page 128
➤ "Schedule Run Modes" on page 130
User interface elements are described below:
UI Elements (A-Z)
Description
Actions grid
Displays a list of scenario’s schedule actions.
See "Actions Grid" on page 150.
149
Chapter 6 • Scheduling Manual Scenarios
UI Elements (A-Z)
Description
Interactive schedule
graph
Displays a graphical representation of the scenario
schedule. The lines in the graph correspond to the
actions defined in the Actions grid.
See "Interactive Schedule Graph" on page 154.
Schedule definition
area
Displays the selected schedule’s details.
See "Schedule Definition Area" on page 157.
Actions Grid
You define the actions for a schedule in this area. You can add, modify, and
delete actions. These actions include starting Vuser groups (in group
schedules) and initializing, starting, and stopping Vusers. You can also
define how long each action should continue.
When creating group schedules, you can copy group schedule settings from
one Vuser group to another.
To access
150
Manual scenario > Design tab > Scenario Schedule pane
Chapter 6 • Scheduling Manual Scenarios
Relevant tasks
➤ "How to Define a Schedule for the Scenario -
Workflow" on page 132
➤ "How to Add Actions to the Scenario Schedule" on
page 136
➤ "How to Edit Schedule Actions" on page 139
See also
➤ Parent Topic: "Scenario Schedule Pane" on page 149
➤ "Schedule Actions" on page 142
➤ "Interactive Schedule Graph" on page 154
User interface elements are described below:
UI Elements (A-Z)
(Real-world schedule
only)
Description
Add Action After. Opens the Add Action dialog box
where you can define new actions. For details, see "Add
Action Dialog Box" on page 147.
Note: The new action is added after the action selected in
the Actions grid.
Edit Action. Opens the Edit Action dialog box where you
can edit the schedule actions. For details, see "Edit Action
Dialog Box" on page 148.
Delete Action. Deletes the selected action.
Move Action Up. Moves the selected action up the grid.
Move Action Down. Moves the selected action down the
grid.
151
Chapter 6 • Scheduling Manual Scenarios
UI Elements (A-Z)
(Vuser group
schedules only)
Description
Copy Schedule Settings From. Enables copying group
schedule settings from one Vuser group to another in the
Scenario Groups pane.
Note: Schedule settings copied include the schedule
run mode (basic or real-world) and the set of schedule
actions.
Example: To copy group_1’s schedule settings to group_2,
select group_2 in the Scenario Groups pane. Then click
this button, and select group_1.
152
Chapter 6 • Scheduling Manual Scenarios
UI Elements (A-Z)
Description
Displays the total number of Vusers scheduled to run in
the scenario.
Note:
➤ This is editable in basic schedules, when the scenario
is in percentage mode only.
➤ When the scenario is in Vuser group mode and you are
defining a basic schedule, this value is updated when
you modify the quantity of Vusers in the Vuser groups.
For details, see "Add Vusers Dialog Box" on page 75.
➤ In real-world schedules, the total number of Vusers is
the sum of all the Vusers defined in the Start Vusers
actions.
Apply. When you modify the Total: <#> Vusers field,
applies the specified total number of Vusers
proportionately to the Vuser groups. (Percentages are
visible in the % column of the Scenario Scripts pane.)
Note: Appears only when Total: <#> Vusers is modified.
153
Chapter 6 • Scheduling Manual Scenarios
Interactive Schedule Graph
This graph provides a graphical representation of the scenario’s schedule.
From the graph, you can watch the progress of the schedule during a
scenario run.
To access
Manual scenario > Design tab > Scenario Schedule pane
Important
information
Only real-world schedules can be modified from the
interactive schedule graph. You can modify Start Vusers,
Duration, and Stop Vusers actions.
To modify a basic schedule, you must edit the actions in
the Actions grid itself.
Relevant tasks
➤ "How to Define a Schedule for the Scenario -
Workflow" on page 132
➤ "How to Add Actions to the Scenario Schedule" on
page 136
➤ "How to Edit Schedule Actions" on page 139
See also
➤ Parent Topic: "Scenario Schedule Pane" on page 149
➤ "Schedule Actions" on page 142
➤ "Actions Grid" on page 150
154
Chapter 6 • Scheduling Manual Scenarios
User interface elements are described below (unlabeled elements are shown
in angle brackets):
UI Elements (A-Z)
Description
New Action. Appends a new action after the last action in
the graph.
(Real-world schedule
only)
Append new actions as follows:
➤ Start Vusers. Click the graph anywhere to the right of
and above the endpoint of the last line of the graph.
➤ Duration. Click the graph anywhere to the right of the
the endpoint of last line of the graph.
➤ Stop Vusers. Click the graph anywhere to the right of
and below the endpoint of the last line of the graph.
Note: Available when the graph is in Edit mode only. (See
Edit/View Mode
below.)
(Real-world schedule
only)
Split Action. Splits a selected line in the graph in two. The
original action in the Actions grid is split into two
equivalent actions, each representing half of the original
action.
Examples:
➤ Splitting a Duration action of 5 minutes results in two
Duration actions of 2.5 minutes each.
➤ Splitting a Start Vusers action that starts 20 Vusers
results in two Start Vusers actions, each starting
10 Vusers.
Note: Available when the graph is in Edit mode only. (See
Edit/View Mode
below.)
Delete Action. Deletes a selected action.
(Real-world schedule
only)
Note: Available when the graph is in Edit mode only. (See
Edit/View Mode
below.)
Edit/View Mode. Switches the graph display between
Edit mode and View mode.
(Real-world schedule
only)
155
Chapter 6 • Scheduling Manual Scenarios
UI Elements (A-Z)
Description
Pause. Pauses the schedule during the scenario run.
When the schedule is paused, the red vertical line that
indicates the schedule’s progress freezes.
Note: Available only when the scenario is running.
Resume. Resumes a paused schedule. When the schedule
resumes running, the red vertical line continues moving
across the graph, indicating the schedule’s progress.
Note: Available only when the scenario is running.
Show Selected Group. Displays only the group selected
in the Scenario Groups pane.
Note: Available for group schedules only.
Show All Groups. Displays all Vuser groups participating
in the scenario.
Note: Available for group schedules only.
Open Full View. Opens the graph in its own window.
Note: All the options available in the Schedule pane’s
interactive graph are also available in the full-view graph
window.
Zoom In. Zooms into the x-axis of the graph— that is,
spreads the graph out to view shorter time intervals.
Zoom Out. Zoom out of the x-axis of the graph— that is,
displays longer time intervals.
Zoom Reset. Reverts to the default time intervals
displayed on the x-axis.
Hide Legend. Hides the graph legend.
Show Legend. Shows the graph legend.
156
Chapter 6 • Scheduling Manual Scenarios
UI Elements (A-Z)
Description
<End points>
When an action (line) in the graph is selected, two
endpoints are displayed:
➤ Dot. Starting point of the line.
➤ Diamond. The endpoint of a selected line. Can be
dragged to edit an action. For details, see "How to Edit
Schedule Actions" on page 139.
Note: To fine-tune any of the details of the selected
action line, use the arrow keys on your keyboard.
<Schedule progress
indicator>
A red vertical line that slides across the schedule graph
while the schedule is running.
Note: The schedule may run a few seconds ahead of the
scenario run.
<Time scroll bar>
Appears if, when zooming into the graph, the graph
spreads out wider than the graph area.
Schedule Definition Area
This area displays the selected schedule’s details.
157
Chapter 6 • Scheduling Manual Scenarios
To access
Manual scenario > Design tab > Scenario Schedule pane
Relevant tasks
"How to Define a Schedule for the Scenario - Workflow"
on page 132
See also
➤ Parent Topic: "Scenario Schedule Pane" on page 149
➤ "Scheduling by Scenario or Group" on page 128
➤ "Schedule Run Modes" on page 130
User interface elements are described below:
UI Elements (A-Z)
Description
New Schedule. Creates a new schedule.
Delete Schedule. Deletes the selected schedule.
Save New Name. Saves a new name given to the
schedule.
Note: Enabled when you start typing the new name.
Start Time. Opens the Scenario Start Time dialog box.
You can schedule the scenario to start running:
➤ Without delay. As soon as the Start Scenario command
is issued.
➤ With a delay of HH:MM:SS. The specified time after
the Start Scenario command was issued.
➤ At HH:MM:SS on <date>. At a specified time on the
specified date.
(Group schedule
only)
158
Wait for all groups to finish initialization. When this
option is selected, all of the Vusers in all of the Vuser
groups finish initializing before any of them start
running.
Note: When this option is selected, Initialize each Vuser
just before it runs is not available. For details about the
Initialize action, see "Initialize" on page 143.
Chapter 6 • Scheduling Manual Scenarios
UI Elements (A-Z)
Description
Run Mode
The mode according to which the schedule will run:
➤ Real-world schedule. A schedule designed according to
a true-to-life series of events.
➤ Basic schedule. A schedule according to which all the
Vusers start running, run for a given duration, and
then all stop running.
For details, see "Schedule Run Modes" on page 130.
Default value: Real-world.
Note: To change the default, select Tools > Options >
Execution tab.
Schedule by
The schedule type:
➤ Scenario. Runs all participating Vuser Groups together
on the same schedule.
➤ Group. Each Vuser group runs on its own schedule.
For details, see "Scheduling by Scenario or Group" on
page 128.
Schedule Name
The name given to the schedule.
159
Chapter 6 • Scheduling Manual Scenarios
160
7
Service Level Agreements
This chapter includes:
Concepts
➤
Service Level Agreements Overview on page 162
➤
Tracking Period on page 163
Tasks
➤
How to Define Service Level Agreements on page 164
➤
How to Define Service Level Agreements - Use-Case Scenario on page 166
Reference
➤
Service Level Agreements User Interface on page 171
161
Chapter 7 • Service Level Agreements
Concepts
Service Level Agreements Overview
Service level agreements (SLAs) are specific goals that you define for your
load test scenario. After a scenario run, HP LoadRunner Analysis compares
these goals against performance related data that was gathered and stored
during the course of the run, and determines whether the SLA passed or
failed.
Depending on the measurements that you are evaluating for your goal,
LoadRunner determines the SLA status in one of the following ways:
SLA Type
Description
SLA status determined at
time intervals over a
timeline
Analysis displays SLA statuses at set time intervals
over a timeline within the run. At each time
interval in the timeline—for example, every 10
seconds—Analysis checks to see if the
measurement’s performance deviated from the
threshold defined in the SLA.
Measurements that can be evaluated in this way:
➤ Average Transaction Response Time
➤ Errors per Second
SLA status determined
over the whole run
Analysis displays a single SLA status for the whole
scenario run.
Measurements that can be evaluated in this way:
➤ Total Hits per run
➤ Average Hits (hits/second) per run
➤ Total Throughput (bytes) per run
➤ Average Throughput (bytes/second) per run
You can define and edit SLAs in the Controller or in Analysis.
To define SLAs in the Controller, see "How to Define Service Level
Agreements" on page 164.
162
Chapter 7 • Service Level Agreements
For details about defining SLAs in Analysis and viewing SLA information in
Analysis reports, see the HP LoadRunner Analysis User Guide.
Tracking Period
When you define an SLAs for measurements that are evaluated over a
timeline, Analysis determines SLA statuses at specified time intervals within
that timeline. The frequency of the time intervals is called the tracking
period.
An internally-calculated tracking period is defined by default. You can
change the tracking period by entering a value in the Advanced Options
dialog box which Analysis plugs into a built-in algorithm to calculate the
tracking period. For details, see "Advanced Options Dialog Box" on
page 171.
163
Chapter 7 • Service Level Agreements
Tasks
How to Define Service Level Agreements
This task describes how to define service level agreements (SLAs).
You can define service level agreements (SLAs) which measure scenario goals
over time intervals, or over a whole scenario run. For details, see "Service
Level Agreements Overview" on page 162.
See also the HP LoadRunner Analysis User Guide.
Tip: For a use-case scenario related to this task, see "How to Define Service
Level Agreements - Use-Case Scenario" on page 166.
This task includes the following steps:
164
➤
"Prerequisites" on page 165
➤
"Run through the SLA wizard" on page 165
➤
"Define a tracking period - optional" on page 165
➤
"Results" on page 166
Chapter 7 • Service Level Agreements
1 Prerequisites
If you are defining an SLA for Average Transaction Response Time, your
scenario must include a script that contains at least one transaction.
2 Run through the SLA wizard
In the Service Level Agreement pane, click New to open the Service Level
Agreement wizard. For user interface details, see "Service Level Agreement
Wizard" on page 174.
a Select a measurement for the SLA.
b If you are defining an SLA for Average Transaction Response Time,
select the transactions to include in your goal.
c (Optional) When evaluating SLA statuses over a timeline, select load
criteria to take into account and define appropriate load value ranges
for the load criteria. For an example, see "How to Define Service Level
Agreements - Use-Case Scenario" on page 166.
d Set thresholds for the measurements.
➤
If the Average Transaction Response Time or Errors per Second
exceed the defined thresholds, Analysis will produce a Failed SLA
status.
➤
If Total Hits per run, Average Hits (hits/second) per run, Total
Throughput (bytes) per run, or Average Throughput (bytes/
second) per run are lower than the defined threshold, Analysis will
produce a Failed SLA status.
3 Define a tracking period - optional
For measurements whose SLA statuses are determined over time intervals,
you need to define the frequency of the time intervals, that is, the
tracking period. For details, see "Tracking Period" on page 163.
For user interface details, see "Advanced Options Dialog Box" on
page 171.
165
Chapter 7 • Service Level Agreements
4 Results
When analyzing your scenario run, HP LoadRunner Analysis compares
the data collected from the scenario run against the SLA settings, and
determines SLA statuses which are included in the default Summary
Report.
For more information, see the HP LoadRunner Analysis User Guide.
How to Define Service Level Agreements - Use-Case
Scenario
This use-case scenario describes how to define a service level agreement
(SLA) for Average Transaction Response Time.
This scenario includes the following steps:
➤
"Background" on page 166
➤
"Start the SLA wizard" on page 166
➤
"Select the measurement for the SLA" on page 167
➤
"Select the transactions to evaluate in your goal" on page 167
➤
"Select a load criterion and define appropriate ranges of load - optional"
on page 167
➤
"Set thresholds" on page 168
➤
"Results" on page 170
1 Background
The administrator of HP Web Tours would like to know when the average
transaction response time for booking a flight and searching for a flight
exceeds a certain value. Assume that your scenario includes a script that
includes the following transactions: book_flight and search_flight.
2 Start the SLA wizard
In the Service Level Agreement pane, click New to open the Service Level
Agreement wizard.
166
Chapter 7 • Service Level Agreements
3 Select the measurement for the SLA
On the Select a Measurement page, under SLA status determined at time
intervals over a timeline, select Average Transaction Response Time.
4 Select the transactions to evaluate in your goal
On the Select a Transaction page, select the transactions to be evaluated:
book_flight and search_flight.
5 Select a load criterion and define appropriate ranges of
load - optional
On the Select Load Criteria page, select the load criterion to take into
account when evaluating the average transaction response time.
In this case, to see the effect that various quantities of Vusers running on
the system has on the average transaction response time of each
transaction, in the Load Criteria box, select Running Vusers.
Then set the value ranges for the running Vusers:
Consider less than 20 Vusers to be a light load, 20 – 50 Vusers an average
load, and 50 Vusers or more a heavy load. Enter these values in the Load
Values boxes.
167
Chapter 7 • Service Level Agreements
Note:
➤
You can set up to three in-between ranges.
➤
Valid load value ranges are consecutive—there are no gaps in the
range—and span all values from zero to infinity.
6 Set thresholds
On the Set Threshold Values page, you define the acceptable average
transaction response times for the transactions, taking into account the
defined load criteria.
In this case, define the same threshold values for both transactions as
follows: for a light load, a reasonable average response time can be up to 5
seconds, for an average load, up to 10 seconds, and for a heavy load, up to
15 seconds.
168
Chapter 7 • Service Level Agreements
Tip: To define the same thresholds for all the transactions, you can type
the values in the table nearer the bottom of the Set Threshold Values
page, and click Apply to all transactions.
7 Define a tracking period - optional
When SLA statuses for a measurement are determined at time intervals
over a timeline, the frequency of the time intervals is determined by the
tracking period.
This step is optional because an internally-calculated tracking period of at
least 5 seconds is defined by default. You can change the tracking period
in the Advanced Options dialog box:
a In the Service Level Agreement pane, click the Advanced button.
b Select Tracking period of at least X seconds, and select a tracking
period. The time intervals are calculated by Analysis according to a
built-in algorithm and as a function of the value you enter here.
Example:
If you select a tracking period of 10, and the aggregation granularity
for the scenario (defined in Analysis) is 6, then the tracking period is
set to the nearest multiple of 6 that is greater than or equal to 10, that
is, Tracking Period = 12.
For details, see "Tracking Period" on page 163.
For user interface details, see "Advanced Options Dialog Box" on
page 171.
169
Chapter 7 • Service Level Agreements
8 Results
When analyzing your scenario run, Analysis applies your SLA settings to
the default Summary Report and the report is updated to include all the
relevant SLA information.
For example, it displays the worst performing transactions in terms of
defined SLAs, how specific transactions performed over set time intervals,
and overall SLA statuses.
For more information, see the HP LoadRunner Analysis User Guide.
170
Chapter 7 • Service Level Agreements
Reference
Service Level Agreements User Interface
This section includes (in alphabetical order):
➤
Advanced Options Dialog Box on page 171
➤
Goal Details Dialog Box on page 172
➤
Service Level Agreement Pane on page 173
Advanced Options Dialog Box
This dialog box enables you to define a tracking period for load test
scenario.
To access
Design tab > Service Level Agreement pane >
Important
Information
The tracking period is calculated by Analysis according to
a built-in algorithm and as a function of the value
entered here.
Relevant tasks
➤ "How to Define Service Level Agreements" on page 164
➤ "How to Define Service Level Agreements - Use-Case
Scenario" on page 166
See also
"Service Level Agreements Overview" on page 162
171
Chapter 7 • Service Level Agreements
User interface elements are described below:
UI Elements (A-Z)
Description
Internally calculated
tracking period
Analysis sets the tracking period to the minimum value
possible, taking into account the aggregation granularity
defined for the scenario. This value is at least 5 seconds.
It uses the following formula:
Tracking Period = Max (5 seconds, aggregation granularity)
Tracking period of at
least X seconds
Determines the minimum amount of time for the
tracking period. This value can never be less than 5
seconds.
Analysis sets the tracking period to the nearest multiple
of the scenario’s aggregation granularity that is greater
than or equal to the value (X) that you selected.
For this option, Analysis uses the following formula:
Tracking Period =
Max(5 seconds, m(Aggregation Granularity))
where m is a multiple of the scenario’s aggregation
granularity such that m(Aggregation Granularity) is
greater than or equal to X.
Example: If you select a tracking period of X=10, and the
aggregation granularity for the scenario is 6, then the
tracking period is set to the nearest multiple of 6 that is
greater than or equal to 10, that is, Tracking Period = 12.
Goal Details Dialog Box
This dialog box displays the thresholds that were set for the selected SLA.
172
To access
Design tab > Service Level Agreement pane >
Important
information
If you defined load criteria as part of your SLA, the
threshold values are displayed per the defined load value
ranges.
See also
"Service Level Agreements Overview" on page 162
Chapter 7 • Service Level Agreements
Service Level Agreement Pane
This pane lists all the service level agreements (SLAs) defined for the
scenario.
To access
Design tab
Relevant Tasks
➤ "How to Design a Goal-Oriented Scenario" on page 60
➤ "How to Design a Manual Scenario" on page 62
➤ "How to Define Service Level Agreements" on page 164
➤ "How to Define Service Level Agreements - Use-Case
Scenario" on page 166
See also
"Service Level Agreements Overview" on page 162
User interface elements are described below:
UI Elements (A-Z)
Description
Starts the Service Level Agreement wizard where you can
define new goals for the load test scenario.
Opens the Goal Details dialog box which displays a
summary of the details of the selected SLA.
Opens the Service Level Agreement wizard where you can
modify the goals defined in the SLA.
Deletes the selected SLA.
Opens the Advanced Options dialog box where you can
adjust the tracking period for measurements that are
evaluated per time interval over a timeline.
For more information, see "Tracking Period" on page 163.
For user interface details, see "Advanced Options Dialog
Box" on page 171.
Service Level
Agreement list
Lists the SLAs defined for the scenario.
173
Chapter 7 • Service Level Agreements
Service Level Agreement Wizard
This wizard enables you to define goals or service level agreements (SLAs)
for your load test scenario.
To access
Design tab > Service Level Agreement pane >
Important
information
There are two modes for the Service Level Agreement
wizard. The pages included in the wizard depend on the
measurement that is selected. See the wizard maps below.
Relevant tasks
➤ "How to Design a Goal-Oriented Scenario" on page 60
➤ "How to Design a Manual Scenario" on page 62
➤ "How to Define Service Level Agreements" on page 164
➤ "How to Define Service Level Agreements - Use-Case
Scenario" on page 166
174
Wizard map - Goal
measured per time
interval
The Service Level Agreement Wizard contains:
Wizard map - Goal
measured over whole
scenario run
The Service Level Agreement Wizard contains:
See also
"Service Level Agreements Overview" on page 162
Welcome > Select a Measurement Page > (Select
Transactions Page) > Set Load Criteria Page > Set
Threshold Values Page (Goal Per Time Interval)
Welcome > Select a Measurement Page > Set Threshold
Values Page (Goal Per Whole Run)
Chapter 7 • Service Level Agreements
Select a Measurement Page
This wizard page enables you to select a measurement for your goal.
Important
information
➤ General information about this wizard is available
here: "Service Level Agreement Wizard" on page 174.
➤ There are two modes for the Service Level Agreement
wizard. The wizard pages that follow depend on the
measurement that you select on this page. See the
wizard maps below.
Wizard map - Goal
measured per time
interval
The Service Level Agreement Wizard contains:
Wizard map - Goal
measured over whole
scenario run
The Service Level Agreement Wizard contains:
See also
"Service Level Agreements Overview" on page 162
Welcome > Select a Measurement Page > (Select
Transactions Page) > Set Load Criteria Page > Set
Threshold Values Page (Goal Per Time Interval)
Welcome > Select a Measurement Page > Set Threshold
Values Page (Goal Per Whole Run)
175
Chapter 7 • Service Level Agreements
User interface elements are described below:
UI Elements (A-Z)
Description
SLA status
determined over the
whole run
Evaluates a single SLA status for the whole scenario run.
Select one of the following measurements:
➤ Total Hits per run
➤ Average Hits (hits/second) per run
➤ Total Throughput (bytes) per run
➤ Average Throughput (bytes/second) per run
SLA status
determined per time
intervals over a
timeline
Evaluates SLA statuses at set time intervals within the
run. Select one of the following measurements:
➤ Average Transaction Response Time
➤ Errors per Second
The time intervals at which the SLA statuses are
evaluated are known as the tracking period. For details,
see"Tracking Period" on page 163.
176
Chapter 7 • Service Level Agreements
Select Transactions Page
This wizard page enables you to select transactions to evaluate as part of
your goal.
Important
information
➤ General information about this wizard is available
here: "Service Level Agreement Wizard" on page 174.
➤ This page is displayed only creating an SLA for Average
Transaction Response Time.
➤ In order to define an SLA for Average Transaction
Response Time, at least one of the Vuser scripts
participating in the scenario must include a
transaction.
➤ You can select multiple transactions using the CTRL
key.
Wizard map - Goal
measured per time
interval
The Service Level Agreement Wizard contains:
See also
"Service Level Agreements Overview" on page 162
Welcome > Select a Measurement Page > (Select
Transactions Page) > Set Load Criteria Page > Set
Threshold Values Page (Goal Per Time Interval)
User interface elements are described below:
UI Elements (A-Z)
Description
Available
Transactions
Lists the transactions in the Vuser scripts participating in
the scenario.
To move a script to the Selected Transaction list, select it
and click Add.
Selected Transactions
Lists the transactions in the Vuser scripts participating in
the scenario that have been selected for the SLA.
To remove a script from this list, select it and click
Remove.
177
Chapter 7 • Service Level Agreements
Set Load Criteria Page
This wizard page enables you to select load criteria to take into account
when testing your goal.
Important
information
➤ General information about this wizard is available
here: "Service Level Agreement Wizard" on page 174.
➤ This page is displayed only when defining an SLA that
determines SLA statuses per time interval over a
timeline.
➤ In the next wizard step (Set Threshold Values page),
you will set different thresholds per each of the load
ranges that you select here.
Wizard map - Goal
measured per time
interval
See also
178
The Service Level Agreement Wizard contains:
Welcome > Select a Measurement Page > (Select
Transactions Page) > Set Load Criteria Page > Set
Threshold Values Page (Goal Per Time Interval)
"Service Level Agreements Overview" on page 162
Chapter 7 • Service Level Agreements
User interface elements are described below:
UI Elements (A-Z)
Description
Load Criteria
The relevant load criteria that you want to use.
Example: If you want to see the impact of running Vusers
on the measurement, select Running Vusers.
To define an SLA without load criteria, select None.
Load Values
Valid load value ranges are consecutive—there are no
gaps in the range—and span all values from zero to
infinity.
➤ Less than. Enter the upper value for the lower range of
values for the load criteria.
The lower range is between 0 and the value you
entered. It does not include the upper value.
Example: If you enter 5, the lower range of values for
the load criteria is between 0 and 5, but does not
include 5.
➤ Between. The in-between range of values for the load
criteria. Enter lower and upper values for this range.
The lower range is included in this range; it does not
include the upper value.
Example: If you enter 5 and 10, the in-between range
of values for the load criteria is from 5 and up to, but
not including, 10.
Note: You can set up to three in-between ranges.
➤ Greater than. Enter the lower value for the upper
range of values for the load criteria.
The upper range includes values from the value you
entered and on.
Example: If you enter 10, the upper range of values for
the load criteria is from 10 and on.
Selected
Measurement
The measurement selected for the goal.
179
Chapter 7 • Service Level Agreements
Set Threshold Values Page (Goal Per Time Interval)
This wizard page enables you to set thresholds for the measurements you are
evaluating in your goal.
Important
information
➤ General information about this wizard is available
here: "Service Level Agreement Wizard" on page 174.
➤ If you defined load criteria in the Set Load Criteria
Page, you must set thresholds per each of the defined
load ranges. If you did not define load criteria, you set
one threshold value. For Average Transaction response
time, you set threshold values for each transaction.
Wizard map - Goal
measured per time
interval
The Service Level Agreement Wizard contains:
See also
"Service Level Agreements Overview" on page 162
Welcome > Select a Measurement Page > (Select
Transactions Page) > Set Load Criteria Page > Set
Threshold Values Page (Goal Per Time Interval)
User interface elements are described below (unlabeled elements are shown
in angle brackets):
UI Elements (A-Z)
Description
<Thresholds table>
The thresholds for your goal. If you defined load criteria,
enter thresholds for each range of values.
Note: If the maximum threshold value is exceeded
during a particular time interval during the run, Analysis
displays an SLA status of Failed for that time interval.
Apply to all
(Average Transaction
Response Time goal
only)
To apply one set of threshold values to all transactions
selected for the goal, enter the threshold values in this
table and click Apply to all transactions. These values are
applied to all the transactions in the Thresholds table at
the top of the page.
Note: Threshold values for selected transactions do not
have to be the same. You can assign different values for
each transaction.
Selected
Measurement
180
The measurement selected for the goal.
Chapter 7 • Service Level Agreements
Set Threshold Values Page (Goal Per Whole Run)
This wizard page enables you to set minimum thresholds for the
measurements you are evaluating in your goal.
Important
information
➤ General information about this wizard is available
Wizard map - Goal
measured over whole
scenario run
The Service Level Agreement Wizard contains:
See also
"Service Level Agreements Overview" on page 162
here: "Service Level Agreement Wizard" on page 174.
Welcome > Select a Measurement Page > Set Threshold
Values Page (Goal Per Whole Run)
User interface elements are described below:
UI Elements (A-Z)
Description
Selected
measurement
The measurement selected for the goal.
Threshold
The minimum threshold value for the selected
measurement.
Note: If the value of the measurement is lower than this
threshold during the run, Analysis displays an SLA status
of Failed for the entire run.
181
Chapter 7 • Service Level Agreements
182
8
Multiple IP Addresses
This chapter includes:
Concepts
➤
Multiple IP Addresses Overview on page 184
Tasks
➤
How to Add IP Addresses to a Load Generator on page 185
➤
How to Configuring Multiple IP Addresses on UNIX on page 187
Reference
➤
IP Wizard on page 190
183
Chapter 8 • Multiple IP Addresses
Concepts
Multiple IP Addresses Overview
Application servers and network devices use IP addresses to identify clients.
The application server often caches information about clients coming from
the same machine. Network routers try to cache source and destination
information to optimize throughput. If many users have the same IP
address, both the server and the routers try to optimize. Since Vusers on the
same load generator have the same IP address, server and router
optimizations do not reflect real-life situations.
LoadRunner’s Multiple IP Address feature enables Vusers running on a single
load generator to be identified by many IP addresses. The server and router
recognize the Vusers as coming from different load generators and as a
result, the testing environment is more realistic.
This feature can be implemented on Windows and UNIX platforms, and
applies to the following protocols:
184
Client/Server
DNS, Windows Sockets
Custom
Javascript Vuser, VB Vuser, VB Script Vuser
E-business
FTP, Palm, SOAP, Web (HTTP/HTML), Web Services,
WinSock\Web Dual Protocol
ERP/CRM
Oracle NCA, Oracle Web Applications 11i,
PeopleSoft Enterprise, SAP-Web, Siebel-Web
Legacy
RTE
Mailing Services
Internet Messaging (IMAP), POP3, SMTP
Streaming Data
Real
Wireless
i-Mode, VoiceXML, WAP
Chapter 8 • Multiple IP Addresses
Tasks
How to Add IP Addresses to a Load Generator
The following steps describe how to add IP addresses to a load generator.
This task includes the following steps:
➤
"Run the IP Wizard on the load generator" on page 185
➤
"Update the server’s routing table with the new addresses" on page 186
➤
"Enable the Multiple IP Addresses feature from the Controller." on
page 187
1 Run the IP Wizard on the load generator
➤
Windows: LoadRunner includes an IP Wizard program that you run on
Windows load generators to create multiple IP addresses. You add new
IP addresses to a machine once and use the addresses for all scenarios.
Run the IP Wizard on the load generator to add a specified number of
IP addresses.
For details, see "IP Wizard" on page 190.
After running the wizard, restart the load generator machine.
➤
UNIX: Manually configure the new IP addresses for UNIX load
generators. For details, see "How to Configuring Multiple IP Addresses
on UNIX" on page 187.
185
Chapter 8 • Multiple IP Addresses
2 Update the server’s routing table with the new addresses
Once the client machine has new IP addresses, the server needs the
addresses in its routing table, so that it can recognize the route back to the
client. If the server and client share the same netmask, IP class, and
network, the server’s routing table does not require modification.
Note: If there is a router between the client and server machines, the
server needs to recognize the path via the router. Make sure to add the
following to the server routing table: route from the Web server to the
router, and routes from the router to all of the IP addresses on the load
generator.
Update the Web server routing table as follows:
a Edit the batch file that appears in the IP Wizard Summary screen. An
example .bat file is shown below.
b For each occurrence of [CLIENT_IP], insert your IP address instead.
c Run the batch file on the server machine.
186
Chapter 8 • Multiple IP Addresses
3 Enable the Multiple IP Addresses feature from the Controller.
Once you define multiple IP addresses, you set an option to tell the
Controller to use this feature.
a In the Controller Design view, select Scenario > Enable IP Spoofer.
Note: You must select this option before connecting to a load
generator.
b In the Controller’s Tools > Options > General tab (Expert mode only),
specify how the Controller should allocate the IP addresses: per process
or per thread. For details, see "Options > General Tab" on page 226.
How to Configuring Multiple IP Addresses on UNIX
The following sections describe how to manually configure multiple IP
addresses on UNIX load generators.
➤
"HP 11.0 or higher" on page 187
➤
"IBM AIX" on page 188
➤
"Linux" on page 188
➤
"Solaris 2.5, 2.6, 7.0, 8.0" on page 188
HP 11.0 or higher
To define multiple IP addresses for a single Ethernet card, you need
IP Aliasing compiled into the kernel. To do this, use the ifconfig command:
/sbin/ifconfig lan1:0 x.x.x.x netmask 255.255.x.x up
Substitute the new IP address for x.x.x.x, and insert the correct information
for the subnet mask. Place this command in the rc.local file so that it
executes upon boot.
187
Chapter 8 • Multiple IP Addresses
IBM AIX
To define multiple IP addresses for a single Ethernet card, you need
IP Aliasing compiled into the kernel. To do this, use the ifconfig command:
/usr/sbin/ifconfig [int] [ip address] alias netmask [mask]
For example, if you want to add IP address 10.0.0.1 to the main interface,
you need to run, as root, the following:
/usr/sbin/ifconfig ne0 10.0.0.1 alias netmask 255.255.255.0
To execute this line upon boot, create a standard script in the appropriate
run level (/etc/rc.d/rc#.d).
Linux
To define multiple IP addresses for a single Ethernet card, you need
IP Aliasing compiled into the kernel. To do this, use the ifconfig command:
/sbin/ifconfig eth0:0 x.x.x.x netmask 255.255.x.x up
Substitute the new IP address for x.x.x.x, and insert the correct information
for subnet mask. Place this command in the rc.local file so that it executes
upon boot.
Solaris 2.5, 2.6, 7.0, 8.0
To configure the hme0 device to support more than one IP address:
1 Create entries in /etc/hosts for each hostname on your physical machine:
128.195.10.31 myhost
128.195.10.46 myhost2
128.195.10.78 myhost3
Create /etc/hostname.hme0:n files that contain the hostname for the
virtual host n.
188
Chapter 8 • Multiple IP Addresses
Note: hostname.hme0:0 is the same as hostname.hme0.
/etc/hostname.hme0 (Contains name myhost)
/etc/hostname.hme0:1 (Contains name myhost2)
/etc/hostname.hme0:2 (Contains name myhost3)
The above changes will cause the virtual hosts to be configured at boot
time.
2 You can also directly enable or modify logical hosts’ configuration by
running ifconfig directly on one of the logical hosts, using the hme0:n
naming scheme:
% ifconfig hme0:1 up
% ifconfig hme0:1 129.153.76.72
% ifconfig hme0:1 down
To verify the current configuration, use ifconfig –a.
189
Chapter 8 • Multiple IP Addresses
Reference
IP Wizard
This wizard enables you to create and save new IP addresses on Windows
machines.
To access
Start > Program Files > LoadRunner > Tools > IP Wizard
Important
information
This wizard resides on each load generator. It enables you
to create and save new IP addresses on Windows
machines. The new addresses can be a range of addresses
defined by the Internet Assignment Numbers Authority.
They are for internal use only, and cannot connect to the
Internet. This range of addresses is the default used by
the IP Wizard.
Relevant tasks
"How to Add IP Addresses to a Load Generator" on
page 185
IP Wizard Welcome - Step 1 of 3
User interface elements are described below:
190
UI Elements (A-Z)
Description
Create new settings
Enables you to define new IP settings on the load
generator.
Load previous
settings from file
Enables you to use an existing file with IP address
settings.
Restore Original
Settings
Restores original settings.
Chapter 8 • Multiple IP Addresses
IP Wizard - Step 2 of 3 - Optional
User interface elements are described below:
UI Elements (A-Z)
Description
<Web Server Address
box>
If you have more than one network card, enables you to
choose the card to use for IP addresses.
This step enables the IP Wizard to check the server’s
routing table to see if it requires updating after new IP
addresses are added to the load generator.
IP Wizard - Step 3 of 3 - Optional
User interface elements are described below:
UI Elements (A-Z)
Description
Opens the Add dialog box where you can add a new IP
address.
➤ Private Address Spaces. Classes that represents the
correct submask for the machine’s IP addresses.
➤ From IP. Adds IP addresses starting with this number.
➤ Submask. IP addresses include two components, a
netid and hostid. The submask determines where the
netid portion of the address stops and where the
hostid begins.
➤ Number to add. The number of IP addresses to add.
➤ Verify that new IP addresses are not already in use.
Instructs the IP Wizard to check the new addresses.
The IP Wizard adds only the addresses that are not
already in use.
Removes a selected IP Address
IP Address
The IP addresses on the load generator machine.
191
Chapter 8 • Multiple IP Addresses
UI Elements (A-Z)
Description
Subnet Mask
The submasks of the IP addresses on the load generator
machine.
Number of IPs added
The number of IP addresses added to the load generator
machine.
IP Wizard - Summary
User interface elements are described below:
UI Elements (A-Z)
Description
<Summary area>
Displays a summary of the operations performed by the
IP Wizard.
Take note of the location of the batch file (.bat). This is
used to update the routing table, if necessary. See "Update
the server’s routing table with the new addresses" on
page 186.
Reboot now to
update routing
tables
192
If you updated the routing table, rebooting initializes the
Windows device drivers with the new addresses.
9
Configuring Terminal Services Settings
This chapter includes:
Concepts
➤
Terminal Services Overview on page 194
Tasks
➤
How to Use the Terminal Services Manager on page 196
➤
How to Configure Terminal Sessions Over a Firewall on page 197
193
Chapter 9 • Configuring Terminal Services Settings
Concepts
Terminal Services Overview
You can use LoadRunner’s Terminal Services Manager to remotely manage
multiple load generators running in your load testing scenario on a terminal
server. In addition, you can use a terminal server to overcome the limitation
of being able to run only a single GUI Vuser on a Windows-based load
generator. By opening a terminal server session for each GUI Vuser, you can
run multiple GUI Vusers on the same application.
A terminal server client can have multiple terminal sessions running
simultaneously. Using LoadRunner’s Terminal Services Manager, you can
select the number of terminals to be used in your scenario (provided that
you have sufficient terminal sessions running), and the maximum number
of Vusers that can be run per terminal. The Terminal Services Manager then
evenly distributes the number of virtual users among the client sessions.
Note: This feature is not supported if the Controller and the load generators
connect over a firewall. To configure terminal services on a load generator
over a firewall, see "How to Configure Terminal Sessions Over a Firewall" on
page 197.
About Terminal Services
Terminal services allows centralized management of computing resources
for each client connected to the server, and provides each user with their
own working environment. Using a terminal server client, you can operate
in a server-based computing environment from a remote machine. The
terminal server transmits applications over the network and displays them
via terminal emulation software. Each user logs on and sees only his
individual session, which is managed transparently by the server’s operating
system independent of any other client session.
194
Chapter 9 • Configuring Terminal Services Settings
Note: Only users with administrator privileges can connect from the
Controller to a local load generator via a terminal services session.
The following diagram illustrates how the LoadRunner components work
together during a terminal session.
195
Chapter 9 • Configuring Terminal Services Settings
Tasks
How to Use the Terminal Services Manager
This task describes how to set up and use LoadRunner’s Terminal Services
Manager.
This task includes the following steps:
➤
"Prerequisite" on page 196
➤
"Set up the LoadRunner agent on the load generator" on page 196
➤
"Launch a terminal client session" on page 197
➤
"Distribute Vusers on the terminal server" on page 197
1 Prerequisite
Make sure that a load generator has been installed on the terminal
services machine. For more information, see the HP LoadRunner
Installation Guide.
2 Set up the LoadRunner agent on the load generator
Perform the following steps:
a Select Start > Programs > LoadRunner > Advanced Settings > Agent
Configuration, or run <LR>\launch_service\bin\AgentConfig.exe to
open the Agent Configuration dialog box.
b Select Enable Terminal Services, and click OK.
c Restart the LoadRunner Agent as a process by double-clicking the
shortcut on the desktop, or from Start > Programs > LoadRunner >
LoadRunner Agent Process. You need to run the LoadRunner Agent as
a process for each terminal session that you are running.
196
Chapter 9 • Configuring Terminal Services Settings
Note: For more information about the LoadRunner Agent, see
"Working with the LoadRunner Agent" on page 524.
3 Launch a terminal client session
Be aware of the following:
➤
You must open a Terminal Client session for each terminal that you
want to run Vusers on during the scenario.
➤
If you are connecting to an existing Terminal Services session, you
need to open a Terminal Client session, log in to the session, and run
the LoadRunner Agent as a process.
4 Distribute Vusers on the terminal server
In the Terminal Services Tab of the Load Generator Information dialog
box, Select Enable Terminal Services Manager and enter information
about the terminals and Vusers that you want to use. For more
information, see "Load Generator Configuration > Terminal Services Tab"
on page 116.
How to Configure Terminal Sessions Over a Firewall
This task describes how to configure a terminal sessions on a load generator
that is located over a firewall. You configure the terminal sessions as
independent virtual load generators. Each virtual load generator must have
its own logical name.
This task includes the following steps:
➤
"Prerequisite" on page 198
➤
"Configure the terminal sessions as independent load generators" on
page 198
197
Chapter 9 • Configuring Terminal Services Settings
1 Prerequisite
If the LoadRunner Agent is not running as a process, select Start >
Programs > LoadRunner > LoadRunner Agent Process to run it as a
process.
2 Configure the terminal sessions as independent load
generators
Perform the following steps:
a Select Start > Programs > LoadRunner > Advanced Settings > Agent
Configuration to open the Agent Configuration dialog box.
b Select Enable Firewall Agent and Enable Terminal Services.
c Click Settings to open the Agent Configuration Over Firewall Settings
dialog box.
d In the Local Machine Key field, enter a logical virtual load generator
name, for example, machine_ofw.
e Click OK.
f Create one or more terminal sessions on the load generator console
machine.
Keep in mind the following:
198
➤
For each terminal session, run the agent configuration as above. For
each session, specify a different Local Machine Key name, for
example, machine_ofw_1, machine _ofw_2, etc.
➤
If you stop the agent on a terminal session, you must reconfigure
the settings for that particular session before restarting the agent.
➤
When selecting the load generator for the scenario in the Controller,
select the local machine key for each individual virtual load
generator used.
10
Configuring WAN Emulation Settings
This chapter includes:
Concepts
➤
WAN Emulation Overview on page 200
➤
Typical Network Emulation Settings on page 200
➤
Emulated Locations Overview on page 201
➤
Viewing WAN Emulation Monitors on page 202
➤
Excluding Machines from WAN Emulation on page 202
Tasks
➤
How to Integrate WAN Emulation Into Your Scenario on page 204
Reference
➤
WAN Emulation Best Practices on page 206
Limitations on page 207
199
Chapter 10 • Configuring WAN Emulation Settings
Concepts
WAN Emulation Overview
HP LoadRunner is integrated with 3rd party software that enables you to
accurately test point-to-point performance of WAN-deployed products
under real-world network conditions. By installing this WAN emulation
software on your load generator, you can introduce highly probable WAN
effects such as latency, packet loss, and link settings. As a result of this, your
scenario performs the test in a more realistic environment that better
represents the actual deployment of your application.
You can create more meaningful results by configuring several load
generators with the same unique set of WAN effects, and by giving each set a
unique location name, for example, London. When viewing scenario results
in Analysis, you can group metrics from different load generators according
to their location names. For information on grouping metrics according to
an emulated location name, see the section that deals with applying filter
and sort criteria to graphs in the HP LoadRunner Analysis User Guide.
Typical Network Emulation Settings
The WAN Emulator allows you to emulate probable WAN effects over your
network, thereby creating a more realistic scenario. The most typical effects
which you can configure are:
Latency
The Latency value you define represents the time, in milliseconds, that it
takes an IP packet to cross the WAN. This is usually affected by geographical
distance, the available bandwidth, the network load on the route between
the two ends, and whether this is a terrestrial link or not.
200
Chapter 10 • Configuring WAN Emulation Settings
Packet Loss
The Packet Loss value you define represents the chance of losing IP packets
while data travels through a WAN. Packets can get lost due to link faults or
due to extreme network load.
Bandwidth
The Bandwidth value you define represents your network’s capacity to
transfer data over the WAN.
Emulated Locations Overview
To receive more meaningful results, you can configure your WAN Emulation
to emulate conditions unique to specific geographic locations. For example,
London and New York.
To view the results for location individually in Analysis, you can group the
results of the scenario by the emulated location name. In other words, for
any graph in Analysis, all the results of the ’New York based’ load generators
can be grouped together, as can all the results of the ’London based’ load
generators, and so on.
Note: In cases where you have to configure more than one load generator
per location, make sure that each load generator designated for a specific
location is configured with the same settings.
201
Chapter 10 • Configuring WAN Emulation Settings
For information on grouping Analysis graph data by emulated location
name, see the section that deals with applying filter and sort criteria to
graphs in the HP Analysis User Guide.
Viewing WAN Emulation Monitors
The WAN Emulation starts and stops automatically as you start and stop the
scenario. WAN Emulation monitors are assigned automatically when the
scenario run starts and WAN metrics are automatically collected during the
scenario run. You can view the WAN metrics during the scenario run in the
Windows Resources monitor.
If a load generator is connected over a firewall, you must add the monitors
manually using the Monitor Over Firewall component. For more
information, see "Monitors Over a Firewall" on page 353
Excluding Machines from WAN Emulation
In some situations, you may need to exclude certain machines from the
WAN Emulation, for example, a software update server. This means that you
set the WAN Emulator to refrain from affecting traffic from a load generator
to the specified machines. When a machine is excluded from the WAN
Emulation, network traffic to that machine does not suffer any WAN effects
and will not be included in the WAN Emulation results.
During a scenario run, machines, that if emulated, may affect the results of
the actual scenario (for example, the Controller) must be excluded.
Accordingly, the following machines are excluded by default:
➤
The Controller or the MI Listener and proxy server.
➤
The Diagnostics Commander server.
In addition to the machines which are excluded by default, the integrated
3rd party software may provide an interface for excluding additional
machines from the WAN Emulation. For a list of some examples of when
you may want to exclude additional machines, see "Additional Reasons to
Exclude Machines" below.
202
Chapter 10 • Configuring WAN Emulation Settings
Note: The option to exclude machines from the WAN Emulation might not
be available. To check for the availability of this option, consult the relevant
3rd party software documentation.
Additional Reasons to Exclude Machines
Examples of situations where you should exclude machines from an
emulated WAN include:
➤
In a Multiprotocol scenario that includes a Web server and a database
server; where information from the database server is not required as a
part of the load test. In such a case, you would exclude the database
server.
➤
You may want to exclude all deployment and software upgrade servers.
➤
Where a user runs and stores scripts on a shared network drive.
203
Chapter 10 • Configuring WAN Emulation Settings
Tasks
How to Integrate WAN Emulation Into Your Scenario
This task describes how to run a scenario using WAN Emulation and view
the WAN metrics in Analysis.
This task includes the following steps:
➤
"Prerequisite" on page 204
➤
"Determine emulated locations and define the WAN Emulation settings
for each load generator" on page 204
➤
"View WAN metrics in HP LoadRunner Analysis" on page 205
1 Prerequisite
Make sure that the relevant 3rd party components are installed on the
load generator machines.
Note that in addition to the load generators, you may be required to
install the WAN Emulator on additional LoadRunner components. For
more information, see the relevant WAN emulation software installation
documentation.
2 Determine emulated locations and define the WAN
Emulation settings for each load generator
Note: For concept details about emulated locations, see "Emulated
Locations Overview" on page 201.
On the main Controller toolbar, click the Load Generator button to open
the Load Generator Information dialog box. Select the desired load
generator, then click Details.
204
Chapter 10 • Configuring WAN Emulation Settings
On the WAN Emulation tab:
➤
In the Emulated Location box, determine which locations you would
like to emulate in your scenario.
➤
Click WAN Emulation Settings to open the third party software WAN
Emulation setting dialog box. For detailed information on configuring
WAN Emulation using this dialog box, see the relevant third party
software documentation. If several load generators are being
configured to emulate a specific location, make sure that each load
generator is configured with the same settings.
For user interface details, see "Load Generator Configuration > WAN
Emulation Tab" on page 123.
3 View WAN metrics in HP LoadRunner Analysis
The WAN Emulation starts and stops automatically as you start and stop
the scenario. WAN metrics are automatically collected during the scenario
run.
You can view all the WAN metrics in the Windows Resources monitor, as
well as in Analysis using all of the available analysis tools, including the
option to group metrics by emulated location, and to correlate data such
as response time with WAN metrics. For more information, see the HP
LoadRunner Analysis User Guide.
205
Chapter 10 • Configuring WAN Emulation Settings
Reference
WAN Emulation Best Practices
We recommend the following when running a scenario with WAN
Emulation:
➤
Once the scenario has started, check that WAN Emulation is running in
one of the following ways:
➤
Check for a confirmation message in the notification messages of the
Output window. The message should contain the following text:
WAN Emulation started on host <host name> with the following configuration
<config>
➤
➤
206
Ping the load generator from your machine and check that the latency
and packet loss behavior is as defined. Your machine must not be
excluded from WAN Emulation to do this.
If you kill the LR_Bridge.exe or magentproc.exe processes on a load
generator to stop a load test, manually stop the WAN Emulation as well.
Chapter 10 • Configuring WAN Emulation Settings
Limitations
➤
Selecting either Use bandwidth, or Use custom bandwidth in the
Network: Speed Simulation node in the Run Time Settings, may interfere
with the WAN Emulation settings and could lead to unexpected behavior.
For more information on Run Time Settings, refer to the HP Virtual User
Generator User Guide.
➤
There is no backward compatibility between the current LoadRunner/
WAN Emulation integration and any previous integrations.
➤
The integrated WAN emulation software may not comply with accepted
Internationalization (I18N) conventions.
➤
The WAN emulation software may consume large amounts of memory,
since the technology delays traffic and captures traffic for later analysis.
To verify that the load generator machine has sufficient memory,
compare the load generator memory consumption with and without the
emulation.
➤
WAN emulation software integration may not be available on the Unix
platform.
207
Chapter 10 • Configuring WAN Emulation Settings
208
Part III
Running Load Test Scenarios
210
11
Configuring Scenario Options
This chapter includes:
Concepts
➤
Configuring Scenario Options Overview on page 212
➤
Expert Mode on page 212
➤
Run-Time File Storage Locations on page 213
➤
Path Translation on page 214
Tasks
➤
How to Configure Scenario Options on page 216
Reference
➤
Path Translation Table on page 219
➤
Configuring Scenario Options User Interface on page 221
211
Chapter 11 • Configuring Scenario Options
Concepts
Configuring Scenario Options Overview
Before you run a scenario, you can configure both the load generator and
Vuser behavior for the scenario. Although the default settings correspond to
most environments, LoadRunner allows you to modify the settings to
customize the scenario behavior. The settings apply to all future scenario
runs and generally need to be set only once.
You configure these settings from the Tools > Options dialog box. Settings
related to load generator behavior apply to all the load generators in a
scenario.
Note: You can configure settings for an individual load generator that
override the global settings for that particular load generator. For details, see
"How to Modify Load Generator Details" on page 106.
Global scenario configuration settings are unrelated to the Vuser run-time
settings. Run-time settings apply to individual Vusers or scripts and contain
information about logging, think time, and the network, the number of
iterations, and the browser. For information on setting run-time settings, see
the HP Virtual User Generator User Guide.
Expert Mode
Expert mode is intended to provide support personnel with access to system
information. When you work in the Expert mode, the Controller dialog
boxes contain additional options for fine tuning the Controller operation.
To activate the Expert mode, select Tools > Expert Mode.
To deactivate Expert mode, select Tools and clear the Expert Mode option.
212
Chapter 11 • Configuring Scenario Options
Run-Time File Storage Locations
When you run a scenario, by default the run-time files are stored locally on
each load generator (the machine running the Vuser script). The default
location of the files is in the temporary directory specified by the load
generator’s environment variables (on Windows, TEMP or TMP, and on
UNIX, $TMPDIR or $TMP). If no environment variable is defined, the files
are saved to the /tmp directory.
Alternatively, you can store the run-time files on a shared network. A shared
network drive is a drive to which the Controller and all the load generators
in the scenario have read and write permission. If you select to save
run-time files on a shared network drive, you may need to perform path
translation. Path translation ensures that the specified results directory is
recognized by the remote load generator. For details about path translation
see "Path Translation" on page 214.
You select where to store run-time files in the Tools > Options >
Run-Time File Storage tab. For details, see "Options > Run-Time File Storage
Tab" on page 231.
213
Chapter 11 • Configuring Scenario Options
The primary run-time files are as follows:
Run-Time File Type
Description
Vuser Script files
When you run a Vuser, the Controller sends a copy
of the associated Vuser script to the load generator.
The script is stored in the load generator’s
temporary run-time directory.
If you specify that all Vusers access their Vuser
scripts directly at some shared location, no transfer
of script files occurs at run time. This method often
necessitates path translation. For details, see "Path
Translation" on page 214. This method may be
useful in either of the following situations:
➤ The file transfer facility does not work.
➤ The Vuser script files are large and therefore take
a long time to transfer. Remember that Vuser
script files are transferred only once during a
scenario.
Result files
While you run a scenario, the participating Vusers
write their results to the temporary run-time file
directory. After scenario execution, these result files
are collated or consolidated—results from all of the
load generators are transferred to the results
directory. After collating the results, the temporary
run-time directory is deleted.
For user interface details, see "Options > Run-Time
File Storage Tab" on page 231.
Path Translation
Path translation might be required when storing scripts and run-time data
results from a scenario on a shared network drive (Tools > Options >
Run-Time File Storage tab).
Path translation is a mechanism used by LoadRunner to convert a remote
path name for the Controller so that all participating machines recognize
the same network drive.
214
Chapter 11 • Configuring Scenario Options
Example 1
The scenario runs on a Windows-based machine and includes multiple
Vusers running on both Windows-based and UNIX load generators. One
remote load generator may map the network drive as F, while another load
generator maps the same drive as H. In a complex situation such as this, you
need to ensure that all participating load generators recognize the same
network drive.
Example 2
The Scenario Groups/Scripts pane in the Design view contains a list of all
the Vuser scripts associated with a scenario, and their locations. A script’s
location (path) is always based on the Controller machine’s mapping of that
location. If a load generator maps to the script’s path using a different name,
path translation is required.
For example, assume that the scenario is running on a Windows-based
machine named pc2, and that a Vuser script is located on a network drive.
The Controller machine maps the network drive as m:\lr_tests. If the
remote load generator hosting the Vusers also maps the path as m:\lr_tests,
no translation is necessary. However, if the remote machine maps the path
as another drive or path, for example r:\lr_tests, you must translate the path
to enable the load generator to recognize the script location.
Note: If the Controller and load generator machines are all Windows
machines, consider using the Universal Naming Convention method instead
of manually adding path translation information. On Windows machines,
you can tell the Controller to convert all paths to UNC, in which case all the
machines are able to recognize the path without requiring path translation.
An example of UNC format is \\machine_a\results.
215
Chapter 11 • Configuring Scenario Options
Tasks
How to Configure Scenario Options
The following sections describe how to configure options that will be
relevant for all your scenarios. You configure these options in the Options
dialog box (Tools > Options).
This task includes the following steps:
➤
"Configure timeout options" on page 216
➤
"Configure Vuser run-time settings" on page 216
➤
"Configure general scenario options for Expert mode" on page 217
➤
"Configure the default schedule run mode" on page 217
➤
"Configure global run-time file storage options" on page 218
➤
"Configure monitoring options" on page 218
➤
"Configure debug information options (Expert mode only)" on page 218
➤
"Configure output display options (Expert mode only)" on page 218
Configure timeout options
Select Tools > Options > Timeout tab and specify timeout values for
commands related to the load generator. For user interface details, see
"Options > Timeout Tab" on page 235.
If the command is not executed successfully within the timeout period, the
load generator status changes to Error.
Configure Vuser run-time settings
Select Tools > Options > Run-Time Settings tab. You can specify:
216
➤
The Vuser quota for a scenario
➤
How to stop running Vusers
Chapter 11 • Configuring Scenario Options
➤
Whether to use a seed number for random sequencing
For user interface details, see "Options > Run-Time Settings Tab" on
page 232.
Configure general scenario options for Expert mode
Select Tools > Options > General tab to specify the following general
scenario settings that apply when in Expert mode:
➤
Specify the directory for data table storage
➤
Disable collation of log files after a scenario run. For details, see "How to
Collate Scenario Run Results" on page 324.
➤
Enable multiple IP address allocation. For details, see "Multiple IP
Addresses" on page 183.
For user interface details, see "Options > General Tab" on page 226.
Configure the default schedule run mode
Select Tools > Options > Execution tab. Under Default Scheduler select a
default run mode. For user interface details, see "Options > Execution Tab"
on page 225.
For details about schedule run modes, see "Schedule Run Modes" on
page 130.
Define a command to run after scenario results are collated
Select Tools > Options > Execution tab. Under Post Collate Command, enter
a command to run after collating scenario results. For user interface details,
see "Options > Execution Tab" on page 225.
For more details about collating run results, see "How to Collate Scenario
Run Results" on page 324.
217
Chapter 11 • Configuring Scenario Options
Configure global run-time file storage options
Select Tools > Options > Run-Time File Storage tab, and specify where
LoadRunner should save and store scenario run-time files collected on
remote load generators:
➤
On the load generator
➤
On a shared network drive
For user interface details, see "Options > Run-Time File Storage Tab" on
page 231.
Note:
➤
LoadRunner applies these settings to all the load generators participating
in a scenario. You can change the settings for individual load generators
as described in "How to Modify Load Generator Details" on page 106.
➤
Storing the files on a shared network drive is not recommended as it
increases network traffic and necessitates path translation. For details
about path translation, see "Path Translation" on page 214.
Configure monitoring options
Select Tools > Options > Monitors tab, and configure the online monitoring
settings. For user interface details, see "Options > Monitors Tab" on
page 227.
Configure debug information options (Expert mode only)
Select Tools > Options > Debug Information tab, and determine the extent
of the trace to be performed during a scenario run. For user interface details,
see "Options > Debug Information Tab" on page 223.
Configure output display options (Expert mode only)
Select Tools > Options > Output tab, and configure how to display running
Vusers on the Controller machine. For user interface details, see "Options >
Output Tab" on page 229.
218
Chapter 11 • Configuring Scenario Options
Reference
Path Translation Table
To translate a path from one Windows-based computer to another, or
between Windows-based and UNIX machines, you create an entry in the
Path Translation table. This table contains a list of paths translated into
formats that can be recognized by different machines.
Each line of the Path Translation table has the following format:
<controller_host> <controller_path> <remote_path> [<remote_host>]
where:
➤
controller_host is the name or type of the machine that is running the
Controller.
The value of controller_host can be:
➤
<hostname>. The name of the machine running the Controller, for
example, LOADPC1
➤
win. The Controller is running on a Windows-based computer
➤
unix. The Controller is running on a UNIX machine
➤
all. The Controller is running on a Windows-based or a UNIX
machine
➤
controller_path is the path of a specific directory—as recognized by the
Controller. For example, if the directory scripts is located on the network
drive r—as mapped by the Controller—type the path r:\scripts in the
controller_path field.
➤
remote_path is the path of a specific directory—as recognized by the
remote machine. For example, if the directory scripts is located on the
network drive n—as mapped by the remote load generator—type the path
n:\scripts in the remote_path field.
219
Chapter 11 • Configuring Scenario Options
If a Vuser on the remote UNIX load generator recognizes the above path
as /m/tests, you would type this path in the remote_path field.
➤
remote_host is the name or type of the remote load generator. For
example, if all the remote machines are UNIX workstations, you could
type unix in the remote_host field. The options for the remote_host field
are the same as the options for the controller_host field, listed above. The
remote_host parameter is optional.
Examples
The examples below show the use of the Path Translation table for a
Windows-based Controller called Merlin.
➤
Example 1: Vusers are running on a Windows 2003 machine, Oasis.
Merlin maps the network drive as f:, while Oasis maps it as g:\loadtest.
merlin
➤
f:\
/u/tests/load/
Ultra
n:\
n:\
Jaguar
Example 4: All Windows-based Vuser load generators map the network
drive as m:\loadtest.
merlin
220
Oasis
Example 3: The mapping of the network drive by the remote load
generator Jaguar, is identical to the Controller’s mapping, so no
translation is required. This line can be excluded from the Path
Translation table.
merlin
➤
g:\loadtest\
Example 2: Vusers are running on a UNIX machine, Ultra. Ultra maps the
networks drive as /u/tests/load.
merlin
➤
f:\
l:\mnt\
m:\loadtest\
win
Chapter 11 • Configuring Scenario Options
Configuring Scenario Options User Interface
This section includes (in alphabetical order):
➤
Options Dialog Box on page 221
➤
Options > Debug Information Tab on page 223
➤
Options > Execution Tab on page 225
➤
Options > General Tab on page 226
➤
Options > Monitors Tab on page 227
➤
Options > Output Tab on page 229
➤
Options > Path Translation Tab on page 230
➤
Options > Run-Time File Storage Tab on page 231
➤
Options > Run-Time Settings Tab on page 232
➤
Options > Timeout Tab on page 235
Options Dialog Box
This dialog box enables you to configure scenario options.
To access
Tools > Options
Important
information
The settings configured in this dialog box:
➤ Generally need to be set only once
➤ Apply to all future scenarios
➤ Apply globally to all the load generators in a scenario.
Note: You can change the settings for individual load
generators (see "How to Modify Load Generator
Details" on page 106). Individual load generator
settings override global scenario settings.
Relevant tasks
"How to Configure Scenario Options" on page 216
221
Chapter 11 • Configuring Scenario Options
User interface elements are described below:
UI Elements (A-Z)
Description
Debug Information
tab
Enables you to determine the extent of the trace to be
performed during a scenario run.
(Expert mode only)
For details, see "Options > Debug Information Tab" on
page 223.
Execution tab
Enables you to configure the following miscellaneous
scenario settings:
➤ The default schedule run mode for a new scenario
➤ The command to run after collating scenario results
For details, see "Options > Execution Tab" on page 225.
General tab
(Expert mode only)
Enables you to specify global settings for data table
storage, log file collation, and multiple IP address
allocation.
For details, see "Options > General Tab" on page 226.
Monitors tab
Enables you to configure the online monitoring settings.
For details, see "Options > Monitors Tab" on page 227.
Output tab
(Expert mode only)
Enables you to configure how running Vusers are
displayed on the Controller machine.
For details, see "Options > Output Tab" on page 229.
Path Translation
Table tab
Enables you to perform path translation when storing
result and script files stored on a shared network drive.
For details, see "Options > Path Translation Tab" on
page 230.
Run-Time File
Storage tab
Enables you to specify where LoadRunner should save
and store the run-time files.
Default value: On the current Vuser machine
For details, see "Options > Run-Time File Storage Tab" on
page 231
222
Chapter 11 • Configuring Scenario Options
UI Elements (A-Z)
Description
Run-Time Settings
tab
Enables you to specify scenario run-time settings.
Timeout tab
Enables you to specify timeout values for certain
commands related to the load generator.
For details, see "Options > Run-Time Settings Tab" on
page 232.
For details, see "Options > Timeout Tab" on page 235.
Options > Debug Information Tab
This tab enables you to configure the settings to determine the extent of the
trace to be performed during a scenario run.
To access
Tools > Options > Debug Information tab
Important
Information
➤ This tab is available only when the Controller is
operating in the Expert mode.
➤ The debug information is written to the Output
window.
Relevant tasks
"How to Configure Scenario Options" on page 216
See also
"Output Window" on page 271
223
Chapter 11 • Configuring Scenario Options
User interface elements are described below:
UI Elements (A-Z)
Description
Sets the default debug information settings.
Keep temporary files
The LoadRunner Agent and Controller create temporary
files that collect information such as the parameter file
sent to the Vuser, the output compilation file, and the
configuration file. The Agent files are saved in brr folders
in the TMP or TEMP directory of the Agent machine. The
Controller files are saved in lrr folders in the TMP or
TEMP directory of the Controller machine. At the end of
the scenario, all these files are automatically deleted.
When selected, this option instructs the Agent and
Controller not to delete these files so that you can use
them for debugging.
Trace Flags
For debugging purposes, you can configure the type of
trace performed by LoadRunner during the scenario run.
Select the appropriate options to enable the detailed
trace. The available trace flags are:
➤ General
➤ File Transfer
➤ Incoming Communication
➤ Outgoing Communication
The trace information appears in the log file located in
the specified Agent log directory.
Note: Select only the flags relating to your problem. For
example, if you encounter specific problems with the
transfer of files, select the File Transfer flag.
224
Chapter 11 • Configuring Scenario Options
Options > Execution Tab
This tab enables you to configure miscellaneous scenario execution settings.
To access
Tools > Options > Execution tab
Relevant tasks
"How to Configure Scenario Options" on page 216
See also
➤ "Schedule Run Modes" on page 130
User interface elements are described below:
UI Elements (A-Z)
Description
Default Scheduler
Enables you to set the default schedule run mode for new
scenarios.
➤ Real-world schedule. Runs the scenario according to a
real-world set of events
➤ Basic schedule. Runs a basic schedule, starting the
Vuser, running the for a given amount of time, and
stopping them.
For more details, see "Schedule Run Modes" on page 130).
Post Collate
Command
Enables you to define a command that the Controller
will run directly after it collates the results of a
scenario run.
Example: You can define a command to run a customer
application that runs the Analysis API to extract data.
Note: In the command, you can use the keyword,
%ResultDir%, to refer to the scenario’s results directory.
(This keyword is not case sensitive.)
225
Chapter 11 • Configuring Scenario Options
Options > General Tab
This tab enables you to specify global settings for data table storage, log file
collation, and multiple IP address allocation.
To access
Tools > Options > General tab
Important
Information
This tab is available only when the Controller is
operating in Expert mode.
Relevant tasks
➤ "How to Configure Scenario Options" on page 216
➤ "How to Add IP Addresses to a Load Generator" on
page 185
User interface elements are described below:
UI Elements (A-Z)
Description
Data tables global
directory
The network location for data tables used as a source for
parameter values.
Note: This setting is only required for scripts created with
earlier versions of LoadRunner.
Do not collate log
files
LoadRunner collates only result files, and not log files.
Multiple IP address
mode
Allocates IP addresses when the multiple IP address
option is enabled (Scenario > Enable IP Spoofer). The
Controller can allocate an IP address per process or per
thread. Allocation per thread results in a more varied
range of IP addresses in a scenario.
Note: If the IP Spoofer is not enabled, this option is not
available.
226
Chapter 11 • Configuring Scenario Options
Options > Monitors Tab
In this tab you can enable the Transaction monitor, configure the behavior
of the transaction data, and set the data sampling rate, error handling,
debugging, and frequency settings for the online monitors.
To access
Tools > Options > Monitors tab
Relevant tasks
"How to Configure Scenario Options" on page 216
See also
"How to Set Up the Monitoring Environment –
Workflow" on page 443
User interface elements are described below:
UI Elements (A-Z)
Description
Sets the default timeout values.
Debug
If Display debug messages is selected, debug-related
messages are sent to the Output window.
For the Network monitor the messages are sent according
to the specified debug level (1 - 9).
Error Handling
Controls the way in which LoadRunner issues error
messages:
➤ Send errors to the Output window.
➤ Pop-up an error message box.
Send
(Expert mode only)
➤ Summary. Sends a summary of the collected data back
to the Controller. Use this option if the speed at which
the data is transferred is significant to you.
➤ Raw Data. Sends all of the data in raw form back to the
Controller. Sending the data in raw form saves time
because the data does not need to be processed.
However, since all of the data is being transferred to
the Controller, it may cause more network traffic.
227
Chapter 11 • Configuring Scenario Options
UI Elements (A-Z)
Description
Transaction Data
Configures the behavior of data for the Transaction, Data
Point, and Web Resource online graphs.
➤ Enable Transaction Monitor. Enables the online Vuser
Transaction monitor to start monitoring transactions
at the start of a scenario.
➤ Frequency. The frequency, in seconds, at which the
online monitor samples the data to produce the
Transaction, Data Point, and Web Resource online
graphs. For a small scenario, use a lower frequency, for
example, 1. For a large scenario, use a higher
frequency, for example, 3 - 5. The higher the
frequency, the less network traffic there will be. The
data is averaged for the frequency period defined, and
only one value is sent to the Controller.
Default value: 5 seconds
For information on enabling and disabling the
Transaction monitor and Web Page Diagnostics, see
"Run-Time and Transaction Monitoring" on
page 471.
Note:
➤ Disabling this option conserves resources.
➤ You cannot modify these settings during scenario
execution; you must stop the scenario before disabling
the monitor or changing its frequency.
228
Chapter 11 • Configuring Scenario Options
UI Elements (A-Z)
Description
Server Resource
Monitors
Configures the behavior of the Server Resource monitors.
➤ Data Sampling Rate. The sampling rate is the period of
time (in seconds) between consecutive samples. Enter
the rate at which LoadRunner samples the scenario for
monitoring data. If you increase the sampling rate, the
data is monitored less frequently. This setting applies
to all graphs.
Default value: 3 seconds
Note:
➤ This data sampling rate is applied to all server
monitors that are subsequently activated. It is not
applied to server monitors that have already been
activated. To apply the new data sampling rate to
activated server monitors, save your scenario and
reopen it.
➤ Each monitor has a different minimum sampling rate.
If the default sampling rate or the rate set here is less
than a monitor’s minimum sampling rate, the
monitor will sample data at intervals of its minimum
sampling rate. For example, the minimum sampling
rate for the Oracle Monitor is 10 seconds. If the
sampling rate is set here at less than 10 seconds, the
Oracle Monitor will continue to monitor data at 10
second intervals.
Options > Output Tab
This tab enables you to configure how to display running Vusers on the
Controller machine.
To access
Tools > Options > Output tab
Important
information
This tab is available only when the Controller is
operating in Expert mode.
229
Chapter 11 • Configuring Scenario Options
Relevant tasks
"How to Configure Scenario Options" on page 216
See also
"Output Window" on page 271
User interface elements are described below:
UI Elements (A-Z)
Description
Sets the default output options.
Configuration of the
"Show Vuser"
operation
Specifies how to handle the Vuser logs:
➤ Max. simultaneously displayed. The maximum
number of Vuser logs that may be displayed
simultaneously, as well as the maximum number of
active UNIX, GUI, RTE, or Web Vusers that the
Controller should display by opening up Run-Time
Viewers on your machine.
Default value: 10
➤ Refresh timeout (milliseconds). How often the Vuser
log should be refreshed.
Default value: Every 1000 milliseconds
Delete Output
window messages
upon Reset
When selected, clears all messages in the Output window
when you reset a scenario.
Options > Path Translation Tab
This tab enables you to perform path translation when storing result and
script files on a shared network drive.
To access
Tools > Options > Path Translation tab
Relevant tasks
"How to Configure Scenario Options" on page 216
See also
➤ "Run-Time File Storage Locations" on page 213
➤ "Path Translation" on page 214
230
Chapter 11 • Configuring Scenario Options
User interface elements are described below (unlabeled elements are shown
in angle brackets):
UI Elements (A-Z)
Description
<Path Translation
table>
Displays a list of paths translated into formats that can be
recognized by different machines.
You can insert comments by typing the # symbol at the
start of a line in the table.
For details, see "Path Translation Table" on page 219.
Convert to UNC
When selected, LoadRunner ignores the path translation
table and converts all paths to the Universal Naming
Convention.
Note: This option can be used only when the Controller
and load generator machines are all Windows-based
machines.
Mode
The read/write permissions for the ppath.mnt file which
contains the path translation table.
Path
The path to the ppath.mnt file which contains the path
translation table.
Options > Run-Time File Storage Tab
This tab enables you to specify where LoadRunner should save run-time
files.
To access
Tools > Options > Run-Time File Storage tab
Important
information
The run-time file storage options described below apply
to all the load generators in a scenario. To change the
settings for an individual load generators see "Load
Generator Configuration > Run-Time File Storage Tab" on
page 112.
Relevant tasks
➤ "How to Configure Scenario Options" on page 216
➤ "How to Prepare a Scenario to Run" on page 238
See also
"Run-Time File Storage Locations" on page 213
231
Chapter 11 • Configuring Scenario Options
User interface elements are described below:
UI Elements (A-Z)
Description
Scripts and results
stored
Select one of the following options:
➤ On the current Vuser machine. Saves the run-time files
on the load generator that is running the Vuser script.
Note: If you select this option, you must collate the
results before you can perform any analysis. You can
wait for LoadRunner to collate the results when you
launch HP LoadRunner Analysis, or you can collate
results by choosing Results > Collate Results.
Alternatively, select Results > Auto Collate Results to
automatically collate the results at the end of each
scenario run.
➤ On a shared network drive. Saves the scenario results
and/or the Vuser scripts on a shared network drive. A
shared network drive is a drive to which the Controller
and all the load generators in the scenario have read
and write permission.
Note: If you select this option, you may need to perform
path translation. Path translation ensures that the
specified results directory is recognized by the remote
load generator. For information about path translation,
see "Path Translation" on page 214.
Options > Run-Time Settings Tab
This tab enables you to specify scenario run-time settings relating to Vuser
quotas, stopping Vusers, and the seed for random sequences.
To access
Tools > Options > Run-Time Settings tab
Relevant tasks
➤ "How to Configure Scenario Options" on page 216
➤ "How to Prepare a Scenario to Run" on page 238
232
Chapter 11 • Configuring Scenario Options
User interface elements are described below:
UI Elements (A-Z)
Description
Sets the default run-time setting values.
Use random
sequence with seed
Allows LoadRunner to use a seed number for random
sequencing. Each seed value represents one sequence of
random values used for test execution. Whenever you
use this seed value, the same sequence of values is
assigned to the Vusers in the scenario. This setting
applies to parameterized Vuser scripts using the Random
method for assigning values from a data file. It also
affects the random percentage of recorded think time (see
information on the Run-Time Settings dialog box in the
HP Virtual User Generator User Guide).
Enable this option if you discover a problem when
running the test and want to repeat the test using the
same sequence of random values.
Default: 0
233
Chapter 11 • Configuring Scenario Options
UI Elements (A-Z)
Description
Vuser Quota
To prevent your system from overloading, you can set
quotas for Vuser activity. The Vuser quotas apply to
Vusers on all load generators.
➤ Number of Vusers that may be initialized at one time -
all load generators. The maximum number of Vusers
the load generator can initialize at a time (when an
Initialize command is sent).
Default: 999
When stopping
Vusers
Controls how Vusers stop running when the Stop button
is clicked.
➤ Wait for the current iteration to end before stopping.
(Default) The Vuser completes the iteration it is
running before stopping. The Vusers move to the
Gradual Exiting status and exit the scenario gradually.
➤ Wait for the current action to end before stopping.
The Vuser completes the action it is running before
stopping. The Vusers move to the Gradual Exiting
status and exit the scenario gradually.
➤ Stop immediately. The Vusers stop running
immediately. The Vusers move to the Exiting status
and exit the scenario immediately.
234
Chapter 11 • Configuring Scenario Options
Options > Timeout Tab
This tab enables you to specify timeout values for certain commands related
to the load generator.
To access
Tools > Options > Timeout tab
Important
information
LoadRunner enables you to set the timeout interval for
commands and Vuser elapsed time.
The command timeouts are the maximum time limits for
various LoadRunner commands. When a command is
issued by the Controller, you set a maximum time for the
load generator or Vuser to execute the command. If it
does not complete the command within the timeout
interval, the Controller issues an error message
Note: LoadRunner recognizes the fact that the number of
active Vusers influences the timeout values. For example,
1000 Vusers trying to initialize will take much longer
than 10 Vusers. LoadRunner adds an internal value,
based on the number of active Vusers, to the specified
timeout value.
Relevant tasks
"How to Configure Scenario Options" on page 216
User interface elements are described below:
UI Elements (A-Z)
Description
Sets the default timeout values.
Command Timeout
(seconds)
If Enable timeout checks is selected, this area defines how
LoadRunner should monitor the status of load generators
and Vusers after a command is issued by the Controller.
If the load generator or Vuser does not complete the
command within the timeout interval you specified, the
Controller issues an error message.
If Enable timeout checks is not selected, LoadRunner
waits an unlimited time for the load generators to
connect and disconnect, and for the Initialize, Run,
Pause, and Stop commands to be executed.
235
Chapter 11 • Configuring Scenario Options
UI Elements (A-Z)
Description
Command Timeout:
Load Generator
➤ Connect. The time limit that LoadRunner waits to
connect to any load generator. If a connection is not
successful within this time, the status of the load
generator changes to Failed.
Default value: 120 seconds.
➤ Disconnect. The time limit that LoadRunner waits to
disconnect from any load generator. If a disconnection
is not successful within this time, the status of the
load generator changes to Failed.
Default value: 120 seconds.
Command Timeout:
Vuser
➤ Init. The timeout value for the Initialize command.
Default value: 180 seconds.
➤ Run. The timeout value for the Run command.
Default value: 120 seconds.
➤ Pause. The timeout value for the Pause command.
Default value: 120 seconds.
➤ Stop. The timeout value for the Stop command.
Default value: 120 seconds.
Update Vuser
elapsed time every
The frequency at which LoadRunner updates the value
displayed in the Elapsed Time column in the Vusers
dialog box.
Default value: 4 seconds.
Example: If you select a Vuser and click the Initialize
button, LoadRunner checks whether the Vuser reaches
the READY state within 180 seconds (the default Init
timeout period); if it does not, the Controller issues a
message indicating that the Init command timed out.
236
12
Before Running Your Scenario
This chapter includes:
Tasks
➤
How to Prepare a Scenario to Run on page 238
Reference
➤
Scenario Pre-Run Configuration User Interface on page 243
237
Chapter 12 • Before Running Your Scenario
Tasks
How to Prepare a Scenario to Run
This task describes steps to take before you start running your scenario.
For details on designing the scenario, see "Designing Scenarios" on page 53.
This task includes the following steps:
➤
"Specify result file name and location" on page 238
➤
"Specify Scenario Run-Time Settings" on page 240
➤
"Set up the monitoring environment - optional" on page 241
➤
"Delete diagnostics log files from servers" on page 241
➤
"Enable Automatic Result Collation - optional" on page 241
➤
"Schedule scenario - Optional" on page 242
➤
"Provide scenario summary information - optional" on page 242
➤
"Set up the scenario to run GUI Vusers - optional" on page 242
Specify result file name and location
Select Results > Results Settings.
1 Enter a descriptive name for the result file.
This is especially useful for cross results analysis, in which LoadRunner
superimposes the results of several scenario runs in a single graph and lets
you compare the results of multiple scenario runs. Giving each run a
descriptive name enables you to distinguish between the results of the
multiple runs displayed later in the analysis graph.
2 Enter the full path to the directory where the result file will be stored.
This depends on the run-time file storage options configured.
238
Chapter 12 • Before Running Your Scenario
For details on setting global run-time file storage options, see "Options >
Run-Time File Storage Tab" on page 231. To set run-time file storage
options for an individual load generator, see "Load Generator
Configuration > Run-Time File Storage Tab" on page 112.
➤
If you are using the default file storage setting (local machine), specify
a directory in which to store all of the collated results after the scenario
run.
➤
If you specified a shared network drive as the file storage method,
specify the directory to which Vuser groups should write during
scenario execution.
3 Select the appropriate options for subsequent scenario runs.
239
Chapter 12 • Before Running Your Scenario
Note:
➤
When comparing the results of scenario runs in Analysis, the graph
displays all the result sets by name. For example, the image below
displays the superimposed results sets of two scenario runs, res12, and
res15.
When naming the results files, avoid using the same name when saving to different directories.
➤
You can use HP’s Web-based test management program, HP
Application Lifecycle Management, to store results to a project. For
information, see "Managing Scenarios Using Application Lifecycle
Management" on page 337.
Specify Scenario Run-Time Settings
You can instruct LoadRunner to allow an individual Vuser or the Vusers in a
group to complete the iterations they are running before stopping, to
complete the actions they are running before stopping, or to stop running
immediately. For details, see "Options > Run-Time Settings Tab" on
page 232.
240
Chapter 12 • Before Running Your Scenario
Set up the monitoring environment - optional
LoadRunner enables you to view data generated during the scenario run
using the online monitors. Before the run, specify the server machines that
the Controller should monitor during the scenario run.
For details, see "How to Set Up the Monitoring Environment – Workflow" on
page 443.
Delete diagnostics log files from servers
➤
Siebel Diagnostics: Delete Siebel Diagnostics logs (*.sarm files) from all
servers involved in the load test.
➤
Siebel DB Diagnostics: Delete log files from all servers involved in the
load test.
➤
Oracle 11i Diagnostics: Delete trace log files from all servers involved in
the load test.
Enable Automatic Result Collation - optional
If you are using the default file storage setting—local machine— (see
"Specify result file name and location" above), prior to running the scenario
you can enable auto-collation. As soon as the scenario run is complete,
LoadRunner automatically collates the results from all the load generators
and diagnostics mediators/servers.
Note: Alternatively, you can collate the results manually after the scenario
run is complete. For details, see "How to Collate Scenario Run Results" on
page 324.
To enable automatic collation, select Results > Auto Collate Results. When
this feature is enabled, Auto Collate Results is displayed in the status bar.
If you are working in Expert mode, you can disable the collation of the log
files. Select Tools > Options > General tab > Do not collate log files.
241
Chapter 12 • Before Running Your Scenario
To set a post-collation command, select Tools > Options > Execution tab, and
enter the command in the Post Collate Command box. For details, see
"Options > Execution Tab" on page 225.
Enable Auto Load Analysis- optional
To invoke HP LoadRunner Analysis as soon as the scenario is finished
running, select Results > Auto Load Analysis. When this is enabled, Auto
Load Analysis is displayed in the status bar.
Schedule scenario - Optional
Define a schedule for the scenario. For details, see "How to Define a
Schedule for the Scenario - Workflow" on page 132.
Provide scenario summary information - optional
Select Scenario > Summary Information, and enter the scenario’s summary
information.
For details, see "How to Define a Schedule for the Scenario - Workflow" on
page 132.
Set up the scenario to run GUI Vusers - optional
If you have integrated a QuickTest script into the scenario:
➤
Ensure that QuickTest is closed before running the scenario.
➤
In the Run-Time Settings for script dialog box, only the General categories
and sub-categories (General, Iterations, Miscellaneous, Think Time) are
relevant for QuickTest and WinRunner tests. The Replay options are not
relevant.
Note: You can run only one GUI Vuser concurrently per machine.
242
Chapter 12 • Before Running Your Scenario
Reference
Scenario Pre-Run Configuration User Interface
This section includes (in alphabetical order):
➤
Set Results Directory Dialog Box on page 243
➤
Summary Information Dialog Box on page 244
Set Results Directory Dialog Box
This dialog box enables you to set the location in which the Controller saves
scenario run results.
To access
Results > Results Settings
Important
information
If you have an open connection to an HP ALM project,
the Controller saves the results to a test set. You can also
save the results directly to disk using the standard file
system.
Relevant tasks
"How to Prepare a Scenario to Run" on page 238
User interface elements are described below:
UI Elements (A-Z)
Description
Automatically create
a results directory for
each scenario
execution
Instructs LoadRunner to create a unique results directory
for each scenario run. By default, the result names are
res1, res2, res3, and so on.
Automatically
overwrite existing
results directory
without prompting
for confirmation
Instructs LoadRunner to automatically overwrite
previous result sets, without prompting the user.
243
Chapter 12 • Before Running Your Scenario
UI Elements (A-Z)
Description
Directory
Specify a location in the file system where the Controller
will save the results file. The Controller creates a
subdirectory in the results directory. All results are saved
within this subdirectory.
File System
Displays the default LoadRunner directory path.
(only when
connected to HP
ALM).
HP ALM
(only when
connected to HP
ALM)
Results Name.
Enables you to save the results to a Application Lifecycle
Management test set.
Specify a name for the run results.
LoadRunner allows you to give descriptive names to each
result set. This is especially useful for cross results
analysis, in which LoadRunner superimposes the results
of several scenario runs in a single Analysis graph and lets
you compare the results of multiple scenario runs. The
descriptive graph names enable you to distinguish
between the results of the multiple runs.
Results Path
Displays the location for the results as specified in Results
Name and Directory.
Avoid using the same name with different paths. Only
the names appear on the Analysis graphs. If the result
names are identical it will be difficult to distinguish
between the runs.
Summary Information Dialog Box
This dialog box enables you to provide a detailed description of the scenario.
244
To access
Scenario > Summary Information
Relevant tasks
"How to Prepare a Scenario to Run" on page 238
Chapter 12 • Before Running Your Scenario
User interface elements are described below:
UI Elements (A-Z)
Description
Author
The name of the scenario’s author
Description
A description of the scenario
Scenario Path
The name and location of the scenario definition file
(.lrs)
Subject
A subject name or short title for the scenario
245
Chapter 12 • Before Running Your Scenario
246
13
Running Scenarios
This chapter includes:
Concepts
➤
Running Scenarios Overview on page 248
Tasks
➤
How to Run a Scenario on page 249
➤
Control Vusers During a Scenario Run - Use-Case Scenario on page 252
Reference
➤
Run View User Interface on page 270
247
Chapter 13 • Running Scenarios
Concepts
Running Scenarios Overview
After planning, designing and scheduling your scenario, you run it to create
load on your application and to test its performance.
Start of run
When you instruct LoadRunner to begin the scenario run, the Controller
checks the scenario configuration information, invokes the applications
that were selected to run with the scenario, and then distributes each Vuser
script to its designated load generator. When the Vusers are ready, they start
running their scripts.
As the scenario starts, in the Scenario Groups pane you can watch Vusers
gradually start running.
During run
During the scenario run, you can see a synopsis of the running scenario in
the Scenario Status pane. You can also drill down to see which Vuser actions
are causing the application problems.
The Controller’s online graphs display performance data collected by the
monitors. You use this information to isolate potential problem areas in
your system.
End of run
The scenario ends when all the Vusers have completed their scripts, when
the duration runs out, or when you terminate it.
At the conclusion of the test run, the Scenario Status pane shows the Down
status. This indicates that the Vusers have stopped running.
248
Chapter 13 • Running Scenarios
Tasks
How to Run a Scenario
This task describes how to run a scenario.
This task includes the following steps:
➤
"Prerequisite" on page 249
➤
"Prepare to run the scenario" on page 249
➤
"Run the scenario" on page 250
➤
"Manually control the behavior, addition, and stopping of Vusers during
the scenario run - optional" on page 250
➤
"Log execution notes during the scenario run - Optional" on page 251
➤
"Monitor the scenario - optional" on page 251
➤
"Collate run results" on page 251
1 Prerequisite
Open an existing scenario, or design a new one.
➤
To design a manual scenario, see "How to Design a Manual Scenario"
on page 62.
➤
To design a goal-oriented scenario, see "How to Design a Goal-Oriented
Scenario" on page 60.
2 Prepare to run the scenario
Before you run the scenario, specify a location for the scenario results and
other run-time related settings. For details, see "How to Prepare a Scenario
to Run" on page 238.
249
Chapter 13 • Running Scenarios
3 Run the scenario
In the Run tab, click the Start Scenario button to begin running the
scenario. The scenario runs according to its defined schedule.
4 Manually control the behavior, addition, and stopping of
Vusers during the scenario run - optional
You can do the following during the scenario run:
Note: For a use-case scenario that explains the differences between the
following options, see "Control Vusers During a Scenario Run - Use-Case
Scenario" on page 252.
➤
Control the behavior of Vuser groups. You can initialize, run, and stop
Vuser groups during the scenario run.
To initialize, run, or stop an entire Vuser group, select the group in the
Scenario Groups pane, and click the desired button on the main
Controller toolbar:
250
➤
Initialize Vusers.
➤
Run Vusers.
➤
Stop Vusers immediately.
➤
Stop Vusers gradually.
➤
Run or stop individual Vusers. You can run or stop specific Vusers
within a Vuser group. For user interface details, see "Vusers Dialog Box"
on page 98.
➤
Initialize/Run additional Vusers, or stop currently running Vusers. You
can manually control the addition of new Vusers to a running
scenario, as well as stop running Vusers. For user interface details, see
"Run/Stop Vusers Dialog Box" on page 279.
Chapter 13 • Running Scenarios
5 View a log containing run-time information about each
running Vuser - Optional
For user interface details, see "Vuser Script Log" on page 287.
6 Release Vusers from a rendezvous before the Controller
releases them - Optional
For more information, see "Rendezvous Points" on page 313.
7 Log execution notes during the scenario run - Optional
The Controller provides you with a dialog box in which you can log
comments while a scenario is running. To open the dialog box select
Scenario > Execution Notes. The notes are automatically saved by clicking
OK to close the dialog box.
8 Monitor the scenario - optional
During the scenario run, you can view data collected by the online
monitors using the online monitor graphs. If you did not set up the
monitors before you started the run, you can do so during the run. The
data collected by the monitors can be viewed using the LoadRunner
online graphs.
➤
For details about setting up the online monitors, see "How to Set Up
the Monitoring Environment – Workflow" on page 443.
➤
For details about viewing the monitor graphs, see "Online Monitor
Graphs" on page 289.
9 Collate run results
If you are using the default file storage setting—local machine, when the
scenario run is complete, the run results must be collated or consolidated
in preparation for result analysis. If LoadRunner is not set up to collate
the results automatically upon completion of the run, you need to collate
the results manually after the run.
Select Results > Collate Results > Collate Results. For details, see "How to
Collate Scenario Run Results" on page 324.
For details about result collation, see "Collating Run Data" on page 322.
251
Chapter 13 • Running Scenarios
Control Vusers During a Scenario Run - Use-Case Scenario
This use-case scenario describes how to override defined schedules and
manually control the behavior, addition, and stopping of Vusers during a
scenario run.
Note: For a task related to this scenario, see "How to Run a Scenario" on
page 249.
David Smith is a load tester at NewSoft Company, currently using
LoadRunner to test a new product in preparation for its upcoming release.
His load test contains three Vuser groups, Script_A, Script_B, and Script_C.
Each group has been assigned ten Vusers and been given the same schedule
definitions, that is, to start two Vusers every ten seconds, and to stop two
Vusers every ten seconds.
If David were to leave these schedules as defined, the start and stop actions
in the scenario groups pane would look as follows:
Start
Stop
The following table shows the options available to David should he wish to
override these defined schedules and manually manipulate the way the
Vusers start or stop:
252
Chapter 13 • Running Scenarios
Note: All the following use-case scenario options refer back to the scenario
explained above.
Control Vusers Option
Use-Case Scenario
Manipulate an entire
Vuser group.
"Initialize, Run, or Stop Vuser Groups - Use-Case
Scenario" on page 254
Example: Run or stop all
the Vusers in a group
simultaneously.
Run/Stop individual
Vusers, or add new Vusers.
"Run/Stop Individual Vusers, or Add New Vusers Use-Case Scenario" on page 256
Example 1: Run/Stop a
single Vuser currently in
the down/run state.
Example 2: (Vuser Group
mode) Add a specified
number of Vusers to a
group without initializing
or running them.
Initialize/Run/Stop any
number of Vusers within a
group.
"Initialize/Run Additional Vusers or Stop Running
Vusers - Use-Case Scenario" on page 260
253
Chapter 13 • Running Scenarios
Initialize, Run, or Stop Vuser Groups - Use-Case
Scenario
This use-case scenario describes how David can manipulate the behavior of
the Vuser groups during the scenario run, irrespective of their defined
schedules. The examples will show how he can initialize, run, and stop all
the Vusers in a Vuser group simultaneously.
Initialize a Vuser group
If David wants to initialize all the Vusers in Script_C simultaneously, he
selects the script in the Scenario Groups pane and clicks the Initialize Vusers
button on the Controller toolbar. All Vusers that are still in the Down state
are immediately initialized (in this case, only five). Their status changes
from Down to Pending to Initializing to Ready. They then run according to
their defined schedules.
Note: Only Vusers that are in the Down state can be initialized. Vusers that
have been initialized already are unaffected.
Run a Vuser group
If David wants to run all the Vusers in Script_C simultaneously, he selects
the script in the Scenario Groups pane and clicks the Run Vusers button on
the Controller toolbar. All Vusers in the group that have not yet started
running move to the Run state and begin executing their scripts.
254
Chapter 13 • Running Scenarios
Stop a Vuser Group
If David wants to stop all the Vusers in Script_C from running, he has two
options:
➤
To stop them immediately
He selects the script in the Scenario Groups pane and clicks the Stop
Vusers button on the Controller toolbar. All Vusers that have been
initialized, or are already running, stop executing their scripts
immediately and move directly to the Stopped state.
➤
To stop them gradually
He selects the script in the Scenario Groups pane and clicks the Gradual
Stop button on the Controller toolbar. All Vusers that have been
initialized, or are already running, move to the Gradual Exiting state and
then exit the scenario gradually as per their defined schedules.
Note: The group can only be stopped gradually if Wait for the current
iteration to end before exiting or Wait for the current action to end
before exiting have been selected in the Run-Time Setting tab of the
Options dialog box. For more information, see "Options > Run-Time
Settings Tab" on page 232.
255
Chapter 13 • Running Scenarios
Run/Stop Individual Vusers, or Add New Vusers Use-Case Scenario
This use-case scenario describes how David can manipulate the behavior of
individual Vusers during the scenario run, irrespective of their defined
schedules. The examples will show how he can run or stop individual
Vusers, as well as how he can add new Vusers to the scenario.
Note: The examples presented in this section demonstrate options in the
Vusers dialog box. Not all information relevant for working with this dialog
box necessarily appears here. For full information about working with the
Vusers dialog box, see "Vusers Dialog Box" on page 98.
Run an individual Vuser
If David wants to immediately run an additional Vuser from Script_A, in the
Run tab, he clicks Vusers to open the Vusers dialog box.
By selecting script_a, and All Vusers in the filter options at the top of the
dialog box, the table displays a list of all the Vusers in Script_A, and
indicates that five are currently running, and that five are still down.
David then selects Vuser number 6 (or any Vuser in the Down state that he
wishes to run), and clicks Run.
256
Chapter 13 • Running Scenarios
That Vuser is immediately initialized and moved to the Run state.
Stop an individual Vuser
If David wants to stop one of the running Vusers in Script_A, in the Run tab,
he clicks Vusers to open the Vusers dialog box.
By selecting script_a, and All Vusers in the filter options at the top of the
dialog box, the table displays a list of all the Vusers in Script_A, and
indicates that five are currently running, and that five are still down.
He then selects Vuser number 1 (or any running Vuser that he wishes to
stop), and then selects one of the stopping options:
257
Chapter 13 • Running Scenarios
258
➤
Stop the Vuser gradually. David clicks Gradual Stop, and the Vuser
immediately moves from the Run state to the Gradual Exiting state, where
it completes its current iteration or action before stopping.
➤
Stop the Vuser immediately. David clicks Stop, and the Vuser
immediately stops running and moves to the Stopped state.
Chapter 13 • Running Scenarios
Add new Vusers (Vuser Group mode only)
If David is working in Vuser Group mode, he can add new Vusers to a group
without initializing them, as follows:
In the Run tab, he clicks Vusers to open the Vusers dialog box, then he clicks
Add Vusers to open the Add Vusers dialog box.
He then enters the following information (as shown in the image above):
➤
Group Name. script_a
➤
Quantity to add. 5
➤
Load Generator Name. localhost (or any load generator on which the
group is running Vusers).
➤
Select Script. Script_A
These settings instruct LoadRunner to add five Vusers to Script_A, and that
the additional Vusers should run Script_A when they run.
259
Chapter 13 • Running Scenarios
Note: For full information on how to work with the Add Vusers dialog box,
see "Add Vusers Dialog Box" on page 75.
He clicks OK. Five Vusers are added to Script_A in the down state, from
where they run according to the group’s defined schedules.
Initialize/Run Additional Vusers or Stop Running
Vusers - Use-Case Scenario
This use-case scenario describes how David can manipulate the behavior of
Vusers during a scenario run, irrespective of their defined schedules. The
examples will show how he can initialize or run specified numbers of
additional Vusers, or stop specified numbers of running Vusers.
Note: The examples presented in this section demonstrate options in the
Run/Stop Vusers dialog box. Not all information relevant for working with
this dialog box necessarily appears here. For full information about working
with the Run/Stop Vusers dialog box, see "Run/Stop Vusers Dialog Box" on
page 279.
260
Chapter 13 • Running Scenarios
Initialize/Run additional Vusers in Vuser group mode
The following procedure shows how David can initialize and run additional
Vusers when he is working in Vuser Group mode:
Note: The options to initialize or run additional Vusers can be done as two
separate actions, with no connection to each other. They are being shown
here together as a single workflow for demonstrative purposes only.
1 Initialize additional Vusers
If he wants to initialize ten Vusers in Script_A immediately, and not wait
for them to initialize as per their defined schedules, in the Run tab, he
clicks Run/Stop Vusers to open the Run/Stop Vusers dialog box.
In the dialog box, he makes sure that only the check box by script_a is
selected, and he enters 10 in the # (number) column.
To initialize these Vusers, he clicks Initialize. Ten Vusers are immediately
initialized and move to the Ready state. From there, they run according to
their defined schedules.
261
Chapter 13 • Running Scenarios
Note: The additional initialized Vusers are taken from the Vusers that are
in the Down state. If David initializes a greater number of Vusers than
there are in the Down state, then all of them will be initialized. In the
example above, there were five Vusers in the Down state. All of them have
been initialized, while an additional five have been created.
2 Run additional Vusers
If David then wants to run five additional Vusers in Script_A immediately,
and not wait for them to run as per their defined schedules, in the Run/
Stop Vusers dialog box, he makes sure that only the check box by script_a
is selected, and he enters 5 in the # (number) column.
He then has the following two options for how to run these additional
Vusers:
➤
262
Run initialized Vusers. He can run five Vusers from those he initialized
in the previous step. To do this, he clicks the arrow on the Run button
and selects Run Initialized. Five Vusers immediately move from the
Ready state to the Run State.
Chapter 13 • Running Scenarios
➤
Run new Vusers. He can create and run five new Vusers, with no effect
on those he initialized in the previous step. To do this, he clicks the
arrow on the Run button and selects Run New. Five Vusers are
immediately created and move directly to the Run state.
Note: If there were still vusers in the Down state, the new Vusers would be
taken from them.
Initialize/Run additional Vusers in Percentage mode
The following procedure shows how David can initialize and run additional
Vusers when he is working in Percentage mode:
Note: The options to initialize or run additional Vusers can be done as two
separate actions, with no connection to each other. They are being shown
here together as a single workflow for demonstrative purposes only.
1 Initialize new Vusers
If he wants to initialize ten Vusers in Script_A immediately, and not wait
for them to initialize as per their defined schedules, in the Run tab, he
clicks Run/Stop Vusers to open the Run/Stop Vusers dialog box.
263
Chapter 13 • Running Scenarios
In the dialog box, he makes sure that only the check box by script_a is
selected, and he enters 10 in the Distribute X Vusers among all the scripts
box. It is also important that the percentage values for Script_B and
Script_C are set to 0%. See the note below for a detailed explanation why.
Note: When a check box is deselected, no Vusers are distributed to that
script. However, the amount of Vusers that would have been assigned to it
are not redistributed to the scripts that remain selected, unless you specify
0% in the percentage column.
For example, in our use-case scenario, when David enters 10 in the
Distribute X Vusers among all the scripts box, LoadRunner automatically
distributes these Vusers as equally as possible among the available scripts,
that is:
➤
script_a. 4 Vusers
➤
script_b. 3 Vusers
➤
script_c. 3 Vusers
However, should David wish to distribute all 10 Vusers to script_a, it is
not sufficient to simply deselect script_b and script_c. This only ensures
that no Vusers are added to these scripts, but it does not change the
original Vuser distribution.
In other words, should David complete the step now, the four Vusers that
are assigned to script_a will be added, while the three each assigned to
script_b and script_c will not, though they will still appear under the #
(number) column. To distribute these six Vusers to script_a instead, David
must first change the % (percentage) columns for these scripts to 0%.
264
Chapter 13 • Running Scenarios
He then clicks Initialize. Ten Vusers are immediately initialized and move
to the Ready state. From there, they run according to their defined
Scheduler settings.
Note: The additional initialized Vusers are taken from the Vusers that are
in the Down state. If you initialize a greater number of Vusers than there
are in the Down state, then all of them will be initialized. In the example
above, there were five Vusers in the Down state. All of them have been
initialized, while an additional five have been created.
2 Run additional Vusers
If David then wants to run five additional Vusers in Script_A immediately,
and not wait for them to run as per their defined schedules, in the Run/
Stop Vusers dialog box, he makes sure that only the check box by script_a
is selected, and he enters 5 in the Distribute X Vusers among all the
scripts box at the top of the dialog box. It is also important that the
percentage values for Script_B and Script_C are set to 0%. See the note in
the step above for a detailed explanation why.
He then has the following two options for how to actually run these
additional Vusers:
265
Chapter 13 • Running Scenarios
➤
Run initialized Vusers. He can run five Vusers from those he initialized
in the previous step. To do this, he clicks the arrow on the Run button
and selects Run Initialized. Five Vusers immediately move from the
Ready state to the Run State.
➤
Run new Vusers. He can create and run five new Vusers, with no effect
on those he initialized in the previous step. To do this, he clicks the
arrow on the Run button and selects Run New. Five Vusers are
immediately created and move directly to the Run state.
Note: If there were still vusers in the Down state, the new Vusers would be
taken from them.
266
Chapter 13 • Running Scenarios
Stop running Vusers in Vuser group mode
If David wants to stop three of the five running Vusers in Script_A, and not
wait for them to stop as per their defined schedules, in the Run tab, he clicks
Run/Stop Vusers to open the Run/Stop Vusers dialog box.
In the dialog box, he makes sure that only the check box by script_a is
selected, and he enters 3 in the # (number) column.
He then clicks Stop. Three of the running Vusers in Script_A move from the
Run state to the Gradual Exiting state.
267
Chapter 13 • Running Scenarios
Stop running Vusers in Percentage mode
If David wants to stop three of the five running Vusers in Script_A, and not
wait for them to stop as per their defined schedules, in the Run tab, he clicks
Run/Stop Vusers to open the Run/Stop Vusers dialog box.
In the dialog box, he makes sure that only the check box by script_a is
selected, and he enters 3 in the Distribute X Vusers among all the scripts
box. It is also important that the percentage values for Script_B and Script_C
are set to 0%. See the note below for a detailed explanation why.
268
Chapter 13 • Running Scenarios
Note: When a check box is deselected, no Vusers are distributed to that
script. However, the amount of Vusers that would have been assigned to it
are not redistributed to the scripts that remain selected, unless you specify
0% in the percentage column.
For example, in our use-case scenario, when David enters 3 in the Distribute
X Vusers among all the scripts box, LoadRunner automatically distributes
these Vusers as equally as possible among the available scripts, that is:
➤
script_a. 1Vuser
➤
script_b. 1Vuser
➤
script_c. 1Vuser
However, should David wish to distribute all 3 Vusers to script_a, it is not
sufficient to simply deselect script_b and script_c. This only ensures that no
Vusers are added to these scripts, but it does not change the original Vuser
distribution.
In other words, should David complete the step now, the single Vuser that is
assigned to script_a will be stopped, while the one each assigned to script_b
and script_c will not, though they will still appear under the # (number)
column. To distribute these two Vusers to script_a instead, David must first
change the % (percentage) columns for these scripts to 0%.
He then clicks Stop. Three of the running Vusers in Script_A move from the
Run state to the Gradual Exiting state.
269
Chapter 13 • Running Scenarios
Reference
Run View User Interface
This section includes (in alphabetical order):
➤
Execution Notes Dialog Box on page 270
➤
Output Window on page 271
➤
Run Tab on page 276
➤
Run/Stop Vusers Dialog Box on page 279
➤
Scenario Groups Pane on page 282
➤
Scenario Status Pane on page 285
➤
Transactions Dialog Box on page 286
➤
Vuser Script Log on page 287
Execution Notes Dialog Box
This page dialog box enables you to log comments while a scenario is
running.
To access
Select Scenario > Execution Notes
Relevant tasks
"How to Run a Scenario" on page 249
Important
Information
Only enabled while the scenario is running.
User interface elements are described below:
270
UI Element
Description
<note writing area>
Enter your notes in this area.
Chapter 13 • Running Scenarios
Output Window
This window displays error, notification, warning, debug, and batch
messages that are sent to the Controller by the Vusers and load generators
during a scenario run.
To access
Use one of the following:
➤ Run tab > Scenario Status pane > Errors >
➤ Select View > Show Output
Important
information
➤ LoadRunner clears the messages in the Output
window at the start of each scenario execution. If you
reset a scenario, messages remain in the Output
window unless you instruct LoadRunner to delete
messages from the window upon reset. For more
information, see "Options > Output Tab" on page 229.
➤ The Summary tab is displayed by default when you
open this window.
Relevant tasks
➤ "How to Run a Scenario" on page 249
➤ "Configure output display options (Expert mode
only)" on page 218
User interface elements are described below:
UI Elements (A-Z)
Description
Filtered Tab
See "Filtered Tab" on page 274
Summary Tab
See "Summary Tab" on page 271
Summary Tab
This tab displays summary information about the messages sent during a
scenario run.
To access
Output window > Summary tab
Important
Information
You can drill down further on any information displayed
in blue.
271
Chapter 13 • Running Scenarios
Parent topic
"Output Window" on page 271
See also
"Filtered Tab" on page 274
User interface elements are described below:
UI Elements (A-Z)
Description
Displays the full text of the selected output message in
the Detailed Message Text area at the bottom of the
Output window.
Remove all messages. Clears all log information from the
Output window.
Export the view. Saves the output to a specified file.
➤ Freeze. Stops updating the Output window with
messages.
➤ Resume. Resumes updating the Output window with
messages. The newly updated log information is
displayed in a red frame.
272
Detailed Message
Text
Displays the full text of the selected output message
when you click the Details button.
Generators
Displays the number of load generators that generated
messages with the specified message code.
Help
Displays an icon if there is a link to troubleshooting for
the message.
Message Code
Displays the code assigned to all similar messages. The
number in parentheses indicates the number of different
codes displayed in the Output window.
Sample Message Text
Displays an example of the text of a message with the
specified code.
Scripts
Displays the number of scripts whose execution
generated messages with the specified code.
Total Messages
Displays the total number of sent messages with the
specified code.
Chapter 13 • Running Scenarios
UI Elements (A-Z)
Description
Type
The type of message being displayed. The following icons
indicate the various message types. For more information
about each type, see Type of Message below:
Type of Message
➤
Batch
➤
Debug
➤
Errors
➤
Notifications
➤
Warnings
Filters the output messages to display only certain
message types. Select one of the following filters:
➤ All messages. Displays all message types.
➤ Batch. Sent instead of message boxes appearing in the
Controller, if you are using automation.
➤ Debug. Sent only if the debugging feature is enabled
in the Controller. (Expert mode: Tools > Options >
Debug Information). For more information, see
"Options > Debug Information Tab" on page 223.
➤ Errors. Usually indicate that the script failed.
➤ Notifications. Provides run-time information, such as
message sent using lr_output_message.
➤ Warnings. Indicates that the Vuser encountered a
problem, but the scenario continued to run.
Vusers
Displays the number of Vusers that generated messages
with the specified code.
273
Chapter 13 • Running Scenarios
Filtered Tab
This tab displays a drilled down view by message, Vuser, script, or load
generator. For example, if you drill down on the Vuser column, the Filtered
tab displays all the messages with the code you selected, grouped by the
Vusers that sent the messages.
To access
Output window > Summary tab. Click the blue link on
the column about which you wish to view more
information.
Important
information
The tab is appears when you click on a blue link in the
Summary tab.
Parent topic
"Output Window" on page 271
See also
"Summary Tab" on page 271
User interface elements are described below:
UI Elements (A-Z)
Description
Previous/Next View. Enables you to move between the
various drill down levels.
Displays the full text of the selected output message in
the Detailed Message Text area at the bottom of the
Output window.
Export the view. Saves the output to a specified file.
Refreshes the Filtered tab with new log information that
arrived in the Output window updated in the Summary
tab.
274
<Message icon>
Displays an icon indicating the type of message by which
the current Output view is filtered.
Active Filter
Displays the category or categories by which the current
Output view is filtered.
Chapter 13 • Running Scenarios
UI Elements (A-Z)
Description
Viewed By
Displays the name of the column on which you selected
to drill down. The following icons indicate the various
message types:
➤
Batch
➤
Debug
➤
Errors
➤
Notifications
➤
Warnings
➤
Detailed Message
Text
Displays the full text of the selected output message
when the Details button is selected.
Message
Displays all instances of the sample message text.
Script
The script on which the message was generated. If you
click the blue link, VuGen opens displaying the script.
Action
The action in the script where the message was
generated. If you click the blue link, VuGen opens the
script to the relevant action.
Line #
The line in the script where the message was generated. If
you click the blue link, VuGen opens the script and
highlights the relevant line.
# Lines
The total number of lines in the script where the Vuser
failed.
Time
The time the message was generated.
Iteration
The iteration during which the message was generated.
Vuser
The Vuser that generated the message.
275
Chapter 13 • Running Scenarios
UI Elements (A-Z)
Description
Generator
The load generator on which the message was generated.
If you click the blue link, the Load Generator dialog box
opens.
# Messages
The number of messages generated by a specific Vuser.
# Diff Texts
Run Tab
The Run tab enables you to run and monitor scenarios.
To access
Run tab
Relevant tasks
➤ "How to Run a Scenario" on page 249
➤ "Control Vusers During a Scenario Run - Use-Case
Scenario" on page 252
276
Chapter 13 • Running Scenarios
User interface elements are described below (unlabeled elements are shown
in angle brackets):
UI Elements (A-Z)
Description
Instructs the Controller to initialize the Vusers and
distribute them to their designated load generators,
where they begin running their Vuser scripts.
Notes:
➤ The Controller begins running the scenario according
to the start time defined in the scenario schedule.
➤ We do not recommend changing the Time/Date and
Time Zone settings on the Controller and load
generators during the load test run.
Terminates the scenario.
The behavior depends on your selection in the Tools >
Options > Run-Time Settings tab:
➤ If you selected Stop immediately, all Vusers in the
scenario move to the Exiting status.
➤ If you selected Wait for the current iteration to end
before exiting, or Wait for the current action to end
before exiting, the button text changes to Stop Now
and the Vusers status changes to Gradual Exiting. To
stop the Vusers immediately, click Stop Now.
For more information about the Run-Time Settings
options, see "Options > Run-Time Settings Tab" on
page 232.
Resets all Vuser groups to the Down status.
Opens the Vusers dialog box, where you can view the
status of each of the Vusers in a Vuser group.
Opens the Run/Stop Vusers dialog box, where you can
activate additional Vusers.
277
Chapter 13 • Running Scenarios
UI Elements (A-Z)
Description
Pauses or resumes the scenario schedule.
<Graph Legend>
Displays statistics for the selected graph. For more
information, see "Online Monitor Graphs" on page 289.
<Graph Viewing
Pane>
Displays the graphs that are listed in the Available
Graphs pane. For more information, see "Online Monitor
Graphs" on page 289.
Default: Displays four graphs
278
Available Graphs
Displays the available online monitor graphs. For more
information, see "Online Monitor Graphs" on page 289.
Scenario Groups
pane
Displays each Vuser group and it’s current status. For
more information. see "Scenario Groups Pane" on
page 282.
Scenario Status pane
Displays a synopsis of the running scenario. For more
information, see "Scenario Status Pane" on page 285.
Chapter 13 • Running Scenarios
Run/Stop Vusers Dialog Box
This dialog box enables you to manually control the addition of new Vusers
to a running scenario, as well as to stop running vusers.
To access
Run tab > Scenario Groups pane >
Important
information
➤ The dialog box differs depending on which mode you
are working in.
➤ Vuser group mode. You specify the number of new
Vusers to be added to each Vuser group, as well as
the load generators on which these additional
Vusers will run.
➤ Percentage mode. You specify the percentage of
Vusers to be added to each script, as well as the load
generators on which these additional Vusers will
run.
➤ When you add Vusers to a running scenario or Vuser
group, the current scheduler settings are automatically
applied to all new Vusers. For example, if the scenario
or Vuser group has a set duration of five minutes, all
Vusers that are subsequently added run only for the
remaining part of that time period.
Vusers that are added to a scenario or Vuser group
which has finished running, are not affected by
schedule settings and run according to the scenario
run-time settings.
Relevant tasks
➤ "How to Run a Scenario" on page 249
➤ "Control Vusers During a Scenario Run - Use-Case
Scenario" on page 252
279
Chapter 13 • Running Scenarios
User interface elements are described below (unlabeled elements are shown
in angle brackets):
UI Elements (A-Z)
Description
Distributes the added Vusers to their designated load
generators so that they are ready to execute their scripts.
The Controller first initializes the Vusers in your scenario
that have not yet run and then adds additional Vusers, as
required, to reach the defined quantity.
➤ Run Initialized. Runs the Vusers in the scenario that
have already been initialized.
➤ Note: You cannot run more Vusers than are
currently initialized using this option.
➤ Run New. Runs the number of Vusers you specified.
The Controller first runs the Vusers in your scenario
that have not yet been run and then adds additional
Vusers, as required, to reach the defined quantity.
Stops the Vusers that are running. The Controller stops
the Vusers according to the settings you defined in the
Run-Time Settings tab. For more information, see
"Options > Run-Time Settings Tab" on page 232.
280
Chapter 13 • Running Scenarios
UI Elements (A-Z)
Description
<check box>
Selects the Vuser groups/scripts you add Vusers to.
Notes:
➤ To disable a Vuser group/script, clear the check box to
the left of the group/script name. A group/script
automatically appear disabled if it is disabled in the
Design view.
➤ When you disable a Vuser group (Vuser Group mode),
no Vusers are added to the group.
➤ When you disable a script (Percentage mode), no
Vusers are distributed to the script, and the unused
percentage of the Vusers are not distributed among the
remaining scripts, unless you define a zero percent
value for the disabled script.
Example: If you have three scripts, A, B, and C, and
you enter 10 in the Distribute X Vusers among all the
scripts box, LoadRunner automatically distributes
these Vusers as equally as possible among the scripts,
that is:
➤ A. 4 Vusers
➤ B. 3 Vusers
➤ C. 3 Vusers
However, if you want LoadRunner to distribute all 10
Vusers to A, it is not sufficient to simply deselect B and
C. This only ensures that no Vusers are added to these
scripts, but it does not change the original Vuser
distribution.
In other words, if you were to finish the step now, the
four Vusers that are assigned to A would be added to
the script, while the three each assigned to B and C
would not, though they would still appear under the #
(number) column. To distribute these six Vusers to A
instead, you must first change the % (percentage)
columns B and C to 0%.
%
(Percentage mode)
Enter the percentage of Vusers to be distributed to each
Vuser script.
#
Indicates the number of Vusers distributed to each script.
281
Chapter 13 • Running Scenarios
UI Elements (A-Z)
Description
Distribute x Vusers
among the checked
scripts
Enter the number of Vusers to be distributed. The Vusers
will be distributed according to the values you entered in
the percentage (%) column.
(Percentage mode)
Load Generators
The load generators assigned to the Vuser group/script.
If you select multiple load generators for a group/script,
the Vusers assigned to the Vuser group/script are
distributed evenly among the load generators.
Default value (in Percentage mode): All Load Generators
Note: To add a load generator to the list, select Add from
the list. For more details see "Add Load Generator/Load
Generator Information Dialog Box" on page 108.
Scenario Groups Pane
This pane enables you to monitor the actions of all the Vusers and Vuser
groups in the scenario.
To access
Run tab
Relevant tasks
➤ "How to Run a Scenario" on page 249
➤ "Control Vusers During a Scenario Run - Use-Case
Scenario" on page 252
282
Chapter 13 • Running Scenarios
User interface elements are described below:
UI Elements (A-Z)
Description
<Right-click menu>
Additional actions available only via the right-click
menu:
➤ Reset IDs. Resets the IDs of the Vusers in the group.
➤ Run Vusers Until Complete. Runs the selected Vusers
until complete. If you run Vusers in the Down or Error
state, the Controller initializes and then runs the
Vusers.
➤ Run One Vuser Until Complete. Instructs the
Controller to run a randomly selected Vuser in the
Vuser group, until it completes running. The Vuser
Log opens, displaying run-time information about the
Vuser. For more information, see "Vuser Script Log" on
page 287.
➤ Pause Vusers. Temporarily pauses running the Vusers
group. The status of the Vuser group changes from
Running to Paused. Note that pausing a Vuser group
affects its transaction response time.
➤ Enable. Enables the Vuser group to participate in the
scenario.
➤ Disable. Disables the Vuser group so that it no longer
participates in the scenario.
➤ Show Vusers. Opens a Run-Time Viewer for each Vuser
in the group which displays the vuser executing its
script.
➤ Hide Vusers. Closes open Run-Time Viewers.
➤ Show Vuser Log. Opens a script log containing
run-time information for each Vuser in the group. The
Vuser script log is refreshed, by default, every 1000
milliseconds.
➤ Hide Vuser Log. Closes the Vuser script logs.
➤ Sort By Name. Sorts the groups alphabetically, by
name.
Done/Failed
The number of Vusers that have finished running and
the script failed.
283
Chapter 13 • Running Scenarios
284
UI Elements (A-Z)
Description
Done/Passed
The number of Vusers that have finished running and
the script passed.
Down
The number of Vusers that have stopped running.
Error
The number of Vusers that encountered problems. Check
the Status field on the Vuser dialog box or the output
window for a complete explanation of the error.
Exiting
The number of Vusers that have finished running or have
been stopped, and are now exiting.
Gradual Exiting
The number of Vusers that are completing their iterations
or actions before exiting. (as defined in Tools > Options >
Run-Time Settings)
Initializing
The number of Vusers that are being initialized on the
remote machine.
Pending
The number of Vusers that are ready to be initialized and
are waiting for an available load generator, or are
transferring files to the load generator.
Ready
The number of Vusers that have already performed the
init section of the script and are ready to run.
Rendezvous
The number of Vusers that have arrived at the
rendezvous and are waiting to be released by the
Controller.
Running
The number of Vusers that are running, and the Vuser
script is being executed on a load generator.
Stopped
The Vuser stopped when the Stop command was
invoked.
Chapter 13 • Running Scenarios
Scenario Status Pane
This pane displays a synopsis of the running scenario.
To access:
Run tab
Important
Information
To detach the Scenario Status pane from the Run tab,
click the detach pane
button in the upper right
corner.
Relevant tasks
"How to Run a Scenario" on page 249
User interface elements are described below:
UI Elements (A-Z)
Description
Elapsed Time
Indicates how much time has elapsed since the scenario
started running.
Errors
Indicates the number of Vusers with errors.
To display the errors, click the Show Snapshot
button to display the Output Window. For more
information, see "Output Window" on page 271.
Hits/Second
Indicates how many hits (HTTP requests) there have been
to the Web site being tested per second that each Vuser
has been running.
Passed/Failed
Transactions
Indicates how many transactions have been executed
successfully or unsuccessfully. For more information, see
"Transactions Dialog Box" on page 286.
Running Vusers
Indicates the number of Vusers that are currently
running.
Scenario Status
Indicates whether the scenario is Running or Down.
285
Chapter 13 • Running Scenarios
Transactions Dialog Box
This dialog box indicates how many transactions have been executed
successfully or unsuccessfully.
To access
Run tab > Scenario Status pane. Click the Show Snapshot
button by Passed/Failed Transactions.
Important
information
VuGen automatically defines each Init, Action, and End
unit as a transaction. In addition, you can insert a static
transaction in your script using the Start Transaction and
End Transaction functions. For details, see the HP Virtual
User Generator User Guide.
Relevant tasks
"How to Run a Scenario" on page 249
See also
"Scenario Status Pane" on page 285
User interface elements are described below:
286
UI Elements (A-Z)
Description
Failed
The number of times the transaction failed.
Name
The names of the individual transactions in a script.
Passed
The number of times the transaction passed.
Stopped
The number of times the transaction stopped.
TPS
The number of times per second the transaction has run.
Chapter 13 • Running Scenarios
Vuser Script Log
This page enables you to view run-time information about each running
Vuser.
To access
Manual scenario > Run tab > Scenario Groups pane >
Vusers
. In the Vusers dialog box select the Vuser
whose log you want to view and click Show Vuser Log
.
Important
information
➤ If you disabled the logging feature in the Run-Time
Settings Log node, the Vuser script log will contain
output only if your script contains the
lr_output_message or lr_message function.
➤ If you selected the Send messages only when an error
occurs option in the Log node, the Vuser script log will
contain output only if there are script errors.
Relevant tasks
"How to Run a Scenario" on page 249
User interface elements are described below (unlabeled elements are shown
in angle brackets):
UI Elements
Description
Show Text/Tree View. Displays the run-time information
in text/tree format. To revert to the previous view, click
the button again.
Display. Displays a snapshot of the Web page where an
error occurred, when the error is highlighted in the Vuser
log.
Note: To view a snapshot of the Web page where an error
occurred, you must select the Activate snapshot on error
option in the General node of the Run-Time Settings
dialog box before running the scenario.
Find Text. Enables you to search for text in the Vuser log.
287
Chapter 13 • Running Scenarios
UI Elements
Description
Expand/Collapse Node. Expands the node so that you
can view additional run-time information details about
the Vuser. To revert to the collapsed tree view, click the
button again.
<message icons>
The following icons may can appear in the script log:
➤
Action. Displays the name and description of an
action.
➤
End iteration. Indicates the end of an iteration.
➤
Errors. Indicates that the Vuser encountered a
problem, but test execution continued. Displays the
error code and a description of the error.
➤
Notifications. Provides action information.
➤
Start/End Transaction. Indicates the start or end
of a transaction.
➤
➤
<Right-click options>
Start iteration. Indicates the start of an iteration.
Start User Script. Indicates the start of the Vuser
script.
➤ Copy. Enables you to copy selected text from the Vuser
log.
➤ Copy path from status bar. Enables you to copy the
path of the Vuser log.
Refresh (every 1000
milliseconds)
When selected, instructs LoadRunner to refresh the
run-time information displayed every 1000 milliseconds.
Note: For information on how to change the default
refresh settings, see "Options > Output Tab" on page 229.
288
14
Online Monitor Graphs
This chapter includes:
Concepts
➤
Online Monitor Graphs Overview on page 290
Tasks
➤
How to Display Online Monitor Graphs on page 291
➤
How to Customize Online Graph and Measurement Settings on page 293
➤
How to Manage Online Graphs on page 296
Reference
➤
Online Monitor Graphs User Interface on page 298
➤
Available Graphs Tree on page 305
289
Chapter 14 • Online Monitor Graphs
Concepts
Online Monitor Graphs Overview
You can view the data collected by the online monitors using the online
monitor graphs.
About Online Monitor Graphs
Online monitor graphs display performance measurements for those
resources being monitored during scenario run. Each measurement is
represented on the graph by a colored line. Information about the
measurements is listed in the legend below the graph. The legend displays
the measurements for the selected graph only.
For details about selecting monitor graphs and customizing the graph
display area, see "How to Display Online Monitor Graphs" on page 291.
For details about customizing graph layout and measurements, see "How to
Customize Online Graph and Measurement Settings" on page 293.
Viewing Monitor Data Offline
After monitoring resources during a scenario run, you can view a graph of
the data that was gathered using HP LoadRunner Analysis. Analysis
processes the data from the scenario run results files, and generates a graph
for each measurement that was monitored.
For details about working with Analysis at the end of the scenario run, see
the HP LoadRunner Analysis User Guide.
290
Chapter 14 • Online Monitor Graphs
Tasks
How to Display Online Monitor Graphs
This task describes how to open other monitor graphs and customize the
graph display area.
This task includes the following steps:
➤
"Prerequisites" on page 291
➤
"Open a monitor graph" on page 291
➤
"Customize the graph display area - Optional" on page 292
1 Prerequisites
To see data in the online monitor graphs, the relevant monitoring
environments must be configured. For details, see "How to Set Up the
Monitoring Environment – Workflow" on page 443.
2 Open a monitor graph
By default, LoadRunner displays the following graphs in the graph display
area:
➤
Running Vusers
➤
Transaction Response Time
➤
Hits per Second
➤
Windows Resources
You can open other graphs., one at a time, as follows:
291
Chapter 14 • Online Monitor Graphs
Method 1
a Select Monitors > Online Graphs > Open a New Graph, or right-click a
graph and select Open a New Graph.
b In the Open a New Graph dialog box, click the "+" in the left pane to
expand the category nodes, and select a graph. You can view a
description of the selected graph in the Graph Description box.
c Click Open Graph, or drag the selected graph into the right pane of the
Run view.
Method 2
In the graph tree on the left of the Run tab, click the "+" to expand the
category nodes. Double-click a graph or, alternatively, select it and drag it
to the graph display area on the right.
Note: If the graph tree is not displayed, select View > Show Available
Graphs. To hide the graph tree view, select View > Hide Available Graphs.
3 Customize the graph display area - Optional
By default, LoadRunner displays four graphs in the graph display area.
To change the number of graphs displayed, right-click a graph in the
graph display area and select View Graphs (or select View > View Graphs).
Do one of the following:
292
➤
Select the number of graphs to display from the options given
➤
Select Custom Number and enter a number of graphs to display.
➤
To display only one graph, double-click the graph displayed in the
graph display area. To return to the previous view, double-click the
graph again.
Chapter 14 • Online Monitor Graphs
How to Customize Online Graph and Measurement
Settings
This task describes ways to customize online graphs and graph
measurements.
➤
"Configure the graph settings" on page 293
➤
"Configure the measurement settings" on page 293
Configure the graph settings
You can customize:
➤
The type of graph display
➤
What to display on the x-axis and y-axis.
You can apply these settings to all graphs, or to a specific graph only.
To configure the graph settings, in the Run tab, select Monitors > Online
Graphs > Configure, (or right-click a graph and select Configure).
For user interface details, see "Graph Configuration Dialog Box" on
page 298 .
Configure the measurement settings
You can customize the appearance and scale of measurements in a graph,
and select whether they should be displayed in the graph or hidden from
the graph.
In the Run tab, right-click a measurement in the graph or legend, and select
Configure.
For user interface details, see "Measurement Configuration Dialog Box" on
page 301 .
293
Chapter 14 • Online Monitor Graphs
Example: Measurement Scale
In the following example, the same graph is displayed with a scale of 1 and
10:
The actual graph values range from 0-1, as shown in the left graph. You can
view the information more accurately using a larger scale for the display, as
shown in the right graph. However, to obtain the actual values, you need to
divide the displayed value by the scale. In the example above, the highest
value shown in the graph is 5. Since the scale is 10, the actual value is 0.5.
The legend below the graph indicates the scale factor.
294
Chapter 14 • Online Monitor Graphs
Example: Shown/Hidden Measurements
In the following example, the first image displays a line for each of the four
measurements. In the second image, the second measurement listed in the
legend is hidden in the graph:
295
Chapter 14 • Online Monitor Graphs
How to Manage Online Graphs
The following sections describe ways to work with the online monitor
graphs.
➤
"Freeze graphs" on page 296
➤
"Overlay graphs" on page 296
➤
"Export graphs to HTML" on page 296
Freeze graphs
You can pause a specific graph during a scenario run. Select the graph and
select Monitors > Online Graph > Freeze, or right-click the graph and select
Freeze. To resume, repeat the above action. When resumed, the graph
displays the data for the paused period as well.
Overlay graphs
You can merge or overlay the results of two graphs from the same scenario
into a single graph. This enables you to compare several different
measurements at once.
In the Run tab, right-click one of the online graphs you want to overlay, and
select Overlay Graphs.
Note: The x-axis of both graphs must be the same measurement.
For details, see "Overlay Graphs Dialog Box" on page 304.
Export graphs to HTML
You can export graphs displayed on the Run tab to HTML format for offline
viewing at a later stage. When you export to HTML, the legend is also
displayed with the graph.
You can export a single graph or all graphs in the online monitor display.
296
Chapter 14 • Online Monitor Graphs
To export a single graph:
a Right-click the graph and select Export to HTML.
b Specify a path and filename for the exported graph/report.
To export all the displayed graph:
a Select Monitors > Export Online Graphs to HTML.
b Specify a path and filename for the exported graphs/reports.
297
Chapter 14 • Online Monitor Graphs
Reference
Online Monitor Graphs User Interface
This section includes (in alphabetical order):
➤
Graph Configuration Dialog Box on page 298
➤
Measurement Configuration Dialog Box on page 301
➤
Open a New Graph Dialog Box on page 303
➤
Overlay Graphs Dialog Box on page 304
Graph Configuration Dialog Box
This dialog box enables you to customize the online graph settings.
To access
Use one of the following:
➤ Select Monitors > Online Graphs > Configure.
➤ Right-click a graph and select Configure.
Important
information
You can apply these settings to all graphs, or to a specific
graph only.
Relevant tasks
"How to Customize Online Graph and Measurement
Settings" on page 293
User interface elements are described below:
298
UI Elements (A-Z)
Description
Apply to all graphs
Applies the dialog box settings to all graphs.
Apply to selected
graph
Applies the dialog box settings to the selected graph.
Chapter 14 • Online Monitor Graphs
UI Elements (A-Z)
Description
Bar Values Type
If the Bar display type is selected, determines the type of
value that will be displayed in the bar graph: Average,
Last Value, Minimum, Maximum.
Display Type
The type of graph displayed: line graph or bar graph.
By default, each graph is displayed as a line graph.
Note: For the Network Delay graph, if you right-click the
graph and select View Segments, you can view the
network segments of the graph as an area graph or a pie
graph.
Graph Time
Indicates the scale for a graph’s x-axis when it is
time-based. A graph can show 60 to 3600 seconds of
activity. To see the graph in greater detail, decrease the
graph time. To view the performance over a longer period
of time, increase the graph time. The available graph
times are: Whole Scenario, 60, 180, 600, and 3600
seconds.
Network Delay View
Available for the Network Delay Time graph only:
➤ SubPaths. Displays the delay measurements from the
source machine to each of the nodes along the
network path.
➤ DNS name. Displays the DNS names of the
measurements displayed in the legend.
Refresh Rate
The interval at which the graph is refreshed with new
data. By default, the graph is refreshed every five seconds.
If you increase the refresh rate, the data is refreshed less
frequently.
Note: In a large load test, it is recommended to use a
refresh rate of three to five seconds. This enables you to
avoid problems with CPU resource usage.
299
Chapter 14 • Online Monitor Graphs
UI Elements (A-Z)
Description
Time
Specifies how the graph displays the time (in seconds) on
the x-axis:
➤ Don’t Show. Instructs LoadRunner not to display
values for the x-axis.
➤ Clock Time. Displays the absolute time, based on the
system clock.
➤ Relative to Scenario Start. Displays the time relative to
the beginning of the scenario.
Note: If no step is running, clock time is displayed.
Example: In the left image below the time is not
displayed on the x-axis. In the right image, the time is
displayed.
Y-Axis Scale
Displays graphs using the selected y-axis scale:
➤ Automatic. Displays the default y-axis values.
➤ Maximum Y-Axis Value. The maximum value for the
y-axis.
➤ Minimum Y-Axis Value. The minimum value for the
y-axis.
300
Chapter 14 • Online Monitor Graphs
Measurement Configuration Dialog Box
This dialog box enables you to configure settings for measurements in a
graph. You can:
➤
Change line colors
➤
Configure a measurement’s scaling
➤
Show/hide measurements
➤
View descriptions of the measurements
To access
In the Run tab, right-click a measurement in the graph or
legend, and select Configure.
Relevant tasks
"How to Customize Online Graph and Measurement
Settings" on page 293
301
Chapter 14 • Online Monitor Graphs
User interface elements are described below:
UI Elements (A-Z)
Description
Configuration tab
➤ Color. The color assigned to the selected measurement.
➤ Scale. The relationship between the y-axis and the
graph's actual value.
➤ Autoscale. Automatically scales the measurement
by calculating the best ratio for displaying the
graph. For some graphs, this option is not available.
Default value: Autoscale
Example: A scale of 1 indicates that the measurement's
value is the value of the y-axis. If you select a scale of
10, you must multiply the y-axis value by 10 to obtain
the true value of the measurement.
➤ Show / Hide. The resource selected in the legend is
shown/hidden in the graph.
By default, all resource measurements are shown in
the graph. To show only a selected measurement,
right-click the measurement, and select Show Only
Selected.
Note: Alternatively right-click a measurement in the
graph legend and select Show/Hide.
Description tab
Information about the measurement:
➤ Machine. Displays the name of the machine whose
resources are being monitored.
Note: Displayed only when a machine’s resources are
being monitored.
➤ Description. Displays a description of the selected
measurement.
Note: Also accessible by right-clicking a measurement in
the legend and selecting Description.
Machine
The name of the machine whose resources are being
monitored.
Note: Displayed only when a machine’s resources are
being monitored.
302
Chapter 14 • Online Monitor Graphs
UI Elements (A-Z)
Description
Measurement
The name of the selected measurement.
Network Type
Appears only when monitoring a network path.
Open a New Graph Dialog Box
This dialog box enables you to open a new graph.
To access
Use one of the following:
➤ Run tab > Monitors > Online Graphs > Open a New
Graph
➤ Right-click a graph and select Open a New Graph.
Important
information
The graph selected in the graph display area will be
replaced by the added graph.
Relevant tasks
"How to Display Online Monitor Graphs" on page 291
User interface elements are described below:
UI Elements (A-Z)
Description
Opens the selected graph and displays it in the graph tree
view.
Display only graphs
containing data
Select this option to view only those graphs that contain
data. To view the entire list of online monitor graphs
(even those that do not contain data), clear this option.
Graph Description
Displays a description of the selected graph
Select Graph box
Lists the online monitor graphs by category. To expand a
category node, click the "+" .
Tip: Graph names displayed in blue contain data.
Note: You can select only one graph at a time.
303
Chapter 14 • Online Monitor Graphs
Overlay Graphs Dialog Box
This dialog box enables you to merge or overlay the results of two graphs
from the same scenario into a single graph. The merging enables you to
compare several different measurements at once.
For example, you can make an overlaid graph that displays the Web
Throughput and Hits per Second as a function of the elapsed time.
To access
In the Run tab, right-click one of the online graphs you
want to overlay, and select Overlay Graphs.
Important
information
➤ In order to overlay graphs, the x-axis of both graphs
must be the same measurement.
➤ When you overlay the contents of two graphs that
share a common x-axis, the left y-axis on the overlaid
graph shows the current graph's values. The right
y-axis shows the values of the graph that was overlaid.
Relevant tasks
"How to Manage Online Graphs" on page 296
User interface elements are described below:
UI Elements (A-Z)
Description
Current Graph
The name of the current graph.
Select graph to
overlay with
The name of the graph to be merged with the current
graph.
Note: The drop-down list displays only the active graphs
that have a common x-axis with the current graph.
Title of overlaid
graph
304
The title given to the overlaid graph.
Chapter 14 • Online Monitor Graphs
Available Graphs Tree
The Available Graphs Tree displays the online monitor graphs.
Tip: Graph names displayed in blue contain data.
To select measurements to monitor in a particular graph, see the monitor
configuration instructions for each specific monitor. For details, see "How to
Set Up the Monitoring Environment – Workflow" on page 443.
Graph
Description
Running Vusers
Provides information about the status of the Vusers
running in the current scenario on all load
generators. The graph shows the number of running
Vusers, while the information in the legend
indicates the number of Vusers in each state.
User-Defined Data Points
Displays the real-time values of user-defined data
points. You define a data point in your Vuser script
by inserting an lr_user_data_point function at the
appropriate place (user_data_point for GUI Vusers
and lr.user_data_point for Java Vusers).
Error Statistics
Provides details about the number of errors that
accrue during each second of the scenario run. The
errors are grouped by error source—for example, the
location in the script or the load generator name.
Vusers with Errors
Provides details about the number of Vusers that
generate errors during scenario execution. The
errors are grouped by error source.
Transaction Response
Time
Shows the average response time of transactions in
seconds (y-axis) as a function of the elapsed time in
the scenario (x-axis).
Transaction Per Second
(Passed)
Shows the number of successful transactions
performed per second (y-axis) as a function of the
elapsed time in the scenario (x-axis).
305
Chapter 14 • Online Monitor Graphs
306
Graph
Description
Transaction Per Second
(Failed, Stopped)
Shows the number of failed and stopped
transactions per second (y-axis) as a function of the
elapsed time in the scenario (x-axis).
Total Transactions Per
Second (Passed)
Shows the total number of completed, successful
transactions per second (y-axis) as a function of the
elapsed time in the scenario (x-axis).
Hits Per Second
Shows the number of hits (HTTP requests) to the
Web server (y-axis) as a function of the elapsed time
in the scenario (x-axis). You can compare this graph
to the Transaction Response Time graph to see how
the number of hits affects transaction performance.
Throughput
Shows the amount of throughput on the Web server
(y-axis) during each second of the scenario run
(x-axis). Throughput is measured in bytes and
represents the amount of data that the Vusers
received from the server at any given second. You
can compare this graph to the Transaction Response
Time graph to see how the throughput affects
transaction performance.
HTTP Responses per
Second
Shows the number of HTTP status codes—which
indicate the status of HTTP requests, for example,
“the request was successful,” “the page was not
found”—(y-axis) returned from the Web server
during each second of the scenario run (x-axis),
grouped by status code. You can group the results
shown in this graph by script (using the "Group By"
function) to locate scripts which generated error
codes.
Pages Downloaded per
Second
Shows the number of Web pages (y-axis)
downloaded from the server during each second of
the scenario run (x-axis). This graph helps you
evaluate the amount of load Vusers generate, in
terms of the number of pages downloaded.
Chapter 14 • Online Monitor Graphs
Graph
Description
Retries per Second
Shows the number of attempted Web server
connections (y-axis) as a function of the elapsed
time in the scenario x-axis). A server connection is
retried when the initial connection was
unauthorized, when proxy authentication is
required, when the initial connection was closed by
the server, when the initial connection to the server
could not be made, or when the server was initially
unable to resolve the load generator’s IP address.
Connections
Shows the number of open TCP/IP connections
(y-axis) at each point in time of the scenario
(x-axis). One HTML page may cause the browser to
open several connections, when links on the page
go to different Web addresses. Two connections are
opened for each Web server.
Connections per Second
Shows the number of new TCP/IP connections
(y-axis) opened and the number of connections that
are shut down each second of the scenario (x-axis).
SSLs per Second
Shows the number of new and reused SSL
Connections (y-axis) opened in each second of the
scenario (x-axis). An SSL connection is opened by
the browser after a TCP/IP connection has been
opened to a secure server.
Windows Resources
Shows the NT and Windows 2000 resources
measured during the scenario. The NT and
Windows 2000 measurements correspond to the
built-in counters available from the Windows
Performance Monitor.
UNIX Resources
Shows the UNIX resources measured during the
scenario. The UNIX measurements include those
available by the rstatd daemon: average load,
collision rate, context switch rate, CPU utilization,
incoming packets error rate, incoming packets rate,
interrupt rate, outgoing packets error rate, outgoing
packets rate, page-in rate, page-out rate, paging rate,
swap-in rate, swap-out rate, system mode CPU
utilization, and user mode CPU utilization.
307
Chapter 14 • Online Monitor Graphs
Graph
Server Resources
Shows the resources (CPU, disk space, memory, or
services) used on remote Unix servers measured
during the scenario. This helps you determine the
impact of Vuser load on the various system
resources. The x-axis represents the elapsed time.
The y-axis represents the resource usage.
SNMP Resources
Shows statistics for machines running an SNMP
agent, using the Simple Network Management
Protocol (SNMP). The x-axis represents the elapsed
time. The y-axis represents the resource usage.
SiteScope
Displays statistics about the resource usage on the
SiteScope machine during the scenario run. The
x-axis represents the elapsed time. The y-axis
represents the resource usage.
Network Delay Time
Shows the delays for the complete path between the
source and destination machines (for example, the
database server and Vuser load generator). The
graph maps the delay as a function of the elapsed
scenario time.
CheckPoint FireWall-1
Shows statistics on Check Point’s Firewall server as a
function of the elapsed scenario time. The x-axis
represents the time that has elapsed since the start
of the scenario run. The y-axis represents the
resource usage.
Apache
Microsoft IIS
308
Description
Displays statistics about the resource usage on the
Apache server during the scenario run.The x-axis
represents the time that has elapsed since the start
of the scenario run. The y-axis represents the
resource usage.
Shows server statistics as a function of the elapsed
scenario time. The x-axis represents the time that
has elapsed since the start of the scenario run. The
y-axis represents the resource usage.
Chapter 14 • Online Monitor Graphs
Graph
Description
Microsoft Active Server
Pages
Displays statistics about the resource usage on the
ASP server during the scenario run. The x-axis
represents the time that has elapsed since the start
of the scenario run. The y-axis represents the
resource usage.
WebLogic (SNMP)
Displays statistics about the resource usage on the
WebLogic (SNMP) server (version 6.0 and earlier)
during the scenario run. The x-axis represents the
time that has elapsed since the start of the scenario
run. The y-axis represents the resource usage.
DB2
Shows the resource usage on the DB2 database
server machine as a function of the elapsed scenario
time. The x-axis represents the time that has elapsed
since the start of the scenario run. The y-axis
represents the resource usage.
Oracle
Displays information from Oracle V$ tables: Session
statistics, V$SESSTAT, system statistics, V$SYSSTAT,
and other table counters defined by the user in the
custom query.
SQL Server
Shows the standard Windows resources on the SQL
server machine. The x-axis represents the time that
has elapsed since the start of the scenario run. The
y-axis represents the resource usage.
RealPlayer Client
Shows statistics on the RealPlayer client machine as
a function of the elapsed scenario time. The x-axis
represents the time that has elapsed since the start
of the scenario run. The y-axis represents the
resource usage.
Media Player Client
Shows statistics on the Windows Media Player client
machine as a function of the elapsed scenario time.
The x-axis represents the time that has elapsed since
the start of the scenario run. The y-axis represents
the resource usage.
309
Chapter 14 • Online Monitor Graphs
Graph
310
Description
SAPGUI
Shows the resource usage of a SAP R/3 system server
as a function of the elapsed scenario time. The
x-axis represents the time that has elapsed since the
start of the scenario run. The y-axis represents the
resource usage.
Siebel Server Manager
Shows the resource usage of your Siebel Server
Manager server as a function of the elapsed scenario
time.
PeopleSoft (Tuxedo)
Shows the resource usage of your Tuxedo server as a
function of the elapsed scenario time.
J2EE
Shows the resource usage of Java 2 Platform,
Enterprise Edition (J2EE) objects as a function of the
elapsed scenario time. The x-axis represents the
time that has elapsed since the start of the scenario
run. The y-axis represents the resource usage.
Microsoft COM+
A series of graphs that provide performance
information for COM+ interfaces and methods as a
function of the elapsed scenario time.
Citrix MetaFrame XP
Citrix MetaFrame is an Application Deployment
solution which delivers applications across
networks. The Citrix MetaFrame Resource Monitor
is an Application Deployment Solution monitor,
which provides performance information for the
Citrix MetaFrame servers. The Citrix MetaFrame XP
graph displays statistics about resource usage on the
Citrix server during the scenario run.
Tuxedo
Provides information about the server, load
generator, workstation handler, and queue in a
Tuxedo system.
IBM WebSphere MQ
Shows the resource usage of IBM WebSphere MQ
Server channel and queue performance counters as
a function of the elapsed scenario time.
Network Client
Shows statistics for FTP, POP3, SMTP, IMAP, and
DNS Vusers on the network client machine as a
function of the elapsed scenario time.
Chapter 14 • Online Monitor Graphs
311
Chapter 14 • Online Monitor Graphs
312
15
Rendezvous Points
This chapter includes:
Concepts
➤
Rendezvous Points Overview on page 314
Tasks
➤
How to Set Up a Rendezvous in a Scenario on page 315
Reference
➤
Rendezvous User Interface on page 317
313
Chapter 15 • Rendezvous Points
Concepts
Rendezvous Points Overview
During a scenario run, you can instruct multiple Vusers to perform tasks
simultaneously by using rendezvous points. A rendezvous point creates
intense user load on the server and enables LoadRunner to measure server
performance under load.
Suppose you want to measure how a Web-based banking system performs
when ten Vusers simultaneously check account information. To emulate the
required user load on the server, you instruct all the Vusers to check account
information at exactly the same time.
You ensure that multiple Vusers act simultaneously by creating a rendezvous
point. When a Vuser arrives at the rendezvous point, it is held there by the
Controller. You then set a rendezvous policy according to which the
Controller releases the Vusers from the rendezvous point either when the
required number of Vusers arrives, or when a specified amount of time has
passed.
You define rendezvous points in the Vuser script. For information about
inserting rendezvous points into Vuser scripts, see the HP Virtual User
Generator User Guide.
Using the Controller, you can influence the level of server load by selecting:
➤
which of the rendezvous points will be active during the scenario
➤
how many Vusers will take part in each rendezvous
For example, to test a bank server, you could create a scenario that contains
two rendezvous points. The first rendezvous ensures that 1000 Vusers
simultaneously deposit cash. The second rendezvous ensures that another
1000 Vusers simultaneously withdraw cash. If you want to measure how the
server performs when only 500 Vusers deposit cash, you can deactivate the
withdraw rendezvous, and instruct 500 Vusers to participate in the deposit
rendezvous only.
314
Chapter 15 • Rendezvous Points
Tasks
How to Set Up a Rendezvous in a Scenario
This task describes set up rendezvous points and policies in a scenario.
This task includes the following steps:
➤
"Prerequisites" on page 315
➤
"Set the level of emulated user load" on page 315
➤
"Set the attributes for the rendezvous policy - Optional" on page 316
1 Prerequisites
To set up a rendezvous in the scenario, your scenario must include Vuser
scripts that have rendezvous points inserted in them. For information
about inserting rendezvous points into Vuser scripts, see the HP Virtual
User Generator User Guide.
When you add a Vuser group or script to the scenario, LoadRunner scans
the included scripts for the names of the rendezvous points and adds
them to the list of rendezvous points. You can the list of all the
rendezvous points in your scenario by selecting Scenario > Rendezvous.
Note: In goal-oriented scenarios, a script’s rendezvous points are disabled.
2 Set the level of emulated user load
Select the rendezvous points to take part in the scenario, and the number
of Vusers to participate in each rendezvous. For user interface details, see
"Rendezvous Information Dialog Box" on page 317.
315
Chapter 15 • Rendezvous Points
You can temporarily disable a rendezvous and exclude it from the
scenario. You can disable a rendezvous point for all Vusers in a scenario,
or you can temporarily disable specific Vusers from participating in the
rendezvous.
By disabling and enabling a rendezvous, you influence the level of server
load.
3 Set the attributes for the rendezvous policy - Optional
In the Rendezvous Information dialog box, for each rendezvous:
a Select the rendezvous, and click the Policy button.
b In the Policy dialog box, set the policy attributes as follows:
➤
Release. How many Vusers will be released from a rendezvous at a
time.
➤
Timeout. How long the Controller waits before releasing Vusers
from a rendezvous.
For user interface details, see "Rendezvous Information Dialog Box" on
page 317.
316
Chapter 15 • Rendezvous Points
Reference
Rendezvous User Interface
This section includes (in alphabetical order):
➤
Rendezvous Information Dialog Box on page 317
Rendezvous Information Dialog Box
This dialog box enables you to view and modify the attributes of each
rendezvous point in the scenario. It displays general information about the
rendezvous point: which script is associated with the rendezvous, and
release history.
To access
Manual scenario > Design tab > Scenario > Rendezvous
Important
information
Available only if one of the Vuser scripts participating in
the scenario contains a rendezvous point.
Relevant tasks
"How to Set Up a Rendezvous in a Scenario" on page 315
User interface elements are described below:
UI Elements (A-Z)
Description
Disables the rendezvous, excluding it from the scenario,
thereby influencing the level of server load.
Enables a disabled rendezvous point.
317
Chapter 15 • Rendezvous Points
UI Elements (A-Z)
Description
Opens the Policy dialog box, where you can set the
number Vusers to be released from a rendezvous at a
time, as well as the amount of time the Controller waits
before releasing Vusers from a rendezvous.
➤ Release when X% of all Vusers arrive at the
rendezvous. Releases the Vusers only when the
specified percentage of all Vusers arrives at the
rendezvous point.
Note: This option interferes with the scheduling of
your scenario. If you select this option, your scenario
will not run as scheduled.
➤ Release when X% of all running Vusers arrive at the
rendezvous. Releases the Vusers only when the
specified percentage of all Vusers running in the
scenario arrives at the rendezvous point.
➤ Release when X Vusers arrive at the rendezvous.
Releases the Vusers only when the specified number
arrives at the rendezvous point.
➤ Timeout between Vusers. The timeout value (in
seconds). After each Vuser arrives at the rendezvous
point, LoadRunner waits up to the maximum timeout
period specified for the next Vuser to arrive. If the next
Vuser does not arrive within the timeout period, the
Controller releases all the Vusers from the rendezvous.
Each time a new Vuser arrives, the timer is reset to
zero. You set a timeout for each rendezvous point.
Default value: 30 seconds
Disables a Vuser from taking part in the rendezvous.
Enables a Vuser to take part in the rendezvous.
Resets the Status Information, removing the information
currently displayed.
318
Chapter 15 • Rendezvous Points
UI Elements (A-Z)
Description
While a scenario is running, enables you to manually
release Vusers from a rendezvous before the Controller
releases them. Use this option if you want the scenario to
continue running even though all the Vusers did not
reach the rendezvous.
Rendezvous
The names of the rendezvous points in the scenario.
Scripts
The Vuser scripts that are associated with the rendezvous
points.
Status Information
During and after a scenario, displays:
➤ Current Status. The number of Vusers that arrived at
the rendezvous point out of the total number of
Vusers assigned to the rendezvous.
➤ Time. The time at which the Vusers at the rendezvous
point were released.
➤ Reason. The reason the Vusers at the rendezvous point
were released. The possible reasons are Timeout or
Arrived.
Vusers
The Vusers associated with the rendezvous points.
319
Chapter 15 • Rendezvous Points
320
16
After the Scenario Run
This chapter includes:
Concepts
➤
Post Scenario Run Procedures - Overview on page 322
➤
Collating Run Data on page 322
Tasks
➤
How to Collate Scenario Run Results on page 324
Reference
➤
Results Directory File Structure on page 325
➤
Collating Results User Interface on page 327
321
Chapter 16 • After the Scenario Run
Concepts
Post Scenario Run Procedures - Overview
After the scenario runs you analyze the results using HP LoadRunner
Analysis. If the run results are stored locally on each participating load
generator, they need to be gathered into one location so that they can be
processed for analysis. Diagnostics results on the mediators and severs must
also be gathered. This process is known as data collation.
For details about collating run results and diagnostics data, see "Collating
Run Data" on page 322.
For details about analyzing the scenario run, see the HP LoadRunner Analysis
User Guide.
Collating Run Data
When you run a scenario, by default all the run data is stored locally on
each load generator. After scenario execution, the results must be collated—
that is, the results from all of the load generators must be gathered and
transferred to the results directory–before any analysis data can be
generated.
In addition, data from the diagnostics servers or mediators must be collated
as well.
You can set LoadRunner to collate the run data automatically, as soon as the
run is complete. Alternatively, you can collate the run data manually after
the run. This way, you can save and close a scenario and collate the data
after reopening the scenario in the Controller.
The data that is collated include the result, diagnostics, and log files. After
LoadRunner has successfully collated the data, these files are deleted from
the load generators and diagnostics mediators from which they were
gathered.
322
Chapter 16 • After the Scenario Run
Note: In Expert mode, you can disable the collation of the log file collation
(see "Configure general scenario options for Expert mode" on page 217).
For details on how to collate run data, see "How to Collate Scenario Run
Results" on page 324.
323
Chapter 16 • After the Scenario Run
Tasks
How to Collate Scenario Run Results
This task describes how to collate results after a scenario run.
Note:
➤
Data collation includes result, diagnostics, and log files. If you are
working in Expert mode, you can disable the collation of the log files.
Before collating the results, select Tools > Options > General tab > Do not
collate log files.
➤
You can set a command to run when collation is complete. Select Tools >
Options > Execution tab, and enter the command in the Post Collate
Command box.
To collate results automatically:
Select Results > Auto Collate Results.
To collate results manually:
Select Results > Collate Results > Collate Results.
To stop the collation process:
In the Collate Results dialog box, click Stop.
To resume the collation process:
If you stopped the collation process, to resume select Results >
Collate Results > Continue stopped collation.
If collation fails due to a lack of disk space:
To recollate, select Results > Collate Results > Recollate. LoadRunner
attempts to collate the results again, without compressing the .eve file.
324
Chapter 16 • After the Scenario Run
Reference
Results Directory File Structure
Before you run a scenario, you specify where the run results should be
stored. LoadRunner saves all the data it gathers during the run to the
specified directory. A typical results directory has the following structure:
The content of the results directory are described in the following table:
Directory/File
Description
log directory
Contains output information generated during
replay for each Vuser
sum_data directory
Contains the graph summary data (.dat) files.
*_bd directories
Contain diagnostics breakdown information.
325
Chapter 16 • After the Scenario Run
326
Directory/File
Description
*.cfg files
Contain a listing of the script's run-time settings as
defined in VuGen (think time, iterations, log, Web,
and so on). The results directory contains a .cfg file
for each script.
*.def files
Definition files for graphs that describe the online
and other custom monitors.
*.usp files
Contain the script's run logic, including how the
actions sections run. The results directory contains
a .usp file for each script.
_t_rep.eve
Contains Vuser and rendezvous information.
<Controller>.eve
Contains information from the Controller host.
<Load_Generator>.eve.gzl
files
The <load generator>.eve files contain information
from the load generators in the scenario. These files
are zipped and saved to the results directory in .gzl
format.
<Load_Generator>.map
Maps transactions and data points on the load
generator to IDs.
<results_name> directory
Contains the scenario run results.
<results_name>.lrr
Contains information about the scenario run, such
as the name, duration, scripts included, and so on.
collate.txt
Contains the file paths of the result files, and
collation status information.
collateLog.txt
Contains the status (succeeded, failed) of result,
diagnostics, and log file collation from each load
generator.
HostEmulatedLocation.txt
Contains the emulated locations defined for
WAN Emulation.
offline.dat
Contains sample monitor information.
output.mdb
The database created by the Controller. Stores all
the output messages reported during the scenario
run.
Chapter 16 • After the Scenario Run
Directory/File
Description
remote_results.txt
Contains the file paths for the host event files
SLAConfiguration.xml
Contains SLA definition information for the
scenario.
When you generate analysis graphs and reports, the Analysis engine copies
all of the scenario result files (.eve and .lrr) to a database. After the database
is created, Analysis works directly with the database and does not use the
result files.
Collating Results User Interface
This section includes:
➤
Collate Results Dialog Box on page 327
Collate Results Dialog Box
This dialog box enables you to view the progress of result collation after a
scenario run.
To access
➤ Results > Collate Results > Collate Results
➤ If Auto Collate Results is activated, this dialog box
opens automatically when LoadRunner starts collating
the run results after a scenario run.
Relevant tasks
➤ "How to Collate Scenario Run Results" on page 324
➤ "Enable Automatic Result Collation - optional" on
page 241
327
Chapter 16 • After the Scenario Run
User interface elements are described below:
UI Elements (A-Z)
Description
Stops collating the results.
Close automatically
Select to automatically close the Collate Results dialog
box after collation is completed.
General Status
The collation status and file size of the Event,
Diagnostics, and Log files.
Note: The file size shown is before compression.
Progress Details
328
The status (succeeded, failed) of result, diagnostics, and
log file collation from each load generator or mediator.
This information is stored in the collateLog.txt file.
17
Using QuickTest Scripts in LoadRunner
This chapter includes:
Concepts
➤
Using QuickTest Scripts in LoadRunner Overview on page 330
➤
About GUI Vuser Scripts on page 330
➤
Guidelines for Using QuickTest Scripts in LoadRunner on page 333
Tasks
➤
How to Add a QuickTest Script to a Load Test Scenario on page 335
329
Chapter 17 • Using QuickTest Scripts in LoadRunner
Concepts
Using QuickTest Scripts in LoadRunner Overview
HP Functional Testing software (QuickTest) enables you to create complex
tests that examine the full spectrum of your application’s functionality.
LoadRunner can integrate QuickTest scripts into a load testing scenario in
the form of GUI Vuser scripts. These scripts, that have already been designed
and debugged in QuickTest can be used as the basis of your load test.
The main advantages of running QuickTest scripts in LoadRunner are:
➤
To check how your application’s functionality is affected by heavy load
➤
To measure the response time that a typical user experiences on the client
side while your application is under load (end-to-end response time)
For example, you can add QuickTest scripts to specific points in a
LoadRunner scenario to confirm that the application’s functionality is not
affected by the extra load at those sensitive points.
Another advantage of using a GUI Vuser script as part of your LoadRunner
scenario is that the GUI Vuser script runs on your screen during the
scenario, enabling you to watch the actual steps executed by the Vuser in
real time.
About GUI Vuser Scripts
GUI Vusers enable you to measure and monitor end-to-end user response
times while your client/server system is under load. A GUI Vuser emulates
the complete environment of a human user.
For example, a human user sits at a machine, operates applications using the
keyboard and the mouse, and reads information on the machine’s monitor.
Similarly, a GUI Vuser runs on its own machine and operates applications. A
GUI Vuser can be programmed to read and act on information that appears
on its machine’s display.
330
Chapter 17 • Using QuickTest Scripts in LoadRunner
Suppose that you have a bank server that services many automatic teller
machines (ATMs). You could create a GUI Vuser script that:
➤
opens the ATM application
➤
enters an account number
➤
enters the amount of cash to be withdrawn
➤
withdraws cash from the account
➤
checks the balance of the account
➤
closes the ATM application
➤
repeats the process
The actions of each GUI Vuser are described in a GUI Vuser script. You use
QuickTest to create GUI Vuser scripts.
You monitor and manage GUI Vusers using the LoadRunner Controller. For
instance, you can use the Controller to run, pause, or view Vusers, and to
monitor scenario status.
Note: You cannot use VuGen to run a GUI Vuser script. You use the
Controller to run a GUI Vuser script as part of a scenario; you use QuickTest
to run a GUI Vuser script in standalone mode.
331
Chapter 17 • Using QuickTest Scripts in LoadRunner
Understanding GUI Vuser Technology
GUI Vusers measure real end-to-end response times. End-to-end response
times represent the total time that a user waits for a response after
submitting a request. End-to-end response times include GUI response times
as well as network and server response times.
332
Chapter 17 • Using QuickTest Scripts in LoadRunner
Guidelines for Using QuickTest Scripts in LoadRunner
When creating test scripts in QuickTest that are going to be used as GUI
Vuser scripts in a LoadRunner testing scenario, you need to follow certain
guidelines to ensure smooth integration of the script. For detailed
explanations about creating tests in QuickTest, see the QuickTest
documentation.
This section also includes:
➤
"Limitations" on page 333
➤
"Including Transactions" on page 333
➤
"Adding Statements" on page 334
➤
"Designing Tests for LoadRunner" on page 334
Limitations
QuickTest offers several features that are designed specifically for integration
with LoadRunner. Some QuickTest features, however, may not be available
when they are integrated with LoadRunner. For more information about
specific limitations, see the QuickTest readme.
Including Transactions
To measure the performance of the server, you define transactions. A
transaction represents an action or a set of actions that you are interested in
measuring. You define transactions within your Vuser script by enclosing
the appropriate sections of the script with start and end transaction
statements.
For example, you can define a transaction that measures the time it takes for
the server to process a request to view the balance of an account and for the
information to be displayed at the ATM.
333
Chapter 17 • Using QuickTest Scripts in LoadRunner
Note: LoadRunner only provides performance information for data that is
included within a transaction. Therefore, your QuickTest test must include
transactions to be used by LoadRunner.
For more information about using transactions in QuickTest, see the
QuickTest documentation.
Adding Statements
You can use the Services object and its associated methods to insert
statements that are specifically relevant to performance testing. These
include Abort, GetEnvironmentAttribute, LogMessage,
SetTransactionStatus, ThinkTime, UserDataPoint, StartTransaction and
EndTransaction. For more information on these methods, see the QuickTest
documentation.
Designing Tests for LoadRunner
Consider the following design guidelines when designing tests for use with
LoadRunner:
334
➤
The QuickTest tests you use with LoadRunner should be simple tests,
designed to pinpoint specific operations.
➤
LoadRunner cannot run nested action iterations.
➤
Do not include references to external actions or other external resources,
such as an external Data Table file, environment variable file, shared
object repositories, and so forth.
➤
Include transactions in your QuickTest test since LoadRunner only
provides performance information for data that is included within a
transaction.
Chapter 17 • Using QuickTest Scripts in LoadRunner
Tasks
How to Add a QuickTest Script to a Load Test Scenario
This task describes how to integrate a QuickTest script into LoadRunner.
1 Navigate to the folder containing the script.
➤
For a new scenario, click Browse in the New Scenario dialog box.
➤
When adding the script to an existing scenario, click Browse in the
Add Group/Add Script dialog box. The Open Test dialog box opens.
2 In the Files of Type box select QuickTest Tests.
3 Navigate to the appropriate script and add it to your scenario.
335
Chapter 17 • Using QuickTest Scripts in LoadRunner
336
18
Managing Scenarios Using Application
Lifecycle Management
This chapter includes:
Concepts
➤
Managing Scenarios Using Application Lifecycle Managment Overview
on page 338
Tasks
➤
How to Work with Scenarios in ALM Projects on page 339
➤
How to Save Scenarios to ALM Projects on page 340
➤
How to Add Vuser Scripts from a Application Lifecycle Management
Project on page 341
Reference
➤
Application Lifecycle Management User Interface on page 343
337
Chapter 18 • Managing Scenarios Using Application Lifecycle Management
Concepts
Managing Scenarios Using Application Lifecycle
Managment Overview
The Controller works together with Application Lifecycle Managment
(ALM), HP’s Web-based test management tool. HP ALM provides an efficient
method for storing and retrieving Vuser scripts, scenarios, and results. You
can store scenarios in an ALM project and organize them into unique
groups.
In order for the Controller to access an ALM project, you must connect it to
the Web server on which HP Application Lifecycle Managment is installed.
You can connect to either a local or remote Web server.
For more information on working with Application Lifecycle Managment,
see the Application Lifecycle Management User’s Guide.
338
Chapter 18 • Managing Scenarios Using Application Lifecycle Management
Tasks
How to Work with Scenarios in ALM Projects
The following steps describe the workflow of how to work with scenarios
saved in an Application Lifecycle Managment project.
➤
"Connect to ALM" on page 339
➤
"Open the scenario" on page 339
➤
"Save the scenario" on page 339
1 Connect to ALM
Open a connection to the ALM server and project that contains the
scenario. For task details, see "Connect to ALM" on page 339.
2 Open the scenario
Select File > Open and specify the location of the scenario.
3 Save the scenario
Select File > Save as. If the scenario is in a project that uses version control
and is not checked out, the scenario is only saved as a temporary file on
your local machine.
Connect to ALM
To store and retrieve scenarios from ALM, you need to connect to an ALM
project. You can connect or disconnect from an ALM project at any time
during the testing process.
The connection process has two stages. First, you connect to an ALM Web
server. This server handles the connections between the Controller and the
ALM project.
Next, you select the project you want to access. The project stores the
scenarios that you created in the Controller.
339
Chapter 18 • Managing Scenarios Using Application Lifecycle Management
To connect to Application Lifecycle Management:
1 Select Tools > HP ALM Connection.
2 Complete the HP ALM Connection dialog box and select Connect.
3 For user interface details, see "HP ALM Connection Dialog Box" on
page 343.
4 To disconnect from ALM, click Disconnect.
How to Save Scenarios to ALM Projects
The following steps describe how to save a scenario to an ALM project.
➤
"Open/create the scenario" on page 340
➤
"Connect to HP Application Lifecycle Management" on page 340
➤
"Save the scenario to ALM" on page 341
1 Open/create the scenario
Create or open the desired scenario.
2 Connect to HP Application Lifecycle Management
Open a connection to the ALM server and project that you want to store
the scenario. For task details, see "Connect to ALM" on page 339.
3 Define a test set
Define a Application Lifecycle Management test set where to save results
as follows:
a Select Results > Results Settings. The Set Results Directory dialog box
opens.
b Click HP ALM...
c Enter the required information in the Set Results Directory dialog box.
For user interface details, see "Set Results Directory Dialog Box" on
page 243.
340
Chapter 18 • Managing Scenarios Using Application Lifecycle Management
d Click OK.
4 Save the scenario to ALM
Select File > Save as and specify the location.
How to Add Vuser Scripts from a Application Lifecycle
Management Project
The following steps describe how to add Vuser scripts from a Application
Lifecycle Management project to the Controller’s script list. You can add the
script to either a manual or a goal-oriented scenario.
➤
"Add a Vuser script to a manual scenario" on page 341
➤
"Add a Vuser script to a goal-oriented scenario" on page 341
Add a Vuser script to a manual scenario
1 Open a connection to the ALM server and project where the scripts are
located. For task details, see "Connect to ALM" on page 339.
2 In the Scenario Groups pane, click the Add Group button.
3 In the Add Group dialog box, click Browse. The Open Test from HP ALM
Project dialog box opens.
4 Select the script and click OK. The Script Path field displays [TD], the full
subject path, and the script name.
For example:
[TD]\Subject\System\test_alm
5 Click OK. The script is displayed in the Scenario Groups pane.
Add a Vuser script to a goal-oriented scenario
1 Open a connection to the ALM server and project where the scripts are
located. For task details, see "Connect to ALM" on page 339.
2 On the Scenario Scripts pane toolbar, click the Add Script button. The
Add Script dialog box opens.
341
Chapter 18 • Managing Scenarios Using Application Lifecycle Management
3 Click Browse. The Open Test from HP ALM Project dialog box opens and
displays the test plan tree.
4 Select the script and click OK. The Script Path field displays [TD], the full
subject path, and the script name.
For example:
[TD]\Subject\System\test_alm
5 Click OK to close the Add Script dialog box. The script appears in the
Script Path column in the Scenario Scripts pane.
342
Chapter 18 • Managing Scenarios Using Application Lifecycle Management
Reference
Application Lifecycle Management User Interface
This section includes:
➤
HP ALM Connection Dialog Box on page 343
➤
Upload Scenario Dialog Box on page 346
HP ALM Connection Dialog Box
This dialog box enables you to connect to an ALM project from within the
Controller.
To access
Tools > HP ALM Connection > Connect
343
Chapter 18 • Managing Scenarios Using Application Lifecycle Management
User interface elements are described below:
UI Elements (A-Z)
Description
Step 1: Connect to
Server
➤ Server URL. The URL of the server that contains HP
ALM.
➤ Reconnect to server on startup. Automatically
reconnect to the server every time you start the
application.
➤
344
/
. Connects to the
server specified in the Server URL box. Only one
button is visible at a time, depending on your
connection status.
Chapter 18 • Managing Scenarios Using Application Lifecycle Management
UI Elements (A-Z)
Description
Step 2: Authenticate
User Information
➤ User Name. Your ALM user name.
➤ Password. Your ALM password.
➤ Authenticate on startup. Authenticates your user
information automatically, the next time you open
the application. This option is only available if you
selected Reconnect to server on startup above.
➤
. Authenticates your user information
against the ALM server.
After your user information has been authenticated,
the fields in the Authenticate user information area
are displayed in read-only format. The Authenticate
button changes to
.
You can log in to the same ALM server using a
different user name by clicking Change User, entering
a new user name and password, and then clicking
Authenticate again.
Step 3: Login to
Project
➤ Domain. The domain that contains the ALM project.
Only those domains containing projects to which you
have permission to connect to are displayed. (If you
are working with a project in versions of TestDirector
earlier than version 7.5, the Domain box is not
relevant.)
➤ Project. Enter the ALM project name or select a project
from the list. Only those projects that you have
permission to connect to are displayed.
➤ Login to project on startup. This option is only
enabled when the Authenticate on startup check box
is selected.
➤
/
the ALM project.
.Logs into and out of
345
Chapter 18 • Managing Scenarios Using Application Lifecycle Management
Upload Scenario Dialog Box
This dialog box enables you to open a scenario from an ALM project or save
a scenario to an ALM project.
To access
File > Open > Click
File > Save as > Click
User interface elements are described below:
Upl
346
UI Elements (A-Z)
Description
Upload run time files
Uploads only the files needed to replay the scenario.
Does not upload recording snapshot files and other
unnecessary files. This results in a shorter download
time.
Upload all files
Uploads all of the files associated with this scenario. This
results in a longer upload time.
Part IV
Working with Firewalls
348
19
Working with Firewalls in LoadRunner
This chapter includes:
Concepts
➤
About Using Firewalls in LoadRunner on page 350
➤
Monitors Over a Firewall on page 353
Tasks
➤
How to Set Up Your System to Use Firewalls on page 355
➤
How to Configure the Over-Firewall System on page 357
➤
How to Configure the System to Monitor Servers Over a Firewall
on page 361
➤
How to Configure the LoadRunner Agent on Each Monitor Over Firewall
Machine on page 362
➤
How to Configure Monitors Over a Firewall on page 365
Reference
➤
Working With Firewalls in LoadRunner - User Interface on page 368
Troubleshooting on page 375
349
Chapter 19 • Working with Firewalls in LoadRunner
Concepts
About Using Firewalls in LoadRunner
Working with a firewall means that you can prevent unauthorized access to
or from a private network, on specific port numbers.
For example, you can specify that there is no access to any port from the
outside world, with the exception of the mail port (25), or you can specify
that there is no outside connection from any ports to the outside except
from the mail port and WEB port (80). The port settings are configured by
the system administrator.
In a regular LoadRunner load test scenario (not over a firewall), the
Controller has direct access to the LoadRunner agents running on remote
machines. This enables the Controller to connect directly to those
machines.
When running Vusers or monitoring applications over a firewall, this direct
connection is blocked by the firewall. The connection cannot be established
by the Controller, because it does not have permissions to open the firewall.
350
Chapter 19 • Working with Firewalls in LoadRunner
LoadRunner solves this problem by using a communication configuration
based on HTTPS or secured TCP/IP. This configuration uses the standard SSL
port on the firewall (port 443). For more information, see "Set Up Your
Deployment (TCP or HTTPS)" on page 357.
A LoadRunner agent is installed on load generators running Vusers over a
firewall, and on Monitor Over Firewall machines that monitor the servers
that are located over a firewall. The agent communicates with the MI
Listener machine through port 443 in the firewall.
The MI Listener is a component that serves as a router between the
Controller and the LoadRunner agent.
When the LoadRunner agent connects to the MI Listener, the MI Listener
keeps a listing of the connection to the agent using a symbolic name that
the agent passed to it.
When the Controller connects to the MI Listener, it communicates to the
MI Listener through port 50500.
351
Chapter 19 • Working with Firewalls in LoadRunner
The Controller uses a symbolic name for the agent, and provides the MI
Listener machine’s name. If there has been a connection from the agent
with the same symbolic name to this MI Listener, the connection is made
between the Controller and the agent. Once you have a connection with the
agent, you can run or monitor Vusers over a firewall.
Example of Over Firewall Deployment
The following diagram is a basic example of a LoadRunner deployment over
a firewall.
As explained in the previous section, the LoadRunner agent is installed on
both the load generator machine and the Monitor Over Firewall machine.
During installation, the LoadRunner agent is added as a Windows service.
352
Chapter 19 • Working with Firewalls in LoadRunner
The MI Listener serves as a router between:
➤
The agent on the load generator machine and the Controller, enabling
the Controller to run Vusers over a firewall.
➤
The agent on the Monitor Over Firewall machine and the Controller,
enabling the Controller to monitor the servers that are located over a
firewall.
Note: You can connect the Controller to load generators over a firewall or
Monitor Over Firewall machines without using the MI Listener and
LoadRunner agent. To do so, open port 54345 on a firewall in the load
generator/Monitor Over Firewall machine’s LAN and in the Controller’s LAN
to allow incoming and outgoing data.
Monitors Over a Firewall
To monitor servers over a firewall, you need to configure the Monitor Over
Firewall machine. On the Monitor Over Firewall machine, you use the
Server Monitor configuration tool to select which servers to monitor and to
define specific measurements that LoadRunner collects for each monitored
server.
To enable monitoring of your servers over a firewall, you install the Monitor
Over Firewall component on a dedicated machine.
Important: Before you configure your system to monitor your servers over a
firewall, ensure that you have completed the configuration steps described
in "How to Configure the Over-Firewall System" on page 357.
After you have set up your LoadRunner system to work with firewalls, you
need to configure the monitor settings on the Monitor Over Firewall
machine.
353
Chapter 19 • Working with Firewalls in LoadRunner
You use the Server Monitor configuration tool to select which servers to
monitor and to define specific measurements that LoadRunner collects for
each monitored server. For more information, see "How to Configure
Monitors Over a Firewall" on page 365.
354
Chapter 19 • Working with Firewalls in LoadRunner
Tasks
How to Set Up Your System to Use Firewalls
Setting up your system to use firewalls involves the following stages of
configuration:
This task includes the following steps:
➤
"Install Components and Perform Initial Configuration" on page 355
➤
"Set Up Your System to Run Vusers Over the Firewall" on page 356
➤
"Configure Your System to Monitoring Servers Over a Firewall" on
page 357
➤
"Check Connectivity" on page 357
1 Install Components and Perform Initial Configuration
Perform the following steps:
a Install the over-firewall components.
To enable over firewall communication, ensure that you have installed
the following LoadRunner components:
➤
MI Listener. Serves as a router between the Controller and the
LoadRunner agent. You install the MI Listener component on a
dedicated machine. For installation instructions, refer to the HP
LoadRunner Installation Guide.
For instructions on configuring the MI Listener machine, see
"Configure the MI Listener" on page 360.
355
Chapter 19 • Working with Firewalls in LoadRunner
Note: You can also use the Controller machine as the MI Listener
without the need for a separate installation. When acting as the MI
Listener, the Controller machine cannot have Vusers running on it.
In this case, the Controller must be a pure Controller and not a
Controller + Load Generator.
➤
Monitor Over Firewall component. Used to monitor the servers that
are located over a firewall. You install the Monitors over Firewall
component on a dedicated machine. For installation instructions,
refer to the HP LoadRunner Installation Guide.
For information about configuring the Monitor Over Firewall
machine, see "How to Configure Monitors Over a Firewall" on
page 365.
b Perform the initial configuration of the over-firewall system.
See "How to Configure the Over-Firewall System" on page 357.
2 Set Up Your System to Run Vusers Over the Firewall
Note: Before configuring your system to run Vusers over a firewall, make
sure that you have completed the steps described in "How to Configure
the Over-Firewall System" on page 357.
To set up your system to run Vusers over a firewall, you configure the
LoadRunner agent to communicate with the MI Listener on each load
generator machine that will be running over the firewall. For more
information, see "Configure the LoadRunner Agent on Each Monitor Over
Firewall Machine" on page 361.
You then configure the Controller to recognize the load generator and MI
Listener machines. For more information, see "Configure the Controller
for Running Over a Firewall" on page 361.
356
Chapter 19 • Working with Firewalls in LoadRunner
3 Configure Your System to Monitoring Servers Over a Firewall
See "How to Configure the System to Monitor Servers Over a Firewall" on
page 361
4 Check Connectivity
After installing a configuring all the necessary components, check that
you are able to establish a connection between the LoadRunner agent, MI
Listener, and the Controller machine. For more information, see
"Checking Connectivity" on page 375.
How to Configure the Over-Firewall System
This task describes how to configure the Over-Firewall System.
This task includes the following steps:
➤
"Prerequisites" on page 357
➤
"Set Up Your Deployment (TCP or HTTPS)" on page 357
➤
"Configure the Firewall to Allow Agent Access" on page 359
➤
"Configure the MI Listener" on page 360
1 Prerequisites
Before configuring the over-firewall system, make sure you have installed
the necessary components as described in "Install Components and
Perform Initial Configuration" on page 355.
2 Set Up Your Deployment (TCP or HTTPS)
To run Vusers or monitor servers over the firewall, configure your system
according to one of the following configurations. Note that these
configurations contain a firewall on each LAN. There may also be
configurations where there is a firewall for the Over-Firewall LAN only.
➤
TCP Configuration
357
Chapter 19 • Working with Firewalls in LoadRunner
The TCP configuration requires every LoadRunner agent machine
behind the customer’s firewall to be allowed to open a port in the
firewall for outgoing communication.
358
Chapter 19 • Working with Firewalls in LoadRunner
➤
HTTPS Configuration
In the HTTPS configuration, only one machine (the proxy server) is
allowed to open a port in the firewall. Therefore, it is necessary to
tunnel all outgoing communications through the proxy server.
3 Configure the Firewall to Allow Agent Access
Modify your firewall settings to enable communication between the
machines inside the firewall and machines outside the firewall.
a If your system has a TCP configuration:
The LoadRunner agent attempts to establish a connection with the MI
Listener using port 443, at intervals specified in the Connection
Timeout field in the Agent Configuration dialog box. To enable this
connection, allow an outgoing connection for HTTPS service on the
firewall for port 443. The agent can then connect to the MI Listener,
and the MI Listener can connect back to the agent. From this point on,
the agent listens to commands from the MI Listener.
359
Chapter 19 • Working with Firewalls in LoadRunner
b If your system has an HTTPS configuration:
The LoadRunner agent attempts to establish a connection with the MI
Listener, using the proxy port specified in the Proxy Port field, and at
intervals specified in the Connection Timeout field in the Agent
Configuration dialog box. When the connection is established, the
proxy server connects to the MI Listener. To enable this connection,
allow an outgoing connection for HTTPS service on the firewall for
port 443. The proxy server can then connect to the MI Listener, and
the MI Listener can connect back to the agent through the proxy
server. From this point on, the agent listens to commands from the MI
Listener.
4 Configure the MI Listener
To enable running Vusers or monitoring over a firewall, you need to
install the MI Listener on one or more machines in the same LAN as the
Controller outside the firewall. For installation instructions, refer to the
HP LoadRunner Installation Guide.
Note:
➤
The Controller installation automatically includes the MI Listener, so
you can designate the Controller as the MI Listener machine.
➤
The MI Listener can only be installed on Windows machines.
For information on how to configure the MI Listener, see "MI Listener
Configuration Dialog Box" on page 371.
360
Chapter 19 • Working with Firewalls in LoadRunner
How to Configure the System to Monitor Servers Over a
Firewall
This task describes how to set up your system to monitor the servers over a
firewall.
This task includes the following steps:
➤
"Install Components and Perform Initial Configuration" on page 355
➤
"Set Up Your System to Run Vusers Over the Firewall" on page 356
➤
"Configure Your System to Monitoring Servers Over a Firewall" on
page 357
➤
"Check Connectivity" on page 357
1 Prerequisites
Before configuring the system to monitor servers over a firewall, make
sure that you have completed the task "How to Configure the
Over-Firewall System" on page 357.
2 Configure the LoadRunner Agent on Each Monitor Over
Firewall Machine
See "How to Configure the LoadRunner Agent on Each Monitor Over
Firewall Machine" on page 362.
3 Configure the Controller for Running Over a Firewall
To run or monitor Vusers over a firewall, you need to create a unique
connection between the Controller and the agent machines. Agent
machines include load generator machines that will be running over a
firewall and all Monitor Over Firewall machines.
This connection is made through the MI Listener, which serves as a router
between the Controller and the LoadRunner agent. To establish this
connection, you configure the Controller machine to define the agent
machine as a load generator.
361
Chapter 19 • Working with Firewalls in LoadRunner
To configure the Controller for running vusers or monitoring over the
firewall, define the load generator settings as described in "Load
Generators Dialog Box" on page 124. For the server name, be sure to use
the same Local Machine Key setting as in the Agent Configuration.
Then, define the settings in the "MI Listener Configuration Dialog Box"
on page 371, using the same MI Listener name as in the Agent
Configuration.
Note: You cannot change the temporary directory on the host running or
monitoring Vusers over the firewall.
4 Configure the Servers to Monitor and Define Measurements
for Collection
You configure the monitor settings from the Monitor Over Firewall
machine, using the Monitor Configuration tool (Start > Programs >
LoadRunner > Advanced Settings > Monitor Configuration).
You select the type of monitors to run and the server whose resources you
want to monitor, add the measurements to monitor for each server, and
specify the frequency with which you want the monitored measurements
to be reported.
For detailed information about how to use the Monitor Configuration
tool, see "How to Configure Monitors Over a Firewall" on page 365.
How to Configure the LoadRunner Agent on Each
Monitor Over Firewall Machine
On each load generator machine that will be running over a firewall and on
each Monitor Over Firewall machine, you configure the LoadRunner agent
to communicate with the MI Listener. The MI Listener serves as a router
between the LoadRunner agent and the Controller.
This section includes:
362
Chapter 19 • Working with Firewalls in LoadRunner
➤
"To Configure the Windows LoadRunner Agent:" on page 363.
➤
"To Configure and Run the UNIX LoadRunner Agent:" on page 363.
➤
"To Restart the LoadRunner Agent:" on page 365.
To Configure the Windows LoadRunner Agent:
1 Stop the LoadRunner agent by right-clicking its icon in the system tray
and selecting Close, and then setting the options in the Agent
Configuration dialog box as described in "Agent Configuration Dialog
Box" on page 368.
2 Restart the LoadRunner agent by double-clicking the shortcut on the
desktop.
3 A green or red light next to the LoadRunner agent in the system tray
indicates a successful or unsuccessful connection respectively.
To Configure and Run the UNIX LoadRunner Agent:
1 Open <LoadRunner root folder>/dat/br_lnch_server.cfg in a text editor.
2 In the Firewall section, set FireWallServiceActive to 1 and save your
changes.
3 Run agent_config from the <LoadRunner root folder>/bin directory to
display the following menu:
363
Chapter 19 • Working with Firewalls in LoadRunner
4 Enter 1 to display the current settings:
5 To change a setting, enter 2 to display the settings menu:
Enter the setting and continue according to the menu instructions. Set
each option according to the "Agent Configuration Settings Dialog Box"
on page 369.
364
Chapter 19 • Working with Firewalls in LoadRunner
6 Restart the agent for the configuration changes to take effect.
To Restart the LoadRunner Agent:
1 To remove the LoadRunner agent, run the command
m_daemon_setup -remove from the <LoadRunner root folder>/bin
directory.
Note: When the LoadRunner agent is configured to run over a firewall,
and the agent is connected to the MI Listener, a file called
<local_machine_key>_connected_to_MI_Listener is created in the
temporary directory of the LoadRunner agent machine. The file is
removed when the LoadRunner agent disconnects from the MI Listener.
2 To start the LoadRunner agent, run the command m_daemon_setup
-install from the <LoadRunner root folder>/bin directory.
How to Configure Monitors Over a Firewall
After you have installed and configured the LoadRunner agent, the
Monitors over Firewall component, the MI Listener, and the Controller
machine, you need to choose the server measurements that you want the
Monitor Over Firewall machine to monitor.
You configure the server monitor properties from the Monitor Over Firewall
machine, using the Monitor Configuration Dialog Box. You can select the
type of monitors to run and the server whose resources you want to
monitor, add the measurements to monitor for each server, and specify the
frequency with which you want the monitored measurements to be
reported.
The following steps describe how to configure monitors over a firewall:
➤
"Open the Monitor Configuration Dialog Box" on page 366
➤
"Add Monitored Servers" on page 366
365
Chapter 19 • Working with Firewalls in LoadRunner
➤
"(Optional) Clone a Monitored Server’s Properties" on page 367
1 Open the Monitor Configuration Dialog Box
Select Start > Programs > LoadRunner > Advanced Settings >
Monitor Configuration. For machines without the complete LoadRunner
installation, select Start > Programs > Server Monitor >
Monitor Configuration.
2 Add Monitored Servers
a To add servers, click the Add Server button. Type the name or IP
address of the server whose resources you want to monitor in the
Monitored Server field.
Note: To add several servers simultaneously, separate the server names
or IP ranges with commas. For example: 255.255.255.0-255.255.255.5,
server1, server2.
b From the Available Monitors list, select the monitors appropriate for
the server being monitored.
Note: Data can only be viewed for the monitors that are enabled with
your LoadRunner license key. To preview your license key information,
select Start > Programs > LoadRunner. HP LoadRunner opens. Click
the License button to display the LoadRunner license information.
For certain monitors, LoadRunner displays default measurements in
the Measurements to be Monitored section. You can specify the
frequency at which LoadRunner reports the measurement in the
Measurement Properties section. For details on selecting
measurements, see "How to Set Up the Monitoring Environment –
Workflow" on page 443.
366
Chapter 19 • Working with Firewalls in LoadRunner
3 (Optional) Clone a Monitored Server’s Properties
If you want to monitor the same properties on different server machines,
you can clone a selected server’s properties using the Clone Monitored
Server Properties dialog box.
To clone a monitored server’s properties, right-click the server you want
to clone, and select Clone. In the Monitored Server box, type the name or
IP address of the clone server you want to create.
367
Chapter 19 • Working with Firewalls in LoadRunner
Reference
Working With Firewalls in LoadRunner - User Interface
This section includes (in alphabetical order):
➤
Agent Configuration Dialog Box on page 368
➤
Agent Configuration Settings Dialog Box on page 369
➤
MI Listener Configuration Dialog Box on page 371
Agent Configuration Dialog Box
This dialog box enables you to open the Agent Configuration Settings dialog
box in order to configure the LoadRunner agent on Windows machines.
To access
➤ Run Agent Configuration from Start > Programs >
LoadRunner > Advanced Settings.
➤ Run <LoadRunner root>\launch-service\bin
\AgentConfig.exe.
368
Important
information
Stop the LoadRunner agent before working with this
dialog box.
Relevant tasks
"How to Configure the LoadRunner Agent on Each
Monitor Over Firewall Machine" on page 362
See also
"Agent Configuration Settings Dialog Box" on page 369.
Chapter 19 • Working with Firewalls in LoadRunner
User interface elements are described below:
UI Elements (A-Z)
Description
Click to open the Agent Configuration Settings dialog
box.
Enable Firewall
Agent
Select of you are enabling or running Vusers over a
firewall.
Enable Terminal
Services
Select to enable distributing Vusers on a terminal server.
Agent Configuration Settings Dialog Box
This dialog box enables you to define the relevant settings in order to enable
the LoadRunner agent on Windows machines.
To access
Run Agent Configuration from Start > Programs >
LoadRunner > Advanced Settings > Settings
Relevant tasks
"How to Configure the LoadRunner Agent on Each
Monitor Over Firewall Machine" on page 362
See also
"Agent Configuration Dialog Box" on page 368.
User interface elements are described below:
UI Elements (A-Z)
Description
Connection Timeout
(seconds)
The length of time you want the agent to wait before
retrying to connect to the MI Listener machine. If zero,
the connection is kept open from the time the agent is
run.
Default value: 20 seconds
Connection Type HTTP Proxy Domain
The user’s domain if defined in the proxy server
configuration. This option is required only if NTLM is
used.
369
Chapter 19 • Working with Firewalls in LoadRunner
UI Elements (A-Z)
Description
Connection Type HTTP Proxy Names
The name of the proxy server. This field is mandatory if
the Connection Type setting is HTTP.
Connection Type HTTP Proxy
Password
The password of the user with connection rights to the
proxy server.
Connection Type HTTP Proxy Port
The proxy server connection port. This field is
mandatory if the Connection Type setting is HTTP
Connection Type HTTP Proxy User
Name
The user name of a user with connection rights to the
proxy server.
Connection Type TCP/HTTP
Select either TCP or HTTP, depending on the
configuration you are using.
Default: TCP
Local Machine Key
A symbolic string identifier used to establish a unique
connection between the Controller host and the agent
machine, via the MI Listener machine.
MI Listener Name
The name, full name, or IP address of the MI Listener.
MI Listener Password
The password needed to connect to the MI Listener
machine.
MI Listener User
Name
The user name needed to connect to the MI Listener
machine.
Server Domain
The domain name needed to connect to the MI Listener
machine. This field is required only if NTLM is used.
Use Secure
Connection (SSL)
Enable to connect using the Secure Sockets Layer
protocol.
Default: disabled
Use Secure
Connection (SSL) Private Key Password
370
The password that might be required during the SSL
certificate authentication process. This option is relevant
only if the Client Certificate Owner option is enabled.
Chapter 19 • Working with Firewalls in LoadRunner
UI Elements (A-Z)
Description
Use Secure
Connection (SSL) user Client
Certificate
Enable to load the SSL certificate (if required by the server
to allow the connection to be made). This option is
relevant only if the Use Secure Connection option is
enabled.
Default: disabled
User Secure
Connection (SSL) Check Server
Certificates
Authenticates the SSL certificates that are sent by the
server. Select Medium to verify that the server certificate
is signed by a trusted Certification Authority. Select High
to verify that the sender IP matches the certificate
information. This setting is available only if Use Secure
Connection is set to True.
MI Listener Configuration Dialog Box
This dialog box enables you to configure the MI Listener.
To access
➤ Select Start > Programs > LoadRunner > Advanced
Settings
➤ Run <LoadRunner root
folder>\launch_service\bin\MILsnConfig.exe
371
Chapter 19 • Working with Firewalls in LoadRunner
Important
information
➤ Before configuring the MI Listener:
➤ Open incoming HTTPs service for port 443. The
port settings are set by your system administrator.
➤ Stop the LoadRunner agent on the MI Listener
machine by right-clicking it’s icon in the system
tray and selecting Close from the popup menu.
➤ After configuring the MI Listener:
➤ Restart the LoadRunner agent by double-clicking
the shortcut on the desktop, or by selecting Start >
Programs > LoadRunner.
➤ Make sure that no Web Servers are running on the MI
Listener or Monitor over Firewall machine. These
servers use port 443 and will not allow the access
required by the listening and monitoring processes.
Relevant tasks
"How to Configure the Over-Firewall System" on
page 357
User interface elements are described below:
372
UI Elements (A-Z)
Description
Check Client
Certificates
Select True to request that the client send an SSL
certificate when connecting, and to authenticate the
certificate. Default value is False.
Private Key Password
The password that may be required during the SSL
certificate authentication process. There is no default
value.
Chapter 19 • Working with Firewalls in LoadRunner
Monitor Configuration Dialog Box
This dialog box enables you to select the type of monitors to run and the
server whose resources you want to monitor, add the measurements to
monitor for each server, and specify the frequency with which you want the
monitored measurements to be reported.
To access
Start > Programs > LoadRunner > Advanced Settin
gs > Monitor Configuration. For machines without
the complete LoadRunner installation, select
Start > Programs > Server Monitor >
Monitor Configuration.
Relevant tasks
"How to Configure Monitors Over a Firewall" on
page 365
373
Chapter 19 • Working with Firewalls in LoadRunner
User interface elements are described below:
UI Elements (A-Z)
Description
Adds a server or measurement to the monitored server
list. Type the name or IP address of the server whose
resources you want to monitor in the Monitored Server
field.
Note: To add several servers simultaneously, separate the
server names or IP ranges with commas. For example:
255.255.255.0-255.255.255.5, server1, server2.
From the Available Monitors list, select the monitors
appropriate for the server being monitored.
Note: Data can only be viewed for the monitors that are
enabled with your LoadRunner license key. To preview
your license key information, select
Start > Programs > LoadRunner. HP LoadRunner opens.
Click the License button to display the LoadRunner
license information.
Removes a server or measurement.
Opens the Monored Server Properties dialog box,
allowing you to modify the settings.
Measurement
Properties
374
Allows you to set a measurement schedule for each
measurement to be reported. Select the configured server
measurement you want to schedule and specify the
frequency at which you want LoadRunner to report the
measurement. Click Apply to save your settings.
Chapter 19 • Working with Firewalls in LoadRunner
Troubleshooting
This section describes troubleshooting for working with firewalls in
LoadRunner.
Checking Connectivity
To run Vusers or monitor servers over a firewall, you must be able to
establish a connection between the LoadRunner agent, MI Listener, and the
Controller machine.
If you encounter connectivity problems after installing and configuring all
the necessary components, check the table below for troubleshooting tips.
Check
Solution
To check that the Firewall
service was activated on the
agent machine:
There should be a traffic light on the right
side of the LoadRunner Agent icon on the
machine running/ monitoring Vusers over a
firewall. If there is no traffic light, this
indicates that the ‘FirewallServiceActive=1’ is
not set in the [FireWall] section of the Agent
Settings. See "Agent Configuration Settings
Dialog Box" on page 369.
To check that port 443 is open:
On the agent machine, open a Command
Prompt window, and type the following:
telnet <MI_Listener_IP>443.
For example: telnet 111.111.111.1111 443.
If port 443 is open, a new Telnet window will
open. If port 443 is not open, contact your
network administrator.
375
Chapter 19 • Working with Firewalls in LoadRunner
Check
Solution
To check that port 443 is
available:
If a Web server is running on the MI Listener
or Monitor over Firewall machine, port 443
will not allow the access required by the
listening and monitoring processes. Contact
your network administrator to change the
Web server port.
To check connectivity between
the agent and the MI Listener,
when running the LoadRunner
agent as a service:
If there is a red light on the right side of the
LoadRunner Agent icon
when running
the LoadRunner agent as a service, do the
following:
➤ Check that port 443 is open. See the
troubleshooting tip above.
➤ Check that the Agent Settings and Agent
Configuration are correctly set. See "Agent
Configuration Settings Dialog Box" on
page 369.
➤ Run the agent as a Process. Launch
<Installation>\Launch_service\bin\
magentproc.exe. If this works, this
indicates an authentication issue with the
LoadRunner Agent Service. Browse to the
Service > LoadRunner Agent Service, and
change the properties of this service to
System User Account or provide the user
name and password of someone who has
administrative privileges on this machine.
376
Chapter 19 • Working with Firewalls in LoadRunner
Check
Solution
To check connectivity between
the agent and the Controller,
when monitoring over a
firewall
➤ Check that you entered the servers that
you want to monitor in the Monitor
Configuration dialog box. (See "Monitor
Configuration Dialog Box" on page 373).
➤ Start the LoadRunner Agent Process on the
Monitor Over Firewall machine. (See "How
to Configure the LoadRunner Agent on
Each Monitor Over Firewall Machine" on
page 362).
➤ On the Controller, enter the name of the
Monitor Over Firewall machine in the
Load Generators dialog box, and click
Connect. After about a minute, data should
start streaming in from the Monitor Over
Firewall machine through the MI Listener
to the Controller. (See "How to Configure
Monitors Over a Firewall" on page 365).
➤ If no data arrives at the Controller, try
connecting the Controller to the MI
Listener as if the Listener were used as a
load generator. This will help identify the
cause of the problem. Examine the log file
on the Monitor Over Firewall machine by
right-clicking the LoadRunner Agent icon.
There should be no error messages.
➤ Start the MI Listener, and then manually
start the LoadRunner Agent Process by
running <installation>\launch_service\
bin\magnetproc.exe on the Monitor Over
Firewall machine. Allow the Monitor Over
Firewall machine sufficient time to
connect to the MI Listener, then connect
the Controller to the Monitor Over
Firewall machine. If the LoadRunner Agent
Process crashes, either restart the agent or
reboot the Monitor Over Firewall machine.
377
Chapter 19 • Working with Firewalls in LoadRunner
378
Part V
Working with Diagnostics
380
20
LoadRunner ERP/CRM Diagnostics
Modules
This chapter includes:
Concepts
➤
ERP/CRM Diagnostics Modules Overview on page 383
➤
ERP/CRM Diagnostics Modules Architecture on page 383
➤
Connecting the Mediator to a Remote Server on page 385
➤
Siebel and Siebel DB Diagnostics Modules Overview on page 387
➤
Oracle 11i Diagnostics Module Overview on page 387
➤
SAP Diagnostics Module Overview on page 387
Tasks
➤
How to Configure Siebel Diagnostics on page 389
➤
How to Configure Siebel DB Diagnostics on page 396
➤
How to Configure Oracle 11i Diagnostics on page 401
➤
How to Configure SAP Diagnostics on page 406
➤
How to Enable and Disable Logging on the Siebel Server on page 407
➤
How to Enable Logging on the Oracle Server on page 409
➤
How to Set and Disable the Oracle Server Diagnostics Password
on page 410
➤
How to View Diagnostics Results on page 411
Reference
➤
LoadRunner Diagnostics Modules User Interface on page 413
381
Chapter 20 • LoadRunner ERP/CRM Diagnostics Modules
Troubleshooting and Limitations on page 425
382
Chapter 20 • LoadRunner ERP/CRM Diagnostics Modules
Concepts
ERP/CRM Diagnostics Modules Overview
During a performance test, LoadRunner’s diagnostics modules trace, time,
and troubleshoot individual transactions across the Web, application, and
database servers. You can drill down from a slow end-user transaction all the
way to the bottlenecked method or SQL statement. The LoadRunner
diagnostics modules enable organizations to:
➤
Trace the application components exercised by business processes
➤
Rapidly isolate application components that have a significant impact on
end-user experience
➤
Provide developers with precise data on how to make performance
improvements
ERP/CRM Diagnostics Modules Architecture
ERP/CRM Diagnostics architecture, as shown in the diagram below, is
composed of the following components:
383
Chapter 20 • LoadRunner ERP/CRM Diagnostics Modules
➤
Mediator. The ERP/CRM Mediator (“Mediator”) gathers and correlates
offline transaction data from the Web, database, and application servers.
For information on installing the Mediator, see the HP LoadRunner
Installation Guide.
For information on how the Mediator connects to remote Windows and
UNIX servers, see "Connecting the Mediator to a Remote Server" on
page 385.
➤
Controller. Before scenario execution, the Controller transfers all server
information to the Mediator and distributes the percentage of users that
will participate in the monitoring. After scenario execution, the
Controller collects the aggregated transaction data files from the
Mediators and collates the results. The files are then transferred to the
results directory per diagnostics type as follows:
➤
Siebel results are transferred to the \sbl_bd directory.
➤
Oracle 11i results are transferred to the \ora_bd directory.
➤
SAP results are transferred to the \sap_bd directory.
You can view the status of diagnostics file collation in the Collate Results
dialog box. For details, see "Collate Results Dialog Box" on page 327.
384
➤
Load Generator. When you execute a scenario, the Controller distributes
each Vuser to a load generator, and the load generator executes the Vuser
script.
➤
Analysis. Displays detailed diagnostics graphs and reports. For more
information about the diagnostics graphs, see the HP LoadRunner Analysis
User Guide.
Chapter 20 • LoadRunner ERP/CRM Diagnostics Modules
Connecting the Mediator to a Remote Server
When you set up the ERP/CRM Diagnostics modules, you define a server to
monitor by entering the user name of the server where trace/log files are
stored. This section explains how the Mediator connects to the server when
it is a remote Windows or UNIX server.
This section includes:
➤
"Connecting to a Remote Windows Server" on page 385
➤
"Connecting to a Remote UNIX Server" on page 385
Connecting to a Remote Windows Server
When monitoring a remote Windows server, the Mediator attempts to
connect to the server using the configuration details which you enter in the
<diagnostics type> Server Configuration Dialog Box during the diagnostics
configuration process. This configuration should give administrator
permissions to the remote machine.
If the Mediator is already connected to the remote machine using another
configuration, it maintains that prior connection. This may lead to an error
if the remote machine user is a non-administrator. For more information,
see "Microsoft Windows networking limitation: Failed to establish
connection. System error 1219" on page 425.
Connecting to a Remote UNIX Server
When monitoring a remote UNIX server, the Mediator supports two types of
connections:
Remote Shell (RSH/RCP) Connection
For more information on remote shell connections, see the Verifying your
UNIX Installation section in the HP LoadRunner Installation Guide.
Secured Shell (PLINK/PSCP) Connection
The secured shell connection is based on the SSH protocol, which enables a
secure connection to a remote machine by an authentication mechanism
(using RSA and DSA) and encrypted communication.
385
Chapter 20 • LoadRunner ERP/CRM Diagnostics Modules
SSH Protocol Security
The SSH protocol has the following security levels:
➤
Using a user name and password.
➤
Using a user name and key pair without passphrase protection.
➤
Using a user name, key pair and a passphrase protected private key.
SSH Protocol Implementation
The Mediator uses PuTTY as an SSH implementation.
You can find the following PuTTY tools in the bin directory of the
LoadRunner installation:
➤
PUTTY.EXE
➤
PAGEANT.EXE
➤
PLINK.EXE
➤
PSCP.EXE
➤
PSFTP.EXE
➤
PUTTYGEN.EXE
➤
PUTTY.HLP
You can use the Import command from the Conversions menu of PuTTYgen
to load the private key in OpenSSH format and ssh.com format and then
generate it as a PuTTY format key. For more information, see the PuTTY User
Manual which resides in the bin directory of the LoadRunner installation.
For more information on secured shell connections, see the Verifying your
UNIX Installation section in the HP LoadRunner Installation Guide.
For troubleshooting information about connecting to a remote UNIX server,
see "Troubleshooting and Limitations" on page 425.
386
Chapter 20 • LoadRunner ERP/CRM Diagnostics Modules
Siebel and Siebel DB Diagnostics Modules Overview
LoadRunner’s Siebel Diagnostics are split into the following modules:
➤
Siebel Diagnostics Module. Enables you to break down Siebel transactions
into layers, areas, sub-areas, servers, and scripts. You can also view the
transaction chain of calls and call stack statistics to track the percentage
of time spent on each part of the transaction. Siebel-Web Vusers support
Siebel Diagnostics. For information on how to configure the Siebel
Diagnostics module, see "How to Configure Siebel Diagnostics" on
page 389.
➤
Siebel DB Diagnostics Module. Helps you to rapidly identify and resolve
database performance problems. You can view the SQLs for each
transaction, identify the problematic SQL queries of each script, and
identify at which point problems occurred. Siebel-Web Vusers support
Siebel DB Diagnostics. For information on how to configure the Siebel DB
Diagnostics module, see "How to Configure Siebel DB Diagnostics" on
page 396.
Oracle 11i Diagnostics Module Overview
Oracle 11i Diagnostics helps pinpoint performance problems on Oracle NCA
systems. The diagnostics information drills down from the transaction to
the SQL statements, and to the SQL stages of each statement. Oracle NCA
Vusers support Oracle 11i Diagnostics. For information on how to configure
the Oracle 11i Diagnostics module, see "How to Configure Oracle 11i
Diagnostics" on page 401.
SAP Diagnostics Module Overview
SAP Diagnostics enables you to pinpoint the root cause of a certain problem
(i.e. DBA, Network, WAS, Application, OS/HW) quickly and easily, and
engage with the relevant expert only, without having to present the
problem to a whole team of people.
387
Chapter 20 • LoadRunner ERP/CRM Diagnostics Modules
The following table outlines the supported versions and required Kernel
patches for the SAP Application Server and the SAPGUI Client:
SAP Application
Server
SAPGUI Client
Supported Version
Required Kernel Patch
4.6C; 4.6D
Kernel Patch 1984 (released
on 11/01/05, SAP note
0451251)
4.7 and higher
No patch required
SAPGUI for Windows 6.20
Minimal patch level: 48
SAPGUI for Windows 6.40
Minimal patch level: 2
For information on how to configure the SAP Diagnostics module, see "How
to Configure SAP Diagnostics" on page 406.
388
Chapter 20 • LoadRunner ERP/CRM Diagnostics Modules
Tasks
How to Configure Siebel Diagnostics
This task describes how to configure the Siebel Diagnostics module to
communicate with the Mediator and how to define the servers that you
want to monitor in order to generate diagnostics data.
This task includes the following steps:
➤
"Prerequisites" on page 389
➤
"Configure the server machine to enable diagnostics" on page 392
➤
"Copy files from the Siebel Application Server to the Mediator" on
page 394
➤
"Enable the Siebel Diagnostics Module" on page 395
1 Prerequisites
➤
Make sure that the ERP/CRM Mediator is installed.
The Mediator, which collects and processes the diagnostics data, is
installed on the Controller machine as part of the LoadRunner Full
Setup. For information on installing the ERP/CRM Mediator on a
dedicated machine, see the HP LoadRunner Installation Guide.
➤
Make sure that the load test scenario is not already running.
You must configure the diagnostics module before running the load
test scenario.
➤
Manually define transactions in the Vuser script.
To ensure that valid diagnostics data is generated, manually define the
transactions in the Vuser script rather than using automatic
transactions. Make sure to disable the following options in the
Run-Time Settings’ General : Miscellaneous node: Define each action
as a transaction and Define each step as a transaction.
➤
If you are monitoring a Siebel Web Server in a DMZ.
389
Chapter 20 • LoadRunner ERP/CRM Diagnostics Modules
Install the Mediator on the internal (over firewall) LAN and enable
SMB/CIFS communication from the internal machine to the file server
in the DMZ.
SMB/CIFS are the file sharing services that use the NBT (NetBIOS over
TCP/IP) as the transport protocol.
To enable the NBT protocol between the client (over firewall machine)
and the file server, use the following port configuration:
File Sharing Service
Port
SMB/CIFS over NBT
TCP 139 (SMB)
CIFS over TCP/IP (Direct SMB)
TCP 445
Example
Configure the firewall settings as follows:
Service enabled: "nbsession" for TCP 139 connection.
Service enabled: "Microsoft-ds" for TCP 445 connection.
Note: CIFS over TCP 445 (direct SMB over TCP/IP) is optional with
Windows 2000 and above (since it is a more secure way of
communicating with the file server). To enable CIFS over TCP/IP, you
must disable the NetBIOS over TCP/IP protocol using the operating
system configuration.
➤
If connecting to a remote UNIX server with a remote shell (RSH/RCP)
connection.
➤
Verify that the RSH and RCP daemons are running on the UNIX
server.
➤
Verify that the UNIX user has permission to run remote shell
commands. To check this, type the following at the DOS command
prompt:
rsh <server machine name> -l <UNIX user login name> -n <command>
390
Chapter 20 • LoadRunner ERP/CRM Diagnostics Modules
Example
rsh my_unix -l my_name -n “cd ~;pwd”
Note: Only RSH commands that work from the DOS command prompt
window work with LoadRunner.
➤
Verify that no output is generated after executing the RSH
command.
Note: You should not generate output from the .login, .profile, and
.cshrc files (for example, by echo, or in any other way, including
commands that generate output indirectly, such as biff). Where an
existing user generates output in the RSH step that cannot be
deleted, you should create a new user that does not generate output,
and who has permissions to run RSH and RCP commands on the
server machine.
➤
If connecting to a remote UNIX server with a secured shell (PLINK/
PSCP) connection.
Note: Before proceeding with the following prerequisite steps, if you
are not familiar with the PuTTY application, see "Secured Shell (PLINK/
PSCP) Connection" on page 385.
➤
Verify that the SSH daemon is running on the UNIX server.
➤
Verify that no output is generated after executing the PuTTY
commands.
391
Chapter 20 • LoadRunner ERP/CRM Diagnostics Modules
Note: You should not generate output from the .login, .profile, and
.cshrc files, (for example, by echo, or by any other form, including
commands that generate output indirectly, such as biff). Where an
existing user generates output that cannot be deleted, you should
create a new user that does not generate output.
➤
Verify that PuTTY commands are working without generating any
errors. Type the following at the DOS command prompt under the
bin directory of the installation:
PLINK.EXE <server machine name> -ssh -l <UNIX user login name> -i
<private key full name if used> -pw <password or passphrase> <command>
Example
Security Level A:
PLINK.EXE my_unix -ssh -l my_name -pw "my_password" "ls"
Security Level B:
PLINK.EXE my_unix -ssh -l my_name -i "my_private_key" -pw "" "ls"
Security Level C:
PLINK.EXE my_unix -ssh -l my_name -i "my_private_key" -pw "my_passphrase" "ls"
➤
Check the PSCP.EXE command as follows:
PSCP.EXE -scp -r -q <private key full name if used> -pw <password or
passphrase> <local file name> <UNIX user login name>@<server machine
name>:<remote file name>
2 Configure the server machine to enable diagnostics
To configure Siebel application and Web servers for diagnostics data
collection:
392
Chapter 20 • LoadRunner ERP/CRM Diagnostics Modules
a Enable Siebel Diagnostics on all Siebel application and Web servers
involved in the load test scenario.
Set the environment variable on the Siebel server to:
SIEBEL_SarmEnabled=true
Then restart the server.
b Optimize the server performance settings.
You change the maximum memory caching and file size using the
following variables:
SIEBEL_SarmMaxMemory= <bytes>
SIEBEL_SarmMaxFileSize = <bytes>
The SIEBEL_SarmMaxMemory value controls the size of the buffer that
Siebel keeps in the memory before writing the information to the
Siebel log files. You can improve server performance by increasing the
parameter value. However, information from the end of the run will be
missing from the Analysis graphs.
We recommend the following settings:
➤
SIEBEL_SarmMaxMemory
Value
Number of Vusers
5000
Less than 20 (low loads)
1000000
More than 100 (high loads)
➤
SIEBEL_SarmMaxFileSize
Value
Number of Vusers
5000000
Less than 20 (low loads)
25000000
More than 100 (high loads)
If more than one Siebel log file is generated on the server every 10
seconds, you should increase the SIEBEL_SarmMaxFileSize.
393
Chapter 20 • LoadRunner ERP/CRM Diagnostics Modules
Note: For Siebel 7.7, the parameters differ slightly.
c Generate a list of Siebel Server IDs.
On the Siebel server, open a command window and run the following
command:
<Siebel bin directory>\srvrmgr /u <username> /p <password> /g <gateway
server> /e <entrpr server> /c "list servers show SBLSRVR_NAME, SV_SRVRID"
where:
/u <username> is the server administrator username
/p <password> is the server administrator password
/g <gateway server> is the gateway server address
/e <entrpr server> is the enterprise server name
/c <command> is the execute a single command
This command generates a list of all the Siebel application servers and
their IDs. Keep a record of the server IDs, since this information is
required in the Siebel Server Configuration dialog box. For more
information, see "Siebel Server Configuration Dialog Box" on page 424.
3 Copy files from the Siebel Application Server to the Mediator
After configuring the application server, copy the files listed below from
the Siebel Application server \bin directory to either the
<LR Mediator installation>\bin directory, <Windows>\System32 directory, or
any other directory in PATH on the Mediator machine:
For Siebel 7.53, copy the following files:
➤ sarmanalyzer.exe
➤ sslcshar.dll
➤ sslcver.dll
➤ sslcosa.dll
➤ sslcsym.dll
394
Chapter 20 • LoadRunner ERP/CRM Diagnostics Modules
For Siebel 7.7, copy the following files:
➤ sarmanalyzer.exe
➤ sslcosa.dll
➤ libarm.dll
➤ sslcosd.dll
➤ msvcp70.dll
➤ sslcrsa.dll
➤ msvcr70.dll
➤ sslcscr.dll
➤ sslcacln.dll
➤ sslcshar.dll
➤ sslccore.dll
➤ sslcsrd.dll
➤ sslcevt.dll
➤ sslcsym.dll
➤ sslcos.dll
➤ sslcver.dll
4 Enable the Siebel Diagnostics Module
To enable the Siebel Diagnostics module:
a Select Diagnostics > Configuration to open the Diagnostics
Distribution dialog box. Then select Enable the following diagnostics
and specify the percentage of Vusers for which you want to collect
Siebel Diagnostics data. For user interface details, see "Diagnostics
Distribution Dialog Box" on page 413.
b In the Diagnostics Distribution dialog box, click Configure next to
Siebel Diagnostics to enable the module and to define server
information. For user interface details, see "Siebel Configuration Dialog
Box" on page 420.
395
Chapter 20 • LoadRunner ERP/CRM Diagnostics Modules
How to Configure Siebel DB Diagnostics
This task describes how to configure the Siebel DB Diagnostics module to
communicate with the Mediator and how to define the servers that you
want to monitor in order to generate diagnostics data.
This task includes the following steps:
➤
"Prerequisites and recommendations" on page 396
➤
"Enable logging on the Siebel Server" on page 400
➤
"Enable the Siebel DB Diagnostics module" on page 401
1 Prerequisites and recommendations
➤
Make sure that the ERP/CRM Mediator is installed.
The Mediator, which collects and processes the diagnostics data, is
installed on the Controller machine as part of the LoadRunner Full
Setup. For information on installing the ERP/CRM Mediator on a
dedicated machine, see the HP LoadRunner Installation Guide.
Note: We recommend that you not install the Mediator on a dedicated
machine as this will increase the time taken to copy diagnostics files to
the results directory.
➤
Make sure that the load test scenario is not already running.
You must configure the diagnostics module before running the load
test scenario.
➤
If you are monitoring a Siebel Web Server in a DMZ.
Install the Mediator on the internal (over firewall) LAN and enable
SMB/CIFS communication from the internal machine to the file server
in the DMZ.
SMB/CIFS are the file sharing services that use the NBT (NetBIOS over
TCP/IP) as the transport protocol.
396
Chapter 20 • LoadRunner ERP/CRM Diagnostics Modules
To enable the NBT protocol between the client (over firewall machine)
and the file server, use the following port configuration:
File Sharing Service
Port
SMB/CIFS over NBT
TCP 139 (SMB)
CIFS over TCP/IP (Direct SMB)
TCP 445
Example
Configure the firewall settings as follows:
Service enabled: "nbsession" for TCP 139 connection.
Service enabled: "Microsoft-ds" for TCP 445 connection.
Note: CIFS over TCP 445 (direct SMB over TCP/IP) is optional with
Windows 2000 and above (since it is a more secure way of
communicating with the file server). To enable CIFS over TCP/IP, you
must disable the NetBIOS over TCP/IP protocol using the operating
system configuration.
➤
Manually define transactions in the Vuser script.
To ensure that valid diagnostics data is generated, manually define the
transactions in the Vuser script rather than using automatic
transactions. Make sure to disable the following options in the
Run-Time Settings’ General : Miscellaneous node: Define each action
as a transaction and Define each step as a transaction.
➤
Avoid session ID conflicts.
Make sure that the Vusers log off from the Siebel system at the end of
each session.
➤
Add think time after transactions.
When preparing your script for collection of diagnostics data, we
recommend that you add think time at the end of each transaction
using the ratio of one second per hour of testing.
397
Chapter 20 • LoadRunner ERP/CRM Diagnostics Modules
➤
Synchronize clocks (Windows Siebel Servers).
Ensure that all the machines’ clocks in the Siebel system are
synchronized. This ensures that the correlation of SQLs to transactions
is correct.
Synchronize the Siebel Gateway and load generators’ clocks by
running the following command from the load generator:
net time \ <Gateway name> /set /y
Replace <Gateway name> with the name of the Siebel Gateway.
➤
Synchronize clocks (Unix Siebel servers).
Ensure that all the machines’ clocks in the Siebel system are
synchronized. This ensures that the correlation of SQLs to transactions
is correct.
You can synchronize the clocks on a UNIX system in one of the
following ways:
➤
➤
Use the date command on the UNIX Siebel Gateway server to
change the time manually, so it will be synchronized with the Load
Generator’s clock.
➤
Change the time on the load generator so that it will be
synchronized with the UNIX Siebel Gateway server.
➤
Configure the time difference in Analysis. For more information, see
the chapter about Siebel DB Diagnostics Graphs in the HP
LoadRunner Analysis User Guide.
If connecting to a remote UNIX server with a remote shell (RSH/RCP)
connection.
➤
Verify that the RSH and RCP daemons are running on the UNIX
server.
➤
Verify that the UNIX user has permission to run remote shell
commands. To check this, type the following at the DOS command
prompt:
rsh <server machine name> -l <UNIX user login name> -n <command>
398
Chapter 20 • LoadRunner ERP/CRM Diagnostics Modules
Example
rsh my_unix -l my_name -n “cd ~;pwd”
Note: Only RSH commands that work from the DOS command prompt
window work with LoadRunner.
➤
Verify that no output is generated after executing the RSH
command.
Note: You should not generate output from the .login, .profile, and
.cshrc files (for example, by echo, or in any other way, including
commands that generate output indirectly, such as biff). Where an
existing user generates output in the RSH step that cannot be
deleted, you should create a new user that does not generate output,
and who has permissions to run RSH and RCP commands on the
server machine.
➤
If connecting to a remote UNIX server with a secured shell (PLINK/
PSCP) connection.
Note: Before proceeding with the following prerequisite steps, if you
are not familiar with the PuTTY application, see "Secured Shell (PLINK/
PSCP) Connection" on page 385.
➤
Verify that the SSH daemon is running on the UNIX server.
➤
Verify that no output is generated after executing the PuTTY
commands.
399
Chapter 20 • LoadRunner ERP/CRM Diagnostics Modules
Note: You should not generate output from the .login, .profile, and
.cshrc files, (for example, by echo, or by any other form, including
commands that generate output indirectly, such as biff). Where an
existing user generates output that cannot be deleted, you should
create a new user that does not generate output.
➤
Verify that PuTTY commands are working without generating any
errors. Type the following at the DOS command prompt under the
bin directory of the installation:
PLINK.EXE <server machine name> -ssh -l <UNIX user login name> -i
<private key full name if used> -pw <password or passphrase> <command>
Example
Security Level A:
PLINK.EXE my_unix -ssh -l my_name -pw "my_password" "ls"
Security Level B:
PLINK.EXE my_unix -ssh -l my_name -i "my_private_key" -pw "" "ls"
Security Level C:
PLINK.EXE my_unix -ssh -l my_name -i "my_private_key" -pw "my_passphrase" "ls"
➤
Check the PSCP.EXE command as follows:
PSCP.EXE -scp -r -q <private key full name if used> -pw <password or
passphrase> <local file name> <UNIX user login name>@<server machine
name>:<remote file name>
2 Enable logging on the Siebel Server
For task details, see page 407.
400
Chapter 20 • LoadRunner ERP/CRM Diagnostics Modules
3 Enable the Siebel DB Diagnostics module
To enable the Siebel DB Diagnostics module:
a Select Diagnostics > Configuration to open the Diagnostics
Distribution dialog box. Then select Enable the following diagnostics
and specify the percentage of Vusers for which you want to collect
Siebel DB Diagnostics data. For user interface details, see "Diagnostics
Distribution Dialog Box" on page 413.
b In the Diagnostics Distribution dialog box, click Configure next to
Siebel DB Diagnostics to enable the module and to define server
information. For user interface details, see "Siebel DB Configuration
Dialog Box" on page 422.
How to Configure Oracle 11i Diagnostics
This task describes how to configure the Oracle 11i Diagnostics module to
communicate with the Mediator and how to define the servers that you
want to monitor in order to generate diagnostics data.
This task includes the following steps:
➤
"Prerequisites" on page 401
➤
"Enable logging on the Oracle server" on page 404
➤
"Set or Disable the Oracle Server Diagnostics Password - Optional" on
page 404
➤
"Select the Oracle NCA application version" on page 405
➤
"Enable the Oracle 11i Diagnostics module" on page 405
1 Prerequisites
➤
Make sure that the ERP/CRM Mediator is installed.
The Mediator, which collects and processes the diagnostics data, is
installed on the Controller machine as part of the LoadRunner Full
Setup. For information on installing the ERP/CRM Mediator on a
dedicated machine, see the HP LoadRunner Installation Guide.
➤
Make sure that the load test scenario is not already running.
401
Chapter 20 • LoadRunner ERP/CRM Diagnostics Modules
You must configure the diagnostics module before running the load
test scenario.
➤
Manually define transactions in the Vuser script.
To ensure that valid diagnostics data is generated, manually define the
transactions in the Vuser script rather than using automatic
transactions. Make sure to disable the following options in the
Run-Time Settings’ General : Miscellaneous node: Define each action
as a transaction and Define each step as a transaction.
➤
Clear the server of users while module is running.
Make sure that no real or other virtual users are working on the Oracle
server while the diagnostics module is running, as this may affect
diagnostics results.
➤
If connecting to a remote UNIX server with a remote shell (RSH/RCP)
connection.
➤
Verify that the RSH and RCP daemons are running on the UNIX
server.
➤
Verify that the UNIX user has permission to run remote shell
commands. To check this, type the following at the DOS command
prompt:
rsh <server machine name> -l <UNIX user login name> -n <command>
Example
rsh my_unix -l my_name -n “cd ~;pwd”
Note: Only RSH commands that work from the DOS command prompt
window work with LoadRunner.
➤
402
Verify that no output is generated after executing the RSH
command.
Chapter 20 • LoadRunner ERP/CRM Diagnostics Modules
Note: You should not generate output from the .login, .profile, and
.cshrc files (for example, by echo, or in any other way, including
commands that generate output indirectly, such as biff). Where an
existing user generates output in the RSH step that cannot be
deleted, you should create a new user that does not generate output,
and who has permissions to run RSH and RCP commands on the
server machine.
➤
If connecting to a remote UNIX server with a secured shell (PLINK/
PSCP) connection.
Note: Before proceeding with the following prerequisite steps, if you
are not familiar with the PuTTY application, see "Secured Shell (PLINK/
PSCP) Connection" on page 385.
➤
Verify that the SSH daemon is running on the UNIX server.
➤
Verify that no output is generated after executing the PuTTY
commands.
Note: You should not generate output from the .login, .profile, and
.cshrc files, (for example, by echo, or by any other form, including
commands that generate output indirectly, such as biff). Where an
existing user generates output that cannot be deleted, you should
create a new user that does not generate output.
➤
Verify that PuTTY commands are working without generating any
errors. Type the following at the DOS command prompt under the
bin directory of the installation:
PLINK.EXE <server machine name> -ssh -l <UNIX user login name> -i
<private key full name if used> -pw <password or passphrase> <command>
403
Chapter 20 • LoadRunner ERP/CRM Diagnostics Modules
Example
Security Level A:
PLINK.EXE my_unix -ssh -l my_name -pw "my_password" "ls"
Security Level B:
PLINK.EXE my_unix -ssh -l my_name -i "my_private_key" -pw "" "ls"
Security Level C:
PLINK.EXE my_unix -ssh -l my_name -i "my_private_key" -pw "my_passphrase" "ls"
➤
Check the PSCP.EXE command as follows:
PSCP.EXE -scp -r -q <private key full name if used> -pw <password or
passphrase> <local file name> <UNIX user login name>@<server machine
name>:<remote file name>
2 Enable logging on the Oracle server
For task details, see "How to Enable Logging on the Oracle Server" on
page 409.
3 Set or Disable the Oracle Server Diagnostics Password -
Optional
To help LoadRunner deal with the Oracle server diagnostics password,
you can either set the password in the Vuser script, or you can disable the
password request on the server itself. For task details, see "How to Set and
Disable the Oracle Server Diagnostics Password" on page 410.
404
Chapter 20 • LoadRunner ERP/CRM Diagnostics Modules
4 Select the Oracle NCA application version
The Oracle 11i Diagnostics module supports Oracle NCA versions 11.5.0
and later. Enter the version of your Oracle application server in VuGen’s
run-time settings to enable the built-in trace mechanism.
Note: To check the version of your Oracle server, log on to the Oracle
server and select Help > About Oracle. The version of your Oracle server is
displayed in the Oracle Application field.
To enter your Oracle application version, open the script in VuGen and
select Vuser > Run-Time Settings. In the Oracle NCA: Client Emulation
node, select the version of Oracle NCA that you are using in the
Diagnostics > Application Version field.
Note: If the Oracle 11i trace cannot be enabled using the built-in
mechanism, you can enable it manually in the Vuser script using the
nca_set_custom_dbtrace and nca_set_dbtrace_file_index functions. This
may occur if you are using a custom application that does not have a
standard user interface.
5 Enable the Oracle 11i Diagnostics module
To enable the Oracle 11i Diagnostics module:
a Select Diagnostics > Configuration to open the Diagnostics
Distribution dialog box. Then select Enable the following diagnostics
and specify the percentage of Vusers for which you want to collect
Oracle 11i Diagnostics data. For user interface details, see "Diagnostics
Distribution Dialog Box" on page 413.
405
Chapter 20 • LoadRunner ERP/CRM Diagnostics Modules
b In the Diagnostics Distribution dialog box, click Configure next to
Oracle 11i Diagnostics to enable the module and to define server
information. For user interface details, see "Oracle 11i Configuration
Dialog Box" on page 417.
How to Configure SAP Diagnostics
This task describes how to configure the SAP Diagnostics module to
communicate with the Mediator and how to define the servers that you
want to monitor in order to generate diagnostics data.
This task includes the following steps:
➤
"Prerequisites" on page 406
➤
"Enable the SAP Diagnostics module" on page 407
1 Prerequisites
➤
Make sure that the ERP/CRM Mediator is installed.
The Mediator, which collects and processes the diagnostics data, is
installed on the Controller machine as part of the LoadRunner Full
Setup. SAPGUI Client must be installed on the Mediator machine. For
information on installing the ERP/CRM Mediator on a dedicated
machine, see the HP LoadRunner Installation Guide.
➤
Make sure that the load test scenario is not already running.
You must configure the diagnostics module before running the load
test scenario.
➤
Manually define transactions in the Vuser script.
To ensure that valid diagnostics data is generated, manually define the
transactions in the Vuser script rather than using automatic
transactions. Make sure to disable the following options in the
Run-Time Settings’ General : Miscellaneous node: Define each action
as a transaction and Define each step as a transaction.
406
Chapter 20 • LoadRunner ERP/CRM Diagnostics Modules
2 Enable the SAP Diagnostics module
To enable the SAP Diagnostics module:
a Select Diagnostics > Configuration to open the Diagnostics
Distribution dialog box. Then select Enable the following diagnostics
and specify the percentage of Vusers for which you want to collect SAP
Diagnostics data. For user interface details, see "Diagnostics
Distribution Dialog Box" on page 413.
b In the Diagnostics Distribution dialog box, click Configure next to SAP
Diagnostics to enable the module and to define server information. For
user interface details, For user interface details, see "SAP Configuration
Dialog Box" on page 419.
How to Enable and Disable Logging on the Siebel Server
This task describes how to enable and disable logging on the Siebel server.
Note: Enabling logging on the Siebel server can negatively impact server
performance. We recommend that you disable logging and restore the
default logging settings at the conclusion of the load test scenario.
This task includes the following steps:
➤
"To enable logging on the Siebel server" on page 407
➤
"To disable logging on the Siebel server" on page 408
To enable logging on the Siebel server
Perform the following steps:
a Open a command window and run the following command.
<Siebel bin directory>\srvrmgr /g <gateway server> /s <Siebel server> /e
<enterprise server name> /u <username> /p <password>
407
Chapter 20 • LoadRunner ERP/CRM Diagnostics Modules
where:
/u <username> is the server administrator username
/p <password> is the server administrator password
/g <gateway server> is the gateway server address
/e <entrpr server> is the enterprise server name
/s <siebel server > is the siebel server (the default server)
b Enter the following commands.
change evtloglvl ObjMgrsqllog=4 for comp <component name>
evtloglvl EventContext=3 for comp <component name>
evtloglvl ObjMgrSessionInfo =3 for comp <component name>
Example
For the Call Center component, enter sccobjmgr_enu as the component
name, as follows:
change evtloglvl ObjMgrsqllog=4 for comp sccobjmgr_enu
To disable logging on the Siebel server
Perform the following steps:
a Open a command window and run the following command.
<Siebel bin directory>\srvrmgr /g <gateway server> /s <Siebel server> /e
<enterprise server name> /u <username> /p <password>
where:
/u <username> is the server administrator username
/p <password> is the server administrator password
/g <gateway server> is the gateway server address
/e <entrpr server> is the enterprise server name
408
Chapter 20 • LoadRunner ERP/CRM Diagnostics Modules
/s <siebel server > is the siebel server (the default server)
b Enter the following commands:
change evtloglvl ObjMgrsqllog=0 for comp <component name>
change evtloglvl EventContext=0 for comp <component name>
change evtloglvl ObjMgrSessionInfo =0 for comp <component name>
How to Enable Logging on the Oracle Server
This task describes how to enable logging on the Oracle server.
This task includes the following steps:
➤
"Verify that the trace diagnostics are enabled" on page 409
➤
"Set the trace file size to unlimited" on page 410
1 Verify that the trace diagnostics are enabled
Perform the following steps:
a Log on to the Oracle application server with administrator privileges,
and select the desired module in the Oracle application. The
Responsibilities dialog box opens.
b Select System Administrator and click OK.
c In the Functions tab, select Profile > System and click Open. The
System Profile Values dialog box opens.
d In the Display section, select Site and Profiles with No Values, enter
%Diagnostics% in the Profiles field, and then click Find.
e If any diagnostics profiles are disabled (denoted by a “Yes” in the Site
column), change the setting to “No”.
f Save your settings.
409
Chapter 20 • LoadRunner ERP/CRM Diagnostics Modules
2 Set the trace file size to unlimited
For Oracle 9i:
On the Oracle server, run the following command in the SQL editor:
Alter system set max_dump_file_size=UNLIMITED scope=both;
For Oracle 8i:
a On the Oracle server, run the following command in the SQL editor:
Alter system set max_dump_file_size=2048000;
b Edit the init*.ora file on
$ORACLE_HOME\admin\<sid>\pfile\init<sid>.ora. Find the line of
the parameter, change its value, and then save the file.
Note: Verify that you have enough disk space on the database server
since these trace files can be very large.
How to Set and Disable the Oracle Server Diagnostics
Password
To help LoadRunner deal with the Oracle server diagnostics password, you
can either set the password in the Vuser script, or you can disable the
password request on the server itself.
➤
"Set the diagnostics password in the Vuser script" on page 410
➤
"Disable the diagnostics password request on the Oracle server" on
page 411
Set the diagnostics password in the Vuser script
In VuGen, add the nca_set_diagnostics_password(<password>) function to
your script and select a password.
410
Chapter 20 • LoadRunner ERP/CRM Diagnostics Modules
Note: The nca_set_diagnostics_password function must come after the
nca_connect_server function.
Disable the diagnostics password request on the Oracle server
Perform the following steps:
a Log on to the Oracle server with administrator privileges, and select
the desired module in the Oracle application. The Responsibilities
dialog box opens.
b Select System Administrator and click OK.
c In the Functions tab, select Profile > System and click Open. The
System Profile Values dialog box opens.
d In the Display section, select User, and enter the required user name.
In the Profile field, enter %Utilities:Diagnostics% and click Find. The
Utilities:Diagnostics profile values are displayed.
e In the User column of the Utilities:Diagnostics profile, set the value to
Yes.
f Save your settings.
How to View Diagnostics Results
This task includes the following steps:
➤
"Open Analysis" on page 412
➤
"View results in the Analysis diagnostics graphs" on page 412
411
Chapter 20 • LoadRunner ERP/CRM Diagnostics Modules
1 Open Analysis
In the Run tab of the Controller, select Results > Analyze Results, or click
the Analyze Results button.
2 View results in the Analysis diagnostics graphs
You can use the Analysis diagnostics graphs and reports to view the
performance data and drill down to pinpoint problem areas in any layer
of the application.
For information about specific diagnostics graphs, see the following
sections in the HP LoadRunner Analysis User Guide:
412
➤
Siebel Diagnostics Graphs
➤
Siebel DB Diagnostics Graphs
➤
Oracle 11i Diagnostics Graphs
➤
SAP Diagnostics Graphs
Chapter 20 • LoadRunner ERP/CRM Diagnostics Modules
Reference
LoadRunner Diagnostics Modules User Interface
This section includes (in alphabetical order):
➤
Diagnostics Distribution Dialog Box on page 413
➤
Oracle 11i Configuration Dialog Box on page 417
➤
Oracle 11i Server Configuration Dialog Box on page 418
➤
SAP Configuration Dialog Box on page 419
➤
Siebel Configuration Dialog Box on page 420
➤
Siebel DB Configuration Dialog Box on page 422
➤
Siebel DB Server Configuration Dialog Box on page 423
➤
Siebel Server Configuration Dialog Box on page 424
Diagnostics Distribution Dialog Box
This dialog box enables you to enable the ERP/CRM diagnostics modules.
To access
Select Diagnostics > Configuration
413
Chapter 20 • LoadRunner ERP/CRM Diagnostics Modules
Important
information
➤ The Diagnostics Distribution dialog box is disabled
during scenario execution. You must enable and
configure the diagnostics modules before running the
scenario.
➤ The settings that you configure are per scenario. All
scripts in the scenario will run under the same
diagnostics configuration.
Relevant tasks
➤ "How to Configure Siebel Diagnostics" on page 389
➤ "How to Configure Siebel DB Diagnostics" on page 396
➤ "How to Configure Oracle 11i Diagnostics" on
page 401
➤ "How to Configure SAP Diagnostics" on page 406
➤ "How to Configure a LoadRunner Scenario to use J2EE/
.NET Diagnostics" on page 432
User interface elements are described below:
UI Elements (A-Z)
Description
Enables/Disables Web Page Diagnostics graphs.
Click to enable and configure the relevant diagnostics
graphs.
Indicates that the diagnostics type is disabled.
Indicates that the diagnostics type is enabled.
Enable the following
diagnostics
414
Enables LoadRunner to generate offline Web Page, Siebel,
Siebel DB, Oracle 11i, and SAP Diagnostics graphs, and
online and offline J2EE & .NET Diagnostics graphs.
Chapter 20 • LoadRunner ERP/CRM Diagnostics Modules
UI Elements (A-Z)
Description
For X% of all the
relevant Vusers in the
current scenario
Specify the percentage of Vusers for which you want to
collect diagnostics data. This value determines how many
of the transactions on the application server are reported
to the Controller. Reducing this percentage will reduce
the overhead on the application server for Web Page,
Oracle 11i, and J2EE & .NET Diagnostics.
Example: If you enter a sampling value of 25% and run
12 Vusers in group1, 8 Vusers in group2, and 1 Vuser in
group3, diagnostics data will be collected for 3 Vusers in
group1, 2 Vusers in group2, and 1 Vuser in group3.
Note: The minimum percentage of Vuser sampling
allowed is 1%, or 1 Vuser per group, whichever is more.
The maximum percentage allowed is the lowest of the
Max. Vuser Sampling values of all the selected
diagnostics types.
Example: If you enable Web Page (max 10%), Oracle 11i
(max 5%) and J2EE/.NET (max 100%) diagnostics, the
percentage of Vuser participation for J2EE/.NET
Diagnostics cannot exceed 5%.
J2EE/.NET
Generates online and offline J2EE/.NET Diagnostics
graphs.
The maximum percentage of Vusers for which J2EE/.NET
Diagnostics data can be collected is 100% of the amount
of Vusers selected in the For X% of all the relevant Vusers
in the current scenario setting.
To enable and configure J2EE/.NET Diagnostics, click
Configure.
Oracle 11i
Generates offline Oracle 11i Diagnostics graphs.
The maximum percentage of Vusers for which Oracle 11i
Diagnostics data can be collected is 5% of the amount of
Vusers selected in the For X% of all the relevant Vusers in
the current scenario setting.
To enable and configure oracle 11i Diagnostics, click
Configure. For user interface details, see "Oracle 11i
Configuration Dialog Box" on page 417.
415
Chapter 20 • LoadRunner ERP/CRM Diagnostics Modules
UI Elements (A-Z)
Description
SAP Diagnostics
Generates offline SAP Diagnostics graphs.
The maximum percentage of Vusers for which SAP
Diagnostics data can be collected is 100% of the amount
of Vusers selected in the For X% of all the relevant Vusers
in the current scenario setting.
To enable and configure SAP Diagnostics, click
Configure. For user interface details, see "SAP
Configuration Dialog Box" on page 419.
Siebel Diagnostics
Generates offline Siebel Diagnostics graphs.
The maximum percentage of Vusers for which Siebel
Diagnostics data can be collected is 10% of the amount
of Vusers selected in the For X% of all the relevant Vusers
in the current scenario setting, or no more that 100
Vusers.
To enable and configure Siebel Diagnostics, click
Configure. For user interface details, see "Siebel
Configuration Dialog Box" on page 420.
Siebel DB
Diagnostics
Generates offline Siebel DB Diagnostics graphs.
The maximum percentage of Vusers for which Siebel DB
Diagnostics data can be collected is 10% of the amount
of Vusers selected in the For X% of all the relevant Vusers
in the current scenario setting.
To enable and configure Siebel DB Diagnostics, click
Configure. For user interface details, see "Siebel DB
Configuration Dialog Box" on page 422.
Web Page
Diagnostics
Generates offline Web Page Diagnostics graphs.
The maximum percentage of Vusers for which
diagnostics data can be collected is 10%.
Default: Enabled
See also: Web Resource Graphs in the HP LoadRunner
Analysis User Guide.
416
Chapter 20 • LoadRunner ERP/CRM Diagnostics Modules
Oracle 11i Configuration Dialog Box
This dialog box enables you to set up the Oracle 11i Diagnostics module to
communicate with the Mediator.
To access
Select Diagnostics > Configuration. Click Configure next
to Oracle 11i Diagnostics.
Relevant tasks
"How to Configure Oracle 11i Diagnostics" on page 401
See also
➤ "Oracle 11i Server Configuration Dialog Box" on
page 418
➤ "Oracle 11i Diagnostics Graphs" in the HP LoadRunner
Analysis User Guide
User interface elements are described below:
UI Elements (A-Z)
Description
Opens the Oracle 11i Server Configuration dialog box
where you can add Oracle 11i servers and to enter server
information. For user interface details, see "Oracle
11i Server Configuration Dialog Box" on page 418.
Tests the connections between the Oracle 11i Diagnostics
module and the Mediator.
Note: This does not check the connections to the Oracle
servers.
Enable Firewall
Select if the Mediator is over a firewall.
Enable Oracle 11i
Diagnostics
Enables Oracle 11i Diagnostics and allows you to
configure the Oracle 11i Diagnostics settings.
MI Listener
The name, full name, or IP address of the MI Listener
machine if you are monitoring over a firewall.
417
Chapter 20 • LoadRunner ERP/CRM Diagnostics Modules
UI Elements (A-Z)
Description
Name
The name of the Mediator used to collect and process the
Oracle 11i diagnostics data. Only one Mediator is
supported for each diagnostics module.
Note: If you are using a Mediator that is over a firewall,
enter the local machine key of the Mediator instead of
the Mediator machine name.
Servers Table
➤ Server Name. The name of the Oracle server.
➤ Platform. The platform of the Oracle server.
➤ Log Directory. The directory where the Oracle trace
files (*.trc) are written.
Oracle 11i Server Configuration Dialog Box
This dialog box enables you to add Oracle 11i servers and to add server
information.
To access
Select Diagnostics > Configuration. Click Configure next
to Oracle 11i Diagnostics then click Add.
Relevant tasks
"How to Configure Oracle 11i Diagnostics" on page 401
See also
"Oracle 11i Configuration Dialog Box" on page 417
User interface elements are described below:
418
UI Elements (A-Z)
Description
Domain
The Oracle server domain.
Password/Passphrase
The user password or passphrase.
Private Key File
The name of the file where the Private Key is stored. This
can be found on the Mediator. If you specify the file
name only (without a path), the configuration
automatically looks for the file in the Mediator’s
<LoadRunner>\bin directory.
Chapter 20 • LoadRunner ERP/CRM Diagnostics Modules
UI Elements (A-Z)
Description
Server Log Directory
A location where the Oracle application saves the trace
files. The trace files can be saved in a shared directory on
the Oracle server or in a separate folder.
Server Name
The name of the Oracle server.
Server Platform
The Oracle server platform.
Use Secure Shell
Select if you are working with a Secure Shell connection.
User Name
The user name of the server where trace files are stored.
Note: For Windows platforms, the user should have
administrator privileges.
SAP Configuration Dialog Box
This dialog box enables you to set up the SAP Diagnostics module to
communicate with the Mediator.
To access
Select Diagnostics > Configuration. Click Configure next
to SAP Diagnostics.
Relevant tasks
"How to Configure SAP Diagnostics" on page 406
See also
"SAP Diagnostics Graphs" in the HP LoadRunner Analysis
User Guide
User interface elements are described below:
UI Elements (A-Z)
Description
Validates the connection to the SAP server.
When you click Validate, the Controller produces a
report of all the servers that are available for diagnostics
through the Server Host.
Enable SAP
Diagnostics
Enables SAP Diagnostics and allows you to configure the
SAP Diagnostics settings.
419
Chapter 20 • LoadRunner ERP/CRM Diagnostics Modules
UI Elements (A-Z)
Description
Name
The name of the Mediator used to collect and process the
SAP diagnostics data. Only one Mediator is supported for
each diagnostics module.
Note: If you are using a Mediator that is over a firewall,
enter the local machine key of the Mediator instead of
the Mediator machine name.
Enable Firewall
Select if the Mediator is over a firewall.
MI Listener
The name, full name, or IP address of the MI Listener
machine if you are monitoring over a firewall.
Application Server
The name of the SAP server.
Router string
Optional. Enter the system router string of the SAP server.
System number
The system number of the SAP server.
User name
The user’s unique name for logging onto the SAP server.
Password
The user’s password for logging onto the SAP server.
Client number
The client number of the selected user.
Siebel Configuration Dialog Box
This dialog box enables you to set up the Siebel Diagnostics module to
communicate with the Mediator.
To access
Select Diagnostics > Configuration. Click Configure next
to Siebel Diagnostics.
Relevant tasks
"How to Configure Siebel Diagnostics" on page 389
See also
➤ "Siebel Server Configuration Dialog Box" on page 424
➤ "Siebel Diagnostics Graphs" in the HP LoadRunner
Analysis User Guide
420
Chapter 20 • LoadRunner ERP/CRM Diagnostics Modules
User interface elements are described below:
UI Elements (A-Z)
Description
Opens the Siebel Server Configuration dialog box where
you can add Siebel servers and to enter server
information. For user interface details, see "Siebel
Server Configuration Dialog Box" on page 424.
Tests the connections between the Siebel Diagnostics
module and the Mediator.
Note: This does not check the connections to the Siebel
servers.
Enable Firewall
Select if the Mediator is over a firewall.
Enable Siebel
Diagnostics
Enables Siebel Diagnostics and allows you to configure
the Siebel Diagnostics settings.
MI Listener
The name, full name, or IP address of the MI Listener
machine if you are monitoring over a firewall.
Name
The name of the Mediator used to collect and process the
Siebel Diagnostics data. Only one Mediator is supported
for each diagnostics module.
Note: If you are using a Mediator that is over a firewall,
enter the local machine key of the Mediator instead of
the Mediator machine name.
Servers Table
➤ Server Name. The name of the Siebel server.
➤ Server ID. The Siebel server ID (for Siebel application
servers only).
➤ Platform. The platform of the Siebel server.
➤ Log Directory. The Siebel server directory where Siebel
log files (*.SARM) are written.
421
Chapter 20 • LoadRunner ERP/CRM Diagnostics Modules
Siebel DB Configuration Dialog Box
This dialog box enables you to set up the Siebel DB Diagnostics module to
communicate with the Mediator.
To access
Select Diagnostics > Configuration. Click Configure next
to Siebel DB Diagnostics.
Relevant tasks
"How to Configure Siebel DB Diagnostics" on page 396
See also
➤ "Siebel DB Server Configuration Dialog Box" on
page 423
➤ "Siebel DB Diagnostics Graphs" in the HP LoadRunner
Analysis User Guide
User interface elements are described below:
UI Elements (A-Z)
Description
Opens the Siebel DB Server Configuration dialog box
where you can add Siebel servers and to enter server
information. For user interface details, see "Siebel DB
Server Configuration Dialog Box" on page 423.
Tests the connections between the Siebel DB Diagnostics
module and the Mediator.
Note: This does not check the connections to the Siebel
servers.
422
Enable Firewall
Select if the Mediator is over a firewall.
Enable Siebel DB
Diagnostics
Enables Siebel Diagnostics and allows you to configure
the Siebel Diagnostics settings.
MI Listener
The name, full name, or IP address of the MI Listener
machine if you are monitoring over a firewall.
Chapter 20 • LoadRunner ERP/CRM Diagnostics Modules
UI Elements (A-Z)
Description
Name
The name of the Mediator used to collect and process the
Siebel Diagnostics data. Only one Mediator is supported
for each diagnostics module.
Note: If you are using a Mediator that is over a firewall,
enter the local machine key of the Mediator instead of
the Mediator machine name.
Servers Table
➤ Server Name. The name of the Siebel server.
➤ Platform. The platform of the Siebel server.
➤ Log Directory. The Siebel server directory where Siebel
log files (*.SARM) are written.
Siebel DB Server Configuration Dialog Box
This dialog box enables you to add Siebel servers and add server
information.
To access
Select Diagnostics > Configuration. Click Configure next
to Siebel DB Diagnostics then click Add.
Relevant tasks
"How to Configure Siebel DB Diagnostics" on page 396
See also
"Siebel DB Configuration Dialog Box" on page 422
User interface elements are described below:
UI Elements (A-Z)
Description
Domain
The Siebel server domain.
Password/Passphrase
The user password or passphrase.
Private Key File
The name of the file where the Private Key is stored. This
can be found on the Mediator. If you specify the file
name only (without a path), the configuration
automatically looks for the file in the Mediator’s
<LoadRunner>\bin directory.
423
Chapter 20 • LoadRunner ERP/CRM Diagnostics Modules
UI Elements (A-Z)
Description
Server Log Directory
A location where the Siebel application saves the log files.
The log files can be saved in a shared log directory on the
Siebel server or in a separate folder.
Server Name
The name of the Siebel server.
Server Platform
The Siebel server platform.
Use Secure Shell
Select if you are working with a Secure Shell connection.
User Name
The user name of the server where log files are stored.
Note: For Windows platforms, the user should have
administrator privileges.
Siebel Server Configuration Dialog Box
This dialog box enables you to add Siebel servers and to enter server
information.
To access
Select Diagnostics > Configuration. Click Configure next
to Siebel Diagnostics then click Add.
Relevant tasks
"How to Configure Siebel Diagnostics" on page 389
See also
"Siebel Configuration Dialog Box" on page 420
User interface elements are described below:
424
UI Elements (A-Z)
Description
App Server ID
The Siebel server ID. For information on generating a list
of server IDs, see "Configure the server machine to enable
diagnostics" on page 392.
Domain
The Siebel server domain.
OS
Select the Siebel server platform.
Password/Passphrase
The user password or passphrase.
Chapter 20 • LoadRunner ERP/CRM Diagnostics Modules
UI Elements (A-Z)
Description
Private Key File
The name of the file where the Private Key is stored. This
can be found on the Mediator. If you specify the file
name only (without a path), the configuration
automatically looks for the file in the Mediator’s
<LoadRunner>\bin directory.
Server Log Directory
Location where the Siebel application saves the log files
(*.SARM). The log files can be saved in a shared log
directory on the Siebel server or in a separate folder.
Server Name
The name of the Siebel server.
Server Type
The Siebel server type.
Use Secure Shell
Select if you are working with a Secure Shell connection.
User Name
The user name of the server where log files are stored.
Note: For Windows platforms, the user should have
administrator privileges.
Troubleshooting and Limitations
This section describes troubleshooting and limitations for ERP/CRM
Diagnostics.
Microsoft Windows networking limitation: Failed to
establish connection. System error 1219
Possible causes:
➤
The limitation might be a result of running the LoadRunner agent as a
process.
➤
The limitation might appear if the Mediator is already connected to the
Server with a prior configuration and if the server user is a
non-administrator.
425
Chapter 20 • LoadRunner ERP/CRM Diagnostics Modules
Solution: You can try the following:
➤
Run the LoadRunner agent as a service. For more information, see
"Running the LoadRunner Agent as a Service" on page 524.
➤
Disconnect all previous Mediator connections to the server and try to
connect again.
➤
To check that a connection exists, at the Command prompt run the
following:
net use
➤
To remove a connection, at the Command prompt run the
following:
net use \\servername\sharename /DELETE
➤
Use your own connection to the log directory by supplying the
UNC-path to the log directory and marking the operating system as
WINDOWS. When the Mediator runs, it will not try to create a
connection but will rely on the given UNC-path instead.
Error: RSH Command Failed
Solution: Run the same command from the DOS command prompt to
determine if it is a problem with the command or with LoadRunner. If it
runs at the DOS command prompt, the command is valid and you should
contact the HP Software Support Web site (www.hp.com/go/
hpsoftwaresupport) for further help.
If you cannot run the command from the DOS command prompt either,
then contact your UNIX administrator for further assistance.
For more information about RSH commands, see "UNIX Shell" on page 507.
426
Chapter 20 • LoadRunner ERP/CRM Diagnostics Modules
Error: SSH Command Failed
Solution: Run the same command from the DOS command prompt to
determine if it is a problem with the command or with LoadRunner. If it
runs at the DOS command prompt, the command is valid and you should
contact the HP Software Support Web site (www.hp.com/go/
hpsoftwaresupport) for further help.
If you cannot run this command from the DOS command prompt either,
then contact your UNIX administrator for further assistance.
427
Chapter 20 • LoadRunner ERP/CRM Diagnostics Modules
428
21
Configuring J2EE/.NET Diagnostics
This chapter includes:
Concepts
➤
J2EE/.NET Diagnostics Overview on page 430
➤
Monitoring Server Requests on page 430
Tasks
➤
How to Specify J2EE/.NET Diagnostics Server Details in the Launcher
on page 431
➤
How to Configure a LoadRunner Scenario to use J2EE/.NET Diagnostics
on page 432
➤
How to View J2EE/.NET Diagnostics Data in LoadRunner During a
Scenario Run on page 433
➤
How to View Offline J2EE/.NET Diagnostics Results on page 434
Reference
➤
LoadRunner J2EE/.NET Diagnostics Module User Interface on page 435
429
Chapter 21 • Configuring J2EE/.NET Diagnostics
Concepts
J2EE/.NET Diagnostics Overview
The HP Diagnostics integration with LoadRunner allows you to monitor and
analyze the performance of Java 2 Enterprise Edition (J2EE),
.NET-connected, SAP, Oracle, and other complex environments.
For more information about working with diagnostics for J2EE and .NET, see
the HP Diagnostics User Guide.
Monitoring Server Requests
When configuring a LoadRunner scenario to use J2EE/.NET Diagnostics, you
can instruct LoadRunner to capture a percentage of server requests which
occur outside the context of any Vuser transaction.
The benefit of enabling this functionality is that calls into a back-end VM
can be captured even in the case where:
430
➤
The probe is not capturing RMI calls
➤
RMI calls cannot be captured (perhaps because an unsupported
application container is being used)
➤
The application uses some other mechanism for communications
between multiple VMs
Chapter 21 • Configuring J2EE/.NET Diagnostics
Tasks
How to Specify J2EE/.NET Diagnostics Server Details in
the Launcher
The first time you use LoadRunner to capture J2EE or .NET diagnostics data,
you need to identify the machine on which the Diagnostics Server in
Commander mode is running, and the port that it is using for
communication with LoadRunner.
Note: You must update this information if you want to integrate with a
different Diagnostics Server in Commander mode, or if you change the port
it is using.
Update the LoadRunner configuration settings for HP
Diagnostics
In the HP Diagnostics Commander, enter the details for the Diagnostics
Server in Commander mode. For user interface details, see "Diagnostics for
J2EE/.NET Setup Dialog Box" on page 435.
431
Chapter 21 • Configuring J2EE/.NET Diagnostics
How to Configure a LoadRunner Scenario to use J2EE/
.NET Diagnostics
This task describes how to capture J2EE/.NET diagnostics metrics in a
LoadRunner scenario and how to select the probes that will be included in
the scenario.
This task includes the following steps:
➤
"Prerequisite" on page 432
➤
"Enable J2EE/.NET Diagnostics" on page 432
1 Prerequisite
➤
Start application server.
Make sure that the application server you are monitoring has already
been started.
➤
Make sure that the load test scenario is not already running.
You must configure J2EE/.NET diagnostics before running the load test
scenario.
2 Enable J2EE/.NET Diagnostics
Perform the following steps:
a In the Controller, select Diagnostics > Configuration to open the
Diagnostics Distribution dialog box. Then select Enable the following
diagnostics and specify the percentage of Vusers for which you want to
collect J2EE/.NET Diagnostics data. For user interface details, see
"Diagnostics for J2EE/.NET Setup Dialog Box" on page 435.
b In the Diagnostics Distribution dialog box, click Configure by J2EE/
.NET Diagnostics to enable the module. For user interface details, see
"J2EE/.NET Configuration Dialog Box" on page 436.
432
Chapter 21 • Configuring J2EE/.NET Diagnostics
How to View J2EE/.NET Diagnostics Data in LoadRunner
During a Scenario Run
This task describes how to view diagnostics data for J2EE/.NET Diagnostics
in LoadRunner for the whole scenario or for a specific transaction during a
scenario run.
This task includes the following steps:
➤
"View diagnostics data for the whole scenario" on page 433
➤
"View Diagnostics Data for a Specific Transaction" on page 433
View diagnostics data for the whole scenario
In the Controller, select the Diagnostics for J2EE/.NET tab. HP Diagnostics
opens, displaying the Scenario Summary dashboard view.
The Scenario Summary dashboard view displays monitoring versions of the
transactions, server requests, load, and probe views for the current run.
Note: If you move to another tab during the scenario run and then return to
the Diagnostics for J2EE/.NET tab, the last screen that you viewed will be
displayed.
View Diagnostics Data for a Specific Transaction
Perform the following steps:
1 Select one of the Transaction graphs (for example, Transaction Response
Time), to open the graph.
2 Right-click the relevant transaction in the graph legend and select Show
J2EE/.NET server side.
HP Diagnostics opens, displaying the Transactions view, which contains
performance metrics and drill-down options for the selected transaction.
For more information about interpreting data in the Diagnostics
Transactions view, see the HP Diagnostics User Guide.
433
Chapter 21 • Configuring J2EE/.NET Diagnostics
How to View Offline J2EE/.NET Diagnostics Results
This task includes the following steps:
➤
"Open Analysis" on page 434
➤
"View results in the Analysis diagnostics graphs" on page 434
1 Open Analysis
In the Run tab of the Controller, select Results > Analyze Results, or click
the Analyze Results button.
2 View results in the Analysis diagnostics graphs
You can use the Analysis diagnostics graphs and reports to view the
performance data and drill down to pinpoint problem areas in any layer
of the application.
For specific information about J2EE/.NET diagnostics graphs, see J2EE &
.NET Diagnostics Graphs in the HP LoadRunner Analysis User Guide.
434
Chapter 21 • Configuring J2EE/.NET Diagnostics
Reference
LoadRunner J2EE/.NET Diagnostics Module User Interface
This section includes (in alphabetical order):
➤
Diagnostics for J2EE/.NET Setup Dialog Box on page 435
➤
J2EE/.NET Configuration Dialog Box on page 436
Diagnostics for J2EE/.NET Setup Dialog Box
This dialog box enables you to update the LoadRunner configuration
settings for HP Diagnostics.
To access
In the LoadRunner launcher window, select
Configuration > Diagnostics for J2EE/.NET Setup
Relevant tasks
"How to Specify J2EE/.NET Diagnostics Server Details in
the Launcher" on page 431
User interface elements are described below:
UI Elements (A-Z)
Description
Click to verify that you entered the correct information
for the Diagnostics Server in Commander mode and that
there is connectivity between the server and
LoadRunner.
Login
The user name with which you log in to Diagnostics.
Default: admin
Note: The user name that you specify should have view,
change, and execute privileges. For more information
about user privileges, see the HP Diagnostics Installation
and Configuration Guide.
435
Chapter 21 • Configuring J2EE/.NET Diagnostics
UI Elements (A-Z)
Description
Password
Enter the password with which you log in to Diagnostics.
Default: admin
Port
Enter the port number used by the Diagnostic server in
Commander mode.
Default: 2006
Note: LoadRunner does not support communication
with the Diagnostics Server in Commander mode using
HTTPS.
Server Name
Enter the name of the machine that is to host the
Diagnostics Server in Commander mode.
J2EE/.NET Configuration Dialog Box
This dialog box enables you to set up the J2EE/.NET Diagnostics module.
436
To access
Select Diagnostics > Configuration. Click Configure by
J2EE/.NET Diagnostics.
Important
information
The dialog box is read only while a scenario is running.
Relevant tasks
"How to Configure a LoadRunner Scenario to use J2EE/
.NET Diagnostics" on page 432
See also
"J2EE & .NET Diagnostics Graphs" in the HP LoadRunner
Analysis User Guide
Chapter 21 • Configuring J2EE/.NET Diagnostics
User interface elements are described below:
UI Elements (A-Z)
Description
Enable J2EE/.NET
Diagnostics
Enables J2EE/.NET Diagnostics and allows you to
configure the J2EE/.NET Diagnostics settings
Select probes table
Selects a probe for monitoring. At least one probe
must be selected. Clear the check box to disable a probe
for the duration of the scenario.
Name. The name of the probe.
Group. The probe group.
Host Name. The host the probe is running on (or the
application server on which the probe is installed) la.
Note: If you upgraded your Diagnostics installation,
probes from existing scenarios may appear with a red
status. Clear any probes that appear in red.
There is a firewall
between the
Mediator and the
Controller
Select if the Diagnostics server (or a Diagnostics server in
Mediator mode in a distributed environment) is located
behind a firewall.
MI Listener server
Enter the name of the MI Listener server when the
Diagnostics server (or a Diagnostics server in Mediator
mode in a distributed environment) is located behind a
firewall.
Note: If there is a firewall between the LoadRunner
Controller and the Diagnostics Server involved in a load
test, you must configure the Controller and the
Diagnostics Server to use the MI Listener to enable the
transfer of the offline analysis file. For more information,
refer to the HP Diagnostics Installation and Configuration
Guide.
437
Chapter 21 • Configuring J2EE/.NET Diagnostics
UI Elements (A-Z)
Description
Monitor server
requests
Select to capture a percentage of server requests which
occur outside the context of any Vuser transaction. For
more information, see"Monitoring Server Requests"
on page 430.
Notes:
➤ The server requests will be captured at the same
percentage that was selected for the percentage of
Vusers in the Diagnostics Distribution dialog box.
➤ Enabling this option imposes an additional overhead
on the probe.
Troubleshoot
Diagnostics for J2EE/
.NET connectivity
438
Click to open the HP Diagnostics System Health Monitor
to enable you to investigate any connectivity issues
between the Diagnostics components.
Part VI
Monitoring Load Test Scenarios
440
22
Working with LoadRunner Online
Monitors
This chapter includes:
Concepts
➤
Monitoring Process Overview on page 442
Tasks
➤
How to Set Up the Monitoring Environment – Workflow on page 443
Reference
➤
Monitor Types on page 448
➤
Configuring Monitors User Interface on page 450
441
Chapter 22 • Working with LoadRunner Online Monitors
Concepts
Monitoring Process Overview
Before monitoring a scenario, you need to set up and configure the
LoadRunner monitoring components. Each monitor has different
configuration requirements that are explained in the specific monitoring
chapters. The following diagram illustrates the LoadRunner monitoring
process.
Before monitoring a server, perform the following steps:
➤
Configure the monitoring environment on the server machine (if
necessary).
➤
Configure the monitor on the Controller machine.
For details, see "How to Set Up the Monitoring Environment – Workflow" on
page 443.
442
Chapter 22 • Working with LoadRunner Online Monitors
Tasks
How to Set Up the Monitoring Environment – Workflow
This task describes how to set up the LoadRunner online monitoring
environment. You specify the machines and measurements that the
Controller will monitor during a scenario execution in the Controller’s Run
tab. During scenario execution, the collected measurement data appears in
the online graphs.
This task includes the following steps:
➤
"Configure the monitoring environment on the server machine" on
page 443
➤
"Add the monitored server to the Controller" on page 444
➤
"For SiteScope monitors, configure the remote server" on page 445
➤
"Select the measurements that you want to monitor" on page 445
➤
"Change the monitor’s default counters - Optional" on page 446
➤
"Improve the level of measurement information - Optional" on page 446
1 Configure the monitoring environment on the server
machine
To use the following monitors, you must first install or configure
monitoring components on the server machine. For details about
configuring the monitoring components, see the specific monitoring
sections.
➤ Citrix
➤ Oracle
➤ DB2
➤ PeopleSoft (Tuxedo)
➤ IBM WebSphere MQ
➤ SAPGUI
➤ J2EE & .NET Diagnostics
➤ Tuxedo
➤ Network Delay
➤ UNIX
443
Chapter 22 • Working with LoadRunner Online Monitors
2 Add the monitored server to the Controller
Select the server whose monitors you want to configure.
To monitor a server from the Controller, you need to add the machine
and the measurements that you want to monitor.
a Click the desired monitor graph in the graph tree, and drag it into the
right pane of the Run tab.
b Right-click the graph and select Add Measurements, or click anywhere
on the graph and select Monitors > Add Measurements. The
<Monitor> dialog box opens.
c Some monitors are native LoadRunner monitors (by default), but you
can also monitor through the SiteScope monitor engine. If you want to
monitor a server through the SiteScope monitor engine: Click
Advanced. In the Choose Monitor Engine dialog box, select SiteScope.
For more information, see the relevant monitoring section.
d In the Monitored Server Machines section of the <Monitor> dialog
box, click Add. The Add Machine dialog box opens.
➤
Enter the server name or IP address of the machine you want to
monitor. Select the platform on which the machine runs.
➤
For Sitescope monitors enter the name and port number of the
SiteScope server, and specify whether you are using a Secure HTTP
connection. To use an account, enter the relevant account
information.
For user interface details, see "Add Machine Dialog Box" on page 450.
444
Chapter 22 • Working with LoadRunner Online Monitors
3 For SiteScope monitors, configure the remote server
You configure the remote machine according to your machine’s platform:
Windows or Unix.
a Windows platform: When you add measurements to monitor for the
first time, the Configuring NT Remote Machine dialog box opens. For
user interface details, see "Configuring NT Remote Machine Dialog
Box" on page 452.
b UNIX platform: When you add measurements to monitor for the first
time, the Configuring Unix Remote Machine dialog box opens. For
user interface details, see "Configuring Unix Remote Machine Dialog
Box" on page 455.
4 Select the measurements that you want to monitor
a Make sure that the monitor you are configuring is selected in the
Monitored Server Machines area of the <Monitor> dialog box.
b In the Resource Measurements section of the <Monitor> dialog box,
click Add. The <monitor> Configuration dialog box opens. Choose the
measurements for the specific server.
Note: For the Citrix monitor, if the dialog box freezes after clicking
Add, you may need to rebuild the localhost cache on the Citrix server
machine. For more information, refer to Document IDs CTX003648
and CTX759510 in the Citrix Knowledge Base
(http://knowledgebase.citrix.com/cgi-bin/
webcgi.exe?New,KB=CitrixKB).
For user interface details, see "<Monitor> Configuration Dialog Box" on
page 460.
For details about each monitor’s default measurements, refer to the
relevant reference section for the monitor.
445
Chapter 22 • Working with LoadRunner Online Monitors
5 Change the monitor’s default counters - Optional
When you configure the System Resource, Microsoft IIS, Microsoft ASP,
and SQL Server monitors, you are presented with a list of default counters
that you can measure on the server you are monitoring. You can change
the default counters for these monitors by editing the res_mon.dft file
found in the LoadRunner\dat directory.
a Open a new scenario and click the Run tab.
b For each of the monitors, select the counters you want to measure.
c Save the scenario and open the scenario .lrs file and res_mon.dft file
with an editor.
d From the scenario .lrs file, copy the MonItemPlus section of the each
counter you selected into the res_mon.dft file.
e Count the number of new counters in the res_mon.dft file and update
the ListCount parameter with this number.
6 Improve the level of measurement information - Optional
You can improve the level of measurement information for the SNMP,
iPlanet (SNMP), or Check Point FireWall-1 monitor by enabling
measurements with string values to be listed (in addition to
measurements with numeric values), and by enabling the name modifier
(which displays the string value as an identifying part of the
measurement name).
In the following example of a measurement using the name modifier, the
string value of ProcessName (sched) is displayed in addition to its
instance ID (0):
To enable this feature, add the following line to the snmp.cfg file in the
LoadRunner\dat\monitors directory:
SNMP_show_string_nodes=1
446
Chapter 22 • Working with LoadRunner Online Monitors
Note: You can select more than one name modifier, but the first in the
hierarchy will be used. Each time the SNMP Add Measurements dialog
box opens, the information is reread from the snmp.cfg file. You cannot
add the same measurement twice (once with a name modifier and once
without it). If you do so, an error message is issued.
You can modify the list of resources that you want to monitor at any
point during the scenario run. A scenario does not have to be active in
order for you to monitor the resources on a remote machine.
447
Chapter 22 • Working with LoadRunner Online Monitors
Reference
Monitor Types
All of the monitors allow you to view a summary of the collected data at the
conclusion of the scenario. Using LoadRunner Analysis, you can generate a
graph for any of the monitors. For more information, see the HP LoadRunner
Analysis User Guide.
The online monitors are divided into the following categories:
448
Web Resource Monitors
Provide information about the number of Web connections, throughput volume, HTTP responses, server
retries, and downloaded pages at the Web servers during the scenario run. For more information, see "Web
Resource Monitors" on page 463.
Run-Time and
Transaction Monitors
Display the transaction rate and response times, and
the number and status of Vusers participating in the
scenario, as well as the number and types of errors
that the Vusers generate. For more information, see
"Run-Time and Transaction Monitoring" on page 471.
System Resource
Monitors
Measure the Windows, UNIX, Server, SNMP, and SiteScope resources used during a scenario run. For more
information, see "System Resource Monitoring" on
page 477.
Network Delay Monitors
Displays information about the network delays on
your system. For more information, see "Network
Delay Monitoring" on page 497.
Firewall Monitor
Measures statistics related to the firewall servers during the scenario run. For more information, see "Firewall Server Performance Monitoring" on page 481.
Web Server Resource
Monitors
Measure statistics related to the Microsoft IISand
Apache Web servers during the scenario run. For
more information, see "Web Server Resource Monitoring" on page 513.
Chapter 22 • Working with LoadRunner Online Monitors
Web Application Server
Resource Monitors
Measure statistics related to the Microsoft ASP and
WebLogic (SNMP) application servers during the scenario run. For more information, see "Web Application Server Resource Monitoring" on page 521.
Database Server
Resource Monitors
Measure statistics related to the SQL server, Oracle,
and DB2 databases during the scenario run. For more
information, see "Database Resource Monitoring" on
page 531.
Streaming Media
Monitors
Measure statistics related to the RealPlayer Client and
Media Player Client servers during the scenario run.
For more information, see "Streaming Media Monitoring" on page 557.
ERP/CRM Server
Resource Monitors
Measure statistics related to the SAP Portal, SAP
CCMS, SAPGUI, Siebel Server Manager, Siebel Web
Server, and PeopleSoft (Tuxedo) servers during the
scenario run. For more information, see "ERP/CRM
Server Resource Monitoring" on page 563.
J2EE & .NET Diagnostics
Monitors
Provide information to trace, time, and troubleshoot
individual transactions through J2EE Web, application, and database servers. For more information, see
the HP Diagnostics User Guide.
Application Component
Monitors
Measures statistics related to the Microsoft COM+
server during a scenario run. For more information,
see "Application Component Monitoring" on
page 583.
Application Deployment
Solutions Monitors
Measures statistics related to the Citrix MetaFrame XP
server during a scenario run. For more information,
see "Application Deployment Solution Monitoring"
on page 589.
Middleware Performance
Monitors
Measure statistics related to the Tuxedo and IBM
WebSphere MQ servers during a scenario run. For
more information, see "Middleware Performance
Monitoring" on page 601
449
Chapter 22 • Working with LoadRunner Online Monitors
Infrastructure Resources
Monitor
Displays information about network client data
points during a scenario run using the Network Client graph. For more information, see "Infrastructure
Resources Monitoring" on page 621.
Security Monitor
Displays information about simulated attacks on the
server during a scenario run using the Distributed
Denial of Service graph. For more information, see
Part VII, "Appendixes."
Configuring Monitors User Interface
This section includes (in alphabetical order):
➤
Add Machine Dialog Box on page 450
➤
Configuring NT Remote Machine Dialog Box on page 452
➤
Configuring Unix Remote Machine Dialog Box on page 455
➤
<Monitor> Configuration Dialog Box on page 460
Add Machine Dialog Box
This dialog box enables you to add the machine that you want to monitor
to the Monitored Server Machines list.
450
To access
Right-click a graph > Add Measurements > Monitored
Servers section of Monitored Server Machine > Add.
Relevant tasks
"How to Set Up the Monitoring Environment –
Workflow" on page 443
Chapter 22 • Working with LoadRunner Online Monitors
Monitored Machine Information
User interface elements are described below:
UI Element (A-Z)
Description
Name
The name or IP address of the machine that you want to
monitor.
➤ Server Resource monitors: If you are using the HTTP
method, enter the full URL of the CGI script.
Example: http://demo.thiscompany.com/cgi-bin/run.sh
➤ DB2 monitor: Enter the DB2 server machine name
followed by the @ sign and the database instance you
specified in the DB2 Control Center.
Example: localhost@DB2
➤ CheckPoint FireWall-1 monitor: You can specify a
machine name and port number using the format:
<machine name>:<port number>
➤ iPlanet (SNMP) monitor: If the iPlanet SNMP agent is
running on a different port than the default SNMP
port, you need to define the port number using the
format: <server name>:<port number>
➤ MS-COM+ monitor: To the monitor over a firewall, use
the format:
<MI Listener machine>:<server machine key> where
server machine key is the unique key that you chose
when configuring the firewall Agent on the server
machine. Example: 12.12.12.3:serverid
➤ MS IIS monitor: To monitor an IIS server through a
firewall, use TCP, port 139.
➤ Tuxedo or PeopleSoft (Tuxedo) monitor: For multiple
instances of the Tuxedo or PeopleSoft (Tuxedo)
monitor on the same machine, enter the port number
of each monitor to distinguish each instance using the
format: <machine name>:<port number>
➤ WebLogic: If If the WebLogic SNMP agent is running
on a different port than the default SNMP port, use the
format: <server name>:<port number>.
Platform
The platform of the machine you want to monitor.
451
Chapter 22 • Working with LoadRunner Online Monitors
SiteScope Server Information
User interface elements are described below:
UI Element (A-Z)
Description
Name
The name of the SiteScope server.
Port
The SiteScope port.
Default: 8888
Use Account
Select this option to use a specific SiteScope user account.
Enter the following account details:
➤ Account. The SiteScope account name or number
➤ Username. The user name defined to log in to the
SiteScope account
➤ Password. The password defined to log in to the
SiteScope account
Use Secure HTTP
Select this to use a Secure HTTP connection.
Configuring NT Remote Machine Dialog Box
This dialog box enables you to configure the remote Windows machine for
SiteScope monitors.
To access
Right-click the graph and select Add Measurements.
This dialog appears only when you add measurements
for the first time.
452
Important information
You configure the NT remote server machine for
SiteScope monitors only.
Relevant tasks
"How to Set Up the Monitoring Environment –
Workflow" on page 443
Chapter 22 • Working with LoadRunner Online Monitors
User interface elements are described below:
UI Element (A-Z)
Description
Connection Limit
Controls the number of open connections that SiteScope
will allow for this remote machine. If you have a large
number of monitors configured to use this connection,
then set this number high enough to relieve the potential
bottleneck.
Note: This setting does not affect the number of tests
running on the remote machine. Tests will always create
a new connection.
Connection Method
SiteScope can use the following connection types for
monitoring remote Windows server resources:
➤ NetBIOS. The default server-to-server communication
protocol for Windows networks.
➤ SSH. Secure Shell, a more secure communication
protocol that can be installed on Windows based
networks. This connection method normally requires
installing SSH libraries on each server to which you
want to connect.
Custom
Commandline
The custom command line for a remote connection
using the External Client. This option can be used when
needing to pass specific options to the external client
being executed. Valid substitution variables are:
➤ $root$. This will be translated to the SiteScope
directory.
➤ $user$. This will be translated to the user name
entered into the remote machine.
➤ $password$. This will be translated to the password
entered into the remote.
➤ $host$. This will be translated to the host name
entered into the remote machine.
Disable Connection
Caching
Select to turn off connection caching for this remote
machine. By default SiteScope caches open connections.
453
Chapter 22 • Working with LoadRunner Online Monitors
UI Element (A-Z)
Description
Key File for SSH
connections
Select the file that contains the private key for this
connection.
Default: SiteScope\groups\identity. This setting only
applies when the authentication method is Key File.
Login
The login for the remote server. If the server is within the
same domain as the SiteScope machine, include the
domain name in front of the user login name.
Example: domainname\user
If you are using a local machine login account for
machines within or outside the domain, include the
machine name in front of the user login name.
Example: machinename\user
NT Server Address
The IP address or UNC-style name of the monitored
Windows server.
Note: The address can be an IP hostname if the SiteScope
server can resolve this name into an IP address (using a
hosts file, DNS, or WINS/DNS integration).
Password
The password for the remote server or the passphrase for
the SSH key file.
Note: When using SSH authentication with public/
private key-based authentication enter the passphrase for
the identity file here.
SSH Authentication
Method
The authentication method to use for SSH connections.
The currently supported methods are:
➤ Password. Authenticate using a password.
➤ Key File. Authenticate using public/private key
authentication. When this option is selected SiteScope
uses the private key in the file SiteScope/groups/
identity to authenticate. The corresponding public key
must be listed in the authorized_keys file on the
remote host.
454
Chapter 22 • Working with LoadRunner Online Monitors
UI Element (A-Z)
Description
SSH Connection
Method
The method to use for this connection. The currently
supported methods are:
➤ Internal Java Libraries. Connect using the Java SSH
client integrated with SiteScope.
➤ Plink. Connect using an external SSH client. On
Windows, SiteScope ships with Plink. On UNIX or
Linux SiteScope uses an installed client such as
OpenSSH.
SSH Port Number
The port that the remote SSH server is listening on.
Default: 22
SSH Version 2 Only
Select to force SiteScope to use SSH protocol version 2
only. This option only applies when using the integrated
Java Client in SiteScope.
Title (Optional)
A title for the remote machine name. This name will
appear in the drop-down list.
Trace
Select to have trace messages to and from the subject
server recorded to the SiteScope RunMonitor.log file.
Configuring Unix Remote Machine Dialog Box
Enables you to configure the remote Unix machine for SiteScope monitors.
To access
Right-click the graph and select Add Measurements.
This dialog appears only when you add measurements
for the first time.
Important
Information
You configure the UNIX remote server machine for
SiteScope monitors only.
Relevant Tasks
"How to Set Up the Monitoring Environment –
Workflow" on page 443
455
Chapter 22 • Working with LoadRunner Online Monitors
User interface elements are described below:
UI Elements (A-Z)
Description
<Test..>
After defining the server for SiteScope, you can test the
settings by clicking the test link. SiteScope attempts to
display the working directory of the remote machine (the
"pwd" command on UNIX, or "cd" on Windows), as a test
to ensure that the remote machine can be accessed and
can run commands properly.
Connection Limit
The maximum number of connections for this remote
machine.
Connection Method
The supported methods for connecting to the server:
➤ Telnet. Log in to the remote server using Telnet.
➤ SSH. Log in to the remote server using the SSH
protocol. This may require additional software and
setup depending on the version of UNIX you are
working with.
➤ Rlogin. Log in to the remote server using the Rlogin
protocol.
➤ HTTP. Connect to an HTTP server on the remote server
and run the command via a CGI. For this method, the
Login and Password are optional and are used for
authorizing logging in to the remote machine if
required.
456
Custom
Commandline
The command for execution of the external SSH client.
For substitutions, use $host$, $user$, and $password$
respectively. This setting is supported only for
connections using an external process.
Disable Connection
Caching
Select this to disable SSH connection caching.
Chapter 22 • Working with LoadRunner Online Monitors
UI Elements (A-Z)
Description
Initialize Shell
Environment
Enter any shell commands to be executed at the
beginning of the session. Separate multiple commands
with a semicolon (;). This option allows you to specify
shell commands to be executed on the remote machine
directly after a Telnet or SSH session has been initiated.
These commands can be used to customize the shell for
each SiteScope remote machine.
Note: Commands after a shell invocation will not be
executed.
Examples:
➤ The remote shell may not have the correct path set for
SiteScope scripts to run. The following command will
add the directory /usr/local/bin into the path of the
current shell on the remote machine:
export PATH=$PATH:/usr/local/sbin
➤ The remote shell may not be initializing the pseudo
terminal correctly. The following command increases
the terminal width to 1024 characters:
stty cols 1024;${SHELL}
➤ There have been cases where the remote Telnet Server
does not echo back the command line properly. This
may cause strange behavior for monitors that rely on
this behavior. The following command forces the
remote terminal to echo:
stty echo
➤ Certain UNIX shells have been known to behave
erratically with SiteScope. This includes bash, ksh, and
csh. The following command changes the shell to sh
for the SiteScope connection:
/bin/sh
Login
The log in string for the remote server.
Login Prompt
Enter the prompt to be displayed when the system is
waiting for the log in string to be entered.
Default: "login:"
457
Chapter 22 • Working with LoadRunner Online Monitors
UI Elements (A-Z)
Description
OS
Select the operating system running on the remote
server. The following versions of UNIX are supported:
➤ AIX
➤ OPENSERVER
➤ FreeBSD
➤ SCO
➤ HP/UX
➤ SGI Irix
➤ HP/UX 64-bit
➤ Sun Solaris
➤ Linux
➤ Tru64 5.x
➤ MacOSX
➤ Tru64 Pre 4.x (Digital)
Password
The password for the remote server.
Password Prompt
The prompt to be displayed when the system is waiting
for the password to be entered.
Default: "password:"
Prompt
The prompt to be displayed when the system is ready to
handle a command.
Default: #.
Secondary Prompt
The prompt to be displayed if the Telnet connection to
the remote server causes the remote server to prompt for
more information about the connection. Separate
multiple prompt strings by commas (,).
Example: For Telnet connections to some remote servers,
the remote server may ask what terminal type should be
emulated for the connection. In this case you might need
to enter Terminal type? as the secondary prompt. The
response to the secondary prompt is entered in the
Secondary Response field below.
458
Chapter 22 • Working with LoadRunner Online Monitors
UI Elements (A-Z)
Description
Secondary Response
The responses to secondary prompts required to establish
connections with this remote server. Separate multiple
responses with commas (,).
Server Address
Displays the IP address or host name of the server that
you entered in the Add Machine Dialog Box.
SSH Authentication
Method
Select the method to use to authenticate to the remote
server (for SSH connections only).
➤ Password. Authenticate using a password.
➤ Keyfile. Authenticate using public/private key
authentication. When this option is selected,
SiteScope uses the private key in the file SiteScope/
groups/identity to authenticate. The corresponding
public key must be listed in the authorized_keys file
on the remote host.
SSH Connection
Method
Select the method to use to connect to the remote server.
➤ Internal Java Libraries. Connect using the Java SSH
client integrated with SiteScope
➤ Plink. Connect using an external SSH client. On
Windows, SiteScope ships with Plink.
SSH Port Number
The port on which the SSH service is running.
SSH Version 2 Only
Select to force SSH to only use SSH protocol version 2.
This option is only supported when using the internal
Java libraries connection method.
Title
A title for the remote machine name. This name will
appear in the drop-down list in monitors that can
connect to this server.
Trace
Select this option to trace messages to and from the
remote server in the RunMonitor.log file.
459
Chapter 22 • Working with LoadRunner Online Monitors
<Monitor> Configuration Dialog Box
This dialog enables you to select the measurements to monitor during a
scenario run.
To access
Right-click a graph > Add Measurements
Click Add in the Resource Measurements section of
<monitor name> dialog.
Important information
For DB2 monitors: If there is no application working with
a database, you can only monitor the database manager
instance.
Relevant tasks
"How to Set Up the Monitoring Environment –
Workflow" on page 443
User interface elements are described below:
460
UI Elements (A-Z)
Description
Component/Counter
Description
Describes the selected component or counter.
Host
The name of the monitored machine.
Measured
Components
A hierarchical view of the available components. Browse
the tree and select the component you want to monitor.
A description of the highlighted component appears in
the Component/Counter Description box.
Performance
Counters
Select the required performance counters. For details
about the default monitor counters, see the relevant
reference section for your monitor.
Chapter 22 • Working with LoadRunner Online Monitors
<monitor name> Dialog Box
This dialog box enables you to add monitored server machines and access
the dialogs to configure the measurements and data collection method.
To access
Right-click a graph > Add Measurements
Important
information
Before configuring a monitor’s measurements, many
servers require initial setup. The first step of "How to Set
Up the Monitoring Environment – Workflow" on
page 443 contains links to the setup instructions.
Relevant tasks
"How to Set Up the Monitoring Environment –
Workflow" on page 443
User interface elements are described below (unlabeled elements are shown
in angle brackets):
UI Elements (A-Z)
Description
Advanced
Opens the Choose Monitor Engine dialog box for
selecting native LoadRunner or SiteScope monitoring.
➤ To monitor a server through LoadRunner, select
LoadRunner native monitors.
➤ To monitor a server through SiteScope, select
SiteScope.
This button is enabled only for those monitors that can
be configured as both a SiteScope monitor or a native
LoadRunner monitor.
Description
Displays a description of the selected resource
measurement.
461
Chapter 22 • Working with LoadRunner Online Monitors
UI Elements (A-Z)
Description
Monitored Server
Machines
The machines whose resources are being monitored.
Displays the Add Machine dialog box, which
adds the machine that you want to monitor to the
existing list.
Removes the selected machine from the list.
Resource
Measurements on
<machine name>
Displays the resource measurements being monitored on
the selected machine.
Displays the Resources dialog box that lets
you create a list of resource measurements on the selected
machine.
Removes the selected resource measurement
from the list.
462
23
Web Resource Monitors
This chapter includes:
Concepts
➤
Web Resource Monitoring Overview on page 464
Reference
➤
HTTP Status Codes on page 469
463
Chapter 23 • Web Resource Monitors
Concepts
Web Resource Monitoring Overview
The Web Resource monitor enables you to analyze the following resources
on the Web server during a scenario run: throughput, HTTP requests,
downloaded pages, server retries, TCP/IP connections, and SSL Connections.
You can view the following resource monitor graphs during a scenario run:
Hits per Second Graph
The Hits Per Second graph shows the number of hits (HTTP requests) to the
Web server (y-axis) as a function of the elapsed time in the scenario (x-axis).
This graph can display the whole step, or the last 60, 180, 600, or 3600
seconds. You can compare this graph to the Transaction Response Time
graph to see how the number of hits affects transaction performance.
Throughput Graph
The Throughput graph shows the amount of throughput (y-axis) on the
Web server during each second of the scenario run (x-axis). Throughput is
measured in bytes and represents the amount of data that the Vusers
received from the server at any given second. You can compare this graph to
the Transaction Response Time graph to see how the throughput affects
transaction performance.
In the following example, the Transaction Response time graph is compared
with the Throughput graph. It is apparent from the graph that as the
throughput decreases, the transaction response time also decreases. The
peak throughput occurred at approximately 1 minute into the step. The
highest response time also occurred at this time.
464
Chapter 23 • Web Resource Monitors
Example
HTTP Responses per Second Graph
The HTTP Responses per Second graph shows the number of HTTP status
codes (y-axis)—which indicate the status of HTTP requests, for example,
“the request was successful” or “the page was not found”—returned from
the Web server during each second of the scenario run (x-axis).
The HTTP responses are grouped by status code. You can also group the
results shown in this graph by script (using the "Group By" function) to
locate scripts which generated error codes.
For a list of status codes and their explanations, see "HTTP Status Codes" on
page 469.
465
Chapter 23 • Web Resource Monitors
Pages Downloaded per Second Graph
The Pages Downloaded per Second graph shows the number of Web pages
(y-axis) downloaded from the server during each second of the scenario run
(x-axis). This graph helps you evaluate the amount of load Vusers generate,
in terms of the number of pages downloaded.
Note: To view the Pages Downloaded per Second graph, you must select
Pages per second (HTML Mode only) from the script’s run-time settings
Preferences tab before running your scenario.
Like throughput, downloaded pages per second is a representation of the
amount of data that the Vusers received from the server at any given second.
➤
The Throughput graph takes into account each resource and its size (for
example, the size of each .gif file, the size of each Web page).
➤
The Pages Downloaded per Second graph takes into account simply the
number of pages.
In the following example, the Throughput graph is compared with the Pages
Downloaded per Second graph. It is apparent from the graph that
throughput is not proportional to the number of pages downloaded per
second. For example, between 15 and 16 seconds into the scenario, the
throughput decreased while the number of pages downloaded per second
increased.
466
Chapter 23 • Web Resource Monitors
Example
Retries per Second Graph
The Retries Per Second graph shows the number of attempted Web server
connections (y-axis) as a function of the elapsed time in the scenario
(x-axis).
A server connection is retried when:
➤
the initial connection was unauthorized
➤
proxy authentication is required
➤
the initial connection was closed by the server
➤
the initial connection to the server could not be made
➤
the server was initially unable to resolve the load generator’s IP address
467
Chapter 23 • Web Resource Monitors
Connections Graph
The Connections graph shows the number of open TCP/IP connections
(y-axis) at each point in time of the scenario (x-axis). One HTML page may
cause the browser to open several connections, when links on the page go to
different Web addresses. Two connections are opened for each Web server.
This graph is useful in indicating when additional connections are needed.
For example, if the number of connections reaches a plateau, and the
transaction response time increases sharply, adding connections would
probably cause a dramatic improvement in performance (reduction in the
transaction response time).
Connections per Second Graph
The Connections Per Second graph shows the number of new TCP/IP
connections (y-axis) opened and the number of connections that are shut
down each second of the scenario (x-axis).
This number should be a small fraction of the number of hits per second,
because new TCP/IP connections are very expensive in terms of server,
router and network resource consumption. Ideally, many HTTP requests
should use the same connection, instead of opening a new connection for
each request.
SSLs per Second Graph
The SSLs per Second graph shows the number of new and reused SSL
Connections (y-axis) opened in each second of the scenario (x-axis). An SSL
connection is opened by the browser after a TCP/IP connection has been
opened to a secure server.
Because creating a new SSL connection entails heavy resource consumption,
you should try to open as few new SSL connections as possible; once you
have established an SSL connection, you should reuse it. There should be no
more than one new SSL connection per Vuser.
If you set your run-time settings to simulate a new Vuser at each iteration
(using the run-time settings Browser Emulation node), you should have no
more than one new SSL connection per Vuser per iteration. Ideally, you
should have very few new TCP/IP and SSL connections each second.
468
Chapter 23 • Web Resource Monitors
Reference
HTTP Status Codes
The following table displays a list of HTTP status codes. These codes appear
in the HTTP Responses per Second Graph:
Code
Description
Code
Description
200
OK
406
Not Acceptable
201
Created
407
Proxy Authentication Required
202
Accepted
408
Request Timeout
203
Non-Authoritative Information
409
Conflict
204
No Content
410
Gone
205
Reset Content
411
Length Required
206
Partial Content
412
Precondition Failed
300
Multiple Choices
413
Request Entity Too Large
301
Moved Permanently
414
Request - URI Too Large
302
Found
415
Unsupported Media Type
303
See Other
416
Requested range not satisfiable
304
Not Modified
417
Expectation Failed
305
Use Proxy
500
Internal Server Error
307
Temporary Redirect
501
Not Implemented
400
Bad Request
502
Bad Gateway
401
Unauthorized
406
Not Acceptable
402
Payment Required
407
Proxy Authentication Required
403
Forbidden
503
Service Unavailable
469
Chapter 23 • Web Resource Monitors
Code
Description
Code
Description
404
Not Found
504
Gateway Timeout
405
Method Not Allowed
505
HTTP Version not supported
For more information on the above status codes and their descriptions, see
http://www.w3.org/Protocols/rfc2616/rfc2616-sec10.html#sec10.
470
24
Run-Time and Transaction Monitoring
This chapter includes:
Concepts
➤
Run-Time Graphs Overview on page 472
➤
Transaction Monitor Graphs Overview on page 474
471
Chapter 24 • Run-Time and Transaction Monitoring
Concepts
Run-Time Graphs Overview
The Run-Time monitor provides information about the status of the Vusers
participating in the scenario, and the number and types of errors that the
Vusers generate. In addition, the Run-Time monitor provides the
User-Defined Data Points graph, which displays the real time values for
user-defined points in a Vuser script.
The Run-Time monitor is enabled by default—it automatically begins
monitoring Vusers at the start of a scenario.
You can view the following Run-Time monitor graphs during a scenario run:
Running Vusers Graph
The monitor’s Running Vusers graph provides information about the status
of the Vusers running in the current scenario on all load generator
machines. The graph shows the number of running Vusers, while the
information in the legend indicates the number of Vusers in each state.
The Status field of each Vuser displays the current status of the Vuser. The
following table describes each Vuser status.
472
Status
Description
Running
The total number of Vusers currently running on all load
generators.
Ready
The number of Vusers that completed the initialization
section of the script and are ready to run.
Chapter 24 • Run-Time and Transaction Monitoring
Status
Description
Finished
The number of Vusers that have finished running. This
includes both Vusers that passed and failed.
Error
The number of Vusers whose execution generated an error.
Check the Status field in the Vuser view or the Output
window for a complete explanation of the error.
User-Defined Data Points Graph
The User-Defined Data Points graph displays the real-time values of
user-defined data points. You define a data point in your Vuser script by
inserting an lr_user_data_point function at the appropriate place
(user_data_point for GUI Vusers and lr.user_data_point for Java Vusers).
Action1()
{
lr_think_time(1);
lr_user_data_point ("data_point_1",1);
lr_user_data_point ("data_point_2",2);
return 0;
}
For Vuser protocols that support the graphical script representations such as
Web and Oracle NCA, you insert a data point as a user-defined step. Data
point information is gathered each time the script executes the function or
step. For more information about data points, see the HP LoadRunner Online
Function Reference.
By default, LoadRunner displays all of the data points in a single graph. The
legend provides information about each data point. If desired, you can hide
specific data points using the legend below the graphs.
You can also view data points offline, after the completion of the scenario.
For more information, see the HP LoadRunner Analysis User Guide.
473
Chapter 24 • Run-Time and Transaction Monitoring
Error Statistics Graph
The monitor’s Error Statistics graph provides details about the number of
errors that accrue during each second of the scenario run. The errors are
grouped by error source—for example, the location in the script or the load
generator name.
Vusers with Errors Graph
The Vusers with Errors graph provides details about the number of Vusers
that generate errors during scenario execution. The errors are grouped by
error source.
Transaction Monitor Graphs Overview
The Transaction monitor displays the transaction rate and response time
during a scenario run. The Transaction monitor is enabled by default—it
automatically begins monitoring Vuser transactions at the start of a scenario
run. To conserve resources, you can disable the Transaction monitor from
the Controller.
You can view the following Transaction monitor graphs during a scenario
run:
474
➤
The Transaction Response Time graph shows the average response time of
transactions in seconds (y-axis) as a function of the elapsed time in the
scenario (x-axis).
➤
The Transactions per Second (Passed) graph shows the number of
successful transactions performed per second (y-axis) as a function of the
elapsed time in the scenario (x-axis).
➤
The Transactions per Second (Failed, Stopped) graph shows the number
of failed and stopped transactions per second (y-axis) as a function of the
elapsed time in the scenario (x-axis).
➤
The Total Transactions per Second (Passed) graph shows the total
number of completed, successful transactions per second (y-axis) as a
function of the elapsed time in the scenario (x-axis).
Chapter 24 • Run-Time and Transaction Monitoring
Note:
➤
If there are no transactions defined in your Vuser script or if no
transactions are being executed, no data will be displayed in the online
monitor graphs.
➤
To generate Web Page diagnostics for each transaction, configure the
Diagnostics options from the Controller.
475
Chapter 24 • Run-Time and Transaction Monitoring
476
25
System Resource Monitoring
This chapter includes:
Concepts
➤
System Resource Monitors Overview on page 478
➤
Windows Resource Monitoring on page 478
➤
UNIX Resource Monitoring on page 479
➤
Server Resource Monitoring on page 479
➤
SNMP Resource Monitoring on page 480
➤
SiteScope Resource Monitoring on page 481
➤
Firewall Server Performance Monitoring on page 481
Tasks
➤
How to Set up the UNIX Monitoring Environment on page 482
Reference
➤
Check Point FireWall-1 Performance Counters on page 485
➤
Server Resources Performance Counters on page 485
➤
UNIX Resources Performance Counters on page 486
➤
Windows Resource Performance Counters on page 488
➤
System Resource Monitors User Interface on page 491
477
Chapter 25 • System Resource Monitoring
Concepts
System Resource Monitors Overview
You use LoadRunner’s System Resource monitors to monitor a machine’s
system resource usage during a scenario run and isolate server performance
bottlenecks.
A primary factor in a transaction’s response time is its system resource usage.
Using the LoadRunner resource monitors, you can monitor the Windows,
UNIX, Server, SNMP, FireWall server, and SiteScope resources on a machine
during a scenario run, and determine why a bottleneck occurred on a
particular machine.
The resource monitors are automatically enabled when you execute a
scenario. However, you must specify the machine you want to monitor and
which resources to monitor for each machine. You can also add or remove
machines and resources during the scenario run.
Windows Resource Monitoring
The Windows Resources monitor shows the Windows resources measured
during the scenario run. Windows measurements correspond to the built-in
counters available from the Windows Performance Monitor.
By default, LoadRunner monitors Windows resources using the native
LoadRunner monitor engine.
If you are using the SiteScope monitor engine, ensure that SiteScope has
been installed on a server. You can install SiteScope on the same server as
the Controller, or on a dedicated server.
478
Chapter 25 • System Resource Monitoring
If you want to monitor a remote Windows server that does not use Windows
domain security, you must authenticate the Controller on the remote
Windows server. To authenticate the Controller, create an account, or
change the password of the account used to log on to the Controller so that
it matches the password and user name used to log on to the remote
monitored Windows machine. When the remote Windows machine
requests another machine’s resources, it sends the logged-in user name and
password of the machine requesting the resources.
UNIX Resource Monitoring
The UNIX Resources monitor shows the UNIX resources measured during
the scenario. This graph helps you determine the impact of Vuser load on
the various system resources.
The UNIX kernel statistics measurements include those available by the
rstatd daemon. For a description of the measurements, see "UNIX Resources
Performance Counters" on page 486.
Note: You must configure an rstatd daemon on all UNIX machines being
monitored. For information, refer to the UNIX man pages, or see "How to Set
up the UNIX Monitoring Environment" on page 482.
Server Resource Monitoring
The Server Resources monitor shows the resources of monitors (CPU, disk
space, memory, or applications) used on remote Windows and UNIX servers
measured during the scenario. This helps you determine the impact of Vuser
load on the various system resources.
The Server Resources monitor includes the following monitors:
➤
CPU Monitor. Monitors CPU usage.
➤
Disk Space Monitor. Monitors disk space.
479
Chapter 25 • System Resource Monitoring
➤
Memory Monitor. Monitors pages per second and percentage of virtual
memory used.
➤
Service Monitor. Verifies that specific processes are listed as running and
checks CPU usage.
To display server resource data during a scenario run, you need to first select
the desired measurements for the online monitor (from the Controller)
before running the scenario.
Server Resource Monitor Environment
➤
Ensure that SiteScope has been installed on a server. You can install
SiteScope on the same machine as the Controller, or on a dedicated
server.
➤
Verify that SiteScope is collecting the required data from the servers it is
monitoring. From the SiteScope Panel, select the monitor group polling
the Server Resource machines, and check that the monitor displays a list
of server measurements in the Status column.
SNMP Resource Monitoring
The SNMP Resource monitor shows statistics for a Windows or UNIX
machine using the Simple Network Management Protocol (SNMP). The
SNMP Resources monitor is available for monitoring any machine that runs
an SNMP agent, using the Simple Network Management Protocol (SNMP).
You can configure this monitor as a native LoadRunner SNMP monitor, or as
a SiteScope SNMP by MIB monitor. The native LoadRunner SNMP monitor
can only monitor up to 25 measurements.
480
Chapter 25 • System Resource Monitoring
SiteScope Resource Monitoring
The SiteScope Resources monitor graph shows the SiteScope resources
measured during the scenario run. The SiteScope monitor can measure
server, network, and processor performance counters. For detailed
information on the performance counters that SiteScope can monitor, refer
to the relevant SiteScope documentation.
Before setting up the SiteScope monitor, ensure that SiteScope has been
installed on a server. You can install SiteScope on the same machine as the
Controller, or on a dedicated server. If SiteScope is installed on a machine
other than the Controller, verify that the SiteScope machine is accessible
from the Controller machine.
Firewall Server Performance Monitoring
The Firewall server online monitor measures the performance of a Firewall
server during scenario execution, which enables isolation of server
performance bottlenecks.
The Check Point FireWall-1 monitor displays statistics about the resource
usage on Check Point's FireWall during the scenario run.
481
Chapter 25 • System Resource Monitoring
Tasks
How to Set up the UNIX Monitoring Environment
This task describes how to configure the UNIX environment before setting
up the UNIX monitor.
This task includes the following steps:
➤
"Verify whether the rstatd daemon is already configured" on page 482
➤
"Configure the rstatd daemon" on page 483
➤
"Configure the monitor for a UNIX machine over a firewall (optional)" on
page 483
➤
"Configure the monitor measurements in the Controller" on page 483
1 Verify whether the rstatd daemon is already configured
The rstatd daemon might already be configured, because when a machine
receives an rstatd request, the inetd on that machine automatically
activates the rstatd.
➤
The rup command reports various machine statistics, including rstatd
configuration. Run the following command on the UNIX machine to
view the machine statistics:
>rup host
➤
You can also use lr_host_monitor and see if it returns any relevant
statistics.
If the command returns meaningful statistics, the rstatd daemon is
already configured and activated. If not, or if you receive an error
message, the rstatd daemon is not configured.
482
Chapter 25 • System Resource Monitoring
2 Configure the rstatd daemon
If the rstatd daemon is not yet configured, follow these steps to configure
it:
a On the UNIX machine, run the command: su root
b Go to /etc/inetd.conf and look for the rstatd row (it begins with the
word rstatd). If it is commented out (with a #), remove the comment
directive, and save the file.
c From the command line, run:
kill -1 inet_pid
where inet_pid is the pid of the inetd process. This instructs the inetd
to rescan the /etc/inetd.conf file and register all daemons which are
uncommented, including the rstatd daemon.
d Run rup again.
If the command still does not indicate that the rstatd daemon is
configured, contact your system administrator.
3 Configure the monitor for a UNIX machine over a firewall
(optional)
To monitor a UNIX machine over a firewall, you must run a UNIX utility
called rpcinfo and identify the rstatd’s port number.
Run rpcinfo -p <hostname>. You will receive a list of all RPC servers
registered in the host’s portmapper, along with the port number. This list
will not change until rstatd is stopped and rerun.
Some firewalls allow you to open an RPC program number instead of a
port. In such cases, open program 100001. If are prompted to include a
version number, specify versions 3 and 4.
4 Configure the monitor measurements in the Controller
For task details, see "How to Set Up the Monitoring Environment –
Workflow" on page 443.
483
Chapter 25 • System Resource Monitoring
Click Add in the Resource Measurements on: <machine> section of the
UNIX Resources dialog box to open the UNIX Kernel Statistics dialog box
and select the available measurements and server properties. For more
information, see "UNIX Kernel Statistics Dialog Box" on page 495.
For a description of the available UNIX monitor measurements, see
"UNIX Resources Performance Counters" on page 486.
484
Chapter 25 • System Resource Monitoring
Reference
Check Point FireWall-1 Performance Counters
The following FireWall counters can be monitored:
Measurement
Description
fwRejected
The number of rejected packets.
fwDropped
The number of dropped packets.
fwLogged
The number of logged packets.
Server Resources Performance Counters
The following monitor measurements are available on the server machine:
Monitor
Measurements
Description
CPU Monitor
Utilization
Measures CPU utilization.
Disk Space Monitor
Disk space
Measures the percentage of disk
space used.
485
Chapter 25 • System Resource Monitoring
Monitor
Measurements
Description
Memory Monitor
MB free
Measures the amount of disk
space free, in MB.
Pages/sec
Measures the number of virtual
memory pages that are moved
between main memory and disk
storage.
Percent used
Measures the percentage of
memory and paging file space
used.
Services Monitor
Monitors processes locally or on
remote systems. Can be used to
verify that specific processes are
running.
UNIX Resources Performance Counters
The following default measurements are available for the UNIX machine:
486
Measurement
Description
Average load
Average number of processes simultaneously in
Ready state during the last minute
Collision rate
Collisions per second detected on the Ethernet
Context switches rate
Number of switches between processes or threads,
per second
CPU utilization
Percent of time that the CPU is utilized
Disk rate
Rate of disk transfers
Incoming packets error
rate
Errors per second while receiving Ethernet packets
Incoming packets rate
Incoming Ethernet packets per second
Interrupt rate
Number of device interrupts per second
Chapter 25 • System Resource Monitoring
Measurement
Description
Outgoing packets errors
rate
Errors per second while sending Ethernet packets
Outgoing packets rate
Outgoing Ethernet packets per second
Page-in rate
Number of pages read to physical memory, per
second
Page-out rate
Number of pages written to pagefile(s) and removed
from physical memory, per second
Paging rate
Number of pages read to physical memory or
written to pagefile(s), per second
Swap-in rate
Number of processes being swapped
Swap-out rate
Number of processes being swapped
System mode CPU
utilization
Percent of time that the CPU is utilized in system
mode
User mode CPU utilization
Percent of time CPU is utilized in user mode
487
Chapter 25 • System Resource Monitoring
Windows Resource Performance Counters
The following default measurements are available for Windows machines:
488
Object
Measurement
Description
System
% Total Processor
Time
The average percentage of time that all the
processors on the system are busy
executing non-idle threads. On a
multi-processor system, if all processors are
always busy, this is 100%, if all processors
are 50% busy this is 50% and if 1/4 of the
processors are 100% busy this is 25%. It
can be viewed as the fraction of the time
spent doing useful work. Each processor is
assigned an Idle thread in the Idle process
which consumes those unproductive
processor cycles not used by any other
threads.
System
File Data
Operations/sec
The rate at which the computer issues read
and write operations to file system devices.
This does not include File Control
Operations.
Chapter 25 • System Resource Monitoring
Object
Measurement
Description
Processor
% Processor Time
(Windows 2000)
The percentage of time that the processor is
executing a non-idle thread. This counter
was designed as a primary indicator of
processor activity. It is calculated by
measuring the time that the processor
spends executing the thread of the idle
process in each sample interval, and
subtracting that value from 100%. (Each
processor has an idle thread which
consumes cycles when no other threads are
ready to run). It can be viewed as the
percentage of the sample interval spent
doing useful work. This counter displays
the average percentage of busy time
observed during the sample interval. It is
calculated by monitoring the time the
service was inactive, and then subtracting
that value from 100%.
System
Processor Queue
Length
The instantaneous length of the processor
queue in units of threads. This counter is
always 0 unless you are also monitoring a
thread counter. All processors use a single
queue in which threads wait for processor
cycles. This length does not include the
threads that are currently executing. A
sustained processor queue length greater
than two generally indicates processor
congestion. This is an instantaneous count,
not an average over the time interval.
Memory
Page Faults/sec
This is a count of the page faults in the
processor. A page fault occurs when a
process refers to a virtual memory page
that is not in its Working Set in the main
memory. A page fault will not cause the
page to be fetched from disk if that page is
on the standby list (and hence already in
main memory), or if it is in use by another
process with which the page is shared.
489
Chapter 25 • System Resource Monitoring
490
Object
Measurement
Description
PhysicalDisk
% Disk Time
The percentage of elapsed time that the
selected disk drive is busy servicing read or
write requests.
Memory
Pool Nonpaged
Bytes
The number of bytes in the nonpaged pool,
a system memory area where space is
acquired by operating system components
as they accomplish their appointed tasks.
Nonpaged pool pages cannot be paged out
to the paging file. They remain in main
memory as long as they are allocated.
Memory
Pages/sec
The number of pages read from the disk or
written to the disk to resolve memory
references to pages that were not in
memory at the time of the reference. This
is the sum of Pages Input/sec and Pages
Output/sec. This counter includes paging
traffic on behalf of the system cache to
access file data for applications. This value
also includes the pages to/from non-cached
mapped memory files. This is the primary
counter to observe if you are concerned
about excessive memory pressure (that is,
thrashing), and the excessive paging that
may result.
System
Total Interrupts/
sec
The rate at which the computer is receiving
and servicing hardware interrupts. The
devices that can generate interrupts are the
system timer, the mouse, data
communication lines, network interface
cards, and other peripheral devices. This
counter provides an indication of how
busy these devices are on a computer-wide
basis. See also Processor:Interrupts/sec.
Chapter 25 • System Resource Monitoring
Object
Measurement
Description
Objects
Threads
The number of threads in the computer at
the time of data collection. Notice that this
is an instantaneous count, not an average
over the time interval. A thread is the basic
executable entity that can execute
instructions in a processor.
Process
Private Bytes
The current number of bytes that the
process has allocated that cannot be shared
with other processes.
System Resource Monitors User Interface
This section includes (in alphabetical order):
➤
Add Windows Resources Measurements Dialog Box on page 491
➤
Configuring SNMP by MIB Monitor Dialog Box on page 493
➤
UNIX Kernel Statistics Dialog Box on page 495
Add Windows Resources Measurements Dialog Box
This dialog box enables you to select the Windows resources to monitor. The
Windows resources correspond to the built-in counters available from the
Windows Performance Monitor.
To access
Right-click a graph > Add Measurements
In the Resource Measurements section of the Windows
Resources dialog, click Add.
Relevant tasks
"How to Set Up the Monitoring Environment –
Workflow" on page 443
491
Chapter 25 • System Resource Monitoring
User interface elements are described below:
UI Elements (A-Z)
Description
Displays a description of the selected counter.
Counters/
Measurements
The resource counter/measurement to monitor. Select
multiple counters using the CTRL key. For a list of
available measurements, see "Windows Resource
Performance Counters" on page 488.
Instances
If multiple instances of the selected counter are running,
select one or more instances to monitor for the selected
counter.
Object
The object to monitor on the specified Windows
machine.
CheckPoint FireWall-1 Dialog Box
This dialog box enables you to select the CheckPoint FireWall-1 server
resources to monitor using the Simple Network Management Protocol
(SNMP).
To access
Right-click a graph > Add Measurements
In the Resource Measurements section of the Monitored
Server Machine dialog, click Add.
492
Important
information
The CheckPoint FireWall-1 monitor can monitor up to
25 measurements.
Relevant tasks
"How to Set Up the Monitoring Environment –
Workflow" on page 443
Chapter 25 • System Resource Monitoring
User interface elements are described below:
UI Elements (A-Z)
Description
Adds the selected measurement to the monitor graph.
Hides the ID number and description of the selected
object
Displays an ID number and description of the selected
object.
CheckPoint
FireWall-1 SNMP
Objects
Select each required object and click
.
Configuring SNMP by MIB Monitor Dialog Box
This dialog box enables you to configure the SiteScope SNMP by MIB
monitor properties before you add monitor measurements.
To access
Right-click a graph > Add Measurements
In the Resource Measurements section of the Monitored
Server Machine dialog, click Add.
Important
information
Many of these properties are applicable for specific
versions of SNMP connections, as noted in the user
interface descriptions below.
Relevant tasks
"How to Set Up the Monitoring Environment –
Workflow" on page 443
493
Chapter 25 • System Resource Monitoring
User interface elements are described below:
UI Elements (A-Z)
Description
MIB File
The MIB file which contains the objects you are
interested in monitoring.
➤ If you select a specific MIB file, then only the objects
described in that MIB file are displayed.
➤ If you select All MIBs, then all objects retrieved from
the agent during the MIB traversal will be displayed.
➤ If no MIB information is available for an object, the
object is still displayed, but with no textual name or
description.
Note: To make this monitor aware of new or additional
MIBs, place new MIB files in the SiteScope/
templates.mib directory.
Port
The port to use when requesting data from the SNMP
agent.
Default: Port 161 is the port on which an SNMP agent
will typically be listening.
Retries
The number of times each SNMP GET request should be
retried before SiteScope considers the request to have
failed.
Default: 1 retry.
494
Server
The name of the server you want to monitor.
SNMP V3
Authentication
Password
The authentication password to use for version 3
connections.
SNMP V3
Authentication Type
The type of authentication to use for version 3
connections.
SNMP V3 Context
Engine ID
A hexadecimal string representing the Context Engine ID
to use for version 3 connections.
SNMP V3 Context
Name
The Context Name to use for version 3 connections.
Chapter 25 • System Resource Monitoring
UI Elements (A-Z)
Description
SNMP V3 Privacy
Password
The privacy password if DES privacy encryption is desired
for version 3 connections. Leave blank if you do not
require privacy.
SNMP V3 Username
The user name for version 3 connections.
SNMP Version
The version of SNMP to use when connecting.
Timeout
The total time, in seconds, that SiteScope should wait for
all SNMP requests (including retries) to complete.
Default: 5 seconds.
Update every
How frequently the monitor should read the server
statistics. The drop-down list to the right of the text box
lets you specify time increments of seconds, minutes,
hours, or days. You must specify a time increment of at
least 3 seconds.
Default: 3 seconds.
V1/V2 Community
The community string for version 1 or 2 connections.
UNIX Kernel Statistics Dialog Box
The UNIX Kernel Statistics dialog box lets you select the UNIX
measurements and server properties to monitor.
To access
Right-click a graph > Add Measurements.
In the UNIX Resource Measurements section of the UNIX
Resources dialog, click Add.
Important
information
Ensure that the rstatd daemon is correctly configured and
running on the monitored UNIX machine.
Relevant tasks
➤ "How to Set up the UNIX Monitoring Environment"
on page 482
➤ "How to Set Up the Monitoring Environment –
Workflow" on page 443
495
Chapter 25 • System Resource Monitoring
User interface elements are described below:
UI Elements (A-Z)
Description
Available
Measurements
Select the measurements you want to add. To select more
than one measurement, use the CTRL key.
For a list of available measurements, see "UNIX Resources
Performance Counters" on page 486.
Description
496
Displays a description of the selected measurement.
26
Network Delay Monitoring
This chapter includes:
Concepts
➤
Network Monitoring Overview on page 498
Tasks
➤
How to Set Up the Network Monitoring Environment on page 500
➤
How to Configure the UNIX Source Machine for Network Monitoring
on page 502
Reference
➤
Network Delay Monitoring User Interface on page 505
Troubleshooting and Limitations on page 510
497
Chapter 26 • Network Delay Monitoring
Concepts
Network Monitoring Overview
Network configuration is a primary factor in the performance of
applications. A poorly designed network can slow client activity to
unacceptable levels.
You use Network monitoring to determine whether your network is causing
a delay in the scenario. You can also determine the problematic network
segment.
In a true Web or client/server system, there are many network segments. A
single network segment with poor performance can affect the entire system.
The following diagram shows a typical network. To go from the server
machine to the Vuser machine, data must travel over several segments.
The Network Delay Time monitor shows the delays for the complete path
between the source and destination machines (for example the database
server and Vuser host). The graph maps the delay as a function of the
elapsed scenario time. Each defined path is represented by a separate line
with a different color in the graph.
To measure network performance, the Network monitor sends packets of
data across the network. When a packet returns, the monitor calculates the
time it takes for the packet to go to the requested node and return. This time
is the delay which appears in the Network Delay Time graph.
498
Chapter 26 • Network Delay Monitoring
Note: The delays from the source machine to each of the nodes are
measured concurrently, yet independently. It is therefore possible that the
delay from the source machine to one of the nodes could be greater than the
delay for the complete path between the source and destination machines.
499
Chapter 26 • Network Delay Monitoring
Tasks
How to Set Up the Network Monitoring Environment
This task describes how to prepare your environment for network
monitoring.
This task includes the following steps:
➤
"Prerequisites" on page 500
➤
"Configure the UNIX source machine - optional" on page 500
➤
"Configure the firewall between the source and destination machines Optional" on page 501
➤
"Specify the network monitor paths" on page 502
1 Prerequisites
To enable network monitoring, you must install the LoadRunner agent on
the source machine. You do not have to install the LoadRunner agent on
the destination machine.
To run the Network monitor, you must have administrator privileges on
the Windows source machine (unless you are using the ICMP protocol).
2 Configure the UNIX source machine - optional
You can run the Network monitor on UNIX source machines, using UDP
or ICMP. Before running the Network monitor from a UNIX source
machine, configure the source machine. For task details, see "How to
Configure the UNIX Source Machine for Network Monitoring" on
page 502.
500
Chapter 26 • Network Delay Monitoring
3 Configure the firewall between the source and destination
machines - Optional
If you are monitoring a network in which there are firewalls between the
source and the destination machines, you must configure the firewalls to
allow the network data packets to reach their destinations.
➤
If you are using the TCP protocol, the firewall that protects the
destination machine should not block outgoing
ICMP_TIMEEXCEEDED packets (packets that are sent outside the
firewall from the machine). In addition, the firewall protecting the
source machine should allow ICMP_TIMEEXCEEDED packets to enter,
as well as TCP packets to exit.
➤
If you are using the ICMP protocol, the destination machine’s firewall
should not block incoming ICMP_ECHO_REQUEST packets, or
outgoing ICMP_ECHO_REPLY and ICMP_ECHO_TIMEEXCEEDED
packets. In addition, the firewall protecting the source machine should
allow ICMP_ECHO_REPLY and ICMP_ECHO_TIMEEXCEEDED packets
to enter, and ICMP_ECHO_REQUEST packets to exit.
➤
If you are using the UDP protocol, ensure that the UDP protocol can
access the destination machine from the source machine. The
destination machine’s firewall should not block outgoing
ICMP_DEST_UNREACHABLE and ICMP_ECHO_TIMEEXCEEDED
packets. In addition, the firewall protecting the source machine should
allow ICMP_DEST_UNREACHABLE and
ICMP_ECHO_TIMEEXCEEDED packets to enter.
Note: To run the Network Delay monitor when there are firewalls
between the Controller and the source machine, you must configure the
LoadRunner agent, MI Listener, and Network Delay monitor for
monitoring over a firewall.
501
Chapter 26 • Network Delay Monitoring
4 Specify the network monitor paths
In the Controller Run tab graph tree view, select the Network Delay Time
graph and drag it into the right pane. Right-click the graph and select Add
Measurements. Define the paths using the following three dialog boxes:
a Add source and destinations machines. For details, see the "Network
Delay Time Dialog Box" on page 506.
b Define the network monitor path. For details, see the "Adding
Destination Machines for Network Delay Monitoring Dialog Box" on
page 505.
c Configure the monitor settings for the defined path. For details, see
the "Network Monitor Settings for Defined Path Dialog Box" on
page 508.
How to Configure the UNIX Source Machine for Network
Monitoring
This task describes how to configure a UNIX source machine before running
the network monitor.
This task includes the following steps:
➤
"Assign permissions where LoadRunner is installed locally." on page 502
➤
"Assign permissions where LoadRunner is installed on the network." on
page 503
➤
"Connect to the Unix Source Machine Through RSH" on page 504
➤
"Connect to the Unix Source Machine Through the Agent" on page 504
1 Assign permissions where LoadRunner is installed locally.
Follow these steps to assign root permissions to the merc_webtrace
process:
a Log in to the source machine as root.
b Type: cd <LoadRunner_installation>/bin to change to the bin directory.
502
Chapter 26 • Network Delay Monitoring
c Type: chown root merc_webtrace to make the root user the owner of
the merc_webtrace file.
d Type: chmod +s merc_webtrace to add the s-bit to the file permissions.
e To verify, type ls -l merc_webtrace. The permissions should look like
this: -rwsrwsr-x.
2 Assign permissions where LoadRunner is installed on the
network.
In a LoadRunner network installation, the merc_webtrace process is on
the network, not on the source machine disk. The following procedure
copies the merc_webtrace file to the local disk, configures mdrv.dat to
recognize the process, and assigns root permissions to merc_webtrace:
a Copy merc_webtrace from <LoadRunner_installation>/bin to
anywhere on the local disk of the source machine. For example, to
copy the file to the /local/<LoadRunner> directory, type: cp /net/tools/
LoadRunner_installation/bin/merc_webtrace /local/<LoadRunner>
Note: All of the source machines that use the same network
installation must copy merc_webtrace to the identical directory path
on their local disk (for example, /local/<LoadRunner>), since all of them
use the same mdrv.dat.
b Add the following line to the <LoadRunner_installation>/dat/
mdrv.dat file, in the [monitors_server] section:
ExtCmdLine=-merc_webtrace_path /local/xxx
c Log in to the source machine as root.
d Type: cd LoadRunner_installation/bin to change to the bin directory.
e Type: chown root merc_webtrace to make the root user the owner of the
merc_webtrace file.
f Type: chmod +s merc_webtrace to add the s-bit to the file permissions.
g To verify, type ls -l merc_webtrace. The permissions should look like:
-rwsrwsr-x.
503
Chapter 26 • Network Delay Monitoring
3 Connect to the Unix Source Machine Through RSH
Follow these instructions if the Controller is connected to the source
machine through RSH (default connection mode). In this case you do not
need to activate the agent daemon.
Before running the Network monitor the first time, you enter an
encrypted user name and password in the Network monitor configuration
file.
a On the Windows taskbar, click Start, point to Programs > LoadRunner
> Tools, and click Password Encoder. The Password Encoder window
opens.
b In the Password box, type your RSH user name and password,
separated by a vertical bar symbol. For example, myname|mypw.
c Click Generate. An encoded string is displayed in the Encoded string
field.
d Click Copy to copy the encoded string to the clipboard.
e Add the following line to the <LoadRunner_installation>/dat/
monitors/ndm.cfg file, in the [hosts] section:
Host = <encrypted string copied from clipboard>
f Close and open the current scenario. LoadRunner will read the
updated configuration file and recognize the source machine for
monitoring.
4 Connect to the Unix Source Machine Through the Agent
Follow these instructions for activating agent daemon on the source
machine if the Controller is not connected to the source machine
through RSH.
a Type m_daemon_setup -install from the <LoadRunner_installation>/bin
directory.
b Make sure that the agent daemon is running whenever you activate
the Network monitor.
c To stop the Network Delay Monitor agent daemon, type
m_daemon_setup -remove.
504
Chapter 26 • Network Delay Monitoring
Reference
Network Delay Monitoring User Interface
This section includes (in alphabetical order):
➤
Adding Destination Machines for Network Delay Monitoring Dialog Box
on page 505
➤
Network Delay Time Dialog Box on page 506
➤
Network Delay Time Graph on page 508
➤
Network Monitor Settings for Defined Path Dialog Box on page 508
Adding Destination Machines for Network Delay
Monitoring Dialog Box
This dialog box enables you to add destination machines for network delay
monitoring, and configure additional network monitor settings.
To access
Network Delay Time dialog box > To machine(s) section>
Click Add
Important
information
The Network Delay Time Monitor cannot be configured
to work in TCP mode on Windows XP SP2 or Vista.
Relevant tasks
"How to Set Up the Network Monitoring Environment"
on page 500
505
Chapter 26 • Network Delay Monitoring
User interface elements are described below:
UI Elements (A-Z)
Description
Enter the name or URL of the machine at the final
destination of the path you want to monitor in the New
Machine Name dialog box. Repeat this for each path you
want to monitor.
Note: If the destination machine is localhost, enter the
local machine’s name and not localhost.
Deletes the destination machine, to remove this path
from the monitor graph.
Renames the destination machine.
Opens the Configuring Network Monitor Settings for
Defined Path dialog box.
From Machine
Displays the name of the source machine.
To Machines
Displays the names or URLs of the destination machines.
Network Delay Time Dialog Box
This dialog box enables you to select the network path you want to monitor.
To access
Right-click the Network Delay Time graph and select Add
Measurements.
This dialog appears only when you add measurements
for the first time.
506
Important
information
To run the Network monitor, you must have
administrator privileges on the source machine (unless
you are using the ICMP protocol).
Relevant tasks
"How to Set Up the Network Monitoring Environment"
on page 500
Chapter 26 • Network Delay Monitoring
User interface elements are described below:
UI Elements (A-Z)
Description
Monitor the network
delay from machine
Displays the name of the machine from which network
monitoring begins (source machine).
To add a machine, click
and specify the server
name or IP address and machine platform.
Repeat this for each path you want to monitor.
Important: If there is a firewall between the Controller
machine and the source machine, enter the server name
or IP address of the source machine according to the
following format:
<MI Listener machine>:<source machine local key>
where where source machine local key is the Local
Machine Key that you chose when configuring the
LoadRunner agent on the source machine. (See “Agent
Configuration Settings” on page 355.)
Example: 12.12.12.3:vds
To machine(s)
Displays the network path in the format of
sourcemachine -> destination machine. To add a new
destination machine, click
and define the
machine in the Adding Destination Machines for
Network Delay Monitoring dialog box.
507
Chapter 26 • Network Delay Monitoring
Network Delay Time Graph
The Network Delay Time graph shows the delay for the complete path
between the source and destination machines (y-axis) as a function of the
elapsed scenario time (x-axis).
Each path defined in the Add Destination Machines for Network Delay
Monitoring dialog box is represented by a separate line with a different color
in the graph.
Network Monitor Settings for Defined Path Dialog Box
This dialog box enables you to set the network protocol, port, monitoring
frequency, and monitoring packet retries.
508
To access
Add Destination Machines for Newtork Delay
Monitoring > Click Properties.
Relevant tasks
"How to Set Up the Network Monitoring Environment"
on page 500
Chapter 26 • Network Delay Monitoring
User interface elements are described below:
UI Elements (A-Z)
Description
Monitor Settings
➤ Send request using X protocol. Select the network
protocol you want the monitor to use: TCP, UDP, or
ICMP. It is recommended that you use the default
protocol. The default in Windows is TCP, and in UNIX
is UDP.
Note: When you use TCP or UDP protocols,
administrator privileges are required on the source
machine.
➤ Send request to port. Enter the port number to be
used by the network path.
➤ Enable display of network nodes by DNS names.
Enables you to view the DNS name of each node along
the network path, in addition to its IP address.
Note: Selecting this option will decrease the speed of
the Network monitor.
509
Chapter 26 • Network Delay Monitoring
UI Elements (A-Z)
Description
Monitoring
Frequency
Send next packet X milliseconds after receipt of previous
packet. Select the number of milliseconds the monitor
should wait between receiving a packet and sending out
the next packet.
Default: 3000 milliseconds.
Note: If you have a long, steady scenario, you can
increase the interval by several seconds.
Monitoring Packet
Retries
➤ Wait X seconds for packet to return before retrying.
Select the maximum number of seconds that the
monitor should wait for a packet to return before it
retries to send the packet.
Default: 3 seconds.
Note: If your network is very large and loaded (an
internet connection with a low capacity), you should
increase the value by several seconds. If you have a
small network (such as a LAN), you can decrease the
value.
➤ Number of retries. Select the number of times the
monitor should try resending a packet to a node if the
packet is not initially returned.
Default: 0.
Troubleshooting and Limitations
This section describes troubleshooting for the Network Delay monitor.
If monitoring is unsuccessful and LoadRunner cannot locate the source or
destination machines, make sure that the specified machines are available to
your machine. Perform a “ping” operation. At the command line prompt,
type:
ping server_name
To check the entire network path, use the trace route utility to verify that
the path is valid.
510
Chapter 26 • Network Delay Monitoring
For Windows, type tracert <server_name>.
For UNIX, type traceroute <server_name>.
If the monitoring problem persists once you verify that the machines are
accessible and that the network path is valid, perform the following
procedures:
1 If you are using the TCP protocol, run <LoadRunner root
folder>\bin\webtrace.exe from the source machine to determine
whether the problem is related to the Controller, or the WebTrace
technology on which the Network Delay monitor is based. If you are
using the UDP or ICMP protocols, the problem must be related to the
Controller and not WebTrace, since these protocols are not WebTrace
technology-based.
2 If you receive results by running webtrace.exe, the problem is related to
the Controller. Verify that the source machine is not a UNIX machine,
and contact the Customer Support Web site with the following
information:
➤
the Controller log file, drv_log.txt, located in the temp directory of the
Controller machine.
➤
the traceroute_server log file, located on the source machine.
➤
the debug information located in the TRS_debug.txt and
WT_debug.txt files in the path directory. These files are generated by
adding the following line to the [monitors_server] section of the
<LoadRunner root folder>\dat\mdrv.dat file, and rerunning the
Network monitor:
ExtCmdLine=-traceroute_debug path
3 If you do not receive results by running webtrace.exe, the problem is
related to the WebTrace technology, on which the Network Delay
monitor is based. Perform the following procedures on the source
machine:
➤
Verify that the packet.sys file (the Webtrace driver) exists in the
WINNT\system32\drivers directory.
511
Chapter 26 • Network Delay Monitoring
512
➤
Check whether a driver (such as “Cloud” or “Sniffer”) is installed on
top of the network card driver. If so, remove it and run WebTrace
again.
➤
Verify that there are administrator permissions on the machine.
➤
Using ipconfig /all, check that only one IP address is assigned to the
network card. WebTrace does not know how to handle multiple IP
addresses assigned to the same card (IP spoofing).
➤
Check the number of network cards installed. Run webtrace –devlist to
receive a list of the available network cards.
➤
If there is more than one card on the list, run webtrace -dev
<dev_name> <destination>, where <dev_name> is one of the network
card names shown in the list. If you discover that WebTrace is binding
to the wrong card, you can use webtrace set_device <dev_name> to set
a registry key that instructs WebTrace to use a specified card instead of
the default one.
➤
Verify that the network card is of the Ethernet type.
➤
Contact the Customer Support Web site with the output of
webtrace.exe –debug (for example, webtrace.exe –debug
www.merc-int.com) and ipconfig /all on the machine.
27
Web Server Resource Monitoring
This chapter includes:
Concepts
➤
Web Server Resource Monitoring Overview on page 514
Tasks
➤
How to change the Apache default server properties on page 515
Reference
➤
Apache Performance Counters on page 516
➤
Microsoft IIS Performance Counters on page 516
➤
Web Server Resource Monitoring User Interface on page 517
513
Chapter 27 • Web Server Resource Monitoring
Concepts
Web Server Resource Monitoring Overview
Web Server Resource monitors provide you with information about the
resource usage of the Microsoft IIS and Apache Web servers during scenario
execution. To obtain this data, you need to activate the online monitor for
the server and specify which resources you want to measure before
executing the scenario.
Note: Certain measurements or counters are especially useful for
determining server performance and isolating the cause of a bottleneck
during an initial stress test on a Web server. For more information about
these counters, see "Useful Counters for Stress Testing" on page 396.
514
Chapter 27 • Web Server Resource Monitoring
Tasks
How to change the Apache default server properties
This task describes how to modify the Apache default server properties that
are defined in the monitor configuration file.
1 Open the apache.cfg file in the <LoadRunner root folder>\dat\monitors
directory.
2 Edit the following parameters after the Delimiter=: statement:
InfoURL. Server statistics information URL
ServerPort. Server port number
SamplingRate. Rate (milliseconds) at which the LoadRunner monitor will
poll the server for the statistics information. If this value is greater than
1000, LoadRunner will use it as its sampling rate. Otherwise, it will use
the sampling rate defined in the Monitors tab of the Options dialog box.
3 Save and close the file.
515
Chapter 27 • Web Server Resource Monitoring
Reference
Apache Performance Counters
The following table describes the measurements and server properties that
can be monitored on the Apache Web server during the scenario run:
Measurement
Description
# Busy Servers
The number of servers in the Busy state
# Idle Servers
The number of servers in the Idle state
Apache CPU Usage
The percentage of time the CPU is utilized by the
Apache server
Hits/sec
The HTTP request rate
KBytes Sent/sec
The rate at which data bytes are sent from the Web
server
Microsoft IIS Performance Counters
The following table describes the measurements and server properties that
can be monitored on the Microsoft IIS Web server during the scenario run:
516
Object
Measurement
Description
Web
Service
Bytes Sent/sec
The rate at which the data bytes are sent by the
Web service
Web
Service
Bytes Received/
sec
The rate at which the data bytes are received by
the Web service
Web
Service
Get Requests/sec
The rate at which HTTP requests using the GET
method are made. Get requests are generally
used for basic file retrievals or image maps,
though they can be used with forms.
Chapter 27 • Web Server Resource Monitoring
Object
Measurement
Description
Web
Service
Post Requests/sec
The rate at which HTTP requests using the POST
method are made. Post requests are generally
used for forms or gateway requests.
Web
Service
Maximum
Connections
The maximum number of simultaneous
connections established with the Web service
Web
Service
Current
Connections
The current number of connections established
with the Web service
Web
Service
Current
NonAnonymous
Users
The number of users that currently have a
non-anonymous connection using the Web
service
Web
Service
Not Found Errors/
sec
The rate of errors due to requests that could not
be satisfied by the server because the requested
document could not be found. These are
generally reported to the client as an HTTP 404
error code.
Process
Private Bytes
The current number of bytes that the process
has allocated that cannot be shared with other
processes.
Web Server Resource Monitoring User Interface
This section includes (in alphabetical order):
➤
Apache Dialog Box on page 518
➤
MS IIS Dialog Box on page 519
517
Chapter 27 • Web Server Resource Monitoring
Apache Dialog Box
This dialog box enables you to configure the measurements and server
properties for the Apache monitor.
To access
Right-click a graph > Add Measurements
Click Add in the Resource Measurements section of
Apache dialog.
Relevant tasks
How to Set Up the Monitoring Environment – Workflow
How to change the Apache default server properties
User interface elements are described below:
UI Elements (A-Z)
Description
Adds the selected measurement to the list of
measurements in the Measurements on <machine>
section of the Apache dialog box.
Available
Measurements
Select the counter to monitor Select multiple
measurements using the CTRL key.
Description
Displays a description of the selected measurement.
Server Properties Port
Type the port number of the Apache server
Server Properties URL
Server statistics information URL. To verify the statistics
information URL, try to view it through the browser
using the following format:
http://<server_name/IP address>:<port_number>/
server-status?auto
For example: http://stimpy:80/server-status?auto.
Note: To monitor an Apache server through a firewall,
use the Web server port (by default, port 80).
Format: Enter the server statistics information URL,
without the server name.
Default value: /server-status?auto
Note: The default port number and URL can vary from
one server to another. Please consult your Web server
administrator.
518
Chapter 27 • Web Server Resource Monitoring
MS IIS Dialog Box
This dialog box enables you to configure the measurements for the MS IIS
monitor.
To access
Right-click a graph > Add Measurements
Click Add in the Resource Measurements section of
MS-IIS dialog.
Relevant tasks
How to Set Up the Monitoring Environment – Workflow
User interface elements are described below:
UI Elements (A-Z)
Description
Adds the selected measurement to the list of
measurements in the Measurements on <machine>
section of the MS IIS dialog box.
Counters
Select a resource counter to monitor. Select multiple
counters using the CTRL key. For a definition of each
counter, click Explain.
Instances
If multiple instances of the selected counter are running,
select one or more instances to monitor for the selected
counter.
Object
Select the Web Service object being monitored on the
specified machine.
519
Chapter 27 • Web Server Resource Monitoring
520
28
Web Application Server Resource
Monitoring
This chapter includes:
Concepts
➤
Web Application Server Resource Monitoring Overview on page 522
Tasks
➤
How to Set Up the WebLogic (SNMP) Monitoring Environment
on page 523
Reference
➤
MS Active Server Pages Performance Counters on page 525
➤
WebLogic (SNMP) Performance Counters on page 525
➤
Web Application Server Resource Monitoring User Interface on page 527
521
Chapter 28 • Web Application Server Resource Monitoring
Concepts
Web Application Server Resource Monitoring Overview
You use LoadRunner’s Web Application Server Resource monitors to monitor
Microsoft Active Server Pages and Weblogic (SNMP) Web application servers
during a scenario run and isolate application server performance
bottlenecks.
522
➤
The Microsoft Active Server Pages (ASP) monitor displays statistics about
the resource usage on the ASP server during the scenario run.
➤
The WebLogic (SNMP) monitor displays statistics about the resource usage
on the WebLogic (SNMP) server (version 6.0 and earlier) during the
scenario run. The WebLogic (SNMP) monitor uses SNMP to retrieve server
statistics.
Chapter 28 • Web Application Server Resource Monitoring
Tasks
How to Set Up the WebLogic (SNMP) Monitoring
Environment
This task describes the working order for setting up the monitoring
environment.
This task includes the following steps:
➤
"Prerequisites" on page 523
➤
"Set the port" on page 523
➤
"Configure the WebLogic (SNMP) monitor from the Controller" on
page 524
1 Prerequisites
➤
Verify that a version prior to WebLogic 6.0 is installed on the server.
➤
Install and activate the SNMP agent on the server.
For instructions on installing the SNMP agent, see http://
edocs.bea.com/wls/docs51/admindocs/snmpagent.html.
2 Set the port
To monitor a WebLogic (SNMP) server, use port 161 or 162, depending on
the configuration of the agent.
To define a different default port for your WebLogic server, modify the
configuration file, snmp.cfg, located in <LoadRunner root
folder>\dat\monitors. For example, if the port used by the SNMP agent
on your WebLogic server is 8888, you should edit the snmp.cfg file as
follows:
; WebLogic
[cm_snmp_mon_isp]
port=8888
523
Chapter 28 • Web Application Server Resource Monitoring
3 Configure the WebLogic (SNMP) monitor from the Controller
For task details (beginning with step 2), see "How to Set Up the
Monitoring Environment – Workflow" on page 443.
524
Chapter 28 • Web Application Server Resource Monitoring
Reference
MS Active Server Pages Performance Counters
The following table describes the default counters that can be monitored:
Measurement
Description
Errors per Second
The number of errors per second.
Requests Wait Time
The number of milliseconds the most recent request
was waiting in the queue.
Requests Executing
The number of requests currently executing.
Requests Queued
The number of requests waiting in the queue for
service.
Requests Rejected
The total number of requests not executed because
there were insufficient resources to process them.
Requests Not Found
The number of requests for files that were not
found.
Requests/sec
The number of requests executed per second.
Memory Allocated
The total amount of memory, in bytes, currently
allocated by Active Server Pages.
Errors During Script
Run-Time
The number of failed requests due to run-time
errors.
Sessions Current
The current number of sessions being serviced.
Transactions/sec
The number of transactions started per second.
WebLogic (SNMP) Performance Counters
The following tables describe the measurements and server properties that
can be monitored.
525
Chapter 28 • Web Application Server Resource Monitoring
Server Table
The Server Table lists all WebLogic (SNMP) servers that are being monitored
by the agent. A server must be contacted or be reported as a member of a
cluster at least once before it will appear in this table. Servers are only
reported as a member of a cluster when they are actively participating in the
cluster, or shortly thereafter.
526
Measurement
Description
ServerState
The state of the WebLogic server, as inferred
by the SNMP agent. Up implies that the agent
can contact the server. Down implies that the
agent cannot contact the server.
ServerLoginEnable
This value is true if client logins are enabled
on the server.
ServerMaxHeapSpace
The maximum heap size for this server, in KB
ServerHeapUsedPct
The percentage of heap space currently in use
on the server
ServerQueueLength
The current length of the server execute
queue
ServerQueueThroughput
The current throughput of execute queue,
expressed as the number of requests processed
per second
ServerNumEJBDeployment
The total number of EJB deployment units
known to the server
ServerNumEJBBeansDeployed
The total number of EJB beans actively
deployed on the server
Chapter 28 • Web Application Server Resource Monitoring
Listen Table
The Listen Table is the set of protocols, IP addresses, and port combinations
on which servers are listening. There will be multiple entries for each server:
one for each protocol, ipAddr, port combination. If clustering is used, the
clustering-related MIB objects will assume a higher priority.
Measurement
Description
ListenPort
Port number.
ListenAdminOK
True if admin requests are allowed on this
(protocol, ipAddr, port) combination;
otherwise false.
ListenState
Listening if the (protocol, ipAddr, port)
combination is enabled on the server; Not
Listening if it is not. The server may be
listening but not accepting new clients if its
server Login Enable state is false. In this case,
existing clients will continue to function, but
new ones will not.
Web Application Server Resource Monitoring User
Interface
This section includes (in alphabetical order):
➤
WebLogic (SNMP) Resources Dialog Box on page 528
➤
Microsoft Active Server Pages Dialog Box on page 528
527
Chapter 28 • Web Application Server Resource Monitoring
WebLogic (SNMP) Resources Dialog Box
This dialog box lets you select the items to monitor on the WebLogic
(SNMP) application server.
To access
Right-click a graph > Add Measurements
Click Add in the Resource Measurements section of the
WebLogic (SNMP) dialog box
Relevant tasks
How to Set Up the WebLogic (SNMP) Monitoring
Environment
How to Set Up the Monitoring Environment – Workflow
See also
WebLogic (SNMP) Performance Counters
User interface elements are described below:
UI Elements (A-Z)
Description
Adds the selected object to the list of measurements.
Note: The WebLogic (SNMP) monitor can only monitor
up to 25 measurements.
Explain >>
Displays a description of the selected object
WebLogic (SNMP)
objects
A tree for browsing the list of available measurements.
You can select only one object at a time in the tree.
Microsoft Active Server Pages Dialog Box
This dialog box enables you to select the items to monitor on the MS Active
Server Pages application server.
To access
Right-click a graph > Add Measurements
Click Add in the Resource Measurements section of
Microsoft Active Server Pages dialog.
528
Relevant tasks
How to Set Up the Monitoring Environment – Workflow
See also
MS Active Server Pages Performance Counters
Chapter 28 • Web Application Server Resource Monitoring
User interface elements are described below:
UI Elements (A-Z)
Description
Adds the selected measurement to the list of
measurements in the Measurements on <machine>
section of the Microsoft Active Server Pages dialog box.
Counters
Select a resource counter to monitor. Select multiple
counters using the CTRL key. For a definition of each
counter, click Explain.
Instances
If multiple instances of the selected counter are running,
select one or more instances to monitor for the selected
counter.
Object
Select the object being monitored on the specified
machine.
529
Chapter 28 • Web Application Server Resource Monitoring
530
29
Database Resource Monitoring
This chapter includes:
Concepts
➤
Database Resource Monitoring Overview on page 532
Tasks
➤
How to Set Up the DB2 Monitoring Environment on page 533
➤
How to Set Up the Oracle Monitoring Environment on page 534
Reference
➤
DB2 Performance Counters on page 538
➤
Oracle Performance Counters on page 552
➤
SQL Server Performance Counters on page 554
➤
Configuring Oracle JDBC Monitor Dialog Box on page 555
531
Chapter 29 • Database Resource Monitoring
Concepts
Database Resource Monitoring Overview
LoadRunner’s Database Server Resource monitors measure database resource
usage statistics for DB2, Oracle, or SQL Servers during a scenario run. You
use these monitors to isolate database server performance bottlenecks.
The DB2 monitor is a native LoadRunner monitor. The SQL monitor can be
configured as a native LoadRunner monitor, or as a SiteScope monitor.
There are two methods of monitoring Oracle database servers:
➤
The Oracle native LoadRunner monitor displays information from Oracle
V$ tables: Session statistics, V$SESSTAT, system statistics, V$SYSSTAT, and
other table counters defined by the user in the custom query.
➤
The SiteScope Oracle JDBC Monitor monitors the server performance
statistics from Oracle Database servers. You can monitor multiple
parameters or counters with a single monitor instance. This allows you to
watch server loading for performance, availability, and capacity planning.
You can create a separate Oracle JDBC Monitor instance for each Oracle
database server in your environment.
Before defining the monitoring measurements for the DB2 and Oracle
monitors in the Controller, you must set up the monitoring environment
on the database server:
➤
For details about the DB2 monitor configuration, see "How to Set Up the
DB2 Monitoring Environment" on page 533.
➤
For details about the Oracle monitor configuration, see "How to Set Up
the Oracle Monitoring Environment" on page 534.
You then enable each database resource monitor from the Controller by
selecting the counters you want the monitor to measure.
532
Chapter 29 • Database Resource Monitoring
Tasks
How to Set Up the DB2 Monitoring Environment
This task describes how to set up the monitor environment before
monitoring a DB2 database server.
This task includes the following steps:
➤
"Prerequisites" on page 533
➤
"Connect to the DB2 server and define the monitor client" on page 533
➤
"Add the Database Manager instance to the server" on page 534
➤
"Configure the DB2 monitor from the Controller" on page 534
1 Prerequisites
Install all the DB2 client files and libraries on the Controller machine.
2 Connect to the DB2 server and define the monitor client
a Select Start > Programs > DB2 for Windows NT > Control Center.
b Enter your DB2 server username and password (with administrative
privileges).
c In the console that opens, right-click Systems, and select Add.
d Enter the following settings in the dialog box:
➤
System Name. <server name>
➤
Remote Instance. DB2
➤
Host Name. <server name>
➤
Service Name. The DB2 server port. The default value is 50000.
e Click Retrieve, and then OK.
533
Chapter 29 • Database Resource Monitoring
Note: If you receive an error message after clicking Retrieve, repeat
steps c and d, and click OK.
3 Add the Database Manager instance to the server
You can only work with a single Database Manager instance during each
monitoring session.
a Expand the <server name> node in the console tree.
b Right-click Instance, and select Add.
c Enter the following settings in the dialog box:
➤
Remote Instance. DB2
➤
Instance Name. the database instance to be called from the
Controller
➤
Host Name. <server name>
➤
Service Name. The DB2 server port. The default value is 50000.
d Click OK and close the Control Center.
4 Configure the DB2 monitor from the Controller
For task details (beginning with step 2), see "How to Set Up the
Monitoring Environment – Workflow" on page 443.
How to Set Up the Oracle Monitoring Environment
This task describes how to set up the monitor environment before
monitoring an Oracle database server using the native LoadRunner monitor.
Note: If a problem occurs in setting up the Oracle environment, check the
Oracle server to view the error messages.
534
Chapter 29 • Database Resource Monitoring
This task includes the following steps:
➤
"Prerequisites" on page 535
➤
"Configure the Oracle client/server connection" on page 535
➤
"Connect to the monitored server machine and verify the connection" on
page 536
➤
"Modify the monitoring sample rate (optional)" on page 537
➤
"Configure the Oracle monitor from the Controller" on page 537
1 Prerequisites
➤
Ensure that the Oracle client libraries are installed on the Controller
machine.
➤
Verify that %OracleHome%\bin is included in the path environment
variable. If it is not, add it.
➤
Ensure that the registries are updated for the version of Oracle that you
are using and that they have the following key:
HKEY_LOCAL_MACHINE\SOFTWARE\ORACLE
➤
Verify that the Oracle server you want to monitor is up and running.
Note that it is possible to monitor several Oracle database servers
concurrently.
Note: Only the 32-bit Oracle client should be installed on the Controller
machine running the Oracle monitor. If you have a 16-bit and a 32-bit
Oracle client installation on the Controller machine, the 16-bit
installation should be uninstalled.
2 Configure the Oracle client/server connection
Set the connection parameters so the Oracle client (Controller machine)
can communicate with the Oracle server(s) you plan to monitor.
535
Chapter 29 • Database Resource Monitoring
On the Controller machine, set the following configuration parameter
either by editing the tnsnames.ora file in a text editor, or using the Oracle
service configuration tool (for example, Start > Programs >
Oracle for Windows NT > Oracle Net8 Easy Config):
➤
a new service name (TNS name) for the Oracle instance
➤
TCP protocol
➤
the host name (name of monitored server machine)
➤
the port number (usually 1521)
➤
the database SID (the default SID is ORCL)
For example:
3 Connect to the monitored server machine and verify the
connection
a Obtain a username and password for the service from your database
administrator, and ensure that the Controller has database
administrator privileges for the Oracle V$ tables (V$SESSTAT,
V$SYSSTAT, V$STATNAME, V$INSTANCE, V$SESSION).
b Verify connection with the Oracle server by performing tns ping from
the Controller machine.
Note: There may be a problem connecting if the Oracle server is
behind a DMZ/firewall that limits its communication to application
servers accessing it.
536
Chapter 29 • Database Resource Monitoring
c Run SQL*Plus from the Controller and attempt to log in to the Oracle
server(s) with the desired username/password/server combination.
d Type SELECT * FROM V$SYSSTAT to verify that you can view the
V$SYSSTAT table on the Oracle server. Use similar queries to verify that
you can view the V$SESSTAT, V$SESSION, V$INSTANCE,
V$STATNAME, and V$PROCESS tables on the server.
4 Modify the monitoring sample rate (optional)
To change the length of each monitoring sample (in seconds), edit the
dat\monitors\vmon.cfg file in the LoadRunner root folder. The default
rate is 10 seconds.
The minimum sampling rate for the Oracle Monitor is 10 seconds. If you
set the sampling rate at less than 10 seconds, the Oracle Monitor will
continue to monitor at 10 second intervals.
5 Configure the Oracle monitor from the Controller
For task details (beginning with step 2), see "How to Set Up the
Monitoring Environment – Workflow" on page 443.
537
Chapter 29 • Database Resource Monitoring
Reference
DB2 Performance Counters
This section includes:
➤
"DatabaseManager" on page 538
➤
"Database" on page 540
➤
"Application" on page 547
DatabaseManager
The following table lists the DatabaseManager counters:
538
Measurement
Description
rem_cons_in
The current number of connections initiated
from remote clients to the instance of the
database manager that is being monitored.
rem_cons_in_exec
The number of remote applications that are
currently connected to a database and are
currently processing a unit of work within the
database manager instance being monitored.
local_cons
The number of local applications that are
currently connected to a database within the
database manager instance being monitored.
local_cons_in_exec
The number of local applications that are
currently connected to a database within the
database manager instance being monitored and
are currently processing a unit of work.
con_local_dbases
The number of local databases that have
applications connected.
Chapter 29 • Database Resource Monitoring
Measurement
Description
agents_registered
The number of agents registered in the database
manager instance that is being monitored
(coordinator agents and subagents).
agents_waiting_on_token
The number of agents waiting for a token so they
can execute a transaction in the database
manager.
idle_agents
The number of agents in the agent pool that are
currently unassigned to an application and are
therefore "idle".
agents_from_pool
The number of agents assigned from the agent
pool.
agents_created_empty_pool
The number of agents created because the agent
pool was empty.
agents_stolen
The number of times that agents are stolen from
an application. Agents are stolen when an idle
agent associated with an application is reassigned
to work on a different application.
comm_private_mem
The amount of private memory that the instance
of the database manager has currently committed
at the time of the snapshot.
inactive_gw_agents
The number of DRDA agents in the DRDA
connections pool that are primed with a
connection to a DRDA database, but are inactive.
num_gw_conn_switches
The number of times that an agent from the
agents pool was primed with a connection and
was stolen for use with a different DRDA
database.
sort_heap_allocated
The total number of allocated pages of sort heap
space for all sorts at the level chosen and at the
time the snapshot was taken.
post_threshold_sorts
The number of sorts that have requested heaps
after the sort heap threshold has been reached.
539
Chapter 29 • Database Resource Monitoring
Measurement
Description
piped_sorts_requested
The number of piped sorts that have been
requested.
piped_sorts_accepted
The number of piped sorts that have been
accepted.
Database
The following table lists the Database counters:
540
Measurement
Description
appls_cur_cons
Indicates the number of applications that are
currently connected to the database.
appls_in_db2
Indicates the number of applications that are
currently connected to the database, and for
which the database manager is currently
processing a request.
total_sec_cons
The number of connections made by a sub-agent
to the database at the node.
num_assoc_agents
At the application level, this is the number of
sub-agents associated with an application. At the
database level, it is the number of sub-agents for
all applications.
sort_heap_allocated
The total number of allocated pages of sort heap
space for all sorts at the level chosen and at the
time the snapshot was taken.
total_sorts
The total number of sorts that have been
executed.
total_sort_time
The total elapsed time (in milliseconds) for all
sorts that have been executed.
sort_overflows
The total number of sorts that ran out of sort
heap and may have required disk space for
temporary storage.
Chapter 29 • Database Resource Monitoring
Measurement
Description
active_sorts
The number of sorts in the database that
currently have a sort heap allocated.
total_hash_joins
The total number of hash joins executed.
total_hash_loops
The total number of times that a single partition
of a hash join was larger than the available sort
heap space.
hash_join_overflows
The number of times that hash join data exceeded
the available sort heap space.
hash_join_small_overflows
The number of times that hash join data exceeded
the available sort heap space by less than 10%.
pool_data_l_reads
Indicates the number of logical read requests for
data pages that have gone through the buffer
pool.
pool_data_p_reads
The number of read requests that required I/O to
get data pages into the buffer pool.
pool_data_writes
Indicates the number of times a buffer pool data
page was physically written to disk.
pool_index_l_reads
Indicates the number of logical read requests for
index pages that have gone through the buffer
pool.
pool_index_p_reads
Indicates the number of physical read requests to
get index pages into the buffer pool.
pool_index_writes
Indicates the number of times a buffer pool index
page was physically written to disk.
pool_read_time
Provides the total amount of elapsed time spent
processing read requests that caused data or index
pages to be physically read from disk to buffer
pool.
pool_write_time
Provides the total amount of time spent
physically writing data or index pages from the
buffer pool to disk.
files_closed
The total number of database files closed.
541
Chapter 29 • Database Resource Monitoring
542
Measurement
Description
pool_async_data_reads
The number of pages read asynchronously into
the buffer pool.
pool_async_data_writes
The number of times a buffer pool data page was
physically written to disk by either an
asynchronous page cleaner, or a pre-fetcher. A
pre-fetcher may have written dirty pages to disk
to make space for the pages being pre-fetched.
pool_async_index_writes
The number of times a buffer pool index page was
physically written to disk by either an
asynchronous page cleaner, or a pre-fetcher. A
pre-fetcher may have written dirty pages to disk
to make space for the pages being pre-fetched.
pool_async_index_reads
The number of index pages read asynchronously
into the buffer pool by a pre-fetcher.
pool_async_read_time
The total elapsed time spent reading by database
manager pre-fetchers.
pool_async_write_time
The total elapsed time spent writing data or index
pages from the buffer pool to disk by database
manager page cleaners.
pool_async_data_read_reqs
The number of asynchronous read requests.
pool_lsn_gap_clns
The number of times a page cleaner was invoked
because the logging space used had reached a
pre-defined criterion for the database.
pool_drty_pg_steal_clns
The number of times a page cleaner was invoked
because a synchronous write was needed during
the victim buffer replacement for the database.
pool_drty_pg_thrsh_clns
The number of times a page cleaner was invoked
because a buffer pool had reached the dirty page
threshold criterion for the database.
prefetch_wait_time
The time an application spent waiting for an I/O
server (pre-fetcher) to finish loading pages into
the buffer pool.
Chapter 29 • Database Resource Monitoring
Measurement
Description
pool_data_to_estore
The number of buffer pool data pages copied to
extended storage.
pool_index_to_estore
The number of buffer pool index pages copied to
extended storage.
pool_data_from_estore
The number of buffer pool data pages copied
from extended storage.
pool_index_from_estore
The number of buffer pool index pages copied
from extended storage.
direct_reads
The number of read operations that do not use
the buffer pool.
direct_writes
The number of write operations that do not use
the buffer pool.
direct_read_reqs
The number of requests to perform a direct read
of one or more sectors of data.
direct_write_reqs
The number of requests to perform a direct write
of one or more sectors of data.
direct_read_time
The elapsed time (in milliseconds) required to
perform the direct reads.
direct_write_time
The elapsed time (in milliseconds) required to
perform the direct writes.
cat_cache_lookups
The number of times that the catalog cache was
referenced to obtain table descriptor information.
cat_cache_inserts
The number of times that the system tried to
insert table descriptor information into the
catalog cache.
cat_cache_overflows
The number of times that an insert into the
catalog cache failed due the catalog cache being
full.
cat_cache_heap_full
The number of times that an insert into the
catalog cache failed due to a heap-full condition
in the database heap.
543
Chapter 29 • Database Resource Monitoring
544
Measurement
Description
pkg_cache_lookups
The number of times that an application looked
for a section or package in the package cache. At a
database level, it indicates the overall number of
references since the database was started, or
monitor data was reset.
pkg_cache_inserts
The total number of times that a requested
section was not available for use and had to be
loaded into the package cache. This count
includes any implicit prepares performed by the
system.
pkg_cache_num_overflows
The number of times that the package cache
overflowed the bounds of its allocated memory.
appl_section_lookups
Lookups of SQL sections by an application from
its SQL work area.
appl_section_inserts
Inserts of SQL sections by an application from its
SQL work area.
sec_logs_allocated
The total number of secondary log files that are
currently being used for the database.
log_reads
The number of log pages read from disk by the
logger.
log_writes
The number of log pages written to disk by the
logger.
total_log_used
The total amount of active log space currently
used (in bytes) in the database.
locks_held
The number of locks currently held.
lock_list_in_use
The total amount of lock list memory (in bytes)
that is in use.
deadlocks
The total number of deadlocks that have
occurred.
lock_escals
The number of times that locks have been
escalated from several row locks to a table lock.
Chapter 29 • Database Resource Monitoring
Measurement
Description
x_lock_escals
The number of times that locks have been
escalated from several row locks to one exclusive
table lock, or the number of times an exclusive
lock on a row caused the table lock to become an
exclusive lock.
lock_timeouts
The number of times that a request to lock an
object timed-out instead of being granted.
lock_waits
The total number of times that applications or
connections waited for locks.
lock_wait_time
The total elapsed time waited for a lock.
locks_waiting
Indicates the number of agents waiting on a lock.
rows_deleted
The number of row deletions attempted.
rows_inserted
The number of row insertions attempted.
rows_updated
The number of row updates attempted.
rows_selected
The number of rows that have been selected and
returned to the application.
int_rows_deleted
The number of rows deleted from the database as
a result of internal activity.
int_rows_updated
The number of rows updated from the database as
a result of internal activity.
int_rows_inserted
The number of rows inserted into the database as
a result of internal activity caused by triggers.
static_sql_stmts
The number of static SQL statements that were
attempted.
dynamic_sql_stmts
The number of dynamic SQL statements that
were attempted.
failed_sql_stmts
The number of SQL statements that were
attempted, but failed.
commit_sql_stmts
The total number of SQL COMMIT statements
that have been attempted.
545
Chapter 29 • Database Resource Monitoring
546
Measurement
Description
rollback_sql_stmts
The total number of SQL ROLLBACK statements
that have been attempted.
select_sql_stmts
The number of SQL SELECT statements that were
executed.
uid_sql_stmts
The number of SQL UPDATE, INSERT, and
DELETE statements that were executed.
ddl_sql_stmts
The number of SQL Data Definition Language
(DDL) statements that were executed.
int_auto_rebinds
The number of automatic rebinds (or recompiles)
that have been attempted.
int_commits
The total number of commits initiated internally
by the database manager.
int_rollbacks
The total number of rollbacks initiated internally
by the database manager.
int_deadlock_rollbacks
The total number of forced rollbacks initiated by
the database manager due to a deadlock. A
rollback is performed on the current unit of work
in an application selected by the database
manager to resolve the deadlock.
binds_precompiles
The number of binds and pre-compiles
attempted.
Chapter 29 • Database Resource Monitoring
Application
The following table lists the Application counters:
Measurement
Description
agents_stolen
The number of times that agents are stolen from
an application. Agents are stolen when an idle
agent associated with an application is reassigned
to work on a different application.
num_assoc_agents
At the application level, this is the number of
sub-agents associated with an application. At the
database level, it is the number of sub-agents for
all applications.
total_sorts
The total number of sorts that have been
executed.
total_sort_time
The total elapsed time (in milliseconds) for all
sorts that have been executed.
sort_overflows
The total number of sorts that ran out of sort
heap and may have required disk space for
temporary storage.
total_hash_joins
The total number of hash joins executed.
total_hash_loops
The total number of times that a single partition
of a hash join was larger than the available sort
heap space.
hash_join_overflows
The number of times that hash join data exceeded
the available sort heap space
hash_join_small_overflows
The number of times that hash join data exceeded
the available sort heap space by less than 10%.
pool_data_l_reads
The number of logical read requests for data pages
that have gone through the buffer pool.
pool_data_p_reads
The number of read requests that required I/O to
get data pages into the buffer pool.
pool_data_writes
The number of times a buffer pool data page was
physically written to disk.
547
Chapter 29 • Database Resource Monitoring
548
Measurement
Description
pool_index_l_reads
The number of logical read requests for index
pages that have gone through the buffer pool.
pool_index_p_reads
The number of physical read requests to get index
pages into the buffer pool.
pool_index_writes
The number of times a buffer pool index page was
physically written to disk.
pool_read_time
Provides the total amount of elapsed time spent
processing read requests that caused data or index
pages to be physically read from disk to buffer
pool.
prefetch_wait_time
The time an application spent waiting for an I/O
server (pre-fetcher) to finish loading pages into
the buffer pool.
pool_data_to_estore
The number of buffer pool data pages copied to
extended storage.
pool_index_to_estore
The number of buffer pool index pages copied to
extended storage.
pool_data_from_estore
The number of buffer pool data pages copied
from extended storage.
pool_index_from_estore
The number of buffer pool index pages copied
from extended storage.
direct_reads
The number of read operations that do not use
the buffer pool.
direct_writes
The number of write operations that do not use
the buffer pool.
direct_read_reqs
The number of requests to perform a direct read
of one or more sectors of data.
direct_write_reqs
The number of requests to perform a direct write
of one or more sectors of data.
direct_read_time
The elapsed time (in milliseconds) required to
perform the direct reads.
Chapter 29 • Database Resource Monitoring
Measurement
Description
direct_write_time
The elapsed time (in milliseconds) required to
perform the direct writes.
cat_cache_lookups
The number of times that the catalog cache was
referenced to obtain table descriptor information.
cat_cache_inserts
The number of times that the system tried to
insert table descriptor information into the
catalog cache.
cat_cache_overflows
The number of times that an insert into the
catalog cache failed due to the catalog cache
being full.
cat_cache_heap_full
The number of times that an insert into the
catalog cache failed due to a heap-full condition
in the database heap.
pkg_cache_lookups
The number of times that an application looked
for a section or package in the package cache. At a
database level, it indicates the overall number of
references since the database was started, or
monitor data was reset.
pkg_cache_inserts
The total number of times that a requested
section was not available for use and had to be
loaded into the package cache. This count
includes any implicit prepares performed by the
system.
appl_section_lookups
Lookups of SQL sections by an application from
its SQL work area.
appl_section_inserts
Inserts of SQL sections by an application from its
SQL work area.
uow_log_space_used
The amount of log space (in bytes) used in the
current unit of work of the monitored
application.
locks_held
The number of locks currently held.
deadlocks
The total number of deadlocks that have
occurred.
549
Chapter 29 • Database Resource Monitoring
550
Measurement
Description
lock_escals
The number of times that locks have been
escalated from several row locks to a table lock.
x_lock_escals
The number of times that locks have been
escalated from several row locks to one exclusive
table lock, or the number of times an exclusive
lock on a row caused the table lock to become an
exclusive lock.
lock_timeouts
The number of times that a request to lock an
object timed-out instead of being granted.
lock_waits
The total number of times that applications or
connections waited for locks.
lock_wait_time
The total elapsed time waited for a lock.
locks_waiting
Indicates the number of agents waiting on a lock.
uow_lock_wait_time
The total amount of elapsed time this unit of
work has spent waiting for locks.
rows_deleted
The number of row deletions attempted.
rows_inserted
The number of row insertions attempted.
rows_updated
The number of row updates attempted.
rows_selected
The number of rows that have been selected and
returned to the application.
rows_written
The number of rows changed (inserted, deleted or
updated) in the table.
rows_read
The number of rows read from the table.
int_rows_deleted
The number of rows deleted from the database as
a result of internal activity.
int_rows_updated
The number of rows updated from the database as
a result of internal activity.
int_rows_inserted
The number of rows inserted into the database as
a result of internal activity caused by triggers.
Chapter 29 • Database Resource Monitoring
Measurement
Description
open_rem_curs
The number of remote cursors currently open for
this application, including those cursors counted
by ‘open_rem_curs_blk’.
open_rem_curs_blk
The number of remote blocking cursors currently
open for this application.
rej_curs_blk
The number of times that a request for an I/O
block at server was rejected and the request was
converted to non-blocked I/O.
acc_curs_blk
The number of times that a request for an I/O
block was accepted.
open_loc_curs
The number of local cursors currently open for
this application, including those cursors counted
by ‘open_loc_curs_blk’.
open_loc_curs_blk
The number of local blocking cursors currently
open for this application.
static_sql_stmts
The number of static SQL statements that were
attempted.
dynamic_sql_stmts
The number of dynamic SQL statements that
were attempted.
failed_sql_stmts
The number of SQL statements that were
attempted, but failed.
commit_sql_stmts
The total number of SQL COMMIT statements
that have been attempted.
rollback_sql_stmts
The total number of SQL ROLLBACK statements
that have been attempted.
select_sql_stmts
The number of SQL SELECT statements that were
executed.
uid_sql_stmts
The number of SQL UPDATE, INSERT, and
DELETE statements that were executed.
ddl_sql_stmts
The number of SQL Data Definition Language
(DDL) statements that were executed.
551
Chapter 29 • Database Resource Monitoring
Measurement
Description
int_auto_rebinds
The number of automatic rebinds (or recompiles)
that have been attempted.
int_commits
The total number of commits initiated internally
by the database manager.
int_rollbacks
The total number of rollbacks initiated internally
by the database manager.
int_deadlock_rollbacks
The total number of forced rollbacks initiated by
the database manager due to a deadlock. A
rollback is performed on the current unit of work
in an application selected by the database
manager to resolve the deadlock.
binds_precompiles
The number of binds and pre-compiles
attempted.
Oracle Performance Counters
The following measurements are most commonly used when monitoring
the Oracle server (from the V$SYSSTAT table):
552
Measurement
Description
CPU used by this session
The amount of CPU time (in 10s of milliseconds)
used by a session between the time a user call
started and ended. Some user calls can be completed
within 10 milliseconds and, as a result, the start and
end-user call time can be the same. In this case, 0
milliseconds are added to the statistic. A similar
problem can exist in the operating system
reporting, especially on systems that suffer from
many context switches.
Bytes received via
SQL*Net from client
The total number of bytes received from the client
over Net8.
Logons current
The total number of current logons
Chapter 29 • Database Resource Monitoring
Measurement
Description
Opens of replaced files
The total number of files that needed to be
reopened because they were no longer in the
process file cache.
User calls
Oracle allocates resources (Call State Objects) to
keep track of relevant user call data structures every
time you log in, parse, or execute. When
determining activity, the ratio of user calls to RPI
calls gives you an indication of how much internal
work is generated as a result of the type of requests
the user is sending to Oracle.
SQL*Net roundtrips to/
from client
The total number of Net8 messages sent to, and
received from, the client.
Bytes sent via SQL*Net to
client
The total number of bytes sent to the client from
the foreground process(es).
Opened cursors current
The total number of current open cursors.
DB block changes
Closely related to consistent changes, this statistic
counts the total number of changes that were made
to all blocks in the SGA that were part of an update
or delete operation. These are changes that generate
redo log entries and hence will cause permanent
changes to the database if the transaction is
committed. This statistic is a rough indication of
total database work and indicates (possibly on a
per-transaction level) the rate at which buffers are
being dirtied.
Total file opens
The total number of file opens being performed by
the instance. Each process needs a number of files
(control file, log file, database file) to work against
the database.
553
Chapter 29 • Database Resource Monitoring
SQL Server Performance Counters
The following table describes the default counters that can be monitored on
version 6.5 of the SQL Server:
554
Measurement
Description
% Total Processor
Time
The average percentage of time that all the processors on
the system are busy executing non-idle threads. On a
multi-processor system, if all processors are always busy,
this is 100%, if all processors are 50% busy this is 50%
and if 1/4 of the processors are 100% busy this is 25%. It
can be viewed as the fraction of the time spent doing
useful work. Each processor is assigned an Idle thread in
the Idle process which consumes those unproductive
processor cycles not used by any other threads.
% Processor Time
The percentage of time that the processor is executing a
non-idle thread. This counter was designed as a primary
indicator of processor activity. It is calculated by
measuring the time that the processor spends executing
the thread of the idle process in each sample interval,
and subtracting that value from 100%. (Each processor
has an idle thread which consumes cycles when no other
threads are ready to run). It can be viewed as the
percentage of the sample interval spent doing useful
work. This counter displays the average percentage of
busy time observed during the sample interval. It is
calculated by monitoring the time the service was
inactive, and then subtracting that value from 100%.
Cache Hit Ratio
The percentage of time that a requested data page was
found in the data cache (instead of being read from disk).
I/O - Batch Writes/
sec
The number of 2K pages written to disk per second, using
Batch I/O. The checkpoint thread is the primary user of
Batch I/O.
I/O - Lazy Writes/sec
The number of 2K pages flushed to disk per second by the
Lazy Writer.
I/O - Outstanding
Reads
The number of physical reads pending.
Chapter 29 • Database Resource Monitoring
Measurement
Description
I/O - Outstanding
Writes
The number of physical writes pending.
I/O - Page Reads/sec
The number of physical page reads per second.
I/O - Transactions/
sec
The number of Transact-SQL command batches executed
per second.
User Connections
The number of open user connections.
Configuring Oracle JDBC Monitor Dialog Box
This dialog box enables you to configure the connection parameters for the
SiteScope Oracle JDBC monitor.
To access
Right-click the graph and select Add Measurements.
This dialog appears only when you add measurements
for the first time.
Relevant tasks
How to Set Up the Oracle Monitoring Environment
See also
Oracle Performance Counters
User interface elements are described below:
UI Elements (A-Z)
Description
Instance
The database SID.
Example: ORCL
Database Connection
URL
The connection URL to the database you want to
monitor. The URL should contain a database user name
and password in the following format (including the
colons and @ symbol):
jdbc:oracle:thin:@<tcp addr>:<tcp port>:<db sid>
Example: To connect to the ORCL database on a machine
using port 1521 you would use
jdbc:oracle:thin:@206.168.191.19:1521:ORCL
555
Chapter 29 • Database Resource Monitoring
UI Elements (A-Z)
Description
Database User Name
The user name that SiteScope should use to connect to
the database.
Important: You must have a valid Oracle user login that
SiteScope will use to access the Oracle server for the
Oracle JDBC Monitor. To verify that SiteScope will be able
retrieve the Oracle database counters, sign in to the
Oracle server with your user and try to execute the SQL
statements found in the file:
SiteScope\templates.applications\commands.oraclejdbc
Database Password
The password for the user name that SiteScope should
use to connect to the database.
Database Driver
The driver used to connect to the database. Specify the
the Oracle Database Driver that was installed on the
SiteScope server when setting up the monitor.
Example: The Database Driver for the Oracle thin JDBC
driver is: oracle.jdbc.driver.OracleDriver
Connection Timeout
An optional the time out value, in seconds, that
SiteScope should to wait for a database connection to
respond.
Query Timeout
An optional the time out value, in seconds, that
SiteScope should to wait for a response from the database
query. If the database does not respond within the period
specified, SiteScope will report an error.
Note: Some commonly used databases and database
drivers do not support the Query Timeout feature. In
these cases the Query Timeout value should be set to
zero.
Update every
How often the monitor should read the server statistics.
The default interval is to run or update the monitor once
every 10 seconds.
Important: The sum of the Connection Timeout value
and Query Timeout value should always be less than the
Update every value for the monitor.
556
30
Streaming Media Monitoring
This chapter includes:
Concepts
➤
Streaming Media Monitoring Overview on page 558
Reference
➤
RealPlayer Client Performance Counters on page 559
➤
Media Player Client Performance Counters on page 561
557
Chapter 30 • Streaming Media Monitoring
Concepts
Streaming Media Monitoring Overview
To isolate server and client performance bottlenecks during a scenario run,
you monitor the Windows Media Server and RealPlayer audio/video servers,
as well as the RealPlayer and Media Player clients.
Note: For instructions on recording a script containing streaming media
functions, see the HP Virtual User Generator.
The streaming media monitors provide you with performance information
for the Windows Media Server and RealPlayer audio/video servers, as well as
the RealPlayer and Media Player clients. To obtain data for the Windows
Media Server and RealPlayer Server, you need to activate the streaming
media monitor before executing the scenario, and indicate which statistics
and measurements you want to monitor. The RealPlayer Client and Media
Player Client do not require pre-session or scenario activation or
configuration.
558
➤
The Real Client monitor graph shows statistics on the RealPlayer client
machine as a function of the elapsed scenario time. The x-axis represents
the time that has elapsed since the start of the scenario run. The y-axis
represents the resource usage.
➤
The Media Player Client monitor graph shows statistics on the Windows
Media Player client machine as a function of the elapsed scenario time.
The x-axis represents the time that has elapsed since the start of the
scenario run. The y-axis represents the resource usage.
Chapter 30 • Streaming Media Monitoring
Reference
RealPlayer Client Performance Counters
The following table describes the RealPlayer Client measurements that are
monitored:
Measurement
Description
Current Bandwidth (Kbits/
sec)
The number of kilobytes in the last second
Buffering Event Time (sec)
The average time spent on buffering
Network Performance
The ratio (percentage) between the current bandwidth and the actual bandwidth of the clip
Percentage of Recovered
Packets
The percentage of error packets that were recovered
Percentage of Lost Packets
The percentage of packets that were lost
Percentage of Late Packets
The percentage of late packets
Time to First Frame
Appearance (sec)
The time for first frame appearance (measured from
the start of the replay)
Number of Buffering
Events
The average number of all buffering events
Number of Buffering Seek
Events
The average number of buffering events resulting
from a seek operation
Buffering Seek Time
The average time spent on buffering events resulting from a seek operation
Number of Buffering Congestion Events
The average number of buffering events resulting
from network congestion
Buffering Congestion
Time
The average time spent on buffering events resulting from network congestion
559
Chapter 30 • Streaming Media Monitoring
560
Measurement
Description
Number of Buffering Live
Pause Events
The average number of buffering events resulting
from live pause
Buffering Live Pause Time
The average time spent on buffering events resulting from live pause
Chapter 30 • Streaming Media Monitoring
Media Player Client Performance Counters
The following table describes the Media Player Client measurements that are
monitored:
Measurement
Description
Average Buffering
Events
The number of times Media Player Client had to
buffer incoming media data due to insufficient media
content.
Average Buffering Time
(sec)
The time spent by Media Player Client waiting for sufficient amount of media data in order to continue
playing media clip.
Current bandwidth
(Kbits/sec)
The number of kbits per second received.
Number of Packets
The number of packets sent by server for a particular
media clip.
Stream Interruptions
The number of interruptions encountered by media
player client while playing a media clip. This measurement includes the number of times Media Player
Client had to buffer incoming media data, and any
errors that occurred during playback.
Stream Quality
(Packet-level)
The percentage ratio of packets received to total packets.
Stream Quality (Sampling-level)
The percentage of stream samples received on time
(no delays in reception).
Total number of recovered packets
The number of lost packets that were recovered. This
value is only relevant during network playback.
Total number of lost
packets
The number of lost packets that were not recovered.
This value is only relevant during network playback.
561
Chapter 30 • Streaming Media Monitoring
562
31
ERP/CRM Server Resource Monitoring
This chapter includes:
Concepts
➤
ERP/CRM Server Resource Monitoring Overview on page 564
Tasks
➤
How to Set Up the PeopleSoft (Tuxedo) Resource Monitor on page 565
➤
How to Set Up the SAPGUI Server Resource Monitor on page 567
Reference
➤
PeopleSoft (Tuxedo) Performance Counters on page 569
➤
SAPGUI Performance Counters on page 572
➤
Siebel Server Manager Performance Counters on page 573
➤
ERP/CRM Server Resounce Monitoring User Interface on page 575
Troubleshooting and Limitations on page 580
563
Chapter 31 • ERP/CRM Server Resource Monitoring
Concepts
ERP/CRM Server Resource Monitoring Overview
You use LoadRunner’s ERP/CRM server resource monitors to monitor ERP/
CRM servers during a scenario run and isolate server performance
bottlenecks.
564
➤
The PeopleSoft (Tuxedo) monitor displays statistics about the resource
usage of a PeopleSoft (Tuxedo) server during the scenario run.
➤
The Siebel Server Manager monitor displays statistics about the resource
usage of a Siebel Server Manager during the scenario run.
➤
The SAPGUI monitor displays statistics about the resource usage of an SAP
R/3 system during the scenario run. You can use the SAPGUI monitor to
view:
➤
the number of configured instances for each SAP system
➤
data for all application instances (not just the one you logged on to)
➤
transactions used and the users that call them
➤
number of users working on the different instances
➤
performance history for recent periods of all instances
➤
response time distribution
➤
resource consumption for any application server
➤
application server workload for the current day or for a recent period
Chapter 31 • ERP/CRM Server Resource Monitoring
Tasks
How to Set Up the PeopleSoft (Tuxedo) Resource
Monitor
This task describes the working order for setting up the monitoring
environment. If Tuxedo 7.1 or later is installed, you can monitor more than
one PeopleSoft (Tuxedo) application server at a time. If Tuxedo 6.5 or earlier
is installed, you can monitor only one PeopleSoft (Tuxedo) application
server at a time.
This task includes the following steps:
➤
"Prerequisites" on page 565
➤
"Define the environment variables on the Controller machine" on
page 566
➤
"Check the Workstation Listener (WSL) Process" on page 566
➤
"Configure the PeopleSoft (Tuxedo) Resource monitor from the
Controller" on page 566
1 Prerequisites
Ensure that a Tuxedo workstation client (not a native client), version 6.3
or later, is installed on the Controller machine.
Use a Tuxedo 6.x client if a Tuxedo 6.x server is used, and Tuxedo 7.1 or
later client if a Tuxedo 7.1 or later server is used.
If you use a Tuxedo 6.5 or earlier server, you can still use a Tuxedo 7.1 or
later client in order to monitor it, provided that you set the
WSINTOPPRE71 environment variable to yes.
565
Chapter 31 • ERP/CRM Server Resource Monitoring
Note: A Tuxedo workstation client communicates with the application
server over the network, and is not required to run the Tuxedo
application server on the same machine. A native client can only
communicate with the Tuxedo application server if it is part of the
relevant Tuxedo domain.
2 Define the environment variables on the Controller machine
a Set the TUXDIR variable to the Tuxedo installation directory (for
example, V:\environ\32\Tuxedo 8.0).
b Add the Tuxedo bin directory to the PATH variable.
3 Check the Workstation Listener (WSL) Process
Ensure that the workstation listener (WSL) process is running. This
enables the application server to accept requests from workstation clients.
The address and port number used to connect to the application server
must match those dedicated to the WSL process.
Note: For information on configuring the WSL, refer to the BEA Tuxedo
Web site (http://edocs.beasys.com/tuxedo/tux81/rf5/
rf5101.htm#1534543).
4 Configure the PeopleSoft (Tuxedo) Resource monitor from
the Controller
The first time you click Add to add a measurement in the Controller, you
specify the PeopleSoft (Tuxedo) server logon information. For user
interface details, see "PeopleSoft (Tuxedo) Logon Dialog Box" on page 577.
566
Chapter 31 • ERP/CRM Server Resource Monitoring
For task details (beginning with step 2), see "How to Set Up the
Monitoring Environment – Workflow" on page 443.
How to Set Up the SAPGUI Server Resource Monitor
This task describes the working order for setting up the monitoring
environment.
Note: The SAPGUI monitor supports SAP server versions 3.1 to 4.6,
regardless of the SAP R/3 server’s operating system and the platform on
which it is installed.
This task includes the following steps:
➤
"Prerequisites" on page 565
➤
"Enable the last minute load from the client" on page 568
➤
"Configure the SAPGUI Server Resource monitor from the Controller" on
page 568
1 Prerequisites
Note: Once the SAPGUI monitor is activated on the Controller machine,
you cannot record a SAPGUI protocol script on that machine.
➤
Install the SAPGUI for Windows 6.20 client on the Controller machine.
➤
Install the latest patch for the SAPGUI for Windows 6.20 client. The
lowest supported level is patch 36. (SAPGUI patches can be downloaded
from https://websmp104.sap-ag.de/patches. You will need a valid Service
Marketplace username and password to access this site.)
567
Chapter 31 • ERP/CRM Server Resource Monitoring
2 Enable the last minute load from the client
From the SAPGUI client application, click F6 to determine whether you
can access the st03 transaction and query for last minute load
information.
If this functionality is not already enabled, enable it from the SAP R/3
client on the Controller machine, using the username and password
defined in the Controller.
3 Configure the SAPGUI Server Resource monitor from the
Controller
The SAP server information comes from the SAP Logon application.
Before you configure this monitor from the Controller, verify the logon
information on the SAP server.
The first time you click Add to add a measurement in the Controller, you
specify the SAPGUI server logon information. For user interface details,
see "SAPGUI Logon Dialog Box" on page 578.
For task details (beginning with step 2), see "How to Set Up the
Monitoring Environment – Workflow" on page 443.
568
Chapter 31 • ERP/CRM Server Resource Monitoring
Reference
PeopleSoft (Tuxedo) Performance Counters
The following table describes the default counters that can be measured. It is
recommended to pay particular attention to the following measurements:
% Busy Clients, Active Clients, Busy Clients, Idle Clients, and all the queue
counters for the APPQ/PSAPPSRV queue.
569
Chapter 31 • ERP/CRM Server Resource Monitoring
Monitor
Measurements
Machine
% Busy Clients - The percent of active clients
currently logged in to the Tuxedo application server
that are waiting for a response from the application
server.
Active Clients - The total number of active clients
currently logged in to the Tuxedo application server.
Busy Clients - The total number of active clients
currently logged in to the Tuxedo application server
that are waiting for a response from the application
server.
Current Accessers - The number of clients and
servers currently accessing the application either
directly on this machine or through a workstation
handler on this machine.
Current Transactions - The number of in use
transaction table entries on this machine.
Idle Clients - The total number of active clients
currently logged in to the Tuxedo application server
that are not waiting for a response from the
application server.
Workload Completed/second - The total workload
on all the servers for the machine that was
completed, per unit time.
Workload Initiated/second - The total workload on
all the servers for the machine that was initiated,
per unit time.
570
Chapter 31 • ERP/CRM Server Resource Monitoring
Monitor
Measurements
Queue
% Busy Servers - The percent of active servers
currently handling Tuxedo requests.
Active Servers - The total number of active servers
either handling or waiting to handle Tuxedo
requests.
Busy Servers - The total number of active servers
currently busy handling Tuxedo requests.
Idle Servers - The total number of active servers
currently waiting to handle Tuxedo requests.
Number Queued - The total number of messages
which have been placed on the queue.
Server
Requests/second - The number of server requests
handled per second.
Workload/second -The workload is a weighted
measure of the server requests. Some requests could
have a different weight than others. By default, the
workload is always 50 times the number of requests.
Workstation Handler
(WSH)
Bytes Received/sec - The total number of bytes
received by the workstation handler, per second.
Bytes Sent/sec - The total number of bytes sent back
to the clients by the workstation handler, per
second.
Messages Received/sec - The number of messages
received by the workstation handler, per second.
Messages Sent/sec - The number of messages sent
back to the clients by the workstation handler, per
second.
Number of Queue Blocks/sec - The number of times
the queue for the workstation handler blocked, per
second. This gives an idea of how often the
workstation handler was overloaded.
571
Chapter 31 • ERP/CRM Server Resource Monitoring
SAPGUI Performance Counters
The following table lists the most commonly monitored counters:
572
Measurement
Description
Average CPU time
The average CPU time used in the work process.
Average response time
The average response time, measured from the time
a dialog sends a request to the dispatcher work
process, through the processing of the dialog, until
the dialog is completed and the data is passed to the
presentation layer. The response time between the
SAP GUI and the dispatcher is not included in this
value.
Average wait time
The average amount of time that an unprocessed
dialog step waits in the dispatcher queue for a free
work process. Under normal conditions, the
dispatcher work process should pass a dialog step to
the application process immediately after receiving
the request from the dialog step. Under these
conditions, the average wait time would be a few
milliseconds. A heavy load on the application server
or on the entire system causes queues at the
dispatcher queue.
Average load time
The time needed to load and generate objects, such
as ABAP source code and screen information, from
the database.
Database calls
The number of parsed requests sent to the database.
Database requests
The number of logical ABAP requests for data in the
database. These requests are passed through the R/3
database interface and parsed into individual
database calls. The proportion of database calls to
database requests is important. If access to
information in a table is buffered in the SAP buffers,
database calls to the database server are not
required. Therefore, the ratio of calls/requests gives
an overall indication of the efficiency of table
buffering. A good ratio would be 1:10.
Chapter 31 • ERP/CRM Server Resource Monitoring
Measurement
Description
Roll ins
The number of rolled-in user contexts.
Roll outs
The number of rolled-out user contexts.
Roll in time
The processing time for roll ins.
Roll out time
The processing time for roll outs.
Roll wait time
The queue time in the roll area. When synchronous
RFCs are called, the work process executes a roll out
and may have to wait for the end of the RFC in the
roll area, even if the dialog step is not yet
completed. In the roll area, RFC server programs can
also wait for other RFCs sent to them.
Average time per logical
DB call
The average response time for all commands sent to
the database system (in milliseconds). The time
depends on the CPU capacity of the database server,
the network, the buffering, and on the input/output
capabilities of the database server. Access times for
buffered tables are many magnitudes faster and are
not considered in the measurement.
Siebel Server Manager Performance Counters
The following table shows the default counters that can be measured:
Measurement
Description
Average Connect Time
The average connection time.
Average Reply Size
The average size of a user reply.
Average Request Size
The average size of a user request.
Average Requests Per
Session
The average number of user requests per
session.
Average Response Time
The average amount of time that it takes
the server to respond to a request.
573
Chapter 31 • ERP/CRM Server Resource Monitoring
574
Measurement
Description
Average Think Time
The average amount of think time taken
to respond to a request.
Avg SQL Execute Time
The average SQL execute time.
Avg SQL Fetch Time
The average SQL fetch time.
Avg SQL Parse Time
The average SQL parse time.
CPU Time
The CPU time used in the work process.
Elapsed Time
The total amount of elapsed time.
Num of DBConn Retries
The number of database connection
retries.
Num of DLRbk Retries
The number of DLRbk retries.
Num of Exhausted
Retries
The total number of retries that expired.
Number of SQL
Executes
The total number of SQL executes.
Number of SQL Fetches
The total number of SQL fetches.
Number of SQL Parses
The total number of SQL parses.
Number of Sleeps
The number of sleeps.
Object Manager Errors
The total number of object manager
errors.
Reply Messages
The total number of reply messages.
Request Messages
The total number of request messages.
SQL Execute Time
The total SQL execute time.
SQL Fetch Time
The total SQL fetch time.
SQL Parse Time
The total SQL parse time.
Sleep Time
The total sleep time.
Tests Attempted
The number of tests attempted.
Tests Failed
The number of tests that failed.
Chapter 31 • ERP/CRM Server Resource Monitoring
Measurement
Description
Tests Successful
The number of tests that were
successful.
Total Reply Size
The total reply size, measured in bytes.
Total Request Size
The total request size, measured in
bytes.
Total Response Time
The total response time.
Total Tasks
The total number of tasks.
Total Think Time
The total think time.
ERP/CRM Server Resounce Monitoring User Interface
This section includes (in alphabetical order):
➤
Add Measurements Dialog Box on page 575
➤
PeopleSoft (Tuxedo) Logon Dialog Box on page 577
➤
SAPGUI Logon Dialog Box on page 578
➤
Siebel Server Manager Configuration Dialog Box on page 580
Add Measurements Dialog Box
This dialog box allows you to select the PeopleSoft (Tuxedo) or SAPGUI
resources to monitor.
To access
Right-click a graph > Add Measurements
Click Add in the Resource Measurements section of
monitor dialog.
575
Chapter 31 • ERP/CRM Server Resource Monitoring
Relevant tasks
How to Set Up the PeopleSoft (Tuxedo) Resource Monitor
How to Set Up the SAPGUI Server Resource Monitor
How to Set Up the Monitoring Environment – Workflow
See also
PeopleSoft (Tuxedo) Performance Counters
SAPGUI Performance Counters
User interface elements are described below:
UI Elements (A-Z)
Description
Adds the selected measurement to the list of
measurements in the Measurements on <machine>
section of the PeopleSoft (Tuxedo) or SAPGUI dialog
box.
576
Counters/
Measurements
Select a resource counter to monitor. Select multiple
counters using the CTRL key. For a definition of each
counter, click Explain.
Instances
If multiple instances of the selected counter are running,
select one or more instances to monitor for the selected
counter.
Object
Select the object being monitored on the specified
machine.
Chapter 31 • ERP/CRM Server Resource Monitoring
PeopleSoft (Tuxedo) Logon Dialog Box
This dialog box configures the connection information for the Tuxedo
server.
To access
Right-click the Tuxedo graph and select Add
Measurements.
This dialog appears only when you add measurements
for the first time.
Important
information
If you are using PeopleSoft 7.x, you can determine the
logon information from the Logon section of the
tpinit.ini file in the recorded script’s directory
If you are using Tuxedo 6.5 or below, the monitor can
only connect to one application server during a
Controller scenario. Once it connects to an application
server, that server is the only one used by the monitor
until the Controller is closed. This applies even when all
of the counters are deleted from the monitor.
Relevant tasks
How to Set Up the PeopleSoft (Tuxedo) Resource Monitor
How to Set Up the Monitoring Environment – Workflow
User interface elements are described below:
UI Elements
Description
Enables you to navigate to the tpinit.ini file of a recorded
Tuxedo script. It is recommended that you use the
Browse button and select the tpinit.ini file from a
recorded script, rather than enter the values manually.
For more information, see "Tuxedo tpinit.ini File" on
page 615.
Advanced
To authenticate the Tuxedo monitor, click Advanced, and
enter the authentication data as a hexadecimal string
(beginning with “0x“) in the data field. The
authentication data value can be obtained from the
tpinit.ini file of an existing Tuxedo script.
577
Chapter 31 • ERP/CRM Server Resource Monitoring
UI Elements
Description
Login Name
The user login name to access the Tuxedo server.
Default: PS
Note: You can determine the client name from the
lrt_tpinitialize statement in the recorded script
Password
The user password to access the Tuxedo server
Default: PS
Server Name
Enter the name of the server. The format of the server
name is //<machine name>:<port number>. The default
port is 7000. Alternatively, you can specify the IP address
or the hexadecimal format used by old versions of
Tuxedo.
Note: You cannot use quotation marks.
Client Name
Enter the name of the client machine. If a Tuxedo server
was previously monitored, its name is displayed in the
Server Name box.
SAPGUI Logon Dialog Box
This dialog box enables you to connect to the SAPGUI server. The server
information comes from the definitions in the SAP Logon application.
To access
Right-click the SAPGUI graph and select Add
Measurements.
This dialog appears only when you add measurements
for the first time.
Important
information
Once the SAPGUI monitor is activated on the Controller
machine, you cannot record a SAPGUI protocol script on
that machine.
Relevant tasks
How to Set Up the SAPGUI Server Resource Monitor
How to Set Up the Monitoring Environment – Workflow
See also
578
SAPGUI Performance Counters
Chapter 31 • ERP/CRM Server Resource Monitoring
User interface elements are described below:
UI Elements (A-Z)
Description
Advanced..
To change the default language, click Advanced..
and enter a 2-letter string in the Language field.
Client
Number used in the Client field of the SAP logon details
Login Name
Login name used to access the SAPGUI server.
Password
Password for the login name.
Server Name
Name of the SAPGUI server. Use one of the following
formats:
➤ Server Description as displayed in the SAP Logon
application
➤ String in the format
server_network_name[:system_number
where server_network_name is the name or IP address
of the application server (for example:
pipeline.HP.com), and system_number (preceded by
":") is the system number as displayed in the SAP
Server Properties dialog box. If the system number is
omitted, "00" is used by default.
Note: If an SAP router string is also specified in the
Properties dialog box, the server_network_name
should be the concatenation of the router string and
the application server (for example, /H/199.35.107.9/
H/204.79.199.5/H/cpce801)
579
Chapter 31 • ERP/CRM Server Resource Monitoring
Siebel Server Manager Configuration Dialog Box
This dialog box allows you to select the Siebel Server Manager resources to
monitor.
To access
Right-click a graph > Add Measurements
Click Add in the Resource Measurements section of
Siebel Server Manager monitor dialog.
Relevant tasks
How to Set Up the Monitoring Environment – Workflow
See also
Siebel Server Manager Performance Counters
Troubleshooting and Limitations
User interface elements are described below:
UI Elements (A-Z)
Description
Component/Counter
Description
Displays a description of the highlighted component.
Host
Displays the name of the monitored machine.
Measured
Components
Displays the available components. Browse the tree and
select the component you want to monitor.
Performance
Counters
Displays the available counters for the selected
component. Select the resource counter to monitor.
Troubleshooting and Limitations
This section describes troubleshooting for the Siebel Server Manager
Monitor
The Siebel Server Manager monitor uses a Siebel command line utility
(srvrmgr) to gather it's statistics. If you are having trouble getting the Siebel
Server Manager monitor to work, run this command from the Siebel Server
Manager client:
srvrmgr /s <server> /g <gateway> /e <enterprise> /u <user> /p <pw>
580
Chapter 31 • ERP/CRM Server Resource Monitoring
If this command works from the command line, but SiteScope has trouble
executing the command, open /sitescope/templates.applications/
commandline.siebel, and verify that you can run the following command
from the command line:
CONNECT_COMMAND:$PATH$/srvrmgr /g $GATEWAY$ /e $ENTERPRISE$ /
s $SERVERS$ /u $USERNAME$ /p $PASSWORD$
Note: On a Windows 2000 Advanced Server platform this command must
be changed to:
CONNECT_COMMAND:$PATH$\srvrmgr.exe /g $GATEWAY$ /e
$ENTERPRISE$ /s $SERVERS$ /u $USERNAME$ /p $PASSWORD$
581
Chapter 31 • ERP/CRM Server Resource Monitoring
582
32
Application Component Monitoring
This chapter includes:
Concepts
➤
Application Component Monitoring Overview on page 584
Reference
➤
Microsoft COM+ Performance Counters on page 586
583
Chapter 32 • Application Component Monitoring
Concepts
Application Component Monitoring Overview
Using LoadRunner’s Application Component monitors, you can monitor
the Microsoft COM+ server during a scenario run in order to isolate server
performance bottlenecks.
The Microsoft COM+ monitor is an Application Component monitor that
provides performance information for the Microsoft COM+ server. Before
monitoring a Microsoft COM+ server, you install the Microsoft COM+
Server Monitor Probe on the server machine. You can then specify which
measurements and resources you want the Microsoft COM+ monitor to
measure. You select these counters using the Controller’s monitor
configuration dialog box.
This section also includes:
➤
"Setting up the Monitoring Environment" on page 584
➤
"Configuring the Microsoft COM+ Monitor Over a Firewall" on page 585
Setting up the Monitoring Environment
To monitor the Microsoft COM+ server performance, you must first install
the Microsoft COM+ Server Monitor Probe on the server machine. You can
then specify which measurements and resources you want the Microsoft
COM+ monitor to measure. You select these counters using the Controller’s
monitor configuration dialog box.
Note: The data sampling rate for the COM+ monitor is fixed and cannot be
modified using the Controller Tools > Options> Monitors dialog.
For more information on installing the Microsoft COM+ server add-in, refer
to the HP LoadRunner Installation Guide.
584
Chapter 32 • Application Component Monitoring
Configuring the Microsoft COM+ Monitor Over a
Firewall
Before running the Microsoft COM+ Monitor over a firewall:
➤
Make sure that the MI Listener is installed on any machine (including the
Controller machine) outside of the firewall. Refer to the HP LoadRunner
Installation Guide for installation instructions.
➤
Configure the firewall agent on the server machine. For details, see
"Working with Firewalls in LoadRunner" on page 349,.
➤
Specify the correct connection string on the client machine. For details,
see "Add Machine Dialog Box" on page 450.
585
Chapter 32 • Application Component Monitoring
Reference
Microsoft COM+ Performance Counters
The following tables describe the default counters that can be measured:
Authentication Metrics
Measurement
Description
Authenticate
Frequency of successful method call level
authentication. When you set an authentication
level for an application, you determine what degree
of authentication is performed when clients call
into the application.
Authenticate Failed
Frequency of failed method call level
authentication.
Application Events
Measurement
Description
Activation
Frequency of application activation or startup.
Shutdown
Frequency of application shutdown or termination.
Thread Events
586
Measurement
Description
Thread Start
Rate at which single-threaded apartment (STA)
thread for application have been started.
Thread Terminate
Rate at which single-threaded apartment (STA)
thread for application have been terminated.
Chapter 32 • Application Component Monitoring
Measurement
Description
Work Enque
Event sent if a work is queued in single thread
apartment object (STA). Note: These events are not
signaled/sent in Windows Server 2003 and later.
Work Reject
Event sent if a work is rejected from single thread
apartment object (STA). Note: These events are not
signaled/sent in Windows Server 2003 and later.
Transaction Events
Measurement
Description
Transaction Duration
Duration of COM+ transactions for selected
application.
Transaction Start
Rate at which transactions have started.
Transaction Prepared
Rate at which transactions have completed the
prepare phase of the two-phase protocol.
Transaction Aborted
Rate at which transactions have been aborted.
Transaction Commit
Rate at which transactions have completed the
commit protocol.
Object Events
Measurement
Description
Object Life Time
Duration of object existence (from instantiation to
destruction).
Object Create
Rate at which new instances of this object are
created.
Object Destroy
Rate at which instances of the object are destroyed.
Object Activate
Rate of retrieving instances of a new JIT-activated
object.
Object Deactivation
Rate of freeing JIT-activated object via SetComplete
or SetAbort.
587
Chapter 32 • Application Component Monitoring
Measurement
Description
Disable Commit
Rate of client calls to DisableCommit on a context.
DisableCommit declares that the object’s
transactional updates are inconsistent and can’t be
committed in their present state.
Enable Commit
Rate of client calls to EnableCommit on a context.
EnableCommit declares that the current object’s
work is not necessarily finished, but that its
transactional updates are consistent and could be
committed in their present form.
Set Complete
Rate of client calls to SetComplete on a context.
SetComplete declares that the transaction in which
the object is executing can be committed, and that
the object should be deactivated on returning from
the currently executing method call.
Set Abort
Rate of client calls to SetAbort on a context.
SetAbort declares that the transaction in which the
object is executing must be aborted, and that the
object should be deactivated on returning from the
currently executing method call.
Method Events
588
Measurement
Description
Method Duration
Average duration of method.
Method Frequency
Frequency of method invocation.
Method Failed
Frequency of failed methods (i.e. methods that
return error HRESULT codes).
Method Exceptions
Frequency of exceptions thrown by selected
method.
33
Application Deployment Solution
Monitoring
This chapter includes:
Concepts
➤
Application Deployment Solution Monitoring Overview on page 590
Tasks
➤
How to Set up the Citrix Monitoring Environment on page 591
Reference
➤
Citrix MetaFrame Performance Counters on page 593
➤
Citrix Monitor Dialog Box on page 600
589
Chapter 33 • Application Deployment Solution Monitoring
Concepts
Application Deployment Solution Monitoring Overview
Using LoadRunner’s Application Deployment Solution monitor, you can
isolate server performance bottlenecks by monitoring the Citrix server
during a scenario run.
LoadRunner’s Citrix monitor provides you with information about the
application deployment usage of the Citrix server during a scenario
execution. The Citrix monitor allows you to monitor the server performance
statistics from Citrix servers. You can monitor multiple parameters
(counters) with a single monitor instance. This allows you to watch server
loading for performance, availability, and capacity planning.
To obtain performance data, you need to activate the online monitor for the
server and specify which resources you want to measure before executing
the scenario.
590
Chapter 33 • Application Deployment Solution Monitoring
Tasks
How to Set up the Citrix Monitoring Environment
This task describes the working order for setting up the monitoring
environment.
This task includes the following steps:
➤
"Prerequisites" on page 591
➤
"Map the Network Drive" on page 591
➤
"Launch PerfMon" on page 592
➤
"Open the Connection with the Citrix Server" on page 592
1 Prerequisites
➤
Make sure that Citrix Server has been installed and is running.
➤
If Citrix Server machine is running Windows 2000, make sure that the
server machine is also running the Remote Registry service.
➤
Make sure that the LoadRunner machine has administrator privileges
to access the Citrix server.
➤
Measurements that monitor instances are valid for the currently
running Citrix session only. If you run this scenario again, you will
need to reconfigure the measurements that are instance-oriented.
To monitor the different instances, ensure that the server login and
logout procedures are recorded in the Vuser_init and Vuser_end
sections respectively, and not in the Action section of the script. For
more information, see the HP Virtual User Generator User Guide.
2 Map the Network Drive
From the Controller machine, map a network drive to the Citrix server
machine. This ensures that the required authentication is provided to the
Controller to access the resource counters.
591
Chapter 33 • Application Deployment Solution Monitoring
3 Launch PerfMon
Launch PerfMon from the Controller machine to enable the counters on
the Citrix server. This allows you to monitor the same counters for the
ICA Session object on the Citrix monitor.
4 Open the Connection with the Citrix Server
You can configure the Citrix monitor to view ICA Session object counters
only if at least one session is being run on the Citrix server. If no “real”
user has opened a connection with the Citrix server, you need to first
initialize or run a Citrix Vuser against the server, and only then configure
the Citrix Monitor and add the ICA Session counters. If you configure the
Citrix monitor without first initializing or running a Citrix Vuser (or
connecting to the Citrix server as a “real” user), you will not be able to
view the ICA Session object.
5 Configure the Citrix monitor from the Controller
For task details (beginning with step 2), see "How to Set Up the
Monitoring Environment – Workflow" on page 443.
592
Chapter 33 • Application Deployment Solution Monitoring
Reference
Citrix MetaFrame Performance Counters
The following sections describe some of the counters that can be measured.
➤
"Non-Virtual Counters" on page 593
➤
"Virtual Channel Counters" on page 596
Non-Virtual Counters
The following table describes non-virtual counters:
Measurement
Description
% Disk Time
The percentage of elapsed time that the selected
disk drive services read or write requests.
% Processor Time
The percentage of time that the processor executes a
non-Idle thread. This counter is a primary indicator
of processor activity. It is calculated by measuring
the time that the processor spends executing the
thread of the Idle process in each sample interval,
and subtracting that value from 100%. (Each
processor has an Idle thread which consumes cycles
when no other threads are ready to run.) It can be
viewed as the percentage of the sample interval
spent doing useful work. This counter displays the
average percentage of busy time observed during
the sample interval. It is calculated by monitoring
the time the service was inactive, and then
subtracting that value from 100%.
File data Operations/sec
The rate that the computer issues Read and Write
operations to file system devices. This does not
include File Control Operations.
593
Chapter 33 • Application Deployment Solution Monitoring
594
Measurement
Description
Interrupts/sec
The average number of hardware interrupts the
processor receives and services per second. It does
not include DPCs, which are counted separately.
This value is an indirect indicator of the activity of
devices that generate interrupts, such as the system
clock, the mouse, disk drivers, data communication
lines, network interface cards and other peripheral
devices. These devices normally interrupt the
processor when they have completed a task or
require attention. Normal thread execution is
suspended during interrupts. Most system clocks
interrupt the processor every 10 milliseconds,
creating a background of interrupt activity. This
counter displays the difference between the values
observed in the last two samples, divided by the
duration of the sample interval.
Output Session Line Speed
This value represents the line speed from server to
client for a session in bps.
Input Session Line Speed
This value represents the line speed from client to
server for a session in bps.
Page Faults/sec
A count of the Page Faults in the processor. A page
fault occurs when a process refers to a virtual
memory page that is not in its Working Set in main
memory. A Page Fault will not cause the page to be
fetched from disk if that page is on the standby list,
and hence already in main memory, or if it is in use
by another process with whom the page is shared.
Chapter 33 • Application Deployment Solution Monitoring
Measurement
Description
Pages/sec
The number of pages read from the disk or written
to the disk to resolve memory references to pages
that were not in memory at the time of the
reference. This is the sum of Pages Input/sec and
Pages Output/sec. This counter includes paging
traffic on behalf of the system Cache to access file
data for applications. This value also includes the
pages to/from non-cached mapped memory files.
This is the primary counter to observe if you are
concerned about excessive memory pressure (that
is, thrashing), and the excessive paging that may
result.
Pool Nonpaged Bytes
The number of bytes in the Nonpaged Pool, a
system memory area where space is acquired by
operating system components as they accomplish
their appointed tasks. Nonpaged Pool pages cannot
be paged out to the paging file, but instead remain
in main memory as long as they are allocated.
Private Bytes
The current number of bytes this process has
allocated that cannot be shared with other
processes.
Processor Queue Length
The instantaneous length of the processor queue in
units of threads. This counter is always 0 unless you
are also monitoring a thread counter. All processors
use a single queue in which threads wait for
processor cycles. This length does not include the
threads that are currently executing. A sustained
processor queue length greater than two generally
indicates processor congestion. This is an
instantaneous count, not an average over the time
interval.
Threads
The number of threads in the computer at the time
of data collection. Notice that this is an
instantaneous count, not an average over the time
interval. A thread is the basic executable entity that
can execute instructions in a processor.
595
Chapter 33 • Application Deployment Solution Monitoring
Measurement
Description
Latency – Session Average
This value represents the average client latency over
the life of a session.
Latency – Last Recorded
This value represents the last recorded latency
measurement for this session.
Latency – Session
Deviation
This value represents the difference between the
minimum and maximum measured values for a
session.
Input Session Bandwidth
This value represents the bandwidth from client to
server traffic for a session in bps.
Input Session
Compression
This value represents the compression ratio for
client to server traffic for a session.
Output Session Bandwidth
This value represents the bandwidth from server to
client traffic for a session in bps.
Output Session
Compression
This value represents the compression ratio for
server to client traffic for a session.
Output Session Linespeed
This value represents the line speed from server to
client for a session in bps.
Virtual Channel Counters
The following table describes virtual channel counters:
596
Measurement
Description
Input Audio Bandwidth
This value represents the bandwidth from client to
server traffic on the audio mapping channel. This is
measured in bps.
Input Clipboard
Bandwidth
This value represents the bandwidth from client to
server traffic on the clipboard mapping channel.
This is measured in bps.
Input COM1 Bandwidth
This value represents the bandwidth from client to
server traffic on the COM1 channel. This is
measured in bps.
Chapter 33 • Application Deployment Solution Monitoring
Measurement
Description
Input COM2 Bandwidth
This value represents the bandwidth from client to
server traffic on the COM2 channel. This is
measured in bps.
Input COM Bandwidth
This value represents the bandwidth from client to
server traffic on the COM channel. This is measured
in bps.
Input Control Channel
Bandwidth
This value represents the bandwidth from client to
server traffic on the ICA control channel. This is
measured in bps.
Input Drive Bandwidth
This value represents the bandwidth from client to
server traffic on the client drive mapping channel.
This is measured in bps.
Input Font Data
Bandwidth
This value represents the bandwidth from client to
server traffic on the local text echo font and
keyboard layout channel. This is measured in bps.
Input Licensing
Bandwidth
This value represents the bandwidth from server to
client traffic on the licensing channel. This is
measured in bps.
Input LPT1 Bandwidth
This value represents the bandwidth from client to
server traffic on the LPT1 channel. This is measured
in bps.
Input LPT2 Bandwidth
This value represents the bandwidth from client to
server traffic on the LPT2 channel. This is measured
in bps.
Input Management
Bandwidth
This value represents the bandwidth from client to
server traffic on the client management channel.
This is measured in bps.
Input PN Bandwidth
This value represents the bandwidth from client to
server traffic on the Program Neighborhood
channel. This is measured in bps.
Input Printer Bandwidth
This value represents the bandwidth from client to
server traffic on the printer spooler channel. This is
measured in bps.
597
Chapter 33 • Application Deployment Solution Monitoring
598
Measurement
Description
Input Seamless Bandwidth
This value represents the bandwidth from client to
server traffic on the Seamless channel. This is
measured in bps.
Input Text Echo
Bandwidth
This value represents the bandwidth from client to
server traffic on the local text echo data channel.
This is measured in bps.
Input Thinwire Bandwidth
This value represents the bandwidth from client to
server traffic on the Thinwire (graphics) channel.
This is measured in bps.
Input VideoFrame
Bandwidth
This value represents the bandwidth from client to
server traffic on the VideoFrame channel. This is
measured in bps.
Output Audio Bandwidth
This value represents the bandwidth from server to
client traffic on the audio mapping channel. This is
measured in bps.
Output Clipboard
Bandwidth
This value represents the bandwidth from server to
client traffic on he clipboard mapping channel. This
is measured in bps.
Output COM1 Bandwidth
This value represents the bandwidth from server to
client traffic on the COM1 channel. This is
measured in bps.
Output COM2 Bandwidth
This value represents the bandwidth from server to
client traffic on the COM2 channel. This is
measured in bps.
Output COM Bandwidth
This value represents the bandwidth from server to
client traffic on the COM channel. This is measured
in bps.
Output Control Channel
Bandwidth
This value represents the bandwidth from server to
client traffic on the ICA control channel. This is
measured in bps.
Output Drive Bandwidth
This value represents the bandwidth from server to
client traffic on the client drive channel. This is
measured in bps.
Chapter 33 • Application Deployment Solution Monitoring
Measurement
Description
Output Font Data
Bandwidth
This value represents the bandwidth from server to
client traffic on the local text echo font and
keyboard layout channel. This is measured in bps.
Output Licensing
Bandwidth
This value represents the bandwidth from server to
client traffic on the licensing channel. This is
measured in bps.
Output LPT1 Bandwidth
This value represents the bandwidth from server to
client traffic on the LPT1 channel. This is measured
in bps.
Output LPT2 Bandwidth
This value represents the bandwidth from server to
client traffic on the LPT2 channel. This is measured
in bps.
Output Management
Bandwidth
This value represents the bandwidth from server to
client traffic on the client management channel.
This is measured in bps.
Output PN Bandwidth
This value represents the bandwidth from server to
client traffic on the Program Neighborhood
channel. This is measured in bps.
Output Printer Bandwidth
This value represents the bandwidth from server to
client traffic on the printer spooler channel. This is
measured in bps.
Output Seamless
Bandwidth
This value represents the bandwidth from server to
client traffic on the Seamless channel. This is
measured in bps.
Output Text Echo
Bandwidth
This value represents the bandwidth from server to
client traffic on the local text echo data channel.
This is measured in bps.
Output Thinwire
Bandwidth
This value represents the bandwidth from server to
client traffic on the Thinwire (graphics) channel.
This is measured in bps.
Output VideoFrame
Bandwidth
This value represents the bandwidth from server to
client traffic on the VideoFrame channel. This is
measured in bps.
599
Chapter 33 • Application Deployment Solution Monitoring
Citrix Monitor Dialog Box
This dialog box enables you to configure the measurements for the Citrix
monitor.
To access
Right-click a graph > Add Measurements
Click Add in the Resource Measurements section of
Citrix Monitor dialog.
Important
information
Note: For Citrix monitoring, if the dialog box freezes
after clicking Add, you may need to rebuild the localhost
cache on the Citrix server machine. For more
information, refer to Document IDs CTX003648 and
CTX759510 in the Citrix Knowledge Base
(http://knowledgebase.citrix.com/
cgi-bin/webcgi.exe?New,KB=CitrixKB).
Relevant tasks
How to Set up the Citrix Monitoring Environment
See also
How to Set Up the Monitoring Environment – Workflow
User interface elements are described below:
UI Elements (A-Z)
Description
Adds the selected measurement to the list of
measurements in the Measurements on <machine>
section of the Citrix dialog box.
600
Counters
Select a resource counter to monitor. Select multiple
counters using the CTRL key. For a definition of each
counter, click Explain.
Instances
If multiple instances of the selected counter are running,
select one or more instances to monitor for the selected
counter.
Object
Select the object being monitored on the specified
machine.
34
Middleware Performance Monitoring
This chapter includes:
Concepts
➤
Middleware Performance Monitoring Overview on page 602
Tasks
➤
How to Set Up the Tuxedo Monitor on page 603
➤
How to Set Up the IBM WebSphere MQ Monitor on page 605
Reference
➤
IBM WebSphere MQ Performance Counters on page 608
➤
IBM WebSphere MQ Queue Attributes on page 611
➤
Tuxedo Performance Counters on page 613
➤
Tuxedo tpinit.ini File on page 615
➤
Middleware Performance Monitoring User Interface on page 615
601
Chapter 34 • Middleware Performance Monitoring
Concepts
Middleware Performance Monitoring Overview
A primary factor in a transaction’s response time is the Middleware
performance usage. LoadRunner’s Middleware Performance monitors
provide you with information about the Middleware performance usage of
the Tuxedo and IBM WebSphere MQ servers during a scenario execution. To
obtain performance data, you need to activate the online monitor for the
server and specify which resources you want to measure before executing
the scenario.
➤
The Tuxedo monitor allows you to measure and view your Tuxedo server
performance. It provides information about the host machine,
workstation handler, and queue in a Tuxedo system. To run the Tuxedo
monitor, you must install the Tuxedo client libraries on the machine you
want to monitor.
➤
The IBM WebSphere MQ monitor is used to monitor channel and queue
performance counters on an IBM WebSphere MQ (version 5.x) Server.
The procedures for selecting monitor measurements and configuring the
monitors vary according to server type. The following sections contain
specific configuration instructions for each server type.
602
Chapter 34 • Middleware Performance Monitoring
Tasks
How to Set Up the Tuxedo Monitor
This task describes the working order for setting up the monitoring
environment.
Note: If Tuxedo 7.1 or higher is installed on the Controller machine, more
than one Tuxedo application server can be monitored at a time. However, if
Tuxedo 6.5 or below is installed on the Controller machine, only one
Tuxedo application server can be monitored at a time.
This task includes the following steps:
➤
"Prerequisites" on page 603
➤
"Define the Tuxedo Environment Variables" on page 604
➤
"Check the Workstation Listener (WSL) Process" on page 604
➤
"Configure the Tuxedo monitor from the Controller" on page 604
1 Prerequisites
Ensure that a Tuxedo workstation client (not a native client) is installed
on the Controller machine. Use a Tuxedo 6.x client if a Tuxedo 6.x server
is used, and Tuxedo 7.1 or above client if a Tuxedo 7.1 or above server is
used.
If you use a Tuxedo 6.5 or earlier server, you can still use a Tuxedo 7.1 or
later client to monitor it, provided that you set the WSINTOPPRE71
environment variable to “yes”.
603
Chapter 34 • Middleware Performance Monitoring
Note: A Tuxedo workstation client communicates with the application
server over the network, and is not required to run the Tuxedo
application server on the same machine. A native client can only
communicate with the Tuxedo application server if it is part of the
relevant Tuxedo domain.
2 Define the Tuxedo Environment Variables
Define the Tuxedo environment variables on the Controller machine—set
the TUXDIR variable to the Tuxedo installation directory (for example,
V:\environ\32\Tuxedo8.0), and add the Tuxedo bin directory to the PATH
variable.
3 Check the Workstation Listener (WSL) Process
Ensure that the workstation listener (WSL) process is running. This
enables the application server to accept requests from workstation clients.
The address and port number used to connect to the application server
must match those dedicated to the WSL process.
Note: For information on configuring the WSL, refer to the BEA Tuxedo
Web site (http://edocs.beasys.com/tuxedo/tux81/rf5/
rf5101.htm#1534543).
4 Configure the Tuxedo monitor from the Controller
The first time you click Add to add a measurement in the Controller, you
specify the Tuxedo server logon information. For user interface details, see
"Tuxedo Logon Dialog Box" on page 619.
For task details (beginning with step 2), see "How to Set Up the
Monitoring Environment – Workflow" on page 443.
604
Chapter 34 • Middleware Performance Monitoring
How to Set Up the IBM WebSphere MQ Monitor
This task describes how to configure the Controller and IBM WebSphere MQ
machines:
This task includes the following steps:
➤
"Prerequisites" on page 605
➤
"Configure the server environment to monitor events" on page 605
➤
"Add the monitored server to the Controller" on page 606
➤
"Configure the IBM WebSphere MQ monitor" on page 606
1 Prerequisites
Ensure that an IBM WebSphere MQ Client Connection (version 5.21
only) is installed on the Controller machine.
For additional information on installing the IBM WebSphere MQ Server/
Client, refer to the IBM Web site (http://www.ibm.com/).
2 Configure the server environment to monitor events
The LoadRunner MQ Monitor retrieves event messages from two standard
MQSeries queues only:
➤
SYSTEM.ADMIN.PERFM.EVENT – performance events, such as “queue
depth high”
➤
SYSTEM.ADMIN.CHANNEL.EVENT – channel events, such as
“channel stopped”
a Events must be enabled for the queue manager (and in many cases, on
the applicable object, as well). Performance events are enabled by
setting attributes for the queue on the MQ Server. Channel events are
enabled by default, and cannot be disabled.
Note: The IBM WebSphere MQ monitor does not retrieve data from a
queue manager after the queue manager has been restarted.
605
Chapter 34 • Middleware Performance Monitoring
b Run the following MQSC command:
ALTER QMGR PERFMEV(ENABLED).
c Set the queue attributes. For a list of queue attributes, see "IBM
WebSphere MQ Queue Attributes" on page 611.
Note: If you encounter an MQ Server error message (starting with the
characters MQRC_), refer to the WebSphere MQ family support Web
site (http://www-306.ibm.com/software/integration/mqfamily/
support/).
3 Add the monitored server to the Controller
a In the Controller Run view, click the IBM WebSphere MQ graph in the
graph tree, and drag it into the right pane.
b Right-click the graph and select Add Measurements, or click anywhere
on the graph and select Monitors > Add Measurements. The IBM
WebSphere MQ dialog box opens.
In the Monitored Server Machines section, click Add. The Add
Machine dialog box opens.
c The first time that you add measurements, enter the server name or IP
address of the machine you want to monitor. The format of the server
name is <machine name>:<port number>. Select the platform on which
the machine runs, and click OK.
d In the Resource Measurements section of the IBM WebSphere MQ
dialog box, click Add.
4 Configure the IBM WebSphere MQ monitor
The IBM WebSphere MQ monitor connects to the IBM WebSphere MQ
server (via the MQ Client Connection installed on the Controller
machine). In MQ Client environments, the client machine connects to an
MQ Server instance, and uses the Server’s resources as if they were local to
the client machine.
606
Chapter 34 • Middleware Performance Monitoring
➤
Specify the connection information and measurements in the MQ
Monitor Add Measurements dialog. For user interface details, see "MQ
Monitor Add Measurements Dialog Box" on page 616.
607
Chapter 34 • Middleware Performance Monitoring
Reference
IBM WebSphere MQ Performance Counters
The following tables list the available IBM WebSphere MQ monitor
measurements:
Queue Performance Counters
The following table describes the Queue Performance counters:
608
Measurement
Description
Event - Queue Depth
High (events per
second)
An event triggered when the queue depth reaches the
configured maximum depth.
Event - Queue Depth
Low (events per
second)
An event triggered when the queue depth reaches the
configured minimum depth.
Event - Queue Full
(events per second)
An event triggered when an attempt is made to put a
message on a queue that is full.
Event - Queue Service
Interval High (events
per second)
An event triggered when no messages are put to or
retrieved from a queue within the timeout threshold.
Event - Queue Service
Interval OK (events
per second)
An event triggered when a message has been put to or
retrieved from a queue within the timeout threshold.
Status - Current Depth
Current count of messages on a local queue. This
measurement applies only to local queues of the
monitored queue manager.
Chapter 34 • Middleware Performance Monitoring
Measurement
Description
Status - Open Input
Count
Current count of open input handles. Input handles
are opened so that an application may "put" messages
to a queue.
Status - Open Output
Count
Current count of open output handles. Output
handles are opened so that an application may "get"
messages from a queue.
Channel Performance Counters
The following table describes the Channel Performance counters:
Measurement
Description
Event - Channel
Activated (events per
second)
Event generated when a channel, waiting to
become active but inhibited from doing so due to a
shortage of queue manager channel slots, becomes
active due to the sudden availability of a channel
slot.
Event - Channel Not
Activated (events per
second)
Event generated when a channel, attempts to
become active but inhibited from doing so due to a
shortage of queue manager channel slots.
Event - Channel Started
(events per second)
Event generated when a channel is started.
Event - Channel Stopped
(events per second)
Event generated when a channel is stopped,
regardless of source of stoppage.
Event - Channel Stopped
by User (events per
second)
Event generated when a channel is stopped by a
user.
Status - Channel State
The current state of a channel. Channels pass
through several states from STOPPED (inactive state)
to RUNNING (fully active state). Channel states
range from 0 (STOPPED) to 6 (RUNNING).
609
Chapter 34 • Middleware Performance Monitoring
610
Measurement
Description
Status - Messages
Transferred
The count of messages that have been sent over the
channel. If no traffic is occurring over the channel,
this measurement will be zero. If the channel has
not been started since the queue manager was
started, no measurement will be available.
Status - Buffer Received
The count of buffers that have been received over
the channel. If no traffic is occurring over the
channel, this measurement will be zero. If the
channel has not been started since the queue
manager was started, no measurement will be
available.
Status - Buffer Sent
The count of buffers that have been sent over the
channel. If no traffic is occurring over the channel,
this measurement will be zero. If the channel has
not been started since the queue manager was
started, no measurement will be available.
Status - Bytes Received
The count of bytes that have been received over the
channel. If no traffic is occurring over the channel,
this measurement will appear as zero. If the
channel has not been started since the queue
manager was started, no measurement will be
available.
Status - Bytes Sent
The count of bytes that have been sent over the
channel. If no traffic is occurring over the channel,
this measurement will appear as zero. If the
channel has not been started since the queue
manager was started, no measurement will be
available.
Chapter 34 • Middleware Performance Monitoring
IBM WebSphere MQ Queue Attributes
You set the following queue attributes using the MQSC command ALTER
QMGR PERFMEV(ENABLED):
Measurement
Set Event Attributes
Event - Queue
Depth High
➤ QDEPTHHI(integer) - where integer is a value expressed as
a percentage of maximum messages allowed, and is in the
range of 0 to 100 inclusive.
➤ QDPHIEV(action) - where action is the word “ENABLED”
or “DISABLED”, enabling or disabling the generation of
the event, respectively.
Event - Queue
Depth Low
To enable the event for a queue, the following attributes of
the queue must be set:
➤ QDEPTHLO(integer) - where integer is a value expressed as
a percentage of maximum messages allowed, and is in the
range of 0 to 100 inclusive.
➤ QDPLOEV(action) - where action is the word “ENABLED”
or “DISABLED”, enabling or disabling the generation of
the event, respectively.
Event - Queue
Full
➤ QDEPTHHI(integer) – where integer is a value expressed as
a percentage of maximum messages allowed, and is in the
range of 0 to 100 inclusive.
➤ QDPMAXEV(action) – where action is the word
“ENABLED” or “DISABLED”, enabling or disabling the
generation of the event, respectively.
611
Chapter 34 • Middleware Performance Monitoring
Measurement
Set Event Attributes
Event - Queue
Service
Interval High
➤ QSVCINT(integer) – where integer is a value expressed as
milliseconds, in the range of 0 and 999,999,999, inclusive.
Note: this value is shared with Queue Service Interval OK.
➤ QSVCIEV(type) – where type is the word “HIGH”, “OK”, or
“NONE”, enabling service interval high events, enabling
service interval ok events, or disabling the generation of
the event, respectively.
Event - Queue
Service
Interval OK
➤ QSVCINT(integer) – where integer is a value expressed as
milliseconds, in the range of 0 and 999,999,999, inclusive.
Note: this value is shared with Queue Service Interval
High.
➤ QSVCIEV(type) – where type is the word “HIGH”, “OK”, or
“NONE”, enabling service interval high events, enabling
service interval ok events, or disabling the generation of
the event, respectively.
612
Chapter 34 • Middleware Performance Monitoring
Tuxedo Performance Counters
The following table lists the available Tuxedo monitor measurements. It is
recommended to pay particular attention to the following measurements:
% Busy Clients, Active Clients, Busy Clients, Idle Clients, and all the queue
counters for relevant queues:
Monitor
Measurements
Machine
% Busy Clients - The percent of active clients
currently logged in to the Tuxedo application server
that are waiting for a response from the application
server.
Active Clients - The total number of active clients
currently logged in to the Tuxedo application server.
Busy Clients - The total number of active clients
currently logged in to the Tuxedo application server
that are waiting for a response from the application
server.
Current Accessers - The number of clients and
servers currently accessing the application either
directly on this machine or through a workstation
handler on this machine.
Current Transactions - The number of in-use
transaction table entries on this machine.
Idle Clients - The total number of active clients
currently logged in to the Tuxedo application server
that are not waiting for a response from the
application server.
Workload Completed/second - The total workload
on all the servers for the machine that was
completed, per unit time.
Workload Initiated/second - The total workload on
all the servers for the machine that was initiated,
per unit time.
613
Chapter 34 • Middleware Performance Monitoring
Monitor
Measurements
Queue
% Busy Servers - The percent of active servers
currently handling Tuxedo requests.
Active Servers - The total number of active servers
either handling or waiting to handle Tuxedo
requests.
Busy Servers - The total number of active servers
currently busy handling Tuxedo requests.
Idle Servers - The total number of active servers
currently waiting to handle Tuxedo requests.
Number Queued - The total number of messages
which have been placed on the queue.
Server
Requests/second -The number of server requests
handled per second
Workload/second - Workload is a weighted measure
of the server requests. Some requests could have a
different weight than others. By default, the
workload is always 50 times the number of requests.
Workstation Handler
(WSH)
Bytes Received/sec - The total number of bytes
received by the workstation handler, per second.
Bytes Sent/sec - The total number of bytes sent back
to the clients by the workstation handler, per
second.
Messages Received/sec - The number of messages
received by the workstation handler, per second.
Messages Sent/sec - The number of messages sent
back to the clients by the workstation handler, per
second.
Number of Queue Blocks/sec - The number of times
the queue for the workstation handler blocked, per
second. This gives an idea of how often the
workstation handler was overloaded.
614
Chapter 34 • Middleware Performance Monitoring
Tuxedo tpinit.ini File
The tpinit.ini file is saved in the recorded script’s directory. It contains
information for connecting the Tuxedo monitor to the server. The client
logon information is located in the Logon section of the tpinit.ini file.
In the following example of a tpinit.ini file, the Tuxedo monitor was
configured for a server named psft1 using port 7000, and a client named
bankapp. The logon user name was PS and the password was PS.
[Logon]
LogonServername=//psft1:7000
LogonUsrName=PS
LogonCltName=bankapp
LogonGrpName=
LogonPasswd=PS
LogonData=
Middleware Performance Monitoring User Interface
This section includes (in alphabetical order):
Add Tuxedo Measurements Dialog Box
This dialog box allows you to select the resources to monitor on the Tuxedo
client.
To access
Right-click a graph > Add Measurements
Click Add in the Resource Measurements section of
Tuxedo dialog.
Relevant tasks
How to Set Up the Monitoring Environment – Workflow
See also
Tuxedo Performance Counters
615
Chapter 34 • Middleware Performance Monitoring
User interface elements are described below:
UI Elements (A-Z)
Description
Adds the selected measurement to the list of
measurements in the Measurements on <machine>
section of the Tuxedo dialog box.
Counters
Select a resource counter to monitor. Select multiple
counters using the CTRL key. For a definition of each
counter, click Explain.
Instances
If multiple instances of the selected counter are running,
select one or more instances to monitor for the selected
counter.
Object
Select the object being monitored on the specified
machine.
MQ Monitor Add Measurements Dialog Box
This dialog box enables you toconfigure the monitor by choosing which
measurements to monitor on the machine.
To access
Right-click a graph > Add Measurements
Click Add in the Resource Measurements section of the
IBM WebSphere MQ dialog.
616
Important
information
User entries for any text box are limited to 48 characters.
Relevant tasks
How to Set Up the IBM WebSphere MQ Monitor
See also
IBM WebSphere MQ Performance Counters
Chapter 34 • Middleware Performance Monitoring
User interface elements are described below:
UI Elements
Description
Alternate Queue
If the event configured for monitoring is from a remote
queue manager (other than the one identified in the
queue manager field of the IBM WebSphere MQ Add
Measurements dialog box), click Alternate Queue to
enter the name of an alternate queue manager.
Note: When you add an alternate queue manager, this
becomes the default queue manager for any events that
you subsequently add. To return to the queue manager to
which you are connected, enter that name in the
Alternate Queue Manager dialog box.
Available
Measurements
Object Type. Select an object type from either Channel or
Queue.
Object Name. Enter a name for object you want to
monitor.
Event/Attribute. Select the events and attributes you
want to monitor for the selected object.
Filter System Objects. Select to enable the system objects
filter.
Add Object. Enables you to add a new object name to the
Object name list.
Add. Enables you to add an Event or Attribute to an
object.
Remove. Enables you to remove a monitored object
event or attribute from the Object name list.
Alternate Queue. Enter the name of an alternate queue
manager if the event is from a remote queue manager.
617
Chapter 34 • Middleware Performance Monitoring
UI Elements
Description
Connections
Information
Server. The name of the server you are monitoring.
Client Channel. Enter the name of the channel through
which a client connection is made to an MQ Server.
➤ Note: You can set up a specific channel on an MQ
Server instance, or use the default
“SYSTEM.DEF.SVRCONN” channel. If the client
channel is undefined, the MQ Server will be
inaccessible via client connections (the MQ Monitor
will not work, as it will not be able to connect to the
queue manager which it is supposed to monitor).
Queue Manager. Enter the name of the queue manager
to be monitored.
➤ Note: The monitor is not restricted to monitoring only
the queue manager to which it is connected. You can
configure multiple queue managers to write to the
event queue of a central queue manager for centralized
monitoring (this applies to Events only, not polled
object attributes). All events contain a queue manager
attribute identifying their source.
➤ Note: A queue manager can only be accessed by one
Controller or monitoring application at any one time.
618
Filter system objects
By default, only user-defined objects are displayed in the
Object name list. To show all objects, clear the Filter
System Objects check box. You can modify the filter
settings, in the
<LoadRunner_installation>\dat\monitors\ mqseries.cfg
file.
Monitored Object list
A list of monitored objects, including the object’s name,
events and attributes, and alternate queue manager.
Chapter 34 • Middleware Performance Monitoring
Tuxedo Logon Dialog Box
This dialog box configures the connection information for the Tuxedo
server.
To access
Right-click the Tuxedo graph and select Add
Measurements.
This dialog appears only when you add measurements
for the first time.
Important
information
If you are using Tuxedo 6.5 or below, the monitor can
only connect to one application server during a scenario.
Once it connects to an application server, the server is
the only one used by the monitor until the Controller is
closed. This applies even when all of the counters are
deleted from the monitor.
Relevant tasks
How to Set Up the Tuxedo Monitor
How to Set Up the Monitoring Environment – Workflow
User interface elements are described below:
UI Elements
Description
Enables you to navigate to the tpinit.ini file of a recorded
Tuxedo script. It is recommended that you use the
Browse button and select the tpinit.ini file from a
recorded script, rather than enter the values manually.
For more information, see "Tuxedo tpinit.ini File" on
page 615.
Advanced
To authenticate the Tuxedo monitor, click Advanced, and
enter the authentication data as a hexadecimal string
(beginning with “0x“) in the data box. The
authentication data value can be obtained from the
tpinit.ini file of an existing Tuxedo script.
Login Name
The user login name to access the Tuxedo server.
Note: You can determine the client name from the
lrt_tpinitialize statement in the recorded script
Password
The user password to access the Tuxedo server
619
Chapter 34 • Middleware Performance Monitoring
UI Elements
Description
Server Name
Enter the name of the server. The format of the server
name is //<machine name>:<port number>.
Alternatively, you can specify the IP address or the
hexadecimal format used by old versions of Tuxedo.
Note: You cannot use quotation marks.
Client Name
620
Enter the name of the client machine. If a Tuxedo server
was previously monitored, its name is displayed in the
Server Name box.
35
Infrastructure Resources Monitoring
This chapter includes:
Concepts
➤
Infrastructure Resources Monitoring Overview on page 622
Reference
➤
Network Client Performance Counters on page 623
621
Chapter 35 • Infrastructure Resources Monitoring
Concepts
Infrastructure Resources Monitoring Overview
Using LoadRunner’s Network Client monitor, you can monitor network
client resources for FTP, POP3, SMTP, IMAP, and DNS Vusers during a
scenario run and isolate client performance bottlenecks.
Activating the Network Client Monitor
The Network Client online monitor graph is only available during scenarios
that run relevant scripts, such as FTP, POP3, and so forth.
You can view this graph by dragging it from the Infrastructure Resources
Graph section in the graph tree into the right pane of the Run view. The
graph appears in the graph view area.
622
Chapter 35 • Infrastructure Resources Monitoring
Reference
Network Client Performance Counters
The following table describes the Network Client measurements that are
monitored:
Measurement
Description
Pings per sec
Number of pings per second
Data transfer bytes per sec
Number of data bytes transferred per second
Data receive bytes per sec
Number of data bytes received per second
Connections per sec
Number of connections per second
Accept connections per
sec
Number of connections accepted per seconds
SSL Connections per sec
Number of SSL connections per second
SSL Data transfer bytes
per sec
Number of SSL data bytes transferred per second
SSL Data receive bytes per
sec
Number of SSL data bytes received per second
SSL Accept connections
per sec
Number of SSL connections accepted per seconds
623
Chapter 35 • Infrastructure Resources Monitoring
624
Part VII
Appendixes
626
36
Secure Host Communication
This chapter includes:
Concepts
➤
Secure Host Communication Overview on page 628
➤
Host Security Configuration on page 629
➤
Remote Security Configuration on page 630
➤
Host Security Best Practices on page 632
Tasks
➤
How to Configure Security Settings Locally on Hosts on page 633
➤
How to Register Hosts in Host Security Manager on page 634
➤
How to Update Host Security Settings Remotely on page 635
Reference
➤
Secure Host Communication Interface on page 638
Troubleshooting on page 645
627
Chapter 36 • Secure Host Communication
Concepts
Secure Host Communication Overview
The need to secure communication channels from hackers attacking the
corporate networks is critical. Securing communication channels ensures
confidentiality, integrity, and the user's authenticity within the scope of the
load testing application.
Secure communication is established between the Controller and load
generator hosts using a security key. Each host in the system must be set up
with the identical security key. If security keys on the hosts do not match,
secure communication cannot be established.
A host is in secure mode when it has a security key and security is enforced.
A host is in non-secure mode:
628
➤
if it has no security key
➤
if it has a security key but security is not enforced
Chapter 36 • Secure Host Communication
When a host in secure mode tries to communicate with a host in non-secure
mode, security is automatically enforced on the non-secure host—assuming
their security keys match—allowing secure communication to be
established.
Note:
➤
When you run a scenario, if secure communication cannot be established
between a secure host (Controller or load generator) and another host
participating in the scenario run, the scenario cannot run.
➤
By definition, non-secure hosts can communicate with each other and
participate in scenario runs over non-secure channels.
This can be summarized in the following table:
Both Hosts in
Secure Mode
Security Mode on
Hosts Differ
Both Hosts in
Non-Secure Mode
Security keys
match
Scenario runs over
secure channel
Scenario runs over
secure channel
Scenario runs over
non-secure channel
Security keys
do not match
Scenario does not
run
Scenario does not
run
Scenario runs over
non-secure channel
Host Security Configuration
When you install the hosts (Controllers and load generators), by default no
security settings are defined on them, and communication channels
between the hosts are not secure. To enforce secure communication between
the hosts, you must configure security settings on each host machine
immediately after installing the hosts.
When configuring these settings for the first time, to avoid configuration
over non-secure channels, we recommend setting the security on each host
locally using the Host Security Setup utility. For details, see "How to
Configure Security Settings Locally on Hosts" on page 633.
629
Chapter 36 • Secure Host Communication
After initial security configuration, you can update security settings locally
or simultaneously across all the hosts in the LoadRunner system from a
remote location using the HP Host Security Manager utility. This utility is
installed on the same machine as the Controller. For details, see "How to
Update Host Security Settings Remotely" on page 635.
Remote Security Configuration
You can align security settings across all the hosts in LoadRunner
simultaneously from a remote location using HP Host Security Manager.
The utility lists all the hosts in LoadRunner, as well as the MI Listeners
required to connect to the hosts that are over a firewall, where applicable.
Using Host Security Manager, you can update the security key on all the
hosts, or update the security mode on selected hosts. For details, see "How to
Update Host Security Settings Remotely" on page 635.
This section also includes:
➤
"Master Security Key" on page 630
➤
"Considerations for Updating UNIX Load Generators" on page 631
Master Security Key
To update security settings on the hosts, Host Security Manager uses a
master key that matches the security keys on all the hosts. This enables
secure communication between Host Security Manager and the hosts for the
purpose of remotely updating the security settings.
If the master key and security key on a particular host do not match,
Host Security Manager cannot update security settings on that host.
630
Chapter 36 • Secure Host Communication
When you open Host Security Manager for the first time, you are prompted
for a key. Host Security Manager stores this key as a master key for secure
communication with the hosts. If you do not enter the key at this point,
you are prompted for it again when you try to update the security settings.
Considerations for Updating UNIX Load Generators
➤
UNIX load generators that use rsh (remote shell) to connect to the
Controller cannot be updated using Host Security Manager. To update
security settings on such load generators, use the local Host Security Setup
utility. See "How to Configure Security Settings Locally on Hosts" for
UNIX load generators on page 633.
➤
To update security settings on a UNIX load generator using
Host Security Manager, you must launch the load generator daemon for a
user and manually grant write permissions to the user on <installation
folder>/config.
631
Chapter 36 • Secure Host Communication
Host Security Best Practices
➤
To avoid sending security settings over a non-secure channel, perform
initial configuration of the security settings on each host locally (see "How
to Configure Security Settings Locally on Hosts" on page 633).
➤
Security settings should be changed once a month.
➤
Security settings can be updated:
➤
manually on each host
➤
remotely on all hosts simultaneously using the Host Security Manager
utility
If, when using the Host Security Manager utility, updating a host’s
settings fails, update the settings manually.
632
Chapter 36 • Secure Host Communication
Tasks
How to Configure Security Settings Locally on Hosts
This task describes how to configure security settings locally on Controllers
and load generators.
Windows Hosts
1 On the host, launch the Host Security Setup utility (Start > Programs >
LoadRunner > Tools > Host Security Setup).
For user interface details, see "Host Security Setup Dialog Box" on
page 642.
2 Select a security mode for the host.
3 If you selected to enforce secure communication, enter a security key
(6 - 16 characters). Enter the key a second time for confirmation.
UNIX Hosts
1 Log in as root user and change for tcsh.
2 Go to the /opt/HP/HP_LoadGenerator directory and type:
>source ./env.csh
3 Run SecurityKeyConsole.exe, located in <Installation_folder>/bin/
directory.
633
Chapter 36 • Secure Host Communication
4 In the Console window, enter an option as follows:
➤
To change the security mode, enter 1.
➤
To change the security key, enter 2.
5 If you are changing the security mode:
➤
To turn the security on, enter 1.
➤
To turn the security on, enter 0.
6 If you are changing the security key, enter the new key. A valid key is
6 - 16 characters long.
How to Register Hosts in Host Security Manager
This task describes how to register hosts in Host Security Manager.
This task includes the following steps:
➤
"Add hosts to the Hosts list" on page 634
➤
"For hosts over a firewall, specify the MI Listener" on page 634
1 Add hosts to the Hosts list
In Host Security Manager (Start > Programs > LoadRunner > Tools >
Host Security Manager), click Add Hosts.
Enter the names or IP addresses of the Controllers and load generators
you want to add. When entering multiple hosts, separate entries by a
comma.
For user interface details, see"Add Hosts Dialog Box" on page 638.
2 For hosts over a firewall, specify the MI Listener
In the main Host Security Manager window:
a Select the host that is over the firewall. If other hosts over a firewall
communicate through the same MI Listener, select these hosts as well
to set the MI Listener for all of the hosts simultaneously.
634
Chapter 36 • Secure Host Communication
Tip: To select multiple hosts, hold down the CTRL key on your
keyboard while selecting the relevant hosts.
b Click Set MI Listener, and enter the name / IP address of the
MI Listener that the host uses to communicate over the firewall.
How to Update Host Security Settings Remotely
This task describes how to use Host Security Manager to update security
settings on the LoadRunner hosts remotely, from the Controller.
This task includes the following steps:
➤
"Prerequisites" on page 635
➤
"Update the security settings" on page 635
➤
"Results" on page 637
Prerequisites
➤
Hosts to be updated must be registered in Host Security Manager. For
details, see "How to Register Hosts in Host Security Manager" on page 634.
➤
Hosts in the Host Security Manager list that are not relevant must be
deleted from the list.
➤
Each host must have a security key defined on it, and all of the hosts’
security keys must be identical.
➤
Host Security Manager must have a master security key that is identical to
the security key on all of the hosts. For details, see "Master Security Key"
on page 630.
Update the security settings
1 Open Host Security Manager (Start > Programs > LoadRunner > Tools >
Host Security Manager).
635
Chapter 36 • Secure Host Communication
2 Update the desired security setting:
➤
Security key. Click Update Security Key, enter the new key, and enter it
again for confirmation.
➤
Security Mode. Select the hosts in the list that you want to update. To
select multiple hosts, hold down the CTRL key on your keyboard while
selecting the relevant hosts. Click Update Security Mode, and select a
security mode.
3 Click Update.
Host Security Manager attempts to update the security setting on the
hosts listed under Update progress. As it attempts to update each host, it
displays the update status, Updated or Failed, before attempting to update
the next host.
If a host is not updated successfully, check for possible reasons. You can
stop the update process by clicking Stop.
If there is a mismatch between Host Security Manager’s master security
key and the host’s security key, the Update Error dialog box opens,
prompting you for an appropriate action:
➤
Skip host. Skip updating this host.
➤
Establish a secure channel using this key. Use a different security key to
communicate securely with the host.
➤
Communicate over non-secure channel. Update the security setting
over a non-secure channel. This action is not recommended, especially
when updating the host security to secure mode. You should rather
update the security setting locally on the host (see "How to Configure
Security Settings Locally on Hosts" on page 633).
To apply the selected action to all similar mismatches, select Use this
solution with all similar mismatches.
Note: The security key update also updates Host Security Manager’s
master security key. If the update fails on all the hosts, the
Host Security Manager’s master key is not updated.
636
Chapter 36 • Secure Host Communication
Results
If the update was successful, Host Security Manager displays the time and
status of the security key/mode update for each host.
637
Chapter 36 • Secure Host Communication
Reference
Secure Host Communication Interface
This section includes (in alphabetical order):
➤
Add Hosts Dialog Box on page 638
➤
Host Security Manager Window on page 639
➤
Host Security Setup Dialog Box on page 642
➤
Update Security Key Dialog Box on page 643
➤
Update Security Mode Dialog Box on page 644
Add Hosts Dialog Box
This window enables you to add hosts to the Hosts list in
Host Security Manager.
To access
Start > Programs > LoadRunner > Tools > Host Security
Manager > Add Hosts
Relevant tasks
"How to Register Hosts in Host Security Manager" on
page 634
User interface elements are described below:
UI Elements
Description
Adds the Controller and load generators to the list of
hosts.
638
Chapter 36 • Secure Host Communication
UI Elements
Description
Controller (name or
IP)
Enter the name or IP address of the Controller you want
to register in Host Security Manager.
Note: You can enter more than one Controller at a time,
separated by commas.
Load Generators
(name or IP),
separated by
commas
Enter the names or IP addresses of the load generator
hosts you want to register in Host Security Manager.
Note: You can enter more than one load generator at a
time, separated by commas.
Host Security Manager Window
This window enables you to update security settings remotely on all of the
hosts in the load testing system.
To access
Start > Programs > LoadRunner > Tools > Host Security
Manager
Important
information
➤ You must provide Host Security Manager with a
master security key before you can update the security
settings.
➤ Every time you use Host Security Manager to update
security settings, make sure that the list of hosts is
up to date. Hosts that were added to the system must
be added to the list, and those deleted, should be
deleted from the list.
To add a host, see "How to Register Hosts in
Host Security Manager" on page 634.
To delete a host, select it and click Delete.
Relevant tasks
"How to Update Host Security Settings Remotely" on
page 635
See also
"Secure Host Communication Overview" on page 628
639
Chapter 36 • Secure Host Communication
User interface elements are described below:
UI Elements
Description
Opens the Add Hosts dialog box where you can register
hosts in Host Security Manager.
Enables you to delete hosts from the Hosts list in
Host Security Manager.
Enables you provide the name/IP address of the
MI Listener that the host (or hosts) uses to communicate
over the firewall.
Opens the Update Security Key dialog box where you can
update the security key on all the hosts.
Opens the Update Security Mode dialog box where you
can update the security mode on selected hosts.
Opens the Set Master Key dialog box where you update
Host Security Manager’s master security key.
640
Chapter 36 • Secure Host Communication
UI Elements
Description
Opens the History dialog box where you can view the
history of updates made to the hosts. The information
displayed includes the date of the update, the operation
(key/mode update), and the update status (Passed/Failed).
<Hosts table>
Displays the following information:
➤ Host Name/IP. The name or IP address of the host.
➤ Host Type. The type of host: Controller / Load
Generator.
➤ MI Listener. When the host is over a firewall, the name
of the MI Listener through which the host
communicates with the other hosts.
➤ Last Key Update. The last time the security key was
updated.
➤ Key Update Status. The status of the last security key
update.
➤ Last Security Mode Update. The last time the security
mode was updated.
➤ Security Mode Update Status. The status of the last
security mode update.
Tip: You can sort the details on this page in ascending or
descending order by clicking the heading of the column
by which you want to sort. Click the column heading
again to reverse the sort order.
641
Chapter 36 • Secure Host Communication
Host Security Setup Dialog Box
This dialog box enables you to update a host’s security settings manually.
To access
On the Controller machine, select Start > Programs >
LoadRunner > Tools > Host Security Setup
Important
information
When configuring security settings on hosts for the first
time, to avoid configuration over non-secure channels, it
is recommended to configure security settings on each
host locally using the Host Security Setup utility.
After initial security configuration, you can update
security settings locally, or simultaneously across all the
hosts in the LoadRunner system from the Controller
using the HP Host Security Manager utility. For details,
see "Remote Security Configuration" on page 630.
Relevant tasks
"How to Configure Security Settings Locally on Hosts" on
page 633 (Windows)
See also
"Host Security Configuration" on page 629
User interface elements are described below:
UI Elements
Description
Select a security
mode
Select one of the following security modes:
➤ Allow non-secure communication. Allows the host to
communicate with other machines over a non-secure
channel. (Default)
➤ Enforce secure communication. Enforces the host to
communicate with other machines over a secure
channel. If you select this option, you must provide
the key (6 - 16 characters long) matching the security
key on the other hosts with which it needs to
communicate.
642
Chapter 36 • Secure Host Communication
Update Security Key Dialog Box
This dialog box enables you to update the security key simultaneously on all
the hosts.
To access
Host Security Manager > Update Security Key button
Important
information
When you update the security key, the
Host Security Manager’s master security key is also
updated.
If the update fails on all the hosts, the
Host Security Manager’s master key is not updated.
Relevant tasks
"How to Update Host Security Settings Remotely" on
page 635
User interface elements are described below:
UI Elements (A-Z)
Description
Updates the security key on all of the hosts.
Stops updating the hosts.
Security Key/
Confirm Security Key
Enter the new security key to be updated on all of the
hosts, and a second time for confirmation.
Note: The key must be 6 - 16 characters long.
Update progress
Displays the hosts and their status during and after the
update.
643
Chapter 36 • Secure Host Communication
Update Security Mode Dialog Box
This dialog box enables you to update the security mode simultaneously on
selected hosts.
To access
Host Security Manager > Update Security Mode button
Relevant tasks
"How to Update Host Security Settings Remotely" on
page 635
User interface elements are described below:
UI Elements (A-Z)
Description
Updates the security mode on the selected hosts.
Stops updating the hosts.
Secure mode
Select a security mode:
➤ Non-secure. Allows non-secure communication.
➤ Secure. Enforces secure communication
Update progress
644
Displays the hosts, their previous status (if known), and
their status during and after the update.
Chapter 36 • Secure Host Communication
Troubleshooting
This section describes troubleshooting for secure host communication.
Cannot Run Scenario Over Secure Channels
Problem description: When you try to run a scenario over secure channels,
the scenario cannot initialize because cannot connect to Controller or load
generator.
Troubleshooting
Verify that the reason the scenario cannot run is because of a security key
mismatch: try to run the same scenario with the same hosts from a local
Controller.
If a Security Key Mismatch error is displayed in the error log, then the keys
do not match and you need to align the security keys on all the host
machines.
Scenario Run Fails. Load Generator Status is Changed to
Resource Failure
Problem description: When trying to run a scenario over secure channels,
the scenario fails to run and the load generator status changes to Resource
Failure.
Troubleshooting
When trying to run a scenario over secure channels, if the security keys on
the Controller and load generator do not match the scenario run fails, and
the status of the load generators changes to Resource Failure. To re-enable
the load generators, manually reset the status on each affected load
generator to Operational.
645
Chapter 36 • Secure Host Communication
646
37
Controller Command Line Arguments
This chapter includes:
Concepts
➤
Controller Command Line Arguments Overview on page 648
Tasks
➤
Invoke the Controller from the command Line on page 649
Reference
➤
Command Line Arguments - Rules on page 650
➤
Application Lifecycle Management Arguments on page 651
➤
Run Time Arguments on page 652
647
Chapter 37 • Controller Command Line Arguments
Concepts
Controller Command Line Arguments Overview
When you invoke the Controller from the command line, you can pass
arguments to instruct the Controller how to behave. By passing arguments
in the command line, you configure Controller scenario settings without
the need to manually define them using the Controller UI.
When invoked, the Controller checks all of the received arguments and sets
its start-up environment accordingly. If no arguments are passed, the
Controller uses its default settings.
For example, you can instruct Controller to Connect to HP Application
Lifecycle Management on start-up, save results to a directory other than the
directory defined in the scenario, and invoke Analysis upon scenario
termination.
For information on how to invoke the Controller from the command line,
see "Invoke the Controller from the command Line" on page 649.
For a list of rules relating to invoking the Controller from the command
line, see "Command Line Arguments - Rules" on page 650.
648
Chapter 37 • Controller Command Line Arguments
Tasks
Invoke the Controller from the command Line
This task describes how to invoke the Controller from the command line
and enter command line arguments.
This task includes the following steps:
➤
"Prerequisite" on page 649
➤
"Invoke the Controller from the command line and enter the desired
command line arguments" on page 649
1 Prerequisite
Before invoking the Controller from the command line, you should be
familiar with the rules relating to command line arguments. For details,
see "Command Line Arguments - Rules" on page 650.
2 Invoke the Controller from the command line and enter the
desired command line arguments
Type wlrun in the command line, followed by the desired arguments.
Notes:
➤
The arguments are case sensitive.
➤
Each argument should be preceded by a dash.
Example:
wlrun -TestPath C:\LoadRunner\scenario\Scenario.lrs -Run
649
Chapter 37 • Controller Command Line Arguments
Reference
Command Line Arguments - Rules
When you invoke the Controller from the command line, the following
rules apply:
650
➤
If the Controller is invoked with no arguments in the command line, the
Controller uses its default settings.
➤
The Controller will always overwrite results.
➤
The Controller will automatically terminate upon scenario termination
and results will be collected. If you don’t want the Controller to
automatically terminate upon scenario termination, add the flag
-DontClose to the command line.
➤
The Controller launched through the command line behaves normally
except when using the -Run option. Using the -Run option, dialogs and
message boxes that usually open and require the user to close them in a
usual launch, do not open in a command line launch.
➤
The Controller’s settings are loaded from wlrun5.ini, located in Windows
directory.
Chapter 37 • Controller Command Line Arguments
Application Lifecycle Management Arguments
These arguments define the LoadRunner integration with Application
Lifecycle Management. For more information about the LoadRunner
Application Lifecycle Management integration, see "Managing Scenarios
Using Application Lifecycle Management" on page 337.
ConnectToQC
Specifies whether the Controller should connect to
ALM on startup (0/1 or ON/OFF)
QCServer
Application Lifecycle Management server name.
Must be a machine where Application Lifecycle
Management is installed
QCDB
Application Lifecycle Management database name.
Use the format:
<Domain name>.<Project name>.
UserName
User name for connecting to Application Lifecycle
Management
Password
Password corresponding to the user name
TestPath
Path to scenario in Application Lifecycle
Management database. For example,
"[TD]\Subject\LoadRunner\Scenario1"
If path includes blank spaces, use quotation marks.
TestId
Test ID (used by ALM only)
ResultCleanName
For use with ResultCycle only. Example: "Res1"
ResultCycle
Application Lifecycle Management cycle. For
example, "LR_60_SP1_247"
Note: The ResultCycle and ResultCleanName arguments
are required if you wish to store the results within the
Application Lifecycle Management database.
651
Chapter 37 • Controller Command Line Arguments
Run Time Arguments
These arguments specify the run-time related scenario settings. For more
information on scenario settings, see "Before Running Your Scenario" on
page 237.
TestPath
Path to the scenario, for example,
C:\LoadRunner\scenario\Scenario.lrs
This argument can also be used for a scenario
residing in a Application Lifecycle Management
database. For example,
"[TD]\Subject\LoadRunner\Scenario1"
If the path includes blank spaces, use quotation
marks.
652
Run
Runs the scenario, dumps all output messages into
res_dir\output.txt, and closes Controller
InvokeAnalysis
Instructs LoadRunner to invoke Analysis upon
scenario termination. If this argument is not
specified, LoadRunner uses the scenario default
setting.
ResultName
Full results path. For example, "C:\Temp\Res_01"
ResultCleanName
Results name. For example, "Res_01"
ResultLocation
Results directory. For example, "C:\Temp"
38
Working with Digital Certificates
This chapter includes:
Concepts
➤
Digital Certificates Overview on page 654
➤
Using Digital Certificates with Firewalls on page 654
Tasks
➤
Create and Use Digital Certificates on page 656
653
Chapter 38 • Working with Digital Certificates
Concepts
Digital Certificates Overview
A Digital Certificate is an electronic “credit card” that establishes your
credentials when doing business or other transactions on the Web. It is
issued by a Certification Authority (CA). It contains the IP address of the
machine for which it was issued, a validation date, and the digital signature
of the certificate-issuing authority.
Using Digital Certificates with Firewalls
When the MI Listener sends its Public Key to the LoadRunner agent, it
always sends its certificate as well (this is the server-side certificate). The
LoadRunner agent can be configured to authenticate the certificate which it
received, as described in "Working with Firewalls in LoadRunner" on
page 349.If the agent is configured to authenticate the certificate, it can
verify whether the sender is really the machine that it claims to be by:
➤
Comparing the certificate's IP address with the sender’s IP address
➤
Checking the validation date
➤
Looking for the digital signature in its Certification Authorities list
The MI Listener may also require the LoadRunner agent to send a certificate
at any point in the session. This is called the client-side certificate, as
described in the MI Listener Configuration Settings in "Working with
Firewalls in LoadRunner" on page 349. If the LoadRunner agent owns a
certificate, it sends it to the MI Listener for the same authentication process.
If the LoadRunner agent does not own a certificate, the communication
might not be continued.
654
Chapter 38 • Working with Digital Certificates
An SSL CA list and an SSL Certificate are included in each LoadRunner
installation. This certificate is the same for all LoadRunner installations,
which means that it can be obtained by third parties. Therefore, if you are
interested in a more secure process, you should create your own Certificate
Authority and include it in the list, and issue matching certificates for your
machines.
655
Chapter 38 • Working with Digital Certificates
Tasks
Create and Use Digital Certificates
This task describes how to create a Certification Authority and a Digital
Certificate.
This task includes the following steps:
➤
"Create a Certification Authority (CA)" on page 656
➤
"Create a Digital Certificate" on page 658
1 Create a Certification Authority (CA)
Note: This step describes how to create a CA using the gen_ca_cert.exe
utility. If you are working on a UNIX platform, use the gen_ca_cert utility
instead.
To create the CA, perform the following steps:
a Run the gen_ca_cert utility from the <LoadRunner root folder>
\launch_service\bin directory.
b Run the gen_ca_cert command with at least one of the following
options:
➤
-country_name
➤
-organization name
➤
-common_name
This process creates two files in the directory from which the utility
was run: the CA Certificate (cacert.cer), and the CA Private Key
(capvk.cer). To provide different file names, use the
-CA_cert_file_name and the -CA_pk_file_name options respectively.
656
Chapter 38 • Working with Digital Certificates
Note: By default, the CA is valid for three years from when it is
generated. To change the validation dates, use the -nb_time (beginning
of validity) and/or -na_time (end of validity) options.
The following example creates two files: ca_igloo_cert.cer and
ca_igloo_pk.cer in the current directory:
c Install the CA using one of the following options:
➤
-install <name of certificate file>. Replaces any previous CA list and
creates a new one that includes this CA only.
➤
-install_add <name of certificate file>. Adds the new CA to the
existing CA list.
Note: The -install and -install_add options install the certificate file
only. Keep the private key file in a safe place and use it only for issuing
certificates.
657
Chapter 38 • Working with Digital Certificates
2 Create a Digital Certificate
Note: This step describes how to create a digital certificate using the
gen_cert.exe utility. If you are working on a UNIX platform, use the
gen_cert utility instead.
To create a digital certificate, perform the following steps:
a Run the gen_cert utility from the <LoadRunner root
folder>\launch_service\bin directory.
b Run the gen_cert command with at least one of the following options:
➤
-country_name
➤
-organization_name
➤
-organization_unit_name
➤
-eMail
➤
-common_name
It is important to note the following:
658
➤
The CA Certificate and the CA Private Key files are necessary for the
creation of the certificate. By default, it is assumed that they are in
the current directory, and are named cacert.cer and capvk.cer
respectively. In any other case, use the -CA_cert_file_name and
-CA_pk_file_name options to give the correct files and locations.
➤
The certificate file is created in the directory from which the utility
was run. By default, the file name is cert.cer. To provide a different
name, use the -cert_file_name option.
39
Troubleshooting Online Monitors
This chapter includes:
Concepts
➤
Troubleshooting Online Monitors Overview on page 660
Reference
Troubleshooting and Limitations on page 661
659
Chapter 39 • Troubleshooting Online Monitors
Concepts
Troubleshooting Online Monitors Overview
LoadRunner monitors allow you to view the performance of the scenario
during execution.
These troubleshooting tips help solve issues related to connecting to the
monitor server machine, and issues related to network usage.
660
Chapter 39 • Troubleshooting Online Monitors
Reference
Troubleshooting and Limitations
Troubleshooting Server Machine Connections
To monitor resources on a server machine, you must be able to connect to
that machine. If monitoring is unsuccessful and LoadRunner cannot locate
the specified server, make sure that the specified server is available. Perform
a “ping” operation by typing ping <server_name> from the Controller
machine command line.
Once you verify that the machine is accessible, check this table for
661
Chapter 39 • Troubleshooting Online Monitors
additional tips on troubleshooting the monitor.
Problem
Solution
Cannot monitor a
Windows machine
on a different
domain, or “access
denied.”
To gain administrative privileges to the remote machine,
perform the following from the command prompt:
Cannot monitor a
Windows machine
(An error message
is issued:
“computer_name
not found” or
“Cannot connect
to the host”)
The Windows machine you want to monitor only enables
monitoring for users with administrator privileges. To allow
monitoring for non-admin users, you must grant read
permission to certain files and registry entries (Microsoft
tech-note number Q158438.) The required steps are:
%net use \\<MachineName>/
user:[<Domain>\<RemoteMachineUsername>]
At the password prompt, enter the password for the remote
machine.
a. Using Explorer or File Manager, give the user READ access
to:
%windir%\system32\PERFCxxx.DAT
%windir%\system32\PERFHxxx.DAT
where xxx is the basic language ID for the system—
for example, 009 for English. These files may be
missing or corrupt. If you suspect this; expand
these files off of the installation cd.
b. Using REGEDT32, give the user READ access to:
HKEY_LOCAL_MACHINE\Software\Microsoft\Windows
NT\CurrentVersion\Perflib
and all sub keys of that key.
c. Using REGEDT32, give the user at least READ access to:
HKEY_LOCAL_MACHINE\System\CurrentControlSet\
Control\SecurePipeServers\winreg
Some Windows
default counters
are generating
errors
662
Remove the problematic counters and add the appropriate
ones using the “Add Measurement” dialog box.
Chapter 39 • Troubleshooting Online Monitors
Problem
Solution
You cannot get
performance
counters for the
SQL server
(version 6.5) on
the monitored
machine.
There is a bug in SQL server version 6.5. As a workaround,
give read permission to the following registry key at the
monitored machine (use regedt32):
The selected
measurements are
not displayed in
the graph.
Ensure that the display file and online.exe are registered. To
register the monitor dll's, without performing a full
installation, run the set_mon.bat batch file located in
LoadRunner\bin.
When monitoring
a Windows
machine, no
measurements
appear in the
graph.
Check the built-in Windows Performance Monitor. If it is
not functional, there may be a problem with the
communication setup.
When monitoring
a UNIX machine,
no measurements
appear in the
graph.
Ensure that an rstatd is running on the UNIX machine
(Refer to "UNIX Resource Monitoring" on page 479)
HKEY_LOCAL_MACHINE\SOFTWARE\Microsoft\MSSQLServ
er\MSSQLServer
(Microsoft tech-note number Q170394)
Troubleshooting Monitor Network Connections
If you notice extraordinary delays on the network, refer to one of the
following sections to increase the performance:
➤
Network Bandwidth Utilization
➤
Ethernet-bus Based Networks
➤
Working on a WAN or Heavily Loaded LAN
663
Chapter 39 • Troubleshooting Online Monitors
Network Bandwidth Utilization
In most load-testing scenario, the network card has little impact on scenario
performance. Network cards are manufactured to handle the bandwidth of
the physical network layer. Packets are transferred over an Ethernet at a rate
that complies with IEEE 803.x standards. If the network becomes a
bottleneck, the issue is not the brand of the network card, but rather the
bandwidth limitations on the physical layer (--i.e. Ethernet, FDDI, ATM,
Ethernet Token-ring, etc.).
That is, instead of load testing over a T10 line, upgrade your line to DS3
(45Mbps), or T100 (100Mbps).
Below are a few tips that will help qualify the need to upgrade the network:
➤
Run the performance monitor on the Vuser load generators. As the
number of Vusers increases, check the network byte transfer rate for
saturation. If a saturation point has been reached, do not run any more
Vusers without upgrading the network—otherwise performance of Vusers
will degrade. Degradation is exponential in networking environments.
➤
Run the performance monitor on the server machine. Run many Vusers
on several load generator machines. Check the kernel usage and network
transfer rate for saturation. If saturation is reached with less than the
desired Vuser load, upgrade the network.
➤
Every network has a different Maximum Transmission Unit or MTU,
which is set by the network administrator. The MTU is the largest physical
packet size (in bytes) that a network can transmit. If a message is larger
than the MTU, it is divided into smaller packets before being sent.
If clients and servers are passing large data sets back and forth, instruct the
network administrator to increase the MTU to yield better bandwidth
utilization. Ideally, you want the MTU to be the same as the smallest MTU of
all the networks between your machine and a message's final destination.
If you send a message that is larger than one of the MTUs, it will be broken
up into fragments, slowing transmission speeds. If the MTU is too high, it
may cause unintended degradation. Trial and error is the only sure way of
finding the optimal MTU, but there are some guidelines that can help. For
example, most Ethernet networks have an MTU of 1500.
664
Chapter 39 • Troubleshooting Online Monitors
If the desired MTU reduces performance, upgrade the network or reduce the
MTU to improve performance.
Ethernet-bus Based Networks
The following guidelines apply to Ethernet-bus based networks:
➤
Networks with only 2 active machines communicating yield a maximum
of 90% bandwidth utilization.
➤
Networks with 3 active machines communicating yield a maximum of
approximately 85% bandwidth utilization.
➤
As the number of active machines on the network increases, the total
bandwidth utilization decreases.
Working on a WAN or Heavily Loaded LAN
When you work with LoadRunner on a WAN or heavy loaded LAN, you may
notice some unusual LoadRunner behavior, which indicates network
problems. The Output window may contain messages about retries, lost
packets, or message mismatch. This is because some of the messages from
the Controller may not be reaching the LoadRunner agent. To solve this
problem, you should reduce the network traffic or improve the network
bandwidth.
The following steps may help reduce network traffic:
➤
Click the Run-Time Settings button and select the General: Log node.
Clear the Enable logging check box.
➤
Initialize all users before running them. Run them only after initialization
is completed.
665
Chapter 39 • Troubleshooting Online Monitors
666
Index
A
D
activating rstatd 482
Adobe Reader 6
agent
daemon 105
Apache counters 516
Application Deployment Solutions monitors
589
Application Lifecycle Management
connecting to 339
managing scenarios with 337
Application Lifecycle Managment
managing scenarios 338
Auto Load Analysis 30
Available Graphs tree 305
Data Points graph (online) 473
Database Server Resource monitors 531
DB2 graph 309
default counter, changing 446
Dialog 371
E
ERP/CRM Server Resource monitors 563
Error - Vuser state
Running Vusers graph 473
Error Statistics graph 305, 474
Ethernet-bus based network 665
F
C
Check Point FireWall-1
monitor 481
CheckPoint FireWall-1 graph 308
Citrix MetaFrame graph 310
Citrix monitor dialog 600
collate results
manually 251
collating data
excluding log files 324
Configure SNMP by MIB dialog 493
Configuring 429
Connections graph 307, 468
Connections per Second graph 307, 468
Controller
running from the command line 649
controller_host 219
controller_path 219
converting a scenario
to Percentage mode 55
Finished - Vuser state
Running Vusers graph 473
Firewall Server monitors
Check Point FireWall-1 481
firewalls
monitoring over 353
running Vusers over 349
firewalls, network monitoring 501
G
Getting Started 6
graphs
CheckPoint FireWall-1 308
Citrix MetaFrame 310
Connections 307
Connections per Second 307
DB2 309
Error Statistics 305
Hits Per Second 306
667
Index
HTTP Responses per Second 306
IBM WebSphere MQ 310
J2EE 310
Media Player Client 309
Microsoft Active Server Pages 309
Microsoft COM+ 310
Microsoft IIS 308
Network Client 310
Network Delay Time 308
Oracle 309
Pages Downloaded per Second 306
PeopleSoft (Tuxedo) 310
RealPlayer Client 309
Retries per Second 307
Running Vusers 305
SAPGUI 310
Server Resources 308
Siebel Server Manager 310
SiteScope 308
SNMP Resources 308
SQL Server 309
SSLs per Second 307
Throughput 306
Total Transactions Per Second
(Passed) 306
Transaction Per Second (Failed,
Stopped) 306
Transaction Per Second (Passed) 305
Transaction Response Time 305
Tuxedo 310
UNIX Resources 307
User-Defined Data Points 305
Vusers with Errors 305
WebLogic (SNMP) 309
Windows Resources 307
graphs, See online graphs
GUI Vusers, defined 24
H
Hits Per Second graph 306
Hits per Second graph 464
hme0 device 187, 188
Host Security Manager utility
introduction 630
master key 630
668
How 533
HP Software Support Web site 12
HP Software Web site 13
HP, configuring IP addresses 187
HTML
exporting graphs to 296
HTTP Response per Second graph 465
HTTP Responses per Second graph 306
I
IBM WebSphere MQ graph 310
Infrastructure Resources monitors
Network Client 621
ing 523
initialization quota 113
IP addresses
configuring on HP 187
configuring on Linux 187, 188
configuring on Solaris 187, 188
J
J2EE graph 310
K
Knowledge Base 12
L
Linux, configuring IP addresses 187, 188
load balancing 102
load generator 101, 183
load generator configuration
disabling load generators 102
initializing quota 113
WAN emulation 199
load generators 20
balancing 102
defined 20
LoadRunner 381
emulating human users with Vusers
20
LoadRunner Analysis User’s Guide 7
LoadRunner Controller User’s Guide 7
LoadRunner Installation Guide 7
Index
log files
excluding from data collation 324
lr_user_data_point 473
lution 18
M
manual scenario
Percentage mode 53, 161, 627
measurements
customizing in online graph 293
Media Player Client graph 309
Microsoft Active Server Pages graph 309
Microsoft COM+ graph 310
Microsoft IIS counters 516
Microsoft IIS graph 308
middleware
response time measurements 46
system configuration 41
monitoring over a firewall 353
monitors
application deployment solutions 589
database server resources 531
ERP/CRM server resources 563
infrastructure resources 621
network 497
network delay 497, 498
run-time 472
system resources 477
transaction 474
Web resources 463
Web server resources 513
monitors over firewall 353
configuring properties 365
multiple IP addresses
enabling 226
N
Network
Delay Time graph 508
Network Client graph 310
Network Client monitor 621
network client monitor counters 623
Network Delay
destination machines 505
Network Delay Time graph 308
Network Monitor 497
Network monitor
determining bottlenecks 498
monitoring over a firewall 501
packets 498
network monitor
troubleshooting 510
New Monitored Server Properties dialog box
367
O
online graphs
Available Graphs tree 305
customizing 293
data point 473
exporting to HTML 296
freezing 296
freezing during scenario run 296
line color 301, 302
managing 296
merging two graphs 296, 304
modifying a measurement scale 302
overlaying 296
show/hide lines 302
viewing data offline 290
online monitors
changing default counters 446
graphs 290
show/hide lines 302
viewing data offline 290
online transaction monitoring
graphs 474
Oracle 11i Diagnostics
disabling diagnostics password
request 411
setting diagnostics password 410
Oracle counters 552
Oracle graph 309
P
packets 498
Pages Downloaded per Second graph 306,
466
669
Index
path translation 214
script path 70
path translation table 219
PeopleSoft (Tuxedo) graph 310
Percentage mode 53, 161, 627
converting a scenario to Percentage
Mode 55
creating a scenario 53, 161, 627
Q
Quality Center
command line arguments 651
R
Ready - Vuser state
Running Vusers graph 472
RealPlayer Client graph 309
relative paths for scripts 70
Remote Agent Dispatcher (Process) 23
remote security configuration 630
remote_host 220
remote_path 219
rendezvous
attributes 316
response time measurement
end-to-end 45
GUI 45
middleware-to-server 46
network and server 45
server 46
results
manual collation 251
Retries per Second graph 307, 467
rsh connection, for UNIX network monitor
504
rstatd process
activating 482
resource monitors 482
Running - Vuser state
Running Vusers graph 472
running over firewall 349
Running Vusers graph 305
Run-Time graphs 471
670
S
SAPGUI
monitor measurements 572
SAPGUI graph 310
scenario
conversion to Percentage mode 55
running 247
scenario execution 247
overview 248
scenario mode, changing 65
scenario run
freezing graphs 296
scenario schedules
by scenario/group 128
run modes 130
Scenarios
ALM integration 337
scripts
relative path locations 70
secure host communication
best practices 632
configuring security settings 629
overview 628
remote security configuration 630
UNIX load generator 631
server monitors
cloning a server 367
configuring properties 365
Server Resource monitor 479
Server Resources Configuration dialog 460
Server Resources graph 308
Services.UserDataPoint(Value,Name) 473
show/hide measurements 302
Siebel Diagnostics
enabling Siebel diagnostics 393
generating application server IDs 394
optimizing server performance
settings 393
Siebel Server Manager graph 310
Siebel Server Manager monitor
troubleshooting 580
SiteScope Configuration dialog 460
SiteScope graph 308
SNMP Configuration dialog 460
SNMP Resources graph 308
Index
Solaris
configuring IP addresses 187, 188
SQL Server graph 309
SSLs per Second graph 307, 468
status
Vusers 71
Streaming Media monitors 558
System Resource monitors 477
T
Terminal Services 193
Throughput graph 306, 464
Total Transactions Per Second (Passed) graph
306
Transaction monitors 471
Transaction Per Second (Failed, Stopped)
graph 306
Transaction Per Second (Passed) graph 305
Transaction Response Time graph 305
transactions 20
deciding which to define 47
Total Transactions per Second
(Passed) graph 474
Transaction Response Time graph 474
Transactions per Second (Failed,
Stopped) graph 474
Transactions per Second (Passed)
graph 474
troubleshooting
monitors 659
network considerations 663
Troubleshooting and Knowledge Base 12
Tuxedo graph 310
Tuxedo performance counters 613
Tuxedo tpinit file 615
Vuser 23
Vuser quota 113, 234
Vuser scripts 20
Vuser states
Run-Time graphs 472
Vuser statuses 71
Vusers
defined 20
GUI Vusers 24
Vusers with Errors graph 305, 474
W
WAN emulation 199
best practices 206
emulated locations 201
excluding machines 202
limitations 207
monitoring 202
typical network settings 200
wan emulation
running a scenatio 204
Web Resource monitors 463
Connections graph 468
Connections per Second graph 468
Hits per Second graph 464
HTTP Response per Second graph 465
Pages Downloaded per Second graph
466
Retries per Second graph 467
SSLs per Second graph 468
Throughput graph 464
Web Server Resource monitors 513
WebLogic (SNMP) graph 309
Windows Resources graph 307
U
UNIX
activating rstatd 482
UNIX Resources graph 307
User-Defined Data Points graph 305, 473
V
V$SYSSTAT table 552
671
Index
672