1
Web Intelligence Rich Client User's
Guide
Web Intelligence Rich Client User's Guide
Copyright
© 2008 Business Objects. All rights reserved. Business Objects owns the following
U.S. patents, which may cover products that are offered and licensed by Business
Objects: 5,555,403; 5,857,205; 6,289,352; 6,247,008; 6,490,593; 6,578,027;
6,831,668; 6,768,986; 6,772,409; 6,882,998; 7,139,766; 7,299,419; 7,194,465;
7,222,130; 7,181,440 and 7,181,435. Business Objects and the Business Objects
logo, BusinessObjects, Business Objects Crystal Vision, Business Process On
Demand, BusinessQuery, Crystal Analysis, Crystal Applications, Crystal Decisions,
Crystal Enterprise, Crystal Insider, Crystal Reports, Desktop Intelligence, Inxight,
the Inxight Logo, LinguistX, Star Tree, Table Lens, ThingFinder, Timewall, Let
there be light, Metify, NSite, Rapid Marts, RapidMarts, the Spectrum Design, Web
Intelligence, Workmail and Xcelsius are trademarks or registered trademarks in
the United States and/or other countries of Business Objects and/or affiliated
companies. All other names mentioned herein may be trademarks of their respective
owners.
Third-party
Contributors
Business Objects products in this release may contain redistributions of software
licensed from third-party contributors. Some of these individual components may
also be available under alternative licenses. A partial listing of third-party
contributors that have requested or permitted acknowledgments, as well as required
notices, can be found at: http://www.businessobjects.com/thirdparty
Contents
Chapter 1
About Web Intelligence
23
How Web Intelligence performs business intelligence over the web.........24
How Web Intelligence performs business intelligence offline....................24
Interacting with Web Intelligence reports...................................................24
Viewing and printing Web Intelligence reports.....................................25
Drilling on Web Intelligence reports......................................................25
Performing on-report analysis..............................................................25
Creating and editing Web Intelligence documents....................................26
Web Intelligence Query - HTML...........................................................26
Web Intelligence Java Report Panel....................................................27
Web Intelligence Rich Client................................................................27
Web Intelligence HTML Report Panel..................................................27
Chapter 2
Installing Web Intelligence Rich Client
29
To install Web Intelligence Rich Client from the BusinessObjects Enterprise
CD..............................................................................................................30
To install Web Intelligence Rich Client from InfoView................................30
Chapter 3
Web Intelligence Rich Client working modes
31
Web Intelligence Rich Client Connected mode.........................................32
Web Intelligence Rich Client Offline mode................................................33
Web Intelligence Rich Client Standalone mode........................................34
Chapter 4
Launching Web Intelligence Rich Client
35
To launch Web Intelligence Rich Client in Connected mode from
InfoView.....................................................................................................36
Web Intelligence Rich Client User's Guide
3
Contents
To launch Web Intelligence Rich Client in Connected mode locally..........37
To launch Web Intelligence Rich Client in Offline mode............................38
To launch Web Intelligence Rich Client in Standalone mode....................39
To log into Web Intelligence Rich Client as a different user.......................40
Chapter 5
To set user preferences in Web Intelligence Rich Client
41
Web Intelligence Rich Client general preferences.....................................42
Web Intelligence Rich Client viewing preferences.....................................43
Web Intelligence Rich Client locale preferences.......................................44
Web Intelligence Rich Client drill preferences...........................................44
To change your password..........................................................................45
Chapter 6
Working with documents in Web Intelligence Rich Client
47
To create a new document in Web Intelligence Rich Client.......................48
To select a universe in Web Intelligence Rich Client............................48
To import documents from the CMS..........................................................48
To select document instances to import from the CMS........................49
To import document instances from the CMS......................................50
To open a document in Web Intelligence Rich Client................................50
To work with open documents in Web Intelligence Rich Client.................51
Saving documents.....................................................................................51
To save a document locally..................................................................51
To export a document to the CMS.............................................................53
To print a document in Web Intelligence Rich Client.................................54
To send a document by E-mail attachment...............................................54
Chapter 7
Working with universes in Web Intelligence Rich Client
57
Universe security in Web Intelligence Rich Client.....................................58
To import a universe from the CMS in Web Intelligence Rich Client.........59
4
Web Intelligence Rich Client User's Guide
Contents
Chapter 8
Accessing Web Intelligence from InfoView
61
To log in to InfoView...................................................................................62
To log out of InfoView................................................................................62
Web Intelligence InfoView options.............................................................63
Web Intelligence document creation and viewing options...................63
To set Web Intelligence drill options.....................................................65
Web Intelligence locale options............................................................67
Chapter 9
Working with queries in Web Intelligence Rich Client
71
How universe objects map to data............................................................72
Classes and subclasses.......................................................................72
Dimension object..................................................................................72
Detail object..........................................................................................72
Measure object.....................................................................................73
Building and using queries........................................................................73
To build and run a query in Web Intelligence Rich Client.....................73
To set query properties.........................................................................74
To interrupt a query..............................................................................75
To remove a query................................................................................76
To duplicate a query.............................................................................76
Multiple queries....................................................................................76
Controlling access to queries....................................................................77
Allow other users to edit all data providers query property..................77
Controlling how queries retrieve data........................................................77
Max retrieval time query property.........................................................77
Max rows retrieved query property.......................................................78
Retrieve duplicate rows query property................................................78
Setting the scope of analysis.....................................................................78
Scope of analysis.................................................................................78
Web Intelligence Rich Client User's Guide
5
Contents
Levels of scope of analysis..................................................................79
To set the scope of analysis.................................................................80
Query contexts...........................................................................................81
What is an ambiguous query?..............................................................81
What is a context?................................................................................81
Choosing a context when you run a query...........................................82
Defining how contexts are used...........................................................82
Using combined queries............................................................................83
Combined queries defined...................................................................83
Types of combined query.....................................................................83
What can you do with combined queries?...........................................84
How does Web Intelligence generate combined queries?...................85
To build a combined query...................................................................85
Combined query structure....................................................................86
Combined query precedence...............................................................87
Merging dimensions from multiple data providers.....................................90
Merged dimensions defined.................................................................90
When to merge dimensions..................................................................90
Choosing which dimensions to merge.................................................91
Merged dimension example.................................................................91
Forcing merged calculations with the ForceMerge function.................93
Creating, editing and deleting merged dimensions..............................95
Understanding the effects of merged dimensions................................97
Filtering queries.......................................................................................104
Query filters defined...........................................................................104
Query filters and report filters compared............................................105
Types of query filter............................................................................106
Filtering data with subqueries..................................................................113
What is a subquery?...........................................................................113
What can you do with subqueries?....................................................113
How do subqueries work?..................................................................113
6
Web Intelligence Rich Client User's Guide
Contents
To build a subquery............................................................................114
Subquery parameters.........................................................................116
Ranking data using database ranking.....................................................118
What is database ranking?.................................................................118
Database ranking parameters............................................................119
To create a database ranking.............................................................120
Filtering data using prompts....................................................................122
What is a prompt?..............................................................................122
Cascading prompts............................................................................123
Hierarchical lists of values..................................................................124
Query filter and prompt operators......................................................124
To create a prompt.............................................................................127
To remove a prompt...........................................................................128
Defining how prompts display............................................................128
Combining prompts............................................................................129
To change the order of prompts.........................................................130
Merging prompts................................................................................130
Chapter 10
Working with reports
131
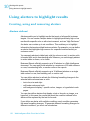
Using alerters to highlight results............................................................132
Creating, using and removing alerters...............................................132
Using formulas to create advanced alerters.......................................136
Merging dimensions from multiple data providers...................................138
Merged dimensions defined...............................................................138
When to merge dimensions................................................................139
Choosing which dimensions to merge...............................................139
Merged dimension example...............................................................140
Forcing merged calculations with the ForceMerge function...............141
Creating, editing and deleting merged dimensions............................143
Understanding the effects of merged dimensions..............................145
Ranking data in Web Intelligence reports................................................152
Web Intelligence Rich Client User's Guide
7
Contents
Ranking data......................................................................................152
Rankings and sorts.............................................................................153
Tied rankings......................................................................................153
Ranking parameters...........................................................................155
Ranking and data order......................................................................158
Ranking workflows.............................................................................158
Ranking examples..............................................................................159
Tracking changes in data.........................................................................163
Tracking changes in your data...........................................................163
Types of data change.........................................................................164
Data tracking modes..........................................................................164
To activate data tracking.....................................................................165
To change the reference data.............................................................165
Displaying changed data....................................................................166
Data tracking limitations.....................................................................173
Using the Web Intelligence formula language to track changed data.174
Changed data and the calculation context.........................................176
Using sections, breaks and sorts.............................................................177
Using sections to group data..............................................................177
Using breaks......................................................................................183
Using sorts to organize data...............................................................187
Calculations, formulas and variables.......................................................189
Calculations, formulas and variables.................................................189
Working with standard calculations....................................................189
Working with formulas........................................................................190
Working with variables.......................................................................192
Filtering reports........................................................................................193
Report filters defined..........................................................................193
Query filters and report filters compared............................................194
Report filter operators.........................................................................194
Creating, editing and deleting report filters........................................197
8
Web Intelligence Rich Client User's Guide
Contents
Drilling on report data..............................................................................199
What is drill?.......................................................................................199
To switch to drill mode........................................................................204
Retrieving more levels of data to the report.......................................204
To choose a drill path when more than one is available.....................205
Drilling on dimensions in tables and sections....................................206
Drilling on measures in tables and sections.......................................211
Synchronizing drill across multiple tables and charts.........................212
Drilling on charts.................................................................................212
Using filters when you drill..................................................................216
Saving reports with drill filters.............................................................217
Refreshing data in a drilled report with prompts.................................218
Drilling with query drill........................................................................218
Filtering data using prompts....................................................................221
What is a prompt?..............................................................................221
Cascading prompts............................................................................222
Hierarchical lists of values..................................................................223
Query filter and prompt operators......................................................223
To create a prompt.............................................................................227
To remove a prompt...........................................................................227
Defining how prompts display............................................................228
Combining prompts............................................................................229
To change the order of prompts.........................................................229
Merging prompts................................................................................230
Displaying data in tables..........................................................................230
Tables in Web Intelligence..................................................................230
Table types in Web Intelligence..........................................................230
Structure View and Results View.......................................................233
Creating, editing and removing tables................................................234
Modifying tables to create crosstabs..................................................239
Formatting tables and table cells.......................................................240
Web Intelligence Rich Client User's Guide
9
Contents
Determining how tables display data.................................................243
Copying tables....................................................................................245
Displaying data in free-standing cells......................................................246
Free-standing cells defined................................................................246
To insert a blank cell on a report........................................................246
To copy a free-standing cell................................................................247
To copy a free-standing cell to another application as text................247
To format a free-standing cell.............................................................248
Displaying data in charts..........................................................................248
Creating charts...................................................................................248
Chart types in Web Intelligence..........................................................248
Adding, copying and removing charts................................................252
Changing the chart type.....................................................................253
Positioning and sizing charts..............................................................255
Formatting charts...............................................................................256
Formatting numbers and dates................................................................261
Predefined and custom formats.........................................................261
Chapter 11
Web Intelligence error messages
269
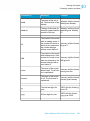
Web Intelligence HTML (WIH) Error Messages.......................................270
Invalid block definition. (WIH 00001)..................................................270
This object has already been inserted. (WIH 00002).........................270
This filter has already been inserted. (WIH 00003)............................271
This document includes advanced formatting that requires the Java Report
Panel. (WIH 00004)............................................................................271
Cannot insert measures on the X-Axis. (WIH 00005)........................272
Cannot insert dimensions or details on the Y-Axis. (WIH 00006)......272
Cannot insert measures on the Z-Axis. (WIH 00007)........................272
You must insert a result object before choosing another tab. (WIH
00008)................................................................................................273
You cannot create a section using a measure. (WIH 00009).............273
10
Web Intelligence Rich Client User's Guide
Contents
You cannot insert dimension or detail objects on the Z-axis of this type
of chart. (WIH 00010).........................................................................273
You cannot insert dimension or detail objects on the X-axis of this type
of chart. (WIH 00011).........................................................................274
Report names cannot be blank. Close this dialog box and then enter a
name for the report. (WIH 00012)......................................................274
The document could not be saved. (WIH 00014)...............................274
Web Intelligence Java Report Panel (WIJ) Error Messages...................275
You need to use the Formula Editor to create a formula. (Error: WIJ
10000) ...............................................................................................275
You cannot create a variable that has the same name as an existing
document object. Give the new variable a different name. (Error: WIJ
10001)................................................................................................275
You cannot position this report component in relation to\na block, cell, or
section that is positioned relative\nto this report component. Select a
different block,\ncell or section in the \"Relative to...of\" dropdown\nlist or
unselect the \"Relative to\" option. (Error: WIJ 10500).......................276
The Web Intelligence Java Report Panel requires the Java Runtime
Environment (JRE) 1.4.2_01. The currently installed JRE is {0}. Contact
your Business Objects administrator to upgrade to 1.4.2_01 or select the
[default VM] entry in the [Java Plug-in Control Panel], if you already have
the required version installed. (Error: WIJ 11111)...............................276
An error occurred while the document was being decoded. Try to open
the document in InfoView. If this doesn't work, see your Business Objects
administrator. (Error: WIJ 20000).......................................................277
An unexpected problem occurred when Web Intelligence tried to refresh
the document data and open the document.\nThe data source has been
modified or deleted, or a prompt on the document has no value selected.
(Error: WIJ 20001)..............................................................................277
Unexpected error\nIf you cannot reconnect to the server, close Web
Intelligence and start again. (WIJ 20002)...........................................278
Unable to get the first page of the current report - Web Intelligence will
switch to structure view (WIJ 20003).................................................278
Web Intelligence Rich Client User's Guide
11
Contents
The query in this document is empty. Check that the Result Objects pane
on the query tab includes objects before running the query (ERR WIJ
30000)................................................................................................279
At least one query in this document is empty. Check that the Result
Objects pane on each query tab includes objects before running the
queries (ERR WIJ 30001)..................................................................279
Out of memory.\nReduce the browser window size or re-launch the report
panel. (Error: WIJ 30003)...................................................................279
Your user profile does not allow you to save personal or corporate
documents. Contact your Business Objects administrator (ERR WIJ
40001)................................................................................................280
An unexpected error occurred. Contact your Business Objects
administrator with details of the actions you performed before the error
occurred. (Error: WIJ 44444)..............................................................280
The information sent to the server contains invalid character(s).\n Use
the Undo button to cancel the latest changes to the document and then
retry. (Error: WIJ 55555).....................................................................281
Web Intelligence cannot retrieve this document due to a server problem
or an error in the document structure. See your Business Objects
administrator. (Error: WIJ 77777).......................................................281
Your Web Intelligence session has timed out. Log out and log in again
to InfoView. (Error: WIJ 77778)..........................................................281
Web Intelligence Server (WIS) Error Messages......................................282
Some objects are no longer available in the universe. (WIS00001)...282
Some objects are not available to your user profile. You cannot refresh
this document. See your Business Objects administrator. (Error: WIS
00002)................................................................................................283
Some pre-defined filters are no longer available in the universe.
(WIS00003)........................................................................................283
Some database tables are no longer available in the universe. See your
Business Objects administrator. (Error: WIS 00004)..........................283
Invalid Prompt definition. See your BusinessObjects administrator.
(WIS00005)........................................................................................284
Invalid Aggregate Aware definition. See your Business Objects
administrator. (Error: WIS 00006).......................................................284
12
Web Intelligence Rich Client User's Guide
Contents
A filter contains a wrong value. You cannot run this query.
(WIS00007)........................................................................................284
The query cannot run, because it contains incompatible objects. See your
Business Objects administrator. (Error: WIS 00008)..........................285
The query cannot run as an advanced filter contains an incompatible
object. See your BusinessObjects administrator. (WIS00009)...........285
The universe does not allow using a complex expression in a GROUP
BY statement. You cannot run this query. See your BusinessObjects
administrator. (WIS00010)..................................................................286
The object(s): {obj_list} contain multiple attributes. This syntax is no longer
supported in this version. See your Business Objects administrator. (Error:
WIS 00011).........................................................................................286
You can not run this query as it will produce a Cartesian product. See
your BusinessObjects administrator. (WIS00012)..............................287
SQL generation failed. See your BusinessObjects administrator.
(WIS00013)........................................................................................288
Aggregate aware resolution failed. (WIS00014)................................288
Multiple query filters contain a prompt with the same text, but the prompts
use a different operand type or operator count of values. (Error: WIS
00015)................................................................................................288
The Query contains an @script() function, which is not supported. See
your BusinessObjects administrator. (WIS00016)..............................289
The following objects cannot be used as Result Objects: {0}.
(WIS00017)........................................................................................290
The following objects cannot be used as Query Filters: {0}. See your
BusinessObjects Designer to resolve the conditional object.
(WIS00018)........................................................................................290
A query filter object contains too many values for the object to be used
in a query filter. (Error: WIS 0019) (WIS 00019)................................291
The SQL generated by the query is invalid. (WIS00020)...................291
This combined query is too complex. One of the queries contains
incompatible objects. (WIS00021).....................................................291
The query does not reference any table. (WIS00022).......................292
Web Intelligence Rich Client User's Guide
13
Contents
Invalid sub-query filter. Either data cannot be retrieved (null) or no result
objects are defined (Error: WIS 00023)..............................................292
Incompatible object types in the sub-query filter (WIS00024)............292
The query is too complex to apply a sampling function. When the function
is applied, no SQL is generated so query aborts. Try to simplify your
query ( such as, combined query, or query with JOIN or SYNCHRO
operators) (Error: WIS 00025)............................................................292
Failed to regenerate SQL for optional prompts: one or more requred
prompts were skipped. (WIS00026)...................................................293
Removing skipped prompts from the query will introduce new prompts.
This introduces complexities that cannot be supported. (Error: WIS
00027)................................................................................................293
You must specify a value for the Keydate parameter. (WIS 00028)....294
The universe is already open with write permission by another user. (WIS
00029)................................................................................................294
Universe not found. See your Business Objects administrator. (Error:
WIS 00501)........................................................................................294
User rights not found. See your Business Objects administrator. (Error:
WIS 00502)........................................................................................295
You are not authorized to access the universe {0}. See your
BusinessObjects Universe Designer or administrator to request rights.
(WIS00503)........................................................................................295
You do not have the right to access data for this universe. See your
BusinessObjects Universe Designer or administrator to request rights.
(WIS00504)........................................................................................295
You do not have the right to access data for this universe connection.
See your BusinessObjects Universe Designer or administrator to request
rights. (WIS00505).............................................................................296
Could not download the universe {unv_name} from the CMS for the
following reason: {cachemgr_errmsg}. See your Business Objects
administrator for further information. (Error: WIS 00506)...................296
You do not have the right to access data for this core universe. See your
BusinessObjects Universe Designer or administrator to request rights.
(WIS00507)........................................................................................296
Single Sign On is not supported on unix platforms. (WIS00508).......297
14
Web Intelligence Rich Client User's Guide
Contents
Universe data connection could not be found. The connection has been
deleted or you don't have the right to use it. (WIS00509)..................297
The system cannot generate the SQL for this query because one of its
objects is based on a derived table (table_name) that contains a loop in
its definition. Please contact your administrator for more details. (WIS
00510)................................................................................................297
The system cannot generate the SQL for this query because one of its
objects is based on a derived table (table_name) that is unknown. Please
contact your administrator for more details. (WIS 00511)..................298
The system cannot generate the SQL for this query because one of its
objects is based on a derived table (table_name) with an incorrect
definition. Please contact your administrator for more details. (WIS
00512)................................................................................................298
Syntax error in formula '%1%' at position %2%. (WIS 10001)...........298
Problem initializing the dictionary of functions. (WIS 10002).............299
The object '%1%' at position '%2%' is not unique in the report. (WIS
10005)................................................................................................299
The object '%1%' at position '%2%' does not exist in the report. (WIS
10006)................................................................................................299
Unexpected empty expression after '='. (WIS 10009)........................300
The number '%1%' at position '%2%' has a format that is incompatible
with your regional settings. (WIS 10012) ..........................................300
The integer '%1%' at position '%2%' is too long. (WIS 10013)..........300
The number '%1%' at position '%2%' has a format that is incompatible
with your regional settings. (WIS 10014)...........................................301
Missing quotation mark after '%1%' at position '%2%'. (WIS 10016)..301
The object name '%1%' at position '%2%' is ambiguous. (WIS 10019)
...........................................................................................................301
Empty list of Identifier is not allowed in this input/output context. (WIS
10032)................................................................................................302
The variable '%1%' cannot be deleted because it has dependant formulas
or variables linked to: '%2%' (WIS 10033).........................................302
The variable '%1%' already exists. (WIS 10034)...............................302
Web Intelligence Rich Client User's Guide
15
Contents
The date or time format '%1%' at position '%2%' is not valid. (WIS
10035)................................................................................................303
The expression or sub-expression at position '%2%' is not valid. (WIS
10036)................................................................................................303
The expression or sub-expression at position '%2%' in the '%1%' function
uses an invalid data type. (WIS 10037).............................................303
Invalid character '%1%' in variable name at position '%2%'. (WIS
10038)................................................................................................304
The context of the measure '%1%' at position '%2%' is not valid. (WIS
10039)................................................................................................304
The formula for variable '%1%' contains a reference to a variable with
the same short name. You must use the fully-qualified variable name in
the formula to remove this ambiguity. (WIS 10040)...........................304
Incorrect use of multiple comparison operators (<,>,<>,<=,>=,=) at position
'%2%'. (WIS 10041)...........................................................................305
There is a circular reference because the formula for variable '%1%'
references a variable whose formula references '%1%'. (WIS 10042).305
There is no opening parenthesis after function '%1%' at position %2%.
(WIS 10060).......................................................................................305
The function '%1%' has missing arguments or closing parenthesis at
position %2%. (WIS 10061)...............................................................306
Missing ';' before argument in function '%1%' at position %2%. (WIS
10062)................................................................................................306
Missing ';' or closing parenthesis in function '%1%' at position %2%. (WIS
10063)................................................................................................306
Missing ';' or closing parenthesis in list '%1%' at position %2%. (WIS
10064)................................................................................................307
Missing closing parenthesis in function '%1%' at position %2%. (WIS
10065)................................................................................................307
Missing aggregate operator or closing parenthesis in function '%1%' at
position %2%. (WIS 10066)...............................................................307
Missing operator or closing parenthesis in '%1%' at position %2%. (WIS
10067)................................................................................................308
Missing list element in '%1%' at position %2%. (WIS 10068)............308
16
Web Intelligence Rich Client User's Guide
Contents
Missing object identifier in '%1%' at position %2%. (WIS 10069)......308
Missing or bad operand in '%1%' expression at position %2%. (WIS
10070)................................................................................................308
Incorrect calculation context %1%' at position %2%. (WIS 10071)....309
Incorrect reset context at position %2%. (WIS 10072).......................309
Invalid Where clause in function '%1%' : a dimension is missing at position
%2%. (WIS 10073).............................................................................309
The object '%1%' at position %2% is incompatible. (WIS 10076)......310
The object '%1%' at position %2% is incompatible. (WIS 10077)......310
Invalid character '%1%' at position %2%. (Error: WIS 10080)...........310
Invalid string '%1%' at position %2%. (WIS 10082)...........................310
The qualification of the variable '%1%' cannot be changed. (WIS
10083)................................................................................................311
Your database server does not support the Both and Except operators.
(WIS 10701).......................................................................................311
A filter is defined on an object that is incompatible with the objects selected
on the Result Objects pane. (WIS 10702)..........................................312
The numeric value for the query filter based on '{object}' is invalid . (WIS
10703)................................................................................................312
The date for the query filter based on '{object}' is invalid . (WIS
10704)................................................................................................312
The prompt '{prompt}' contains an invalid numeric value. (WIS
10705)................................................................................................313
The date for the prompt '{prompt}' is invalid. (WIS 10706).................313
The server cannot build the SQL for the query. (WIS 10707)............313
You do not have the right to refresh this document. (WIS 10801)......314
The query SQL has {nbHaving} instead of {nbWanted} columns.(WIS
10810)................................................................................................314
Column ({nCol}) has an invalid type. (WIS 10811).............................314
CustomSQL can not containt optional prompts. (WIS 10812)...........315
Incompatible objects cannot be used in combined queries. (WIS
10820)................................................................................................315
Web Intelligence Rich Client User's Guide
17
Contents
A subquery in the '{dp_name}' data provider has missing objects. (WIS
10830)................................................................................................315
The filtered object is missing in a ranking in the '{dp_name}' data provider.
(WIS 10831).......................................................................................316
The rank-based object is missing in a ranking in the '{dp_name}' data
provider. (WIS 10832)........................................................................316
The document cannot be loaded. (WIS 10833).................................316
Additional context resolution not supported with optional prompts. (WIS
10834)................................................................................................317
Column "{col_name}" contains invalid data. (WIS 10840).................317
Invalid UTF-8 string in the column "{col_name}". (WIS 10841)..........317
Cannot create or update the query on the file "{filename}". (WIS
10850)................................................................................................318
Cannot refresh the query on the file "{filename}". (WIS 10851).........318
Unable to refresh the query on this file : the structure of file "{filename}"
does not match. (WIS 10852).............................................................318
Unable to create or update the Excel personal data provider: the file path
is invalid. (WIS 10870).......................................................................319
Unable to create or update the Excel personal data provider: the workbook
is protected. (WIS 10871)...................................................................319
Unable to create or update the Excel personal data provider: cannot open
the workbook. (WIS 10872)................................................................319
Unable to create or update the Excel personal data provider: cannot
retrieve the named ranges. (WIS 10873)...........................................320
Unable to create or update the Excel personal data provider: cannot
retrieve data from the file. (WIS 10874).............................................320
Unable to create or update the Excel personal data provider: cannot
retrieve data from the file. (WIS 10875).............................................320
Unable to create or update the Excel personal data provider: cannot build
the iterator on the data set. (WIS 10876)...........................................321
Unable to create or update the Excel personal data provider: no worksheet
available. (WIS 10877).......................................................................321
Unable to create or update the Excel personal data provider: unable to
retrieve the list of worksheets. (WIS 10878)......................................321
18
Web Intelligence Rich Client User's Guide
Contents
Unable to create or update the Excel personal data provider: invalid
information retrieved from the selected range. (WIS 10879).............322
Unable to create or update the Excel personal data provider: the selected
worksheet is invalid. (WIS 10880)......................................................322
Unable to create or update the Excel personal data provider: an error
occured while retrieving the data sampling. (WIS 10881)..................322
Unable to create or update the Excel personal data provider: an error
occured while creating the data iterator. (WIS 10882).......................323
Unable to create or update the Excel personal data provider: an error
occured during data retrieval. (WIS 10883).......................................323
Unable to create or update the Excel personal data provider: an internal
error occured. (WIS 10884)................................................................323
Unable to create or update the Excel personal data provider: the range
selection is invalid. (WIS 10885)........................................................324
Unable to create or update the Excel personal data provider: the range
selection does not match the worksheet. (WIS 10886)......................324
A database error occured. The database error text is: {error_db}. (WIS
10901)................................................................................................324
Could not retrieve data because the query timed out. The database error
text is: {error_db}. (WIS 10902)..........................................................325
The query contains the field '{db_fieldname}' which has an invalid data
type. (WIS 10903)..............................................................................325
The query in this document is empty. (WIS 30000) ...........................325
At least one query in the document is empty. (WIS 30001) ..............326
Your security profile does not include permission to edit the queries in
Web Intelligence documents. (WIS 30251) .......................................326
Your security profile does not include permission to edit Web Intelligence
documents. (WIS 30252) ...................................................................326
Your security profile does not include permission to refresh Web
Intelligence documents. (WIS 30253) ...............................................327
Your security profile does not include permission to refresh lists of values.
(WIS 30254) ......................................................................................327
Your security profile does not include permission to use lists of values.
(WIS 30255) ......................................................................................328
Web Intelligence Rich Client User's Guide
19
Contents
Your security profile does not include permission to view the SQL
generated by the query. (WIS 30256) ...............................................328
Your security profile does not include permission to use the Web
Intelligence formula language. (WIS 30257) .....................................328
Your security profile does not include permission to perform drill analysis.
(WIS 30258) ......................................................................................329
Your security profile does not include permission to extend the scope of
analysis. (WIS 30259) .......................................................................329
An internal error occurred while calling the {api_name} API. (WIS 30270)
...........................................................................................................329
The document is too large to be processed by the Web Intelligence server.
(WIS 30271) ......................................................................................331
The document is too large to be processed by the Web Intelligence server.
(WIS 30272) ......................................................................................331
Web Intelligence cannot build the query or generate the report.(WIS
30351) ...............................................................................................332
A query with this name already exists. (WIS 30371) .........................332
You cannot edit this document, because the query property option "Allow
other users to edit the query" was not enabled when the document was
created. (WIS 30381) ........................................................................333
An internal error has been generated by the WIQT. Contact your
BusinessObjects administrator. (WIS 30551) ....................................333
Your Web Intelligence WIQT session has reached timeout. Log out and
log in again to InfoView. (WIS 30553) ...............................................333
No more WIQT servers are available. The maximum number of concurrent
users is already logged into Web Intelligence. (WIS 30554) .............334
Your security profile does not include permission to save documents as
corporate documents or to send documents via InfoView. (WIS 30555)
...........................................................................................................334
A Corporate document with this name already exists. Your security profile
does not include permission to delete corporate documents created by
other users. (WIS 30556) ..................................................................335
There is no document with this name in InfoView. Specify a different
document name. (WIS 30557) ..........................................................335
20
Web Intelligence Rich Client User's Guide
Contents
Web Intelligence cannot perform the intended action on this document.
(WIS 30650) ......................................................................................336
The Web Intelligence server failed to load the XML document. Contact
your BusinessObjects administrator. (WIS 30751) ............................336
The XML file for this document cannot be opened. Contact your
BusinessObjects administrator. (WIS 30752) ....................................337
An error occurred while parsing the Web Intelligence XML document.
Contact your BusinessObjects administrator. (WIS 30753) ..............337
The Web Intelligence 2.x document could not be migrated. (WIS 30761)
...........................................................................................................338
This document cannot be migrated. The query and report of the original
Web Intelligence 2.x document are not synchronized. Try to refresh and
save the original document; then attempt migration again. (WIS 30762)
...........................................................................................................338
The Web Intelligence 2.x document could not be migrated, because the
WIQT module returned an error. Contact your administrator. (WIS 30763)
...........................................................................................................339
Your user profile does not provide you with access to a document domain
to save corporate documents. Save this document as a personal
document or contact your Business Objects administrator. (WIS 40000)
...........................................................................................................339
Web Intelligence Rich Client (WIO) Error Messages...............................340
Web Intelligence Offline cannot log in. (WIO 00001) ........................340
Appendix A
Get More Help
341
Index
345
Web Intelligence Rich Client User's Guide
21
Contents
22
Web Intelligence Rich Client User's Guide
About Web Intelligence
1
1
About Web Intelligence
How Web Intelligence performs business intelligence over the web
How Web Intelligence performs business
intelligence over the web
Web Intelligence provides business users an easy to use interactive and
flexible user interface for building and analyzing reports on corporate data
over the web, on secured intranets and extranets. The Web Intelligence
software is installed by your administrator on a web server on your corporate
network.
To use Web Intelligence from your local computer, you log into the business
intelligence portal InfoView via your Internet browser. Then, depending on
your security profile, you can interact with the reports in corporate documents
or edit or build your own documents using a Web Intelligence report panel
or query panel.
How Web Intelligence performs business
intelligence offline
Web Intelligence can be used offline as Web Intelligence Rich Client, a
standalone Microsoft Windows application, equivalent to the Java Report
Panel, that you can install on your computer. Web Intelligence Rich Client
lets you continue to work with Web Intelligence (WID) documents when you
are unable to connect to a CMS, when you want to perform calculations
locally rather than on the server, and when you want to work with Web
Intelligence documents without installing a CMS or application server.
Web Intelligence Rich Client can also be used when connected to a CMS.
Interacting with Web Intelligence reports
Depending on your security profile and on how Web Intelligence is deployed
across your organization, you can view, analyze, or enhance and modify the
data displayed on reports.
24
Web Intelligence Rich Client User's Guide
About Web Intelligence
Interacting with Web Intelligence reports
Viewing and printing Web Intelligence reports
Once logged into the business intelligence portal InfoView, you can access
Web Intelligence documents and view reports. Onscreen navigation is made
easy with page-to-page navigation buttons and a document map that allows
you to jump from section to section or report to report.
The same document can provide the information adapted to each user due
to prompts that request each user, who opens the document, to specify the
data they want to return to the reports.
When you print reports, Web Intelligence automatically generates a copy of
reports in Portable Document Format (PDF) format for optimum print quality.
Drilling on Web Intelligence reports
Drilling on Web Intelligence reports enables you to analyze the detailed data
behind the displayed results. You can turn the report you are viewing into a
drillable report or drill on a duplicate of the original report to retain a version
of the results before your drill analysis.
Once you have found the information you need, you can save a snapshot
of the drilled report to share the results of your analysis with other Web
Intelligence users, or save the document in Excel or Portable Document
(PDF) format to print or email to other business contacts.
Performing on-report analysis
Viewing Web Intelligence reports in Interactive view format enables you to
enhance reports and fine-tune the data reports contain, to highlight the
information that most interests you on demand.
On-Report Analysis is designed for:
•
•
users who need to build queries and then want to build reports
report consumers who need to manipulate the reports created by others
With On-Report Analysis you can:
Web Intelligence Rich Client User's Guide
25
1
1
About Web Intelligence
Creating and editing Web Intelligence documents
•
•
•
•
•
•
view document metadata to understand the data behind reports and see
how reports are structured and filtered
filter and sort results
add new tables and charts
add formulas and create variables
format and change the layout of charts and tables
slice and dice results by adding other data to charts and tables
Note: On-report analysis of Web Intelligence reports in Interactive view
format is only available if your administrator has deployed Web Intelligence
in JSP mode.
Creating and editing Web Intelligence
documents
You can create or edit Web Intelligence documents using several tools:
•
•
•
•
Web Intelligence Query - HTML on page 26
Web Intelligence Java Report Panel on page 27
Web Intelligence Rich Client on page 27
Web Intelligence HTML Report Panel on page 27
Web Intelligence Query - HTML
Designed for users requiring a pure HTML environment to build queries,
Web Intelligence Query – HTML offers the ability to define the data content
of documents on multiple data sources. You can use Query – HTML to create
new documents from scratch or edit the queries in documents created using
any of the other Web Intelligence tools.
Used together with On-Report Analysis, Query – HTML provides a complete
solution for building queries and designing powerful reports in a pure HTML
environment. Once you have run the queries to generate a standard report,
you can leverage Web Intelligence On-Report Analysis features to format
multiple reports, add formulas, and create variables.
Note: Web Intelligence Query – HTML and On-Report Analysis in Interactive
view format are only available, if your administrator has deployed Web
Intelligence in JSP mode.
26
Web Intelligence Rich Client User's Guide
About Web Intelligence
Creating and editing Web Intelligence documents
Web Intelligence Java Report Panel
The Java Report Panel is designed for users who need more flexibility with
designing report layout and defining formulas and variables. A graphical
Formula Editor enables you to build formulas rapidly using drag-and-drop.
Note: The Web Intelligence Java Report Panel is available if your
administrator has deployed Web Intelligence in ASP mode and if your
administrator has deployed Web Intelligence in JSP mode.
Web Intelligence Rich Client
Web Intelligence Rich Client is a locally installed Microsoft Windows
application that lets you work with Web Intelligence (WID) documents that
are stored locally or in a CMS.
When working without a CMS connection you can work on your local machine
with either CMS-secured or unsecured documents.
Web Intelligence Rich Client is based on the Web Intelligence Java Report
Panel and provides equivalent document creation, editing, formatting, printing
and saving capabilities.
There are a number of reasons for using Web Intelligence Rich Client to
work with WID documents:
•
•
•
You want to work with Web Intelligence documents but you are unable
to connect to a CMS (while traveling, for example).
You want to improve calculation performance: Web Intelligence Rich
Client performs calculations locally, rather than on the server, and local
calculations can perform better than server calculations.
You want to work with Web Intelligence documents without installing a
CMS or application server.
Web Intelligence HTML Report Panel
Designed for users who need to build basic reports, the HTML Report Panel
provides query and report features in a simple wizard-like interface. Each
Web Intelligence Rich Client User's Guide
27
1
1
About Web Intelligence
Creating and editing Web Intelligence documents
document is based on a single data source and can contain multiple reports,
displaying different subsets of information.
In addition, the HTML Report Panel is 508 compliant and can be customized
for specialized deployments.
Note: The Web Intelligence HTML Report Panel is only available if your
administrator has deployed Web Intelligence in JSP mode.
28
Web Intelligence Rich Client User's Guide
Installing Web Intelligence
Rich Client
2
2
Installing Web Intelligence Rich Client
To install Web Intelligence Rich Client from the BusinessObjects Enterprise CD
There are two ways to install Web Intelligence Rich Client:
•
•
from the BusinessObjects Enterprise CD
from InfoView
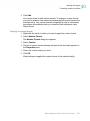
To install Web Intelligence Rich Client
from the BusinessObjects Enterprise CD
•
See the Business Objects Enterprise XI 3.0 Installation Guide for full
installation instructions.
To install Web Intelligence Rich Client
from InfoView
1.
2.
3.
4.
Log into InfoView.
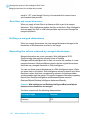
Click Preferences at the top right of the InfoView screen.
Scroll down and click Web Intelligence Preferences.
Click Desktop (Web Intelligence Rich Client required) in the Select a
default creation/editing tool section.
5. Click Document List at the top left of the InfoView screen.
6. Click New > Web Intelligence Document or select an existing document
to edit.
Web Intelligence Rich Client is downloaded to your computer and launched
to create the document.
Note: If you install Web Intelligence Rich Client from InfoView, the Web
Intelligence Rich Client online help system is not installed to your local
computer. If you work in Connected mode, Web Intelligence Rich Client
displays help pages stored on the server. If you work in Offline or Standalone
mode, help pages are not available.
Related Topics
•
30
Web Intelligence Rich Client working modes on page 31
Web Intelligence Rich Client User's Guide
Web Intelligence Rich Client
working modes
3
3
Web Intelligence Rich Client working modes
Web Intelligence Rich Client Connected mode
You can work with Web Intelligence Rich Client in three modes: Connected,
Offline, or Standalone.
Web Intelligence Rich Client Connected
mode
In Connected mode, Web Intelligence Rich Client is connected to a CMS.
You can work with documents on the CMS or with local secured or unsecured
documents. According to your security rights in the CMS, you can do the
following:
• import documents from the CMS
• import universes from the CMS
• open local documents
• create documents
• edit documents
• refresh documents
• save documents locally
• export documents to the CMS
Security in Connected mode
When you work with Web Intelligence documents in Connected mode, the
security rights of your user account are applied by the CMS.
Connecting to the CMS in Connected mode
There are two ways of launching Web Intelligence Rich Client, and each
connects to the CMS differently:
•
•
32
When you launch from InfoView, Web Intelligence Rich Client connects
to the CMS within the same InfoView session, so no login is required.
Communication with the CMS goes via HTTP to an application server,
which reroutes the calls to the CMS and repository. No local middleware
is required.
When you launch locally, by logging in to Web Intelligence Rich Client
through the Windows Start menu or by double-clicking a Web Intelligence
document, Web Intelligence Rich Client connects to the CMS in
client-server mode via the OCA/CORBA framework of the Enterprise
Web Intelligence Rich Client User's Guide
Web Intelligence Rich Client working modes
Web Intelligence Rich Client Offline mode
SDK. You need the appropriate database middleware on your local
machine.
Related Topics
•
To launch Web Intelligence Rich Client in Connected mode locally on
page 37
• To launch Web Intelligence Rich Client in Connected mode from InfoView
on page 36
Web Intelligence Rich Client Offline
mode
In Offline mode, Web Intelligence Rich Client is not connected to a CMS but
applies CMS security. You can work with local documents and universes
that are secured by the CMS you select at login, or with unsecured local
documents and universes. You can do the following:
• open local documents
• create documents (requires local universe and local connection server)
• edit documents
• refresh documents (requires local universe and local connection server)
• save documents locally
In Offline mode, you cannot import documents from or export documents to
a CMS.
Security in Offline mode
When you connect to a CMS in Connected mode, your security rights in that
CMS are downloaded to your computer. Each document and universe
downloaded from a CMS contains within it an access control list identifying
groups and users that have access rights to the document. In Offline mode,
Web Intelligence Rich Client applies CMS security rights by matching the
access rights for the document or universe against the locally stored security
file. For example, if a document was downloaded from a CMS to your local
machine, and you do not have the right to open the document in the CMS
from which it was downloaded, you cannot open the document on your local
machine.
Note: Before you can work in Offline mode with documents or universes
secured by a CMS, you must first have connected to that CMS at least once
Web Intelligence Rich Client User's Guide
33
3
3
Web Intelligence Rich Client working modes
Web Intelligence Rich Client Standalone mode
in Connected mode. This allows Web Intelligence Rich Client to download
the CMS security information to your local machine, and to display the CMS
as a choice in the System list on the login page. You can then log in in Offline
mode and work with no CMS connection because Web Intelligence Rich
Client reads the CMS security information in the local file.
Technical notes
•
•
When working in Offline mode, you must have a connection server
installed on the same machine as Web Intelligence Rich Client to be able
to create or refresh documents. If you do not, you can still open, edit, and
save documents locally as long as you have the appropriate security
rights.
The security information for a CMS is stored in a local security information
file (extension LSI) in the LocData folder under the BusinessObjects Web
Intelligence Rich Client installation folder. One computer can store LSI
files for several CMSs.
Web Intelligence Rich Client Standalone
mode
In Standalone mode, Web Intelligence Rich Client is not connected to a CMS
and no security is enforced. You can work with local, unsecured documents
and universes only. You can do the following:
•
•
•
•
•
open documents
create documents
edit documents
refresh documents
save documents locally
You cannot import documents from or export documents to a CMS.
The middleware required to create and refresh local, unsecured documents
with local, unsecured universes must be installed on the computer with Web
Intelligence Rich Client.
34
Web Intelligence Rich Client User's Guide
Launching Web Intelligence
Rich Client
4
4
Launching Web Intelligence Rich Client
To launch Web Intelligence Rich Client in Connected mode from InfoView
You can launch Web Intelligence Rich Client in any of its three working
modes:
•
•
•
Connected
Offline
Standalone
You can run multiple instances of Web Intelligent Rich Client simultaneously,
in any mode and connected to any available CMS.
The CMS connection status and the current Web Intelligence Rich Client
working mode are shown in the status bar on the lower right of the screen.
Related Topics
•
Web Intelligence Rich Client working modes on page 31
To launch Web Intelligence Rich Client
in Connected mode from InfoView
In Connected mode, security is handled by the CMS. You work with reports
in Web Intelligence Rich Client as you do with the Java Report Panel. You
do not need database middleware on your local machine when you launch
in Connected mode from InfoView.
1. Log into InfoView.
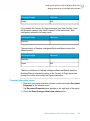
2. Click Preferences at the top right of the InfoView screen.
3. On the Preferences page, scroll down and click Web Intelligence
Preferences.
4. In the Select a default creation/editing tool section, click Desktop (Web
Intelligence Rich Client required).
5. Click OK.
6. At the top left of the screen, click Document List.
7. Open an existing document or click New > Web Intelligence Document
to create a new document.
Web Intelligence Rich Client is launched on your computer in Connected
mode. If it is not yet installed on your computer, it is installed from
InfoView.
36
Web Intelligence Rich Client User's Guide
Launching Web Intelligence Rich Client
To launch Web Intelligence Rich Client in Connected mode locally
If Web Intelligence Rich Client was already running on your computer,
launching from InfoView opens a new instance of the application. The
document is not opened in the application instance that was already open.
Related Topics
•
Web Intelligence Rich Client working modes on page 31
To launch Web Intelligence Rich Client
in Connected mode locally
To launch Web Intelligence Rich Client in Connected mode locally, Web
Intelligence Rich Client must be installed on your computer. You must have
already connected at least once to the CMS you want to work with using
Web Intelligence Rich Client via InfoView.
You need to have the middleware required to connect to the CMS installed
on your computer.
In Connected mode, security is handled by the CMS. You work with reports
in Web Intelligence Rich Client as you do with the Java Report Panel.
When you launch Web Intelligence Rich Client in Connected mode locally,
you have a client-server connection to the CMS. In this case, you can log
out and log in again within the same application session by clicking Tools
> Login As.
1. Start Web Intelligence Rich Client locally in either of two ways:
• Click Start > Programs > BusinessObjects XI Release 3 >
BusinessObjects Enterprise > Web Intelligence Rich Client
• In Windows Explorer, associate the WID file type with Web Intelligence
Rich Client, and then double-click a Web Intelligence (WID) file.
The Web Intelligence login page opens.
2. Select a CMS in the System list.
An icon shows what kind of connection was used for the last connection
with the CMS:
•
An icon of a desktop computer means Web Intelligence Rich Client
last connected to this CMS in client-server mode (local launch from
the client computer). The name of the CMS is the server name.
Web Intelligence Rich Client User's Guide
37
4
4
Launching Web Intelligence Rich Client
To launch Web Intelligence Rich Client in Offline mode
•
An icon of a globe means Web Intelligence Rich Client last connected
to this CMS in HTTP mode (connection via InfoView). The name of
the CMS is the full name of the connected cluster.
3. Enter a valid user name and password.
4. Select an authentication mode from the list.
Do not choose Standalone if you want to work in Connected mode. When
you choose Standalone authentication you work in Standalone mode,
with no CMS connection.
5. Make sure the Use in Offline Mode option is not selected.
6. Click Log In.
Web Intelligence Rich Client is launched in Connected mode. If Web
Intelligence Rich Client was already running on your computer, launching it
again opens a new instance of the application. If you double-clicked a Web
Intelligence document, the document will not be opened in the application
instance that was already open.
Related Topics
•
Web Intelligence Rich Client working modes on page 31
To launch Web Intelligence Rich Client
in Offline mode
To launch Web Intelligence Rich Client in Offline mode, Web Intelligence
Rich Client must be installed on your computer. You must have already
connected at least once to the CMS you want to work with using Web
Intelligence Rich Client via InfoView.
In Offline mode, Web Intelligence Rich Client uses the locally stored security
file of the CMS you want to work with to authenticate documents. You cannot
import to or export from the CMS. To create or refresh documents, you need
to have a connection server installed on your computer.
1. Start Web Intelligence Rich Client in Offline mode in either of two ways:
• Click Start > Programs > BusinessObjects XI 3.0 >
BusinessObjects Enterprise > Web Intelligence Rich Client
• In Windows Explorer, associate the WID file type with Web Intelligence
Rich Client, and then double-click a Web Intelligence (WID) file.
The Web Intelligence login page opens.
38
Web Intelligence Rich Client User's Guide
Launching Web Intelligence Rich Client
To launch Web Intelligence Rich Client in Standalone mode
2. Select a CMS in the System list.
3. Enter a valid user name and password.
4. Select an authentication mode from the list.
Do not choose Standalone if you want to work in Connected mode. When
you choose Standalone authentication you work in Standalone mode,
with no CMS connection.
5. Select the Offline Mode option.
6. Click Log In.
Web Intelligence Rich Client is launched in Offline mode. If Web Intelligence
Rich Client was already running on your computer, launching it again opens
a new instance of the application. If you double-clicked a Web Intelligence
document, the document will not be opened in the application instance that
was already open.
Related Topics
•
•
Web Intelligence Rich Client working modes on page 31
Installing Web Intelligence Rich Client on page 29
To launch Web Intelligence Rich Client
in Standalone mode
To launch Web Intelligence Rich Client in Standalone mode, Web Intelligence
Rich Client must be installed on your computer.
Any middleware required to work with unsecured documents and universes
must be installed on your computer.
In Standalone mode, you cannot work with documents or universes that have
been secured by a CMS.
1. Start Web Intelligence Rich Client in Standalone mode in either of two
ways:
• Click Start > Programs > BusinessObjects XI 3.0 >
BusinessObjects Enterprise > Web Intelligence Rich Client
• In Windows Explorer, associate the WID file type with Web Intelligence
Rich Client, and then double-click a Web Intelligence (WID) file.
The Web Intelligence login page opens.
2. Select Standalone in the Authentication list.
Web Intelligence Rich Client User's Guide
39
4
4
Launching Web Intelligence Rich Client
To log into Web Intelligence Rich Client as a different user
The System, User Name, and Password boxes, as well as the Use in
Offline Mode option, are grayed.
3. Click Log In.
Web Intelligence Rich Client is launched in Standalone mode. If Web
Intelligence Rich Client was already running on your computer, launching it
again opens a new instance of the application. If you double-clicked a Web
Intelligence document, the document will not be opened in the application
instance that was already open.
Related Topics
•
•
Installing Web Intelligence Rich Client on page 29
Web Intelligence Rich Client working modes on page 31
To log into Web Intelligence Rich Client
as a different user
To log into Web Intelligence Rich Client as a different user without exiting
the application, you must have launched Web Intelligence Rich Client via
the Windows Start menu or by double-clicking a local WID file, and then
connected to the CMS in Connected mode.
1. Save any open documents.
2. Click Tools > Login As.
If any documents have not been saved, you are asked if you want to save
them.
3. When you are asked if you are sure you want to log out, click Yes.
Any open documents are closed.
4. In the User Identification box, enter your login information and click OK.
Related Topics
•
To launch Web Intelligence Rich Client in Connected mode locally on
page 37
• Web Intelligence Rich Client working modes on page 31
40
Web Intelligence Rich Client User's Guide
To set user preferences in
Web Intelligence Rich Client
5
5
To set user preferences in Web Intelligence Rich Client
Web Intelligence Rich Client general preferences
1. Click Tools > Options.
The Preferences dialog box opens.
2. Click one of the tabs:
• General: to set general preferences
• Viewing: to set document viewing preferences
• Locale: to set preferences for interface and formatting locales and
how to use them
• Drilling: to set document drill preferences
3. Set preferences and click OK.
The preferences are now applied. They are stored in a file in the LocData
folder under the BusinessObjects Enterprise 12.0 installation folder.
Web Intelligence Rich Client general
preferences
You set general preferences for Web Intelligence Rich Client by clicking
Tools > Options and clicking the General tab of the Preferences box.
General
In the General section, you choose whether to show the welcome wizard
each time Web Intelligence Rich Client is started. The welcome wizard lets
you select from a list of recently used universes or browse for more data
sources to create a new document.
Select default universe
In this section, you choose whether to select a default universe for new
documents. The default universe is pre-selected in the Universe dialog box
when you create a new document. When creating a document, you can use
the default universe or select another one.
•
•
42
No default universe means that no universe in the list is pre-selected
when you open the Universe dialog box. You must select a universe from
the list when creating a document.
The other choice shows the name of the default universe, or None if no
default universe has been selected. To choose a default universe, click
Browse, then browse to and select a universe.
Web Intelligence Rich Client User's Guide
To set user preferences in Web Intelligence Rich Client
Web Intelligence Rich Client viewing preferences
Select default folders
In this section, you choose the default folders in which to store user
documents, universes, and help files. To change the default locations, click
Browse, then browse to and select a folder.
Note: If Web Intelligence Rich Client was downloaded and installed from
InfoView, help files are not installed locally. However, they are installed on
the InfoView server. Contact your company's Business Objects administrator
to get the URL of the help files on the server, then enter the URL here for
help to be available.
Select Microsoft Excel format
In this section you choose the format to use when you save a document in
Microsoft Excel format.
•
•
Prioritize easy data processing in the Excel document: the Excel
document will be formatted to ensure efficient data processing.
Prioritize the format of reports in the Excel document: the Excel
document will be formatted to ensure optimum readability.
Web Intelligence Rich Client viewing
preferences
You set general preferences for Web Intelligence Rich Client by clicking
Tools > Options and clicking the Viewing tab of the Preferences box.
General
In this section, you set the unit of measurement for report display: pixel, inch,
or centimeter.
Grid
In this section you set grid options:
•
•
•
Show grid: When this is selected, a grid is displayed to help align page
elements.
Snap to grid: When this is selected, page elements align to the grid to
enable accurate repositioning.
Grid spacing: This defines the distance between lines on the grid.
Web Intelligence Rich Client User's Guide
43
5
5
To set user preferences in Web Intelligence Rich Client
Web Intelligence Rich Client locale preferences
Web Intelligence Rich Client locale
preferences
You set locale preferences for Web Intelligence Rich Client by clicking Tools
> Options and clicking the Locale tab of the Preferences box.
Locale
In this section, you set preferences for interface and formatting locales. A
locale is a combination of language and geographical area.
•
•
Select interface locale: Select an available locale to set the application
interface language. If you change this setting, you must restart Web
Intelligence Rich Client for the change to be taken into account.
Select formatting locale: Select an available locale to determine
locale-specific formatting (for example, date and time formats). If you
change this setting, any documents that are open must be closed and
reopened for the new formatting locale to be applied.
When viewing a document
In this section, you set how the formatting locale is decided:
•
•
Use the document locale to format the data: When this is selected,
data is formatted according to the document locale. The document locale
can be saved with the document by means of the permanent regional
formatting option that you can select when saving.
Use my formatting locale to format the data: When this is selected,
data is formatted according to your formatting locale preference. This
overrides the document locale.
Web Intelligence Rich Client drill
preferences
You set drill preferences for Web Intelligence Rich Client by clicking Tools
> Options and clicking the Drilling tab of the Preferences box.
For each new drill session
In this section, you choose how to start a new drill session:
44
Web Intelligence Rich Client User's Guide
To set user preferences in Web Intelligence Rich Client
To change your password
•
•
Start drill on duplicate report: When you start a new drill session, a
duplicate report is opened in the document and you drill on the duplicate.
When you end drill mode, both the original report and the drilled report
remain in the document.
Start drill on existing report: When you start a new drill session, the
current report becomes drillable. When you end drill mode, the report
displays the drilled values.
General drill options
•
•
•
Prompt if drill requires additional data: You are prompted when Web
Intelligence needs to retrieve additional data to complete the drill, and
can decide whether to go ahead. If the amount of data is large, the retrieval
can take time and you may decide not to drill. When this option is not
selected, Web Intelligence retrieves the additional data without prompting
you.
Synchronize drill on report blocks: When this is selected, drilled values
are shown in all the report blocks in the report. When it is not selected,
drilled values are shown only in the report block selected for the drill.
Hide drill toolbar: When this is selected, the drill toolbar that is normally
displayed at the top of drilled reports is not shown. The drill toolbar
displays the value on which you drilled. It is only useful if you want to
select filters during your drill session.
To change your password
You can only change your password from Web Intelligence Rich Client if you
are in client-server connection mode: you must have launched Web
Intelligence Rich Client locally rather than from InfoView.
1.
2.
3.
4.
Click Tools > Change Password.
Type your current password in the Enter Old Password box.
Type your new password in the Enter New Password box.
Type your new password again in the Confirm New Password box.
Your password is changed to the new password.
Web Intelligence Rich Client User's Guide
45
5
5
To set user preferences in Web Intelligence Rich Client
To change your password
46
Web Intelligence Rich Client User's Guide
Working with documents in
Web Intelligence Rich Client
6
6
Working with documents in Web Intelligence Rich Client
To create a new document in Web Intelligence Rich Client
To create a new document in Web
Intelligence Rich Client
To create a new document in Web Intelligence Rich Client in Offline mode,
you need to have a connection server installed on your computer. To install
a connection server, do this.........
1. Click Document > New.
2. In the New Document dialog box, click Universe and then Next.
3. In the Universe dialog box, select a universe.
The query panel opens to let you build your report.
To select a universe in Web Intelligence Rich Client
1. Select a universe in the Available Universes list.
A description of the universe appears in the Help on selected universe
box.
2. Click OK.
The query panel opens, showing the universe's data in the Data tab.
You can now use the query panel to build queries in your document.
To import documents from the CMS
1. Click Document > Import from CMS.
2. Locate the files you want to import:
• To search in folders, click Folders and select the CMS folder from
which to choose one or more documents to import.
•
To search in categories, click Categories and select the categories
in which you want to search.
The files that meet the criteria are displayed on the right.
3. To filter the search results, click the Search list and choose a filter:
• Search title
• Search keyword
48
Web Intelligence Rich Client User's Guide
Working with documents in Web Intelligence Rich Client
To import documents from the CMS
•
•
Search description
Search comments
4. In the text box, type the text that you want to search for in the element
you selected (title, keyword, description, or comments), then press Enter.
Documents in the list that do not match the criteria are removed from the
list.
5. Select one or more documents in the list and click Add.
6. Choose options:
• Click Overwrite imported files to have the imported file overwrite the
existing version of the file, if any.
• Click Open documents on retrieval, at the bottom left, for the
documents to open when they have been imported.
7. Click Import.
8. Click Close.
The documents you selected are installed on your disk. If you selected Open
documents on retrieval, they will be opened. Any documents that were
already open will remain open in addition.
To select document instances to import from the CMS
When you import documents from the CMS, more than one instance of the
same document may be available. In the Import Documents dialog box, you
can see the number of instances of a document and import one or more.
1. Click Document > Import from CMS.
The Import Documents dialog box opens, in which you can locate the
CMS documents you want to import.
2. If a document you want to import has multiple instances, double-click in
the Instances column.
The Import document instances dialog box opens.
Related Topics
•
To import document instances from the CMS on page 50
Web Intelligence Rich Client User's Guide
49
6
6
Working with documents in Web Intelligence Rich Client
To open a document in Web Intelligence Rich Client
To import document instances from the CMS
Before you can import document instances from the CMS, you must open
the Import Documents dialog box (Document > Import from CMS) and
double-click in the Instances column for a report with multiple instances, to
open the Import document instances dialog box.
1. In the Import document instances dialog box, select one or more
document instances from the list.
2. Click Open on retrieval if you want the document instances to open when
they have been imported.
3. Click Import.
4. Click Close.
The document instances are imported from the CMS to your computer.
To open a document in Web Intelligence
Rich Client
In Web Intelligence Rich Client, you can open and work with more than one
document in the same session.
1. Click Document > Open.
2. In the Open a document dialog box, select a document.
When you are working in Connected mode, you cannot open local
CMS-secured documents. You can only open documents on the CMS
itself and local, unsecured documents.
3. Click Open.
Related Topics
•
50
Web Intelligence Rich Client working modes on page 31
Web Intelligence Rich Client User's Guide
Working with documents in Web Intelligence Rich Client
To work with open documents in Web Intelligence Rich Client
To work with open documents in Web
Intelligence Rich Client
In Web Intelligence Rich Client, you can have more than one document open
in the same session. Open documents are displayed on separate tabs within
the document window and appear as a list in the Window menu.
•
With more than one document open, choose the one you want to display
in any of three ways:
• Click the Window menu and select a document.
• Click the tab corresponding to the document.
• On the top right of the document tab bar, click the Show List icon to
display and select the document.
The document is displayed. Other documents remain open in the background.
Saving documents
To save a document locally
1. When you are ready to save a document locally, click Document > Save
or Document > Save as, or click the save icon on the toolbar.
2. In the Save in list, select the folder where you want to save the document.
The contents of the folder appear in the display box below the list. Use
the buttons to the right of the list to navigate your file system and control
display.
3. If you are saving the document as a Web Intelligence document, type a
description and keywords for the document if desired.
4. If you are saving the document as a Web Intelligence document, choose
options:
Option
Description
Refresh on open
The document will automatically be refreshed
when it is opened.
Web Intelligence Rich Client User's Guide
51
6
6
Working with documents in Web Intelligence Rich Client
Saving documents
Option
Description
Permanent regional for- The current regional settings (locale) for formatmatting
ting are applied no matter what the locale is on
the machine where it is opened.
Save for all users
All security information stored in the document
is removed, making it accessible to all users
and openable in Standalone mode.
Lock document for cur- The document is locked for the current user.
rent user
Secure document
The document is secured.
5. Type a file name.
6. Select a file type.
The file type that you select filters documents shown in the display box.
You can save in three formats:
• Web Intelligence document
• PDF document
• Excel document
If you save as a PDF or Excel document, you cannot enter a description
or keywords and the options re unavailable.
7. Click Save.
Saving as an Excel or PDF document
Using the Document > Save or Document > Save as command, you can
save a document in any of three formats:
•
•
•
as a Web Intelligence document (default choice)
as a Microsoft Excel document
as a PDF document
Save as an Excel document
Web Intelligence saves a copy of your document in Microsoft Excel format
to the location you specified on your computer. Each report within the Web
Intelligence document converts to a separate Excel worksheet within the
Excel file.
52
Web Intelligence Rich Client User's Guide
Working with documents in Web Intelligence Rich Client
To export a document to the CMS
Note: Some Web Intelligence chart formats do not exist in Excel. These
charts are automatically converted to the closest corresponding chart format
available in Excel.
Save as a PDF document
Web Intelligence saves a copy of your document in Adobe Acrobat PDF
format to the location you specified on your computer.
Related Topics
•
To save a document locally on page 51
To export a document to the CMS
Documents are exported to the CMS in their current state, including all
modifications made since they were created or opened. This means that in
addition to locally saved documents, you can export a document to the CMS
without saving it locally. A newly created document that is exported before
being saved will be given the name "Document X", where X is the document
creation order in the session.
1. With the document you want to export open, click Document > Export
to CMS.
2. In the Export Document dialog box, click the Folders tab, then select the
folder in which you want the document to be published.
3. To associate a category with the document, click the Categories tab and
select one or more available categories.
4. Click Export.
Once you have started the export, you cannot cancel it.
An "Export successful" message appears at the bottom if export was
successful.
5. Click Close.
The document is exported to the CMS, where it is available in the folder you
chose, associated with the categories you chose.
Web Intelligence Rich Client User's Guide
53
6
6
Working with documents in Web Intelligence Rich Client
To print a document in Web Intelligence Rich Client
To print a document in Web Intelligence
Rich Client
1. Click Document > Print.
2. In the Print dialog box, select a printer.
3. Select your print options.
• To print all reports in the document, click All reports.
• To print all pages of the current report, click Current Report and then
All.
• To print only the current page of the current report, click Current
Report and then Current Page.
• To print specific pages in the current report, click Current Report and
then Pages. In the Pages box, enter the pages to print. For a range
of pages, enter the first and last pages separated by a dash. Enter a
comma as a separator between pages or page ranges.
4. Select the page size from the Page Size list.
5. Select the size of the top, left, right, and bottom margins in the Margins
section.
The unit of measurement for the margins is controlled from the Viewing
tab of the Preferences dialog box (Tools > Options.)
6. Select portrait or landscape page orientation in the Orientation section.
7. Select the number of copies to print in the Copies section.
8. Click OK.
To send a document by E-mail attachment
To send a document as an email attachment you must an email application
installed on your computer.
1. With a Web Intelligence document open, click Document > Send by
E-mail attachment.
If several documents are open, the document currently displayed on
screen is the one that is sent as an E-mail attachment.
2. Choose the format in which to send the document:
• Web Intelligence document (.WID)
• As unsecured WID
54
Web Intelligence Rich Client User's Guide
Working with documents in Web Intelligence Rich Client
To send a document by E-mail attachment
• As PDF
• As Excel
The email application opens a new E-mail message with the document
attached. The "Subject" line of the E-mail is the name of the document.
The document that is attached is saved in the format you selected,
including any modifications made since it was created or opened.
3. In the E-mail message, fill in the "To" line, and if desired change the
"Subject" line and write a message in the body of the E-mail.
4. Send the E-mail.
Web Intelligence Rich Client User's Guide
55
6
6
Working with documents in Web Intelligence Rich Client
To send a document by E-mail attachment
56
Web Intelligence Rich Client User's Guide
Working with universes in
Web Intelligence Rich Client
7
7
Working with universes in Web Intelligence Rich Client
Universe security in Web Intelligence Rich Client
Universe security in Web Intelligence
Rich Client
Universe security in Connected mode
When you work with Web Intelligence Rich Client in Connected mode, you
access CMS universes remotely. The CMS applies the security rights directly,
exactly as if you were working with Web Intelligence through InfoView in
your browser.
In Connected mode, you cannot access local, CMS-secured universes. You
must access the CMS universes remotely.
Universe security in Offline mode
To create or refresh a report in Offline mode, you must have first connected
to the CMS in Connected mode. When you work in Connected mode with a
CMS, a local security information (LSI) file is downloaded to your computer
containing your security rights to the resources in the CMS.
When you try to create or refresh a report in Offline mode, you can use:
•
•
locally installed universes that are not secured by the CMS
locally installed universes which you are authorized to access, as verified
by the LSI file
You cannot access universes on the CMS remotely, because in Offline mode
you are working without a CMS connection.
Note that you need to have a Connection Server installed on your computer
with Web Intelligence Rich Client in order to create or refresh documents in
Offline mode.
Universe security in Standalone mode
In Standalone mode, you work with no security and no connection to the
CMS. You can work with unsecured, locally installed universes only.
The middleware required to create and refresh local, unsecured documents
with local, unsecured universes must be installed on the computer with Web
Intelligence Rich Client.
58
Web Intelligence Rich Client User's Guide
Working with universes in Web Intelligence Rich Client
To import a universe from the CMS in Web Intelligence Rich Client
Related Topics
•
•
Launching Web Intelligence Rich Client on page 35
Web Intelligence Rich Client working modes on page 31
To import a universe from the CMS in
Web Intelligence Rich Client
You can import a universe from the CMS in Connected mode only. Import
is automatic to provide a universe that is required to create or refresh a
document. However, you may want to import universes first to be able to
then work with them offline.
1. Click Tools > Universes.
The list of available universes appears in the Universe dialog box. These
include both local and CMS universes. Universes that have already been
imported are indicated with a green check mark.
2. Select one or more universes to import.
3. Click Import.
The universes you selected are imported from the CMS to your computer,
together with their dependencies (derived or core universes).
Related Topics
•
To launch Web Intelligence Rich Client in Connected mode locally on
page 37
• To launch Web Intelligence Rich Client in Connected mode from InfoView
on page 36
• Web Intelligence Rich Client working modes on page 31
Web Intelligence Rich Client User's Guide
59
7
7
Working with universes in Web Intelligence Rich Client
To import a universe from the CMS in Web Intelligence Rich Client
60
Web Intelligence Rich Client User's Guide
Accessing Web Intelligence
from InfoView
8
8
Accessing Web Intelligence from InfoView
To log in to InfoView
You access Web Intelligence reports and set global Web Intelligence options
from InfoView, the corporate business intelligence portal.
To log in to InfoView
Before you can use InfoView and Web Intelligence you need the following
information:
•
•
•
•
a URL to the InfoView server
the InfoView server name and port number
your login and password
your authentication, which controls the InfoView resources available to
you
Contact your adminstrator for these details if you do not already know them.
You access Web Intelligence by using your web browser to log into InfoView,
the corporate business intelligence portal. Once you are in InfoView, you
can analyze and enhance Web Intelligence reports.
1. Launch your web browser.
2. Point your browser to the InfoView bookmark or URL.
The InfoView login page appears.
3. If the System box is blank, type the name of the InfoView server followed
by a colon (:), and then type the port number.
4. In the Username box, type your user name.
5. In the Password box, type your password.
6. In the Authentication box, select the authentication provided to you by
your administrator.
7. Click Log On.
The InfoView home page appears.
To log out of InfoView
When you finish using InfoView or Web Intelligence you need to log out,
instead of simply closing your web browser.
Logging out of InfoView ensures that any preferences you modified during
your InfoView session are saved. It also lets your administrator track how
62
Web Intelligence Rich Client User's Guide
Accessing Web Intelligence from InfoView
Web Intelligence InfoView options
many users are logged into the system at any given time and thus optimize
InfoView and Web Intelligence performance.
•
Click Log Out.
The login page appears. You are logged out of InfoView
Web Intelligence InfoView options
Web Intelligence document creation and viewing
options
You can set your Web Intelligence options to determine how you create,
view and interact with documents using Web Intelligence.
You create documents using a query editor to build the query to retrieve the
document data. After the query returns the data to the document, you can
view and interact with the data.
Document creation option
Description
You create documents using the Java
Report Panel, a Java applet than
launches in your Web browser.
Advanced
The Java Report Panel is a combined
query building, report editing and data analysis environment. If you
choose Advanced as your document creation option, you also use
the Java Report Panel for working
with the data returned by the query.
The View format option is not taken
into account.
The Java Report Panel provides the
richest feature set of all Web Intelligence query building, report editing
and data analysis environments.
Interactive
You build queries using Query HTML, an HTML-based query editor.
Web Intelligence Rich Client User's Guide
63
8
8
Accessing Web Intelligence from InfoView
Web Intelligence InfoView options
Document creation option
Description
Desktop
You build queries, edit reports and
analyze data using Web Intelligence
Rich Client, a standalone version of
the Java Report Panel that runs outside your web browser.
Web Accessibility
You create documents using the
HTML Report Panel, a 508-compliant
query-building and report-viewing
environment.
You can use the following view formats to view and interact with existing
Web Intelligence documents, or documents that you have just created using
a query editor:
View format
Description
HTML
Use HTML format when you want to
open reports, answer prompts, navigate reports, and/or perform drill analysis.
Use Interactive format when you want
to apply filters, sorts, calculations,
modify formatting and data displayed
on tables and charts, and/or perform
drill analysis.
Interactive
Use Interactive format if you are using
Query – HTML to define queries, and
you want to format reports based on
those queries and add formulas and
variables.
Interactive view format is only available
if your administrator has deployed Web
Intelligence in JSP mode.
PDF
64
Web Intelligence Rich Client User's Guide
Use PDF mode when you want to view
static reports.
Accessing Web Intelligence from InfoView
Web Intelligence InfoView options
To select the Web Intelligence query editor
1. Click the Preferences button on the InfoView toolbar.
2. ClickWeb Intelligence Preferences to display the Web Intelligence
options.
3. Select the query editor beneath Select a default creation/editing tool.
4. Click OK.
To select the Web Intelligence view format
You can select different view formats for Web Intelligence documents
depending on how you want to interact with the information displayed on the
reports. You select your Web Intelligence view options in InfoView. When
you modify your view options, the new settings are implemented the next
time you open a Web Intelligence document.
1. Click the Preferences button on the InfoView toolbar.
2. Click Web Intelligence Preferences to display the Web Intelligence
options.
3. In the Select a view format section, select the view format.
To select a default universe for new documents
1. Click Preferences on the Infoview toolbar.
2. ClickWeb Intelligence Preferences to display the Web Intelligence
options.
3. Click Browse beneath Select a default universe and browse to the
universe you want to select as the default.
To set Web Intelligence drill options
Drilling on reports lets you look deeper into data to discover the details behind
a good or bad summary result displayed on a table, chart, or section. Before
you begin a drill session, you can set your drill options in InfoView to specify
how reports will change each time you drill.
1. Click Preferences on the Infoview toolbar.
Web Intelligence Rich Client User's Guide
65
8
8
Accessing Web Intelligence from InfoView
Web Intelligence InfoView options
2. Click Web Intelligence Preferences to display the Web Intelligence
options.
3. Select the drill options under Drill options and Start drill session.
Hide drill toolbar option
When you drill on a value displayed on a report, the Drill toolbar appears
and displays the value on which you drilled. The value displayed on the
toolbar filters the results displayed on the drilled report.
For example, if you drill on year 2001, the results displayed on the drilled
table are Q1, Q2, Q3, and Q4 for year 2001. This means that the quarterly
values you drilled to are filtered by 2001.
Note: If the drilled report includes dimensions from multiple queries, a ToolTip
appears when you rest your cursor on the value displayed on the filter. The
ToolTip displays the name of the query and the dimension for the value.
The Drill toolbar allows you to select alternative values on the same level,
in order to filter the results differently. For example, if you use the Drill toolbar
illustrated above to select “2002,” the results displayed on the drilled table
would be Q1, Q2, Q3, and Q4 for year 2002.
You can opt to hide the Drill toolbar when you start drill mode. The Drill
toolbar is only useful if you want to select filters during your drill session.
Prompt when drill requires additional data option
When you drill the results displayed on a Web Intelligence report, you may
want to drill to higher- or lower-level information that isn’t included in the
scope of analysis for the document. When this is the case, Web Intelligence
needs to run a new query to retrieve the additional data from the data source.
Since queries on large selections of data may take a long time to be
completed, you can choose to be prompted with a message every time a
new query is necessary. The prompt message asks you whether you want
to run the additional query or not. In addition, the prompt lets you apply filters
to the extra dimensions you include in the new query. This means you can
restrict the size of the query to only the data necessary for your analysis.
You need permission from your administrator to drill out of the scope of
analysis during a drill session.
66
Web Intelligence Rich Client User's Guide
Accessing Web Intelligence from InfoView
Web Intelligence InfoView options
Synchronize drill on report blocks option
When you select the Sychronize drill on all report blocks option, the display
of all blocks changes to correspond with your drill actions. For example, if
you drill down on a block from year to quarter, and your report also contains
a chart showing data by year, the chart display also changes to display data
by quarter.
If you do not select the option, only the drilled block changes in response to
drill actions.
Start drill session option
The Start drill session option controls how Web Intelligence behaves when
you start drill mode.
Start drill session on existing report option
When you select Start drill session on existing report, the current report
becomes drillable when you start drill mode. When you end drill mode, the
report displays the drilled values.
Start drill session on a duplicate report option
When you select Start drill on a duplicate report, Web Intelligence creates
a duplicate of the current report when you start drill mode, and you drill on
the duplicate. This allows you to compare the results of the original report
with the results you discover during your drill analysis.
Web Intelligence locale options
The locale determines how a Web Intelligence document displays data. It
affects, for example, the formatting of numbers and the default sort order.
Three locale settings combine to determine how Web Intelligence displays
data:
Web Intelligence Rich Client User's Guide
67
8
8
Accessing Web Intelligence from InfoView
Web Intelligence InfoView options
Locale
Description
Product locale
The locale in which InfoView displays
data by default.
Document locale
The locale associated with a particular
Web Intelligence document. When you
save a document, the document locale
becomes the current product locale or
the preferred viewing locale.
You can permanently associate a locale with a document. For more information, see To permanently associate
a locale with a document on page 69.
Preferred viewing locale
The locale in which you choose to view
documents
The product locale
The product locale is the locale that InfoView uses by default. You set the
product locale in the Infoview General preferences.
To set the product locale
1. Click Preferences on the main InfoView toolbar.
2. Click General to display the general options.
3. Select the product locale from the Product locale list.
The document locale
The document locale is the locale associated with a particular document. By
default, the document takes the product locale when you save a document,
or the preferred viewing locale if this is different from the product locale and
your settings give the preferred viewing locale priority. The document retains
this locale until the next time it is saved, when it again takes either the product
locale or the preferred viewing locale.
68
Web Intelligence Rich Client User's Guide
Accessing Web Intelligence from InfoView
Web Intelligence InfoView options
You can permanently associate the current document locale with a document.
For more information, see To permanently associate a locale with a document
on page 69.
The GetContentLocale() Web Intelligence function returns the document
locale.
To display data using the document locale
1. Click Web Intelligence Preferences to display the Web Intelligence
options.
2. Click Use the document locale to format the data beneath When
viewing a document.
The preferred viewing locale
The preferred viewing locale is the locale that you choose to dislay data. The
preferred viewing locale overrides the product locale if it is different from the
product locale and your settings give the preferred viewing locale priority.
To set the preferred viewing locale
1. Click Preferences on the main InfoView toolbar.
2. Click General to display the general options.
3. Select the preferred viewing locale from the Preferred viewing locale
list.
4. Click Web Intelligence Preferences to display the Web Intelligence
options.
5. If you want data to be formatted using the preferred viewing locale, click
Use my Preferred Viewing Locale to format the data beneath When
viewing a document.
To permanently associate a locale with a document
1. In Web Intelligence Interactive, select Document > Properties from the
menu to display the" Document Properties" dialog box.
2. Select Permanent regional formatting.
3. Save the document.
The current document locale is associated permanently with the document
and overrides the product locale and the preferred viewing locale.
Web Intelligence Rich Client User's Guide
69
8
8
Accessing Web Intelligence from InfoView
Web Intelligence InfoView options
70
Web Intelligence Rich Client User's Guide
Working with queries in Web
Intelligence Rich Client
9
9
Working with queries in Web Intelligence Rich Client
How universe objects map to data
How universe objects map to data
Classes and subclasses
Objects are grouped into folders called classes. Each class can also contain
one or more subclasses. Subclasses contain objects that are a further
subcategory of the objects in the upper level of the class.
The role of classes is to organize the objects into logical groups. When you
create queries on the universe, classes help you to find the objects that
represent the information that you want to use in a query.
Dimension object
A dimension object represents data that provides the basis for analysis in a
report. Dimension objects typically retrieve character-type data, for example;
customer names, resort names, or dates.
Dimension objects appear as follows in the Web Intelligence query panel:
Detail object
A detail obect provides descriptive data about a dimension. A detail is always
attached to the dimension for which it provides additional information. For
example, [Age] is a detail object that is associated with the (Customer]
dimension.
Detail objects appear as follows in the Web Intelligence query panel:
72
Web Intelligence Rich Client User's Guide
Working with queries in Web Intelligence Rich Client
Building and using queries
Measure object
The measure object retrieves numeric data that is the result of calculations
on data in the database. For example, [Revenue] is the calculation of the
number of items sold multiplied by item price. Measure objects are often
located in a Measures class.
Measure objects appear as follows in the Web Intelligence query panel:
There are two types of measure:
• classic measures - calculated by Web Intelligence
• smart measures - calculated by the database on which the universe is
based
In certain situations, smart measures impact the way in which Web
Intelligence displays calculations. For more information on smart measures,
see the Using Functions, Formulas and Calculations in Web Intelligence
guide.
Building and using queries
To build and run a query in Web Intelligence Rich
Client
1. How you add a query depends on whether you are creating the first query
in a document or adding a query to an existing document:
• To create a new document and its first query, click Document > New
• To add a query to a document that already contains at least one query,
open the document and click Edit Query in the top toolbar, then Add
Query in the Query Panel.
Web Intelligence Rich Client User's Guide
73
9
9
Working with queries in Web Intelligence Rich Client
Building and using queries
2. In the Add Query box, choose a data source:
• Universe
• Local data source
3. In the Universe box or Local data source box, depending on what you
selected, select the data source for your query.
4. In the Data tab, open a class.
5. Select the objects you want to include in the query and drag them to the
Result Objects pane.
Note: To add all the objects in the class, drag the class to the Result
Objects pane.
6. Repeat the previous step until the query contains all the objects you want
to include.
7. Select the objects on which you want to define query filters and drag them
to the Query Filters pane.
8. Set the scope of analysis and other query properties.
9. Click Run Query to run the query.
10. If the query you are building is not the first query in the document, you
need to specify in the New Query box how its data will be displayed.
Option
Description
Insert a table in a new report Display the data on a new report in the
document
Insert a table in the current
report
Display the data on the currently selected
report in a new table
Include the result objects in Include the data in the document without
the document without gener- displaying the data on a report. (You can
ating a table
add the objects returned by the query to
the report later.)
To set query properties
1. Verify that you are in Query View.
2. Click the Properties tab.
74
Web Intelligence Rich Client User's Guide
Working with queries in Web Intelligence Rich Client
Building and using queries
3. Click the Fold/Unfold arrows at the top right of each section of the options
to expand or close the property groups.
4. Select or type query property options.
To interrupt a query
You can interrupt a query before Web Intelligence has returned all the data
to the document.
When you interrupt a query, only partial data is returned to the document.
The values displayed in the document do not accurately reflect the definition
in the query.
Before returning the data to the document, Web Intelligence requests you
to choose which version of the data you want retrieved
1. On the "Waiting - Refresh Data" dialog box, click Cancel.
The "Interrupt Data Retrieval" dialog box appears.
2. Select one of the options on the "Interrupt Data Retrieval" dialog box.
Option
Description
Restore the results
from the previous
data retrieval
Web Intelligence restores the values to the document
that were retrieved the last time the query was run.
The values displayed will not be the most up to data
information available on the database. You can run
the query later to return the up to date values from
the database
Purge all data from
the document
Web Intelligence displays the document empty of
values. The structure and formatting of the document
is retained. You can run the query later to return the
up to date values from the database
Return the partial
results
Web Intelligence displays the new values retrieved
so far in the appropriate parts of the document. The
rest of the document will display the values retrieved
the last time the query was run
Web Intelligence Rich Client User's Guide
75
9
9
Working with queries in Web Intelligence Rich Client
Building and using queries
To remove a query
1. Select a the query you want to remove by right-clicking the appropriate
Query tab.
2. Click Remove.
To duplicate a query
If you want to build a different query on a universe already included in the
document, you can duplicate the existing query on that universe and then
modify it, instead of starting from scratch.
1. Select the query you want to duplicate by right-clicking the appropriate
Query tab at the bottom of the report panel.
2. Select Duplicate
Multiple queries
You can include one or multiple queries in a Web Intelligence document.
When you include multiple queries, those queries can be based on a single
universe or on multiple universes available in InfoView.
For example, you can include product sales data and customer data in the
same document. In this case, your corporate data for product line sales is
available on one universe and data on customers is available on another
universe. You want to present product line sales results and information on
customer age groups in the same report. To do this, you create a single
document that includes two queries; one query on each universe. You can
then include and format results from both queries on the same report.
Defining multiple queries in a single document is necessary when the data
you want to include in a document is available on multiple universes, or when
you want to create several differently-focused queries on the same universe.
You can define multiple queries when you build a new document or add more
queries to an existing document. You can present the information from all
of the queries on a single report or on multiple reports in the same document.
76
Web Intelligence Rich Client User's Guide
Working with queries in Web Intelligence Rich Client
Controlling access to queries
Multiple queries, combined queries and synchronized queries
compared
It is important to understand the relationship between multiple data providers,
combined queries and synchronized data providers .
•
•
•
A single data provider, or query, can contain multiple queries, called
combined queries.
A document can be based on multiple data providers (each one of which
can contain multiple queries). These data providers do not need to be
synchronized. If they are not synchronized, the document contains multiple
sources of unrelated data.
Multiple data providers can be synchronized if they have common
dimensions around which they can be linked. You synchronize data
providers by merging these common dimensions.
Controlling access to queries
Allow other users to edit all data providers query
property
When selected, other users who have the appropriate editing rights can
access Query View and modify the data providers in the document. When
cleared, only the report creator can modify the data providers. This option
is selected by default. Unlike the other query properties, which only apply to
the selected query, this option applies to all of the data providers in the
document.
Controlling how queries retrieve data
Max retrieval time query property
Maximum time that a query can run before the query is stopped. This can
be useful when a query is taking too long due to an excess of data, or network
Web Intelligence Rich Client User's Guide
77
9
9
Working with queries in Web Intelligence Rich Client
Setting the scope of analysis
problems. You can set a time limit so a query can stop within a reasonable
time.
Max rows retrieved query property
The Max rows retrieved query property determines the maximum number
of rows of data that are displayed when a query is run. If you only need a
certain amount of data, you can set this value to limit the number of rows of
data in your document.
Max rows retrieved does not operate at the database level. If you set Max
rows retrieved to 1000, and your query returns 5000 rows, Web Intelligence
initially retrieves all 5000 rows, before discarding 4000 and retaining only
the first 1000 rows.
The Sample result set query property also applies a restriction on the
number of rows in the query, but at the database level. If you set Max rows
retrieved to 2000 and Sample result set to 1000, the query retrieves a
maximum of 1000 rows only.
This setting can be overridden by the limits set by your administrator in your
security profile. For example, if you set the Max rows retrieved setting to
400 rows, but your security profile limits you to 200 rows, only 200 rows of
data will be retrieved when you run the query.
Retrieve duplicate rows query property
In a database, the same data may be repeated over many rows. You can
choose to have these repeated rows returned in a query, or to have only
unique rows returned.
Setting the scope of analysis
Scope of analysis
The scope of analysis for a query is extra data that you can retrieve from the
database to give more details on the results returned by each of the objects
78
Web Intelligence Rich Client User's Guide
Working with queries in Web Intelligence Rich Client
Setting the scope of analysis
in a query. This extra data does not appear in the initial result report, but it
remains available in the data cube, so you can pull this data in to the report
to allow you to access more detail at any time. This process of refining the
data to lower levels of detail is called drilling down on an object.
In the universe, the scope of analysis corresponds to the hierarchical levels
below the object selected for a query. For example, a scope of analysis of
one level down for the object Year, would include the object Quarter, which
appears immediately under Year.
You can set this level when you build a query. It allows objects lower down
the hierarchy to be included in the query, without them appearing in the
Results Objects pane. The hierarchies in a universe allow you to choose
your scope of analysis, and correspondingly the level of drill available.
In Web Intelligence Rich Client, as in the Java Report Panel, you can also
create a custom scope of analysis by selecting specific dimensions for the
Scope of Analysis pane.
Note: You cannot set the scope of analysis when working in query drill mode
because this drill mode causes Web Intelligence to modify the scope
dynamically in response to drill actions. For more information on query drill,
Query drill defined on page 218.
Levels of scope of analysis
You can set the following levels for scope of analysis:
Level
Description
None
Only the objects that appear in the
Results Objects pane are included in
the query.
•
•
•
For each object in the Results pane,
one, two, or three objects lower down
the hierarchy tree are included in the
query. The data from these objects is
stored in the cube until you add them
to the document.
One level down
Two levels down
Three levels down
Web Intelligence Rich Client User's Guide
79
9
9
Working with queries in Web Intelligence Rich Client
Setting the scope of analysis
Level
Description
Custom
All objects added manually to the
Note: This option is available in the
Scope of Analysis panel are included
Java Report Panel and in Web Intelliin the query.
gence Rich Client only.
Including a scope of analysis in a document increases the document size
significantly. This is because the data necessary for the scope you specify
is saved with the document, even though it is not visible in the reports unless
you start drill mode and drill down to the data to display the corresponding
values.
In order to minimize the size of documents and optimize performance, we
recommend that you only include a scope of analysis in documents where
you are certain that users will need to drill.
We suggest the following method because it will be easier for you to set the
scope of analysis seeing the hierarchy of the classes and objects.
To set the scope of analysis
1. Click the Show/Hide Scope of Analysis Pane button so that it appears
pressed in.
The Scope of Analysis panel appears at the bottom of the Result Objects
pane. The default scope of analysis is None. Each dimension in the Result
Objects pane appears in the Scope of Analysis pane.
2. Click the down arrow in the Scope of Analysis drop-down list box.
3. Select a level for the scope of analysis.
The level appears in the list box and the dimensions that are hierarchically
below each dimension in the Result Objects pane appear in the Scope
of Analysis pane.
4. If you want to add selected dimensions to the scope of analysis or create
a custom scope of analysis, select dimensions in the Query Manager and
drag them across to the Scope of Analysis panel.
80
Web Intelligence Rich Client User's Guide
Working with queries in Web Intelligence Rich Client
Query contexts
Query contexts
What is an ambiguous query?
An ambiguous query is a query that contains one or more objects that can
potentially return two different types of information.
In a universe, certain dimensions may have values that are used for two
different purposes in the database. For example, the [Country] dimension in
the query below can return two types of information:
•
•
Customers and the country in which they spent their vacation.
Customers and the country for which they have made their reservation.
The role that Country plays in this query is ambiguous. A country can be
either the country where a vacation was sold, or a country where a vacation
is reserved. One is existing information (sales), and the other is future
information (reservations).
To avoid ambiguities in a query, the universe designer identifies the different
ways that objects can be used in the universe, and implements restrictions
on how these objects can be combined. These restrictions are called contexts.
What is a context?
A context is a defined group of objects that share a common business
purpose. This business purpose is usually the type of information that these
related objects represent. For example, a sales context is a grouping of all
the objects that can be used to create sales queries. A reservations context
is a grouping of all the objects that can be used in reservation queries.
Contexts are defined in a universe by the universe designer.
You can combine any object within the same context to create a query. You
can also combine objects in different contexts. If you use an object that is
common to both contexts, Web Intelligence will try to determine the context
that best fits the other objects in the query.
If it cannot determine a context, you are prompted to choose the context that
you want to apply to the query.
Web Intelligence Rich Client User's Guide
81
9
9
Working with queries in Web Intelligence Rich Client
Query contexts
Choosing a context when you run a query
When you create a query or refresh a report, you may be asked to choose
a context before the query can run. Contexts are set up in a universe to avoid
ambiguous queries.
To choose a context when you run a query
•
Click the context in the Select a Context dialog box.
Defining how contexts are used
Reset contexts on refresh query property
When selected, you are prompted to choose a context each time a query
requiring a context is run. When unselected, Web Intelligence retains the
context specified the first time you run the query.
To reset contexts on query refresh
1. Make sure you are in Query View.
2. Click the Properties tab to display the query properties.
3. Select Reset contexts on refresh.
Clear contexts query property
When this property is selected, Web Intelligence clears the contexts listed
in the list when you next run the query or refresh the data.
To clear contexts
1. Make sure you are in Query View.
2. Click the Properties tab to display the query properties.
3. Click Clear Contexts
82
Web Intelligence Rich Client User's Guide
Working with queries in Web Intelligence Rich Client
Using combined queries
Using combined queries
Combined queries defined
Combined queries are multiple queries on the same universe that return a
single set of data.
Note: You cannot create combined queries across multiple universes.
Types of combined query
You can combine queries in three relationships:
•
•
•
union
intersection
minus
In a union combination, Web Intelligence takes the all the data from both
queries, eliminates duplicate rows, and builds a combined data set.
In an intersection combination, Web Intelligence returns the data that is
common to both queries.
In a minus combination, Web Intelligence returns the data in the first query
that does not appear in the second.
Example: Union, intersect and minus queries
In this example you have two queries that return lists of countries as shown
in the following table:
Query
Values
Query 1
US; UK; Germany; France
Query 2
US; Spain
Web Intelligence Rich Client User's Guide
83
9
9
Working with queries in Web Intelligence Rich Client
Using combined queries
Depending on the type of combined query, Web Intelligence returns the
following values:
Combination type
Values
UNION
US; UK; Germany; France;Spain
INTERSECTION
US; Spain
MINUS
UK; Germany; France
What can you do with combined queries?
Combined queries allow you to answer questions that are otherwise difficult
or impossible to frame in a single Web Intelligence query.
Example: Return a data set using a combined query
The Island Resorts Marketing sample universe contains the dimension
Year, which is associated with guests who have already stayed in a resort,
and Reservation Year, which is associated guests who have reserved to
stay in the future. Because of the structure of the database and universe,
these objects are incompatible, which means that you cannot include them
in the same block in a report.
What if you want to return a single list of years that includes those years
where more than n guests stayed in a resort and those years where more
than n guests reserved to stay in a resort? You can do this using a combined
query, as follows:
Query
Returns
Query 1
Years where more than n guests
stayed in a resort
UNION
84
Web Intelligence Rich Client User's Guide
Working with queries in Web Intelligence Rich Client
Using combined queries
Query
Returns
Query 2
Years where more than n guests reserved to stay in a resort
The union between these two queries returns the list of years that you want.
How does Web Intelligence generate combined
queries?
If your database supports the type of combination in your query, combined
queries work at the database level: they alter the query that Web Intelligence
submits to the database. They do so by generating SQL (Structured Query
Language) queries containing UNION, INTERSECT and MINUS operators.
Note: SQL is the standard query language of relational databases, although
each database has its own dialect.
If your database does not support the type of combination in your query,
Web Intelligence performs the query at the report level by generating multiple
SQL queries whose data it resolves after retrieval from the database.
To build a combined query
1. Create an initial query in the Query Panel.
2. Click Combined Query on the toolbar.
Web Intelligence adds a copy of the initial query to the data provider. The
second query has the following characteristics:
• It contains the same report objects as the original query.
• It does not contain the filters defined on the original query.
• It is combined with the original query in a UNION relationship.
3. To switch to a query, click Combined Query n.
The individual queries in the combined queries are named Combined
Query n
Web Intelligence Rich Client User's Guide
85
9
9
Working with queries in Web Intelligence Rich Client
Using combined queries
4. To delete a query, right-click the Combined Query n you want to delete,
then select Remove on the menu.
5. To change the combination type, double-click on the operator. The
operator moves through the sequence UNION, INTERSECTION, MINUS.
6. Build each query within the combined query as you build any normal Web
Intelligence query.
7. Click Run Query.
Combined query structure
The queries within a combined query must return the same number of objects
of the same data type and the objects must be in the same order. You cannot
combine queries when the number of objects in the query results and the
data types of those objects are not identical. For example, you cannot
combine a query than returns Year with a query that returns Year and
Revenue, and you cannot combine a query that returns Year with a query
that returns Revenue.
You must also pay attention to the semantics of your combined queries.
While it is possible to combine a query that returns Year with a query that
returns Region if both dimensions are of the same data type, the result - a
mixed list of years and regions - is unlikely to be meaningful. Typically, if
your first query contains a Year dimension, your second query also contains
a dimension that returns a list of years.
Related Topics
•
To return a list of years and reservation years based on the number of
guests on page 86
To return a list of years and reservation years based on the
number of guests
This example describes the workflow for the query described in the
exampleReturn a data set using a combined query on page 84. You want
to build a query that returns a list of years consisting of years where more
than n guests stayed in a resort and years where more than n guests reserved
to stay in a resort.
86
Web Intelligence Rich Client User's Guide
Working with queries in Web Intelligence Rich Client
Using combined queries
1. Select the Island Resorts Marketing universe in the list of universes to
open the Query Panel.
2. Drag the Year object to the Result Objects pane.
3. Drag the Number of Guests object to the Query Filters pane and create
a report filter that restricts Number of Guests to greater than n.
4. Click Combined Query.
The Combined Query pane appears in the bottom left of the Query panel
with the two queries joined by UNION.
5. Click on the second query and remove the Year and Number of Guests
objects.
6. CDrag the Reservation Year object to the Result Objects pane.
7. Drag the Future Guests object to the Query Filters pane and create a
report filter that restricts the future guests to greater than n.
8. Click Run Query.
The query returns the combined list of years and reservation years.
Combined query precedence
It is important to understand the order in which Web Intelligence executes
query combinations in a combined query. The order of execution is crucial
in determining the final result.
In the simplest form of combined query you combine two or more queries in
a relationship as follows:
Query 1
INTERSECTION
Query 2
Query 3
In such a case, Web Intelligence first finds the set of data that represents
the union/intersection/minus between Combined Query n and Combined
Query n + 1, then finds the union/intersection/minus between that data set
and the data returned by Combined Query n + 2. Web Intelligence continues
in this way through all the queries in the relationship. This gives the following
result for the above example:
Web Intelligence Rich Client User's Guide
87
9
9
Working with queries in Web Intelligence Rich Client
Using combined queries
Query
Data
Query 1
US; UK; France; Germany
Query 2
US; France; Finland
INTERSECTION of 1 and 2
US; France
Query 3
US; Spain
Final INTERSECTION
US
Multiple combined queries
ou can combine multiple queries in complex relationships to determine the
order of execution, as in the following example (displayed in the Java Report
Panel):
Web Intelligence processes query groups from right to left as they appear
in the Query Panel, and from top to bottom within each group.
(Higher-precedence groups, such as the MINUS group in the above example,
appear indented to the right in the Query Panel.) In the above query Web
Intelligence first determines the result of the minus combination then finds
the intersection of this result with the result of Combined Query 3 as shown
in the following table:
88
Web Intelligence Rich Client User's Guide
Working with queries in Web Intelligence Rich Client
Using combined queries
Query
Result
Query 1
US; UK; Spain; Germany
Query 2
Germany
Query 1 MINUS Query 2
US; UK; Spain
Query 3
US; Spain; Finland
(Query 1 MINUS Query 2)
INTERSECTION
US; Spain
Query 3
Note: If your database directly supports the type of combined query you
wish to execute, Web Intelligence generates SQL containing combination
operators. In this case the order of precedence depends on the order of
precedence defined in the database. See your Web Intelligence administrator
for more details.
To set the order of precedence of combined queries in the Java
Report Panel
1.
2.
3.
4.
Build the first query in the Query Panel.
Click Combined Query.
Repeat these steps until you have built all the component queries.
To increase the precedence of a pair of queries, drag and drop a query
on to the query with which you want to associate it in the
higher-precedence pair.
Web Intelligence indents the source and target queries in the
drag-and-drop operation and combines them by default in a UNION.
5. Continue adding queries to the higher-precedence group by dragging
and dropping them on to the space between any two queries already in
the group.
6. To create further higher-precedence groups within an existing
higher-precedence group, repeat the previous two steps.
Web Intelligence Rich Client User's Guide
89
9
9
Working with queries in Web Intelligence Rich Client
Merging dimensions from multiple data providers
7. Double-click the combination operators of all the groups in the query to
change them as required.
8. Click Run Query.
Merging dimensions from multiple data
providers
Merged dimensions defined
You can include multiple data providers in a Web Intelligence document.
You often need to synchronize the data returned by these data providers.
You do this by incorporating common dimensions into a merged dimension.
Merged dimensions and data synchronization were introduced in Web
Intelligence XI R2. They enormously increase the power and flexibility of
Web Intelligence by allowing you to synthesise data from different sources
in the same report, rather than simply including the data.
For example, if you have one database that contains detailed customer
information and another database that contains sales data, you can
synchronize the two data sources around the customer.
When to merge dimensions
You merge dimensions when your report draws related data from different
data providers. For example, you have a report showing revenue and sales
targets. The report contains sections based on the year, and each section
shows revenue and sales targets. If revenue and sales target data comes
from two different data providers, Web Intelligence does not know that it is
related. You tell Web Intelligence that the data is related by merging the two
data providers on the common dimension, year.
When you merge dimensions, Web Intelligence creates a new dimension
that contains all the values from the original dimensions that make up the
merged dimension. You use this dimension in reports as you use any other
report object. You can add report objects from all the data providers
90
Web Intelligence Rich Client User's Guide
Working with queries in Web Intelligence Rich Client
Merging dimensions from multiple data providers
synchronized through the merged dimension in the same block as the merged
dimension.
Choosing which dimensions to merge
The only restriction that Web Intelligence imposes on merged dimensions
is that they must be of the same data type: for example, character data. But
it does not make sense to merge unrelated dimensions even when their data
types are the same. For example, it does not make sense to merge a
dimension containing customer names with a dimension containing sales
regions.
Merged dimensions often have the same name in both data sources, but
this is not obligatory. It can make sense to merge dimensions with different
names if they contain related data.
To merge dimensions correctly you need to be aware of the semantics of
the data (what the data refers to) in the different data sources. The dimension
data types and names are an approximate guide only to dimensions’ suitability
for merging.
Merged dimension example
The following example with two data providers illustrates the effect of merging
dimensions:
Example: Merging City dimensions
Data Provider 1:
Country
City
US
New York
US
Los Angeles
France
Paris
France
Toulouse
Web Intelligence Rich Client User's Guide
91
9
9
Working with queries in Web Intelligence Rich Client
Merging dimensions from multiple data providers
Data Provider 2:
City
Revenue
New York
100000
Los Angeles
75000
Paris
90000
Toulouse
60000
If you merge the City dimensions and display the Country, merged City
dimensions and Revenue measure in a table, Web Intelligence returns the
following result:
If the City dimensions are not merged, Web Intelligence displays the
following result:
Country
City
Revenue
US
New York
325000
US
Los Angeles
325000
France
Paris
325000
France
Toulouse
325000
Because there is no link between the two data providers through a merged
dimension, Web Intelligence is unable to relate the city revenues to
countries. As a result Web Intelligence displays the total revenue against
each Country/City pair.
If the City dimensions are merged, Web Intelligence displays the following
result:
92
Web Intelligence Rich Client User's Guide
Working with queries in Web Intelligence Rich Client
Merging dimensions from multiple data providers
Country
City
Revenue
US
New York
100000
US
Los Angeles
75000
France
Paris
90000
France
Toulouse
60000
Forcing merged calculations with the ForceMerge
function
By default, Web Intelligence does not account for merged dimensions in
calculations if the merged dimensions do not explicitly appear in the
calculation context.
Example: Calculating revenue with ForceMerge
This example has two data providers as follows:
Data Provider 1:
Country
City
US
New York
US
Los Angeles
France
Paris
France
Toulouse
Data Provider 2:
Web Intelligence Rich Client User's Guide
93
9
9
Working with queries in Web Intelligence Rich Client
Merging dimensions from multiple data providers
City
Revenue
New York
100000
Los Angeles
75000
Paris
90000
Toulouse
60000
If you merge the [City] dimensions, then create a table with [Country] and
[Revenue], Web Intelligence displays the following result:
Country
Revenue
US
325000
US
325000
France
325000
France
325000
Because [City], the merged dimension, does not appear in the table, Web
Intelligence does not take the merge into account when calculating revenue.
Web Intelligence lists the total revenue in the second data provider against
each country.
To display the correct result, replace [Revenue] in the second column with
the formula ForceMerge([Revenue]):
94
City
Revenue
US
175000
US
175000
France
150000
Web Intelligence Rich Client User's Guide
Working with queries in Web Intelligence Rich Client
Merging dimensions from multiple data providers
City
Revenue
France
150000
Web Intelligence now takes the relationship between countries and cities
into account when calculating revenue.
Note: If [Revenue] is a smart measure in the above example, Force
Merge([Revenue]) returns #MULTIVALUE. This is because the grouping
set (Country) does not exist for the [Revenue] measure. Force
Merge([smart_measure]) always returns #MULTIVALUE, unless by chance
no aggregation is required to calculate the measure.
Creating, editing and deleting merged dimensions
To merge dimensions
1. Click Merge Dimensions on the toolbar.
The "Merge Dimensions" dialog box appears.
2. Select the dimensions you want to merge in the boxes at the top of the
dialog box.
When you select a dimension, all dimensions of different data types are
disabled because you cannot merge dimensions of different data types.
3. Click Values to view the values associated with the dimensions.
4. Click Merge.
The "Create Merged Dimension" dialog box appears. You use this
dialog box to specify the properties of the merged dimension.
5. Select the dimension in the Source Dimension drop-down list.
The source dimension provides the default name, description and number
formats for the merged dimension.
6. Type the merged dimension name in the Merged Dimension Name box
and the merged dimension description in the Description box.
7. Click OK.
Web Intelligence Rich Client User's Guide
95
9
9
Working with queries in Web Intelligence Rich Client
Merging dimensions from multiple data providers
The merged dimension name appears in the "Merged Dimensions" box
and the dimensions that are part of the merged dimension appear in the
boxes alongside it. Because an original dimension can be part of one
merged dimension only, it no longer appears in the box above that lists
the original dimensions in the query.
8. Click OK to close the "Merged Dimensions" dialog box.
Web Intelligenceadds the merged dimensions to the list of merged
dimensions in the Data tab.
To define a merged dimension
You define a merged dimension in the "Create Merged Dimension" dialog
box.
1. Type the merged dimension name in the Merged Dimension Name box.
2. Type the merged dimension description in the Description box
3. To use the name and description of one of the source dimensions in the
merged dimension, select the source dimension from the Source
Dimension list.
4. Click OK.
To merge dimensions automatically
You can set Web Intelligence to merge dimensions automatically under the
following circumstances:
•
•
•
1.
The dimensions have the same name
The dimensions have the same data type
The dimensions are in the same universe
Right-click outside any block or chart and click Document Properties
on the popup menu.
2. Click Auto-merge dimensions.
To edit a merged dimension
1. In the Data tab, select the dimension in the Merged Dimensions folder
and click the right mouse button.
2. Select Edit Merged Dimension from the menu.
The "Merged Dimensions" dialog box appears.
96
Web Intelligence Rich Client User's Guide
Working with queries in Web Intelligence Rich Client
Merging dimensions from multiple data providers
3. Edit the merged dimension as described in To merge dimensions on
page 143
To delete a merged dimension
1. Select the dimension in the Merged Dimensions folder and click the right
mouse button.
2. Select Delete Merged Dimension from the menu.
Understanding the effects of merged dimensions
Data synchronization through merged dimensions adds enormous power to
Web Intelligence. Merged dimensions also have implications for the results
that Web Intelligence displays in certain situations. You need to understand
these implications to work effectively with merged dimensions and
synchronized data.
Synchronizing data providers with different aggregation levels
You can synchronize data providers with different aggregation levels. This
can have implications for the way in which Web Intelligence calculates
measures.
Example: Synchronizing data providers with different aggregation levels
In this example you have two data providers as follows:
Customer
Year
Revenue
Jones
2004
1500
Jones
2005
2000
Smith
2005
1200
Web Intelligence Rich Client User's Guide
97
9
9
Working with queries in Web Intelligence Rich Client
Merging dimensions from multiple data providers
Customer
Number of sales
Jones
12
Smith
10
If you merge the two data providers and the table properties Avoid
Duplicate Rows Aggregation and Show Rows with Empty Dimensions
are unchecked, Web Intelligence returns the following:
Customer
Year
Revenue
Number of sales
Jones
2004
1500
12
Jones
2005
1200
12
Smith
2005
1200
10
Web Intelligence cannot determine the number of sales per year for
customer Jones because the data provider that stores the number of sales
does not break them down by year. Web Intelligence therefore reproduces
the total number of sales on each row.
Note: Although the Number of Sales values are duplicated, if you add a
standard calculation to the bottom of the column (for example a Sum or Average
calculation), the result is correct.
One way of adressing this issue is to add the dimensions to the second
data provider that allow Web Intelligence to calculate to the appropriate
level of data. If this is not possible, you must be aware of any situations
where Web Intelligence cannot aggregate the data to the necessary level
of detail.
Detail objects and merged dimensions
Detail objects are associated with dimensions and provide additional
information about the dimension.
98
Web Intelligence Rich Client User's Guide
Working with queries in Web Intelligence Rich Client
Merging dimensions from multiple data providers
Web Intelligence XI R2 requires a one-to-one relationship between
dimensions and details (this means that a detail object can have one value
only for each value of its associated dimension) and does not take detail
objects into account when synchronizing data. The following example
illustrates why this is necessary.
Previous versions of Web Intelligence, as well as Desktop Intelligence and
BusinessObjects, allow a one-to-many relationship between dimensions and
details. If you migrate a report created using any of these products and the
detail object contains multiple values, Web Intelligence places the
#MULTIVALUE error in the detail cell.
Example: Synchronizing data providers with detail objects
In this example you have two data providers as follows, and [Address] is a
detail object related to [Customer].
Customer
Address
Revenue
John
London
10000
Paul
Liverpool
15000
Customer
Age
John
25
Paul
28
If you create a merged Customer dimension to synchronize the data
providers, and Address can have more than one value for each customer,
the result is ambiguous because there is no common value around which
WebIntelligence can synchronize the data.
For example, Paul might also have an address in London, which means
that there is no unique ‘Paul’ row with which WebIntelligence can
synchronize Paul’s age:
Web Intelligence Rich Client User's Guide
99
9
9
Working with queries in Web Intelligence Rich Client
Merging dimensions from multiple data providers
Customer
Address
John
London
Paul
Paris
Paul
London
Age
John
25
Paul
28
If the relationship between Customer and Address is one-to-one,
WebIntelligence can ignore Address in the synchronization. This removes
the ambiguity:
Customer
Address
Age
John
25
Paul
28
Filtering merged dimensions
Merging dimensions has implications for the way in which Web Intelligence
applies filters.
Note: You cannot apply a filter a on merged dimension. You apply filters on
the dimensions that make up the merged dimension.
Report filters and merged dimensions
When you apply a report filter to a dimension that is part of a merged
dimension, Web Intelligence applies the filter to all data providers that are
synchronized through the merged dimension.
100
Web Intelligence Rich Client User's Guide
Working with queries in Web Intelligence Rich Client
Merging dimensions from multiple data providers
Example: Filtering a merged dimension
In this example you have a report with the following data providers, which
are merged on the Country dimension
Country
Resort
Revenue
France
French Riviera
835,420
US
Bahamas Beach
971,444
US
Hawaiian Club
1,479,660
Country
Future Guests
France
46
US
56
If you apply the filter Country=”US” to the first block, Web Intelligence also
filters the second block to give the following result:
Country
Future Guests
US
56
If the Country dimensions are not merged the second block is unaffected
by the filter.
Section filters and merged dimensions
When a dimension that is part of a merged dimension is set as a section
header, any filter applied to the section also applies to blocks from
synchronized data providers within the section. If Country is set as the section
header in the example Filtering a merged dimension on page 149 and the
filter Country=”US” is applied to the section, Web Intelligence filters both
blocks in the section—(Resort, Revenue) and (Country, Number of
Guests)—so that only those rows appear where the country dimension is
Web Intelligence Rich Client User's Guide
101
9
9
Working with queries in Web Intelligence Rich Client
Merging dimensions from multiple data providers
equal to “US”, even though Country in the second block comes from a
synchronized data provider.
Block filters and merged dimensions
When you apply a block filter to a dimension that is part of a merged
dimension, Web Intelligence applies the filter to the block. Web Intelligence
does not apply the filter to other data providers synchronized through the
merged dimension.
Drilling on merged dimensions
When you merge dimensions, the new merged dimension belongs to the
hierarchies of all dimensions involved in the merge.
Extending the values returned by merged dimensions
Merged dimensions are a new concept in Web Intelligence XI R2.
Synchronizing data providers already exists in Desktop
Intelligence/BusinessObjects but it does not involve the creation of a new
merged dimension. BusinessObjects reports use the original dimensions
that make up a merged dimension in Web Intelligence.
You can use these original dimensions in a Web Intelligence report. When
you place them in the report, Web Intelligence returns by default only those
dimension values that have corresponding values in the data providers
synchronized through the merge. You need to be aware of this when migrating
reports from Desktop Intelligence and BusinessObjects because
BusinessObjects/Desktop Intelligence behaves differently.
Example: Web Intelligence and Desktop Intelligence/BusinessObjects
behavior when dimensions are merged
You have a report with the following data providers:
102
Country of origin
Revenue
Germany
470
Web Intelligence Rich Client User's Guide
Working with queries in Web Intelligence Rich Client
Merging dimensions from multiple data providers
Country of origin
Revenue
Japan
499
If you include the Country of Origin dimension from Data Provider 1 and
the Revenue measure from Data Provider 2 in the same block, Web
Intelligence returns the following result:
Country of origin
Revenue
Germany
The same block in Desktop Intelligence/BusinessObjects returns the
following result:
Country of origin
Revenue
Germany
Japan
499
The block is different in Desktop Intelligence/BusinessObjects because
BusinessObjects extends the values of the Country of Origin dimension
through the values returned by the Revenue measure.
To extend dimension values
1. Right-click your report outside any blocks or charts and select Document
Properties on the shortcut menu.
The Document Properties pane appears on the right side of the report.
2. Check the Extend merged dimension values option.
Web Intelligence Rich Client User's Guide
103
9
9
Working with queries in Web Intelligence Rich Client
Filtering queries
Filtering queries
Query filters defined
You limit the data returned to the document by applying filters when you
define the query. Using query filters enables you to secure the data that you
don’t want specific user groups to see and limits the size of the documents
that are stored on your network. When you run the query on the document
data, the Web Intelligence returns only the values that meet the query filter
definitions.
Query filters limit the data Web Intelligence returns to a document. They
retrieve a sub-set of the data from the database and return the corresponding
values to the document. You define filters to match business questions. For
example, you can filter the [Year] dimension to view only sales revenue for
Year 2003; or filter the [Annual Income] dimension to view only customers
whose annual income is equal to or greater than $1.5M.
Query filters allow you to:
•
•
•
retrieve only the data you need to answer a specific business question
hide the data you don’t want specific users to see when they access the
document
minimize the quantity of data returned to the document to optimize
performance
Example: In Q4 2002, which stores in my sales region gained margins
above $130K?
As Regional Marketing Manager for Texas, you are only interested in
analyzing margins for Texas, but the sales universe includes data US-wide.
In addition, you only want to view information for stores where margins
reached over your 4Q 2002 quarterly target figure: $130K. To create a
document with only the information you need, you apply a filter on the
[State], [Year], and [Quarter] dimensions and a filter on the [Margin]
measure:
104
Web Intelligence Rich Client User's Guide
Working with queries in Web Intelligence Rich Client
Filtering queries
Year Equal to 2002
Quarter Equal to Q4
AND
State Equal to Texas
Margin Greater than or equal to 130000
To avoid displaying the filtered values Texas, 2002, and Q4 in the table
columns Year, Quarter, and State, you exclude the [Year], [Quarter], and
[State] objects from the Result Objects pane. When you generate the report,
the report values correspond to Texas stores with 4Q 2002 margins greater
than or equal to $130K:
Store name
Sales Revenue
Margin
e-Fashion Houston
307,914
133,802
e-Fashion Houston
Leighton
316,232
136,055
Query filters and report filters compared
You can apply filters at two levels within a document:
•
•
query filters – these filters are defined on the query; they limit the data
retrieved from the data source and returned to the Web Intelligence
document
report filters – these filters limit the values displayed on reports, tables,
charts, sections within the document, but they don’t modify the data that
is retrieved from the data source; they simply hide values at the report
level
Web Intelligence Rich Client User's Guide
105
9
9
Working with queries in Web Intelligence Rich Client
Filtering queries
Types of query filter
You can create the following types of query filter:
•
•
•
•
predefined filters – created by your administrator
custom filters – you define on the query
quick filters - a simplified form of custom filter for simple filters
prompts – you define these dynamic filters to display a question or a list
of values so you or other users can select different filter value(s) at each
run query
You can different types of filters on a single query.
Predefined query filters
Predefined filters make the specific data you most typically need for reports
permanently available in Web Intelligence. They are created by an
administrator and saved with the universe. Predefined filters often contain
complex expressions that require a detailed knowledge of the database
structure. Including predefined filters on the universe means you don’t need
to create the same custom filters every time you create new Web Intelligence
documents based on the same universe.
As a Web Intelligence user, you cannot view the component parts of
predefined filters or edit predefined filters.
To select a predefined query filter
• Double-click the predefined filter or drag it to the Query Filters pane.
When you run the query, the data corresponding to the query filters you
selected is returned to the report.
Quick query filters
Quick filters allow you to quickly define the values you want to retrieve for a
specific object without launching the Filter Editor. By default, Quick filters
use the Equal to operator if you select a single value or the In list operator
if you select multiple values.
For example:
106
Web Intelligence Rich Client User's Guide
Working with queries in Web Intelligence Rich Client
Filtering queries
•
•
If you select the [Payment Status] dimension and the value “unpaid” you
create the filter: [Payment Status] Equal to “unpaid”
If you select the [Country] dimension and the values US, Japan, Germany,
you create the filter: [Country] In list “US;Japan;Germany”
To create a quick query filter
1. Select the object you want to filter and drag it to the Result Objects pane.
2. Reselect the object on the Result Objects pane and click the Add Quick
Filter button on the Report toolbar.
The List of Values dialog box appears. The values for the selected object
are listed.
3. Select the values you want to retrieve from the database.
For example, to filter the query for values in Q1, select the [Quarter]
dimension, then select Q1 from the list of values.
4. Click OK
The new filter appears on the Query Filters pane.
Custom query filters
You create custom query filters to limit document data to information
corresponding to:
•
•
a specific business question
the business information needs of a specific group of users
For example, you can create custom filters to retrieve sales results data for
specific dates, products, or services, or to view customer information only
for customers who are high wage earners or who live in a particular region.
To use the Filter Editor to create filters
1. Select the object you want to filter and drag it to the Query Filters pane.
The query filter appears in outline in the Query Filters pane.
2. Click the arrow next to the default operator (In List) and select the query
operator from the list of operators.
3. Click the arrow on the right of the query filter and select Constant, Value(s)
from List or Object.
4. Type/select the constant, list of values or object you want to include in
the filter.
Web Intelligence Rich Client User's Guide
107
9
9
Working with queries in Web Intelligence Rich Client
Filtering queries
5. Click OK.
The new filter appears in the Query Filters pane.
6. To remove the filter, right-click it and select Remove from the menu.
Query filter and prompt operators
Equal To operator
Use the Equal to operator to obtain data equal to a value.
For example, to return data for the US only, create the filter "County Equal
To US".
Not Equal To operator
Use the Not Equal To operator to obtain data not equal to a value.
For example, to return data for all countries except the US create the filter
"County Not Equal To US".
Different From operator
Use the Different From operator to retrieve data different from a value.
For example, to retrieve data for all quarters execpt Q4, create the filter
[Quarter] Different From "Q4"
Greater Than operator
Use the Greater Than operator to retrieve data greater than a value.
For example, to retrieve data for customers aged over 60, create the filter
"[Customer Age] Greater than 60".
Greater Than Or Equal To operator
Use the Greater Than Or Equal To operator to retrieve data greater than or
equal to a value.
For example, to retrieve data for revenue starting from $1.5M, create the
filter "[Revenue] Greater than or equal to 1000500".
Less Than operator
Use the Less Than operator to retrieve data lower than a value.
108
Web Intelligence Rich Client User's Guide
Working with queries in Web Intelligence Rich Client
Filtering queries
For example, to retrieve data for exam grades lower than 40, create the filter
"[Exam Grade] Less Than 40".
Less Than Or Equal To operator
Use the Less Than Or Equal To operator to retrieve data less than or equal
to a value.
For example, to retrieve data for customers whose age is 30 or less, create
the filter "[Age] Less Than Or Equal To 30".
Between operator
Use the Between operator to retrieve data between and including two values.
For example, to retrieve data for weeks starting at week 25 and finishing at
36 (including week 25 and week 36), create the filter "[Week] Between 25
and 36".
Not Between operator
Use the Not Between operator to retrieve data outside the range of two
values.
For example; to retrieve data for all the weeks of the year, except for and
not including weeks 25 through 36, create the filter "[Week] Not between 25
and 36".
In List operator
Use the In List operator to retrieve data corresponding to values in a list of
values.
For example, to retrieve data for the US, UK and Japan only, create the filter
[Country] In List ("US";"UK";"Japan").
Not In List operator
Use the Not In List operator to retrieve data that does not correspond to
multiple values.
For example, if you do not want to retrieve data for the US, UK and Japan,
create the filter [Country] Not In ("US";"UK";"Japan").
Web Intelligence Rich Client User's Guide
109
9
9
Working with queries in Web Intelligence Rich Client
Filtering queries
Matches Pattern operator
Use the Matches Pattern operator to retrieve data that includes a specific
string or part of a string.
For example, to retrieve customers whose date of birth is 1972, create the
filter [DOB] Matches Pattern "72".
Different From Pattern operator
Use the Different From Pattern operator to return data that doesn't include
a specific string.
For example, to retrieve customers whose date of birth is not 1972, create
the filter [DOB] Different From Pattern '72'.
Both operator
Use the Both operator to retrieve data that corresponds to two values.
For example, to retrieve customers who have both a fixed and a mobile
telephone, create the filter [Account Type] Both 'Fixed' And 'Mobile'.
Except operator
Use the Except operator to retrieve data that corresponds to one value and
excludes another.
For example, to retrieve customers who have a fixed telephone and do not
have a mobile telephone, create the filter [Account Type] 'Fixed' Except
'Mobile'.
The Except operator is more restrictive than Different From or Not In
List. For example, a report that returns customers and that includes the
filter [Lines] Different From 'Accessories' excludes all sales records
where the item sold is part of the 'Accessories' line. If the same customer
has purchased Accessories and non-Accessories items, the customer still
appears in the report, but their spending total includes only non-Accessories
sales.
If the filter is [Lines] Except 'Accessories', only customers who have
bought no accessories are included in the report.
Related Topics
•
110
Not In List operator on page 225
Web Intelligence Rich Client User's Guide
Working with queries in Web Intelligence Rich Client
Filtering queries
•
Different From operator on page 224
Combining query filters
Combining query filters
Typical business questions require you to retrieve information that matches
more than one criteria. For example, if you are analyzing customer services
data, you will most likely want to focus on customers for a specific time period
and also for a specific region, and probably also for a specific level of
customer service contract. You can retrieve data that answers several criteria
like this by combining filters in the same query.
Example: Analyze sales revenue this year at stores where the floor size
is over 4,000 square feet and sales revenue figures are equal to or less
than $1.5M
In this example, you are an operations manager for a retail chain. You want
to analyze information about the large retail stores in your chain that are
making less than the sales revenue figure your company has set as the
target.
To do this you add a predefined filter on the [Year] dimension to specify
that you only want to retrieve values for this year. Then you create a second
filter on the [Sales Floor Size] dimension to specify that you only want to
retrieve data for stores where the floor size is greater than 4,000 square
feet. After this, you create a third filter on the [Sales Revenue] measure to
specify that you only want to retrieve data for stores where the sales revenue
figures are equal to or less than $1.5M. Finally, you combine these three
filters with the And operator:
Last Year
AND
Sales Floor Size Group Greater than or equal to:
4000
Sales Revenue Less than 1,500,000
When you run the query, only data for stores that satisfy all three criteria
will be returned to the report.
Web Intelligence Rich Client User's Guide
111
9
9
Working with queries in Web Intelligence Rich Client
Filtering queries
To combine query filters
1. Create the filters and add them to the Query Filters pane.
By default, Web Intelligence combines the filters with the AND operator.
2. Double-click the operator (in Query - HTML) or click the arrow next to the
operator checkbox and select the other operator (HTML Report Panel)
to toggle between AND and OR.
Nesting query filters
Nesting query filters allows you to create more complex filter conditions than
is possible when you combine filters at the same level.
When you nest filters, you set the order in which Web Intelligence evaluates
them. For example, Web Intelligence can return the data given by two query
filters joined in an OR relationship (where either one filter condition or the
other is true) and then further restrict this data by applying another filter to
it. In this case, the two filters in an OR relationship are nested, then compared
with the other filter in an AND relationship.
The following example illustrates this:
Example: List all sales made in Japan either in Q4 or where the revenue
was greater than 1000000
To answer this question you create the following nested query filter:
Country Equal To Japan
Quarter Equal To Q4
AND
OR
Revenue Greater Than
1000000
Web Intelligence first returns sales data where the sale was made in Q4
or the revenue was greater than 1000000, then restricts this data further
by returning only those sales made in Japan.
To nest query filters
1. Drag and drop a report object onto an existing query filter.
112
Web Intelligence Rich Client User's Guide
Working with queries in Web Intelligence Rich Client
Filtering data with subqueries
A query filter outline on the report object appears in a nested AND
relationship with the existing query filter.
2. Define the new query filter.
Filtering data with subqueries
What is a subquery?
A subquery is a more flexible kind of query filter that allows you to restrict
values in more sophisticated ways than is possible with a ordinary query
filters.
Subqueries are more powerful than ordinary query filters for the following
reasons:
•
•
They allow you to compare the values of the object whose values are
used to restrict the query with values from other objects.
They allow you to restrict the values returned by the subquery with a
WHERE clause.
What can you do with subqueries?
Subqueries allow you to pose complex questions that are difficult or
impossible to formulate with simple query filters. For example: what is the
list of customers and their associated revenue where the customer purchased
a service that had previously been reserved (by any customer) in Q1 of 2003?
How do subqueries work?
Subqueries work by modifying the SQL that Web Intelligence generates to
retrieve the query data. Web Intelligence generates SQL containining a
subquery that restricts the data returned by an outer query. For more
information on SQL subqueries, see any book on SQL.
Note: SQL is the query language supported by all relational databases
(RDBMS), although each database has its own syntax.
Web Intelligence Rich Client User's Guide
113
9
9
Working with queries in Web Intelligence Rich Client
Filtering data with subqueries
To build a subquery
1. Add the objects that you want to appear in the query to the Result Objects
pane.
2. Select the object that you want to filter with a subquery.
3. Click Add a subquery.
The subquery outline appears in the Query Filters pane. By default the
object you selected appears as the Filter object and Filter By object. For
more information on the Filter Object and Filter By object, see Subquery
parameters on page 116.
4. To add a WHERE condition to the subquery, drag a report object to the
area of the subquery below the Drop an object here boxes.
5. To add a WHERE condition to the subquery, drag a report object to the
area of the subquery below the Drop an object here boxes.
You can use an existing subquery or standard query filter as a WHERE
condition in a subquery. To do so, drag and drop the existing filter or
subquery to the area of the subquery below the Drop an object here
boxes. To copy rather than move the existing filter to the WHERE
condition, hold down the Control key while dragging and dropping. In this
case the existing filter remains in its initial place and becomes part of the
WHERE condition of the subquery.
6. Select the operator and values used to filter the object in the WHERE
condition.
7. Click Subquery to add an additional subquery to the query filter.
In addition to linking subqueries in AND or OR relationships, you can nest
them (create subqueries within subqueries) by dragging an existing
subquery to the area beneath the Drop an object here boxes. In this
case the inner subquery becomes part of the WHERE condition of the
outer subquery. To copy rather than move the subquery to the WHERE
condition, hold down the Control key while dragging and dropping. In this
case the second subquery remains at the same level as the first, and
becomes part of the WHERE clause of the first.
By default the two subqueries are linked in an AND relationship. Click the
AND operator to toggle between AND and OR.
8. To nest a subquery (create a subquery within a subquery), drag an existing
subquery to the area beneath the Drop an object here boxes.
114
Web Intelligence Rich Client User's Guide
Working with queries in Web Intelligence Rich Client
Filtering data with subqueries
To copy rather than move the subquery to the WHERE condition, hold
down the Control key while dragging and dropping. In this case the second
subquery remains at the same level as the first, and becomes part of the
WHERE clause of the first
The inner subquery becomes part of the WHERE condition of the outer
subquery.
Example: Which customers bought a service that had previously been
reserved in Q1 of 2003, and how much revenue have they generated?
SeeTo find out which customers bought a service that had previously been
reserved in Q1 of 2003, and how much revenue have they generated on
page 115.
To find out which customers bought a service that had previously
been reserved in Q1 of 2003, and how much revenue have they
generated
1. Drag the Customer and Revenue objects to the Result Objects pane of
the Query Panel.
2. Select the Service object.
3. Click Subquery.
The subquery outline appears in the Query Filters pane.
Note: The selected object appears in both boxes in the subquery outline.
You often use the same object in both boxes, although this is not required.
If the objects do not return any common values, the subquery returns no
values, and the query therefore returns no values.
4. Drag the Reservation Year object to the area of the subquery outline
beneath the Service objects.
Web Intelligence adds a WHERE condition on the Reservation Year
object.
5. Set the Reservation Year condition operator to Equal To.
6. Type ‘FY2003’ in the Type a constant box.
7. Drag the Reservation Quarter object to the area of the subquery outline
beneath the Service objects.
Web Intelligence adds the Reservation Quarter object to the WHERE
condition.
Web Intelligence Rich Client User's Guide
115
9
9
Working with queries in Web Intelligence Rich Client
Filtering data with subqueries
8. Set the Reservation Quarter condition operator to Equal To.
9. Type ‘Q1’ in the Type a constant box.
10. Click Run Query to run the query.
Subquery parameters
A subquery or set of subqueries contains the following parameters:
Parameter
Description
The object whose values are used to
filter the result objects.
Filter Object(s)
You can include more than one Filter
Object. If you do, Web Intelligence
concatenates the values of the objects
you specify.
The object that determines which Filter
Object values the subquery returns.
Filter By Object(s)
116
Web Intelligence Rich Client User's Guide
You can include more than one Filter
By object. If you do, Web Intelligence
concatenates the values of the objects
you specify.
Working with queries in Web Intelligence Rich Client
Filtering data with subqueries
Parameter
Description
The operator that specifies the relationship between the Filter object and the
Filter By object.
Operator
Because of database restrictions you
cannot use certain combinations of
operators and Filter By objects together. For example, if you use the Equal
To operator with a Filter By object that
returns multiple values, the database
rejects the SQL because this type of
subquery requires the Filter By object
to return one value only.
In cases where the generated SQL is
rejected by the database, you see an
error message showing the error description returned by the database
WHERE condition (optional)
An additional condition that constrains
the list of values of the Filter By object.
You can use ordinary report objects,
predefined conditions or existing query
filters (including subqueries) in the
WHERE condition.
If there is more than one subquery,
determines the relationship between
the subqueries.
Relationship operator
AND - the conditions in all of the subqueries must be satisfied.
OR - the conditions in any one of the
subqueries must be satisfied.
Web Intelligence Rich Client User's Guide
117
9
9
Working with queries in Web Intelligence Rich Client
Ranking data using database ranking
Ranking data using database ranking
What is database ranking?
When you rank data you sort and filter it according to ranking criteria. Web
Intelligence allows you to return unranked data from a database, then rank
it in Web Intelligence. (For more information, see Ranking data on page 152.)
A database ranking allows you to specify a ranking at the query and database
level so that the data returned to Web Intelligence by the query is already
ranked.
Database rankings allow you to answer questions like “Return the top 3
customers based on the revenue they generated for each year” at the query
level, without the need to return data that falls outside the ranking to Web
Intelligence and then filter it using a Web Intelligence ranking.
Database ranking has the following advantages:
•
•
Ranking data can be processing-intensive. By ranking at the database
level you allow the server, which is typically far more powerful than the
client machine, to perform this processing.
Pre-ranking data reduces the amount of data retrieved across the network
and stored in Web Intelligence.
A database ranking works by modifying the SQL that Web Intelligence
generates to retrieve the query data. If your database supports ranking, Web
Intelligence generates SQL to rank the data. Web Intelligence uses the
SQL-99 Rank function in ranking SQL. (SQL is the query language supported
by all relational databases (RDBMS), although each database has its own
syntax.)
Note: You can perform a database ranking only if your database supports
it. If this is not the case, the Add a database ranking button is disabled on
the Query Panel toolbar. Databases that support ranking are Oracle, DB2,
Terradata and Redbrick.
118
Web Intelligence Rich Client User's Guide
Working with queries in Web Intelligence Rich Client
Ranking data using database ranking
Database ranking parameters
A database ranking appears as follows in the Query Filters pane of the Query
Panel:
The following table describes the parameters from left to right in the ranking:
Parameter
Description
Top/Bottom
Ranking order.
• Top - ranks in descending order.
• Bottom - ranks in ascending order.
Number of records
The number of records to return in the
ranking. For example, the top 10.
Ranking dimension
The dimension used in the ranking. For
example, if the dimension is Region
and the ranking is Top 10, the ranking
returns the top 10 regions.
Based on
The measure by which the ranking dimension is ranked. For example, if the
measure is Revenue and the dimension is Region, Web Intelligence ranks
regions by the amount of revenue they
generate
For Each (optional)
Dimension that specifies additional
calculation context for the ranking. For
example, if the ranking dimension is
Region, the measure is Revenue and
the For Each dimension is Country,
Web Intelligence ranks regions by revenue within each country.
Web Intelligence Rich Client User's Guide
119
9
9
Working with queries in Web Intelligence Rich Client
Ranking data using database ranking
Parameter
Description
WHERE condition (optional)
Additional restriction on the values returned in the ranking that appears below the other parameters. For example,
a ranking of regions with a condition
that restricts Country to “USA” ranks
only those regions in the USA.
To create a database ranking
1. Add the objects that you want to appear in your query to the Result Objects
pane of the Query Panel.
2. Select the dimension that you want to rank by.
3. Click Add a database ranking on the toolbar.
The ranking outline appears in the Query Filter pane. The dimension you
selected appears as the ranking dimension and the first measure in the
query appears as the ranking measure in the Based on box.
Note: The Add a database ranking button is disabled if your database
does not support ranking.
4. Select the ranking direction (Top or bottom.)
5. Type the number of records you want the ranking to return in the box next
to Top/Bottom.
You can specify a prompt instead of a constant by clicking on the arrow
next to the number. When you select a prompt the user must enter the
ranking number when the query is run.
6. Drag the dimension that provides the calculation context for the measure
to the For Each box.
This dimension is optional. To display the For Each box, click the arrow
to the right of the Based on measure.
7. Drag any dimensions that you want to include in the WHERE restriction
to the area at the bottom of the ranking. (For more information on the
WHERE restriction, see the explanation in What is a subquery? on
page 113.)
120
Web Intelligence Rich Client User's Guide
Working with queries in Web Intelligence Rich Client
Ranking data using database ranking
8. Click Run Query.
Example: Create a report that returns the top 10 employees based on
salary, and calculated by department.
See To create a report that returns the top 10 employees based on salary,
and calculated by department on page 121.
To create a report that returns the top 10 employees based on
salary, and calculated by department
1. Drag the Department, Employee Name, and Salary objects to the Report
Objects pane within the Query Panel.
2. Select the Employee Name object.
3. Click Add a database ranking on the toolbar.
Web Intelligence adds an outline database rank to the Query Filters pane.
The ranking dimension is Employee Name and the ranking measure is
Salary.
4. Set the ranking direction to Top.
5. Set the ranking number to 10.
6. Click the arrow next to the Based on measure if the For Each box is not
already visible.
7. Set the For Each dimension to Department by dragging and dropping the
dimension.
The ranking now looks like this:
8. Click Run Query.
Web Intelligence Rich Client User's Guide
121
9
9
Working with queries in Web Intelligence Rich Client
Filtering data using prompts
Filtering data using prompts
What is a prompt?
A prompt is a special type of query filter. It is a dynamic filter that displays a
question every time you refresh the data in a document. You answer prompts
by either typing or selecting the value(s) you want to view before you refresh
the data. Web Intelligence retrieves only the values you specified from the
database and returns those values to the reports within the document.
Prompts allow multiple users viewing a single document to specify a different
sub-set of the database information and display it in the same report tables
and charts. Prompts also reduce the time it takes for the data to be retrieved
from the database.
A prompt contains the following elements:
•
•
•
a filtered object
an operator
a message
For example, to prompt users to select a specific year, you define a prompt
on the [Year] dimension:
Year Equal To ("Which year?°)
In this prompt, the filtered object is [Year], the operator is Equal To, and the
prompt message is "Which year?".
You can define prompts on any dimension, measure, or detail object. For
example, you can filter the [Year] dimension to return values for a specific
year, filter the [Sales Revenue] measure to return values for a range of
revenue figures, or filter the [Year/week] detail to return values for a specific
week in a year.
You can create multiple prompts, related by the AND or OR operators, in
the same query. You can also nest prompts. When the user runs a query,
Web Intelligence displays the prompts.
Prompts appear in the SQL generated by a Web Intelligence query as either
the value supplied in response to the prompt (when the SQL is read-only),
122
Web Intelligence Rich Client User's Guide
Working with queries in Web Intelligence Rich Client
Filtering data using prompts
or as Web Intelligence prompt syntax (when the SQL is editable). For
example, a prompt on [Country) can appear in the generated SQL as
Resort_Country.country = @prompt('Enter Country:','A',
'Resort\Country', Mono,Free,Persistent,,User:0)
or as
Resort_country.country In ('UK')
Merged prompts
When a document contains multiple data providers, any prompts that include
(1) objects with the same data type, (2) operators of the same operator type,
and that (3) use the same prompt text are merged.
When all the data providers are refreshed, a single prompt message appears
for such prompts.
The List of Values displayed by the merged prompt is the list associated with
the object in the prompt that has the most display property constraints.
Cascading prompts
Some objects cause Web Intelligence to display a cascading prompt when
they are included in a prompt definition. The universe designer defines the
lists of values of these objects hierarchically in relation to other object lists
of values in the universe.
Cascading prompts help the user to focus on the object values they want to
include in the prompt without the need to search all possible object values.
Example: Choosing a store
In this example the universe designer has defined the [Store Name], [City]
and [State] objects in a hierarchy. If you include a prompt [Store Name]
Equal To <value>, Web Intelligence displays these objects in a hierarchy
in the Prompts dialog box. In order to select the store, the user must first
select the state in which the store city is found, then the city in which the
store is found, then the store itself. When the user selects the state, Web
Intelligence restricts the values of City to the cities in the state; when the
Web Intelligence Rich Client User's Guide
123
9
9
Working with queries in Web Intelligence Rich Client
Filtering data using prompts
user selects the city, Web Intelligence restricts the stores to the stores in
the city.
Hierarchical lists of values
If your universe contains hierararchical lists of values, these lists appear in
tree form. You navigate down through the tree to the items you want.
Whether a list of values appears as a cascading prompt or hierarchically
depends on how the list is configured in the universe. See your administrator
for more information.
Query filter and prompt operators
Equal To operator
Use the Equal to operator to obtain data equal to a value.
For example, to return data for the US only, create the filter "County Equal
To US".
Not Equal To operator
Use the Not Equal To operator to obtain data not equal to a value.
For example, to return data for all countries except the US create the filter
"County Not Equal To US".
Different From operator
Use the Different From operator to retrieve data different from a value.
For example, to retrieve data for all quarters execpt Q4, create the filter
[Quarter] Different From "Q4"
124
Web Intelligence Rich Client User's Guide
Working with queries in Web Intelligence Rich Client
Filtering data using prompts
Greater Than operator
Use the Greater Than operator to retrieve data greater than a value.
For example, to retrieve data for customers aged over 60, create the filter
"[Customer Age] Greater than 60".
Greater Than Or Equal To operator
Use the Greater Than Or Equal To operator to retrieve data greater than or
equal to a value.
For example, to retrieve data for revenue starting from $1.5M, create the
filter "[Revenue] Greater than or equal to 1000500".
Less Than operator
Use the Less Than operator to retrieve data lower than a value.
For example, to retrieve data for exam grades lower than 40, create the filter
"[Exam Grade] Less Than 40".
Less Than Or Equal To operator
Use the Less Than Or Equal To operator to retrieve data less than or equal
to a value.
For example, to retrieve data for customers whose age is 30 or less, create
the filter "[Age] Less Than Or Equal To 30".
Between operator
Use the Between operator to retrieve data between and including two values.
For example, to retrieve data for weeks starting at week 25 and finishing at
36 (including week 25 and week 36), create the filter "[Week] Between 25
and 36".
Web Intelligence Rich Client User's Guide
125
9
9
Working with queries in Web Intelligence Rich Client
Filtering data using prompts
Not Between operator
Use the Not Between operator to retrieve data outside the range of two
values.
For example; to retrieve data for all the weeks of the year, except for and
not including weeks 25 through 36, create the filter "[Week] Not between 25
and 36".
In List operator
Use the In List operator to retrieve data corresponding to values in a list of
values.
For example, to retrieve data for the US, UK and Japan only, create the filter
[Country] In List ("US";"UK";"Japan").
Not In List operator
Use the Not In List operator to retrieve data that does not correspond to
multiple values.
For example, if you do not want to retrieve data for the US, UK and Japan,
create the filter [Country] Not In ("US";"UK";"Japan").
Matches Pattern operator
Use the Matches Pattern operator to retrieve data that includes a specific
string or part of a string.
For example, to retrieve customers whose date of birth is 1972, create the
filter [DOB] Matches Pattern "72".
Different From Pattern operator
Use the Different From Pattern operator to return data that doesn't include
a specific string.
126
Web Intelligence Rich Client User's Guide
Working with queries in Web Intelligence Rich Client
Filtering data using prompts
For example, to retrieve customers whose date of birth is not 1972, create
the filter [DOB] Different From Pattern '72'.
Both operator
Use the Both operator to retrieve data that corresponds to two values.
For example, to retrieve customers who have both a fixed and a mobile
telephone, create the filter [Account Type] Both 'Fixed' And 'Mobile'.
Except operator
Use the Except operator to retrieve data that corresponds to one value and
excludes another.
For example, to retrieve customers who have a fixed telephone and do not
have a mobile telephone, create the filter [Account Type] 'Fixed' Except
'Mobile'.
The Except operator is more restrictive than Different From or Not In
List. For example, a report that returns customers and that includes the
filter [Lines] Different From 'Accessories' excludes all sales records
where the item sold is part of the 'Accessories' line. If the same customer
has purchased Accessories and non-Accessories items, the customer still
appears in the report, but their spending total includes only non-Accessories
sales.
If the filter is [Lines] Except 'Accessories', only customers who have
bought no accessories are included in the report.
Related Topics
•
•
Not In List operator on page 225
Different From operator on page 224
To create a prompt
1. Make sure the Query Panel is open.
2. From the Data tab, drag the object on which you want to apply a prompt
and drop it onto the Query Filters pane.
Web Intelligence Rich Client User's Guide
127
9
9
Working with queries in Web Intelligence Rich Client
Filtering data using prompts
The query filter appears in outline in the Query Filters pane.
3. Click the arrow at the right of the Query Filter and select Prompt from
the menu.
4. Type the prompt text in the text box.
5. Click the icon next to the text box and use the dialog box that appears to
set the prompt properties.
• If the prompt is for a date and you want users to see the popup
calendar in order to select the date(s) then do not select Prompt with
List of Values
• If the document contains multiple data providers, and there is already
a prompt that includes (1) objects with the same data type, (2)
operators of the same operator type, and (3) that uses the same prompt
text as the new prompt, Web Intelligence displays a warning to tell
you that the two prompts will be merged. This means that whenever
all the data providers are refreshed, a single prompt message will
appear for the two prompts.
6. Click OK to confirm the prompt.
7. To delete a prompt, right-click it and select Remove from the menu.
The prompt appears at each document refresh.
Related Topics
•
•
Defining how prompts display on page 228
Merged prompts on page 222
To remove a prompt
•
Select the prompt and then click the Delete key.
Defining how prompts display
By default, prompts display a box and a list of values. You answer the prompt
by either typing the value(s) in the box or by selecting value(s) from the list.
You can modify how prompts display by checking one, some, or all of the
following options:
128
Web Intelligence Rich Client User's Guide
Working with queries in Web Intelligence Rich Client
Filtering data using prompts
If you want the prompt
(useful when you...)
to display...
then...
want to view all the valthe list of values associatues for the object and
ed with the filtered dimenthen select from those
sion, measure, or detail,
values
leave the option selected
by default: Prompt with
List of Values
the value(s) specified the
last time the prompt was
answered (users can select a different value(s)),
often reselect the same
value(s) when you refresh the document, but
want the ability to select select the option: Keep
a different value when
last values selected
necessary, such as the
name of the current
month
almost always reselect
the same value(s) when
the value(s) you specify you refresh the docuas the default (users can ment, but want the ability select the option: Set deselect a different valto select a different value fault value(s)
ue(s)),
when necessary, such as
the number for the current year
prevent users from typing
a list of values from which
select the option: Select
a value that might not exusers select a value(s),
only from List
ist on the database
Note: If the prompt is for a date and you want users to see the popup
calendar in order to select the date(s) then do not select Prompt with List
of Values
Combining prompts
Combining multiple prompts on a single query enables you to filter the data
returned to the document so that each person viewing the reports sees only
the information relevant to their business need. For example, you can
combine the following three prompts on a Customer Accounts document:
Web Intelligence Rich Client User's Guide
129
9
9
Working with queries in Web Intelligence Rich Client
Filtering data using prompts
•
•
•
Which customer?
Which account?
Which calendar period: from? to?
This enables each accounts manager viewing the document to view report
values for a specific customer account during a specific period.
You combine prompts in the same way that you combine query filters.
Combining prompts with query filters
Combining prompts and filters on a single query enables you decide the
values for some of the selected objects on the query using filters and allow
users to decide the values of other selected objects using prompts. For
example, if you combine the following filters and prompts on a HR document:
•
•
•
[Year] Equal to This Year
[Job title] Not equal to Senior Executive
Which employee?
Users viewing the document can choose which employee they view
information for, but they can only view data for the current year and they
can’t view data for senior executives.
To change the order of prompts
1. Click the Properties tab in the Query Panel.
2. Select the prompt you want to move up or down in the prompt order in
the Prompt Order box, then press the Up or Down arrow next to the box.
Merging prompts
When a document contains multiple queries, Web Intelligence merges any
prompts that include objects with the same data type, operators of the same
operator type, and that use the same prompt text. When all the queries are
refreshed, a single prompt message appears for such prompts.
130
Web Intelligence Rich Client User's Guide
Working with reports
10
10
Working with reports
Using alerters to highlight results
Using alerters to highlight results
Creating, using and removing alerters
Alerters defined
Alerters enable you to highlight results that meet or fail specific business
targets. You can create a simple alerter to highlight particularly high or low
results with a specific color or with a text comment, such as “High Performer.”
An alerter can contain up to six conditions. This enables you to highlight
information that meets multiple business criteria. For example, you can define
an alerter that highlights high revenue for a specific business activity or
customer sector.
You can apply alerters to table body cells (by column or row), to section cells,
to header cells, and to free-standing cells. However, you cannot apply alerters
to entire tables or forms, or to charts.
Business Objects officially supports up to 30 alerters in a Web Intelligence
document. You can apply those alerters to a maximum of 20 table columns
or rows, free-standing cells, or section cells on the reports.
Business Objects officially supports up to 10 different alerters on a single
table column or row, free-standing cell, or section cell.
You can define alerters to activate the following formatting changes to the
selected table columns/rows or cells:
•
•
•
text color, size and style
cell border colors and style
cell background display – specific colors, images, or hyperlinks to web
pages
You can also define alerters that display a text or formula, an image, or a
hyperlink. In this case, the results that meet the condition defined in the
alerter will be replaced by the text for formula.
If you define an alerter with multiple conditions, each condition generates
the same formatting changes. To generate different formatting changes for
different conditions, you must use sub-alerters.
132
Web Intelligence Rich Client User's Guide
Working with reports
Using alerters to highlight results
Alerters are dynamic. This means that when you refresh reports with the
latest data on the database, the alerters highlight the new results accordingly.
If you apply an alerter to a table row or column with a break, the alerter is
only activated when the value that meets the condition in the alerter appears
on the first row of that break.
Sub-alerters
An alerter can be made of multiple sub-alerters, each containing one or
multiple conditions. Sub-alerters allow you to apply different conditions and
different formatting to a single object.
You must use sub-alerters if you want different conditions to generate different
formats. If you define an alerter with multiple conditions, the alerter format
is applied to all of the conditions.
For example, in a single alerter defined for [Sales revenue], one sub-alerter
can highlight high results in green and a second sub-alerter can highlight
low results in red. You can include a maximum of eight sub-alerters in an
alerter.
To launch the Alerter Editor and name a new alerter
1. Click a table column, a table row, a section cell or a free-standing cell.
2. Click Alerters on the toolbar to display the "Alerters" dialog box.
3. Click New.
4. In the Alerter name text box, type a name for the alerter.
5. Type the alerter description in the Description text box.
To add alerter conditions
1. In the "Alerter Editor", click + to the right of Format.
Note: You do not need to click + to add the first condition.
2. Define the condition by specifying the appropriate Filtered object or cell,
Operator and Operand(s).
Option
Description
Select Cell Contents.
Use this option to define the alerter on
whichever cell contents are selected
on the report, independent of any
specific object or variable.
Web Intelligence Rich Client User's Guide
133
10
10
Working with reports
Using alerters to highlight results
Option
Description
Leave the current object name
selected, or click ..., then select
Objects and variables from the
popup menu, then select an object or variable from the list and
click OK.
Use this option to define the alerter on
a specific object or variable in the
document.
If the cell(s) on which you want to create an alerter contains date or
numeric type data (for example, a date or a calculation) you need to select
an object or variable instead of Cell contents. This is because, Web
Intelligence considers any value you type into the Operand(s) text box
as a character string.
3. To remove a condition, click - next to the condition.
To format alerters
1. Click Format in the "Alerter Editor".
The "Alerter Display" dialog box appears.
2. Use the "Alerter Display" dialog box to specify the alerter format.
3. Click OK to close the "Alerter Display" dialog box.
To add sub-alerters
1. Click Add Sub-Alerter in the "Alerter Editor"
2. Define the sub-alerter conditions.
3. To remove a sub-alerter, click Remove Sub-Alerter.
To activate or deactivate an alerter
1. Click the table column, table row, section cell or a free-standing cell to
which you want to apply the alerter.
2. Click Alerters on the toolbar.
3. Check (to activate) or uncheck (to deactivate) the checkbox next to the
alerter you want to activate or deactivate.
To remove alerters
1. Click Alerters on the toolbar.
The "Alerters" dialog box appears.
2. Select the alerter you want to remove, then click Remove.
134
Web Intelligence Rich Client User's Guide
Working with reports
Using alerters to highlight results
3. Click OK to close the Alerters dialog box.
To prioritize alerters
1. Click the Alerters button on the report panel
The "Alerters" dialog box appears.
2. To set the alerter priority for the entire document, click a blank area of
the report page. To set the alerter priority for a select cell, column or row,
select the cell, column or row.
3. Select the alerter you want to prioritize.
4. Click Up to increase the alerter priority or Down to decrease the priority.
To duplicate alerters
1. Click the Alerters button on the report panel
The "Alerters" dialog box appears.
2. Select the alerter you want to duplicate, then click Duplicate.
The duplicate alerter appears in the list with the name <Original alerter
name> (n). For example, if the original alerter is called Champions, the
first duplicate is called Champions (1).
To edit alerters
1. Click Alerters on the toolbar.
The "Alerters" dialog box appears.
2. Select the alerter you want to edit and click Edit.
3. Edit the alerter in the "Alerter Editor".
To select an object or variable
1. Select the object or variable from the list.
2. Click OK.
To select values from a list
1. To search the list of values, type the string for which you want to search
in the search box beneath the list.
2. Click the arrow to the right of the search box and select Normal (for a
non-case-sensitive search) or Match Case (case-sensitive).
3. Select the value from the list.
4. Click OK.
Web Intelligence Rich Client User's Guide
135
10
10
Working with reports
Using alerters to highlight results
Using formulas to create advanced alerters
You can build advanced alerters using the Web Intelligence formula language
rather than using the Filtered object or cell, Operator and Operand choices
offered by default.
You can create alerters that display text, formulas, or hyperlinks in the report
cells, where results meet the condition(s) defined in the alerter.
This enables you to display messages in cells, such as “UNPAID,” or to
display formulas that change the results (for example, to display a text you
specify and the result of the object in the same cell), or to include links to
other web pages that can be consulted easily whenever results meet the
business condition(s) set in the alerter.
Example: Highlighting three ranges of quarterly sales revenue results
calculated as percentages of the average sales revenue
In this example, you build three alerters to color-code sales revenues,
depending on their relationship to the average sales revenue. The table
includes results for three years, and this is the average to which you want
to compare each sales revenue result calculated per quarter per product
line.
Using the Formula option in the Alerter Editor, you build the following alerter,
which contains three sub-alerters.
Each sub-alerter has a single condition. Web Intelligence combines the
sub-alerters with the Or operator, as follows:
[Sales revenue] < ((Average([Sales revenue]) In Block) * 0.8)
Or
=[Sales revenue] < ((Average([Sales revenue]) In Block) * 1.2)
Or
=[Sales revenue] > ((Average([Sales revenue]) In Block) * 1.2)
The formula you specify for each sub-alerter is calculated as follows:
• The first sub-alerter will be activated on sales revenue results that are
< 0.8 (this means, less than 80%) of the average.
136
Web Intelligence Rich Client User's Guide
Working with reports
Using alerters to highlight results
•
•
The second sub-alerter will be activated on sales revenue results that
are < 1.2 (this means, less than 120%) of the average.
The third sub-alerter will be activated on sales revenue results that are
> 1.2 (this means, greater than 120%) of the average.
You then use the formula pane in the Alerter Display dialog box, to specify
the conditional formatting you want displayed on the report cells. Here, you
specify an appropriate text string and format you want displayed, when the
results in a table cell meet the condition for one of the sub-alerters. You
specify the following:
•
•
•
Report cells containing sales revenue results that are less than 80% of the
average revenue display the character string in red.
Report cells containing sales revenue results that are less then 20% above
the average revenue display in blue. Note that this alerter covers values
also covered by the first alerter. For example, if the average is 100, then 79
is both > 80% below the average and < 20% above the average. In this
case, the first alerter takes precedence.
Report cells containing sales revenue results that are greater than 20%
above the average revenue display in green.
This formatting enables you to see at a glance which product lines are
generating above or below the total average sales revenue.
To create an alerter containing a formula
1.
2.
3.
4.
5.
Click Alerters on the toolbar to display the "Alerters" dialog box.
Click New.
Type the alerter name in the Alerter name box.
TYpe the alerter description in the Description box.
Click Formula and type the formula in the formula box, or launch the
Formula Editor to build the formula by clicking the Formula button.
6. Click Format and define the formatting associated with the formula result.
7. Add sub-alerters as necessary.
8. Click OK.
Web Intelligence Rich Client User's Guide
137
10
10
Working with reports
Merging dimensions from multiple data providers
To use a formula to generate cell contents
1. To access the "Alerter Editor", click the Alerters button on the report
panel toolbar, then on the "Alerters" dialog box, then either click New
or select the alerter you want to edit and click Edit.
2. Click Format.
The Alerter Display dialog box appears.
3. To display text, type the text into the Display box, then click Validate.
Do not include quote marks before or after the text. For example, if you
want the alerter to display OVERDUE, then type: OVERDUE.
Web Intelligence inserts the “=” sign followed by quote marks before the
text string and inserts quote marks after the string.
4. To build a formula, click the Formula button, then use the "Formula
Editor" to build the formula.
5. To display a hyperlink, type the hyperlink into the Display box, then check
Read contents as and select Hyperlink from the list.
Merging dimensions from multiple data
providers
Merged dimensions defined
You can include multiple data providers in a Web Intelligence document.
You often need to synchronize the data returned by these data providers.
You do this by incorporating common dimensions into a merged dimension.
Merged dimensions and data synchronization were introduced in Web
Intelligence XI R2. They enormously increase the power and flexibility of
Web Intelligence by allowing you to synthesise data from different sources
in the same report, rather than simply including the data.
For example, if you have one database that contains detailed customer
information and another database that contains sales data, you can
synchronize the two data sources around the customer.
138
Web Intelligence Rich Client User's Guide
Working with reports
Merging dimensions from multiple data providers
When to merge dimensions
You merge dimensions when your report draws related data from different
data providers. For example, you have a report showing revenue and sales
targets. The report contains sections based on the year, and each section
shows revenue and sales targets. If revenue and sales target data comes
from two different data providers, Web Intelligence does not know that it is
related. You tell Web Intelligence that the data is related by merging the two
data providers on the common dimension, year.
When you merge dimensions, Web Intelligence creates a new dimension
that contains all the values from the original dimensions that make up the
merged dimension. You use this dimension in reports as you use any other
report object. You can add report objects from all the data providers
synchronized through the merged dimension in the same block as the merged
dimension.
Choosing which dimensions to merge
The only restriction that Web Intelligence imposes on merged dimensions
is that they must be of the same data type: for example, character data. But
it does not make sense to merge unrelated dimensions even when their data
types are the same. For example, it does not make sense to merge a
dimension containing customer names with a dimension containing sales
regions.
Merged dimensions often have the same name in both data sources, but
this is not obligatory. It can make sense to merge dimensions with different
names if they contain related data.
To merge dimensions correctly you need to be aware of the semantics of
the data (what the data refers to) in the different data sources. The dimension
data types and names are an approximate guide only to dimensions’ suitability
for merging.
Web Intelligence Rich Client User's Guide
139
10
10
Working with reports
Merging dimensions from multiple data providers
Merged dimension example
The following example with two data providers illustrates the effect of merging
dimensions:
Example: Merging City dimensions
Data Provider 1:
Country
City
US
New York
US
Los Angeles
France
Paris
France
Toulouse
Data Provider 2:
City
Revenue
New York
100000
Los Angeles
75000
Paris
90000
Toulouse
60000
If you merge the City dimensions and display the Country, merged City
dimensions and Revenue measure in a table, Web Intelligence returns the
following result:
If the City dimensions are not merged, Web Intelligence displays the
following result:
140
Web Intelligence Rich Client User's Guide
Working with reports
Merging dimensions from multiple data providers
Country
City
Revenue
US
New York
325000
US
Los Angeles
325000
France
Paris
325000
France
Toulouse
325000
Because there is no link between the two data providers through a merged
dimension, Web Intelligence is unable to relate the city revenues to
countries. As a result Web Intelligence displays the total revenue against
each Country/City pair.
If the City dimensions are merged, Web Intelligence displays the following
result:
Country
City
Revenue
US
New York
100000
US
Los Angeles
75000
France
Paris
90000
France
Toulouse
60000
Forcing merged calculations with the ForceMerge
function
By default, Web Intelligence does not account for merged dimensions in
calculations if the merged dimensions do not explicitly appear in the
calculation context.
Web Intelligence Rich Client User's Guide
141
10
10
Working with reports
Merging dimensions from multiple data providers
Example: Calculating revenue with ForceMerge
This example has two data providers as follows:
Data Provider 1:
Country
City
US
New York
US
Los Angeles
France
Paris
France
Toulouse
Data Provider 2:
City
Revenue
New York
100000
Los Angeles
75000
Paris
90000
Toulouse
60000
If you merge the [City] dimensions, then create a table with [Country] and
[Revenue], Web Intelligence displays the following result:
142
Country
Revenue
US
325000
US
325000
France
325000
Web Intelligence Rich Client User's Guide
Working with reports
Merging dimensions from multiple data providers
Country
Revenue
France
325000
Because [City], the merged dimension, does not appear in the table, Web
Intelligence does not take the merge into account when calculating revenue.
Web Intelligence lists the total revenue in the second data provider against
each country.
To display the correct result, replace [Revenue] in the second column with
the formula ForceMerge([Revenue]):
City
Revenue
US
175000
US
175000
France
150000
France
150000
Web Intelligence now takes the relationship between countries and cities
into account when calculating revenue.
Note: If [Revenue] is a smart measure in the above example, Force
Merge([Revenue]) returns #MULTIVALUE. This is because the grouping
set (Country) does not exist for the [Revenue] measure. Force
Merge([smart_measure]) always returns #MULTIVALUE, unless by chance
no aggregation is required to calculate the measure.
Creating, editing and deleting merged dimensions
To merge dimensions
1. Click Merge Dimensions on the toolbar.
Web Intelligence Rich Client User's Guide
143
10
10
Working with reports
Merging dimensions from multiple data providers
The "Merge Dimensions" dialog box appears.
2. Select the dimensions you want to merge in the boxes at the top of the
dialog box.
When you select a dimension, all dimensions of different data types are
disabled because you cannot merge dimensions of different data types.
3. Click Values to view the values associated with the dimensions.
4. Click Merge.
The "Create Merged Dimension" dialog box appears. You use this
dialog box to specify the properties of the merged dimension.
5. Select the dimension in the Source Dimension drop-down list.
The source dimension provides the default name, description and number
formats for the merged dimension.
6. Type the merged dimension name in the Merged Dimension Name box
and the merged dimension description in the Description box.
7. Click OK.
The merged dimension name appears in the "Merged Dimensions" box
and the dimensions that are part of the merged dimension appear in the
boxes alongside it. Because an original dimension can be part of one
merged dimension only, it no longer appears in the box above that lists
the original dimensions in the query.
8. Click OK to close the "Merged Dimensions" dialog box.
Web Intelligenceadds the merged dimensions to the list of merged
dimensions in the Data tab.
To define a merged dimension
You define a merged dimension in the "Create Merged Dimension" dialog
box.
1. Type the merged dimension name in the Merged Dimension Name box.
2. Type the merged dimension description in the Description box
3. To use the name and description of one of the source dimensions in the
merged dimension, select the source dimension from the Source
Dimension list.
4. Click OK.
144
Web Intelligence Rich Client User's Guide
Working with reports
Merging dimensions from multiple data providers
To merge dimensions automatically
You can set Web Intelligence to merge dimensions automatically under the
following circumstances:
•
•
•
1.
The dimensions have the same name
The dimensions have the same data type
The dimensions are in the same universe
Right-click outside any block or chart and click Document Properties
on the popup menu.
2. Click Auto-merge dimensions.
To edit a merged dimension
1. In the Data tab, select the dimension in the Merged Dimensions folder
and click the right mouse button.
2. Select Edit Merged Dimension from the menu.
The "Merged Dimensions" dialog box appears.
3. Edit the merged dimension as described in To merge dimensions on
page 143
To delete a merged dimension
1. Select the dimension in the Merged Dimensions folder and click the right
mouse button.
2. Select Delete Merged Dimension from the menu.
Understanding the effects of merged dimensions
Data synchronization through merged dimensions adds enormous power to
Web Intelligence. Merged dimensions also have implications for the results
that Web Intelligence displays in certain situations. You need to understand
these implications to work effectively with merged dimensions and
synchronized data.
Web Intelligence Rich Client User's Guide
145
10
10
Working with reports
Merging dimensions from multiple data providers
Synchronizing data providers with different aggregation levels
You can synchronize data providers with different aggregation levels. This
can have implications for the way in which Web Intelligence calculates
measures.
Example: Synchronizing data providers with different aggregation levels
In this example you have two data providers as follows:
Customer
Year
Revenue
Jones
2004
1500
Jones
2005
2000
Smith
2005
1200
Customer
Number of sales
Jones
12
Smith
10
If you merge the two data providers and the table properties Avoid
Duplicate Rows Aggregation and Show Rows with Empty Dimensions
are unchecked, Web Intelligence returns the following:
146
Customer
Year
Revenue
Number of sales
Jones
2004
1500
12
Jones
2005
1200
12
Smith
2005
1200
10
Web Intelligence Rich Client User's Guide
Working with reports
Merging dimensions from multiple data providers
Web Intelligence cannot determine the number of sales per year for
customer Jones because the data provider that stores the number of sales
does not break them down by year. Web Intelligence therefore reproduces
the total number of sales on each row.
Note: Although the Number of Sales values are duplicated, if you add a
standard calculation to the bottom of the column (for example a Sum or Average
calculation), the result is correct.
One way of adressing this issue is to add the dimensions to the second
data provider that allow Web Intelligence to calculate to the appropriate
level of data. If this is not possible, you must be aware of any situations
where Web Intelligence cannot aggregate the data to the necessary level
of detail.
Detail objects and merged dimensions
Detail objects are associated with dimensions and provide additional
information about the dimension.
Web Intelligence XI R2 requires a one-to-one relationship between
dimensions and details (this means that a detail object can have one value
only for each value of its associated dimension) and does not take detail
objects into account when synchronizing data. The following example
illustrates why this is necessary.
Previous versions of Web Intelligence, as well as Desktop Intelligence and
BusinessObjects, allow a one-to-many relationship between dimensions and
details. If you migrate a report created using any of these products and the
detail object contains multiple values, Web Intelligence places the
#MULTIVALUE error in the detail cell.
Example: Synchronizing data providers with detail objects
In this example you have two data providers as follows, and [Address] is a
detail object related to [Customer].
Customer
Address
Revenue
John
London
10000
Web Intelligence Rich Client User's Guide
147
10
10
Working with reports
Merging dimensions from multiple data providers
Customer
Address
Revenue
Paul
Liverpool
15000
Customer
Age
John
25
Paul
28
If you create a merged Customer dimension to synchronize the data
providers, and Address can have more than one value for each customer,
the result is ambiguous because there is no common value around which
WebIntelligence can synchronize the data.
For example, Paul might also have an address in London, which means
that there is no unique ‘Paul’ row with which WebIntelligence can
synchronize Paul’s age:
Customer
Address
John
London
Paul
Paris
Paul
London
Age
John
25
Paul
28
If the relationship between Customer and Address is one-to-one,
WebIntelligence can ignore Address in the synchronization. This removes
the ambiguity:
148
Web Intelligence Rich Client User's Guide
Working with reports
Merging dimensions from multiple data providers
Customer
Address
Age
John
25
Paul
28
Filtering merged dimensions
Merging dimensions has implications for the way in which Web Intelligence
applies filters.
Note: You cannot apply a filter a on merged dimension. You apply filters on
the dimensions that make up the merged dimension.
Report filters and merged dimensions
When you apply a report filter to a dimension that is part of a merged
dimension, Web Intelligence applies the filter to all data providers that are
synchronized through the merged dimension.
Example: Filtering a merged dimension
In this example you have a report with the following data providers, which
are merged on the Country dimension
Country
Resort
Revenue
France
French Riviera
835,420
US
Bahamas Beach
971,444
US
Hawaiian Club
1,479,660
Web Intelligence Rich Client User's Guide
149
10
10
Working with reports
Merging dimensions from multiple data providers
Country
Future Guests
France
46
US
56
If you apply the filter Country=”US” to the first block, Web Intelligence also
filters the second block to give the following result:
Country
Future Guests
US
56
If the Country dimensions are not merged the second block is unaffected
by the filter.
Section filters and merged dimensions
When a dimension that is part of a merged dimension is set as a section
header, any filter applied to the section also applies to blocks from
synchronized data providers within the section. If Country is set as the section
header in the example Filtering a merged dimension on page 149 and the
filter Country=”US” is applied to the section, Web Intelligence filters both
blocks in the section—(Resort, Revenue) and (Country, Number of
Guests)—so that only those rows appear where the country dimension is
equal to “US”, even though Country in the second block comes from a
synchronized data provider.
Block filters and merged dimensions
When you apply a block filter to a dimension that is part of a merged
dimension, Web Intelligence applies the filter to the block. Web Intelligence
does not apply the filter to other data providers synchronized through the
merged dimension.
150
Web Intelligence Rich Client User's Guide
Working with reports
Merging dimensions from multiple data providers
Drilling on merged dimensions
When you merge dimensions, the new merged dimension belongs to the
hierarchies of all dimensions involved in the merge.
Extending the values returned by merged dimensions
Merged dimensions are a new concept in Web Intelligence XI R2.
Synchronizing data providers already exists in Desktop
Intelligence/BusinessObjects but it does not involve the creation of a new
merged dimension. BusinessObjects reports use the original dimensions
that make up a merged dimension in Web Intelligence.
You can use these original dimensions in a Web Intelligence report. When
you place them in the report, Web Intelligence returns by default only those
dimension values that have corresponding values in the data providers
synchronized through the merge. You need to be aware of this when migrating
reports from Desktop Intelligence and BusinessObjects because
BusinessObjects/Desktop Intelligence behaves differently.
Example: Web Intelligence and Desktop Intelligence/BusinessObjects
behavior when dimensions are merged
You have a report with the following data providers:
Country of origin
Revenue
Germany
470
Country of origin
Revenue
Japan
499
If you include the Country of Origin dimension from Data Provider 1 and
the Revenue measure from Data Provider 2 in the same block, Web
Intelligence returns the following result:
Web Intelligence Rich Client User's Guide
151
10
10
Working with reports
Ranking data in Web Intelligence reports
Country of origin
Revenue
Germany
The same block in Desktop Intelligence/BusinessObjects returns the
following result:
Country of origin
Revenue
Germany
Japan
499
The block is different in Desktop Intelligence/BusinessObjects because
BusinessObjects extends the values of the Country of Origin dimension
through the values returned by the Revenue measure.
To extend dimension values
1. Right-click your report outside any blocks or charts and select Document
Properties on the shortcut menu.
The Document Properties pane appears on the right side of the report.
2. Check the Extend merged dimension values option.
Ranking data in Web Intelligence reports
Ranking data
Ranking allows you to isolate the top and bottom records in a set based on
a variety of criteria. For example, if you have a block showing countries and
associated revenues, ranking allows you to rank the data in the block to show
the top 3 countries only, based on the revenue they generate.
Ranking allows you to answer business questions such as:
•
152
Which 3 regions generate the most revenue?
Web Intelligence Rich Client User's Guide
Working with reports
Ranking data in Web Intelligence reports
•
•
Which are the bottom 10% of stores in terms of revenue generation?
What is the group of the best-performing stores that generates a combined
revenue of up tot $10,000,000?
Web Intelligence allows you to rank data in many ways to answer these kinds
of business questions. You can:
•
•
•
•
rank the top and/or bottom n records by dimension (for example Country)
based on the sum of a related measure (for example Revenue)
rank the top and/or bottom n% of the total number of records by dimension
based on the value of a related measure as a percentage of the total
value of the measure
rank the top and/or bottom n records by dimension based on the
cumulative sum of a related measure
rank the top and/or bottom n records by dimension based on the value
of a related measure as a cumulative percentage of the total value of the
measure
Rankings and sorts
Web Intelligence sorts data as part of applying a ranking. For example, if
you rank the top 3 stores by revenue, Web Intelligence sorts the stores in
descending order by revenue generated.
The sorts that Web Intelligence applies in rankings take precendence over
sorts that you have previously applied to your data. For example, if you have
previously sorted the list of stores in alphabetical order, Web Intelligence
overrides this sort when applying the ranking.
Tied rankings
Web Intelligence assigns equal ranking values to tied rankings and pushes
back the ranking values of the rows after the tie. This means that a bottom
n ranking can return more than n records.
Example: Top and bottom tied rankings
The following table shows a tied ranking. The Top 3 ranking column shows
how Web Intelligence ranks these records in a top 3 ranking; the Bottom 3
Web Intelligence Rich Client User's Guide
153
10
10
Working with reports
Ranking data in Web Intelligence reports
Ranking column shows how Web Intelligence ranks these records in a
bottom 3 ranking.
Dimension
Measure
Top 3 Ranking
Bottom 3 Ranking
A
10
4
1
B
20
3
2
C
30
1
3
D
30
1
3
In each case Web Intelligence includes records up to and including rank
3. This results in the following for a top 3 ranking:
Dimension
Measure
D
30
C
30
B
20
It results in the following for a bottom 3 ranking:
154
Dimension
Measure
A
10
B
20
C
30
D
30
Web Intelligence Rich Client User's Guide
Working with reports
Ranking data in Web Intelligence reports
Ranking parameters
Parameter
Description
When the calculation mode is Count,
the ranking returns the top/bottom n
records based on the measure specified in the Based on parameter. For
example, the top 3 countries by revenue generated, the bottom 3
year/quarter combinations by revenue
generated.
Top/bottom
When the calculation mode is Percentage, the ranking returns the top/bottom
n% of the total number of records
based on the measure specified in the
Based on parameter. For example, if
there are 100 records and you rank the
top 10%, the ranking returns the top 10
records.
When the calculation mode is Cumulative Sum, the ranking returns the
top/bottom records for which the cumulative sum of the measure specified in
Based on does not exceed n.
When the calculation mode is Cumulative Percentage, the ranking returns
the top/bottom records for which the
cumulative sum of the measure specified in Based on does not exceed n%
of the total of the measure.
Web Intelligence Rich Client User's Guide
155
10
10
Working with reports
Ranking data in Web Intelligence reports
Parameter
Description
When the calculation mode is Count the number of records to retrieve based
on the measure.
When the calculation mode is Percentage - the percentage of records to retrieve based on the measure.
n/n%
When the calculation mode is Cumulative Sum - the cumulative sum that the
measure must not pass.
When the calculation mode is Cumulative Percentage - the cumulative sum
of the measure, represented as a percentage of the total, that the measure
must not pass.
156
Based on
The measure on which the ranking is
based.
Ranked By
The ranking dimension. If you specify
a ranking dimension, Web Intelligence
uses the aggregated values of the
Based on measure, calculated for the
dimension, to determine the ranking. If
you do not specify this dimension, Web
Intelligence uses the values of the
Based on measure calculated for all
dimensions in the block. (In other
words, Web Intelligence returns the
top/bottom X rows in the block based
on the measure.)
Calculation mode
The type of calculation used to create
the ranking. See the description of the
Top/Bottom and n/n% parameters at
the top of this this table for more information.
Web Intelligence Rich Client User's Guide
Working with reports
Ranking data in Web Intelligence reports
Example of a ranking dimension
A table contains the following data:
Year
Quarter
Revenue
2006
Q1
100
2006
Q2
200
2006
Q3
300
2006
Q4
500
2007
Q1
400
2007
Q2
700
2007
Q3
300
2007
Q4
600
2008
Q1
200
2008
Q2
200
2008
Q3
400
2008
Q4
500
Total for Q1: 700
Total for Q2: 1100
Total for Q3: 1000
Total Q4: 1600
If you rank the top 2 of each Quarter based on Revenue, Web Intelligence
filters out all the rows for Q1 and Q3 because Q4 and Q2 have the highest
aggregate revenues.
Web Intelligence Rich Client User's Guide
157
10
10
Working with reports
Ranking data in Web Intelligence reports
Ranking and data order
You cannot rank on an object whose values depend on the data order. This
is because the ranking changes the data order, which in turn changes the
object data, which then requires Web Intelligence to recalculate the ranking.
The result is a circular dependency between the ranking and the object that
Web Intelligence cannot resolve.
If you create a rank on a measure whose values depend on the data order,
for example a measure that that uses the Previous function or any of the
running aggregate functions such as RunningSum, Web Intelligence displays
the #RANK error message in all cells in the block.
Ranking workflows
There are two ways of ranking data in Web Intelligence. You can:
•
•
create a ranking by using the Web Intelligence interface
use the Rank function to return a ranking value
When you rank the data in a block by using the Web Intelligence interface,
you tell Web Intelligence to sort and filter the data in the block according to
the rank. For example, if you rank the top 3 countries in a block by revenue,
Web Intelligence sorts the countries in descending order by revenue, then
filters the block to remove all countries other than the 3 with the highest
revenue.
Note: When you create a ranking using the interface, Web Intelligence uses
the Rank function behind the scenes to assign ranking values.
To create a ranking
1. Select the block that you want to rank.
2. Click Rank.
The "Create Rank" dialog box appears
3. Click Top and select the number of records if you want to rank the highest
records in the block.
158
Web Intelligence Rich Client User's Guide
Working with reports
Ranking data in Web Intelligence reports
4. Click Bottom and select the number of records if you want to rank the
lowest records in the block .
5. Select the measure on which the ranking is based in the Based on list.
6. Click Ranked By and select the dimension on which the ranking is based
if you want to rank by a particular dimension rather than by all dimensions
in the block.
7. Select the rank calculation mode in the Calculation mode list.
8. Click OK.
Ranking examples
In the following examples, you have a dimension, Region, and a measure,
Revenue, which give the following values:
Region
Revenue
% of Total Revenue
South East
1000000
7%
South West
2000000
13%
North East
3000000
20%
North West
4000000
24%
Central
5000000
33%
Example: Rank the top 3 regions by revenue generated
1000000
Parameter
Value
Top/Bottom
Top
n/n%
3
Web Intelligence Rich Client User's Guide
159
10
10
Working with reports
Ranking data in Web Intelligence reports
Parameter
Value
For Each
Region (or unspecified because region
is the only dimension in the block and
therefore the default ranking dimension)
Based on
Revenue
Calculation mode
Count
This ranking gives the following result:
Region
Revenue
Central
5000000
North West
4000000
North East
3000000
To calculate this ranking, Web Intelligence:
•
•
sorts the records in descending order
displays the top 3 records
Example: Rank the bottom 40% of regions by revenue
To perform this ranking you set the following parameters
160
Parameter
Value
Top/Bottom
Bottom
n/n%
40%
For Each
Region
Web Intelligence Rich Client User's Guide
Working with reports
Ranking data in Web Intelligence reports
Parameter
Value
Based on
Revenue
Calculation mode
Percentage
This ranking gives the following result:
Region
Revenue
South East
1000000
South West
2000000
To calculate this ranking, Web Intelligence:
•
•
sorts the records in ascending order
works through the records until 40% of the total number of records are
displayed
Example: Rank the top regions whose cumulative revenue is less than or
equal to 10,000,000
To perform this ranking you set the following parameters:
Parameter
Value
Top/Bottom
Top
n/n%
10000000
For Each
Region
Based on
Revenue
Calculation mode
Cumulative sum
This ranking gives the following result:
Web Intelligence Rich Client User's Guide
161
10
10
Working with reports
Ranking data in Web Intelligence reports
Region
Revenue
Central
5000000
North West
4000000
To calculate this ranking, Web Intelligence:
• sorts the records in descending order
• works through the records until it reaches the record that causes the
the cumulative total of the measure to pass 10,000,000
• includes those records that do not cause the cumulative total to pass
10,000,000
Example: Rank the bottom regions whose cumulative revenue is less than
or equal to 30% of the total revenue
To perform this ranking you set the following parameters:
Parameter
Value
Top/Bottom
Bottom
n/n%
30%
For Each
Region
Based on
Revenue
Calculation mode
Cumulative percentage
This ranking gives the following result:
162
Region
Revenue
South East
1000000
Web Intelligence Rich Client User's Guide
Working with reports
Tracking changes in data
Region
Revenue
South West
2000000
To calculate this ranking, Web Intelligence:
• sorts the records in ascending order
• works through the records until it reaches the record that causes the
cumulative total of the measure, expressed as a percentage of the overall
total of the measure, to exceed 30%
• displays those records that do not cause the cumulative percentage to
pass 30%
Tracking changes in data
Tracking changes in your data
To make informed and effective business intelligence decisions, you need
to understand how the data on which you base those decisions changes
over time. Web Intelligence allows you to track and display data changes to
help you focus your analysis on key areas and avoid wasting time exploring
irrelevant data.
When you track data changes, you select a particular data refresh as a
reference point. This data is known as the reference data. When you display
the data changes, Web Intelligence places your current data in context by
showing how it relates to the reference data.
Here are some examples of the usefulness of data tracking:
•
•
If an outlet no longer appears in a list of the top outlets by sales, Web
Intelligence displays the outlet as deleted from the list. You can use this
information to investigate why the outlet is no longer a top performer.
If sales have decreased in a region, data tracking displays the decrease.
You can then drill down into the data for the region to understand why
revenue is falling.
Web Intelligence Rich Client User's Guide
163
10
10
Working with reports
Tracking changes in data
In both these cases, data tracking makes the current data more meaningful
by placing it in context with old data. Without this context it is much more
difficult to identify trends.
Types of data change
Web Intelligence allows you to track the following types of data change:
•
•
•
•
•
added data
removed data
modified data
increased data
decreased data
You configure the display of these changes through the Web Intelligence
interface or the Web Intelligence formula language. The formula language
provides advanced users with additional power and flexibility in displaying
and formatting changed data.
Data tracking modes
Automatic data tracking mode
In automatic data tracking mode, Web Intelligence always compares the
current data with the data before the last refresh. To do this, Web Intelligence
sets the current data as the reference data just before each refresh. The
reference data is always one refresh behind the current data.
Automatic data tracking is appropriate for scheduled documents when you
want to compare the current data with the data before the last refresh.
Manual data tracking mode
In manual data tracking mode, you select the reference data. Web Intelligence
continues to use this data as a reference point until you update the reference
point.
164
Web Intelligence Rich Client User's Guide
Working with reports
Tracking changes in data
To activate data tracking
1. Click Track on the main toolbar to display the "Activate Data Tracking"
dialog box.
2. Select options in the dialog box.
Option
Description
Auto-update the refer- The current data becomes the reference data after
ence data with each
each data refresh. The report always shows the
data refresh
difference between the most recent data and the
data before the last refresh.
Use the current data as The current data becomes the fixed reference
reference data
data and remains the reference data after further
data refreshes. The report always shows the difference between the most recent data and this
fixed reference data.
3. Click "Refresh Now" to refresh the data when the dialog box closes.
4. Click OK
To change the reference data
1. Click Data Tracking Options to the left of Drill on the main toolbar, or
click the Auto-update/Fixed Data hyperlink in the status bar to display
the "Data Tracking Options" dialog box.
2. Select the Reference Data tab.
3. Select options.
Option
Description
Auto-update the refer- The current data becomes the reference data after
ence data with each
each data refresh. The report always shows the
data refresh
difference between the most recent data and the
data before the last refresh.
Web Intelligence Rich Client User's Guide
165
10
10
Working with reports
Tracking changes in data
Option
Description
Use fixed reference
data from
The data you select becomes the fixed reference
data and remains the reference data after further
data refreshes. The report always shows the difference between the most recent data and this fixed
reference data.
Displaying changed data
To display or hide changed data
•
Click Hide Changes/Show Changes (the button tooltip text varies
depending on whether changed data is currently visible) to the right of
Track on the main menu.
Configuring the appearance of changed data
You can configure the appearance (font style, size and color) of changed
data in your document. You can seperately configure the appearance of the
following changes:
•
•
Inserted, deleted and changed dimension and detail values
Increased or decreased measure values
Measure values can also adopt the formatting of inserted or deleted
dimension values. For example, if a dimension value disappears from a list
of values in a block, and the block also shows a measure value for the
dimension, both the dimension and measure values appear as deleted data.
Your Business Objects administrator defines the default appearance of
changed data in the Central Management Server. When you configure the
appearance of changed data in Web Intelligence, you override the CMS
defaults.
To configure the appearance of changed data
1. Click Data Tracking Options to the left of Drill on the main toolbar to
display the "Data Tracking Options" dialog box.
2. Select the Format tab.
166
Web Intelligence Rich Client User's Guide
Working with reports
Tracking changes in data
3. Select each type of changed data you wish to display and click "Format"
to specify how you want the changes to appear.
How changed data is displayed in blocks
Example: Changed data in a simple block
This example uses a document with a block showing [Country], [Year] and
[Revenue]. The original data was as follows:
Country
Year
Revenue
France
2003
1000
France
2004
2000
Japan
2002
1000
Poland
2002
1200
After a refresh, the data is as follows:
Country
Year
Revenue
France
2004
3000
Japan
2003
900
Poland
2002
800
UK
2004
900
When data tracking is activated and data changes displayed, the block
appears as follows:
Web Intelligence Rich Client User's Guide
167
10
10
Working with reports
Tracking changes in data
Country
Year
Revenue
Formatting
France
2003
1000
[deleted data formatting on all cells]
France
2004
3000
[increased data formatting on Revenue cell]
Japan
2002
1000
[deleted data formatting on all cells]
Japan
2003
900
[inserted data formatting on all cells]
Poland
2002
800
[decreased data formatting on Revenue cell]
UK
2004
900
[inserted data formatting on all cells]
•
•
•
•
The rows showing revenue for France in 2003 and Japan in 2002 represent
data that no longers exist after the refresh.
The revenue for France in 2004 has increased.
The revenue for Poland in 2002 has decreased.
The rows showing revenue for Japan in 2003 and the UK in 2004 appeared
after the refresh.
How changed data is displayed in reports with merged
dimensions
Web Intelligence displays a dimension as changed only if all the dimensions
that participate in the merge are changed.
168
Web Intelligence Rich Client User's Guide
Working with reports
Tracking changes in data
Example: Changed data and merged dimensions
In this example, Country is a merged dimension containing the Country
dimensions from two data providers. Before data refresh, the data is as
follows:
Country (DP1)
Revenue (DP1)
Country (DP2)
Sales (DP2)
US
10000
US
5000
France
4000
UK
5000
UK
3000
Germany
1000
Germany
1000
After a data refresh, the data becomes:
Country (DP1)
Revenue (DP1)
Country (DP2)
Sales (DP2)
US
10000
US
4000
France
4000
France
3000
UK
6000
UK
4000
Poland
2000
When displayed in a block with the merged Country dimension and data
changes displayed, the data appears as follows:
Country
Revenue
Sales
Formatting
US
10000
4000
[decreased data formatting on Sales cell]
Web Intelligence Rich Client User's Guide
169
10
10
Working with reports
Tracking changes in data
Country
Revenue
Sales
Formatting
France
4000
3000
[inserted data formatting on Revenue cell]
UK
6000
4000
[increased data formatting on Revenue and
Sales cells]
Germany
1000
1000
[deleted data formatting on all cells]
Poland
2000
[inserted data formatting on Country and
Revenue cells]
In the France row, France does not appear as inserted because a France
row was not inserted in both data providers. Revenue appears as inserted
because it is a new measure value after the data refresh.
In the Poland row, Poland appears as inserted because it is a new
dimension value after the data refresh.
How changed data is displayed in sections
Example: Changed data in a report with sections
In this example you have a document with a block showing [Country], [Year]
and [Revenue]. The original data was as follows:
170
Country
Year
Revenue
France
2003
1000
France
2004
2000
Japan
2002
1000
Web Intelligence Rich Client User's Guide
Working with reports
Tracking changes in data
Country
Year
Revenue
Poland
2002
1200
US
2003
US
2004
After a refresh, the data is as follows:
Country
Year
Revenue
France
2004
3000
Japan
2003
900
Poland
2002
800
UK
2004
900
If you create a section on [Country] and display data changes, the report
appears as follows:
France [no formatting]
Year
Revenue
Formatting
2003
1000
[deleted data formatting on all
cells]
2004
3000
[increased data formatting on
Revenue cell]
Japan [no formatting]
Web Intelligence Rich Client User's Guide
171
10
10
Working with reports
Tracking changes in data
Year
Revenue
Formatting
2002
1000
[deleted data formatting
on all cells]
2003
900
[inserted data formatting
on all cells]
Year
Revenue
Formatting
2002
800
[decreased data formatting on Revenue cell]
Poland [no formatting]
UK [inserted data formatting]
Year
Revenue
Formatting
2004
900
[inserted data formatting
on all cells]
Web Intelligence displays the data in the section header in either of two ways,
depending on the changes in the data in the section:
•
•
If all the rows in the block in the section have changed in the same way,
the section header is displayed with the same formatting as the rows.
If the rows have changed in different ways, or only some rows have
changed, the section header retains its default format.
How changed data is displayed in blocks with breaks
When a block contains a break and the Center value across break block
property is set, Web Intelligence displays the centered value according rules
similar to those for section headers.
172
Web Intelligence Rich Client User's Guide
Working with reports
Tracking changes in data
•
•
If all the rows in the break have changed in the same way, the centered
value is displayed with the same formatting as the rows.
If the rows have changed in different ways, or only some rows have
changed, the centered value retains the default formatting.
How changed data is displayed in charts
When the data in a chart has changed, Web Intelligence displays a changed
data icon above the chart. When you click the icon, Web Intelligence changes
the chart to a table to allow you to see the details of the changes.
Data tracking limitations
If the data provider behind a document is changed, or if the document data
is cleared, Web Intelligence no longer displays changed data. If the data
provider is changed, the current version of the document is no longer
compatible with the reference version. If the data is cleared, the old data no
longer exists for comparison.
As a result, the following actions are incompatible with data tracking:
•
•
•
•
•
Drill out of scope
Query drill
Deleting a query
Any modification (including modifications to security rights) that changes
the SQL generated by a data provider
Purging the document
When you perform any of these actions, Web Intelligence clears the data
history of the document. It does so because these actions are incompatible
with the display of changed data. For example, if you modify a query, the
data in the document changes because of the modification. Any comparison
between this data and old data generated from a different query is misleading.
Data tracking and drill
When you use query drill or drill out of scope, Web Intelligence clears the
data history because these actions change the data provider. This should
not affect you because, when you start to drill, you have already identified
Web Intelligence Rich Client User's Guide
173
10
10
Working with reports
Tracking changes in data
the data that requires further analysis. Data tracking has served its purpose
and you can now continue with your data analysis.
Using the Web Intelligence formula language to track
changed data
When you use the Web Intelligence interface to configure the display of
changed data (as described in @@@), Web Intelligence builds special
behind-the-scenes alerters to display the changes. These special alerters
do not appear in the list of standard alerters.
The Web Intelligence formula language allows you to build your own custom
alerters for formatting data changes. You can also use the formula language
to include special calculations based on data changes. For example, you
can include a calculation to show the difference between the previous value
and the current value of a measure.
The RefValue function
The Web Intelligence formula language provides access to changed data
throught the RefValue function. This function gives the value of the reference
data for a measure. If there is no reference data, the function returns null.
For example, if the [Revenue] measure currently has the value 1000, and
its reference value is 900, the formula RefValue([Revenue]) returns 900.
The RefValueDate function
The RefValueDate function returns the date of the reference data used for
data tracking.
Building formulas using the RefValue function
You can use the RefValue function to build formulas that give information
about the current data in relation to the reference data.
174
Web Intelligence Rich Client User's Guide
Working with reports
Tracking changes in data
Example: Finding the difference between the reference value and the
current value
The following formula returns the difference between the reference value
and the current value of the [Revenue] measure:
=If(Not(IsNull([Revenue])) Or Not (IsNull(RefValue([Rev
enue]))); [Revenue]-RefValue([Revenue]))
The following table shows data before a data refresh:
Customer
Revenue
Johnson
2000
Smith
3000
Wilson
3500
After refresh, the data changes as follows:
Customer
Revenue
Johnson
3000
Smith
2500
Placed in a third column, the formula returns the following figures:
Customer
Revenue
Difference
Johnson
3000
1000
Smith
2500
-500
Wilson
3500
Web Intelligence Rich Client User's Guide
175
10
10
Working with reports
Tracking changes in data
Changed data and the calculation context
When data tracking is activated, Web Intelligence displays data as changed
only when the calculation context remains the same.
For example, if a measure value changes because you change the calculation
context of a block, the new value is not flagged as changed.
Example: Changing the calculation context
In this example you have a block showing [City], [Customer] and [Revenue]
as follows:
City
Customer
Revenue
San Francisco
Smith
1000
San Francisco
Jones
2000
Los Angeles
Wilson
3000
Los Angeles
Harris
4000
If you remove [Customer] from the block, Web Intelligence aggregates
revenue by city:
City
Customer
San Francisco
3000
Los Angeles
7000
Web Intelligence does not display the revenues as increased because the
amount of revenue has not changed. Only the calculation context has
changed - revenues are now aggregated by city only, giving higher figures.
176
Web Intelligence Rich Client User's Guide
Working with reports
Using sections, breaks and sorts
If, after a data refresh, Jones’ revenue falls to 1000 and Wilson’s revenue
rises to 4000, the data appears as follows:
City
Customer
San Francisco
2000
Los Angeles
8000
Web Intelligence now displays the data as changed because, independently
of the change of calculation context, the total revenue for San Francisco
has decreased and the total revenue for Los Angeles has increased.
Using sections, breaks and sorts
Using sections to group data
Grouping information with sections
Sections allow you to split report information into smaller, more
comprehensible parts.
Example: Grouping quarterly revenue results into sections on a report
You are the regional sales manager in Texas. You receive a report showing
2003 annual revenue for stores in your region, broken down by cities and
quarters.
City
Quarter
Sales revenue
Austin
Q1
314430
Austin
Q2
273608
Web Intelligence Rich Client User's Guide
177
10
10
Working with reports
Using sections, breaks and sorts
City
Quarter
Sales revenue
Austin
Q3
294798
Austin
Q4
252644
Dallas
Q1
215874
Dallas
Q2
194689
Dallas
Q3
204066
Dallas
Q4
188791
Houston
Q1
572177
Houston
Q2
619924
Houston
Q3
533765
Houston
Q4
520332
To make a comparison of the results for each city per quarter, you set
[Quarter] as a section value. The report is broken up into four separate
sections by quarter.
Q1
City
Sales revenue
Austin
314430
Dallas
215874
Houston
572177
Q2
178
Web Intelligence Rich Client User's Guide
Working with reports
Using sections, breaks and sorts
City
Sales revenue
Austin
273608
Dallas
194689
Houston
619924
Q3
City
Sales revenue
Austin
294798
Dallas
204066
Houston
533765
Q4
City
Sales revenue
Austin
252644
Dallas
188791
Houston
520332
You can create a single section or include multiple sections with subsections
in a report. You can also remove and reposition sections within a report.
You can create a section from one of two sources:
•
•
on a dimension already displayed on a table or chart
on a dimension included in the document but not displayed on a table or
chart
You cannot create a section with a measure object.
Web Intelligence Rich Client User's Guide
179
10
10
Working with reports
Using sections, breaks and sorts
Sections in Structure View
The following illustration shows a report with sections in Structure View.
When you view a report in Structure View, each section is clearly indicated
by a section divider.It is easier to format sections when you work in Structure
View.
Creating and removing sections and subsections
To create a section by moving a cell from a table
1. Verify you are viewing the report in Report View.
2. Select the header cell on the table that displays the name of the
dimension, or select a body cell on the table that displays a value for the
dimension.
For example, if you want a section for each state, either select the header
cell labelled “State” or select one of the cells that displays the name of a
state.
3. Drag the selected cell above the table and drop it onto the report
background.
A section is created for each value of the selected dimension.
180
Web Intelligence Rich Client User's Guide
Working with reports
Using sections, breaks and sorts
To create a section by adding a dimension from the Data tab
1. Click the Data tab.
2. Select a dimension object and, then drag the dimension over to an empty
area of the report.
3. Position and drop the dimension where you want the section cell to appear.
If the report includes tables or charts, then drop the section cell above
the tables and charts that you want to be included in the section.
• If you are in Results View, a cell containing one value for each unique
value for the added object appears above the table or crosstab. The
data in the table or crosstab is automatically sorted according to the
cell value.
• If you are in Structure View, a cell is added above the table or crosstab.
4. If you are in Structure View, click View Results to see the results.
Web Intelligence applies the section to the report and displays the results.
Creating subsections
You can create a report with multiple sections. You create multiple sections
in the same way you create a section:
•
•
by moving a cell from a table and dropping the cell below an existing
section cell
by selecting a dimension object listed on the Data tab (in the Java Report
Panel) , and then dragging and dropping the dimension below an existing
section cell.
Related Topics
•
•
To create a section by moving a cell from a table on page 180
To create a section by adding a dimension from the Data tab on page 181
To remove a section cell or section
1. To delete a section, click the beginning or end divider of the section, then
press the Delete key.
2. To delete a section cell, right-click the cell, then select Remove from the
menu.
Section properties
You can set the following properties for a section:
Web Intelligence Rich Client User's Guide
181
10
10
Working with reports
Using sections, breaks and sorts
•
•
•
•
name the section
specify your criteria for when you consider a section to be “empty”. (For
example, you may consider a section of no interest for your analysis
whenever a specific table or chart within that section is empty. In this
case you can choose to specify that the section is to be considered
“empty.” )
hide or show sections that you consider empty
include links to sections in the report map so you can jump from
section-to-section when navigating the report
To select the section display properties
1. Make sure you are in Report View.
2. Click View Structure.
In Structure View you can see the start and end divider of each section
on the report. This makes it easy for you to select a specific section and
then choose the properties you want to apply to the selected section.
3. Right-click the section divider.
The Properties tab shows the properties relevant to sections
4. Set the section properties.
If you want to...
then...
Name of the section with a different
name from the name of the dimension selected for the section,
type a name for the section in the
General > Name property.
Specify the component(s) of the section that will qualify the entire section Check the components in the dropas an “empty section,” if there is no down list next to the Display > Hide
data on the database for that compo- section when empty property.
nent(s),
Show the section when there is no check Show when empty. (To hide
data on the database for this section, empty sections, uncheck this option.)
5. Click the View Results button to view the properties applied to the results
on the report.
Web Intelligence applies the properties to the section and displays the
results on the report.
182
Web Intelligence Rich Client User's Guide
Working with reports
Using sections, breaks and sorts
To set the page layout for a section
1. To set the cell position, right-click the section cell then click Edit Format
on the menu, then set the Position > Left edge and Position > Top
edge properties on the Properties tab.
2. To control the section page breaks, select the section divider, then set
the Page Layout > Position > Start section on new page and Avoid
page break in section properties in the Properties tab.
3. To repeat the section cell on each new page, select the section cell, then
select the Page Layout > Repeat on every new page property in the
Properties tab.
Using breaks
Breaks defined
A break is a division within a block in which data is grouped according to a
selected dimension, detail, or measure into self contained sections. These
sections are represented as smaller tables within the same block of data.
You use breaks to display all the data for each unique value of an object in
separate parts.
Using breaks has two main advantages:
•
•
You can more efficiently organize how your data is represented.
You can display subtotals.
Breaks compared to sections
A section breaks up the data into multiple free-standing cells called section
headers. Each section header contains one value for a dimension, with a
block of data that corresponds to the dimension value.
A break divides the data up within one block. One column contains the values
for a dimension, detail, or measure, which are repeated for each other row
of values in the block.
Web Intelligence Rich Client User's Guide
183
10
10
Working with reports
Using sections, breaks and sorts
Default sort order in breaks
When you insert a break on an object, the values for the object are
automatically sorted in ascending order as follows:
•
•
If the values are numeric, the lowest value appears in the first row of the
table, the highest in the last row.
If the values are alphabetical characters, then the values are sorted in
alphabetical order from top to bottom.
You can change this sort order at any time.
You can set multiple breaks and set a sort priority on each break, so that
you control how the data is displayed when you insert multiple breaks across
several dimensions details, or measures.
To insert a break
1. Click a table cell in the column or row where you want to insert a break.
2. Click Insert/Remove Break on the Reporting toolbar.
Web Intelligence divides the table up into as many mini tables as there
are unique values for the selected cell. Web Intelligence inserts a footer
at the end of each break.
To prioritize breaks
A table can contain multiple breaks that you can prioritize. For example, you
can decide to break on [Year] then on [Quarter], or on [Quarter] then on
[Year].
1. Right-click the table that contains multiple breaks and select Edit Format.
The Properties tab shows the properties relevant to a table.
2. Click the ... button next to the Breaks > Break priority property to display
the "Breaks" dilaog box
3. Click Vertical breaks or Horizontal breaks to display the type of break
you want to prioritize.
•
184
If the selected table is a vertical table, then all the breaks are applied
to columns. These are called Vertical breaks.
Web Intelligence Rich Client User's Guide
Working with reports
Using sections, breaks and sorts
•
•
If the selected table is a horizontal table, then all the breaks are applied
to rows. These are called Horizontal breaks.
If the selected table is a crosstab, then breaks can be applied to rows
or to columns. You can choose the priority for the Horizontal breaks
and for the Vertical breaks.
4. Select the break whose priority you want to change and click the Up/Down
buttons to promote/demote the break in the list of breaks.
To define display properties for a break
When you first insert a break on data, certain display options are applied by
default. You can edit these settings and set options for the following:
• Display properties – how the results display on the break
• Page layout properties – how the breaks display on the report page
Property
Description
Show break header
A header is displayed for each part of
the table, crosstab, or form when you
insert a break.
Show break footer
A footer is added after the last row for
a table or column for a crosstab when
you insert a break. When you apply a
calculation to the data, the result is
shown in the footer.
Remove duplicates
Removes all duplicate values from the
data in a table or crosstab when you
insert a break. Each value is only
shown once.
Center values across break
Active when Remove Duplicates is
selected. It merges empty cells and
centers the value name over the
merged cells.
Web Intelligence Rich Client User's Guide
185
10
10
Working with reports
Using sections, breaks and sorts
Property
Description
Start on a new page
Displays each part of the table
crosstab, or form created by a break
on a new page.
Avoid page breaks in blocks
Where possible, keeps each break
section on the same page. This option
is not taken into account when a block
is larger than one page.
Repeat header
Repeats the header at the top of the
table on every new page when a table
goes over onto a new page.
Repeat footer
Repeats the footer at the bottom of the
table on every new page when a table
goes over onto a new page.
Repeat break value on a new page
Repeats the current value on each new
page.
1. Right-click a cell in the column/row on which you have defined a break
and select Edit Format on the menu.
The Properties tab appears, displaying a property group called Breaks
which contains the break properties.
2. Set the break properties in the Breaks property group.
To remove a break
•
186
Web Intelligence Rich Client User's Guide
Working with reports
Using sections, breaks and sorts
Example:
Using sorts to organize data
Sorting the results displayed on reports
You can apply sorts to the values displayed in tables and sections to organize
the order in which values are displayed in a report.
The following sort orders are available:
Sort order
Description
Default
This is sometimes referred to as the
”natural” order. Depending on the type
of data in the column or row, the results
are sorted as follows:
• ascending numeric order for numeric data
• ascending chronological order for
date
• Chronological order for months
• alphabetical order for alphanumeric
data
Ascending
When selected, results are arranged
in ascending order: The smallest value
at the top of the column moving to the
highest value at the bottom.
For example: 100, 200, 300 or California, Colorado, Florida.
Web Intelligence Rich Client User's Guide
187
10
10
Working with reports
Using sections, breaks and sorts
Sort order
Description
Descending
When selected, results are arranged
in descending order: The highest value
at the top of the column moving to the
smallest value at the bottom.
For example: 300, 200, 100 or Florida,
Colorado, California.
Custom (available in the Java Report
Panel)
You define your own sort order.
To apply an ascending or descending sort
1. Select the section cell or table cells you want to sort.
2. Click the down arrow next to the Apply/Remove Sort button on the Report
toolbar and then, select Ascending or Descending from the drop-down
list.
3. Repeat the previous step to apply multiple sorts.
To apply a custom sort
1. Select the section cell or table cells you want to sort.
2. Click the down arrow next to the Apply/Remove Sort button on the Report
toolbar then select Custom... from the drop-down list.
3. Select a value in the list of sorted values and click the Up and Down
buttons to promote/demote it in the sort order.
4. To add an additional temporary value to the list of sorted values, type the
value in the Temporary Values box, then click >> to add it to the sort
list.
To prioritize multiple sorts
1. Right-click the table and select Edit Format to display the Properties
tab.
188
Web Intelligence Rich Client User's Guide
Working with reports
Calculations, formulas and variables
2. Click the ... button next to the Sorts > Sort priority property to display
the "Sorts" dialog box.
3. Click Vertical sorts to display the vertical sorts or Horizontal sorts to
display the horizontal sorts.
4. Select the sort whose priority you want to change and click the Up/Down
buttons to promote/demote it in the list of sorts.
Calculations, formulas and variables
Calculations, formulas and variables
You can add calculations, formulas and variables (named formulas) to your
Web Intelligence reports. This section explains the workflows. For information
on the calculation power that calculations, formulas and variables add to
your reports, see the Using Functions, Formulas and Calculations in Web
Intelligence guide.
Working with standard calculations
To insert a standard calculation in a table or crosstab
You can insert standard calculations in tables or crosstabs to make quick
calculations on table data. For more information on the standard calculations
available in Web Intelligence, see the Web Intelligence Formulas, Functions
and Calculations Guide
You can insert multiple calculations in a table or crosstab. When you apply
two calculations to a table or crosstab, a footer is added for each calculation
result. You insert multiple calculations in a table or crosstab in the same way
that you insert one calculation, but you repeat the procedure for as many
calculations as you want to insert.
1. Click a cell that contains data in the table.
2. Click the arrow at the right of the Insert Calculation button and select
the calculation you want to insert.
3. Click the button again to insert the calculation.
Web Intelligence Rich Client User's Guide
189
10
10
Working with reports
Calculations, formulas and variables
The Insert Calculation button displays a mathematical symbol for the
currently-selected calculation. This symbol changes depending on the
default or the last calculation selected for insertion. For example, if the
calculation is Sum, the button displays the Σ symbol.
Note: If you insert a percentage calculation, the results of the percentage
are displayed in an additional column or row of the table.
4. To insert other calculations, click the down arrow next to the Sum icon
and select the calculation from the drop-down list.
A new row is added at the bottom of the table. The aggregated value
appears in the new row cell.
To remove a standard calculation
1. Right-click the table or crosstab that contains the calculation.
• If you are in Result View this is the calculated value
• If you are Structure View, this is the cell that contains the aggregate
formula
2. Depending on the table type, select Remove Row or Remove Column
from the shortcut menu.
Working with formulas
The Formula toolbar
You display the Formula toolbar by clicking the Show/Hide Formula Toolbar
button. Now, when you select a cell, its formula appears in the Formula
toolbar.
The Formula toolbar has the following buttons, from left to right:
190
Button
Description
Open Formula Editor
Opens the Formula Editor which allows
you to build a formula using a graphical
interface
Web Intelligence Rich Client User's Guide
Working with reports
Calculations, formulas and variables
Button
Description
Create variable
Allows you to save a formula as a variable
Clear changes
Clears all changes made to the formula
since the last save or validation
Validate formula
Verifies the formula syntax and replaces the current formula
To enter a formula directly into the Formula toolbar without using the Variable
Editor, you can type the formula or drag report objects to the formula toolbar.
To enter a formula in the Formula toolbar by typing the formula
1. Click Show/Hide Formula Toolbar to display the Formula toolbar.
2. In the Formula toolbar, type the formula.
For example, to calculate the average revenue generated per item sold,
type: =[Sales Revenue]/[Quantity Sold].
Web Intelligence gives you suggestions for completing the component of
the formula you are typing. To select a Web Intelligence suggestion, press
the down arrow button to highlight it, then press Return, or select the
suggestion with your cursor.
3. To select a Web Intelligence suggestion, press the down arrow button to
highlight it, then press Return.
To enter a formula in the Formula toolbar by using drag and drop
• Drag reports objects onto the Formula toolbar.
When you release an object, it appears in the Formula toolbar at the
cursor position as if you had typed it directly.
To build a formula using the Formula Editor
1. Click the Formula Editor button on the Formula toolbar to display the
Formula Editor.
2. Select the cell on the report where you want to include the formula.
3. On the Data, Functions and Operators tabs, double-click the report
objects, functions and operators you want to include in the formula, or
type the formula directly.
Web Intelligence Rich Client User's Guide
191
10
10
Working with reports
Calculations, formulas and variables
For example, to create the formula =Average([Revenue]), double-click
the Average() function, then double-click the Revenue object.
When you double-click a function to include it in a formula, Web
Intelligence places the cursor between the function parentheses.
Working with variables
To create a variable using the Create Variable dialog box
1. Display the Formula toolbar.
2. Type your formula in the Formula toolbar or select a cell containing a
formula.
3. Click Create Variable on the Formula toolbar
The "Create Variable" dialog box appears.
4. Type the variable name in the Name box.
5. Select the variable type by selecting Dimension, Measure or Detail.
6. If you select Detail, an "Associated Dimension" box appears. Click ...
next to the box to open the "Objects and Variables" dialog box and
select the dimension you want to associate with the detail.
7. Click OK.
The variable appears in the list of report variables in the Data tab.
To create a variable using the Variable Editor
1. Click Show/Hide Variable Editor on the report panel toolbar.
2. Type your formula in the Formula pane or use the functions and operators
on the Functions and Operators tab to build the formula.
3. Type the variable name in the Name box.
4. Select the variable type by selecting Dimension, Measure or Detail.
5. If you select Detail, an Associated Dimension box appears. Click ...
next to the box to open the Objects and Variables dialog box and select
the dimension you want to associate with the detail.
6. Click OK.
The variable appears in the list of report variables in the Data tab.
192
Web Intelligence Rich Client User's Guide
Working with reports
Filtering reports
To edit a variable
1. Select the variable in the list of report variables.
2. Click the right mouse button and click Edit Variable on the shortcut menu.
The Variable Editor appears.
3. Edit the variable.
4. Click OK to save the new variable definition.
To delete a variable
1. Select the variable in the list of report variables.
2. Click the right mouse button and click Delete Variable on the shortcut
menu.
Filtering reports
Report filters defined
You can filter reports to limit the results that are displayed to specific
information that interests you. For example, you can limit the displayed results
to information for a specific customer or a sales period. The data you filter
out remains within the Web Intelligence document; it is simply not displayed
in the report tables or charts. This means you can change or remove report
filters in order to view the hidden values, without modifying the query definition
behind the document.
You can apply different filters to different parts of a report. For example, you
can limit the results in the entire report to a specific product line and then
limit results in a table or chart further to focus on results for a specific region
or customer profile.
To create a report filter, you need to specify three elements:
• a filtered object
• an operator
• a value(s)
Web Intelligence Rich Client User's Guide
193
10
10
Working with reports
Filtering reports
You can include multiple filters in a report.
Query filters and report filters compared
You can apply filters at two levels within a document:
•
•
query filters – these filters are defined on the query; they limit the data
retrieved from the data source and returned to the Web Intelligence
document
report filters – these filters limit the values displayed on reports, tables,
charts, sections within the document, but they don’t modify the data that
is retrieved from the data source; they simply hide values at the report
level
Report filter operators
Equal To operator
Use the Equal to operator to obtain data equal to a value.
For example, to return data for the US only, create the filter "County Equal
To US".
Not Equal To operator
Use the Not Equal To operator to obtain data not equal to a value.
For example, to return data for all countries except the US create the filter
"County Not Equal To US".
Different From operator
Use the Different From operator to retrieve data different from a value.
For example, to retrieve data for all quarters execpt Q4, create the filter
[Quarter] Different From "Q4"
194
Web Intelligence Rich Client User's Guide
Working with reports
Filtering reports
Greater Than operator
Use the Greater Than operator to retrieve data greater than a value.
For example, to retrieve data for customers aged over 60, create the filter
"[Customer Age] Greater than 60".
Greater Than Or Equal To operator
Use the Greater Than Or Equal To operator to retrieve data greater than or
equal to a value.
For example, to retrieve data for revenue starting from $1.5M, create the
filter "[Revenue] Greater than or equal to 1000500".
Less Than operator
Use the Less Than operator to retrieve data lower than a value.
For example, to retrieve data for exam grades lower than 40, create the filter
"[Exam Grade] Less Than 40".
Less Than Or Equal To operator
Use the Less Than Or Equal To operator to retrieve data less than or equal
to a value.
For example, to retrieve data for customers whose age is 30 or less, create
the filter "[Age] Less Than Or Equal To 30".
Between operator
Use the Between operator to retrieve data between and including two values.
For example, to retrieve data for weeks starting at week 25 and finishing at
36 (including week 25 and week 36), create the filter "[Week] Between 25
and 36".
Web Intelligence Rich Client User's Guide
195
10
10
Working with reports
Filtering reports
Not Between operator
Use the Not Between operator to retrieve data outside the range of two
values.
For example; to retrieve data for all the weeks of the year, except for and
not including weeks 25 through 36, create the filter "[Week] Not between 25
and 36".
In List operator
Use the In List operator to retrieve data corresponding to values in a list of
values.
For example, to retrieve data for the US, UK and Japan only, create the filter
[Country] In List ("US";"UK";"Japan").
Not In List operator
Use the Not In List operator to retrieve data that does not correspond to
multiple values.
For example, if you do not want to retrieve data for the US, UK and Japan,
create the filter [Country] Not In ("US";"UK";"Japan").
Is Null operator
Use the Is Null operator to retrieve data for which there are no values in the
database.
For example, to retrieve customers without children (the children column in
the database has no value), create the filter [Children] Is Null.
Is Not Null operator
Use the Is Not Null operator to return data for which there is a value in the
database.
196
Web Intelligence Rich Client User's Guide
Working with reports
Filtering reports
For example, to return customers with children, create the filter [Children] Is
not Null.
Creating, editing and deleting report filters
To create a report filter using the Quick Filter option
1. Click the report tab of the report you want to filter.
2. If you want to filter a block (that is, a table, chart, or form), then click the
top edge of the block to select it. If you want to filter a section, and not
just the section cell, click View Structure and then select either the start
section or end section divider.
3. Click the Add Quick Filter button on the Report toolbar.
The List of Values dialog box appears. The values for the selected section
or block are listed.
4. Select the value(s) you want to display in the section or block.
5. Click OK.
The selected section or block only displays values that correspond to the
value you selected.
To create a report filter using the Filter Editor
1. Click the report tab of the report you want to filter.
2. On the Report toolbar, click the Show/Hide Filter Pane button to display
the Report Filters pane.
3. Select the part of the report you want to filter.
The Report Filters pane displays the name of the selected part of the
report. For example, if you select a table, the Report Filter pane displays
the name of the selected table.
4. In the Data tab, select the object you want to filter.
5. Drag the selected object onto the Report Filters pane.
The Filter Editor appears. The name of the object you selected is displayed
below Filtered Object.
6. Select the operator.
Web Intelligence Rich Client User's Guide
197
10
10
Working with reports
Filtering reports
7. Select Constant or Value(s) from list.
When you define filters on measures or variables, you cannot select
value(s) from the list of values; you need to type a constant(s).
8. If you selected Constant, type the value(s), you want to retrieve, in the
Constant box. If you selected Value(s), select the value(s), you want to
retrieve, from the displayed List of Values and add them to the Values
Selected box, by clicking the >> button.
9. Click OK to confirm the filter definition.
The selected report, section, or table, chart, or form displays only the
values you specified in the custom filter.
To combine multiple filters on a report
1. Create each filter.
By default Web Intelligence combines all the filters with the AND operator.
2. Double-click the AND operator to toggle between AND or OR.
Related Topics
•
•
To create a report filter using the Quick Filter option on page 197
To create a report filter using the Filter Editor on page 197
To view the filters on a report
1. Click on the area of the report for which you want to see filters. (To view
filters defined on the entire report, click outside any table, chart or section.)
2. Click the Map tab, then click Filters.
Web Intelligence displays the filters on the area of the report you clicked.
To edit a report filter
1. Click the Show/Hide Filter Pane button on the Report toolbar to display
the Report Filters pane.
2. Click the area of the report for which you edit the filters.
The filters on the selected area display in the Report Filters pane.
3. Double-click the filter you want to edit.
198
Web Intelligence Rich Client User's Guide
Working with reports
Drilling on report data
The Filter Editor appears. The name of the filtered object is listed under
Filtered Object.
4. Edit the filter using the Filter Editor.
To delete a report filter
1. Click the Show/Hide Filter Pane button on the Report toolbar to display
the Report Filters pane.
2. Click the area of the report from which you want to remove the filters.
The filters on the selected area display in the Report Filters pane.
3. Select the filter you want to delete and press Delete.
Drilling on report data
What is drill?
You use drill to analyze the results displayed in reports. Drilling on reports
lets you look deeper into your data to discover the details behind a good or
bad summary result displayed in tables, charts, or sections.
Example: Why did sales of accessories, outwear, and overcoats rise in
Q3?
You work for a US national fashion retail chain, and are in charge of sales
of accessories, outerwear and overcoat clothing lines in western states.
You see that revenue is much higher for Q3 than the other quarters.
Web Intelligence Rich Client User's Guide
199
10
10
Working with reports
Drilling on report data
To understand why, you drill down to look at the factors behind the result.
200
Web Intelligence Rich Client User's Guide
Working with reports
Drilling on report data
You see that jewelry sales escalated in July (month #7).
Scope of analysis
The scope of analysis for a query is extra data that you can retrieve from the
database to give more details on the results returned by each of the objects
in a query. This extra data does not appear in the initial result report, but it
remains available in the data cube, so you can pull this data in to the report
to allow you to access more detail at any time. This process of refining the
data to lower levels of detail is called drilling down on an object.
In the universe, the scope of analysis corresponds to the hierarchical levels
below the object selected for a query. For example, a scope of analysis of
one level down for the object Year, would include the object Quarter, which
appears immediately under Year.
You can set this level when you build a query. It allows objects lower down
the hierarchy to be included in the query, without them appearing in the
Results Objects pane. The hierarchies in a universe allow you to choose
your scope of analysis, and correspondingly the level of drill available.
In the Java Report Panel and in Web Intelligence Rich Client, you can also
create a custom scope of analysis by selecting specific dimensions for the
Scope of Analysis pane.
Note: You cannot set the scope of analysis when working in query drill mode
because this drill mode causes Web Intelligence to modify the scope
dynamically in response to drill actions.
Levels of scope of analysis
You can set the following levels for scope of analysis:
Level
Description
None
Only the objects that appear in the
Results Objects pane are included in
the query.
Web Intelligence Rich Client User's Guide
201
10
10
Working with reports
Drilling on report data
Level
Description
•
•
•
For each object in the Results pane,
one, two, or three objects lower down
the hierarchy tree are included in the
query. The data from these objects is
stored in the cube until you add them
to the document.
One level down
Two levels down
Three levels down
Custom
All objects added manually to the
Note: This option is available in the
Scope of Analysis panel are included
Java Report Panel and in Web Intelliin the query.
gence Rich Client only.
Including a scope of analysis in a document increases the document size
significantly. This is because the data necessary for the scope you specify
is saved with the document, even though it is not visible in the reports unless
you start drill mode and drill down to the data to display the corresponding
values.
In order to minimize the size of documents and optimize performance, we
recommend that you only include a scope of analysis in documents where
you are certain that users will need to drill.
We suggest the following method because it will be easier for you to set the
scope of analysis seeing the hierarchy of the classes and objects.
To set the scope of analysis
1. Verify that you are in Query View.
2. Click the Show/Hide Scope of Analysis Pane button so that it appears
pressed in.
The Scope of Analysis panel appears at the bottom of the Result
Objects pane. The default scope of analysis is None. Each dimension
in the Result Objects pane appears in the Scope of Analysis pane
3. Click the down arrow in the Scope of Analysis drop-down list box
4. Select a level for the scope of analysis.
202
Web Intelligence Rich Client User's Guide
Working with reports
Drilling on report data
The level appears in the list box and the dimensions that are hierarchically
below each dimension in the Result Objects pane appear in the Scope
of Analysis pane.
5. If you want to add selected dimensions to the scope of analysis or create
a custom scope of analysis, select dimensions in the Query Manager and
drag them across to the Scope of Analysis panel.
Drill paths and hierarchies
When you analyze data in drill mode, you move along a drill path. These
paths are based on the dimension hierarchies set by the designer of the
universe. Universe designers organize objects in classes in a hierarchy with
the most summary objects at the top and the most detailed at the bottom.
So if you want to make a high-level report, you know that your query should
include objects at the top of the list. If you want to see more detailed
information, you can then switch to Drill mode and drill down on each
dimension value displayed in the reports.
For example, if the data from [Quarter] did not sufficiently explain a result,
you could drill down to [Month] or [Week], depending on how the universe
designer set up the hierarchy. When you drill to a different level, measures,
such as a [Revenue] or [Margin], are recalculated accordingly.
Drill paths usually follow the same hierarchy order as the classes on a
universe. For example, a class called Time typically includes the [Year]
dimension at the top of the class, followed by the [Quarter], [Month], and
[Week] dimensions. The hierarchies for drill within the Time hierarchy typically
follow the same order, because users want to drill annual results to analyze
details for quarter, month, and so on. However, the universe designer can
also define custom hierarchies.
Note: A dimension can belong to several hierarchies. When you drill a result
on a dimension that belongs to more than one hierarchy, Web Intelligence
prompts you to select the drill path.
To view drill hierarchies
1. Open a document in Edit mode.
2. Verify you are in Query View.
3. Click the Data tab.
4. Click the Hierarchies radio button.
Web Intelligence Rich Client User's Guide
203
10
10
Working with reports
Drilling on report data
To switch to drill mode
To start drilling on a report you either switch to Drill mode or, if the report is
saved in Drill mode, drill directly.
1. With a document open, verify you are in Report View.
2. Select the report you want to drill.
The Drill button appears in the Web Intelligence toolbar.
3. Click the Drill button.
Note: When you open a document that was saved in Drill mode, the
document opens in Drill mode if you have the right to drill on documents.
If not, it opens in Results view..
By default, a drill icon appears on the tab of the drillable report. Depending
on the drill options you selected on the Web Intelligence Document
Preferences page in InfoView, Web Intelligence either makes the selected
report drillable or creates a duplicate of the selected report, in drill mode.
(For more information, see Start drill session on a duplicate report option
on page 67.)
Retrieving more levels of data to the report
When you are drilling a Web Intelligence report, you may want to drill up or
down to a dimension that lies outside the scope of analysis defined for the
document. To return the additional data, Web Intelligence must run a new
query that includes the additional dimension(s) you specify. This is called
extending the scope of analysis.
You can extend the scope of analysis during your drill sessions only if your
security profile allows you to do so. Your security profile is controlled by your
BusinessObjects Enterprise administrator.
If your Drill options are not set to display the Extend the Scope of Analysis
prompt message during drill, you will not be given the option to select filters
if you drill beyond the data already available in the document. In this case,
Web Intelligence immediately runs a new query and returns data for all the
values on the dimensions you are drilling.
204
Web Intelligence Rich Client User's Guide
Working with reports
Drilling on report data
To drill out of the scope of analysis
1. Hold your mouse cursor over a dimension value that is at the end of the
scope of analysis.
A ToolTip informs you that a new query is necessary to return the
additional data to the document.
2. Drill on the dimension.
If your Drill options are set for Web Intelligence to prompt you when a
drill action requires a new query, the Extend the Scope of Analysis dialog
box appears.
The dialog box lists the dimensions in the hierarchy above and below the
drilled value. The dimensions already included in the document are
checked. The dialog box also displays the filters that you can select to
filter the new query.
3. Select the check boxes next to the dimensions you want to drill.
4. Select the check boxes next to the filters you want to use to filter the
query.
5. Click OK.
Web Intelligence runs a new query and returns the additional data to the
document and the results for the dimension you drilled to appear on the
table.
To choose a drill path when more than one is
available
A dimension can belong to multiple hierarchies. When you drill down on such
a dimension value, Web Intelligence does not know which drill path to follow.
You must define the drill path.
Note: If the dimension value you choose to drill on is the result of a previous
drill, the drill path is already known. Therefore you do not need to select a
drill path.
1. Drill on the dimension.
The "Select Drill Path" dialog box appears. The dialog box lists the
dimensions in the hierarchy above and below the drilled value. A check
Web Intelligence Rich Client User's Guide
205
10
10
Working with reports
Drilling on report data
box appears next to each dimensions below the current dimension you
are drilling, so that you can select which of these dimensions you want
to retrieve from the database, in order to continue your drill action. The
dialog box also displays the filters that you can select to filter the new
query.
2. Select the path you want to drill.
3. Click OK.
Drilling on dimensions in tables and sections
Dimensions typically represent character-type data, such as customer or
business names, and dates. Web Intelligence makes calculations based on
the dimensions in a report. For example, if you create a report that calculates
a region’s total sales revenue for a given year, Web Intelligence calculates
the [Sales revenue] measure based on the two dimensions: [State] and
[Year].
When you drill on a dimension to see the more data behind the displayed
result, the sales revenue is calculated according to the values to which you
drill. If you drill on [Year] in the above example, Web Intelligence calculates
and displays sales revenue by state and quarter, because [Quarter] is the
next dimension in the time hierarchy below [Year].
Note: You cannot drill on detail objects.
Drilling down
You drill down to see the lower-level data that makes up the summary results
displayed on reports. This helps explain why high or low results occurred.
Example: Using drill analysis to find out why sales decreased dramatically
in 2003
In this example, you receive a report that shows sales revenue results for
the accessories line at the eFashion retail store. The following crosstab
shows that the Accessories line decreased in 2003.
206
Web Intelligence Rich Client User's Guide
Working with reports
Drilling on report data
To analyze more precisely when the decrease occurred, you drill down on
the cell value 2003, to view the detailed data for each quarter.
When you drill down on the cell value 2003, a filter appears in the Drill
toolbar to show that the quarterly values you have drilled to are filtered for
the year 2003. The drilled chart clearly shows that the problem arose in Q4
of 2003.
To find out which of the of the categories within the Accessories line was
responsible for the drop in revenue, you drill down again on the cell value
Accessories.
The drilled crosstab shows which categories were responsible for low
revenue in Q4.
Note: If you try to drill to a dimension that is already displayed in another
column or row of the same table, Web Intelligence automatically displays the
next available dimension in the drill path.
Web Intelligence Rich Client User's Guide
207
10
10
Working with reports
Drilling on report data
To drill down on a dimension value in a table or section cell
1. Verify you are in Drill mode
2. On a table or section cell, place your pointer over the dimension value
on which you want to drill.
A ToolTip appears, showing the next dimension in the drill path. If the
drilled report includes dimensions from multiple data providers, the ToolTip
displays the name of the query and the dimension for the value.
3. Click the value.
The drilled table or section displays data one dimension level down. The
Drill toolbar, at the top of the report, displays the values from which you
drilled. These values filter the values displayed on the drilled table.
Drilling up
You drill up on a dimension value to see how the more detailed data
aggregates to a higher-level result. For example, you may have drilled down
on Year to examine data for each quarter. If you want to see how this data
aggregates to yearly results, you can drill up.
When you drill up on a dimension value, you move along the drill path from
lower- to higher-level data. For example, you may have drilled down on [Year]
to [Quarter]. If you drill up on [Quarter], you return to [Year].
You can only drill up on a dimension value if you have previously drilled down
to that dimension, or you have defined the appropriate drill path in the scope
of analysis.
To drill up on a dimension value
1. Verify you are in Drill mode.
2. On a table or section cell, right-click the dimension value on which you
want to drill up, then on the shortcut menu click Drill up , or click the Drill
Up icon next to the dimension value you want to drill up.
If the table is a crosstab without headers that display the names of the
dimensions on the table, then the Drill Up icon appears next to each value
from which you can drill up.
The report now displays data one dimension level up. The filters that
filtered the value you drilled up from, are removed from the Drill toolbar.
208
Web Intelligence Rich Client User's Guide
Working with reports
Drilling on report data
Drilling by
When you drill down or up, you move through a hierarchy one dimension at
a time. However, you can get another view of the data by slicing it in a
different way, and then look at the data in other hierarchies. To do this, you
drill by the other dimensions that interest you.
Note: You can only Drill by to a dimension that is included in the scope of
analysis of the document.
Example: Drilling by the Products hierarchy to slice sales revenue results
by product
You work as regional manager for California in a retail clothing store, and
have been sent the following report that shows quarterly sales revenue by
state:
You are only interested in analyzing the results in the state of California.
In addition, you want to analyze the sales revenue broken down by each
product line you sell. To drill on California data, you place your pointer on
the table cell that says California.
If you drilled down now, however, you would drill to results for each city
within California, because [City] is the dimension below [State]. Instead,
you select Drill by from the drill menu and then you navigate through the
dimensions on the Products hierarchy by selecting the sub-menus until you
reach the [Lines] dimension.
Web Intelligence Rich Client User's Guide
209
10
10
Working with reports
Drilling on report data
The drilled report displays the detailed sales revenue results for each
product line sold in California.
To drill by a dimension value
1. Verify you are in Drill mode.
2. On a table or section cell, right-click the dimension value you want to drill
by.
A shortcut menu appears, displaying the available drill paths.
210
Web Intelligence Rich Client User's Guide
Working with reports
Drilling on report data
3. Place your pointer on Drill by, then on the class to which you want to
drill.
4. Click the dimension to which you want to drill.
The report now displays data for the dimension to which you drilled.
Drilling on measures in tables and sections
When you drill on a measure value, Web Intelligence performs the drill action
one level down for each related dimension in the block and displays the new
measure calculation for the displayed dimensions.
Example: Drill on annual sales revenue results to see the breakdown by
city and quarter
For example, you drill down on the year 2003 sales revenue value for
California, which is displayed on a crosstab that shows sales revenue by
year in by state.
The drilled report displays sales revenue by quarter by city for California –
the state on which you drilled.
To drill down on a measure value
1. Verify you are in Drill mode.
2. Place your pointer over the measure value on which you want to drill.
A ToolTip appears, displaying the next dimension(s) in each related drill
path
3. Click the measure value.
Your report now displays data one dimension level down. The table
headers display the names of the dimensions you drilled to and the drill
up arrow, which indicates you can drill back up to the summary results if
wished. The Drill toolbar displays the values that filter the results displayed
on the drilled table or section.
Web Intelligence Rich Client User's Guide
211
10
10
Working with reports
Drilling on report data
To drill up on a measure value
1. Verify you are in Drill mode.
2. Right-click the measure value on which you want to drill up, then click the
Drill up option on the shortcut menu, or click the Drill Up icon next to the
measure value you want to analyze.
The drilled table now displays data one dimension level up.
Synchronizing drill across multiple tables and charts
A Web Intelligence report can contain several tables or charts. The generic
term used to refer to tables and charts in this guide is a block. There are two
ways to drill on a report with multiple blocks:
•
•
drill simultaneously on each block in the report the contains the drilled
dimension
drill on only the current block of data
You set how Web Intelligence performs drill on reports with the Synchronize
drill on report blocks option on page 67.
If you set Web Intelligence to synchronize drilling across a report, you drill
on each block in the report containing that drilled dimension. The next
dimension in the drill path replaces the previous dimension in all blocks of
the report.
If you set Web Intelligence not to synchronize drilling on all blocks in a report,
the next dimension in the drill path replaces the previous dimension only in
the current block of the report.
Drilling on charts
Drilling down, up, or by on a chart, provides you with a graphical explanation
for why summary results are particularly high or low.
You can drill on:
•
•
212
dimensions – by drilling on chart axes
dimensions – by drilling on the chart legend
Web Intelligence Rich Client User's Guide
Working with reports
Drilling on report data
•
measures – by drilling on the data bars or markers in the body of the chart
You cannot Drill by dimensions on chart axes. However, you can Drill by
dimensions on chart legends. For more information, see Drilling on axis
legends on page 216.
Drilling on dimensions via chart axes
On 2D charts, you can drill on dimensions via the X-Axis. On 3D charts, you
can drill on dimensions via the X-Axis and the Z-Axis. Charts can contain
one or multiple dimensions on a single axis. When an axis contains multiple
dimensions, each possible combination of the dimension values appear on
the axis (this is sometimes referred to as a cartesian product).
In the 2D bar chart illustrated below, the X-axis includes the [Year] and
[Quarter] dimensions. Each bar on the chart shows the values for one
combination of year and quarter; for example, 2001/Q1, 2001/Q2, and so
on.
When you drill on an axis value with multiple dimensions, the drilled results
are filtered by both dimensions. For example, in the chart illustrated above,
if you drill down on 2001/Q1 to the next level of data for [Month], the results
displayed on the drilled chart are those for the months in Q1 of 2001.
To drill on a chart axis
1. Verify you are in Drill mode.
2. Place your pointer over the dimension value on which you want to drill.
Web Intelligence Rich Client User's Guide
213
10
10
Working with reports
Drilling on report data
3. If you want to drill down on the dimension value, click the value. If you
want to drill up on the dimension value, right-click the value then select
Drill Up. If you want to drill down on the dimension value, right-click the
value then select Drill Down. If you want to drill by the dimension value,
right-click the value then select Drill By
Note: Drill by is not available if the axis has multiple dimensions.
Drilling on measures in charts
You can drill on the measures displayed on the following types of chart:
•
•
•
bar charts – by drilling on the bars
line and radar line charts – by drilling on the data markers
pie chart – by drilling on the segments
When you drill on measures, Web Intelligence performs the drill action on
each dimension displayed on the chart axes. The new measure calculations
displayed on the bars or data markers on the drilled chart, correspond to the
lower- or higher-level dimensions to which you drilled. The chart axis labels
display the names of the drilled dimensions.
Example: Analyze detailed information for the sales revenue measure on
a chart
For example, this 3D bar chart displays values for the [State] dimension on
the X-Axis and displays values for the [Lines] dimension on the Z-Axis. This
means that the chart bars display values for sales revenue per state per
line.
214
Web Intelligence Rich Client User's Guide
Working with reports
Drilling on report data
As the example below shows, when you drill down on the bar for “City
Trousers” in “California” you also drill down from [State] to [City] on the
X-Axis and from [Lines] to [Category] on the Y-Axis.
The drilled chart displays sales revenue per city per category for the “City
Trousers” clothing line.
To drill on a measure in a chart
1. Verify you are in Drill mode.
2. Place your pointer on the measure value on which you want to drill.
On charts, each measure is represented by a bar (on bar charts) or by a
data marker (on a line charts and radar line charts).
3. If you want to drill down on the measure value, click the bar or data
marker. If you want to drill up on the measure value, right-click the bar or
data marker, and then click Drill up.
Limitations when drilling measures on charts
When you drill on charts that are not bar charts, Web Intelligence may perform
the drill action only on certain dimensions instead of performing the drill action
on all of the dimensions on the chart axes. When you drill on measures in
the following chart types, Web Intelligence only performs the drill action on
the values in the axis legend:
•
area charts – 2D, 3D, and stacked
Web Intelligence Rich Client User's Guide
215
10
10
Working with reports
Drilling on report data
•
radar and scatter charts – all types
Note: You cannot drill on measures in 3D surface charts.
Drilling on axis legends
You can drill on charts via the chart legend whenever the legend lists the
dimensions displayed on the chart. When the chart legend lists the measures
displayed on the chart, drilling on the legend is not possible.
Drilling on a legend is useful, if you are working with a pie chart, because
the axis labels, which display the names of the dimensions represented by
each pie segment, are not often displayed.
Note: You can only Drill by on a chart legend, if there is a single dimension
on the axis.
To drill on an axis legend
1. Verify you are in Drill mode.
2. Place your pointer over the value on which you want to drill.
3. To drill down the dimension value, click the color associated with the
value. To drill up the dimension value, right-click the color associated with
the value, then click Drill up ; or click the Drill Up icon. To drill by the
dimension value, right-click the color associated with the value, then click
Drill by .
Using filters when you drill
When you drill on a dimension or measure value in a table or chart, Web
Intelligence filters the drilled results by the dimension or measure you drilled
on. The filter is applied to all of the results displayed on the drilled report.
Filters appear as list boxes in the Drill toolbar. Each list box contains the
values associated with that filter. You select the data displayed in a table or
chart by choosing the appropriate values from the list boxes.
216
Web Intelligence Rich Client User's Guide
Working with reports
Drilling on report data
Example: Filtering drilled reports by different US states
For example, if you drill down on a table cell displaying “California,” to view
results for cities in California, Web Intelligence filters the values in the entire
report for California and only displays results for California in the report.
By changing the value of each filter, you can then see data for other values
on the drilled dimension. For example, you can select Colorado in the filter
on State.
Note: If the drilled report includes dimensions from multiple data providers, a
ToolTip appears when you rest your cursor on the value displayed on the filter.
The ToolTip displays the name of the query and the dimension for the value.
To change a filter value on the Drill toolbar
1. Verify you are in Drill mode.
2. In the Drill toolbar, click the drop-down arrow relating to the dimension
you want to filter.
3. Click the value you want.
To add or remove a drill filter
1. Verify you are in Drill mode.
2. Drag the dimension containing the values around which you want to filter
your report and drop it onto the Drill toolbar.
A list box for the new filter appears on the Drill toolbar. You can select a
value from the list of values to filter the results displayed on the drilled
table, chart, or report.
3. To remove a drill filter, drag the dimension away from the Drill toolbar.
Saving reports with drill filters
When you save a document with reports in drill mode, Web Intelligence
maintains any filters that have been generated during drill. When you open
a document saved in drill mode, Web Intelligence displays the Drill toolbar
on the drilled reports showing the filters generated during the last drill session.
Web Intelligence Rich Client User's Guide
217
10
10
Working with reports
Drilling on report data
Note: Documents saved in drill mode take longer to open than documents
saved in results mode.
Refreshing data in a drilled report with prompts
Some Web Intelligence reports contain prompts. When you refresh the
document, the prompt(s) require(s) you to specify the value(s) you want to
retrieve from the database and return to the report(s) in the document. For
example, a prompt can require you to specify a year, for which you want to
retrieve data. This drilled report shows values for Year 2003 – the year
selected for the prompt.
If the drilled report is filtered for Year 2003, and you then refresh the document
and select year 2002 to answer the prompt, Web Intelligence retrieves results
for 2002 instead of 2003. The drilled report then displays values for 2002.
Drilling with query drill
Query drill defined
You can set Web Intelligence to drill in query drill mode, which behaves
differently from the standard drill mode described so far in this chapter. When
you activate query drill, Web Intelligence drills by modifying the underlying
query (adding and removing dimensions and query filters) in addition to
applying drill filters.
Example: Drilling down from month to week
n this example, Month is the lowest dimension currently available in the
query from a time hierarchy, and Week is the dimension immediately below
it in the hierarchy.
If you drill down on Month = January, three things happen:
•
•
•
Web Intelligence adds Week to the query scope of analysis.
Web Intelligence adds a query filter to restrict Month to January.
Web Intelligence adds a drill filter to restrict Month to January.
If you drill up from Week to Month, the process is reversed:
218
Web Intelligence Rich Client User's Guide
Working with reports
Drilling on report data
•
•
•
Web Intelligence removes Week from the query scope of analysis.
Web Intelligence removes the query filter.
Web Intelligence removes the drill filter.
Note: Drill filters are not strictly necessary in query drill mode. Web Intelligence
applies them for consistency with standard drill mode. For example, the
DrillFilters function returns the correct value in query drill mode because
Web Intelligence applies drill filters to match the query filters.
When do you use query drill?
You use query drill when your report contains aggregate measures calculated
at the database level. It is designed in particular to provide a drill mode
adapted to databases such as Oracle 9i OLAP, which contain aggregate
functions that Web Intelligence either does not support, or cannot calculate
accurately at the report level during a drill session.
The kinds of aggregate functions that are candidates for drilling in query drill
mode are: percentages, distinct counts, ranks, standard deviations and
variances, running aggregates, lead and lag functions. Because query drill
modifies the query at each drill operation, it ensures that these aggregates
are recalculated by the server each time you drill.
Query drill is also useful for reducing the amount of data that Web Intelligence
must store locally during a drill session. Because query drill reduces the
scope of analysis when you drill up, Web Intelligence is able to purge
unecessary data.
To activate query drill
1. Right-click on the document anywhere outside a table or chart and click
Document Properties to display the Document Properties pane.
2. Open the Document Options group within the tab.
3. Check Use query drill.
If your report already has a scope of analysis defined, you see a message
telling you to clear the scope of analysis before activating query drill.
Drilling with query drill
Drilling down with query drill
When you drill down, query drill behaves similarly to standard drill at the
point where the data moves outside the scope of analysis.
Web Intelligence Rich Client User's Guide
219
10
10
Working with reports
Drilling on report data
When Web Intelligence filters a drilled dimension in query drill mode it does
so by adding a query filter in addition to a drill filter. For example, if you drill
on Year=2001, Web Intelligence adds a filter at the query level to restrict the
Year dimension to 2001. For this reason, the only value that appears in the
drill toolbar for the drilled dimension is the value on which you drilled (in this
case 2001). This is different from standard drill mode, in which all values of
the dimension are visible in the toolbar. As a result, you cannot change filter
values in query drill mode (for example, drill on Year=2001 then switch to
Year=2003) as you can in standard drill mode.
Because query drill automatically extends the scope of analysis, you can
use it only if your BusinessObjects XI administrator has granted you the the
right to drill outside the scope. See your administrator for more details.
Drilling up with query drill
When you drill up, query drill removes dimensions from the query. For
example, if you drill up from Month to Quarter, Web Intelligence removes
Month from the query. This has two consequences:
•
•
Query drill is incompatible with drill snapshots. For more information, see
Query drill and drill snapshots on page 220).
Web Intelligence does not allow you to drill up beyond any dimension
that appears as one of the report objects. For example, if your report
displays Year, Quarter and Revenue, you cannot drill up from Quarter to
Year because this would remove quarter from the list of report objects.
Query drill and drill snapshots
Do not use drill snapshots when working in query drill mode, because query
drill means that snapshots cannot be guaranteed to stay the same.
In query drill mode, snapshots change when you drill up beyond a dimension
that you included in a snapshot. Because the drill up removes the dimension
from the underlying query, it also removes the dimension from the snapshot.
Query drill and the scope of analysis
Query drill and other reports based on the same data provider
If your document contains other reports that contain dimensions on which
you drill in query drill mode, these reports are affected because the query
drill modifies the dimensions they contain.
220
Web Intelligence Rich Client User's Guide
Working with reports
Filtering data using prompts
You can avoid this (at the cost of retrieving duplicate data into Web
Intelligence) by creating a new data provider and rebuilding the other report
against it. Now when you drill in query drill mode, the other report remains
unaffected.
Example: Drilling on a dimension that appears in another report
If you have two reports based on a query that contains Year, Quarter and
Sales Revenue, and you use query drill to drill down to Year = 2001 on the
first report, Web Intelligence also filters the data for Year in the second
report to include 2001 only.
Filtering data using prompts
What is a prompt?
A prompt is a special type of query filter. It is a dynamic filter that displays a
question every time you refresh the data in a document. You answer prompts
by either typing or selecting the value(s) you want to view before you refresh
the data. Web Intelligence retrieves only the values you specified from the
database and returns those values to the reports within the document.
Prompts allow multiple users viewing a single document to specify a different
sub-set of the database information and display it in the same report tables
and charts. Prompts also reduce the time it takes for the data to be retrieved
from the database.
A prompt contains the following elements:
•
•
•
a filtered object
an operator
a message
For example, to prompt users to select a specific year, you define a prompt
on the [Year] dimension:
Year Equal To ("Which year?°)
In this prompt, the filtered object is [Year], the operator is Equal To, and the
prompt message is "Which year?".
Web Intelligence Rich Client User's Guide
221
10
10
Working with reports
Filtering data using prompts
You can define prompts on any dimension, measure, or detail object. For
example, you can filter the [Year] dimension to return values for a specific
year, filter the [Sales Revenue] measure to return values for a range of
revenue figures, or filter the [Year/week] detail to return values for a specific
week in a year.
You can create multiple prompts, related by the AND or OR operators, in
the same query. You can also nest prompts. When the user runs a query,
Web Intelligence displays the prompts.
Prompts appear in the SQL generated by a Web Intelligence query as either
the value supplied in response to the prompt (when the SQL is read-only),
or as Web Intelligence prompt syntax (when the SQL is editable). For
example, a prompt on [Country) can appear in the generated SQL as
Resort_Country.country = @prompt('Enter Country:','A',
'Resort\Country', Mono,Free,Persistent,,User:0)
or as
Resort_country.country In ('UK')
Merged prompts
When a document contains multiple data providers, any prompts that include
(1) objects with the same data type, (2) operators of the same operator type,
and that (3) use the same prompt text are merged.
When all the data providers are refreshed, a single prompt message appears
for such prompts.
The List of Values displayed by the merged prompt is the list associated with
the object in the prompt that has the most display property constraints.
Cascading prompts
Some objects cause Web Intelligence to display a cascading prompt when
they are included in a prompt definition. The universe designer defines the
lists of values of these objects hierarchically in relation to other object lists
of values in the universe.
Cascading prompts help the user to focus on the object values they want to
include in the prompt without the need to search all possible object values.
222
Web Intelligence Rich Client User's Guide
Working with reports
Filtering data using prompts
Example: Choosing a store
In this example the universe designer has defined the [Store Name], [City]
and [State] objects in a hierarchy. If you include a prompt [Store Name]
Equal To <value>, Web Intelligence displays these objects in a hierarchy
in the Prompts dialog box. In order to select the store, the user must first
select the state in which the store city is found, then the city in which the
store is found, then the store itself. When the user selects the state, Web
Intelligence restricts the values of City to the cities in the state; when the
user selects the city, Web Intelligence restricts the stores to the stores in
the city.
Hierarchical lists of values
If your universe contains hierararchical lists of values, these lists appear in
tree form. You navigate down through the tree to the items you want.
Whether a list of values appears as a cascading prompt or hierarchically
depends on how the list is configured in the universe. See your administrator
for more information.
Query filter and prompt operators
Equal To operator
Use the Equal to operator to obtain data equal to a value.
For example, to return data for the US only, create the filter "County Equal
To US".
Not Equal To operator
Use the Not Equal To operator to obtain data not equal to a value.
For example, to return data for all countries except the US create the filter
"County Not Equal To US".
Web Intelligence Rich Client User's Guide
223
10
10
Working with reports
Filtering data using prompts
Different From operator
Use the Different From operator to retrieve data different from a value.
For example, to retrieve data for all quarters execpt Q4, create the filter
[Quarter] Different From "Q4"
Greater Than operator
Use the Greater Than operator to retrieve data greater than a value.
For example, to retrieve data for customers aged over 60, create the filter
"[Customer Age] Greater than 60".
Greater Than Or Equal To operator
Use the Greater Than Or Equal To operator to retrieve data greater than or
equal to a value.
For example, to retrieve data for revenue starting from $1.5M, create the
filter "[Revenue] Greater than or equal to 1000500".
Less Than operator
Use the Less Than operator to retrieve data lower than a value.
For example, to retrieve data for exam grades lower than 40, create the filter
"[Exam Grade] Less Than 40".
Less Than Or Equal To operator
Use the Less Than Or Equal To operator to retrieve data less than or equal
to a value.
For example, to retrieve data for customers whose age is 30 or less, create
the filter "[Age] Less Than Or Equal To 30".
224
Web Intelligence Rich Client User's Guide
Working with reports
Filtering data using prompts
Between operator
Use the Between operator to retrieve data between and including two values.
For example, to retrieve data for weeks starting at week 25 and finishing at
36 (including week 25 and week 36), create the filter "[Week] Between 25
and 36".
Not Between operator
Use the Not Between operator to retrieve data outside the range of two
values.
For example; to retrieve data for all the weeks of the year, except for and
not including weeks 25 through 36, create the filter "[Week] Not between 25
and 36".
In List operator
Use the In List operator to retrieve data corresponding to values in a list of
values.
For example, to retrieve data for the US, UK and Japan only, create the filter
[Country] In List ("US";"UK";"Japan").
Not In List operator
Use the Not In List operator to retrieve data that does not correspond to
multiple values.
For example, if you do not want to retrieve data for the US, UK and Japan,
create the filter [Country] Not In ("US";"UK";"Japan").
Matches Pattern operator
Use the Matches Pattern operator to retrieve data that includes a specific
string or part of a string.
Web Intelligence Rich Client User's Guide
225
10
10
Working with reports
Filtering data using prompts
For example, to retrieve customers whose date of birth is 1972, create the
filter [DOB] Matches Pattern "72".
Different From Pattern operator
Use the Different From Pattern operator to return data that doesn't include
a specific string.
For example, to retrieve customers whose date of birth is not 1972, create
the filter [DOB] Different From Pattern '72'.
Both operator
Use the Both operator to retrieve data that corresponds to two values.
For example, to retrieve customers who have both a fixed and a mobile
telephone, create the filter [Account Type] Both 'Fixed' And 'Mobile'.
Except operator
Use the Except operator to retrieve data that corresponds to one value and
excludes another.
For example, to retrieve customers who have a fixed telephone and do not
have a mobile telephone, create the filter [Account Type] 'Fixed' Except
'Mobile'.
The Except operator is more restrictive than Different From or Not In
List. For example, a report that returns customers and that includes the
filter [Lines] Different From 'Accessories' excludes all sales records
where the item sold is part of the 'Accessories' line. If the same customer
has purchased Accessories and non-Accessories items, the customer still
appears in the report, but their spending total includes only non-Accessories
sales.
If the filter is [Lines] Except 'Accessories', only customers who have
bought no accessories are included in the report.
Related Topics
•
226
Not In List operator on page 225
Web Intelligence Rich Client User's Guide
Working with reports
Filtering data using prompts
•
Different From operator on page 224
To create a prompt
1. Make sure the Query Panel is open.
2. From the Data tab, drag the object on which you want to apply a prompt
and drop it onto the Query Filters pane.
The query filter appears in outline in the Query Filters pane.
3. Click the arrow at the right of the Query Filter and select Prompt from
the menu.
4. Type the prompt text in the text box.
5. Click the icon next to the text box and use the dialog box that appears to
set the prompt properties.
• If the prompt is for a date and you want users to see the popup
calendar in order to select the date(s) then do not select Prompt with
List of Values
• If the document contains multiple data providers, and there is already
a prompt that includes (1) objects with the same data type, (2)
operators of the same operator type, and (3) that uses the same prompt
text as the new prompt, Web Intelligence displays a warning to tell
you that the two prompts will be merged. This means that whenever
all the data providers are refreshed, a single prompt message will
appear for the two prompts.
6. Click OK to confirm the prompt.
7. To delete a prompt, right-click it and select Remove from the menu.
The prompt appears at each document refresh.
Related Topics
•
•
Defining how prompts display on page 228
Merged prompts on page 222
To remove a prompt
•
Select the prompt and then click the Delete key.
Web Intelligence Rich Client User's Guide
227
10
10
Working with reports
Filtering data using prompts
Defining how prompts display
By default, prompts display a box and a list of values. You answer the prompt
by either typing the value(s) in the box or by selecting value(s) from the list.
You can modify how prompts display by checking one, some, or all of the
following options:
If you want the prompt
(useful when you...)
to display...
then...
want to view all the valthe list of values associatues for the object and
ed with the filtered dimenthen select from those
sion, measure, or detail,
values
leave the option selected
by default: Prompt with
List of Values
the value(s) specified the
last time the prompt was
answered (users can select a different value(s)),
often reselect the same
value(s) when you refresh the document, but
want the ability to select select the option: Keep
a different value when
last values selected
necessary, such as the
name of the current
month
almost always reselect
the same value(s) when
the value(s) you specify you refresh the docuas the default (users can ment, but want the ability select the option: Set deselect a different valto select a different value fault value(s)
ue(s)),
when necessary, such as
the number for the current year
prevent users from typing
a list of values from which
select the option: Select
a value that might not exusers select a value(s),
only from List
ist on the database
Note: If the prompt is for a date and you want users to see the popup
calendar in order to select the date(s) then do not select Prompt with List
of Values
228
Web Intelligence Rich Client User's Guide
Working with reports
Filtering data using prompts
Combining prompts
Combining multiple prompts on a single query enables you to filter the data
returned to the document so that each person viewing the reports sees only
the information relevant to their business need. For example, you can
combine the following three prompts on a Customer Accounts document:
•
•
•
Which customer?
Which account?
Which calendar period: from? to?
This enables each accounts manager viewing the document to view report
values for a specific customer account during a specific period.
You combine prompts in the same way that you combine query filters.
Combining prompts with query filters
Combining prompts and filters on a single query enables you decide the
values for some of the selected objects on the query using filters and allow
users to decide the values of other selected objects using prompts. For
example, if you combine the following filters and prompts on a HR document:
•
•
•
[Year] Equal to This Year
[Job title] Not equal to Senior Executive
Which employee?
Users viewing the document can choose which employee they view
information for, but they can only view data for the current year and they
can’t view data for senior executives.
To change the order of prompts
1. Click the Properties tab in the Query Panel.
2. Select the prompt you want to move up or down in the prompt order in
the Prompt Order box, then press the Up or Down arrow next to the box.
Web Intelligence Rich Client User's Guide
229
10
10
Working with reports
Displaying data in tables
Merging prompts
When a document contains multiple queries, Web Intelligence merges any
prompts that include objects with the same data type, operators of the same
operator type, and that use the same prompt text. When all the queries are
refreshed, a single prompt message appears for such prompts.
Displaying data in tables
Tables in Web Intelligence
When you create a new document and run the query the first time to display
the results, Web Intelligence generates a report that includes all of the results
in a vertical table. You can modify how the table is organized, remove or add
data, change the table type to display the results differently or insert other
tables. You can also insert free standing cells to display results in a single
cell.
Table types in Web Intelligence
A Web Intelligence report displays results in a block. You can format the
block as a specific type of table.
Vertical table
Vertical tables display header cells at the top of the table and the
corresponding data in columns. By default, the header cells display the names
of the dimensions, details, and measures included in the table. The body
cells display the corresponding values.
230
Web Intelligence Rich Client User's Guide
Working with reports
Displaying data in tables
Horizontal table
Horizontal tables display header cells at the left of the table and the
corresponding data in rows. By default, the header cells display the names
of the dimensions, details, and measures included in the table. The body
cells display the corresponding values.
Crosstab
Crosstabs display values for dimensions across the top axis and on the left
axis. The body displays the values of a measure that correspond to the
cross-section of the dimensions. For example, this crosstab displays values
for [Quarter] across the top axis and displays values for [State] on the left
axis. The body displays values that [Sales Revenue] for each quarter in each
state.
Web Intelligence Rich Client User's Guide
231
10
10
Working with reports
Displaying data in tables
You can include multiple dimensions in crosstabs. For example, this crosstab
displays two dimensions. The values for the [Sales Revenue] measure are
values each state by quarter for each line.
When you create crosstabs that include a dimension(s) in the body, the body
cell values are calculated according to a multi-dimensional data model. The
values displayed in the body are calculated according to all of the coordinates
on the table axes, whether or not there is a row for the specific coordinate
in the SQL result.
232
Web Intelligence Rich Client User's Guide
Working with reports
Displaying data in tables
Forms
Forms are useful in your report if you want to display detailed information
per customer, product, or partner. For example, a form is a useful way of
displaying individual customer records with information such as the customer
account, name, address, and so on.
Forms are also useful for formatting address labels for envelopes.
Structure View and Results View
The Web Intelligence Java Report Panel allows you to make modifications
to documents and preview those changes in Structure View, without
implementing each change on the Web Intelligence server. This enables you
to make multiple formatting changes quickly and preview them. When you
return to Results View, Web Intelligence requests the server to apply the
changes and returns the modified format in a single operation.
Web Intelligence Rich Client User's Guide
233
10
10
Working with reports
Displaying data in tables
You can create and format tables in either Structure View or Results View.
If you have several modifications to make, however, we recommend you
make the modifications in Structure View.
Creating, editing and removing tables
To create a table by dragging objects onto a report
1. If the report is empty, select either a single object or a class folder on the
Data tab, and then drag and drop the object or class onto the report.
2. If the report already contains tables or charts, press the Alt key, then with
the Alt key pressed, drag an object onto an empty area of the report.
A new table header and body cell appears on the report. The table header
displays the name of the object.
3. To add another object to the table, drag another object from the Data tab
and place it to the left or right of the existing column header.
4. When the “Drop here to insert a cell” ToolTip appears, drop the object
onto the left or right of the table header.
A second column appears before or after the first column. The new column
header displays the name of the object.
Web Intelligence displays the values in a vertical table. You can quickly turn
the vertical table to a different table format, such as a crosstab by using the
Turn To feature.
To create a table by selecting a template
1. Click View Structure.
Working in Structure View allows you to define and preview the new table
without requesting the server to apply each of your modifications. You
then apply all your modifications and display the results in the new table,
by returning to Results View.
2. Click the Templates tab. If the Templates tab is hidden, click the
Show/Hide Manager button on the Report toolbar.
3. Drag a template from the Template tab onto a blank area of the report.
The template appears on the report.
234
Web Intelligence Rich Client User's Guide
Working with reports
Displaying data in tables
4. Click the Data tab.
The objects and variables that the document contains appear here. You
can add any of these objects or variables to the table.
5. Drag an object or variable onto an empty header or body cell of the table.
6. When the ToolTip “Drop here to replace cell” appears, drop the object
onto the table.
The empty cell is replaced by the object. If you are working in Results
View, the values of the objects display on the table. If you are working in
Structure View, the name of the object displays on the table.
7. To add more objects to the template, drag an object from the Data tab
and drop it onto the template.
Once you have allocated objects to each part of the table template, you
can add more objects to increase the size of the table. Each additional
object inserts more columns or rows onto the table.
8. To add another object and create an additional table column or row, drag
an object from the Data tab and drop it onto a row or column.
• If you drop the object onto the left of a column, you create a new
column before the existing column.
• If you drop the object onto the right of a column, you create a new
column after the existing column.
• If you drop the object onto the top edge of a row, you create a new
row above the existing row.
• If you drop the object onto the bottom edge of a row, you create a new
row below the existing row.
9. If you are working in Structure View, click View Results to display the
values in the new table.
To duplicate a table
1. Select a table on a report.
A gray border appears around the table, when the table is selected.
2. Keep your pointer pressed in and press the Ctrl key.
Web Intelligence creates a duplicate table on top of the original table.
3. With your pointer and the Ctrl key pressed in, drag the duplicate table to
an empty area of the report.
The duplicate table appears on the report.
Web Intelligence Rich Client User's Guide
235
10
10
Working with reports
Displaying data in tables
To apply a different template to a table by using drag and drop
1. Select the report tab that contains the table you want to modify.
2. Click the Templates tab.
If the Templates tab is hidden, click the Show/Hide Manager button on
the Report toolbar. The Templates appear.
3. Drag a template from the Template tab onto a table. You must drop the
template directly on the existing report block.
Web Intelligence applies the new template to the table values.
To apply a different template to a table with Turn To
1. To select the table you want to reformat, click the top edge of the table.
A gray border appears around the table.
2. Right-click the report block.
3. On the shortcut menu, click Turn To.
The "Turn To" dialog box appears.
4. On the Tables tab or on one of the Chart tabs, select the table or chart
template you want to apply to the table.
5. Click OK.
If you turned a table to a chart, the unicode font is not retained in the chart
if the font for the text on the table was unicode, and if unicode is not defined
as your default font for charts. You need to format the chart with the unicode
font, if this font is available on your computer. If this is not the case, you need
to contact your administrator to configure the Web Intelligence server and
your computer appropriately.
To add rows or columns to tables using drag and drop
•
236
Drag the object you want to add to the table from the Data tab, and drop
the object where you want to add it:
• To add the object into a new column to the left of an existing column,
drag the object onto the left edge of a column header.
• To add the object into a new column to the right of an existing column
, drag the object onto the right edge of a column header.
Web Intelligence Rich Client User's Guide
Working with reports
Displaying data in tables
•
To add the object into a new row before an existing row, drag the
object onto the top edge of a row header.
• To add the object into a new row after an existing row, drag the object
onto the bottom edge of a row header.
The name of the object appears in the new column or row header, and
the values appear in the new body cells.
To add table rows or columns using the Insert row or column
toolbar menu
1. Select the table you want to reformat.
2. Select the column or row next to which you want to insert the new column
or row.
3. The Insert column or row button automatically displays one of the insert
options.
4. Click the displayed option or click the arrow next to the Insert button, and
then select the appropriate option from the drop-down menu.
Web Intelligence adds a blank column or row to the table.
5. Drag an object from the Data tab, and drop the object onto the blank
column or row.
Web Intelligence allocates the selected object to the new column or row.
The name of the object displays in the column or row header, and the
values for the object display on the body cells.
To remove table rows or columns
•
Right-click the table column or row you want to remove and select
Remove Row, Remove Column or Remove from the shortcut menu.
To move a row or column
•
Drag the selected column or row and drop it before or after another column
or row on the table.
When you drag a row or column, the column or row header displays next
to your pointer.
Web Intelligence Rich Client User's Guide
237
10
10
Working with reports
Displaying data in tables
To swap a row or column
•
Drag the selected column or row onto the column or row with which you
want to make the swap
Web Intelligence swaps the two columns or rows.
To replace a row or column
1. Select the report tab that contains the table you want to modify.
2. Click the Data tab.
3. Drag the object you want to add to the table from the Data tab, and then
drop the object onto the row, column, or body you want to replace.
The values for the new object display on the table.
To clear cell contents from a table
You can clear cell contents and then use the empty cells to display images,
hyperlinks, formulas, or text you type.
You can clear the following types of cell in a table:
• header cells – you can clear each header cell separately
• footer cells – you can clear each footer cell separately
• related body cells – when you clear one body cell, you automatically clear
all of the body cells in the same column or row of the table
1. To select the cell you want to clear, click the cell.
The cell borders are highlighted.
2. Right-click the selected cell.
The shortcut menu appears.
3. The shortcut menu appears.
4. Click Clear Cell Contents.
Web Intelligence clears the contents from the selected cell(s).
238
Web Intelligence Rich Client User's Guide
Working with reports
Displaying data in tables
To remove a table
1. To select the table you want to remove, click the top edge of the table.
A gray border appears around the table.
2. Press the Delete key, or right-click the selected table and select Remove
from the shortcut menu.
Modifying tables to create crosstabs
To create a crosstab by adding an object to a vertical or
horizontal table
1. Drag an object from the Data tab onto the top edge of the table or the left
side of the table where you want to create the new axis and form the
crosstab.
2. When the ToolTip “Drop here to create a crosstab” appears, drop the
selected object onto the report.
Web Intelligence creates a second axis to form a crosstab and inserts
the object on the new axis.
To create a crosstab by moving a column or row
1. Select the table column or row you want to move to create the crosstab.
2. Drag the selected column or row onto the top edge of the table or the left
side of the table where you want to create the new axis and form the
crosstab.
3. Drop the column or row onto the header.
Web Intelligence creates a second axis to form a crosstab, and displays
the data of the column or row you moved on the new axis.
Web Intelligence Rich Client User's Guide
239
10
10
Working with reports
Displaying data in tables
Formatting tables and table cells
To select a background color for the table
1. Select the table or table cell for which you want to format a background.
2. Right-click the table, then select Edit Format from the shortcut menu.
The Properties tab displays the table or cell formatting options depending
on which element you selected.
3. Select the drop-down arrow next to Appearance > Background color.
A list of available colors appears.
4. Click the color you want to apply to the selected table or table cell, or click
Custom, and then create a custom color, using the Swatches, HSB
(Hue, Saturation, Brightness), or RGB (Red, Green, Blue) tab, and click
OK.
If you know the RGB hexadecimal color reference, you can type the
reference into the combo boxes next to the + and - buttons on the RGB
tab.
Web Intelligence applies the background color to the selected table or
cell.
To define alternate row and column colors for a table
1. Select the table for which you want to format alternate row colors.
When the table is selected, a gray border appears around the table.
2. Right-click the table, then select Edit Format from the shortcut menu.
The Properties tab displays the table formatting options.
3. Open the Appearance > Alternate color property sub-group.
4. Set the frequency for the alternate row color in the combo box next to
Frequency by clicking the + or - sign, or by entering a number.
5. Click the arrow next to Color.
6. Select a color from the list of colors, or click Custom, and then create a
custom color, using the Swatches, HSB (Hue, Saturation, Brightness),
or RGB (Red, Green, Blue) tab, and click OK.
240
Web Intelligence Rich Client User's Guide
Working with reports
Displaying data in tables
If you know the RGB hexadecimal color reference, you can type the
reference into the combo boxes next to the + and - buttons on the RGB
tab.
To select or remove a table skin
1. Right-click the table, then select Edit Format from the shortcut menu.
The Properties tab displays the table or cell formatting options depending
on which element you selected.
2. Click the ... button next to Background image in the Appearance property
sub-group.
3. Select Skin in the "Background Image" dialog box.
4. Select the skin from the drop-down list.
5. Select None to remove the skin.
To insert an image in a table
1. Right-click the table, then select Edit Format from the shortcut menu.
The Properties tab displays the table or cell formatting options depending
on which element you selected.
2. Click the ... button next to Background image in the Appearance property
sub-group.
3. Click Custom in the Background Image dialog box.
4. Type the file name in the Image (URL) box (Web Intelligence inserts the
HTML tag boimg:// before the file name and links to the image file on a
corporate web server), or type the web server URL followed by the file
name of the image file (the URL and file name must not include spaces).
To format table borders
1. Right-click the table, then select Edit Format from the shortcut menu.
The Properties tab displays the table or cell formatting options depending
on which element you selected.
2. Click the ... button next the the Borders property.
3. Use the buttons in the Border Editor dialog box to set the border style.
Web Intelligence Rich Client User's Guide
241
10
10
Working with reports
Displaying data in tables
You can also set the borders of header cells, body cells and footer cells
in the table properties. To do so, click the ... button next to the Borders
property in the Header cells, Body cells and Footer cells property
sub-groups.
To format text in table cells
1. Right-click the table, then select Edit Format from the shortcut menu.
The Properties tab displays the table formatting options.
2. Click the ... button next to the the Text format property in the Appearance
> Header cells/Body cells/Footer cells property sub-group.
3. Format the text in the Format Text dialog box.
You can also format cell text by selecting the cell then setting the
Appearance > Text Format property in the Properties tab.
To set cell height and width
You can define the height and width of cells by using drag and drop or
specifying the size of cells on the Properties tab.
If you want to hide cell contents on reports, you can set the cell width to 0.1
cm so that the cell width can be modified to display the cell contents later.
1. Drag the cell borders until the cell is the height and width you want, or:
2. Select the table cell you want to format, right-click and select Edit Format
from the menu.
The Properties tab displays the cell formatting options.
3. Set the Width and Height properties in the Display properties sub-group.
4. If you want to set the cell to autofit, select Autofit Width and/or Autofit
Height.
Some Web Intelligence functions are incompatible with AutoFit cells. If
you place any of these functions in an AutoFit cell, Web Intelligence
returns the #RECURSIVE error message as the function output.
You can also set AutoFit cell width and height by double-clicking the cell
borders.
• To set AutoFit cell width, double-click the right border of the cell
242
Web Intelligence Rich Client User's Guide
Working with reports
Displaying data in tables
•
To set AutoFit cell height, double-click the bottom border of the cell
AutoFit retains the current cell size as the minimum size and enlarges
the cell size, if the string or image that the cell contains is larger than the
minimum size specified.
Documents that contain tables with the cell size set to AutoFit, take longer
to display in the Java Report Panel or InfoView than documents where
tables contain cells with a fixed cell width and cell height. We recommend
that for large documents, you specify a fixed sized for cell width and cell
height for tables.
Determining how tables display data
Showing or hiding empty tables, rows or columns
Sometimes tables or specific rows and columns display no values. For
example, if a sales of a specific product are discontinued, table rows or
columns that normally show results for that product appear empty. By default,
Web Intelligence displays such empty rows, columns, or tables. You can
choose to display or hide empty tables, rows or columns.
To show or hide empty tables, rows or columns
1. Select the table, right-click and select Edit Format on the menu.
The Properties tab displays the crosstab formatting options.
2. Select Show table when empty to display empty tables.
3. Select Show empty rows to display empty rows in a vertical table.
4. Select Show rows with empty dimension valuesto display rows with
empty dimension values.
5. Select Show empty columnsto display empty columns in a horizontal
table or crosstab.
Aggregating duplicate rows
When rows contain duplicate data, Web Intelligence aggregates measure
values by default.
Web Intelligence Rich Client User's Guide
243
10
10
Working with reports
Displaying data in tables
To avoid duplicate row aggregation
1. Select the table, right-click and select Edit Format on the menu.
The Properties tab displays the crosstab formatting options.
2. Select Display > Avoid duplicate row aggregation.
To show or hide headers and footers
1. Select the table, right-click and select Edit Format from the menu.
The Properties tab displays the table formatting options.
2. Select Show table headers in the Display properties sub-group to
display table headers.
3. Select Show table footers in the Display properties sub-group to display
table footers.
To start tables on a new report page
1. Select the table, right-click and select Edit Format from the menu.
The Properties tab displays the table formatting options.
2. Select Position > Start on a new page.
To display object names in headers on crosstabs
1. Select the table, right-click and select Edit Format from the menu.
The Properties tab displays the table formatting options.
2. Click Display > Show object name to display the object names in
additional headers on the crosstab.
To avoid page breaks in tables
1. Select the table, right-click and select Edit Format on the menu.
The Properties tab displays the crosstab formatting options.
2. Select Position > Avoid page breaks in table.
244
Web Intelligence Rich Client User's Guide
Working with reports
Displaying data in tables
To repeat table headers or footers on report pages
1. Select the table, right-click and select Edit Format on the menu.
The Properties tab displays the crosstab formatting options.
2. Select Position > Repeat header on every page to repeat the header
on every page.
3. Select Position > Repeat footer on every page to repeat the footer on
every page.
Copying tables
To copy a table
You can copy and paste tables within a report or into external applications
such as Microsoft Word and Excel. You cannot copy tables from one instance
of Web Intelligence to another.
1. Select the table, right-click and select Copy on the menu.
2. To paste the table to another part of the report, right-click where you want
the table to appear and click Paste on the menu.
3. To paste the table into another application, paste the contents of the
clipboard from within the other application.
You can also copy a table into another application by dragging and
dropping the table directly into the open document in the target application.
The table appears as a picture in the open document if pasted to another
application.
To copy a table as text
You can copy the data in a table as plain text into another application. For
example, if you copy a table as text into Microsoft Excel, Web Intelligence
copies the text in each table cell to a cell in the Excel worksheet. Web
Intelligence copies the text to the clipboard as tab-separated text.
1. Select the table, right-click and select Copy as text on the menu.
2. Paste the contents of the clipboard into the target application.
Web Intelligence Rich Client User's Guide
245
10
10
Working with reports
Displaying data in free-standing cells
If you choose Copy as text, then paste the table into the current Web
Intelligence report, the table appears as a normal Web Intelligence table.
Displaying data in free-standing cells
Free-standing cells defined
Free-standing cells are single cells that stand alone in a report. You can use
free-standing cells to display information that adds meaning to your report,
such as:
• text comments – type messages or questions or to add titles
• images – display logos, icons, or photographs on reports
• formulas or calculations – add custom formulas or calculations
• the last refresh date – display he date when the document results were
refreshed with the most recent data from the database
• the DrillFilter function – display the names of the objects by which the
data on a drilled report is filtered
• page numbers – display the page number of each report page
To insert a blank cell on a report
1. Click the Templates tab.
2. Select the Blank Cell template, and then drag the template onto an empty
area of the report.
The blank cell appears on the report.
3. Right-click the cell, then select Edit Format from the shortcut menu to
display the Properties tab.
The Properties tab lists the properties (arranged into groups) relevant
to free-standing cells.
4. To display text in the cell, type the text into the General > Text property.
5. To display an image in the cell, type the file name or the URL and file
name into the General > Text property, then select Image (URL) from
the drop-down list next to the Display > Read cell contents as property
246
Web Intelligence Rich Client User's Guide
Working with reports
Displaying data in free-standing cells
6. To display HTML in the cell, type the HTML string into the General > Text
box, then select HTML from the drop-down list next to the Display > Read
cell contents as property
7. To display a formula result in the cell, click the Show/Hide Formula
Toolbar button on the Report View toolbar, then type the formula into the
toolbar.
To copy a free-standing cell
You can copy and paste free-standing cells within a report or into external
applications such as Microsoft Word and Excel. You cannot copy
free-standing cells from one instance of Web Intelligence to another.
1. Select the free-standing cell, right-click and select Copy on the menu.
2. To paste the free-standing cell to another part of the report, right-click
where you want the free-standing cell to appear and click Paste on the
menu.
3. To paste the free-standing cell into another application, paste the contents
of the clipboard from within the application.
You can also copy a free-standing cell into another application by dragging
and dropping the free-standing cell directly into the open document in the
target application.
The free-standing cell appears as a picture in the open document if pasted
to another application.
To copy a free-standing cell to another application
as text
You can copy the data in a free-standing cell as plain text into another
application. For example, if you copy a free-standing cell as text into Microsoft
Excel, Web Intelligence copies the text in the free-standing cell to a cell in
the Excel worksheet.
1. Select the free-standing cell, right-click and select Copy as text on the
menu.
2. Paste the contents of the clipboard into the target application.
Web Intelligence Rich Client User's Guide
247
10
10
Working with reports
Displaying data in charts
If you choose Copy as text, then paste the free-standing cell into the
current Web Intelligence report, the free-standing cell appears as a normal
Web Intelligence free-standing cell.
To format a free-standing cell
1. Right-click the cell and select Edit Format to display the Properties tab.
2. Set the cell formatting properties in the Properties tab.
Displaying data in charts
Creating charts
You can include one or multiple charts on the reports in a Web Intelligence
document. You can create a chart when you build or new document or insert
charts into an existing document.
If you are building a new document, you need to define the data definition
of the document by building a query before you select a chart template.
Once you have defined the query you go to Report View to define the chart(s)
on report(s).
To create a chart, you follow three steps:
• select a chart template
• allocate dimensions and measures to the chart axes
• view the results displayed on the chart
If you want to create a chart that displays the same data as a table on a
report, you can copy the table first and then turn the duplicate table into a
chart using the "Turn To" dialog box.
Chart types in Web Intelligence
A Web Intelligence report displays results in a block. You can format the
block as a specific type of chart.
248
Web Intelligence Rich Client User's Guide
Working with reports
Displaying data in charts
Bar charts
Bar charts display data in bar form, either vertically or horizontally. Bar charts
are useful if you want to compare similar groups of data; for example one
time period to another. There are five types of bar charts: grouped, bar and
line, stacked, percent, and 3D.
2D bar charts include the optional Z-Axis. Including data on the Z-Axis
enables you to show an additional break down of the results displayed on
the chart bars.
3D bar charts do not include an axis legend. You can clearly see what
information is displayed on the chart bars by looking at the axis labels.
Line charts
Line charts connect specific data values with lines, either horizontally or
vertically. Line charts are useful if you want to show trends or changes in
data over time. There are five types of line charts: mixed, stacked, percent,
3D, and 3D surface.
Area charts
Area charts are line charts in which the area between the lines and axis are
filled in. Area charts are useful if you want to emphasize the size of the total
data in a report, as opposed to the changes in the data. You may not want
to use an area chart if you have a sharp contrast between specific data
points. Use a line chart instead.
Web Intelligence Rich Client User's Guide
249
10
10
Working with reports
Displaying data in charts
You can use more than one measure object on the Y-axis as long as the
measures are of the same type and scale; for example, Number of Guests,
and Future Guests. There are five types of area charts: absolute, stacked,
percent, 3D area, and 3D surface.
Pie charts
Pie charts display data as segments of a whole. Pie charts are useful if you
want to show how each part of your report data contributes to the total.
Pie charts have a single axis displayed on the body of the pie. This is the
Y-Axis. Each segment of the pie chart displays a value for the measure on
the Y-Axis. The pie chart legend indicates the dimension on the X-Axis.
You can only include one measure object in a pie chart. If you have several
measures in your report, you should choose another chart type. There are
four types of pie charts: pie, 3D pie, ring, 3D ring.
Radar, polar and scatter charts
In radar charts, the X- and Y-axis connect at the chart’s center. Radar charts
are useful if you want to look at several different factors related to one item.
For example, you could use a radar chart to display revenue data for different
services within a hotel. On one axis, you could display revenue for the rooms.
On another you could display revenue for the restaurant, and so on.
Scatter charts are similar to line graphs, except that the data points are
plotted without a line connecting them. Scatter charts are useful if you want
to make a comparison between specific data points.
250
Web Intelligence Rich Client User's Guide
Working with reports
Displaying data in charts
There are four types of radar, polar, and scatter charts: radar line, stacked
radar, polar, and scatter.
3D charts
3D charts include three axes: the Y-Axis always displays values for measures
(such as sales totals, margins, quantities and so on); the X- and Z-Axis
display values for dimensions (that is, key indicators, such as time,
geography, service lines, and so on). In the 3d bar chart displayed below,
the chart bars display sales revenue per quarter, per year. The [Sales
revenue] measure is on the Y-Axis, the [Quarter] dimension is on the X-Axis,
and the [Year] dimension is on the Z-Axis
To see how this data is displayed in a 2D bar chart, see 2D charts on
page 251.
2D charts
The 2D bar chart below includes an optional Z-Axis with the values for quarter.
Including data on the Z-Axis enables you to show an additional break down
of the results displayed on the chart bars. The [Sales revenue] measure is
Web Intelligence Rich Client User's Guide
251
10
10
Working with reports
Displaying data in charts
on the Y-Axis, the [Year] dimension is on the X-Axis, and the [Quarter]
dimension is on the Z-Axis. Notice that because the Z-Axis cannot be
represented graphically on a 2D chart, the legend provides the information
for the Z-Axis values.
To see the same data displayed in a 3D bar chart, see 3D charts on page 251.
Adding, copying and removing charts
To add a chart to a report
It is recommended you work in Structure View when you insert a new chart.
This is because Results View is designed to display the data contained in
reports. Therefore, you can only view charts in Results View after you have
allocated dimensions and measures to the empty chart template.
1. Click View Structure on the report panel toolbar.
2. Click the Templates tab.
3. Select the chart template drag it onto an empty area of the report.
The empty template appears on the report.
4. Click the Data tab.
5. Drag a dimension or measure object onto the chart axis, where you want
the results for that dimension or measure to appear on the chart.
252
Web Intelligence Rich Client User's Guide
Working with reports
Displaying data in charts
6. Drop the dimension or measure onto the axis when the “Place dimension
objects here” or the “Place measure objects here” ToolTip appears.
7. To allocate more dimension and measure objects to each chart axis,
repeat the previous two steps.
8. To display the results in the chart, click the View Results button on the
Report toolbar.
The chart displays the results corresponding to the objects you allocated
to the chart axes.
To copy a chart
1. Select the chart, right-click and select Copy on the menu.
Web Intelligence copies the chart to the clipboard.
2. To paste the chart to another part of the report, right-click where you want
the chart to appear then click Paste on the menu.
3. To paste the chart into another application, paste the contents of the
clipboard from within the other application.
You can also copy a chart into another application by dragging and
dropping it directly into the open document in the target application.
The chart appears as a picture in the open document if pasted to another
application.
To remove a chart
•
Right-click the chart and click Remove, or verify that the Data tab is
displayed, then drag the chart from the Document pane and drop it onto
the Data tab.
Changing the chart type
To change the chart type by using drag and drop
1. Click the Templates tab.
Web Intelligence Rich Client User's Guide
253
10
10
Working with reports
Displaying data in charts
2. Drag a template onto the chart or table you want to modify. You must
drop the template directly on the existing report block. If you drop the
template outside the existing report block, you create a separate chart.
3. If you want to move the dimensions or measures to different axes, click
the View Structure button on the report panel toolbar, then drag the
objects you want to move onto the Data tab, and then drag and drop the
objects you want to display on the chart from the Data tab onto each chart
axis
To change the chart type by using TurnTo
1. Right-click the table or chart.
2. Click Turn To.
The "Turn To" dialog box appears.
3. Click the tab corresponding to the chart type you want, then click a format.
4. Click OK.
If the new chart type does not have data allocated to both the X-axis and
the Y-axis, the chart will not appear when you view the report in Results
View or in Drill mode. In this case, click the View Structure button on the
report panel toolbar, and then click the Data tab and drag the appropriate
dimensions or measures onto the axes on the new chart template. When
you click View Results, the chart appears.
If the font for the text on the table was unicode, and if unicode is not
defined as your default font for charts, the unicode font is not retained in
the chart. You need to format the chart with the unicode font if available
on your computer. If this is not the case, you need to contact your
administrator to configure the Web Intelligence server and your computer
appropriately.
Web Intelligence applies the selected template to the block and displays
the data in the chart type you chose.
254
Web Intelligence Rich Client User's Guide
Working with reports
Displaying data in charts
Positioning and sizing charts
To set the position of a table or chart on the report page
1. Select the table or chart.
The chart properties appear in the Properties tab.
2. Open the Page layout > Position property group on the Properties tab,
then click ... next to the property.
3. Use the "Relative Position" dialog box to set the position.
To position a chart in relation to another chart or table
If you have more than one block (table, chart, or form) in your report, you
can use relative positioning. Relative positioning allows you to position a
selected block (for example, a chart) in relation to other blocks in the report.
If new data on the database modifies the size of the tables or charts, relative
positioning ensures that the different tables and charts display correctly
without overlapping each other.
Note: If you position a chart in relation to another block (that is, a chart,
table, or form), the position of the related block changes automatically, if you
reposition the chart.
1. Right-click the chart and click Edit Format.
2. Open the Page layout > Position property group on the Properties tab.
3. Click ... next to the Position property to open the Relative Position dialog
box.
If the report does not contain multiple elements, the Relative Position
dialog box is not available.
4. Select the distance of the upper left point of the chart in relation to another
report element by entering - the number of pixels; the part of the other
report element from which you want to measure the pixels (in the first
drop-down list); the report element from which you want to measure the
pixels (in the second drop-down list).
5. Repeat this for the distance of the lower left point of the chart.
Web Intelligence Rich Client User's Guide
255
10
10
Working with reports
Displaying data in charts
To resize a chart
1. Right-click the chart and click Edit Format.
2. Open the Display property group on the Properties tab.
3. Type the chart width in the Width property and the height in the Height
property.
Formatting charts
To insert and format a chart title
1.
2.
3.
4.
Right-click the chart and click Edit Format.
Open the Title > Text format property group on the Properties tab.
Click ... next to Text Format to open the "Text Format" dialog box.
Use the Text Format dialog box to set the title format.
To display a chart with a 3D look
1. Right-click the chart and click Edit Format.
2. Open the Display property group on the Properties tab.
3. Select 3D look.
To add background colors to a chart
1.
2.
3.
4.
Right-click the chart and click Edit Format.
Open the Appearance property group on the Properties tab.
Click the arrow next to Background color to display the color palette.
Select a color from the color palette or click More Colors to display the
Choose Color dialog box.
To modify chart borders
1. Right-click the chart and click Edit Format.
256
Web Intelligence Rich Client User's Guide
Working with reports
Displaying data in charts
2. Open the Appearance property group on the Properties tab
3. Select the border style from the Style list and the color from the Color
list.
To select and format chart floors and walls
Floors and walls give depth to charts and help to set off the data displayed
on the chart bars or lines. 3D charts have a floor, a left wall, and a right wall.
2D charts just have a floor. You can specify a color for the floor and walls.
1. Right-click the chart and click Edit Format.
2. Open the Display property group on the Properties tab.
3. Select Show floor to display the chart floor, Show left wall to display
the chart left wall and Show right wall to display the chart right wall.
The availability of these options depends on the type of chart.
4. Set the wall and floor color by clicking the Wall and floor color property
in the Appearance property group and using the "Color Palette" or the
"Choose Color" dialog box to set the color.
To show and format axis legends
1.
2.
3.
4.
5.
6.
7.
8.
9.
10.
Right-click the report and select Edit Format.
Open the Display property group in the Properties tab.
Select Show legend to show the legend.
To select the legend’s position. open the Legend property group and
select the position from the Position list.
To format the legend title, open the Title property group.
Format the title text by clicking ... next to the Text Format property and
using the Format Text dialog box to set the format.
Set the legend background color by clicking the arrow to the right of the
Background color property and using the Color Palette or Choose
Color dialog box to define the color.
Set the legend border style by clicking ... next to the Borders property
and using the Edit Borders dialog box to define the border.
To format the legend values, open the Legend > Values property group.
Repeat steps 6 - 8 to format the legend values.
Web Intelligence Rich Client User's Guide
257
10
10
Working with reports
Displaying data in charts
To avoid page breaks in charts
1. Right-click the chart and click Edit Format.
2. Open the Page layout property group on the Properties tab.
3. Select Avoid page breaks in chart.
To show axis labels on pie charts
1. Right-click the chart and select Edit Format.
2. Open the Legend > Data property group.
3. Select Show segment labels.
To format axis label text, borders, and background
1.
2.
3.
4.
Right-click the chart and click Edit Format.
Open the Appearance > X/Y/Z Axis > Label property group.
Select Show object name to show the object name on the label.
Type the text into Other label if you want to assign custom text to the
label in place of the object name.
5. To format the text, Click ... next to Text Format to open the "Text Format"
dialog box.
6. Use the "Text Format" dialog box to format the text.
You can set many of the properties in the "Text Format " dialog box
directly from the property list, where they appear beneath Text Format.
To show, hide or format the axes grid
1. Right-click the chart and select Edit Format.
2. Open the Appearance > X/Y/Z Axis > Values property group in the
Properties tab.
3. Select Show grid to show the grid.
4. Select Show markers to show the grid markers.
5. Click Grid color and select the grid color using the "Color Palette" or
the "Choose Color" dialog box.
258
Web Intelligence Rich Client User's Guide
Working with reports
Displaying data in charts
Displaying and formatting chart data
To show a chart when empty
Sometimes charts display no values. For example, if sales of a specific
product are discontinued, a chart that normally displays results for that product
will appear empty. By default, Web Intelligence displays such empty charts
on reports. If wished, you set Web Intelligence to hide charts whenever they
are empty.
1. Right-click the chart and click Edit Format.
2. Open the Display property group in the Properties tab.
3. Select Show when empty.
To specify a color palette for the chart data
1. Right-click the report and select Edit Format.
2. Open the Appearance > Data property group in the Properties tab.
3. Click ... next to Palette to display the "Choose Palette" dialog box and
select one of the predefined palettes in the Predefined Palettes list.
4. To edit a pallete, select the pallete, then click Edit Pallete.
The "Edit Palette" dialog box opens
5. Select a color in the palette.
The "Custom Color" dialog box opens.
6. Create a custom color using the Custom Color dialog box, then click
OK.
7. To set all the colors in the palette to the same color, click Set All Colors.
To format axis values numbers and text
1. Select the chart and click Edit Format.
2. Open the Appearance > X/Y/Z Axis > Values property group in the
Properties tab.
3. Click ... next to the Number format property to display the Number
Format dialog box.
4. Use the "Number Format" dialog box to define the format.
5. Click ... next to the Text Format property to display the "Text Format"
dialog box.
6. Use the "Text Format" dialog box to format the text.
Web Intelligence Rich Client User's Guide
259
10
10
Working with reports
Displaying data in charts
ou can set many of the properties in the "Text Format" dialog box directly
from the property list, where they appear beneath Text Format.
To define the axis value frequency
1. Right-click the chart and click Edit Format.
2. Open the Appearance > X/Y/Z Axis > Values property group in the
Properties tab.
3. Select Automatic frequency to set the frequency to automatic.
4. Type the frequency in Frequency to set the frequency to a specific value.
Automatic frequency must be unselected before you can type a custom
frequency.
When you set the frequency to n, Web Intelligence displays every n values
on the axis.
To show a specific range of axis values
1. Right-click the report and click Edit Format.
2. Open the Appearance > X/Y/Z Axis > Scale property group on the
Properties tab.
3. Enter the minimum value in Min. value and the maximum value in Max.
value.
Web Intelligence displays the minimum and/or maximum values you
specified on the axis.
To show or hide data values
1. Right-click the chart and select Edit Format.
2. Open the Appearance > Data group in the Properties tab.
3. Select Show data to show the data.
To vary the data markers for each result
1. Right-click the chart and select Edit Format.
2. Open the Appearance > Data property group in the Properties tab.
3. Select Vary data markers.
You can only vary the data markers for each result on the following chart
types: 2D Line charts, 2D Bar and Line charts, and Radar charts.
260
Web Intelligence Rich Client User's Guide
Working with reports
Formatting numbers and dates
Linear and logarithmic axes scales
By default, Web Intelligence displays the Y-axis on charts as a linear scale.
You can set the axis to a logarithmic scale. Logarithmic scales allow you to
examine values that span many orders of magnitude without losing
information on the smaller scales.
In a linear scale, the axis markers are evenly spaced. Linear scales are
based on addition. Consider, for example, the linear sequence: 1, 3, 5, 7, 9
To get the next number in the sequence, you add 2 to the previous number.
Logarithmic scales are based on multiplication rather than addition. In a
logarithmic scale, the steps increase or decrease in size. Logarithmic scales
are based on multiplication (or division). Consider, for example, the
logarithmic sequence: 2, 4, 8, 16, 32
To get the next number in the sequence, you multiply the previous number
by 2. We can say that this sequence represents ``base 2.''
Consider the following sequence: 1, 10, 100, 1000, 10000
This sequence represents ``base 10,'' because you get the next term in the
sequence by multiplying the previous term by 10.
To display the Y Axis logarithmically in the Java Report Panel
1. Right-click the chart and select Edit Format.
2. Open the Appearance > Y Axis > Scale property group in the Properties
tab.
3. Select Logarithmic.
A logarithmic scale uniformly presents percent changes rather than point
changes. In other words, the distance from 1 to 2 (100% increase) is the
same as the distance from 2 to 4 (another 100% increase).
Formatting numbers and dates
Predefined and custom formats
You can change how values display in specific cells or on chart axes. You
do this by applying predefined formats available in Web Intelligence or by
Web Intelligence Rich Client User's Guide
261
10
10
Working with reports
Formatting numbers and dates
creating your own custom formats. You can save your custom formats for
reuse on multiple blocks and reports in the same document.
Predefined formats
You can change how values display in specific cells or on chart axes. You
do this by applying predefined formats available in Web Intelligence or by
creating your own custom formats. You can save your custom formats for
reuse on multiple blocks and reports in the same document.
The following predefined formats are available for cells:
Format
Description
Default
The format defined for the object on
the universe.
Number
Formats for decimal or integer values.
Currency
Formats for currency values.
Date/Time
Date and time formats.
Boolean
Formats for true and false values.
To apply a predefined format
1. Right-click a cell and click Format Number on the shortcut menu.
The "Format Number" dialog box appears.
2. Click a format in the Format Type list.
The available formats for the format type you selected appear in the
Properties pane.
3. Click OK.
Web Intelligence applies the new format to the cell.
262
Web Intelligence Rich Client User's Guide
Working with reports
Formatting numbers and dates
Custom formats
You can use the Custom format type to define a customized number format
for any cell. The following table lists the strings you can use to create custom
formats:
Character(s)
Display(s)
Example
#
The corresponding digit.
If the number has less
digits than the number of
# characters used to
specify the format, no
leading zeros are inserted.
‘12345’ with the format
#,##0 gives ‘12,345’ (if
your locale defines the
grouping separator as a
comma) or ‘12 345’ (if
your locale defines the
grouping separator as a
space)
0
The corresponding digit.
If the number has less
digits than the number of
‘123’ with the format
0 characters used to
#0,000 gives ‘0,123’
specify the format, a
leading zero(s) is inserted
before the number.
,
‘1234567’ with the format
#,##0 gives ‘1,234,567’
(if you locale defines the
The grouping separator grouping separator as a
as defined by your locale. comma) or ‘1 234 567’ (if
your locale defines the
grouping separator as a
non-breaking space)
.
‘12.34’ with the format
#.#0 gives ‘12.34’ (if your
locale defines the decimal
The decimal separator as
separator as a period) or
defined by your locale.
‘12,34’ (if your locale defines the decimal separator as a comma)
Web Intelligence Rich Client User's Guide
263
10
10
Working with reports
Formatting numbers and dates
Character(s)
[%]%
%
Display(s)
Displays a percentage
sign (%) after the result
and multiplies the result
by 100.
The % sign after the result, but does not multiply
the result by 100.
A non-breaking space ( )
1, 2, 3, a, b, c, $, £, €
(and so on)
Example
‘1234567’ with the format
# ##0 gives ‘1234 567’
‘705.15’ with the format
The alphanumeric charac- $#.#0 gives ‘$705.15’ or
ter.
with the format #,#0 €
gives ‘705,15 €’
[Red], [Blue], [Green],
‘150’ with the format
[Yellow], [Gray], [White], The value in the specified
#,##0[Red] gives ‘150’
[Dark Red], [Dark Blue], color.
#,##0[Blue] gives -’150’
[Dark Green]
264
d
The number of the day in
the month with no leading
zeros. If the date for day The first day of a month
is less than two charac- with the format d gives ‘1’
ters, the date displays
without a zero before it.
dd
The number of the day
with leading zeros. If the
The first day of a month
date for day is less than
with the format dd gives
two characters, the date
‘01’
displays with a zero before it.
ddd
The name of the day abMonday’ with the format
breviated. The first letter
ddd gives ‘Mon’
is capitalized.
Web Intelligence Rich Client User's Guide
Working with reports
Formatting numbers and dates
Character(s)
Display(s)
Example
dddd
The name of the day in
‘Monday’ with the format
full. The first letter is capdddd gives ‘Monday’
italized.
dddd dd
The day of the week fol- ‘Monday’ with the format
lowed by a space and the dddd dd gives ‘Monday
number of the day.
01’
M
The number of the month
with no leading zeros. If
the number for month is ‘January’ with the format
less than two characters, M gives '1'
the number displays
without a zero before it.
MM
The number of the month
with leading zeros. If the
number for month is less ‘January’ with the format
than two characters, the MM gives 01
number displays with a
zero before it.
mmm
The name of the month
‘January’ with the format
abbreviated. The first letmmm gives Jan
ter is capitalized.
mmmm
The name of the month
in full. The first letter is
capitalized.
‘January’ with the format
mmmm gives January
yy
The last two digits for
year.
‘2003’ with the format yy
gives ‘03’
yyyy
All four digits for year.
‘2003’ with the format
yyyy gives ‘2003’
Web Intelligence Rich Client User's Guide
265
10
10
Working with reports
Formatting numbers and dates
Character(s)
Display(s)
Example
h:mm:ss a
The hour with no leading
zeros and the minutes
‘21:05:03’ with the format
and seconds with leading
h:mm:ss a gives ‘9:05:03
zeros. The “a” character
PM’
displays AM or PM after
the time.
HH
The hour according to the ‘21:00’ with the format HH
24-hour clock.
gives ‘21’
hh
The hour according to the ‘21:00’ with the format hh
12-hour clock.
gives ‘09’
HH:mm
The hour and minutes
with leading zeros.
HH:mm:ss
The hour, minutes, and ‘7.15 am’ with the format
seconds with leading ze- HH:mm:ss gives
ros.
‘07:15:00’
mm:ss
The minutes, and sec‘07:15:03’ with the format
onds with leading zeros. mm:ss gives ‘15:03’
‘7.15 am’ with the format
HH:mm gives ‘07:15’
To define a custom format
1. Right-click the cell(s) to which you want to apply a custom format.
2. Select Number Format.
The "Number Format" dialog box appears.
3. In the Format Type list, select the format category that corresponds to
the data type in the selected cell.
4. Select the Custom check box.
Text boxes appear for you to type your custom format(s).
5. Select a format listed in the Properties pane, and then edit the selected
format by typing additional characters in one or more text boxes.
For example, if you want to create a custom format for Number values,
type the custom format you want in the Positive, Negative, and Equal
to Zero boxes. If you want to create a custom format for Boolean values,
type the custom format you want in the True and False boxes.
266
Web Intelligence Rich Client User's Guide
Working with reports
Formatting numbers and dates
6. Click Add.
You cannot delete or edit custom formats. To change a custom format,
you need to create a new custom format and apply the new format to the
selected cell(s). Any custom formats not applied to cells in a document
are deleted automatically when you close the Web Intelligence Java
Report Panel.
To apply a custom format
1. Right-click the cell(s) to which you want to apply the custom format.
2. Select Number Format.
The Number Format dialog box appears.
3. Select Custom.
4. The list of custom formats already included in the document appears in
the Properties pane.
5. Select the custom format you want.
6. Click OK.
Web Intelligence applies the custom format to the selected cell(s).
Web Intelligence Rich Client User's Guide
267
10
10
Working with reports
Formatting numbers and dates
268
Web Intelligence Rich Client User's Guide
Web Intelligence error
messages
11
11
Web Intelligence error messages
Web Intelligence HTML (WIH) Error Messages
Web Intelligence HTML (WIH) Error
Messages
Invalid block definition. (WIH 00001)
Cause
You have tried to run the query, or access the Report Filters, Properties, or
Format tab without completing the following criteria:
•
For tables, crosstabs, and forms, you must allocate objects to each field.
•
For all chart types, you must allocate measure objects only to the Y-Axis.
•
For all chart types except pie charts, you must allocate at least one
dimension or detail object to the X-Axis.
•
For all chart types, except pie charts, if you have allocated more than one
object to the Y-Axis, you cannot allocate any objects to the Z-Axis.
•
For pie charts, you can allocate only one measure object to the Y-Axis.
•
For pie charts, you must allocate at least one object to the X-Axis.
Action
Properly allocate the objects to each necessary field, then access the tab
you want or run the query.
This object has already been inserted. (WIH 00002)
Cause
You cannot insert the same object more than once in a query.
Action
Choose another object, or run the query with the object you have selected.
270
Web Intelligence Rich Client User's Guide
Web Intelligence error messages
Web Intelligence HTML (WIH) Error Messages
This filter has already been inserted. (WIH 00003)
Cause
You cannot insert the same predefined filter more than once in a query.
Action
Choose another predefined filter, or run the query with the predefined filter
you have already selected.
This document includes advanced formatting that requires the Java Report
Panel. (WIH 00004)
Cause
You have tried to open a document created in the Java Report Panel
containing one of the following elements:
•
more than one report
•
more than one report block
•
filters defined for either a section or report block
•
a non-embedded section
•
more than three freestanding cells in the page header or footer
•
more than one freestanding cell in the top of the report
•
more than one freestanding cell in each section of the report
Action
Open the document with the Java Report Panel.
Web Intelligence Rich Client User's Guide
271
11
11
Web Intelligence error messages
Web Intelligence HTML (WIH) Error Messages
Cannot insert measures on the X-Axis. (WIH 00005)
Cause
You cannot insert a measure on the X-Axis of a chart. You can only insert a
measure on the Y-Axis.
Action
Insert the measure on the Y-Axis.
Cannot insert dimensions or details on the Y-Axis. (WIH 00006)
Cause
You cannot insert a dimension or detail on the Y-Axis of a chart. You can
only insert a measure on the Y-Axis.
Action
Insert the dimension or detail on either the X- or Z-Axis.
Cannot insert measures on the Z-Axis. (WIH 00007)
Cause
You cannot insert a measure on the Z-Axis of a chart. You can only insert a
measure on the Y-Axis.
Action
Insert the measure on the Y-Axis.
272
Web Intelligence Rich Client User's Guide
Web Intelligence error messages
Web Intelligence HTML (WIH) Error Messages
You must insert a result object before choosing another tab. (WIH 00008)
Cause
You tried to access another tab without inserting objects to the report.
Action
Insert one or more objects to the report in the Universe Objects pane in the
Query tab.
You cannot create a section using a measure. (WIH 00009)
Cause
You can only create sections on dimensions. For example, you can create
sections for time periods, geographies, product categories, customers and
so on. You cannot create sections on measures, for example, sales revenue,
margin, or unit sold.
Action
Select a dimension to create a section.
You cannot insert dimension or detail objects on the Z-axis of this type of
chart. (WIH 00010)
Cause
You can only insert measure objects on the Z-axis of this chart type.
Action
Select a measure for the Z-axis.
Web Intelligence Rich Client User's Guide
273
11
11
Web Intelligence error messages
Web Intelligence HTML (WIH) Error Messages
You cannot insert dimension or detail objects on the X-axis of this type of
chart. (WIH 00011)
Cause
You can only insert measure objects on the X-axis of this chart type.
Action
Select a measure for the X-axis.
Report names cannot be blank. Close this dialog box and then enter a name
for the report. (WIH 00012)
Cause
All reports in a document need to be named.
Action
Type a name for this report in the Name text box displayed in either the
Rename or Insert Report dialog box.
Tip: To launch these dialog boxes:
•
Go to the HTML Report Panel Report tab, and then click the link in the
Current Report section of the options, which says: To manage reports in
this document, click here.
•
Select a report, and then click rename to display the Rename dialog box.
The document could not be saved. (WIH 00014)
Cause
Web Intelligence was unable to save the document to the repository. This
error can occur for a number of reasons. For example: you do not have the
security rights to the folder where you tried to save the document.
274
Web Intelligence Rich Client User's Guide
Web Intelligence error messages
Web Intelligence Java Report Panel (WIJ) Error Messages
Action
See your BusinessObjects Administrator to determine why you could not
save the document.
Web Intelligence Java Report Panel (WIJ)
Error Messages
Web Intelligence Java Report Panel error messages include the following:
Range
Category
WIJ 10000 - WIJ 77779
Web Intelligence Java Report Panel
You need to use the Formula Editor to create a formula. (Error: WIJ 10000)
Cause
You typed a formula into a cell using the Cell Properties panel instead of the
Formula Editor.
Action
Launch the Formula Editor and define the formula in the Formula Definition
pane.
You cannot create a variable that has the same name as an existing document
object. Give the new variable a different name. (Error: WIJ 10001)
Cause
A single Web Intelligence document cannot contain multiple objects or
variables with the same name.
Web Intelligence Rich Client User's Guide
275
11
11
Web Intelligence error messages
Web Intelligence Java Report Panel (WIJ) Error Messages
Action
To save a new variable, give the variable a name that is different from the
objects and variables already included in the document.
You cannot position this report component in relation to\na block, cell, or
section that is positioned relative\nto this report component. Select a different
block,\ncell or section in the \"Relative to...of\" dropdown\nlist or unselect
the \"Relative to\" option. (Error: WIJ 10500)
Cause
When you position a report component in relation to another report component
that references the selected one, you create a circular attachment.
Action
Select a different block, cell, or section in the Relative to...of: dropdown list.
Alternatively, unselect the Relative to: option for the selected report
component.
The Web Intelligence Java Report Panel requires the Java Runtime
Environment (JRE) 1.4.2_01. The currently installed JRE is {0}. Contact your
Business Objects administrator to upgrade to 1.4.2_01 or select the [default
VM] entry in the [Java Plug-in Control Panel], if you already have the required
version installed. (Error: WIJ 11111)
Cause
When you use the Web Intelligence Java Report Panel, a Java applet is
installed on your local PC. The Java Runtime Environment 1.4.2_01 (or later
version) needs to be installed and selected in order for the report panel to
function.
Action
If Java Runtime Environment 1.4.2_01 (or later version) is already installed
on your PC, then launch the Java Plugin Control panel. To do this:
276
Web Intelligence Rich Client User's Guide
Web Intelligence error messages
Web Intelligence Java Report Panel (WIJ) Error Messages
•
Select the Windows menu: Start>Settings>Control Panel.
•
Double-click Java Plug-in.
•
On the Advanced tab, select Use Java Plug-in Default, then click Apply.
Or
Contact your Business Objects administrator, and request help with installing
Java Runtime Environment 1.4.2_01 (or later version).
An error occurred while the document was being decoded. Try to open the
document in InfoView. If this doesn't work, see your Business Objects
administrator. (Error: WIJ 20000)
Cause
Web Intelligence cannot decode and open the document in the Java Report
Panel.
Action
Open the document in InfoView by clicking the document title where the
document is listed on the InfoView Corporate Documents or Personal
Documents page.
If this does not work, see your BusinessObjects administrator.
An unexpected problem occurred when Web Intelligence tried to refresh the
document data and open the document.\nThe data source has been modified
or deleted, or a prompt on the document has no value selected. (Error: WIJ
20001)
Cause
The document has the Refresh on open option selected. One or more of the
following explanations can account for this error:
•
The data source has been modified since the document was created.
•
The data source has been deleted since the document was created.
Web Intelligence Rich Client User's Guide
277
11
11
Web Intelligence error messages
Web Intelligence Java Report Panel (WIJ) Error Messages
•
One or more prompts have no values selected.
Action
See your BusinessObjects administrator.
Unexpected error\nIf you cannot reconnect to the server, close Web
Intelligence and start again. (WIJ 20002)
Cause
The server may be down or your user session may be closed.
Action
See your BusinessObjects administrator.
Unable to get the first page of the current report - Web Intelligence will switch
to structure view (WIJ 20003).
Cause
The report contains structural errors. This means that Web Intelligence cannot
decode the report and display the results.
Action
Do one of the following:
278
•
View the report in Structure View and verify the report structure. For
example, errors can be caused if report blocks overlap or if the structure
of a table contains cells that create an asymmetrical table format. Modify
the report structure appropriately.
•
Contact your administrator and request them to search for structural
anomalies in the report.
Web Intelligence Rich Client User's Guide
Web Intelligence error messages
Web Intelligence Java Report Panel (WIJ) Error Messages
The query in this document is empty. Check that the Result Objects pane on
the query tab includes objects before running the query (ERR WIJ 30000).
Cause
If the query does not contain any objects, Web Intelligence cannot run the
query and retrieve data from the database.
Action
Edit the query and add the appropriate objects to the Query pane.
At least one query in this document is empty. Check that the Result Objects
pane on each query tab includes objects before running the queries (ERR
WIJ 30001).
Cause
If a query does not contain any objects, Web Intelligence cannot run the
query and retrieve data from the database. This is the case even if the
document contains multiple queries.
Action
Go to the Query pane and verify each Query tab. Add the appropriate objects
to the Query tab that is empty.
Out of memory.\nReduce the browser window size or re-launch the report
panel. (Error: WIJ 30003).
Cause
Your computer has run out of the memory necessary to operate the Web
Intelligence Java Report Panel. This may be because your browser window
size is too large.
Web Intelligence Rich Client User's Guide
279
11
11
Web Intelligence error messages
Web Intelligence Java Report Panel (WIJ) Error Messages
Action
Do one of the following:
•
Use your cursor to reduce the size of the browser window displaying the
Java Report Panel.
•
Go back to the InfoView browser window and re-launch the Java Report
Panel, by opening an existing document or by creating a new document.
Your user profile does not allow you to save personal or corporate documents.
Contact your Business Objects administrator (ERR WIJ 40001).
Cause
Your user profile, defined by your administrator, does not allow you to save
personal or corporate documents.
Action
If you think you need to be allowed to save personal documents and/or
corporate documents to InfoView, contact your Business Objects administrator
to request they modify your security profile.
An unexpected error occurred. Contact your Business Objects administrator
with details of the actions you performed before the error occurred. (Error:
WIJ 44444)
Cause
This message appears when an unexpected error occurs that Web
Intelligence cannot analyze.
Action
Provide your BusinessObjects administrator with details of how the error
occurred. Your administrator will need to activate the tracing in order to find
an explanation and solution for this error. Full information about system
tracing is available in the System Administrator's Guide for Windows and the
System Administrator's Guide for UNIX.
280
Web Intelligence Rich Client User's Guide
Web Intelligence error messages
Web Intelligence Java Report Panel (WIJ) Error Messages
The information sent to the server contains invalid character(s).\n Use the
Undo button to cancel the latest changes to the document and then retry.
(Error: WIJ 55555)
Cause
Web Intelligence sends information on the document format and data
definition to the server in XML code in order to render the document and the
results. This error means that there is an error in the XML.
Action
Use the Undo button on the report panel toolbar to remove the erroneous
modification made to the document, and then run the query or refresh the
document again.
Web Intelligence cannot retrieve this document due to a server problem or
an error in the document structure. See your Business Objects administrator.
(Error: WIJ 77777).
Cause
The Web Intelligence Java Report Panel cannot retrieve the document
because the server is down.
Action
See your BusinessObjects administrator.
Your Web Intelligence session has timed out. Log out and log in again to
InfoView. (Error: WIJ 77778)
Cause
You have remained logged in to InfoView without using Web Intelligence for
longer than the maximum time allowed by the Business Objects system.
Web Intelligence Rich Client User's Guide
281
11
11
Web Intelligence error messages
Web Intelligence Server (WIS) Error Messages
Action
Log out and then log back into InfoView to continue using Web Intelligence
(you will lose any unsaved modifications you made previous to timeout).
To increase the length of time you are allowed to remain logged in to InfoView
without using Web Intelligence, ask your BusinessObjects administrator to
increase your session timeout parameter.
Web Intelligence Server (WIS) Error
Messages
Web Intelligence Server error messages include the following:
Range
Category
WIS 00001 - WIS 40000
Web Intelligence Server
Some objects are no longer available in the universe. (WIS00001)
Cause
One or more objects in a universe are no longer available to a document.
Action
Delete the objects from the query that seem to be missing. The available
objects are listed on the Data tab. Rebuild the query without the obsolete
objects.
282
Web Intelligence Rich Client User's Guide
Web Intelligence error messages
Web Intelligence Server (WIS) Error Messages
Some objects are not available to your user profile. You cannot refresh this
document. See your Business Objects administrator. (Error: WIS 00002)
Cause
You do not have the correct user rights to access the data for one or more
objects included in a query. As you are not permitted to access the data for
these objects, you cannot refresh the report.
Action
Ask your BusinessObjects administrator to change your user profile to make
these objects accessible.
Some pre-defined filters are no longer available in the universe. (WIS00003)
Cause
One or more predefined filters are no longer available in the universe.
Predefined filters are condition objects that are predefined WHERE clauses.
You use these to restrict the data returned in a query.
Action
Remove the predefined filters from the query, and manually create the same
condition in the query by using the appropriate operators and operands.
Some database tables are no longer available in the universe. See your
Business Objects administrator. (Error: WIS 00004)
Cause
One or more database tables referenced by objects in the universe are no
longer available. The tables may have been renamed, or removed from the
database.
Web Intelligence Rich Client User's Guide
283
11
11
Web Intelligence error messages
Web Intelligence Server (WIS) Error Messages
Action
The universe designer can update the universe structure by selecting View
> Refresh Structure in Designer.
Invalid Prompt definition. See your BusinessObjects administrator. (WIS00005)
Cause
The syntax in the prompt is not valid, or the prompt makes reference to an
object that no longer exists in the universe.
Action
The universe designer can verify that the prompt syntax is correct, and check
that all objects referenced in the prompt exist.
Invalid Aggregate Aware definition. See your Business Objects administrator.
(Error: WIS 00006)
Cause
One or more objects in the query use the aggregate aware function in their
definition. The syntax for the aggregate aware function is not valid.
Action
The universe designer must verify that the aggregate aware syntax is correct.
A filter contains a wrong value. You cannot run this query. (WIS00007)
Cause
The filter has a wrong operand. For example, a filter with an empty constant,
or a filter that deals with numeric values is defined with an alphanumeric
value.
284
Web Intelligence Rich Client User's Guide
Web Intelligence error messages
Web Intelligence Server (WIS) Error Messages
Action
Verify the filter syntax.
The query cannot run, because it contains incompatible objects. See your
Business Objects administrator. (Error: WIS 00008)
Cause
The query contains objects that return data sets that can not be combined
or synchronized. This can be due to parameters that have not been set in
the universe to allow multiple SQL statements for each context, or multiple
SQL statements for each measure.
Action
The universe designer can do the following:
•
Select the options Multiple SQL statements for each context and Multiple
SQL statements for each measure. These are on the SQL page of the
Universe Parameters dialog box.
•
Create a new context that includes the incompatible objects.
The query cannot run as an advanced filter contains an incompatible object.
See your BusinessObjects administrator. (WIS00009)
Cause
The advanced filter is a subquery. You can not combine incompatible objects
in a sub query.
Action
Change the advanced filter definition to use only compatible objects.
Web Intelligence Rich Client User's Guide
285
11
11
Web Intelligence error messages
Web Intelligence Server (WIS) Error Messages
The universe does not allow using a complex expression in a GROUP BY
statement. You cannot run this query. See your BusinessObjects administrator.
(WIS00010)
Cause
A query contains a GROUP BY clause that uses formulas or aliases. The
universe does not allow these expressions in GROUP BY clauses. The
behavior is determined by the parameter
<Parameter Name="GROUPBY_EXCLUDE_COMPLEX">Y</Parameter>
in the PRM file for the target RDBMS.
Action
You have two solutions:
•
Modify the query so that objects using formulas or aliases are not included
in the query.
•
A universe designer can open the PRM file for the target RDBMS and
change the value for the parameter GROUPBY_EXCLUDE_COMPLEX
to N. This change should be made only if you are sure that your RDBMS
supports complex GROUP BY expressions.
The object(s): {obj_list} contain multiple attributes. This syntax is no longer
supported in this version. See your Business Objects administrator. (Error:
WIS 00011)
Cause
One or more objects in the query use a comma (",") instead of a concatenation
operator in their definition. This syntax is no longer supported for current
versions.
Action
The universe designer has three options:
286
Web Intelligence Rich Client User's Guide
Web Intelligence error messages
Web Intelligence Server (WIS) Error Messages
•
Redefine the objects that use the comma to concatenate the data for two
objects. You can use the standard concatenation operator for your
RDBMS.
•
If you do not want to redefine the objects, you can add the following line
to the PRM file for the target RDBMS:
<Parameter Name = "REPLACE_COMMA_BY_SEPARATOR"=Y>
This will enable the comma to be accepted syntax for concatenation in
object definitions.
•
Set the value of REPLACE_COMMA_BY_CONCAT to "Yes" in the
universe.
You can not run this query as it will produce a Cartesian product. See your
BusinessObjects administrator. (WIS00012)
Cause
The query will produce a Cartesian product. This is a result set that contains
all possible combinations of rows from the tables inferred by objects in the
query. This is rarely a correct result. Parameters have been set in the universe
to prevent Cartesian products.
Action
The universe designer has two options:
•
Modify the universe table schema to include the appropriate joins and
restrictions to prevent the possible occurrence of a Cartesian product.
•
If Cartesian products are acceptable in your business context, then from
Designer, set the Cartesian Products option to Warn. This option is on
the SQLl page of Universe Parameters dialog box. The user will be
warned, but the production of a Cartesian product will not be prevented.
Web Intelligence Rich Client User's Guide
287
11
11
Web Intelligence error messages
Web Intelligence Server (WIS) Error Messages
SQL generation failed. See your BusinessObjects administrator. (WIS00013)
Cause
Error occurs during SQL generation of the query. This can be due to a number
of reasons; for example the query doesn't involve any table in the database.
Action
Ask your BusinessObjects administrator to check the SQL associated with
the objects involved in the query.
Aggregate aware resolution failed. (WIS00014)
Cause
The query objects exclude all possible SQL choices for an aggregate aware
function.
Action
The universe designer can remove the incompatibility between the objects
in Designer. Select Tools > Aggregate Navigation and remove the
incompatibility for the concerned objects.
Multiple query filters contain a prompt with the same text, but the prompts
use a different operand type or operator count of values. (Error: WIS 00015)
Cause
The query has multiple prompts that display the same message. Web
Intelligence combines prompts with the same message and displays the
prompt once. If the operator defined for some of these prompts requires you
to enter one value while the operator in other prompts with the same message
requires you to enter multiple values, Web Intelligence cannot combine the
prompt.
288
Web Intelligence Rich Client User's Guide
Web Intelligence error messages
Web Intelligence Server (WIS) Error Messages
Action
You need to modify the definition of the prompts. How you do this depends
on how you are viewing the document:
•
Via InfoView -- click the Edit link, and then use the Web Intelligence report
panel options to modify the prompts. For more information on how to do
this, refer to the Building Reports Using the Java Report Panel or Building
Reports Using the HTML Report Panel guide.
•
In the Web Intelligence Java Report Panel -- go to Query View by clicking
Edit Query in the report panel toolbar, and then double-click the prompts
you want to edit and select operators for each prompt. For more
information on how to do this, refer to the Building Reports Using the Java
Report Panel or Building Reports Using the HTML Report Panel guide.
Example:
The operators you define for the prompts with the same message text must
all require one of the following:
•
one value (for example: Equal to, Different from, Greater than, Greater
than or equal to, Less than, Less than or equal to, Except.)
•
multiple values when the prompt is answered (for example: Between,
Not between, In list, Not in list, Matches pattern, Different from pattern,
Both.)
The Query contains an @script() function, which is not supported. See your
BusinessObjects administrator. (WIS00016)
Cause
The SQL generated by the query for this document includes an @Script()
function, which is not supported.
Action
Your administrator will need to remove the @Script in the universe selected
for this document.
Web Intelligence Rich Client User's Guide
289
11
11
Web Intelligence error messages
Web Intelligence Server (WIS) Error Messages
The following objects cannot be used as Result Objects: {0}. (WIS00017)
Cause
The query definition for this document includes objects in the Result Objects
pane that cannot be used in queries.
Action
Do one of the following:
•
Go to Query View by clicking the Edit Query button on the report panel
toolbar, and then remove the listed objects from the Result Objects pane.
•
Contact your BusinessObjects administrator and request the ability to
include the listed objects in the Result Objects defined for the query.
The following objects cannot be used as Query Filters: {0}. See your
BusinessObjects Designer to resolve the conditional object. (WIS00018)
Cause
The query definition for this document includes objects in the Query Filters
pane that cannot be used in query filters.
Action
Do one of the following:
290
•
Go to Query View by clicking the Edit Query button on the report panel
toolbar, and then remove the listed objects from the Query Filters pane.
•
Contact your BusinessObjects administrator and request the ability to
include the listed objects in filters defined on the query
Web Intelligence Rich Client User's Guide
Web Intelligence error messages
Web Intelligence Server (WIS) Error Messages
A query filter object contains too many values for the object to be used in a
query filter. (Error: WIS 0019) (WIS 00019)
Cause
Too many values were selected in the query filter
Action
Select fewer values
The SQL generated by the query is invalid. (WIS00020)
Cause
The SQL generated by the query is invalid
Action
Verify the query and the generated SQL
This combined query is too complex. One of the queries contains incompatible
objects. (WIS00021)
Cause
One of the queries in the combined queries contains incompatible objects
Action
Remove the incompatible objects
Web Intelligence Rich Client User's Guide
291
11
11
Web Intelligence error messages
Web Intelligence Server (WIS) Error Messages
The query does not reference any table. (WIS00022)
Cause
The query does not reference a database table
Action
Modify the query to reference a table
Invalid sub-query filter. Either data cannot be retrieved (null) or no result
objects are defined (Error: WIS 00023)
Cause
The sub-query contains an invalid filter that returns null data
Action
Modify the sub-query filter
Incompatible object types in the sub-query filter (WIS00024)
Cause
The sub-query filter contains incompatible object types
Action
Modify the sub-query filter
The query is too complex to apply a sampling function. When the function is
applied, no SQL is generated so query aborts. Try to simplify your query (
292
Web Intelligence Rich Client User's Guide
Web Intelligence error messages
Web Intelligence Server (WIS) Error Messages
such as, combined query, or query with JOIN or SYNCHRO operators) (Error:
WIS 00025)
Cause
<cause here>
Action
<action here>
Failed to regenerate SQL for optional prompts: one or more requred prompts
were skipped. (WIS00026)
Cause
<cause here>
Action
<action here>
Removing skipped prompts from the query will introduce new prompts. This
introduces complexities that cannot be supported. (Error: WIS 00027)
Cause
""action=""
Action
""
Web Intelligence Rich Client User's Guide
293
11
11
Web Intelligence error messages
Web Intelligence Server (WIS) Error Messages
You must specify a value for the Keydate parameter. (WIS 00028)
Cause
A value was not specified for the Keydate.
Action
Specify a value for the Keydate.
The universe is already open with write permission by another user. (WIS
00029)
Cause
"action="
Action
Universe not found. See your Business Objects administrator. (Error: WIS
00501)
Cause
The universe used to refresh the document is not available; for example the
universe does not exist, or has been moved.
Action
The universe designer can check that the universe is present in the repository,
and is accessible to the connection. If you are dealing with a linked universe,
check that the links are still valid.
Contact your BusinessObjects administrator with this information.
294
Web Intelligence Rich Client User's Guide
Web Intelligence error messages
Web Intelligence Server (WIS) Error Messages
User rights not found. See your Business Objects administrator. (Error: WIS
00502)
Cause
You cannot retrieve the list of user rights from the repository. This may be
because the server which hosts the repository is down or the network
connection is not working.
Action
Verify the network connection by "pinging" the server. If the network is running
properly, the database administrator should then use database middleware
(such as Net8 for Oracle) to check if there is any response from the repository
database.
You are not authorized to access the universe {0}. See your BusinessObjects
Universe Designer or administrator to request rights. (WIS00503)
Cause
Your user profile has the current universe as "Disabled." This user profile
parameter is set by your administrator.
Action
Contact your administrator to request a modification to your user profile, so
that you can access this universe.
You do not have the right to access data for this universe. See your
BusinessObjects Universe Designer or administrator to request rights.
(WIS00504)
Cause
You do not have the right to access data in the universe
Web Intelligence Rich Client User's Guide
295
11
11
Web Intelligence error messages
Web Intelligence Server (WIS) Error Messages
Action
See your Business Objects adminsitrator for data access rights to the universe
You do not have the right to access data for this universe connection. See
your BusinessObjects Universe Designer or administrator to request rights.
(WIS00505)
Cause
You do not have the right to view data provided by the universe connection.
Action
Ask your Business Objects administrator to grant you the right to view the
data.
Could not download the universe {unv_name} from the CMS for the following
reason: {cachemgr_errmsg}. See your Business Objects administrator for
further information. (Error: WIS 00506)
Cause
The universe could not be downloaded.
Action
See your Business Objects administrator.
You do not have the right to access data for this core universe. See your
BusinessObjects Universe Designer or administrator to request rights.
(WIS00507)
Cause
You do not have the right to access the data in the universe.
296
Web Intelligence Rich Client User's Guide
Web Intelligence error messages
Web Intelligence Server (WIS) Error Messages
Action
See your Business Objects administrator.
Single Sign On is not supported on unix platforms. (WIS00508)
Cause
You cannot use Single Sign On on the Unix platform.
Action
See your Business Objects administrator.
Universe data connection could not be found. The connection has been
deleted or you don't have the right to use it. (WIS00509)
Cause
The universe data connection is not available
Action
See your Business Objects administrator
The system cannot generate the SQL for this query because one of its objects
is based on a derived table (table_name) that contains a loop in its definition.
Please contact your administrator for more details. (WIS 00510)
Cause
Web Intelligence cannot generate the query SQL.
Action
See your Business Objects administrator.
Web Intelligence Rich Client User's Guide
297
11
11
Web Intelligence error messages
Web Intelligence Server (WIS) Error Messages
The system cannot generate the SQL for this query because one of its objects
is based on a derived table (table_name) that is unknown. Please contact
your administrator for more details. (WIS 00511)
Cause
Web Intelligence cannot generate the query SQL.
Action
See your Business Objects administrator.
The system cannot generate the SQL for this query because one of its objects
is based on a derived table (table_name) with an incorrect definition. Please
contact your administrator for more details. (WIS 00512)
Cause
Web Intelligence cannot generate the query SQL.
Action
See your Business Objects administrator.
Syntax error in formula '%1%' at position %2%. (WIS 10001)
Cause
There is a syntax error in your formula at the position indicated.
Action
Correct the formula syntax.
298
Web Intelligence Rich Client User's Guide
Web Intelligence error messages
Web Intelligence Server (WIS) Error Messages
Problem initializing the dictionary of functions. (WIS 10002)
Cause
Web Intelligence could not initialize the dictionary of functions.
Action
See your Business Objects administrator.
The object '%1%' at position '%2%' is not unique in the report. (WIS 10005)
Cause
The object {object} has a name that conflicts with the name of another object
in the report.
Action
Use the fully-qualified name for {object}.
The object '%1%' at position '%2%' does not exist in the report. (WIS 10006)
Cause
The formula refers to an object that no longer exists in the report.
Action
Remove the reference to the object from the formula.
Web Intelligence Rich Client User's Guide
299
11
11
Web Intelligence error messages
Web Intelligence Server (WIS) Error Messages
Unexpected empty expression after '='. (WIS 10009)
Cause
A formula contains an empty expression after an '=' operator.
Action
Supply an expression after the '=' operator.
The number '%1%' at position '%2%' has a format that is incompatible with
your regional settings. (WIS 10012)
Cause
The format of the number {number} is not compatible with your regional
settings.
Action
Change the number format to conform with the format permitted by your
regional settings.
The integer '%1%' at position '%2%' is too long. (WIS 10013)
Cause
An integer in a formula exceeds the Web Intelligence limit.
Action
Edit the formula.
300
Web Intelligence Rich Client User's Guide
Web Intelligence error messages
Web Intelligence Server (WIS) Error Messages
The number '%1%' at position '%2%' has a format that is incompatible with
your regional settings. (WIS 10014)
Cause
The format of the real number {number} is not compatible with your regional
settings.
Action
Change the number format to conform with the format permitted by your
regional settings.
Missing quotation mark after '%1%' at position '%2%'. (WIS 10016)
Cause
There is a missing closing quotation mark in the formula.
Action
Add the closing quotation mark.
The object name '%1%' at position '%2%' is ambiguous. (WIS 10019)
Cause
A formula contains an object name that is ambiguous.
Action
Use the fully-qualified object name (qualify the object name with its class)
to remove the ambiguity.
Web Intelligence Rich Client User's Guide
301
11
11
Web Intelligence error messages
Web Intelligence Server (WIS) Error Messages
Empty list of Identifier is not allowed in this input/output context. (WIS 10032)
Cause
The list of dimensions in the input or output context must not be empty.
Action
Update the input or output context.
The variable '%1%' cannot be deleted because it has dependant formulas or
variables linked to: '%2%' (WIS 10033)
Cause
The variable cannot be deleted because it is referenced by other variables
or formulas.
Action
Delete the dependent formulas/variables before deleting the variable.
The variable '%1%' already exists. (WIS 10034)
Cause
You attempted to create a variable or update a variable name using a variable
name that already exists.
Action
Choose a variable name that does not already exist.
302
Web Intelligence Rich Client User's Guide
Web Intelligence error messages
Web Intelligence Server (WIS) Error Messages
The date or time format '%1%' at position '%2%' is not valid. (WIS 10035)
Cause
The formula contains an invalid date/time format (for example, "bb/MM/yyyy").
Action
Specify a valid date/time format in the formula.
The expression or sub-expression at position '%2%' is not valid. (WIS 10036)
Cause
The formula contains an invalid expression/sub-expression.
Action
Specify a valid expression/sub-expression.
The expression or sub-expression at position '%2%' in the '%1%' function
uses an invalid data type. (WIS 10037)
Cause
An expression contains an invalid data type. (For example, you have
attempted to pass a string to a function that requires a date.)
Action
Use a valid data type in the expression.
Web Intelligence Rich Client User's Guide
303
11
11
Web Intelligence error messages
Web Intelligence Server (WIS) Error Messages
Invalid character '%1%' in variable name at position '%2%'. (WIS 10038)
Cause
The character {character} is not valid in the variable name.
Action
Remove {character} from the variable name.
The context of the measure '%1%' at position '%2%' is not valid. (WIS 10039)
Cause
The calculation context of {measure} is not valid.
Action
Specify a valid context.
The formula for variable '%1%' contains a reference to a variable with the
same short name. You must use the fully-qualified variable name in the formula
to remove this ambiguity. (WIS 10040)
Cause
The formula of a variable references another variable with the same short
name.
Action
Use the fully-qualified variable name.
304
Web Intelligence Rich Client User's Guide
Web Intelligence error messages
Web Intelligence Server (WIS) Error Messages
Incorrect use of multiple comparison operators (<,>,<>,<=,>=,=) at position
'%2%'. (WIS 10041)
Cause
The formula uses multiple comparison operators incorrectly (for example:
if(1<2=3;0;-1)).
Action
Re-structure the formula to avoid using comparison operators incorrectly.
There is a circular reference because the formula for variable '%1%' references
a variable whose formula references '%1%'. (WIS 10042)
Cause
A formula contains a circular reference.
Action
Remove the circular reference.
There is no opening parenthesis after function '%1%' at position %2%. (WIS
10060)
Cause
The opening parenthesis is missing after a function name.
Action
Supply the opening parenthesis.
Web Intelligence Rich Client User's Guide
305
11
11
Web Intelligence error messages
Web Intelligence Server (WIS) Error Messages
The function '%1%' has missing arguments or closing parenthesis at position
%2%. (WIS 10061)
Cause
Arguments or a closing parenthesis are missing from the formula.
Action
Supply the arguments or closing parenthesis.
Missing ';' before argument in function '%1%' at position %2%. (WIS 10062)
Cause
A semicolon is missing from the formula.
Action
Supply the semicolon.
Missing ';' or closing parenthesis in function '%1%' at position %2%. (WIS
10063)
Cause
A semicolon or closing parenthesis is missing from the function.
Action
Supply the semicolon or closing parenthesis.
306
Web Intelligence Rich Client User's Guide
Web Intelligence error messages
Web Intelligence Server (WIS) Error Messages
Missing ';' or closing parenthesis in list '%1%' at position %2%. (WIS 10064)
Cause
A semicolon or closing parenthesis is missing from the formula.
Action
Supply the semicolon or closing parenthesis.
Missing closing parenthesis in function '%1%' at position %2%. (WIS 10065)
Cause
A closing parenthesis is missing from the formula.
Action
Supply the closing parenthesis.
Missing aggregate operator or closing parenthesis in function '%1%' at
position %2%. (WIS 10066)
Cause
A closing parenthesis or aggregate operator is missing from the formula.
Action
Supply the closing parenthesis or aggregate operator.
Web Intelligence Rich Client User's Guide
307
11
11
Web Intelligence error messages
Web Intelligence Server (WIS) Error Messages
Missing operator or closing parenthesis in '%1%' at position %2%. (WIS 10067)
Cause
An operator or closing parenthesis is missing from the formula.
Action
Supply the operator or closing parenthesis.
Missing list element in '%1%' at position %2%. (WIS 10068)
Cause
to do
Action
to do
Missing object identifier in '%1%' at position %2%. (WIS 10069)
Cause
to do
Action
to do
Missing or bad operand in '%1%' expression at position %2%. (WIS 10070)
Cause
to do
308
Web Intelligence Rich Client User's Guide
Web Intelligence error messages
Web Intelligence Server (WIS) Error Messages
Action
to do
Incorrect calculation context %1%' at position %2%. (WIS 10071)
Cause
to do
Action
to do
Incorrect reset context at position %2%. (WIS 10072)
Cause
The formula contains an incorrect reset context.
Action
Correct the reset context.
Invalid Where clause in function '%1%' : a dimension is missing at position
%2%. (WIS 10073)
Cause
The Where clause of the formula is invalid because a dimension is missing.
Action
Add the missing dimension to the Where clause.
Web Intelligence Rich Client User's Guide
309
11
11
Web Intelligence error messages
Web Intelligence Server (WIS) Error Messages
The object '%1%' at position %2% is incompatible. (WIS 10076)
Cause
to do
Action
to do
The object '%1%' at position %2% is incompatible. (WIS 10077)
Cause
to do
Action
to do
Invalid character '%1%' at position %2%. (Error: WIS 10080)
Cause
to do
Action
to do
Invalid string '%1%' at position %2%. (WIS 10082)
Cause
to do
310
Web Intelligence Rich Client User's Guide
Web Intelligence error messages
Web Intelligence Server (WIS) Error Messages
Action
to do
The qualification of the variable '%1%' cannot be changed. (WIS 10083)
Cause
to do
Action
to do
Your database server does not support the Both and Except operators. (WIS
10701)
Cause
The database on which this document is based does not support the Both
and Except operators. This means that you cannot use the Both operator or
the Except operator when you define filters on the query.
Action
Return to Query View by clicking the Edit Query button on the report panel
toolbar, then do one of the following:
•
Remove the filter from the Query Filters pane.
•
Double-click the filter on the Query Filters pane, and then select a different
operator for the filter.
Tip: If the Query Filters pane is not visible in Query View, click the Show/Hide
Filter Pane button on the Query View toolbar.
Web Intelligence Rich Client User's Guide
311
11
11
Web Intelligence error messages
Web Intelligence Server (WIS) Error Messages
A filter is defined on an object that is incompatible with the objects selected
on the Result Objects pane. (WIS 10702)
Cause
One of the query filters is defined on an object which is incompatible with all
the objects selected on the Results Objects pane.
Action
Return to Query View by clicking the Edit Query button on the report panel
toolbar, then do one of the following:
•
Remove the filter from the Query Filters pane.
•
Remove the objects from the Result Objects pane.
Tip: If the Query Filters pane is not visible in Query View, click the Show/Hide
Filter Pane button on the Query View toolbar.
The numeric value for the query filter based on '{object}' is invalid . (WIS
10703)
Cause
You specified an invalid numeric value for a query filter.
Action
Edit the query filter and specify a valid numeric value.
The date for the query filter based on '{object}' is invalid . (WIS 10704)
Cause
You specified an invalid date for a query filter.
312
Web Intelligence Rich Client User's Guide
Web Intelligence error messages
Web Intelligence Server (WIS) Error Messages
Action
Edit the query filter and specify a valid date.
The prompt '{prompt}' contains an invalid numeric value. (WIS 10705)
Cause
You specified an invalid numeric value for a prompt.
Action
Specify a valid numeric value.
The date for the prompt '{prompt}' is invalid. (WIS 10706)
Cause
You specified an invalid date for a prompt.
Action
Edit the prompt and specify a valid date.
The server cannot build the SQL for the query. (WIS 10707)
Cause
Your query cannot be converted to SQL to run against the database.
Action
Reformulate the query or see your Business Objects administrator.
Web Intelligence Rich Client User's Guide
313
11
11
Web Intelligence error messages
Web Intelligence Server (WIS) Error Messages
You do not have the right to refresh this document. (WIS 10801)
Cause
Your user profile does not permit you to view data for one of the objects
included in the query for this document.
The security level for objects is set by the Business Objects administrator at
your organization, using the universe design tool Designer. When the
object-level security for objects in a query is different from the security level
specified in your user profile you cannot refresh the document data.
Action
Do one of the following:
•
Cancel the refresh.
•
Request your administrator to modify your user profile, so that you can
access data for objects with higher levels of security.
The query SQL has {nbHaving} instead of {nbWanted} columns.(WIS 10810)
Cause
to do
Action
to do
Column ({nCol}) has an invalid type. (WIS 10811)
Cause
to do
314
Web Intelligence Rich Client User's Guide
Web Intelligence error messages
Web Intelligence Server (WIS) Error Messages
Action
to do
CustomSQL can not containt optional prompts. (WIS 10812)
Cause
Optional prompts are not supported in custom SQL.
Action
Remove the optional prompts.
Incompatible objects cannot be used in combined queries. (WIS 10820)
Cause
A combined query contains incompatible objects.
Action
Edit the combined query and remove the incompatible objects.
A subquery in the '{dp_name}' data provider has missing objects. (WIS 10830)
Cause
Objects necessary to generate query SQL are missing from a subquery in
the {dp_name} data provider.
Action
Edit the subquery and add the missing objects.
Web Intelligence Rich Client User's Guide
315
11
11
Web Intelligence error messages
Web Intelligence Server (WIS) Error Messages
The filtered object is missing in a ranking in the '{dp_name}' data provider.
(WIS 10831)
Cause
The filtered object is missing in a ranking.
Action
Edit the ranking and specify the filtered object.
The rank-based object is missing in a ranking in the '{dp_name}' data provider.
(WIS 10832)
Cause
The rank-based object is missing in a ranking.
Action
Edit the ranking and specify the rank-based object.
The document cannot be loaded. (WIS 10833)
Cause
The Web Intelligence document could not be loaded.
Action
See your Business Objects administrator.
316
Web Intelligence Rich Client User's Guide
Web Intelligence error messages
Web Intelligence Server (WIS) Error Messages
Additional context resolution not supported with optional prompts. (WIS
10834)
Cause
The optional prompts in a query generate additional query context resolution
that is not supported by Web Intelligence.
Action
Remove the optional prompts or make them obligatory.
Column "{col_name}" contains invalid data. (WIS 10840)
Cause
to do
Action
to do
Invalid UTF-8 string in the column "{col_name}". (WIS 10841)
Cause
to do
Action
to do
Web Intelligence Rich Client User's Guide
317
11
11
Web Intelligence error messages
Web Intelligence Server (WIS) Error Messages
Cannot create or update the query on the file "{filename}". (WIS 10850)
Cause
The file {filename} cannot be found on the file system.
Action
Check the location of {filename} or see your Business Objects administrator.
Cannot refresh the query on the file "{filename}". (WIS 10851)
Cause
The file {filename} cannot be found on the file system.
Action
Check the location of {filename} or see your Business Objects administrator.
Unable to refresh the query on this file : the structure of file "{filename}" does
not match. (WIS 10852)
Cause
to do
Action
to do
318
Web Intelligence Rich Client User's Guide
Web Intelligence error messages
Web Intelligence Server (WIS) Error Messages
Unable to create or update the Excel personal data provider: the file path is
invalid. (WIS 10870)
Cause
Web Intelligence could not find the Excel file on the file system.
Action
Check the location of the Excel file or see your Business Objects
administrator.
Unable to create or update the Excel personal data provider: the workbook
is protected. (WIS 10871)
Cause
The Excel workbook is protected.
Action
Remove the protection from the Excel workbook or see your Business Objects
administrator if you do not have access to the Excel file.
Unable to create or update the Excel personal data provider: cannot open the
workbook. (WIS 10872)
Cause
Web Intelligence could not open the Excel workbook.
Action
Check the Excel file or see your Business Objects administrator.
Web Intelligence Rich Client User's Guide
319
11
11
Web Intelligence error messages
Web Intelligence Server (WIS) Error Messages
Unable to create or update the Excel personal data provider: cannot retrieve
the named ranges. (WIS 10873)
Cause
Web Intelligence could not retrieve data from a named range of cells.
Action
Check the Excel file or see your Business Objects administrator.
Unable to create or update the Excel personal data provider: cannot retrieve
data from the file. (WIS 10874)
Cause
Web Intelligence could not retrieve data from the file.
Action
See your Business Objects administrator.
Unable to create or update the Excel personal data provider: cannot retrieve
data from the file. (WIS 10875)
Cause
Web Intelligence could not retrieve data from the file.
Action
See your Business Objects administrator.
320
Web Intelligence Rich Client User's Guide
Web Intelligence error messages
Web Intelligence Server (WIS) Error Messages
Unable to create or update the Excel personal data provider: cannot build the
iterator on the data set. (WIS 10876)
Cause
A Web Intelligence error occurred (Web Intelligence could not build an iterator
on the data set).
Action
See your Business Objects administrator.
Unable to create or update the Excel personal data provider: no worksheet
available. (WIS 10877)
Cause
Web Intelligence could not find the Excel worksheet.
Action
Check the Excel file or see your Business Objects administrator.
Unable to create or update the Excel personal data provider: unable to retrieve
the list of worksheets. (WIS 10878)
Cause
Web Intelligence could not retrieve the list of worksheets from the Excel file.
Action
Check the Excel file or see your Business Objects administrator.
Web Intelligence Rich Client User's Guide
321
11
11
Web Intelligence error messages
Web Intelligence Server (WIS) Error Messages
Unable to create or update the Excel personal data provider: invalid
information retrieved from the selected range. (WIS 10879)
Cause
The data retrieved from the Excel range is invalid.
Action
See your Business Objects administrator.
Unable to create or update the Excel personal data provider: the selected
worksheet is invalid. (WIS 10880)
Cause
The Excel worksheet is invalid.
Action
See your Business Objects administrator.
Unable to create or update the Excel personal data provider: an error occured
while retrieving the data sampling. (WIS 10881)
Cause
An error occured during data retrieval.
Action
See your Busines Objects adminstrator.
322
Web Intelligence Rich Client User's Guide
Web Intelligence error messages
Web Intelligence Server (WIS) Error Messages
Unable to create or update the Excel personal data provider: an error occured
while creating the data iterator. (WIS 10882)
Cause
Web Intelligence could not create a data iterator.
Action
See your Business Objects adminstrator.
Unable to create or update the Excel personal data provider: an error occured
during data retrieval. (WIS 10883)
Cause
Web Intelligence could not fetch the data through a data iterator.
Action
See your Business Objects administrator.
Unable to create or update the Excel personal data provider: an internal error
occured. (WIS 10884)
Cause
An internal error occured.
Action
See your Business Objects administrator.
Web Intelligence Rich Client User's Guide
323
11
11
Web Intelligence error messages
Web Intelligence Server (WIS) Error Messages
Unable to create or update the Excel personal data provider: the range
selection is invalid. (WIS 10885)
Cause
The cell range is discontinuous.
Action
See your Business Objects administrator.
Unable to create or update the Excel personal data provider: the range
selection does not match the worksheet. (WIS 10886)
Cause
The cell range does not correspond to cells in the worksheet.
Action
See your Business Objects administrator.
A database error occured. The database error text is: {error_db}. (WIS 10901)
Cause
The database that provides the data to this document has generated an
error. Details about the error are provided in the section of the message
indicated by the field code: {error_db}.
Action
Contact your BusinessObjects administrator with the error message
information or consult the documentation provided by the supplier of the
database.
324
Web Intelligence Rich Client User's Guide
Web Intelligence error messages
Web Intelligence Server (WIS) Error Messages
Could not retrieve data because the query timed out. The database error text
is: {error_db}. (WIS 10902)
Cause
The query timed out before it could retrieve its data.
Action
Edit the query to restrict the amount of data it returns or ask your Business
Objects administrator to increase the timeout limit.
The query contains the field '{db_fieldname}' which has an invalid data type.
(WIS 10903)
Cause
The query contains a field with an invalid data type.
Action
Remove the field from the query or see your Business Objects administrator.
The query in this document is empty. (WIS 30000)
Cause
No data is defined for this document.
Action
1. Depending on the Web Intelligence report panel you are using, either
click Edit Query or click the Query Tab.
2. Add objects to the Result Objects pane to define the data for the query.
3. Run the query again.
Web Intelligence Rich Client User's Guide
325
11
11
Web Intelligence error messages
Web Intelligence Server (WIS) Error Messages
At least one query in the document is empty. (WIS 30001)
Cause
No data is defined for at least one of the queries in this document.
Action
1. Click Edit Query on the report panel toolbar.
2. Click the tab for each of the queries in the document to identify the query
or queries that have no objects selected.
3. For each empty query, add objects to the Result Objects pane to define
the data you want Web Intelligence to retrieve.
4. Run the query again.
Your security profile does not include permission to edit the queries in Web
Intelligence documents. (WIS 30251)
Cause
Your BusinessObjects administrator has disabled the Edit Query command
in your user profile.
Action
Contact your BusinessObjects administrator to request the ability to edit the
queries in Web Intelligence documents.
Your security profile does not include permission to edit Web Intelligence
documents. (WIS 30252)
Cause
Your BusinessObjects administrator has disabled the Edit Documents
command in your user profile.
326
Web Intelligence Rich Client User's Guide
Web Intelligence error messages
Web Intelligence Server (WIS) Error Messages
Action
Contact your BusinessObjects administrator and request the ability to edit
Web Intelligence documents.
Your security profile does not include permission to refresh Web Intelligence
documents. (WIS 30253)
Cause
Your BusinessObjects administrator has disabled the Refresh Documents
command in your user profile.
Action
Contact your BusinessObjects administrator to request the ability to refresh
Web Intelligence documents.
Your security profile does not include permission to refresh lists of values.
(WIS 30254)
Cause
Your BusinessObjects administrator has disabled the Refresh List of Values
command in your user profile.
Action
Contact your BusinessObjects administrator to request the ability to refresh
lists of values in Web Intelligence documents.
Web Intelligence Rich Client User's Guide
327
11
11
Web Intelligence error messages
Web Intelligence Server (WIS) Error Messages
Your security profile does not include permission to use lists of values. (WIS
30255)
Cause
Your BusinessObjects administrator has disabled the Use List of Values
command in your user profile.
Action
Contact your BusinessObjects administrator to request the ability to use lists
of values in Web Intelligence documents.
Your security profile does not include permission to view the SQL generated
by the query. (WIS 30256)
Cause
Your BusinessObjects administrator has disabled the View SQL command
in your user profile.
Action
Contact your BusinessObjects administrator to request the ability to view the
SQL in Web Intelligence queries.
Your security profile does not include permission to use the Web Intelligence
formula language. (WIS 30257)
Cause
Your BusinessObjects administrator has disabled the Use Formula
Language/Create Variables command in your user profile.
328
Web Intelligence Rich Client User's Guide
Web Intelligence error messages
Web Intelligence Server (WIS) Error Messages
Action
Contact your BusinessObjects administrator to request the ability to use the
formula language and create variables in Web Intelligence documents.
Your security profile does not include permission to perform drill analysis.
(WIS 30258)
Cause
Your BusinessObjects administrator has disabled the Work in Drill Mode
command in your user profile.
Action
Contact your BusinessObjects administrator to request the ability to drill on
Web Intelligence reports.
Your security profile does not include permission to extend the scope of
analysis. (WIS 30259)
Cause
You attempted to perform a drill operation outside the defined scope of
analysis. Your administrator must grant you permission to perform such an
operation.
Action
Contact your administrator.
An internal error occurred while calling the {api_name} API. (WIS 30270)
Cause
Information about the document or the data source is invalid or not available.
Web Intelligence Rich Client User's Guide
329
11
11
Web Intelligence error messages
Web Intelligence Server (WIS) Error Messages
The following table provides information about each of the APIs that you may
see named in the {api_name} error message field:
Name
Cause
getDocumentInfos
The document ID is invalid or the document is not available.
getCategoriesAndDocuments
The document category is invalid or
Web Intelligence is unable to retrieve
the document from the Business Objects repository.
getGroupAndDomains
The user group or document domain
associated with this document is invalid
or cannot be found.
getDataSourceList
The list of universes is not available.
getDataProviderResults
The data provider is invalid or some of
the objects specified in the query are
not available.
sendDocument
This document cannot be sent via InfoView, because the recipient or the
document ID is invalid.
publishDocument
This document cannot be saved as a
corporate document, because the recipient or the document ID is invalid.
Action
Your BusinessObjects administrator can trace the problem that caused the
error by activating the tracking and verifying the trace associated with the
API.
Note: For information on how to trace system activity, see the Business
Objects Administrator's Guide.
330
Web Intelligence Rich Client User's Guide
Web Intelligence error messages
Web Intelligence Server (WIS) Error Messages
The document is too large to be processed by the Web Intelligence server.
(WIS 30271)
Cause
When you view a Web Intelligence in Portable Document Format (PDF) or
Microsoft Excel format, the Web Intelligence server generates binary based
output, which is then interpreted by your web browser. This errors occurs, if
the size of the binary output is greater than the maximum size specified by
your administrator for the Web Intelligence server.
Action
An administrator can change the parameters set for Maximum binary output
on the Administration Console. However, increasing the maximum binary
output can affect performance.
Contact your administrator with this information.
The document is too large to be processed by the Web Intelligence server.
(WIS 30272)
Cause
When you view a Web Intelligence document in HTML format, the Web
Intelligence server generates character based output, which is then
interpreted by your web browser. This errors occurs, if the size of the
character output is greater than the maximum size specified by your
administrator for the Web Intelligence server.
Action
An administrator can change the parameters set for Maximum character
output on the Administration Console. However, increasing the maximum
binary output can affect performance.
Contact your administrator with this information.
Web Intelligence Rich Client User's Guide
331
11
11
Web Intelligence error messages
Web Intelligence Server (WIS) Error Messages
Web Intelligence cannot build the query or generate the report.(WIS 30351)
Cause
Web Intelligence could not complete one or more of the steps required to
define a query and generate a report. This is due to one of the following
reasons:
•
the document was not initialized
•
the data source is not valid
•
the query was not defined
•
the query context was not defined at the universe level
•
no values were specified for prompts at the universe level
Action
Your BusinessObjects administrator needs to check the following:
•
the connection to the data source
•
check the universe for unspecified contexts and prompt values
A query with this name already exists. (WIS 30371)
Cause
Another query used in this document already has this name.
Action
Enter a different name for this query.
332
Web Intelligence Rich Client User's Guide
Web Intelligence error messages
Web Intelligence Server (WIS) Error Messages
You cannot edit this document, because the query property option "Allow
other users to edit the query" was not enabled when the document was
created. (WIS 30381)
Cause
The creator of the document did not select the query property option: "Allow
other users to edit the query".
Action
Contact the document creator to ask them to enable the option and resave
the document.
Save a copy of the document as a personal document and then edit the
query in the copy.
An internal error has been generated by the WIQT. Contact your
BusinessObjects administrator. (WIS 30551)
Cause
An unexpected error occurred on the WIQT.
Action
Contact your BusinessObjects administrator, who may need to seek
assistance from BusinessObjects Worldwide Customer Support.
Your Web Intelligence WIQT session has reached timeout. Log out and log
in again to InfoView. (WIS 30553)
Cause
You have remained logged in to InfoView without using Web Intelligence for
longer than the maximum time allowed by the Business Objects system.
Web Intelligence Rich Client User's Guide
333
11
11
Web Intelligence error messages
Web Intelligence Server (WIS) Error Messages
Action
Log out and then log back into InfoView to continue using Web Intelligence
(you will lose any unsaved modifications you made previous to timeout).
To increase the length of time you are allowed to remain logged in to InfoView
without using Web Intelligence, ask your BusinessObjects administrator to
increase your session timeout parameter.
No more WIQT servers are available. The maximum number of concurrent
users is already logged into Web Intelligence. (WIS 30554)
Cause
This error message means that the number of users currently using Web
Intelligence has reached the maximum number of concurrent users allowed
by your administrator. Administrators specify the number of preregistered
WIQTs generated at system startup, ready to be used as users log in. The
system assigns a WIQT to each user session at login.
Action
Try again later, when less users are using Web Intelligence.
Ask your BusinessObjects administrator to increase the number of concurrent
users allowed by Web Intelligence.
Your security profile does not include permission to save documents as
corporate documents or to send documents via InfoView. (WIS 30555)
Cause
Your security profile does not allow you to save Web Intelligence documents
as personal or corporate documents, or to schedule documents.
Action
Contact your BusinessObjects administrator to request the ability to:
•
334
save corporate documents
Web Intelligence Rich Client User's Guide
Web Intelligence error messages
Web Intelligence Server (WIS) Error Messages
•
send documents to users in own groups
•
send documents to users in other groups
A Corporate document with this name already exists. Your security profile
does not include permission to delete corporate documents created by other
users. (WIS 30556)
Cause
Your security profile does not allow you to overwrite existing corporate
documents.
Action
Contact your BusinessObjects administrator, to request the ability to delete
corporate documents saved by other users to InfoView.
There is no document with this name in InfoView. Specify a different document
name. (WIS 30557)
Cause
There is no Web Intelligence document with this name in InfoView for one
of the following reasons:
•
You have typed the document name incorrectly
•
The document with this name has been deleted from InfoView
Action
Check that you have entered the document correctly.
Note: Deleted documents cannot be retrieved.
Web Intelligence Rich Client User's Guide
335
11
11
Web Intelligence error messages
Web Intelligence Server (WIS) Error Messages
Web Intelligence cannot perform the intended action on this document. (WIS
30650)
Cause
The Web Intelligence server is unable to complete the current task, because
of lack of resources or access problems.
Action
Do one of the following:
•
Close Web Intelligence and log out of InfoView, then log back into InfoView
again.
•
Ask your BusinessObjects administrator to verify that your security profile
allows you access to the corporate repository.
The Web Intelligence server failed to load the XML document. Contact your
BusinessObjects administrator. (WIS 30751)
Cause
When you migrate a BusinessObjects document to Web Intelligence 6.x, an
XML file is created that can be opened by the Web Intelligence Report Server.
(The related module on the Administration Console is called the
WIReportServer). In this case an unexpected error occurred on the Web
Intelligence Report Server, while migrating a BusinessObjects document to
Web Intelligence 6.x.
Action
Your BusinessObjects administrator can trace the problem that caused this
error by activating the tracking and verifying the trace associated with the
WIReportServer. Contact your administrator with this information.
336
Web Intelligence Rich Client User's Guide
Web Intelligence error messages
Web Intelligence Server (WIS) Error Messages
The XML file for this document cannot be opened. Contact your
BusinessObjects administrator. (WIS 30752)
Cause
When you migrate a BusinessObjects document to Web Intelligence 6.x, an
XML file is created that can be opened by the Web Intelligence server. This
error occurs when the XML file cannot be opened by the Web Intelligence
server, and so migration cannot be completed. There are two common
causes:
•
The XML is Read Only.
•
The file path to the XML file is incorrect.
Action
Contact your BusinessObjects administrator with this information.
An error occurred while parsing the Web Intelligence XML document. Contact
your BusinessObjects administrator. (WIS 30753)
Cause
When you migrate a BusinessObjects document to Web Intelligence 6.x, an
XML file is created that can be opened by the Web Intelligence server. This
error occurs when the XML file contains structural anomalies that the Web
Intelligence server cannot interpret, and so migration cannot be completed.
Action
There are two possible actions that an administrator can take to solve this
problem:
•
Open the XML file with an XML editing tool and verify the structure of the
document.
•
Activate the tracking and verify the trace associated with the
WIReportServer.
Web Intelligence Rich Client User's Guide
337
11
11
Web Intelligence error messages
Web Intelligence Server (WIS) Error Messages
The Web Intelligence 2.x document could not be migrated. (WIS 30761)
Cause
An unexpected error occurred when trying to migrate a Web Intelligence 2.x
document to the current Web Intelligence version document format.
Action
An administrator may be able to identify the cause of this error by activating
the tracking and verifying the trace associated with the Web Intelligence
server. Contact your BusinessObjects administrator with this information.
This document cannot be migrated. The query and report of the original Web
Intelligence 2.x document are not synchronized. Try to refresh and save the
original document; then attempt migration again. (WIS 30762)
Cause
In the original Web Intelligence 2.x document, there is a discrepancy between
the objects included in the query and the objects included in the report. This
means that the Web Intelligence server is unable to interpret the document
correctly to migrate it to the current Web Intelligence version document
format.
Action
To synchronize the data definition in the query and report of the original
WbIntelligence 2.x document:
1. Use Web Intelligence 2.x to open the original document again.
2. Either run the query or refresh the document data.
3. Save the refreshed document.
4. Try to migrate the document again using the Migration Tool.
If you do not have access to Web Intelligence 2.x or the Migration Tool,
contact your BusinessObjects administrator with this information.
338
Web Intelligence Rich Client User's Guide
Web Intelligence error messages
Web Intelligence Server (WIS) Error Messages
The Web Intelligence 2.x document could not be migrated, because the WIQT
module returned an error. Contact your administrator. (WIS 30763)
Cause
The original Web Intelligence 2.x document could not be migrated to the
current Web Intelligence version document format, due to an error generated
by the WIQT (Web Intelligence Query Technique) process.
Action
Your BusinessObjects administrator can trace the problem that caused this
error by activating the tracking and verifying the trace associated with the
WIQT. Contact your administrator with this information.
Your user profile does not provide you with access to a document domain to
save corporate documents. Save this document as a personal document or
contact your Business Objects administrator. (WIS 40000)
Cause
Your user profile does not include permission to save documents to a
corporate document domain on InfoView.
Action
Do one of the following:
•
Save this document to your Personal Documents area on InfoView by
saving it as a Personal Document
•
Contact your Business Objects administrator and request access to a
corporate document domain.
Web Intelligence Rich Client User's Guide
339
11
11
Web Intelligence error messages
Web Intelligence Rich Client (WIO) Error Messages
Web Intelligence Rich Client (WIO) Error
Messages
Web Intelligence Offline error messages include the following:
Range
Category
WIO 00001
Web Intelligence Offline
Web Intelligence Offline cannot log in. (WIO 00001)
Cause
The browser cache might be full – under certain circumstances this can
prevent Web Intelligence Offline from logging in.
Action
Empty the browser cache if it is full. If Web Intelligence Offline still cannot
log in, see your Business Objects administrator.
340
Web Intelligence Rich Client User's Guide
Get More Help
A
A
Get More Help
Online documentation library
Business Objects offers a full documentation set covering all products and
their deployment. The online documentation library has the most up-to-date
version of the Business Objects product documentation. You can browse
the library contents, do full-text searches, read guides on line, and download
PDF versions. The library is updated regularly with new content as it becomes
available.
http://support.businessobjects.com/documentation/product_guides/
Additional developer resources
http://devlibrary.businessobjects.com
Online customer support
The Business Objects Customer Support web site contains information about
Customer Support programs and services. It also has links to a wide range
of technical information including knowledgebase articles, downloads, and
support forums.
http://www.businessobjects.com/support/
Looking for the best deployment solution for your company?
Business Objects consultants can accompany you from the initial analysis
stage to the delivery of your deployment project. Expertise is available in
relational and multidimensional databases, in connectivities, database design
tools, customized embedding technology, and more.
For more information, contact your local sales office, or contact us at:
http://www.businessobjects.com/services/consulting/
Looking for training options?
From traditional classroom learning to targeted e-learning seminars, we can
offer a training package to suit your learning needs and preferred learning
style. Find more information on the Business Objects Education web site:
http://www.businessobjects.com/services/training
342
Web Intelligence Rich Client User's Guide
Get More Help
Send us your feedback
Do you have a suggestion on how we can improve our documentation? Is
there something you particularly like or have found useful? Drop us a line,
and we will do our best to ensure that your suggestion is included in the next
release of our documentation:
mailto:[email protected]
Note: If your issue concerns a Business Objects product and not the
documentation, please contact our Customer Support experts. For information
about Customer Support visit: http://www.businessobjects.com/support/.
Business Objects product information
For information about the full range of Business Objects products, visit:
http://www.businessobjects.com.
Web Intelligence Rich Client User's Guide
343
A
A
Get More Help
344
Web Intelligence Rich Client User's Guide
Index
A
Alerter Editor
launching 133
alerters
activating and deactivating 134
adding conditions to 133
adding sub-alerters 134
defined 132
duplicating 135
editing 135
formatting 134
prioritizing 135
removing 134
sub-alerters 133
to create using a formula in the Java Report
Panel 137
using formula to generate cell contents 138
using formulas to create 136
B
breaks
changed data in 172
prioritizing 184
C
calculation context
and changed data 176
cells
formatting text in 242
changed data
configuring appearance of 166
displaying or hiding 166
charts
and changed data 173
drilling on chart axes 213
drilling on legends 216
drilling on measures in 215
setting the position of 255
classes 72
Create Variable dialog box 192
custom sorts
applying 188
D
data tracking
activating 165
and drill 173
automatic mode 164
manual mode 164
types of data change 164
default universe 65
detail objects
and merged dimensions 98, 147
dimensions
defined 72
drilling by 210
drilling down on 208
drilling up on 208
when to merge 90, 139
document locale
defined 68
displaying data using 69
document, save 51
documents
selecting creation and viewing options 63
Web Intelligence Rich Client User's Guide
345
Index
drill
adding and removing drill filters 217
and data tracking 173
changing values in drill toolbar 217
choosing a drill path 205
drilling by dimensions 210
drilling down on dimensions 208
drilling down on measures 211
drilling on chart axes 213
drilling on chart legends 216
drilling on measures in charts 215
drilling out of scope 205
drilling up on dimensions 208
drilling up on measures 212
query drill defined 218
retrieving more levels of data 204
drill filters
adding and removing 217
drill options
hide drill toolbar option 66
prompt for additional data option 66
setting 65
start drill on duplicate report option 67
start drill on existing report option 67
start drill session option 67
synchronize drill on report blocks option 67
drill toolbar
changing filter values in 217
F
filters
creating quick query filters 107
ForceMerge function
example of 93, 141
Formula Editor 191
Formula toolbar 190
formulas
building using the Formula Editor 191
creating alerters with 136
entering in Formula toolbar 191
to enter using the Formula toolbar 191
346
Web Intelligence Rich Client User's Guide
I
Infoview
logging in to 62
InfoView
accessing Web Intelligence from 62
logging out of 62
selecting document creation and viewing
options in 63
Web Intelligence locale options 67
L
locale
associating with a document 69
M
max rows retrieved query property 78
measures
drilling down on 211
drilling up on 212
merged dimensions 90, 139
and changed data 168
and detail objects 98, 147
choosing which dimensions to merge 91,
139
defined 90, 138
example of 91, 140
forcing calculations with ForceMerge 93,
141
understanding the effects of 97, 145
N
number formats
custom 261
customized 263
predefined 261, 262
Index
O
objects
selecting 135
P
preferred viewing locale
defined 69
setting 69
product locale
defined 68
setting 68
prompts
creating 127, 227
merging 130, 230
Q
queries
building in Java Report Panel 83
combined queries 83
combined queries in Java Report Panel 83
duplicating 76
interrupting 75
Query - HTML defined 26
query context
choosing 82
query drill
defined 218
when to use 219
query editor
selecting 65
query editors
Query - HTML 26
query filter and prompt opertors
Between 109, 125, 195, 225
Both 110, 127, 226
Different From 108, 124, 194, 224
Different From Pattern 110, 126, 226
Equal To 108, 124, 194, 223
Except 110, 127, 226
query filter and prompt opertors (continued)
Greater Than 108, 125, 195, 224
Greater Than Or Equal To 108, 125, 195,
224
In List 109, 126, 196, 225
Less Than 108, 125, 195, 224
Less Than Or Equal To 109, 125, 195,
224
Matches Pattern 110, 126, 225
Not Between 109, 126, 196, 225
Not Equal To 108, 124, 194, 223
Not In List 109, 126, 196, 225
query filters
about combining query filters 111
about nesting query filters 112
combining 112
selecting a predefined query filter 106
query properties
clear contexts 82
max retrieval time 77
max rows retrieved 78
reset contexts on refresh 82
retrieve duplicate rows 78
setting in Java Report Panel 74
quick filters
defined 106
R
ranking data 158
ranking dimension
index of 157
ranking parameters 155
reference data
changing 165
RefValue function
building formulas using 174
reports
drilling on 25
viewing and printing 25
Web Intelligence Rich Client User's Guide
347
Index
S
sections
changed data in 170
grouping information with 177
sorts
applying custom sorts 188
prioritizing 188
standard calculations
inserting in tables 189
removing 190
sub-alerters 133
adding 134
subclasses 72
T
tables
formatting borders 241
inserting standard calculations in 189
setting the position of 255
text
formatting 242
toolbars
Formula 190, 191
tracking data changes 163
U
universe
selecting default 65
universe, to select in Web Intelligence Rich
Client 48
V
values
selecting from list 135
Variable Editor 192
348
Web Intelligence Rich Client User's Guide
variables
creating using Create Variable dialog box
192
deleting 193
editing 193
selecting 135
to create using Variable Editor 192
view format
selecting 65
W
Web Intelligence
and business intelligence 24
when to merge 90, 139
WIH 00001 270
WIH 00002 270
WIH 00003 271
WIH 00004 271
WIH 00005 272
WIH 00006 272
WIH 00007 272
WIH 00008 273
WIH 00009 273
WIH 00010 273
WIH 00011 274
WIH 00012 274
WIJ 10000 275
WIJ 10001 275
WIJ 10500 276
WIJ 11111 276
WIJ 20000 277
WIJ 20001 277
WIJ 20002 278
WIJ 20003 278
WIJ 30000 279
WIJ 30001 279
WIJ 30003 279
WIJ 40001 280
WIJ 44444 280
WIJ 55555 281
WIJ 77777 281
Index
WIJ 77778 281
WIO 0001 340
WIS 00001 282
WIS 00002 283
WIS 00003 283
WIS 00004 283
WIS 00005 284
WIS 00006 284
WIS 00007 284
WIS 00008 285
WIS 00009 285
WIS 00010 286
WIS 00011 286
WIS 00012 287
WIS 00013 288
WIS 00014 288
WIS 00015 288
WIS 00016 289
WIS 00017 290
WIS 00018 290
WIS 00019 291
WIS 00024 292
WIS 00027 293
WIS 00028 294
WIS 00029 294
WIS 00501 294
WIS 00502 295
WIS 00503 295
WIS 00508 297
WIS 00510 297
WIS 00511 298
WIS 00512 298
WIS 10001 298
WIS 10002 299
WIS 10005 299
WIS 10006 299
WIS 10009 300
WIS 10012 300
WIS 10013 300
WIS 10014 301
WIS 10016 301
WIS 10019 301
WIS 10032
WIS 10033
WIS 10034
WIS 10035
WIS 10036
WIS 10037
WIS 10038
WIS 10039
WIS 10040
WIS 10041
WIS 10042
WIS 10060
WIS 10061
WIS 10062
WIS 10063
WIS 10064
WIS 10065
WIS 10066
WIS 10067
WIS 10068
WIS 10069
WIS 10070
WIS 10071
WIS 10072
WIS 10073
WIS 10076
WIS 10077
WIS 10080
WIS 10082
WIS 10083
WIS 10701
WIS 10702
WIS 10703
WIS 10704
WIS 10705
WIS 10706
WIS 10707
WIS 10801
WIS 10810
WIS 10811
WIS 10812
WIS 10820
302
302
302
303
303
303
304
304
304
305
305
305
306
306
306
307
307
307
308
308
308
308
309
309
309
310
310
310
310
311
311
312
312
312
313
313
313
314
314
314
315
315
Web Intelligence Rich Client User's Guide
349
Index
WIS 10830
WIS 10831
WIS 10832
WIS 10833
WIS 10834
WIS 10840
WIS 10841
WIS 10850
WIS 10851
WIS 10852
WIS 10870
WIS 10871
WIS 10872
WIS 10873
WIS 10874
WIS 10875
WIS 10876
WIS 10877
WIS 10878
WIS 10879
WIS 10880
WIS 10881
WIS 10882
WIS 10883
WIS 10884
WIS 10885
WIS 10886
WIS 10901
WIS 10902
WIS 10903
WIS 30000
WIS 30001
WIS 30251
WIS 30252
WIS 30253
WIS 30254
350
315
316
316
316
317
317
317
318
318
318
319
319
319
320
320
320
321
321
321
322
322
322
323
323
323
324
324
324
325
325
325
326
326
326
327
327
Web Intelligence Rich Client User's Guide
WIS 30255
WIS 30256
WIS 30257
WIS 30258
WIS 30259
WIS 30270
WIS 30271
WIS 30272
WIS 30351
WIS 30371
WIS 30381
WIS 30551
WIS 30553
WIS 30554
WIS 30555
WIS 30556
WIS 30557
WIS 30650
WIS 30751
WIS 30752
WIS 30753
WIS 30761
WIS 30762
WIS 30763
WIS 40000
WIS00020
WIS00021
WIS00022
WIS00023
WIS00025
WIS00026
WIS00504
WIS00505
WIS00506
WIS00507
WIS00509
328
328
328
329
329
329
331
331
332
332
333
333
333
334
334
335
335
336
336
337
337
338
338
339
339
291
291
292
292
293
293
295
296
296
296
297