1
ALICE 98/44 Internal Note/DAQ
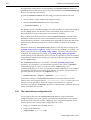
ALICE DATE
User’s Guide
November 1998
CERN ALICE DAQ group
DATE V3
Copyright CERN, Geneva 1998 - Copyright and any other appropriate legal protection of
this documentation and associated computer program reserved in all countries of the
world.
Organisations collaborating with CERN may receive this program and documentation
freely and without charge.
CERN undertakes no obligation for the maintenance of this program, nor responsibility
for its correctness, and accepts no liability whatsoever resulting from its use.
Program and documentation are provided solely for the use of the organisation to which
they are distributed.
This program may not be copied or otherwise distributed without permission. This
message must be retained on this and any other authorised copies.
The material cannot be sold. CERN should be given credit in all references.
Creation date: 11/10/98
This document has been prepared with Release 5.5.3 of the Adobe FrameMaker®
Technical Publishing System using the User’s Guide template prepared by Mario Ruggier
of the Information and Programming Techniques Group at CERN. Only widely available
fonts have been used, with the principal ones being:
Running text:
Chapter numbers and titles:
Section headings
Subsection and subsubsection headings:
Captions:
Listings:
Symbol:
Palatino 10.5 pt on 13.5 pt line spacing
AvantGarde DemiBold 36 and Bold 56 pt
AvantGarde DemiBold 20 pt
Helvetica Bold 12 and 10 pt
Helvetica 9 pt
Courier 9 pt
Courier Bold Italic 10.5 pt
Use of any trademark in this document is not intended in any way to infringe on the
rights of the trademark holder.
Preface
The ALICE DATE (Data Acquisition and Test Environment) system has been
developed as a basis for prototyping the components of the DAQ system and for
the support of the ALICE test beams.
The ALICE DATE system includes a set of programs and packages needed for a
data acquisition system such as readout, monitoring, error reporting and run
control and also prototypes of the components developed for the future ALICE
DAQ system such as the event building based on a switched network.
The ALICE DATE system is based on widely accepted hardware and software
industry standards such as VME boards and workstations running Unix, Java,
Tcl/Tk, TCP/IP socket library.
The ALICE DATE system is designed to run on two different types of machines:
•
The Local Data Concentrator (LDC) has the following functions: readout the
front-end electronic, format the data fragments into (sub-)events, record the
data or send them to a GDC.
•
The Global Data Collector (GDC) has the following functions: event-building,
formatting of subevents into events and data recording.
The list of releases of the ALICE DATE User’s Guide is the following:
–
April 98: first released version for DATE V2;
–
November 98: updated version for DATE V3
–
the following chapters have been modified: ”Data recording and data
format”, ”Guide to prepare a readout program” and ”DATE installation
guide”;
–
the following chapter have been completely rewritten: ”Guide to write a
monitoring program”;
–
two new chapters have been added: ”The generic readList” and on
”VME access and trigger system”.
This User’s Guide can be found in the ALICE web site:
–
ALICE home page > Documents > Internal Notes DAQ > INT-98-44
or
–
http://consult.cern.ch/alice/Internal_Notes/1998/44/abstract.
ALICE DATE V3 User’s Guide
iv
Preface
ALICE DATE V3 User’s Guide
Contents
Preface .
.
.
.
.
.
.
.
.
.
Chapter 1
ALICE DATE architecture . .
1.1 Overview . . . . .
1.2 Readout and data flow
1.3 Event monitoring . .
1.4 Run control . . . .
1.5 Information logging .
1.6 Run bookkeeping . .
.
.
.
.
.
.
.
.
.
.
.
.
.
.
.
.
.
.
iii
.
.
.
.
.
.
.
.
.
.
.
.
.
.
.
.
.
.
.
.
.
.
.
.
.
.
.
.
.
.
.
.
.
.
.
.
.
.
.
.
.
.
.
.
.
.
.
.
.
.
.
.
.
.
.
.
.
.
.
.
.
.
.
.
.
.
.
.
.
.
.
.
.
.
.
.
.
.
.
.
.
.
.
.
.
.
.
.
.
.
.
.
.
.
.
.
.
.
.
.
.
.
.
.
.
.
.
.
.
.
.
.
.
.
.
.
.
.
.
.
.
.
.
.
.
.
1
2
3
4
5
5
6
.
.
.
.
.
.
.
.
.
.
.
.
.
.
.
.
.
.
.
.
.
.
.
.
.
.
.
.
.
.
.
.
.
.
.
.
.
.
.
.
.
.
.
.
.
.
.
.
.
.
.
.
.
.
.
.
.
.
.
.
.
.
.
.
.
.
.
.
.
.
.
.
.
.
.
.
.
.
.
.
.
.
.
.
.
.
.
.
.
.
.
.
.
.
.
.
.
.
.
.
.
.
.
.
.
.
.
.
.
.
.
.
.
Chapter 2
Guide to operate the system . . . . . . . . .
2.1 The control console . . . . . . . . . .
2.1.1 Overview . . . . . . . . . .
2.1.2 The menu bar . . . . . . . .
2.1.2.1 The File menu . . . .
2.1.2.2 The View menu . . . .
2.1.2.3 The option menu . . .
2.1.2.4 The windows menu . .
2.2 The infoBrowser console . . . . . . . .
2.2.1 The infoBrowser operator window
2.3 The statsBrowser console . . . . . . .
Chapter 3
Data recording and data format . . . . .
3.1 Data recording . . . . . . . .
3.1.1 Data recording from a LDC
3.1.2 Data recording from a GDC
3.2 Data files . . . . . . . . . .
3.3 The data format . . . . . . . .
3.4 The event types . . . . . . . .
3.5 The full event format . . . . . .
.
.
.
.
.
.
.
.
.
.
.
.
.
.
.
.
.
.
.
.
.
.
.
.
.
.
.
.
.
.
.
.
.
.
.
.
.
.
.
.
.
.
.
.
.
.
.
.
.
.
.
.
.
.
.
.
.
.
.
.
.
.
.
.
.
.
.
.
.
.
.
.
.
.
.
.
.
.
.
.
.
.
.
.
.
.
.
.
.
.
.
.
.
.
.
.
.
.
.
.
.
.
.
.
.
.
.
.
.
.
.
.
.
.
.
.
.
.
.
.
.
.
.
.
.
.
.
.
.
.
.
.
.
.
.
.
.
.
.
.
.
.
.
.
.
.
.
.
.
.
.
.
.
.
.
.
Chapter 4
Guide to write a monitoring program . . . . .
4.1 Monitoring in DATE . . . . . . . .
4.2 Monitoring and Analysis in C/FORTRAN
4.2.1 Some simple examples . . . .
4.2.2 The monitoring package files .
ALICE DATE V3 User’s Guide
7
8
8
11
11
11
13
13
15
16
17
19
20
20
20
20
21
23
24
27
28
30
31
32
vi
Contents
4.2.3 Error codes . . . . . . .
4.2.4 The monitoring callable library
4.3 The “eventDump” utility program . .
.
.
.
.
.
.
.
.
.
.
.
.
.
.
.
.
.
.
.
.
.
.
.
.
.
.
.
.
.
.
.
.
.
33
33
. 40
.
.
.
.
.
.
.
.
.
.
.
.
.
.
.
.
.
.
.
.
.
.
.
.
.
.
.
.
.
.
.
.
.
.
.
.
.
.
.
.
.
.
.
.
.
.
.
.
.
.
.
.
.
.
.
.
.
.
.
.
.
.
.
.
.
.
.
.
.
.
.
.
.
.
.
.
.
.
.
.
.
.
.
.
.
.
.
.
.
.
.
.
.
.
.
.
.
.
.
.
Chapter 5
Guide to prepare a readout program . . . . . . . . .
5.1 Overview . . . . . . . . . . . . . . .
5.1.1 The main event loop . . . . . . . .
5.1.2 The readout process . . . . . . . .
5.1.3 The recorder process . . . . . . . .
5.2 The readList templates . . . . . . . . . . .
5.3 Report message to the infoLogger . . . . . .
5.4 Customization of the front-end software . . . .
5.4.1 The Start of Run and End of Run scripts .
5.4.2 The Start of Run and End of Run files . .
5.5 How to build and install a readout program . . .
5.5.1 The timerRand readList . . . . . . .
5.5.2 The custom readList . . . . . . . .
5.5.3 The generic readList . . . . . . . .
Chapter 6
The generic readList . . . . . . . . . . .
6.1 Overview . . . . . . . . . . .
6.2 Using the generic readList . . . . .
6.3 The readout control . . . . . . . .
6.4 The equipment header . . . . . . .
6.5 The equipmentList library . . . . .
6.5.1 Trigger equipments . . . .
6.5.2 Readout equipments . . . .
6.5.3 Accessing the parameters . .
6.5.4 Arming the equipments . . .
6.5.5 Reading the equipments . . .
6.5.6 Disarming the equipments . .
6.5.7 Triggering . . . . . . . .
6.5.8 The function references . . .
6.6 The detectors configuration file . . .
6.6.1 The readout equipment types .
6.6.2 The trigger equipment types .
6.6.3 The detector parameters . . .
6.6.4 The detectors . . . . . . .
.
.
.
.
.
43
44
. 44
. 45
. 46
. 47
. 51
. 52
. 52
. 53
. 54
. 54
. 54
. 55
.
.
.
.
.
.
.
.
.
.
.
.
.
.
.
.
.
.
.
.
.
.
.
.
.
.
.
.
.
.
.
.
.
.
.
.
.
.
.
.
.
.
.
.
.
.
.
.
.
.
.
.
.
.
.
.
.
.
.
.
.
.
.
.
.
.
.
.
.
.
.
.
.
.
.
.
.
.
.
.
.
.
.
.
.
.
.
.
.
.
.
.
.
.
.
.
.
.
.
.
.
.
.
.
.
.
.
.
.
.
.
.
.
.
.
.
.
.
.
.
.
.
.
.
.
.
.
.
.
.
.
.
.
.
.
.
.
.
.
.
.
.
.
.
.
.
.
.
.
.
.
.
.
.
.
.
.
.
.
.
.
.
.
.
.
.
.
.
.
.
.
.
.
.
.
.
.
.
.
.
.
.
.
.
.
.
.
.
.
.
.
.
.
.
.
.
.
.
.
.
.
.
.
.
.
.
.
.
.
57
58
. 59
. 61
. 62
. 63
. 63
. 64
. 64
. 65
. 65
. 66
. 66
. 66
. 68
. 68
. 69
. 70
. 70
.
.
.
.
.
.
.
.
.
.
.
.
.
.
.
.
.
.
.
.
.
.
.
.
.
.
.
.
.
.
.
.
.
.
.
.
.
.
.
.
.
.
.
.
.
.
.
.
.
.
.
.
.
.
.
.
.
.
.
.
.
.
.
.
.
.
.
.
.
.
.
.
.
.
.
.
.
.
.
71
72
. 74
. 75
. 76
. 76
. 77
. 79
. 80
. 80
. 81
.
.
.
.
.
.
.
.
Chapter 7
VME access and trigger system . . . . . . . . . . .
7.1 Access to the VME bus . . . . . . . . . . .
7.2 The trigger system . . . . . . . . . . . .
7.3 The CORBO module . . . . . . . . . . .
7.4 Triggering with the CORBO . . . . . . . . .
7.4.1 Using the CORBO as LDC trigger module
7.4.2 Start of run initialization . . . . . .
7.4.3 End of run tidy-up . . . . . . . . .
7.4.4 Trigger processing . . . . . . . . .
7.4.5 Reading the CORBO counters . . . .
7.5 Using the CORBO to control the trigger . . . .
Chapter 8
Guide to use the infoLogger system
.
.
.
.
.
.
.
.
83
ALICE DATE V3 User’s Guide
Contents
vii
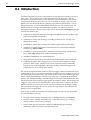
8.1 Introduction . . . . . . . . . . . . . . . . . . . . . .
8.2 The infoBrowser . . . . . . . . . . . . . . . . . . . . .
8.2.1 The infoBrowser operator mode . . . . . . . . . . .
8.3 Browsing HTML help pages . . . . . . . . . . . . . . . .
8.4 The information repository . . . . . . . . . . . . . . . . .
8.5 Extracting portions of the log files . . . . . . . . . . . . . .
8.6 Injection of messages . . . . . . . . . . . . . . . . . . .
8.6.1 The messaging system . . . . . . . . . . . . . . .
8.6.2 Setting the facility name . . . . . . . . . . . . . .
8.6.3 The infoLogger callable interface . . . . . . . . . . .
8.6.4 The Java LogChannel Class constructors, fields and methods .
8.6.5 Interactive injection of messages . . . . . . . . . . .
Chapter 9
Guide to use the bookkeeping system . . . . . . . . . . . . . .
9.1 The DATE bookkeeping package. . . . . . . . . . . . .
9.2 The statsCollector . . . . . . . . . . . . . . . . . .
9.2.1 The statsCollector configuration file . . . . . . . .
9.3 The statsBrowser . . . . . . . . . . . . . . . . . .
9.4 Browsing HTML help pages . . . . . . . . . . . . . .
9.5 The bookkeeping repository . . . . . . . . . . . . . .
9.5.1 How to re-create the ${DATE_SITE_STATS} repository
9.6 The bookkeeping callable interface . . . . . . . . . . . .
9.6.1 The run record structure . . . . . . . . . . . .
9.6.2 The bookkeeping calls . . . . . . . . . . . . .
9.6.3 Single-line records examples . . . . . . . . . . .
9.6.4 Multi-line records examples . . . . . . . . . . .
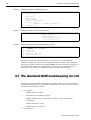
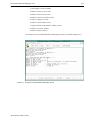
9.7 The standard DATE bookkeeping record . . . . . . . . . .
Chapter 10
Conventions and file organization . . . . . . . . . . . . . . .
10.1 DATE environment . . . . . . . . . . . . . . . . . .
10.2 File organization . . . . . . . . . . . . . . . . . . .
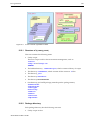
10.2.1 Structure of ${DATE_ROOT} . . . . . . . . . . .
10.2.2 Package directory . . . . . . . . . . . . . . .
10.2.3 Structure of ${DATE_SITE} . . . . . . . . . . .
10.3 Environment variables and aliases . . . . . . . . . . . .
10.4 Internet dæmons . . . . . . . . . . . . . . . . . .
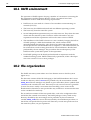
10.5 Package development . . . . . . . . . . . . . . . . .
10.6 Logging information . . . . . . . . . . . . . . . . .
10.6.1 Use of streams . . . . . . . . . . . . . . . .
10.6.2 Use of the severity . . . . . . . . . . . . . . .
10.6.3 Use of the facility . . . . . . . . . . . . . . .
10.6.4 Filtering the logged messages at the source: the log level
Chapter 11
DATE installation guide . . . . . . . . . . .
11.1 Hardware and software platforms . . . .
11.2 Getting the software . . . . . . . . .
11.3 First time installation . . . . . . . . .
11.3.1 Setting up the file base . . . . .
11.3.2 Internet services . . . . . . .
11.4 Installation of a new release . . . . . .
11.5 Run control configuration . . . . . . .
11.5.1 Run-control windows configuration
11.5.2 The LDC event buffer size . . . .
ALICE DATE V3 User’s Guide
84
86
87
87
87
89
91
92
92
93
97
98
.
101
102
103
104
105
106
106
106
107
107
108
109
109
. 110
.
. 113
.
. 114
.
.
.
.
.
.
.
.
.
.
.
.
.
.
. 114
.
. 115
.
. 115
.
. 116
.
. 116
.
. 117
.
. 117
.
. 119
.
. 119
.
. 119
.
120
120
.
.
.
.
.
.
.
.
.
.
.
.
.
.
.
.
.
.
.
.
.
.
.
.
.
.
.
.
.
.
.
.
.
.
.
.
.
.
.
.
.
.
.
.
.
.
.
.
.
.
.
.
.
.
.
.
.
.
.
.
.
.
.
.
.
.
.
.
.
.
.
.
.
.
.
.
.
.
.
.
.
.
.
.
.
.
.
.
.
.
.
123
124
124
125
125
126
129
129
129
137
viii
Contents
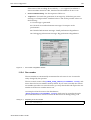
11.5.3 Run-control configuration parameters . .
11.5.4 Run number . . . . . . . . . . . .
11.5.5 Multiple run controls . . . . . . . . .
11.6 Information logger configuration . . . . . . . .
11.7 Monitoring configuration . . . . . . . . . . .
11.7.1 Creation of configuration files . . . . .
11.7.2 Installation of the monitoring daemon . .
11.7.3 Monitoring of the online monitoring scheme
.
.
.
.
.
.
.
.
.
.
.
.
.
.
.
.
.
.
.
.
.
.
.
.
.
.
.
.
.
.
.
.
.
.
.
.
.
.
.
.
.
.
.
.
.
.
.
.
138
139
140
140
140
141
143
144
.
.
.
.
.
.
.
.
.
.
.
.
.
.
.
.
.
.
.
.
.
.
.
.
145
List of Figures
.
.
.
.
.
.
.
.
.
.
.
.
.
.
.
.
.
.
.
.
.
.
.
.
149
List of Listings
.
.
.
.
.
.
.
.
.
.
.
.
.
.
.
.
.
.
.
.
.
.
.
.
151
List of Tables
.
.
.
.
.
.
.
.
.
.
.
.
.
.
.
.
.
.
.
.
.
.
.
.
153
Index
.
.
.
ALICE DATE V3 User’s Guide
ALICE DATE
architecture
1
This chapter gives an overview of the architecture of DATE. The features of the
system are described, with the components that implement such features. For each
component, a brief explanation of the underlying mechanism is given.
ALICE DATE V3 User’s Guide
1.1
Overview . . . . . . . . . . . . . . . . . . . . . . . . . . . . . . 2
1.2
Readout and data flow. . . . . . . . . . . . . . . . . . . . . . . 3
1.3
Event monitoring. . . . . . . . . . . . . . . . . . . . . . . . . . 4
1.4
Run control . . . . . . . . . . . . . . . . . . . . . . . . . . . . . 5
1.5
Information logging . . . . . . . . . . . . . . . . . . . . . . . . 5
1.6
Run bookkeeping. . . . . . . . . . . . . . . . . . . . . . . . . . 6
2
ALICE DATE architecture
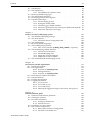
1.1 Overview
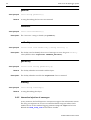
DATE (Data Acquisition and Test Environment) is a software system that performs
data-acquisition activities in a multi-processor distributed environment.
The basic dataflow architecture is organized along parallel data streams working
independently and concurrently, followed by an event builder stage where data are
merged and eventually recorded as a complete event.
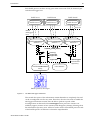
A view of this architecture is depicted in the middle of figure 1.1, where terms such
LDC and GDC, used throughout this guide, are illustrated. The LDC (Local Data
Concentrator) is the front-end processor whose main purpose is to readout the
front-end electronics of a given detector (or section of a detector). The LDCs
manage concurrent streams of data; the triggering system provides the necessary
synchronization with the physics events. The LDC data streams are injected on the
data-acquisition network (shown in figure 1.1 as an Ethernet switch), through
which they reach the GDC. The GDC (Global Data Collector) is a processor that
performs the event-building function. It collects the various sub-events from the
LDCs, puts them together and encapsulates them with the proper event structure.
It also performs the recording function.
The conditions imposed to the hardware architecture in order to support DATE are
minimal:
a. The operating system of all the processors must be Unix.
b. All the processors must share the same file system.
c. All the processors must be linked to a network supporting the TCP/IP stack
and the socket library.
Figure 1.1
DATE features
The processors may be of any type (such as embedded VME processors or fully
equipped workstations). Some of the activities of the data acquisition, such as run
ALICE DATE V3 User’s Guide
Readout and data flow
3
control and monitoring, may be more conveniently located on one or more
workstations which may or may not share the file system of the readout processors.
The DATE architecture may be concentrated onto one single processor. In this case,
the GDC function is missing, but all the others functions are supported.
The DATE system, besides the data-flow function, provides a number of other
features (depicted in figure 1.1), namely:
•
Parametrization of the hardware configuration and interactive setting up.
•
Run control.
•
Display of the run status.
•
Event monitoring.
•
Information reporting.
•
Run bookkeeping.
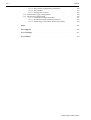
1.2 Readout and data flow
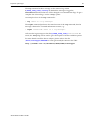
The readout and data flow architecture is shown in figure 1.2.
The readout is performed, in each LDC, by the process readout, which waits for a
trigger and then reads the front-end electronics and fills a circular buffer. Another
process, called recorder, off-loads the buffer and sends the events to whatever
device has been indicated in the configuration. It may be either a disk file (this is the
case of a single LDC, when there is no GDC) or, more usually, it is the IP address of
the GDC.
Figure 1.2
Dataflow architecture
In the GDC, an Internet dæmon, called gdcServer, is created when the recorder
opens the socket. The gdcServer gets the events from the socket and fills a
circular buffer. A process called eventBuilder off-loads the buffer and sends the
events to whatever device has been indicated in the configuration. It usually is a
disk file.
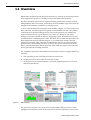
The function of the eventBuilder process is to collect the sub-events from the
various LDC and to build the full event (figure 1.3). In the GDC there is one
gdcServer and one circular buffer per LDC. The eventBuilder simply goes
around all the buffers and picks up all the sub-events.
ALICE DATE V3 User’s Guide
4
ALICE DATE architecture
Figure 1.3
Event builder architecture
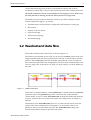
1.3 Event monitoring
The architecture of the monitoring function is shown in figure 1.4.
An analysis process may request events from any data-acquisition machine by
calling the monitoring library routines. A buffer (reserved to the monitoring
function) is filled with the requested events, either by the readout program (if the
machine is an LDC) or by the eventBuilder (if the machine is a GDC). No copy is
made if there is no pending request.
Figure 1.4
Monitoring architecture
The analysis process may run locally on the machine producing the events; in this
case it will get the events directly from the monitoring buffer. It may also run on
any other workstation, even if the workstation does not share the DATE file system;
it will then get the events over the network, via an Inetd server called mpDæmon.
The monitoring library provides several other features, such as delivery of events
stored on disc, either local or remote.
ALICE DATE V3 User’s Guide
Run control
5
1.4 Run control
The run control architecture is shown in figure 1.5.
The whole DATE system is controlled from a central point, which may be either one
of the processors involved in the data acquisition or, more suitably, an independent
workstation. It is preferable that the run control workstation shares the DATE file
system, even though this is not strictly necessary.
The run control is performed by a process called runControl, which is made
aware of the hardware configuration by reading a configuration file.
This process opens sockets to all the machines involved, where Internet dæmons
are created. The dæmon called rcServer controls the readout and recorder
processes. Two dæmons (ebDaemon and rcServer) control the eventBuilder
process. These dæmons make use of shared memory segments to communicate
with the controlled processes.
The runControl process displays in a dedicated window the status of the machines
involved in the data acquisition and the values of selected variables in the shared
memory segments.
Figure 1.5
Run control architecture
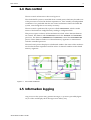
1.5 Information logging
Any process in the system may generate messages. A system is provided (figure
1.6) to collect and display these messages in an orderly way.
ALICE DATE V3 User’s Guide
6
ALICE DATE architecture
Figure 1.6
Information logger architecture
To log a message, a process calls a library routine, which sends the message onto a
socket.
A machine or workstation is designated to receive these messages. Internet
dæmons called infoDaemon handle each socket and save the messages on disk
files. A program called infoBrowser may be interactively invoked to browse
these files and apply various selection criteria to the messages to be displayed.
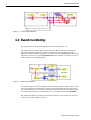
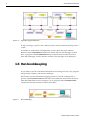
1.6 Run bookkeeping
It is possible to record on disk files information concerning each run. Any program
may generate summary information and log it.
This feature uses the information logging system to write the summary file. A
process called statsCollector will select the summaries from the file and save
them files dedicated to each run (figure 1.7). A program called statsBrowser
may be interactively invoked to browse these files.
Figure 1.7
Run bookkeeping
ALICE DATE V3 User’s Guide
Guide to
operate the
system
2
This chapter describes the person-machine interface of DATE. There is one part
concerning the configuration and the control of the data acquisition, another one on
the information provided to the operator and a last one on the run bookkeeping.
ALICE DATE V3 User’s Guide
2.1
The control console. . . . . . . . . . . . . . . . . . . . . . . . . 8
2.2
The infoBrowser console . . . . . . . . . . . . . . . . . . . . . 15
2.3
The statsBrowser console . . . . . . . . . . . . . . . . . . . . . 17
8
Guide to operate the system
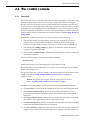
2.1 The control console
2.1.1 Overview
The control console is a machine from which the data acquisition is operated, using
the run-control system. The control console is unique and cannot be changed
during a run. One of the processors involved in the data acquisition may be used
for this purpose. It is though preferable to give the role of control console to another
workstation to avoid mixing control and dataflow activities in one processor. The
selected workstation should have access, on its mounted disks, to the two file areas
used by DATE, which are pointed to by the environment variables DATE_ROOT and
DATE_SITE.
Preliminary condition to start the run-control system are the following:
1. The machine which owns the display (which is not necessarily the control
console, when a remote shell is used) must authorize all the other DATE
machines to open windows on the screen (e.g. with the command xhost +)
2. The shell symbol DATE_SITE must point to the directory where the DATE
experiment-specific files reside.
3. The procedure /date/setup.sh must be executed once, in order to define all
the symbols required.
The run-control system is started by the shell command:
> dateControl
which launches the run-control program on the control console.
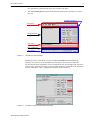
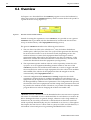
The visible effect of this command is the creation on the main run-control window
on the screen (Figure 2.1).
The specific items shown on the window are determined by the declarations in the
configuration file ${DATE_SITE_CONFIG}/runControl.config (see
Chapter 11.5.1).
Remark: throughout this chapter, the term configuration file refers to
the file ${DATE_SITE_CONFIG}/runControl.config.
Still there are on the window various panels with a well-defined functionality.
•
The menu bar is used to perform operations on the run-control program itself.
•
The machine-selection panel shows all the available machines. The ones
participating in the data acquisition can be selected here; their status will be
displayed.
•
The run-parameters panel contains the most important parameters to be set by
the operator. These parameters will be used at start of run.
•
The run-status panel shows the run number, the run status and a line providing
some basic information about the run operation.
•
The run-conditions panel allows the operator to select the machine hosting the
trigger system and to enable/disable the event recording. From this panel it is
ALICE DATE V3 User’s Guide
The control console
9
also possible to automatically start one run after the other.
•
The run-control panel contain all the buttons used by the operator to control
the run.
machine selection
menu bar
run parameters
run status
run conditions
run control
Figure 2.1
The main run-control window
Initially, the only active button is the one labelled Connect. Beforehand, the
operator may choose, in the machine-selection panel, the pattern of machines
involved in the data acquisition. If the configuration has not changed, the operator
will leave the pattern previously saved and automatically retrieved at the program
startup. Otherwise a new configuration pattern will be selected.
Figure 2.2
The main run-control window, after connection
ALICE DATE V3 User’s Guide
10
Guide to operate the system
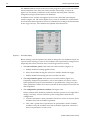
The Connect button instructs the run-control program to get in touch with all the
selected machines. The main run-control window will change, as shown in
Figure 2.2. The pattern of machines in the machine-selection panel cannot be
changed any longer (all the buttons are disabled).
In addition a new window will appear on the screen, called the status-display
window (Figure 2.3). The status display shows a list of variables for each machine
involved in the data acquisition. The list is established according to the declarations
in the configuration file. The variables are updated at fixed intervals.
Figure 2.3
The status display
Before starting a run the operator may need to change the run conditions. There are
various means of doing it; some of the conditions are expected to be changed more
frequently than others, therefore they have been given more visibility.
1. The run-conditions panel of the main run-control window (Figure 2.1).
a. Enable/disable recording (global switch).
b. Select the machine hosting the software to enable/disable the trigger.
c. Enable/disable autostarting the runs one after the other.
2. The run-parameters panel of the main run-control window (Figure 2.1).
Frequently changed run parameters, such as the number of events to collect.
Other parameters may be presented here (as specified in the configuration file).
These parameters will be set at start of run into all the machines involved in the
data acquisition.
3. The configuration-parameters window (See Figure 2.10).
In this window there should be parameters that the operator is not supposed to
change, since they concern rather the system configuration than the run
configuration.
a. Common parameters: these parameters will be set at start of run into all the
machines involved in the data acquisition.
b. LDC, GDC: specific lists of parameters are presented for all the available
machines. Only the machines involved in the data acquisition will receive
their own parameters at start of run.
ALICE DATE V3 User’s Guide
The control console
11
The run operation is controlled through the buttons of the run-control panel
(Figure 2.1).
1. Start run. It initiates the procedure to start the run on all the machines involved,
to synchronize them and to eventually enable the trigger.
2. Stop run. It initiates the procedure to disable the trigger and then stop the run
on all the machines involved.
3. Pause trigger/Continue trigger. It respectively either disables or enables the
trigger.
4. Disconnect/Connect. It respectively either disconnects or connects the control
console from/to all the machines involved in the data acquisition.
2.1.2 The menu bar
2.1.2.1
The File menu
The options of the file menu (Figure 2.4) are the following:
Figure 2.4
The file menu
1. Save parameters. Saves on a file all the parameters, switches and menu options
selected on the main run-control window and on the configuration-parameters
window (see Figure 2.10). The saved conditions can be restored with the menu
option File-Load parameters.
2. Load parameters. Restores from a file all the parameters, switches and menu
options.
3. Quit. Stops the run-control program. The same effect is achieved by the
close-window button of the window frame. If there is a run active, an alert
window will ask for a confirmation, since the action will compromise the run.
2.1.2.2
The View menu
The options of the view menu (Figure 2.5) allow the operator to display additional
panels onto the main run-control window. The usage of these additional panels is
reserved to specialists, therefore it is suggested to keep these options disabled.
ALICE DATE V3 User’s Guide
12
Guide to operate the system
Figure 2.5
The view menu
The main run-control window with the additional panels is shown in Figure 2.6.
1. Parameters-file name. If enabled, an additional panel will display the name of
the parameters file that was used last. Commands that set this name are the
menu options File-Save and File-Load, and the PARFILE statement in the
configuration file. The file name can be changed in the interactive entry field; the
new value is used as default in the menu options File-Save and File-Load.
2. Trace. If enabled, an additional panel will display a list of information messages
internally generated by the control program. The most recent messages are on
top of the list. Buttons allow the operator to pause and clear the trace for
debugging purposes, and to get more details by enabling a debug mode.
3. Tcl eval. If enabled, an additional panel will allow the operator to dispatch an
expression to the Tcl interpreter for evaluation. The expression may be written
on the entry field, then it will be evaluated when the eval button will be
depressed. This facility has the same effect as a TCLEVAL statement in the
configuration file. It may be used to add new functions to the control program
while it is running, by evaluating source Tcl statements referring to the plug-in
Tcl source file.
Parameters-file name
Tcl command
Trace
Figure 2.6
The extended main run-control window
ALICE DATE V3 User’s Guide
The control console
2.1.2.3
13
The option menu
The option menu (Figure 2.7) provides facilities to change the internal behaviour of
the control program.
Timer
Figure 2.7
The option menu
1. Log the info. If enabled, all the messages appearing in the information field of
the run-status panel will be sent to the Information logger as well.
2. Log the trace. If enabled, all the messages appearing in the trace panel will be
sent to the Information logger as well.
3. Update remote status. If enabled, the status of the machines in the
machine-selection panel and the variables in the status display are updated at
regular intervals. The internal timer displays a rotating segment on the right of
the menu bar (see Figure 2.7).
If disabled, a warning appears on the menu bar (Figure 2.8).
Figure 2.8
No-update indicator
4. Update interval. The operator can choose among a set of pre-defined update
intervals. Unnecessary frequent polling should be avoided, in order to interfere
as little as possible with the data taking. At each update, messages are sent to all
the machines involved, which reply sending back the variable values.
2.1.2.4
The windows menu
This menu (Figure 2.9) allows the operator to recall windows (other than the main
run-control window) that may have been either closed or iconized or hidden under
other windows. The content of this menu may vary, since plug-ins may add options
corresponding the windows they may have created.
ALICE DATE V3 User’s Guide
14
Guide to operate the system
Figure 2.9
The windows menu
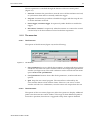
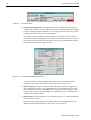
1. Configuration parameters. This option recalls the configuration-parameters
window. This window is not usually shown, since the operator need not modify
it when running in stable conditions. It is, though, the place where most of the
configuration parameters can be manipulated.
The configuration-parameters window (Figure 2.10) shows a list of common
parameters and lists of parameters specific to each machine available to (but not
necessarily involved in) the data acquisition. The lists are established according
to the declarations in the configuration file.
Figure 2.10
The configuration-parameters window
All the parameters can be modified at any time with no harm for the data
acquisition, since the values will be used exclusively at start of run.
2. Status display. This option recalls the status-display window (see Figure 2.3).
The status display shows a list of parameters for each machine involved in the
data acquisition. The lists are established according to the declarations in the
configuration file. The values are updated at regular intervals, according to the
settings of the Options menu.
3. Buffer status. This menu option is not normally present. It is a feature added by
the buffer-status plug-in.
The buffer-status plug-in may be installed either at the program startup, by
adding the following fragment of code to the configuration file:
ALICE DATE V3 User’s Guide
The infoBrowser console
Listing 2.1
15
Installation of the buffer-status plug-in.
1: TCLEVAL
2: source /date/runControl/bufferStatus.tcl
or at any time by typing the same source command into the Tcl command
window and pushing the Eval button.
A new window will then be shown (Figure 2.11), which indicates the
occupation level of the circular buffers used in the data acquisition. This
window is regularly updated, at the same time as the other status information.
Figure 2.11
The buffer status window
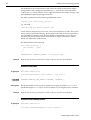
2.2 The infoBrowser console
All the components a DATE system generate all sorts of messages: diagnostics,
debugging, statistics, logging. These messages can be browsed online, filtered and
selected using the infoBrowser, an X11 tool written in Java.
The main features of the infoBrowser are:
•
small run-time overhead;
•
memory-based browsing and filtering (no use of disk resources);
•
browsing messages stored in a standard online area (${DATE_SITE_LOGS}) as
well as in archives areas;
•
display customizable in font size and color;
•
allows printing of the messages or regions of interest;
•
online context-sensitive and generic help;
•
selection of messages according to the source facility, the messages severity and
the repository logFile;
•
display of messages starting from a given time-of-day.
To start the infoBrowser console the first step is to run the DATE setup procedure.
Once the X11 display is set and enabled, it is possible to run the command
infoBrowser from the shell level. There are various run-time flags available for
special purposed (use the -help flag for a complete description). In its default
configuration, the infoBrowser will allow normal browsing of the online logs area.
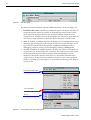
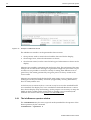
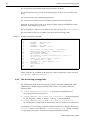
An example of how the infoBrowser window looks like is given in Figure 2.12.
Please note that the appearance might change between different versions of the
tool.
ALICE DATE V3 User’s Guide
16
Guide to operate the system
Figure 2.12
Example of infoBrowser window
The infoBrowser window can be partioned in three sections
1. the top menu, used to control the tool and the font used for the display;
2. the messages area, where the information is shown;
3. the selection control, used to control which type of information is shown on the
display.
Messages are sorted by generation time and source host. The resolution of the time
stamp is one second. In case messages are generated at high rate (more then one per
second) it is not possible to sort them correctly if coming from different sources
(processes). The stream generated by one given process is always sorted in the
correct order.
Messages are presented with all their fields: time stamp, source computer, source
facility, process ID (if available), username (if applicable), severity (Information,
Error or Fatal) and the text.
As the browser is written in Java, it can run on any host were the standard DATE
set is installed. The display runs via a standard X11 link and therefore it is vital to
have the X11 display setup and running. At this purpose it is necessary to setup the
DISPLAY shell variable (either via the shell or opening a new X-terminal) and
authorize the client on the server prior to run the infoBrowser.
2.2.1 The infoBrowser operator window
The infoBrowser may be run in a special mode (intended for the operator of the
data acquisition) by the command:
infoBrowser -operator &
ALICE DATE V3 User’s Guide
The statsBrowser console
17
The infoBrowser will then show a different window (Figure 2.13), which will not
allow the interactive selection of the message streams. Only the runLog stream will
be shown, which by convention contains only the messages concerning the general
aspects of the operations and provides a rough indications on the behaviour of the
system. In case of troubles it is of course necessary to obtain more detailed
information from the various packages, therefore the standard infoBrowser
window should be used.
It is a good practice to keep the infoBrowser operator window permanently open
on the operator console.
Figure 2.13
The infoBrowser operator window
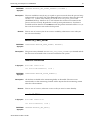
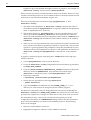
2.3 The statsBrowser console
Using the infoLogger scheme, facilities belonging to a DATE system can generate
run-time statistics records to be collected via the statsCollector daemon and
browsed with the statsBrowser tool. The statsBrowser is an X11 tool written in
Java capable to scan over the records describing a series of runs, display them and
update their content on-the-fly. It is also possible to perform online searches of
given text patterns over the available data. Help on the usage of the tool and the
statistics scheme is available via a context-sensitive scheme and using an associated
“Help” command.
To start the statsBrowser console the first step is to run the DATE setup procedure.
Once the X11 display is set and enabled, it is possible to run the command
statsBrowser from the shell level. There are various run-time flags available for
special purposes (use the -help flag for a complete description). In its default
configuration, the statsBrowser will allow browsing of the online run description
records area.
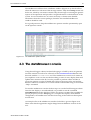
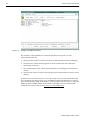
An example of how the infoBrowser window looks like is given in Figure 2.14.
Please note that the appearance might change between different versions of the
tool.
ALICE DATE V3 User’s Guide
18
Guide to operate the system
Figure 2.14
Example of statsBrowser window
The window of the statsBrowser can be divided in four sections. As seen
top-to-bottom they are:
1. the top menu, used for control over the tool and the font used for the display;
2. the status line, where the description of the tool and of the stats collection
mechanism is shown;
3. the run descriptors area, where the information concerning the selected run is
shown;
4. the selection control, used to control which type of information is shown on the
display.
As the browser is written in Java, it can run on any host were the standard DATE
set is installed. The display runs via a standard X11 link and therefore it is vital to
have the X11 display setup and running. At this purpose it is necessary to setup the
DISPLAY shell variable (either via the shell or opening a new X-terminal) and
authorize the client on the server prior to run the infoBrowser.
ALICE DATE V3 User’s Guide
Data recording
and data
format
3
This chapter describes how the data can be recorded in the LDCs and in
the GDC. It explains also the conventions concerning the filenames. It
then describes the format of the data produced in the LDCs, the
different event types used in DATE and the format of the full event,
built in the GDC.
ALICE DATE V3 User’s Guide
3.1
Data recording . . . . . . . . . . . . . . . . . . . . . . . . . . . 20
3.2
Data files . . . . . . . . . . . . . . . . . . . . . . . . . . . . . . 20
3.3
The data format. . . . . . . . . . . . . . . . . . . . . . . . . . . 21
3.4
The event types . . . . . . . . . . . . . . . . . . . . . . . . . . . 23
3.5
The full event format . . . . . . . . . . . . . . . . . . . . . . . 24
20
Data recording and data format
3.1 Data recording
3.1.1 Data recording from a LDC
The data generated in a LDC can be recorded in two different ways: either by
recording them to a local disk file or by sending them to a GDC.
If the data-acquisition system is composed by a single front-end processor, without
any event-building functionality, the recorder process can write the readout
data to an output file on disk. The full path of the directory and filename has to be
specified as recording device of the LDC in the run control configuration
parameters panel, for example:
/tmp/my_raw_data.dat
If the data-acquisition system includes a GDC for the event building, the
recorder process can send the data to the GDC. This option is selected by
specifying a recording device that ends with “:”. In this case, the recording device
name must be the host name of the event-builder machine, for example:
mppcna57eb01:
The recorder process uses the infoLogger facility to report and trace error or
abnormal conditions and to trace state changes.
3.1.2 Data recording from a GDC
The data assembled in a GDC can be recorded to a local disk file by the
eventBuilder process.
The full path of the directory and filename has to be specified as recording device of
the GDC in the Run Control panel, for example:
/tmp/my_raw_data.dat
The output filename may include any character except a “:”.
The directory in which the filename resides should have write access for “nobody”;
one can either give write access for everybody or change the owner of the directory.
The eventBuilder process uses the infoLogger facility to report and trace error or
abnormal conditions and to trace state changes.
3.2 Data files
The data are recorded in unix data files. It is possible to limit the total amount of
information to be recorded in a run by setting the parameter maxBytes (in kBytes)
in the run control configuration parameters panel. A “0” value of the maxBytes
parameter means that there is no limit. If maxBytes is different from 0, when this
ALICE DATE V3 User’s Guide
The data format
21
limit is reached, the program recording the data (recorder in the LDC or the
eventBuilder in the GDC) will request the run control to stop the run.
The data of a run may be recorded to one or several disk files. The maximum size of
each file is fixed by the parameter maxFileSize (in kBytes). It allows to limit the
file size independently of the run duration. A “0” value of maxFileSize
parameter means that there is no limit and that all the data will be recorded in a
unique file. If maxFileSize is different from 0, when this limit is reached, the
program recording the data (recorder in the LDC or the eventBuilder in the
GDC) will open a new file.
The full path of the directory and filename has to be specified as recording device of
the GDC in the Run Control panel. Some characters have a special meanings: “@” is
replaced by the event builder host name and “#” is replaced by the current run
number. With the following value of the recording device:
/data/run_#.raw
the data of the run 1020 will be recorded into the file /data/run_1020.raw if
there is no limit on the filesize.
If there is a limit on the maximum file size, the data will be recorded to a sequence
of files. Their filenames will be formed by the addition of the original filename for
this run and a sequential number: /data/run_1020_000.raw,
/data/run_1020_001.raw, /data/run_1020_002.raw etc... The
sequential number 0 is reserved for the data recorded at start-of-run. It includes the
records of the types START_OF_RUN and START_OF_RUN_FILES.
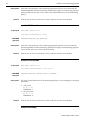
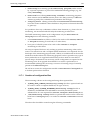
3.3 The data format
The data format is described by the eventStruct structure defined in the file
/date/commonDefs/event.h . An event is constituted by an event header,
described by the eventHeaderStruc structure, followed by the event data. The
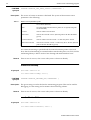
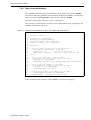
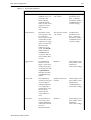
fields in the event header are shown in Listing 3.1. The meaning and the size of
each field in the event header are explained in Table 3.1. The DATE package which
writes each field is also indicated in the table. Indeed, the fields of the event header
are set by one of the three following packages: the readout process, the user code of
the readout process or by the event builder.
A program is included in the DATE system to dump a data file recorded following
the DATE data format.This tool is available in the monitoring package and is called
eventDump (see Section 4.3).
ALICE DATE V3 User’s Guide
22
Data recording and data format
Listing 3.1
Event header structure
1: struct eventHeaderStruct {
2:
long32 size;
/* size of event in Bytes */
3:
unsigned long32 magic;
/* magic number used for
consistency check */
4:
unsigned long32 type;
/* event type */
5:
unsigned long32 headLen;
/* size of header in bytes */
6:
unsigned long32 runNb;
/* run number */
7:
unsigned long32 burstNb;
/* burst number */
8:
unsigned long32 nbInRun;
/* event number in run */
9:
unsigned long32 nbInBurst;
/* event number in burst */
10:
unsigned long32 triggerNb;
/* trigger number for this
detector */
11:
unsigned long32 fileSeqNb;
/* File sequence number for
multifiles run */
12:
detectorIdType detectorId[MASK_LENGTH]; /* detector
identification */
13:
unsigned long32 time;
/* Time in seconds since 0.00
GMT 1.1.1970 */
14:
unsigned long32 usec;
/* microseconds */
15:
unsigned long32 errorCode;
16:
unsigned long32 deadTime;
17:
unsigned long32 deadTimeusec;
18: };
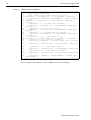
Table 3.1
Event header fields
FIELD
MEANING
size (32 bits)
size of event in bytes; set by the readout process.
magic (32 bits)
number used for consistency check an to discover the
byte ordering; set by the readout process.
type (32 bits)
type of record; see Table 3.2
headLen (32 bits)
size of header in bytes; set by the readout process.
runNb (32 bits)
run number; set by the readout process.
burstNb (32 bits)
burst number; initialized to 0 by the readout process.
This field is set by the user routine ReadEvent.
nbInRun (32 bits)
event number within run; initialized to NOT_SET_TAG
by the readout process and set by the user routine
ReadEvent. The readout process logs an error message if this field is not filled upon return from the routine. This is the unique number identifying the event.
nbInBurst (32 bits)
event number within burst; initialized to 0 by the readout process. This field is set by the user routine ReadEvent.
triggerNb (32 bits)
trigger number for this detector; this field is incremented
by the readout process only for PHYSICS_EVENT type
of records.
fileSeqNb (32 bits)
sequence number of the raw data file containing this
event. This field is set by the recording library in the
recorder or the eventBuilder process.
ALICE DATE V3 User’s Guide
The event types
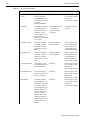
Table 3.1
23
Event header fields
FIELD
MEANING
detectorId (96 bits)
detector identification mask; initialized to 0 by the readout process. Each bit identifies one LDC. The event
builder process will write in this field the detector bit a as
declared by the user in the runControl.config. file.
Valid detectors bit are from 0 to 94.
time (32 bits)
Time in number of seconds since 0.00 GMT 1.1.1970; set
by the readout process.
usec (32 bits)
time in milliseconds to be added to the previous field; set
by the readout process.
errorCode (32 bits)
error code for the event; initialized to 0 by the readout
process. This field is an experiment dependent error
code that the user may set to signal any kind of error
occurred during the readout phase.
deadTime (32 bits)
dead time for the event readout in seconds; initialized to
0 by the readout process. This field may be set by the
user to measure the dead time in seconds for the readout of a particular equipment.
deadTimeusec (32 bits)
dead time for the event readout in milliseconds; initialized to 0 by the readout process. This field may be set
by the user to measure the dead time in milliseconds
for the readout of a particular equipment.
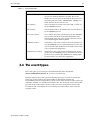
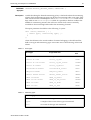
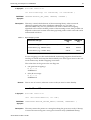
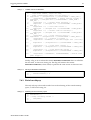
3.4 The event types
The event types (or record types) are defined in the same include file
/date/commonDefs/event.h as shown in Listing 3.2.
The first usage of the event type is to identify each type of event or record. The
event type is also used by the event-builder to determine whether the
event-building has to be applied on a given event. Only the sub-events of the type
“PHYSICS_EVENT” are assembled into full events. For all the sub-events of the other
types the event builder adds a header to the sub-event coming from one LDC and
record them. The event builder does not attempt to assemble these sub-events into
complete events.
ALICE DATE V3 User’s Guide
24
Data recording and data format
Listing 3.2
Event types
1:
2:
3:
4:
5:
6:
7:
8:
9:
10:
11:
12:
13:
14:
15:
16:
17:
18:
19:
20:
21:
22:
23:
24:
25:
26:
27:
/* Possible Values for type in eventHeaderStruct */
/* Mask to separate the event type from the event flags */
#define EVENT_TYPE_MASK
((unsigned long32)0x0000FFFF)
#define EVENT_FLAGS_MASK
((unsigned long32)~EVENT_TYPE_MASK)
/* Event error flags: */
#define EVENT_ERROR
((unsigned long32)0x80000000)
#define EVENT_DATA_TRUNCATED ((unsigned long32)0x40000000)
/* Event flags: */
#define EVENT_EQUIPMENT
((unsigned long32)0x00010000)
/* Event types: */
#define START_OF_RUN
#define END_OF_RUN
#define START_OF_RUN_FILES
#define END_OF_RUN_FILES
#define START_OF_BURST
#define END_OF_BURST
#define PHYSICS_EVENT
#define CALIBRATION_EVENT
#define END_OF_LINK
#define EVENT_FORMAT_ERROR
((unsigned
((unsigned
((unsigned
((unsigned
((unsigned
((unsigned
((unsigned
((unsigned
((unsigned
((unsigned
#define EVENT_TYPE_MIN
#define EVENT_TYPE_MAX
1
10
long32)1)
long32)2)
long32)3)
long32)4)
long32)5)
long32)6)
long32)7)
long32)8)
long32)9)
long32)10)
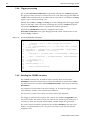
The list of possible record types of the field type in the event header is given in
Table 3.2.
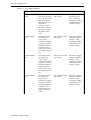
Table 3.2
List of record types
Type of record
Set by
START_OF_RUN
the readout process
END_OF_RUN
the readout process
START_OF_RUN_FILES
the readout process
END_OF_RUN_FILES
the readout process
START_OF_BURST
the user routine ReadEvent
END_OF_BURST
the user routine ReadEvent
PHYSICS_EVENT
the readout process
CALIBRATION_EVENT
not used in the present version
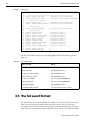
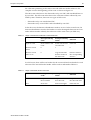
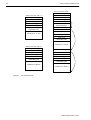
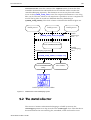
3.5 The full event format
The data format structure described before applies to sub-events and to full events.
Each event will include a header and a data block. In the cases of a full event
assembled by the event-builder, the data block is itself subdivided into sub-events.
Each subevent will include a header and a data block. The event builder assembles
ALICE DATE V3 User’s Guide
The full event format
25
the subevents pertaining to the same event and adds one header relative to the
complete event at the beginning of the event. as shown in Figure 3.1.
The sub-event refers here to the data read-out by one LDC and assembled later on
by one GDC. The full event refers here to the collection of data collected by one
DATE system. Therefore, there are two types of full event:
–
data read-out by one stand-alone LDC;
–
data read-out by several LDCs and assembled by one GDC.
In the first case, the detector identification mask is set to 0. In the second case, the
detector identification mask in the header is used to distinguish between an event
and a subevent and to identify the subevents of the same event (see Table 3.3).
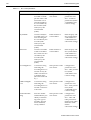
Table 3.3
Usage of the detector identification mask header field
Event generated by
a LDC
Event generated by
a GDC
Type of event
Event with no subevent
Event with at least
one subevent
Subevent
Detector mask
bit 95
0
1
0
Detector mask
bits 0 to 93
0
Logical OR of the
detector masks of
the subevents
Detector mask of
the corresponding
detector
Subevent
In a full event, there will be one header for the event itself and one header for each
subevent. The size field in the header will be used as indicated in Table 3.4.
Table 3.4
Usage of the header len and of the size
Event generated by
a LDC
Event generated by
a GDC
Subevent
Header len
Displacement to
the event data
Displacement to
first subevent
Displacement to
the subevent data
Size
Event size
Full event length
Subevent size
ALICE DATE V3 User’s Guide
26
Data recording and data format
Subevent from LDC A
Subevent A length
...
type=PHYSICS_EVENT
Header length
...
detectorId
0000 0000 0001
Full event from GDC
Event length
...
...
type=PHYSICS_EVENT
Header length
...
detectorId
8000 0000 8001
Subevent A length
...
type=PHYSICS_EVENT
Subdetector A data
...
detectorId
0000 0000 0001
Subdetector A data
Subevent from LDC B
Subevent B length
...
type=PHYSICS_EVENT
Header length
...
detectorId
0000 0000 0800
Subevent B length
...
type=PHYSICS_EVENT
Header length
...
detectorId
0000 0000 0800
Subdetector B data
Subdetector B data
Figure 3.1
The full event format
ALICE DATE V3 User’s Guide
Guide to write
a monitoring
program
4
This chapter describes how to write a monitoring program. After a brief
introduction to the monitoring in DATE, the monitoring library is explained and its
use from all the most commonly used programming languages.
ALICE DATE V3 User’s Guide
4.1
Monitoring in DATE . . . . . . . . . . . . . . . . . . . . . . . . 28
4.2
Monitoring and Analysis in C/FORTRAN . . . . . . . . . . . 30
4.3
The “eventDump” utility program. . . . . . . . . . . . . . . . 40
28
Guide to write a monitoring program
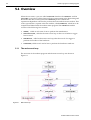
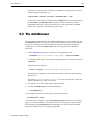
4.1 Monitoring in DATE
A Data Acquisition system such as DATE may require monitoring of experimental
data (online and offline data, on online and offline hosts). Some possible
applications for this kind of monitor tasks are:
•
statistical analysis of the experimental stream to evaluate the quality of the
physics conditions;
•
detailed analysis of the experimental data to extract specific information such as
configuration, occupancy and efficiency of the hardware;
•
occasional checking of the overall status of the Data Acquisition system (e.g.
operator status panel).
To perform these and other functions, DATE provides the monitoring package,
whose objective is to offer a uniform interface for the development and the support
of user-written monitoring programs tailored to specific needs. The monitoring
interface implements access to events coming from the live experimental stream or
from a Permanent Data Storage (PDS) media, with statistical or strict monitoring
purposes, on online (part of the Data Acquisition system) or offline (near the online
or totally detached) hosts.
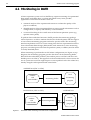
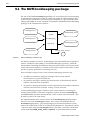
When monitoring is performed in its full online configuration (see Figure 4.1 top
diagram), the monitoring program gets the data from a local monitoring buffer,
filled from the online data producer (the readout process on LDCs and the event
builder process on GDCs). This approach is the most efficient for what concerns the
use of system resources but might impose an unacceptable load on the online host,
already charged with acquisition and control tasks.
ONLINE host (LDC or GDC)
local
readout
OR
event builder
monitoring buffer
program
ONLINE host (LDC or GDC)
readout
OR
event builder
Figure 4.1
monitoring
OFFLINE host
remote
monitoring buffer
monitoring
program
The DATE online monitoring, local and remote configurations
ALICE DATE V3 User’s Guide
Monitoring in DATE
29
To “off-load” the online environment, it is possible to run the monitoring program
on another host, linked to the first via LAN or WAN (see Figure 4.1 bottom
diagram). The result is similar to what we achieved in the first configuration, with
the advantage of freeing resources on the Data Acquisition host, at the price of an
increased load on the interconnecting network between the two machines. The
same Data Acquisition system can have - without reconfiguration - several local
and remote monitoring programs, all running simultaneously and getting their
data from the same source. However, each monitoring program can receive its data
to monitor from one source at a time. It is possible to switch forth and back between
different data sources within the same monitoring program, although this practice
is not recommended.
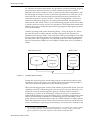
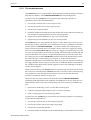
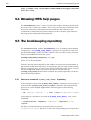
Another operating mode of the monitoring library - shown in Figure 4.2 - allows
the same functions on offline streams, usually coming from the experiment’s
Permanent Data Storage (PDS)1. This setup allows direct monitoring from the PDS
server or from other hosts (batch server, desktop or workstation) not connected to
the PDS media. This configuration can optionally make use of the CERN Remote
File I/O system library (RFIO) to access SHIFT or HPSS disks servers available at
CERN.
PDS-attached host
PDS
Figure 4.2
Remote host
local
remote
monitoring
monitoring
program
program
The DATE offline monitoring
During the connection phase, monitoring program can declare themselves to the
monitoring scheme. This allows easy tracing of each client and makes possible to
“fine tune” the runtime parameters of the monitoring system.
When a monitoring program connects itself with the experimental stream, it has the
capability to declare a monitoring policy for any given event type. This policy can
require all events for monitoring (must policy), a random share of events for
monitoring (yes policy) or no monitoring at all (none policy). It is important to
understand the impact of a given monitoring policy on the Data Acquisition system
and on the monitoring environment. A monitoring program requesting a must
policy must process the information as fast as it will be offered or it might stall the
entire data acquisition system. On the other hand, the exclusion of certain classes of
events - unwanted for a given type of monitoring - will reduce the overhead on the
1. The term PDS - defined in the ALICE technical proposal - is used here with a wider meaning,
also covering permanent, semi-permanent and temporary storage, usually located in the
physical path between the Data Acquisition online buffer and the final PDS.
ALICE DATE V3 User’s Guide
30
Guide to write a monitoring program
online host and on the interconnecting network, as less data will be stored and
transferred between the online producer (readout or event builder) and the
consumer (the monitoring program).
Monitoring programs have the choice to stall if no data is available or to continue
with their execution (knowing that no data has been received). This allows the
implementation of event-driven processes (such as X11 clients) that should not be
blocked in absence of data.
Another feature of the monitoring library is to let a monitoring program discard all
data eventually stored in the monitoring buffer. This is useful to access only future
events at any given point in time.
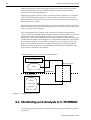
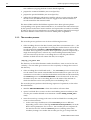
Some experimental setups might “hide” their Data Acquisition hosts behind
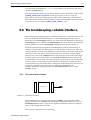
routers or firewalls, making remote monitoring difficult or impossible. To solve this
problem, the DATE monitoring library allows a mechanism called “relayed
monitoring”, where the monitoring channel travels through a dedicated relay host
(visible from the offline host and with access to the hidden online host). The scheme
is described in Figure 4.3. It is possible to filter the access through the relay host
only to a restricted set of clients, according to the type of monitoring requested.
Relayed monitoring performs worse then direct monitoring and should be used
only whenever absolutely unavoidable.
ONLINE HOST (LDC/GDC) or PDS-attached host
monitoring buffer
RELAY HOST
PDS
FIREWALL
OFFLINE HOST
remote
monitoring
program
Figure 4.3
The DATE relayed monitoring
4.2 Monitoring and Analysis in C/FORTRAN
A monitoring program should accomplish the following steps in order to perform
its function:
ALICE DATE V3 User’s Guide
Monitoring and Analysis in C/FORTRAN
31
1. declare the source providing the data to monitor;
2. declare itself to the monitoring scheme;
3. declare - if necessary - the monitor policy he wishes to use;
4. declare - if necessary - the wait/nowait policy to be followed;
5. get the available event(s) from the monitoring stream.
This chapter describes the callable interface available within the DATA monitoring
package and its characteristics.
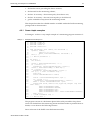
4.2.1 Some simple examples
In Listing 4.1 we have a very simple example of a monitoring program written in C.
Listing 4.1
Example of event dump in C:
1:
2:
3:
4:
5:
6:
7:
8:
9:
10:
11:
12:
13:
14:
15:
16:
17:
18:
19:
20:
21:
22:
23:
24:
25:
26:
27:
28:
29:
30:
31:
32:
33:
34:
35:
36:
37:
38:
#include
#include
#include
#include
<stdio.h>
<stdlib.h>
“event.h”
“monitor.h”
void printError( char *where, int errorCode ) {
fprintf( stderr,
“Error in %s: %s\n”,
where, monitorDecodeError( errorCode ) );
exit( 1 );
} /* End of printError */
int main() {
int status;
status = monitorSetDataSource( “:” );
if ( status != 0 )
printError( “monitorSetDataSource”, status );
status = monitorDeclareMp( “C demo mp” );
if ( status != 0 )
printError( “monitorDeclareMp”, status );
for (;;){ /* Start of endless loop */
void *ptr;
struct eventHeaderStruct *event;
status = monitorGetEventDynamic( &ptr );
if ( status != 0 )
printError( “monitorGetEventDynamic”, status );
event = (struct eventHeaderStruct *)ptr;
printf(“Run #:%ld, Event #:%ld, Type:%ld, Length: %ld, Data
size: %d\n”,
event->eventHeader.runNb,
event->eventHeader.nbInRun,
event->eventHeader.type,
event->eventHeader.size,
event->eventHeader.size - event->eventHeader.headLen);
free( ptr );
} /* End of endless loop */
} /* End of main */
The program consists of a declaration phase followed by an endless loop where
events are fetched from the monitoring stream and their header is printed. More in
details, we can observe the following features:
line 3: inclusion of the DATE event declaration module;
ALICE DATE V3 User’s Guide
32
Guide to write a monitoring program
line 4: inclusion of the DATE monitoring declaration module;
line 16: declaration of the source of monitoring data (in this case, the online local
host);
line 19: declaration of the monitoring program;
line 26: the next available event is transferred from the monitoring buffer.
Similarly, in Listing 4.2 we can see a simple example written in FORTRAN. Main
features of this simple program are:
line 8: declaration of the source of data (in this case, the local file /tmp/runData);
line 14: transfer of the next available event from the monitoring buffer.
Listing 4.2
Example of analysis in FORTRAN
1:
2:
3:
4:
5:
6:
7:
8:
9:
10:
11:
12:
13:
14:
15:
16:
17:
18:
19:
20:
PROGRAM HSIMPLE
INTEGER
INTEGER
INTEGER
PARAMETER
10
VECTOR(100000)
STATUS
get_event
(NWPAWC = 10000)
CALL monitor_set_data_source( ‘/tmp/runData’ )
CALL monitor_declare_mp( ‘FORTRAN demo mp’ )
CALL HLIMIT( NWPAWC )
CALL HTITLE( ‘Example’ )
CALL HBOOK1( 10,’Event size dist’,50,0.,20000.,0. )
DO 10 I=1,100
STATUS = get_event( VECTOR, 100000*4 )
IF ( STATUS .LE. 0 ) STOP
CALL HF1( 10, FLOAT( VECTOR(1) ),1. )
CONTINUE
CALL HPRINT( 10 )
STOP
END
Other examples are available in the directory /date/monitoring, namely the files:
eventDump.c and eventDumpFtn.f
4.2.2 The monitoring package files
The distribution point for the monitoring package is ${DATE_MONITOR_DIR}
(defined by the DATE setup procedure). In this area it is possible to find the
following files:
•
${DATE_MONITOR_DIR}/monitor.h: prototypes and definitions for
monitoring programs written in C;
•
${DATE_MONITOR_DIR}/${DATE_SYS}/libmonitor.a: monitoring library
for any language capable of calling C code (e.g. C and FORTRAN);
•
${DATE_MONITOR_DIR}/${DATE_SYS}/libmonitorstdalone.a:
monitoring library with reduced functionality for non-SHIFT hosts (see below).
Compilation of C monitoring programs should include the prototypes declaration
monitor.h either via the directive -I${DATE_MONITOR_DIR} (DATE machines)
or copying the prototypes declaration locally (non-DATE machines).
ALICE DATE V3 User’s Guide
Monitoring and Analysis in C/FORTRAN
33
Linking monitoring programs require the following libraries:
1. ${DATE_MONITOR_DIR}/${DATE_SYS}/libmonitor.a
or the equivalent for non-SHIFT hosts
${DATE_MONITOR_DIR}/${DATE_SYS}/libmonitorstdalone.a
(see below for more details);
2. network libraries (on SunOS: -lsocket -lnsl) eventually required for socket
I/O (man 3n socket should normally give pointers to those libraries);
3. on machines where the CERN Remote File I/O (RFIO) library is available, the
SHIFT library (usually available as: /usr/local/lib/libshift.a), plus all
the libraries eventually required by the SHIFT library itself (not needed if the
libmonitorstdalone.a library is used).
The SHIFT library - referenced by the monitoring I/O package - is used to access
hosts whose PDS is available on SHIFT servers via Remote File I/O (RFIO) system,
e.g. the CERN ALICE WorkGroup server (ION), the CERN batch processing facility
(SHIFT) and the CERN High Performance Storage System (HPSS) servers. If access
to any of these three facilities is not required, the inclusion of the libshift.a
library is not necessary. In this case, a special version of the monitoring library is
available as
${DATE_MONITOR_DIR}/${DATE_SYS}/libmonitorstdalone.a
This library will not reference the RFIO system and can be used for local file I/O
only.
Hardware and software platforms not part of the standard DATE distribution - but
possible clients of the DATE monitoring scheme (see Table 11.1) - can still use the
monitoring library by copying the necessary files and performing a local
compilation and link.
4.2.3 Error codes
The entries belonging to the monitoring library may return a monitoring-specific
error code. This code can be either zero for success or non-zero for failure. To
decode an error code please refer to the ${DATE_MONITOR_DIR}/monitor.h file
or call the entry monitorDecodeError described in the next section.
4.2.4 The monitoring callable library
This section describes the entries available in the monitoring library. Each entry is
described in the C version and - if available - in the FORTRAN equivalent. For the
decoding of error codes eventually returned by the entries, please refer to 4.2.3.
monitorSetDataSource
C Synopsis
#include “monitor.h”
int monitorSetDataSource( char* )
ALICE DATE V3 User’s Guide
34
Guide to write a monitoring program
FORTRAN
Synopsis
Description
Table 4.1
INTEGER MONITOR_SET_DATA_SOURCE( CHARACTER* )
The source of events to monitor is declared. The syntax of the monitor source
parameter is the following:
Monitor source parameter syntax
“:”
local online (default)
“file”
local file (both full and relative paths are accepted, full path
recommended)
“@host:”
remote online on node host
“file@host”
remote file on node “host” (the full path to the file should be
given)
“@host1@host2:”
remote online on node “host1” via the relay host “host2”
“file@host1@host2”
remote file on node “host1” via the relay host “host2” (the full
path to the file should be given)
If a remote monitoring is specified and the remote hostname points to the local
host, then local monitoring is assumed and no transfer take place over TCP/IP. The
monitoring library is able to resolve host aliasing and multi-interface hosts.
Returns
Zero in case of success, else a error code (see 4.2.3 for more details).
monitorDeclareMp
C Synopsis
#include “monitor.h”
int monitorDeclareMp( char* )
FORTRAN
Synopsis
Description
Returns
INTEGER MONITOR_DECLARE_MP( CHARACTER* )
The given string is used to declare the monitoring program. This can be used for
debugging, for fine tuning and to monitor the monitoring scheme.
Zero in case of success, else a error code (see 4.2.3 for more details).
monitorDeclareTable
C Synopsis
#include “monitor.h”
int monitorDeclareTable( char** )
ALICE DATE V3 User’s Guide
Monitoring and Analysis in C/FORTRAN
FORTRAN
Synopsis
Description
35
INTEGER MONITOR_DECLARE_TABLE( CHARACTER* )
A table describing the desired monitoring policy is declared within the monitoring
scheme. Each monitoring program can declare a monitoring table at any time. This
table will be used for all subsequent calls to monitorSetDataSource and will be
kept valid in case monitorLogout is called. It is possible to declare a table in the
middle of a monitoring stream: this will force a flush of all events eventually
available in the monitoring buffer and in the monitoring channel.
The input parameter should have the following C syntax:
char *table[ nEntries ] = {
[ “event type”, “monitoring type”, ]*
0
};
where the nEntries is the actual number of entries belonging to the table and the
field event type and monitoring type can assume one of the following values and
aliases:
Table 4.2
Table 4.3
Event types
Event type
Single-word alias
Short
alias
“All events”
“All_events”
“ALL”
“Start of run”
“Start_of_run”
“SOR”
“Start of run files”
“Start_of_run_files”
“SORF”
“Start of burst”
“Start_of_burst”
“SOB”
“Calibration event”
“Calibration_event”
“CAL”
“Physics event”
“Physics_event”
“PHY”
“Event format error”
“Event_format_error”
“FERR”
“End of burst”
“End_of_burst”
“EOB”
“End of run files”
“End_of_run_files”
“EORF”
“End of link”
“End_of_link”
“EOL”
“End of run”
“End_of_run”
“EOR”
Monitoring types
Monitoring type
Action
“all”
all events of this type are monitored (100%)
“yes”
a sample of the events of this type is monitored
“no”
no events of this type are monitored
ALICE DATE V3 User’s Guide
36
Guide to write a monitoring program
All declarations are case-insensitive and can be shortened to the nearest unique
string (watch out for ambiguous shortening, e.g. “end of run” can match either
“end of run” or “end of run files”). The single-word aliases are used to comply with
the FORTRAN argument passing convention.
The input parameter has the following FORTRAN syntax:
‘(event_type monitoring_policy)*’
e.g., the table:
‘SOR yes EOR yes Physics_event yes’
can be used to request only start of run, end of run and physics events. The syntax
for the event_type and monitoring_policy fields is the same as for the equivalent C
call (see Tables 4.2 and 4.3) with the only difference that blanks are not allowed
inside the keywords (either use the short aliases or single word aliases, where
blanks are replaced by underscores).
The default table is the following:
char *defaultTable[ 3 ] = {
“All events”, “yes”,
0
};
CHARACTER*14 DEFAULT_TABLE / ’All_events yes’ /
Returns
Zero in case of success, otherwise a error code (see 4.2.3 for more details).
monitorGetEvent
C Synopsis
#include “monitor.h”
int monitorGetEvent( void *buffer, long size )
FORTRAN
Synopsis
Description
Returns
INTEGER MONITOR_GET_EVENT( INTEGER, INTEGER )
The next available event (if any) is copied in the region pointed by buffer for a
maximum length of size bytes. In case of failure, a zero-length event is returned.
Zero in case of success, otherwise a error code (see 4.2.3 for more details).
monitorGetEventDynamic
C Synopsis
#include “monitor.h”
int monitorGetEventDynamic( void **buffer )
ALICE DATE V3 User’s Guide
Monitoring and Analysis in C/FORTRAN
FORTRAN
Synopsis
Description
Returns
37
INTEGER MONITOR_GET_EVENT_DYNAMIC( POINTER )
The next available event (if any) is copied on space reserved from the process heap
and returned to the caller. The caller must take care of properly disposing the event
via the free system call (C library) or via the MONITOR_FREE_EVENT call
(FORTRAN library): failure to do so will exhaust the resources associated to the
process and can severely degrade the overall system performances. If no data is
available and the channel set in noWait mode the pointer returned will be NULL; in
this case the event does not need to be disposed.
Zero in case of success (also if no event is available), otherwise a error code (see
4.2.3 for more details).
MONITOR_FREE_EVENT
FORTRAN
Synopsis
Description
SUBROUTINE MONITOR_FREE_EVENT( POINTER )
The given event (obtained via MONITOR_GET_EVENT_DYNAMIC) is released and all
the resources associated to the event are returned to the system.
monitorFlushEvents
C Synopsis
#include “monitor.h”
int monitorFlushEvents( void )
FORTRAN
Synopsis
Description
Returns
SUBROUTINE MONITOR_FLUSH_EVENTS()
All the data available in the monitoring buffer is discarded. The next event
transferred over the monitoring channel will be injected in the monitoring stream
after this call terminates.
Zero in case of success, otherwise a error code (see 4.2.3 for more details).
monitorSetWait
C Synopsis
#include “monitor.h”
int monitorSetWait( void )
FORTRAN
Synopsis
INTEGER MONITOR_SET_WAIT()
ALICE DATE V3 User’s Guide
38
Guide to write a monitoring program
Description
Returns
After this call completes, if the monitoring program requests an event when the
monitoring buffer and the monitoring channel are empty, the monitoring program
will stop and wait for new events. This is the default behaviour of the monitoring
library.
Zero in case of success, otherwise a error code (see 4.2.3 for more details).
monitorSetNowait
C Synopsis
#include “monitor.h”
int monitorSetNowait( void )
FORTRAN
Synopsis
Description
Returns
INTEGER MONITOR_SET_NOWAIT()
After this call completes, if the monitoring program requests an event when the
monitoring buffer and the monitoring channel are empty, the monitoring program
will continue and a error code will be returned.
Zero in case of success, otherwise a error code (see 4.2.3 for more details).
monitorControlWait
C Synopsis
#include “monitor.h”
int monitorControlWait( int flag )
FORTRAN
Synopsis
Description
Returns
INTEGER MONITOR_CONTROL_WAIT( INTEGER )
The wait/nowait behaviour of the monitoring library is set accordingly to the input
parameter:
•
true (wait):
C: (0 == 0)
FORTRAN: 1
•
false (nowait):
C: (0 == 1)
FORTRAN: 0
Zero in case of success, otherwise a error code (see 4.2.3 for more details).
monitorSetSwap
ALICE DATE V3 User’s Guide
Monitoring and Analysis in C/FORTRAN
C Synopsis
39
#include “monitor.h”
int monitorSetSwap( int 32BitWords, int 16BitWords )
FORTRAN
Synopsis
Description
Table 4.4
INTEGER MONITOR_SET_SWAP( INTEGER, INTEGER )
This entry controls the behaviour of the monitoring library when a network
channel is opened with a host of different endianness (e.g. PC/DEC vs.
Motorola/IBM/Sun). The two parameters are used to control the swapping
algorithm to be used for the data portion of the incoming events; their possible use
depends on the actual content of the data (payload) portion of the event and can be
summarized as follows:
Bytes swapping control
32BitWords
flag
16BitWords
flag
8-bit entities (signed or unsigned characters)
FALSE
FALSE
32-bit entities (e.g. VMEbus data)
TRUE
FALSE
16-bit entities (e.g. CAMAC data)
FALSE
TRUE
Data buffer data type
In case swapping is not known beforehand, monitoring programs should set the
two flags to FALSE and swap the data manually once their type is known: this will
avoid unnecessary double-swapping at run-time.
The values that can be given to the two flags are:
Returns
•
true (perform swapping):
C: (0 == 0)
FORTRAN: 1
•
false (do not swap):
C: (0 == 1)
FORTRAN: 0
Zero in case of success, otherwise a error code (see 4.2.3 for more details).
monitorDecodeError
C Synopsis
#include “monitor.h”
char *monitorDecodeError( int code )
FORTRAN
Synopsis
Description
SUBROUTINE MONITOR_DECODE_ERROR( INTEGER, CHARACTER* )
The entry returns the pointer to a string describing the given error code (C library)
or stores the same string into a user-given character array (FORTRAN library).
ALICE DATE V3 User’s Guide
40
Guide to write a monitoring program
Returns
Pointer to a C zero-terminated static, read-only string (C library only).
monitorLogout
C Synopsis
#include “monitor.h”
int monitorLogout( void )
FORTRAN
Synopsis
Description
Returns
INTEGER MONITOR_LOGOUT()
The monitoring link is closed and all resources allocated for this monitoring
program are freed. The link will be automatically re-opened when the monitoring
program will request the next event. This entry can be used whenever the
monitoring program expects long pauses, such as operator input. It imposes a
certain overhead on the monitoring scheme and therefore should not be used too
frequently.
Zero in case of success, otherwise a error code (see 4.2.3 for more details).
4.3 The “eventDump” utility program
Part of the standard DATE kit is the utility eventDump. This image allows easy
monitoring of any stream, useful for a quick check or for debug of a running
system. The standard DATE kit provides a version of the eventDump utility for
each architecture fully supported or only with monitoring support (see Table 11.1).
To run the utility on DATE hosts, execute the standard DATE setup and issue the
command
$ eventDump buffer
For non-DATE hosts, copy the utility in your PATH (or declare a proper alias) and
then issue the same command as for DATE hosts.
A list of all available options can be shown via the “-?” command-line flag. Some
of the parameters are:
•
-b brief output (does not display event data);
•
-c check events data against a pre-defined data pattern (test environment only);
•
-s use static data buffer rather then dynamic memory;
•
-a use asynchronous reads (nowait mode);
•
-i interactive: pauses after each event and proposes a mini-menu with several
options;
•
-t allows the declaration of a monitoring table, e.g.:
ALICE DATE V3 User’s Guide
The “eventDump” utility program
41
-t “SOR all EOR all”
will show all Start-of-Run and End-of-Run events available, skipping all
the other events.
The buffer parameter must always be specified. The syntax to be used is the same
as for the parameter of the monitorSetDataSource entry (see Table 4.1).
ALICE DATE V3 User’s Guide
42
Guide to write a monitoring program
ALICE DATE V3 User’s Guide
Guide to
prepare a
readout
program
5
This chapter describes the software running in the front-end crates. In particular it
explains how to customize it and how to build the readout program, responsible for
performing the hardware readout.
ALICE DATE V2 User’s Guide
5.1
Overview . . . . . . . . . . . . . . . . . . . . . . . . . . . . . . 44
5.2
The readList templates. . . . . . . . . . . . . . . . . . . . . . . 47
5.3
Report message to the infoLogger . . . . . . . . . . . . . . . . 51
5.4
Customization of the front-end software . . . . . . . . . . . . 52
5.5
How to build and install a readout program . . . . . . . . . . 54
44
Guide to prepare a readout program
5.1 Overview
When the run starts, a process called rcServer launches the readout and the
recorder processes in all the front-end crates participating in the data taking and
declared in the Run Control panel.The readout process contains the
experiment-dependent code used to perform the front-end electronic readout. This
code is specified in a separate software module, called readList, which has to be
compiled and linked with the readout main program.The readlist module
consists of the following four routines:
•
ArmHw, called at each start of run to perform the initialization.
•
EventArrived, called in the main event loop to discover whether a trigger
has occurred.
•
ReadEvent, called in the main event loop after the arrival of a trigger to
perform the readout of the hardware.
•
DisArmHw,called at each end of run to perform the hardware rundown.
5.1.1 The main event loop
The structure of the readout program and the main event loop are shown in
Figure 5.1
Figure 5.1
Main event loop
ALICE DATE V2 User’s Guide
Overview
45
5.1.2 The readout process
The readout process is responsible for performing the hardware readout. It inserts
data into two buffers, called RECORDINGBUFFER and monitoring buffer.
At start of run, the readout process performs the following sequence of
operations, in the order described below:
•
execute the common start of run scripts (if any)
•
execute the specific start of run scripts (if any)
•
call the user routine ArmHw
•
build the header of the SOR record and fill the data of the SOR record with the
run conditions (copying the Run Control shared segment)
•
prepare the common SOR files (if any, one record per file)
•
prepare the specific SOR files (if any, one record per file)
The readout process then initiates the physics events main loop. First it reserves
the amount of space specified as the “Maximum event size” parameter in the Run
Control panel in RECORDINGBUFFER. If it doesn’t find it, the readout process
sleeps until the requested space is available. Then it waits for a trigger (by calling
the user routine EventArrived): the arrival of a trigger can signal a physics event
or a start of burst (SOB) or an end of burst (EOB). The readout process then fills the
event header fields for which it is responsible and lets the user fill the event data
(by calling the user routine ReadEvent) and the other event header fields, which
are under the user’s responsibility (see Chapter 3). It then checks that the
mandatory fields in the event header have been set by the user routines, increments
the trigger number only for physics events (not for SOB and EOB records) and fills
the variables in the Run control shared segment to allow the updating of the Run
Control status display.
While in the event loop, the readout process continuously checks for the arrival of
the end of run command. The readout exits the event loop if one of the following
two conditions is met: the maximum number of events to be taken has been
reached or somebody asked to stop the run.
All the records are always inserted in the buffer named RECORDINGBUFFER
(including SOR and EOR records, SOR files and EOR files records), while they are
injected in the buffer reserved for monitoring only if the following conditions are
met:
1. the monitor enable flag is set to 1 in the Run Control panel,
2. a monitor program requesting this type of events is running
3. there is enough space in the monitoring buffer.
At end of run, the readout process performs the following sequence of operations,
in the order described below:
•
execute the common end of run scripts (if present)
•
execute the specific end of run scripts (if present)
•
call the user routine DisArmHw
•
build the header of the EOR record and fill the data of the EOR record with the
ALICE DATE V2 User’s Guide
46
Guide to prepare a readout program
run conditions (copying the Run Control shared segment)
•
prepare the common EOR files (one record per file)
•
prepare the specific EOR files (one record per file)
•
update the bookkeeping information with the physics events count, the SOB
records count, the EOB records count, the trigger count and the number of
records inserted in the monitor buffer.
The Start Of Run and the End Of Run sequences have been split into phases.
corresponding to the points enumerated above. At each time the timeout limit (set
by the operator in the Run Control window and expressed in seconds) is restarted,
in order to allow for long initialization or ending procedures. Diagnostics messages
have been added in case of time-out to know which phase originated it.
5.1.3 The recorder process
The recorder process performs one of the two following functions:
•
if the recording device in the Run Control panel does not terminate with “:”, the
recorder process is responsible for writing the readout data as well as all the
records inserted by readout in RECORDINGBUFFER, to an output file on the
local disk. This is typically used if the data-acquisition system is composed by a
single front-end processor, without any event-building functionality.In this
case, the name set by the user as recording device is the full path and the
filename on disk which will contain the data, for example:
/tmp/my_raw_data.dat
The directory in which the filename resides should have write access for the user
“nobody”; one can either give write access for everybody or change the owner of
the directory.
•
if the recording device field ends with “:”, the recorder process assumes that
it is the name of the remote event-builder machine and tries to open a TCP/IP
connection to it in order to send the readout data and all the records inserted by
the readout process in RECORDINGBUFFER across the network. In this case,
the name set by the user as recording device is the name of the machine to
which the data have to be sent (usually the event building CPU).
The recorder process performs the following sequence of operations, in the order
described below:
•
initialize RECORDINGBUFFER where the readout will insert data
•
open a local disk file or connect to the event building remote machine (in this
case the port number defined as environment variable DATE_SOCKET_EB is
used)
•
enter the event loop, writing each event on the local disk file or sending each
event over then network
•
in the event loop, the behavior of the recorder process is different
depending on the value of the flag enableRecordingInBurst, set in the
Run Control parameters. If it is set to 1, the recorder process competes all
the time for the CPU with the readout process (running in the same
machine). Setting it to 0 makes the recorder process go to sleep while the
ALICE DATE V2 User’s Guide
The readList templates
47
variable DAQCONTROL->eventCount changes. The variable
DAQCONTROL->eventCount does not move either out of burst (i.e. no
more trigger are arriving) or when the RECORDINGBUFFER is full. This
implementation improves the performance when bursts are present, since it
forbids the recorder process to steal the CPU to the readout process
inside the burst. The time during which the recorder process sleeps can be
controlled by the variable DAQCONTROL->recorderSleepTime, allowing
for more precise tuning, depending on the burst length. Its value (expressed
in microseconds) can be set in the Run Control parameters. The default is 10
milliseconds.
•
•
each event is sent separately over the network.
•
while in the event loop, the recorder process continuously checks for the
arrival of the end of run command. It exits the event loop, if one of the
following conditions is met: the maximum number of bytes to be written
has already been reached (in case of recording of a local file) or there have
been too many errors in writing the file or in the transfer over the network
or if somebody asked to stop the run.
close the file or the socket connection, after exiting the event loop.
5.2 The readList templates
The template for the sources of the experiment specific code can be found in the
directory /date/readList/readList_timerRand.c.
The template can be used as a working example. The readout program
distributed in the DATE distribution kit uses this template.
The readList_timerRand generates dummy events of random size between
DAQCONTROL->randEventMinSize and DAQCONTROL->randEventMaxSize
at a simulated trigger interval of DAQCONTROL->randEventInterval
microseconds. All these variables can be set in the Run Control panel. The data
produced are monotonously increasing and start at 0.
The user may start from the example provided to write a custom readList, in which
the four routines included in the template and described below must be supplied,
or use the generic readList (see next chapter).
Upon return from the user routines the readout process checks the content of the
global variable readList_error, whose value allows the user to signal error
conditions.If its value is different from 0, the readout process logs an error message
containing the value of the variable and the name of the routine originating the
error (set by the user in the global variable readList_errorSource) and asks to
stop the run. When using the generic readList, the variable
readList_errorSource is filled by the readout process.
ArmHw
ALICE DATE V2 User’s Guide
48
Guide to prepare a readout program
Synopsis
#include “rcShm.h”
#include “event.h”
void ArmHw ()
Description
Returns
The ArmHw routine is called at each start of run, after the execution of the start of
run Unix scripts and before the transfer of the start of run files on the output
medium. The routine should perform all the actions needed at the beginning of the
run, such as the initialization of the hardware and of the trigger, and the
pre-encoding of hardware addresses to be saved in global static variables.
The routine does not return any value. It should use the variables
readList_error and readList_errorSource to signal error conditions,
which will provoke the log of a message and the termination of the run.
EventArrived
Synopsis
#include “rcShm.h”
#include “event.h”
int EventArrived ()
Description
The EventArrived routine is called to know whether a trigger has occurred. It is
up to the user to either poll and return immediately (with 0 if no trigger has
occurred) or to wait for an interrupt with an appropriate driver call for the
hardware.
The main readout program calls this routine as follows, in a strictly close loop
without sleeping, as shown in Listing 5.1
Returns
Listing 5.1
Upon occurrence of a trigger, the routine should return a value different from 0. If
the trigger is to be regarded a valid event, the value must be > 0. The routine should
return 0 if no trigger has occurred. It should use the variables readList_error
and readList_errorSource to signal error conditions, which will provoke the
log of a message and the termination of the run.
Calling EventArrived
1: /* while waiting for a trigger, check that nobody stopped the run
*/
2:
3: while(! (triggerArrived=EventArrived())) {
4:
if(DAQCONTROL->readoutFlag) goto finish;
5: };
ReadEvent
Synopsis
#include “rcShm.h”
ALICE DATE V2 User’s Guide
The readList templates
49
#include “event.h”
int ReadEvent(struct eventHeaderStruct*, unsigned short*)
Description
The ReadEvent routine is called after a trigger has arrived. The user is supposed
to insert the readout data into the area pointed to by the second parameter and to
fill the following fields in the event header, pointed to by the first parameter:
•
event->eventHeader.nbInRun (initialized to NOT_SET_TAG): mandatory.
This variable is the event number in the run. The readout process logs an error
message if this field is not filled upon return from the routine.
•
event->eventHeader.burstNb (initialized to 0): optional. This variable is
the burst number.
•
event->eventHeader.nbInBurst (initialized to 0): optional. This variable
is the event number within burst.
•
event->eventHeader.type (initialized to PHYSICS_EVENT): mandatory.
This variable is the type of record. The readout process increments the trigger
number (in the variable event->eventHeader.triggerNb) only for
PHYSICS_EVENT type of record, and not for other types of records, such as
SOB and EOB data.
•
event->eventHeader.errorCode (initialized to 0): optional. This variable
is an experiment dependent error code that the user may set to signal any kind
of error occurred during the readout phase.
•
event->eventHeader.deadTime (initialized to 0): optional.This variable
may be set by the user to measure the dead time in seconds for the readout of a
particular equipment.
•
event->eventHeader.deadTimeusec (initialized to 0): optional.This
variable may be set by the user to measure the dead time in milliseconds for the
readout of a particular equipment.
Up to DAQCONTROL->maxEventSize bytes are available to fill the event data and
the event header; this parameter can be changed in the main panel of the Run
Control program, when setting the maximum event size.
The main readout program calls this routine (Listing 5.2), after the initialization of
some fields in the event header. Upon return from this routine, it checks that the
user has filled the mandatory fields in the event header, updates some variables
used in the run status display and sets the time in the event header.
Returns
The routine must return the number of bytes actually readout. It should use the
variables readList_error and readList_errorSource to signal error
conditions, which will provoke the log of a message and the termination of the run.
An example on the easiest way to keep the count in a varying length event is given
in Listing 5.3.
ALICE DATE V2 User’s Guide
50
Guide to prepare a readout program
Listing 5.2
Calling ReadEvent
1:
2:
3:
4:
5:
6:
7:
8:
9:
10:
11:
12:
13:
14:
15:
16:
17:
18:
19:
20:
21:
22:
23:
24:
/* fill the header of event record */
event->eventHeader.magic = EVENT_MAGIC_NUMBER;
event->eventHeader.type = PHYSICS_EVENT;
event->eventHeader.headLen = sizeof(struct eventHeaderStruct);
event->eventHeader.runNb = DAQCONTROL->runNumber;
event->eventHeader.nbInRun = NOT_SET_TAG;
event->eventHeader.burstNb = 0;
event->eventHeader.nbInBurst = 0;
for (mIndex = 0; mIndex < MASK_LENGTH; mIndex++) {
event->eventHeader.detectorId [mIndex]= 0;
}
event->eventHeader.fileSeqNb = 0;
event->eventHeader.errorCode = 0;
event->eventHeader.deadTime = 0;
event->eventHeader.deadTimeusec = 0;
/* let the user fill the header and the raw data of the event
record by calling the user routine */
evlen = ReadEvent(&(event->eventHeader), &(event->rawData[0]));
if (LOGLEVEL >= 20) {
sprintf (lineLog, “Read event of lenght %d”, evlen);
LOG_TO (fileLog, LOG_INFO, lineLog);
}
if ((LOGLEVEL >= 10) && (event->eventHeader.nbInRun ==
NOT_SET_TAG)) {
sprintf (lineLog, “ReadEvent has not set the event
number: nbInRun = %ld”, event->eventHeader.nbInRun);
LOG_TO (fileLog, LOG_ERROR, lineLog);
}
/* increment trigger number only for data records, not sob,eob */
if (event->eventHeader.type == PHYSICS_EVENT) {
DAQCONTROL->triggerCount += 1;
event->eventHeader.triggerNb = DAQCONTROL->triggerCount;
}
/* fill the control shared section variables used to update */
/* the status display */
DAQCONTROL->eventsInBurstCount = event->eventHeader.nbInBurst;
DAQCONTROL->burstCount = event->eventHeader.burstNb;
25:
26:
27:
28:
29:
30:
31:
32:
33:
34:
35:
36:
37: event->eventHeader.size = evlen + sizeof(struct
eventHeaderStruct);
38: gettimeofday(&timeStamp,0);
39: event->eventHeader.time
= timeStamp.tv_sec;
40: event->eventHeader.usec
= timeStamp.tv_usec;
ALICE DATE V2 User’s Guide
Report message to the infoLogger
Listing 5.3
51
Example of ReadEvent routine
1: int ReadEvent (struct eventHeaderStruct *header_ptr, int
*data_ptr) {
2:
3: /* Called after a trigger has arrived */
4:
5: /* Inserts raw data into the area pointed by data_ptr */
6:
7: int* firstWord = data_ptr;
8: int dataSize;
9: int i;
10:
11: /* fill the header */
12:
13: header_ptr->nbInRun = ....
14: .............
15:
16: /* fill the raw data */
17:
18: dataSize = ....
19:
20: for (i=0; i<= dataSize-1; i++) {
21:
data_ptr ++ = i;
22: }
23: /* returns number of bytes actually readout */
24:
25: return ((unsigned long32)data_ptr - (unsigned long32)firstWord );
26:
27: }
DisArmHw
Synopsis
#include “rcShm.h”
#include “event.h”
void DisArmHw ()
Description
Returns
The DisarmHw routine is called at each end of run, after the execution of the end of
run Unix scripts and before the transfer of the end of run files on the output
medium. In general it should perform all the actions needed at end of run, such as
for example the switching off the high voltages, the saving of error statistics that
may have been collected in the readList routines.
The routine does not return any value. It should use the variables
readList_error and readList_errorSource to signal error conditions,
which will provoke the log of a message.
5.3 Report message to the infoLogger
Both the readout and the recorder processes use the infoLogger package facilities
to report and trace error or abnormal conditions and to trace state changes. The
ALICE DATE V2 User’s Guide
52
Guide to prepare a readout program
readout process also updates the bookkeeping information at the end of the run
through the LOGBOOK facility.
The user can tailor these features to the required needs by setting the value of the
variable LOGLEVEL in the Run Control panel, according the Table 5.1.
Table 5.1
LOGLEVEL definitions for the readout and the recorder processes
LOGLEVEL
Meaning
=0
Switch off both infoLogger and bookkeeping facilities
<10
Switch off the use of the infoLogger facility
>=10
Only report major traces and errors
>=20
Add the report of minor state changes
>=30
Add the report of debugging messages
The information reported by the readout package in the run bookkeeping at the
end of each run is shown in the Listing 5.4.
Listing 5.4
Bookkeeping information reported by the readout package
1:
2:
3:
4:
5:
6:
7:
8:
9:
10:
11:
12:
13:
14:
/* update bookkeeping information */
if (LOGLEVEL >= 1) {
sprintf (bookLog, “Run %d”, DAQCONTROL->runNumber);
LOGBOOK (bookLog);
sprintf (bookLog, “--- Readout %s summary on %s ---”,
READOUT_VERSION,getenv(“DATE_HOSTNAME”));
LOGBOOK (bookLog);
sprintf (bookLog, “Data,sob and eob count %d”,
DAQCONTROL->eventCount);
LOGBOOK (bookLog);
sprintf (bookLog, “Physics data trigger count %d”,
DAQCONTROL->triggerCount);
LOGBOOK (bookLog);
sprintf (bookLog, “No. of records inserted in the
monitoring buffer %d”,DAQCONTROL->eventsMonitored);
LOGBOOK (bookLog);
LOGBOOK_MARKER;
}
5.4 Customization of the front-end software
5.4.1 The Start of Run and End of Run scripts
The user may customize the front-end software for the experiment specific needs
through common (to all front-end processors) or specific (to each front-end
processor) Unix shell scripts, which are called at every start of run and at every end
of run, called respectively SOR.commands and EOR.commands. The common
scripts are executed first and must reside in the $DATE_SITE_CONFIG directory,
while the specific ones reside in the $DATE_SITE/DATE_HOSTNAME directory.
These source scripts may contain the execution of other user-written stand-alone
programs, which do not have to be linked to the DAQ processes.
ALICE DATE V2 User’s Guide
Customization of the front-end software
53
Whenever a run is started, the start of run scripts are executed before calling ArmHw.
Similarly, when a run is stopped, the end of run scripts are performed before calling
DisArmHw.
Examples of start of run scripts may be the programming of high voltages and the
calibration of ADCs and TDCs. If there is the need to record the results of these
programs on the output medium, one can simply let these programs writing their
results on the start of run files.
There is also the possibility to call the infoLogger facility from a shell script, as
shown in Listing 5.5. It is recommended to call the error macro of the
infoLogger facility from the user scripts to signal and report eventual errors, in
order to get a trace in the runLog stream of the operator InfoBrowser window.
Listing 5.5
SOR.commands script
1: #! /bin/sh
2:
3: . /date/setup.sh
4: log “SOR.commands: DATE_SITE=\”$DATE_SITE\”
DATE_HOSTNAME=\”$DATE_HOSTNAME\” pwd=\”`pwd`\””
5.4.2 The Start of Run and End of Run files
A facility is provided to describe in special files the list of filenames to be copied to
the output medium as special records at the beginning and at the end of each run.
These files may have been created by the above Unix shell scripts and may again be
common (to all front-end processors) or specific (to each front-end processor).
These special files are called respectively SOR.files and EOR.files.The
common files are recorded first and must reside in the DATE_SITE_CONFIG
directory, while the specific ones reside in the DATE_SITE/DATE_HOSTNAME
directory. Each file in the list of filenames in SOR.files or EOR.files creates
one separate record on the output medium and is written after the execution of the
SOR.commands or EOR.commands scripts, so that the latest version produced by
those scripts is always obtained.
Listing 5.6 and Listing 5.7 are an example on how to set high voltages and at the
beginning of each run, produce a file with these values, run a calibration program,
and add a run comment to the tape:
Listing 5.6
SOR.commands
1:
2:
3:
4:
5:
6:
7:
8:
ALICE DATE V2 User’s Guide
#! /bin/sh
# SOR.commands
. /date/setup.sh
high_voltage_program > CALIBRATION_DIR/HV.dat
sleep 5 # wait for HV to settle
ADC_calibration_program >CALIBRATION_DIR/ADC.dat
log “File HV.DAT contains the current high_voltages”
54
Guide to prepare a readout program
Listing 5.7
SOR.files
1: CALIBRATION_DIR/HV.dat
2: CALIBRATION_DIR/ADC.dat
3: run.comment
The programs high_voltage_program and ADC_calibration_program are totally
independent from the DAQ system and they have just to produce result files. The
files can have any format, but standard ASCII formatted text files are strongly
recommended, since it is the only format which can be read on any monitoring and
analysis platform.
5.5 How to build and install a readout
program
5.5.1 The timerRand readList
After the installation of the distribution kit, the file readList_timerRand.c sits
in the /date/readList directory. To build the readout program using this
readList, the following procedure has to be followed:
1. Execute
> dateSetup /date/readout/packageParams
2. Copy /date/readList/readList_timerRand.c in a private directory.
3. Copy /date/readList/GNUmakefile_readout in the same directory and
rename it GNUmakefile.
4. Execute the makefile procedure giving timerRand as target:
> gmake timerRand
This will produce a new executable program, called readout.
5. Copy the newly built readout program on the directory pointed to by
$(DATE_SITE)/$(DATE_HOSTNAME).
5.5.2 The custom readList
If you wish to define your own readList implementing a library with the
functions described in the above templates, and build your readout program, the
following procedure has to be followed:
1. Execute
> dateSetup /date/readout/packageParams
2. Create a readList.c file providing containing the four routines described in
the templates.
ALICE DATE V2 User’s Guide
How to build and install a readout program
55
3. Copy /date/readList/GNUmakefile_readout in the same directory and
rename it GNUmakefile.
4. Edit the GNUmakefile to add your own target and the dependencies for it
(private libraries, include files, etc.).
5. Execute the makefile procedure giving the target that you have defined.
6. Copy the newly built readout program on the directory pointed to by
$(DATE_SITE)/$(DATE_HOSTNAME).
5.5.3 The generic readList
For building a readout program using the generic readList, you should refer
to the Chapter 6.
ALICE DATE V2 User’s Guide
56
Guide to prepare a readout program
ALICE DATE V2 User’s Guide
The generic
readList
6
This chapter describes how to use the generic readList, which allows you to
organize the readout as a collection of equipments. Equipments can be
programmed independently; they can be selected (activated and de-activated)
without changing the readout code.
ALICE DATE V3 User’s Guide
6.1
Overview . . . . . . . . . . . . . . . . . . . . . . . . . . . . . . 58
6.2
Using the generic readList . . . . . . . . . . . . . . . . . . . . 59
6.3
The readout control . . . . . . . . . . . . . . . . . . . . . . . . 61
6.4
The equipment header. . . . . . . . . . . . . . . . . . . . . . . 62
6.5
The equipmentList library . . . . . . . . . . . . . . . . . . . . 63
6.6
The detectors configuration file. . . . . . . . . . . . . . . . . . 68
58
The generic readList
6.1 Overview
In Chapter 5 it is described how the readout program accesses the hardware by
calling the routines of the readList library, which contains all the code specific to
a given electronic set-up (Figure 6.1).
Figure 6.1
Readout and the standard readList
Instead of writing the experiment’s own readList, it is possible to use a generic
readList that is provided with the distribution kit and describe the electronic
set-up in another library called equipmentList (Figure 6.2).
The generic readList introduces the following new features:
a. The raw data of an LDC (also called detector1) may be further divided into
smaller parts, called equipment data. The equipment that generates the data may
be an electronic board or a set of electronic boards, depending on how the
readout software is written. Each equipment data block begins with an
equipment header, followed by the equipment raw data. In summary, a fully
built event contains the sub-events from the various detectors, which in turn
contain the data blocks from the equipments (see Figure 6.4).
b. The experiment-specific readout software can be separately written for each
equipment. A set of equipment-handling routines similar to the ones of the
readList (used to arm and disarm the hardware, wait for a trigger and read
the event) deal now with one single equipment, thus the code is more modular
and readable. The code for all the equipments must be merged in one file,
conventionally called equipmentList.c.
c. A textual configuration file detectors.config, unique for the whole
experiment, contains the list of available equipments for each detector. An
equipment may be repeated several times in a detector; each run-time call will
be distinguished by a different set of parameters. The configuration file specifies
the selection of the active equipments and the setting of the parameters that will
be passed to the readout routines. Therefore, it is possible to modify the readout
program behaviour without changing the readout executable code.
1.Remark: The LDCs data blocks can be identified in the event structure as separate
sub-events. It is desirable to have a dedicated LDC for each detector, in order to be
able to distinguish its data. In general, though, a detector with a large number of
channels may be served by several LDCs. Still the blocks of data from each LDC
will be separately identified (they may be considered as sub-detectors). Throughout
this chapter, the term detector will be used as synonym of LDC and sub-detector; it
will indicate a front-end processor generating identifiable blocks of data.
ALICE DATE V3 User’s Guide
Using the generic readList
59
d. An interactive program provides a graphical interface to manipulate the
configuration file.
Figure 6.2
Readout and the generic readList.
The equipment-handling routines must be provided in a single file called
equipmentList.c. The routine names are fixed by convention; the name is
obtained by concatenating the prefix Arm, Disarm, ReadEvent and
EventArrived with the name of the equipment type as declared in the detectors
configuration file.
The generic readList library implements the following functions (see the
readList template in Chapter 5.2):
1. ArmHw()
It scans the configuration file, identifies the equipments involved in the readout
of the detector, saves them in a table and then calls the Arm routines for each
active equipment, in the order specified in the configuration file.
2. ReadEvent()
This routine generates the equipment header and then invokes the ReadEvent
routine for each active equipment, in the order specified in the configuration
file.
3. DisArmHw()
It calls the Disarm routine for each active equipment (in the opposite order as
specified in the configuration file.
4. EventArrived()
This routine calls the EventArrived routine of the trigger equipment selected
in the configuration file (see 6.5.1).
6.2 Using the generic readList
The use of the generic readList requires the preparation of two files containing
the description of the detectors and their equipments:
1. The equipmentList.c contains the code handling the readout of all the
equipments that may be activated in all the detectors. Chapter 6.5 gives the
detailed description on how to prepare it. An example of equipmentList.c
can be found in /date/readList.
2. The detectors.config contains a textual declaration of all the equipments
followed by a description of how the equipments are shared by the detectors.
ALICE DATE V3 User’s Guide
60
The generic readList
Chapter 6.6 gives the detailed description on how to prepare it. An example of
detectors.config can be found in /date/readList.
These two files are strictly correlated and must match one another. There is no tool
to make sure that this is the case. Error conditions due to a mismatch are discovered
at the start of run and will immediately stop the run.
There are essentially three conventions tying equipmentList.c and
detectors.config:
1. The name of the equipments in detectors.config constrains the name of
the readout routines in equipmentList.c (a prefix is added to the equipment
name, as explained in 6.5.1 and 6.5.2).
2. The readout routines in equipmentList.c must be declared using a set of
macros provided in readList_detectors.h, as explained in 6.5.8. These
macros provide the link between the equipment name (read by readList from
detectors.config) and the address of the readout routines (to be called by
readList).
3. There are two sets of parameters that can be passed to the readout routines: the
first is specific to the detector (parameters specific to a given LDC), the second is
specific to a given equipment (the parameters values may be different for each
declaration of the same equipment in a detector). The parameter declarations in
detectors.config and equipmentList.c must match, as described in
6.5.3.
To prepare a readout program using the generic readList the following steps
must be followed:
1. Create equipmentList.c into a private directory.
2. Create the detectors.config configuration file into the directory pointed to
by DATE_SITE_CONFIG.
3. Copy the /date/readList/GNUmakefile_readout makefile into the private
directory, rename it GNUmakefile and customize the makefile target
detectors to compile the newly created equipmentList.c file.
4. Invoke the command:
> dateSetup /date/readout/packageParams
5. Invoke the make procedure for the target detectors:
> gmake detectors
6. Copy the readout executable file into the ${DATE_SITE}/hostName
directory, for each of the hosts using this specific readout program.
The detector configuration may be changed between runs just by modifying the
detectors.config file in DATE_SITE_CONFIG (an interactive tool to do that is
provided. See Chapter 6.3). Changes are taken into account at the next start of run.
The modifications may concern only the detectors description part of the
configuration file (below the >DETECTORS heading) and not the other declarative
parts, which are linked by convention to the handling software. The following
items can be changed:
1. Detectors can be added or removed.
2. Equipments assigned to a detector can be added or removed.
ALICE DATE V3 User’s Guide
The readout control
61
3. Equipments assigned to a detector can be activated or de-activated.
4. The value of the parameters provided to both detectors and equipments can be
changed.
Modifications to any other declaration in the configuration file require changing the
equipmentList software and building again the readout program.
6.3 The readout control
An interactive tool is provided to manipulate the file detectors.config from a
window without using an editor. The program may be activated by invoking the
following command:
> readoutControl
The program will open a window, as shown in Figure 6.3.
The tool is allowed to perform the following operations:
1. Equipments assigned to a detector can be activated or de-activated.
2. The value of the parameters provided to both detectors and equipments can be
changed.
Figure 6.3
The readoutControl window.
The modifications are applied to the file only if the menu option File - Save
configuration is invoked. They do not have any influence on the current run,
ALICE DATE V3 User’s Guide
62
The generic readList
since they will be taken into account only at the next start of run (provided that the
edited file is ${DATE_SITE_CONFIG}/detectors.config).
6.4 The equipment header
The equipment header provides a further division of the sub-event raw data.
Within a detector, it defines blocks of data generated by an equipment (Figure 6.4).
Figure 6.4
Sub-event structure
The equipment header has the following structure (Figure 6.5):
•
Equipment type: a 16-bit integer number identifying the type of the equipment
(declared in the configuration file). The type is a number which uniquely
identifies a class of identical equipments. It is a convention of the experiment.
•
Header extension length: a 16-bit integer with the length in bytes of an optional
extension of the equipment header (default 0).
•
Equipment identifier: a 16-bit integer number identifying the equipment
(declared in the configuration file). The identifier is a number which uniquely
identifies an equipment within a detector. It is a convention of the experiment.
•
Byte alignment: an 8-bit integer specifying the length of the word read from the
hardware (in bytes);
•
Reserved 8-bit word.
•
Raw data length: a 32-bit integer with the length in bytes of the data block
(header excluded).
type
headerExtLen
reserved
31
Figure 6.5
rawByteAlign
rawDataLen
32 bit
equipmentId
0
The equipment header.
The equipment header is defined in the file ${DATE_COMMON_DEFS}/equipment.h
(see Listing 6.1).
ALICE DATE V3 User’s Guide
The equipmentList library
Listing 6.1
63
The equipment.h file.
1:
2:
3:
4:
5:
6:
7:
8:
9:
10:
11:
12:
13:
struct equipmentHeaderStruct {
short headerExtLen;
/* header extension (in bytes) */
short type;
/* the equipment type identifier */
char reserved;
/* reserved byte */
char rawByteAlign;
/* word length (in bytes) */
short equipmentId;
/* equipment identifier */
long rawDataLen;
/* data block length (in bytes) */
};
struct equipmentStruct {
struct equipmentHeaderStruct equipmentHeader;
unsigned short rawData[1];
};
6.5 The equipmentList library
The functions to handle the equipments declared in the configuration file must be
provided as the equipmentList.c library. An example is shown in Listing 6.2.
There exist two types of equipments: the trigger equipments and the readout
equipments. Their handling routines have a different calling sequence in the two
cases, as described below.
6.5.1 Trigger equipments
Trigger equipments deal with the trigger hardware. Many trigger equipments may
be declared in the detectors configuration file, but only one per detector should be
active. If there are more of them, no warnings are given, but only the first is kept.
Trigger equipments usually do not generate data; therefore, the flag NODATA (see
6.6.1) is specified. Optionally, trigger equipments may generate data.
The routines to be provided for the trigger equipment are the following (replace
Equipment with the trigger name):
1. ArmEquipment
It is called by ArmHw at start of run.
It should initialize the hardware. It cannot generate any data.
2. EventArrivedEquipment
It is called by EventArrived when waiting for the next event.
It should check the trigger status and return 1 if a trigger has arrived, 0
otherwise. It cannot generate any data.
3. ReadEventEquipment
It is called by ReadEvent at each event, even if NODATA is specified. In the
latter case, the pointer to the header and to the data are not provided.
It should perform the event-related processing of the trigger hardware and, if
NODATA is omitted, read the equipment data block and update the equipment
header.
4. DisarmEquipment
ALICE DATE V3 User’s Guide
64
The generic readList
It is called by DisarmHw at end of run.
It should reset the hardware. It cannot generate any data.
If a functionality is not required, dummy routines should be provided.
6.5.2 Readout equipments
Readout equipments deal with the readout hardware and collect the equipment
information. They usually generate data; therefore, the flag NODATA (see 6.6.1) is
not specified.
It may, though, be convenient to isolate some specific processing in an equipment,
even though this processing generates no data. The equipment will be marked with
the flag NODATA, in such a way no data (relative to this equipment) will be added to
the event, still all the routines will be called.
The routines to be provided for each equipment are the following (replace
Equipment with the equipment name):
1. ArmEquipment
It is called by ArmHw at start of run.
It should initialize the hardware. It cannot generate any data.
2. ReadEventEquipment
It is called by ReadEvent at each event, even if NODATA is specified. In the
latter case, the pointer to the header and to the data are not provided.
It should perform the event-related processing of the equipment hardware and,
if NODATA is omitted, read the equipment data block and update the equipment
header.
3. DisarmEquipment
It is called by DisarmHw at end of run.
It should reset the hardware. It cannot generate any data.
If a functionality is not required, dummy routines should still be provided.
6.5.3 Accessing the parameters
All the functions in the library have access to two sets of parameters:
a. The equipment-specific parameters. These are accessible via a pointer received
as first parameter in the routine call (see example in Listing 6.2).
b. The detector-specific parameters. They are unique in a given detector. They are
accessible via a global pointer (see example in Listing 6.2):
char *globPar;
The order, type and format of all the parameters is matter of convention within the
experiment. Coherence must be assured between what is specified in the detectors
configuration file and the code in the equipmentList.c library. No check is
performed by readList before calling the library.
The actual values passed to the routines are the ones specified in the detectors
configuration file, in the section >DETECTORS.
ALICE DATE V3 User’s Guide
The equipmentList library
65
The values of the parameters are copied into memory at run time, while parsing the
configuration file, following this convention on their formats: %ld corresponds to
long, %hd to short, %lx to long hex value, %hd to short hex value, %s and to
char * and %c to char.
To ease the use of the parameters it is suggested to cast their memory pointer into a
pointer to a structure with proper fields, according to what declared into the
detectors.config configuration file (in the same order and following the
format convention).
6.5.4 Arming the equipments
If NNN is the name of an equipment type (either readout or trigger) declared in the
configuration file, the ArmNNN function to arm the equipment of that type must be
provided with the following signature:
void ArmNNN( char *);
The function receives a pointer to a memory region containing the sequence of
pointers to the values of the parameters of the component being armed; these
values are read at run time, before arming the detector, from the
detector.config file and are assigned to the equipment (see 6.5.3).
6.5.5 Reading the equipments
If NNN is the name of a type (either readout or trigger) declared in the configuration
file, the ReadNNN function to read the equipment of that type must be provided.
Since the type may produce data or not, if the type NNN is declared as NODATA in
the configuration file, the function signature is:
void ReadEventNNN( char *, struct eventHeaderStruct*);
Otherwise, if NODATA is omitted, the function signature must be:
int ReadEventNNN( char *, struct eventHeaderStruct *, struct
equipmentHeaderStruct *, int *);
All the parameters in the call are input parameters. The first parameter is a pointer
to a memory region containing the sequence of pointers to the values of the
parameters of the component being read (see 6.5.3). The second parameter is a
pointer to the event header2. Two further parameters appear in the second case: a
pointer to the equipment header3 and a pointer to the raw data block to fill in.
If the equipment produces data, the size (in bytes) of the data read must be
returned.
2. Defined in the ${DATE_COMMON_DEFS}/event.h header file, to be included in the library.
3. Defined in the ${DATE_COMMON_DEFS}/equipment.h header file, to be included in the
library.
ALICE DATE V3 User’s Guide
66
The generic readList
6.5.6 Disarming the equipments
If NNN is the name of a type (either readout or trigger) declared in the configuration
file, the DisArmNNN function to disarm the equipment of that type must be
provided with the following signature:
void DisArmNNN( char *);
The function receives a pointer to a memory region containing the sequence of
pointers to the values of the parameters of the component being disarmed (see
6.5.3).
6.5.7 Triggering
If NNN is the name of a trigger equipment type declared in the configuration file, the
EventArrivedNNN function to signal the trigger arrival must be provided with
the following signature:
int EventArrivedNNN( char *);
The function receives a pointer to a memory region containing the sequence of
pointers to the values of the parameters of the trigger (see 6.5.3).
The function must return the value 1 if a new event has arrived, 0 otherwise.
6.5.8 The function references
In order to make the functions contained in the library accessible from the generic
readList, references to them must be created in the library through a set of
arrays, types and macros defined into the readList_detectors.h4 header file.
The rules to be fulfilled are the following (see example in Listing 6.2):
•
Types declared in the >EQTYPES section, without NODATA: the values returned
applying the equipmentDataType macro to the name of each of these types,
must be assigned to the equipmentDataTable array of elements of type
equipmentDataTableType. The variable nbDtEqps must then be set with
the number of entries put into the array.
•
Types declared in the >EQTYPES section, with NODATA: the values returned
applying the equipmentNoDataType macro to the name of each of these
types, must be assigned to the equipmentNoDataTable array of elements of
type equipmentNoDataTableType. The variable nbNoDtEqps must then be
set with the number of entries put into the array.
•
Types declared in the >TRTYPES section, without NODATA: the values returned
applying the triggerDataType macro to the name of each of these types,
must be assigned to the triggerDataTable array of elements of type
triggerDataTableType. The variable nbDtTrgs must then be set with the
number of entries put into the array.
4. The file ${DATE_ROOT}/readList/readList_detectors.h must be included in the
library.
ALICE DATE V3 User’s Guide
The equipmentList library
67
•
Types declared in the >TRTYPES section, with NODATA: the values returned
applying the triggerNoDataType macro to the name of each of these types,
must be assigned to the triggerNoDataTable array of elements of type
triggerNoDataTableType. The variable nbNoDtTrgs must then be set with
the number of entries put into the array.
Listing 6.2
Example of equipmentList.c library for the configuration file in Listing 6.3
1:
2:
3:
4:
5:
6:
7:
8:
9:
10:
11:
12:
13:
14:
15:
16:
17:
18:
19:
20:
21:
22:
23:
24:
25:
26:
27:
28:
29:
30:
31:
32:
33:
34:
35:
36:
37:
38:
39:
40:
41:
42:
43:
44:
45:
46:
47:
48:
49:
50:
51:
52:
53:
54:
55:
56:
57:
58:
59:
60:
61:
62:
ALICE DATE V3 User’s Guide
/* Code for Rand and Corbo equipments */
/************** G L O B A L
P A R A M E T E R S *************/
typedef struct {
char *namePtr;
} GlobParType;
/************************ C O R B O ***************************/
typedef struct {
unsigned int *vmeBaseAddressPtr;
} CorboParType;
void ArmCorbo( char *parPtr) {
CorboParType *corboPar = (CorboParType *)parPtr;
printf( “Arming corbo with vme base address %lx\n”,
*corboPar->vmeBaseAddressPtr);
...
}
void DisArmCorbo( char *parPtr) {...}
int EventArrivedCorbo( char *parPtr) {...}
void ReadEventCorbo( char *parPtr,
struct eventHeaderStruct *header_ptr) {...}
/************************* R A N D ****************************/
typedef struct {
long *eventMinSizePtr;
long *eventMaxSizePtr;
short *eqIdPtr;
} RandParType;
void ArmRand( char *parPtr) {
RandParType *randPar = (RandParType *)parPtr;
GlobParType *gpar = (GlobParType *)globPar;
printf( “detector name = %s\n”, gpar->namePtr);
printf( “with min = %d and max = %d\n”,
*randPar->eventMinSizePtr,
*randPar->eventMaxSizePtr); {...}
}
void DisArmRand( char *parPtr) {...}
int ReadEventRand( char *parPtr,
struct eventHeaderStruct *header_ptr,
struct equipmentHeaderStruct *eq_header_ptr,
int *data_ptr) {...}
equipmentDataTableType equipmentDataTable[] = {
equipmentDataType( Rand)
};
int nbDtEqps = 1;
equipmentNoDataTableType equipmentNoDataTable[];
int nbNoDtEqps = 0;
triggerDataTableType triggerDataTable[];
int nbDtTrgs = 0;
triggerNoDataTableType triggerNoDataTable[] = {
triggerNoDataType( Corbo)
};
int nbNoDtTrgs = 1;
68
The generic readList
6.6 The detectors configuration file
The detector configuration file $(DATE_SITE_CONFIG)/detectors.config
contains the description of the readout system in terms of equipments. This file
describes all the detectors and is unique in the experiment.
Each detector is composed of equipments and triggers that may either produce
data or not. Each detector and each equipment has a set of parameters associated
with it. Each equipment may be activated and de-activated.
The configuration file is made of four sections, appearing in the order indicated
below and identified by their keywords:
The first three sections are declarations of types and of list of parameters:
1. >EQTYPES: followed by the description of the readout equipment types.
2. >TRTYPES: followed by the description of the trigger equipment types.
3. >DEPARAMS: followed by the description of the list of parameters passed to
all the detectors.
The last section contains the list of equipments associated to each detector and the
actual literal values for the parameters:
4. >DETECTORS: followed by the detectors description.
An example of the configuration file is shown in Listing 6.3.
6.6.1 The readout equipment types
The types of readout equipments (see 6.5.2) available are declared under the
heading >EQTYPES. These declarations refer to types of equipments for which the
driving software is provided in the equipmentList.c library. The actual
instantiation of the equipments is declared under the various detector declarations.
The description of a readout equipment type begins with a line of the format:
>EqTypeName Id NODATA
where > is a literal character, EqTypeName is the type name, Id the type identifier
(a short integer that will be copied in the equipment header if this type produces
data) and NODATA an optional keyword specifying that the equipments of this type
do not produce any data when they are read out. If NODATA is omitted the
equipments of this type are expected to produce data. If NODATA is specified, there
will be no trace of these equipments in the events (even the equipment headers will
be omitted).
The type declaration may be followed by the declaration of the equipment-specific
parameters. These parameters can be accessed from all the equipment-handling
routines of a detector. The list of parameters is common to all the equipments of a
given type. The values are assigned equipment by equipment.
ALICE DATE V3 User’s Guide
The detectors configuration file
69
The parameters are declared one per line, by specifying for each of them the name
and the format (either %hd, %ld, %hx, %lx, %s or %c, according to the C language
definition of these constants).
Listing 6.3
Example of detector.config configuration file
1:
2:
3:
4:
5:
6:
7:
8:
9:
10:
11:
12:
13:
14:
15:
16:
17:
18:
19:
20:
21:
22:
23:
24:
25:
26:
27:
28:
29:
30:
31:
32:
33:
34:
35:
36:
37:
38:
>EQTYPES
>VmeWindow 0 NODATA
vmeWinOffset %lx
vmeWinSize %lx
>Rand 1
EvMinSize %ld
EvMaxSize %ld
EqId %hd
>TRTYPES
>Corbo 0 NODATA
vmeBaseAddress %lx
>Timer 0 NODATA
EvInterval %ld
>DEPARAMS
name %s
>DETECTORS
>mppcal03 LDC1
LDC1
+ VmeWindow
0x700000 0x60
+ Corbo CorboLDC1
0x700000
- Timer TimerLDC1
1000000
+ Rand RandLDC1
10 20 11
+ Rand RandLDC1
1000 1010 22
>mppcal04 LDC2
LDC2
+ VmeWindow
0x 0xF00000
+ Corbo CorboLDC2
0x700000
- Timer TimerLDC2
5000000
+ Rand RandLDC2
20 30 11
6.6.2 The trigger equipment types
The types of trigger equipments (see 6.5.1) available are declared under the heading
>TRTYPES. These declarations refer to types of equipments for which the driving
software is provided in the equipmentList.c library. The actual instantiation of
the equipments is declared under the various detector declarations.
Trigger equipments types are declared using the same format as for the readout
equipment types, described above (6.6.1).
The difference between trigger equipments and readout equipments concerns the
number of routines to be provided in equipmentList.c and the how they will be
called by the generic readList (see 6.5.1 and 6.5.2).
ALICE DATE V3 User’s Guide
70
The generic readList
6.6.3 The detector parameters
The list of detector-specific parameters is declared under the heading >DEPARAMS.
These are parameters that can be accessed from all the equipment-handling
routines of a detector. The list of parameters is common to all the detectors, while
the values are assigned detector by detector.
The parameters are declared one per line, by specifying for each of them the name
and the format (either %hd, %ld, %hx, %lx, %s or %c, according to the C language
definition of these constants).
6.6.4 The detectors
The detectors description appears under the heading >DETECTORS. The
description of a detector consists of its name, the detector-specific parameter values
and the list of its equipments with their equipment-specific parameter values.
The description begins with a line with the format:
>detName Label
where detName is the name of the LDC (as defined in DATE_HOSTNAME on the
LDC) and Label is an optional string describing the detector.
On the following line the detector parameters values may be specified, separated
by spaces, according to what is declared in the detector parameters section.
Then, the detector equipment list follows. Each equipment is declared in a line with
the following format:
S EqTypeName Label
where S is the equipment status (+ for active equipments, - for inactive
equipments), EqTypeName is the type of this equipment (one of those declared in
the equipment types or trigger types section) and Label is an optional string
describing the equipment.
Following each equipment declaration, there may be a line with the specification of
the equipment parameters values, separated by spaces, according to what declared
in the equipment type section.
ALICE DATE V3 User’s Guide
VME access
and
trigger system
7
This chapter gives some indications on how to set up the trigger system. It shows
what electronic equipment is required and how the software should handle it.
An example based on VME equipment is discussed down to the details.
The introductory section explains how to access the VME bus from a program,
using a direct mapping mode.
ALICE DATE V3 User’s Guide
7.1
Access to the VME bus . . . . . . . . . . . . . . . . . . . . . . 72
7.2
The trigger system . . . . . . . . . . . . . . . . . . . . . . . . . 74
7.3
The CORBO module . . . . . . . . . . . . . . . . . . . . . . . . 75
7.4
Triggering with the CORBO . . . . . . . . . . . . . . . . . . . 76
7.5
Using the CORBO to control the trigger . . . . . . . . . . . . . 81
72
VME access and trigger system
7.1 Access to the VME bus
There are various ways of accessing the VME. The one described here is the direct
mapping from the application program. It consists of assigning a virtual-address
window to a region of the VME space, as shown in Figure 7.1.
Virtual address space
0xFFFFFFFF (32-bit)
VME
0xFFFFFF (24-bit)
Device
vmeWinSize
aDeviceVmeBaseAddr
0x0
vmeWinOffset
aDeviceBaseAddr
0x0
Figure 7.1
vmeWinAddr
VME to memory mapping
We shall describe how to operate an hypotethic device called aDevice.
It is convenient to indicate the offset addresses of the device registers in a header
file, such as the one shown in Listing 7.1.
Listing 7.1
Definition of the offset addresses of a device
1:
2:
3:
4:
5:
6:
/* aDevice.h */
/* Register address definition */
#define A_DEVICE_CSR
0x00
#define A_DEVICE_INPUT_REG 0x04
#define A_DEVICE_OUTPUT_REG 0x08
The application code maps a VME window onto a virtual-address window and
then accesses the registers with normal memory references, as shown in Listing 7.2.
Before termination, the program unmaps the VME window.
The mapping and unmapping are performed by external routines. Simple
arithmetics leads to the calculation of the device base address.
ALICE DATE V3 User’s Guide
Access to the VME bus
73
The register access is obtained by calculating the pointer to it as the sum of the
device base address and the register offset.
Read and writes from/to the register are performed as virtual memory read and
writes.
Listing 7.2
Example of an application accessing a VME device
7:
8:
9:
10:
11:
12:
13:
14:
15:
16:
17:
18:
19:
20:
21:
22:
23:
24:
25:
26:
27:
28:
29:
30:
31:
32:
33:
34:
35:
36:
37:
38:
39:
40:
41:
42:
43:
44:
45:
46:
47:
48:
49:
50:
51:
52:
/* anApplication.c */
/* Application controlling the device aDevice */
# include “aDevice.h”
main() {
/* Set the offset and the size of the VME window */
unsigned long vmeWinOffset, vmeWinSize;
vmeWinOffset = 0;
/* Start from the bottom */
vmeWinSize = 0xF00000; /* Map part of the 24-bit the VME
space */
/* Map the VME window onto a memory window.
A pointer to the first 32-bit word is returned */
unsigned long *vmeWinAddr;
vmeWinAddr=(unsigned long *)MapVME(vmeWinOffset,vmeWinSize);
/* Set the vme base address of the device.
It may depend on a switch setting on the board */
unsigned int aDeviceVmeBaseAddr;
aDeviceVmeBaseAddr = 0x700000;
/* Calculate the memory base address of the device */
unsigned int aDeviceBaseAddr;
aDeviceBaseAddr=(unsigned int)vmeWinAddr +
aDeviceVmeBaseAddr - (unsigned int)vmeWinOffset;
/* Calculate the pointers to the 16-bit registers */
register unsigned short *aDeviceCsr, *aDeviceInputReg,
*aDeviceOutputReg
aDeviceCsr =
(unsigned short *) (aDeviceBaseAddr + A_DEVICE_CSR);
aDeviceInputReg =
(unsigned short *) (aDeviceBaseAddr + A_DEVICE_INPUT_REG);
aDeviceOutputReg =
(unsigned short *) (aDeviceBaseAddr + A_DEVICE_OUTPUT_REG);
/* Beginning of processing */
int value
*aDeviceCsr = 0;
/* Clear CSR */
value = *aDeviceInputReg = 0x2; /* Read input */
*aDeviceOutputReg = 0x2;
/* Output bit 1 */
/* End of processing */
/* Unmap the memory window */
UnmapVME();
}
The routines MapVME and UnmapVME depend on the operating system. The routines
to be used in AOS (the IBM AIX for the Motorola VME processor boards) can be
found in the file /date/readList/vme2utils.c.
ALICE DATE V3 User’s Guide
74
VME access and trigger system
7.2 The trigger system
The trigger system provides the synchronization between the experiment and the
data acquisition. When an event has been collected by the detectors, a trigger signal
is sent to each LDC to activate the readout program. The EventArrived routine
handles the trigger hardware and provides the synchronization.
The EventArrived strongly depends on the triggering method adopted and on
the hardware modules. It is possible to wait for interrupts, if the trigger modules
can generate them. DATE has been design in a way that permits to poll the status of
a register instead of waiting for an interrupt. Polling is much faster than interrupt
handling, but it waists CPU cycles; this is not a problem when the processors are
dedicated to the readout.
The trigger electronics should implement the basic scheme given in Figure 7.2.
Figure 7.2
Trigger electronics
This circuit meets the following requirements:
1. All the LDCs handle a software-controlled trigger module. The trigger module
is essentially a set/reset flip-flop indicating whether the LDC is enabled to
accept triggers (status ready) or is busy processing an event (status busy). The
status of the module is accessible as an output signal and can be interrogated by
software as well. When a trigger arrives, the module must flip its status from
ready to busy within nanoseconds. In the time window between the trigger
arrival and all the output signals being flipped, the trigger must be hold off by
other electronic means. The trigger-module status is reset to ready by software.
2. The trigger may be gated off by several veto sources. In the circuit the
complementary logic is used; the trigger is enabled by the presence of the
following signals:
a. A general trigger enable signal. This signal is used to have clean start
of run and end of run procedures by blocking the triggers at the source. It is
also used to pause and continue the data acquisition.
b. A burst signal, when triggers must be gated off during the inter-spill
period.
c. A ready signal indicating that all the LDCs are ready to collect events. This
signal is an AND of the ready signals from each LDC.
ALICE DATE V3 User’s Guide
The CORBO module
75
3. LDCs not involved in a given run are prevented to affect the ready signal by
the individual disable detector signals. The disable detector signals
should be generated in accordance with the running conditions.
4. The fan-out module distributes the triggers to the LDCs. There may be events
that require reading out some of the LDCs but not all of them. The fan-out may
implement a logic decision and send the trigger only to those LDCs that are
involved in the event.
7.3 The CORBO module
The CORBO module (CES RCB 8047) is a VME read-out control board. It has four
identical channels containing a trigger input, a busy output, two VME interrupt
generators and two counters.
The CORBO registers are defined in Listing 7.3.
Listing 7.3
CORBO registers
1:
2:
3:
4:
5:
6:
7:
8:
9:
10:
11:
12:
13:
14:
15:
16:
17:
18:
19:
20:
21:
22:
23:
24:
25:
26:
27:
28:
29:
30:
31:
32:
33:
34:
35:
36:
37:
38:
39:
40:
ALICE DATE V3 User’s Guide
/* corboDef.h */
/* CORBO registers definition */
#define CORBO_CSR1
0x00 /* status registers 16-bit */
#define CORBO_CSR2
0x02
#define CORBO_CSR3
0x04
#define CORBO_CSR4
0x06
#define
#define
#define
#define
CORBO_CNT1
CORBO_CNT2
CORBO_CNT3
CORBO_CNT4
0x10 /* counters 32-bit */
0x14
0x18
0x1C
#define
#define
#define
#define
CORBO_TOU1
CORBO_TOU2
CORBO_TOU3
CORBO_TOU4
0x20 /* time out 16-bit */
0x22
0x24
0x26
#define CORBO_BIM1
*/
#define CORBO_BIM2
8-bit */
#define OFST_CR0
#define OFST_CR1
#define OFST_CR2
#define OFST_CR3
#define OFST_VR0
#define OFST_VR1
#define OFST_VR2
#define OFST_VR3
0x30 /* Event interrupt registers 8-bit
#define
#define
#define
#define
CORBO_TEST1
CORBO_TEST2
CORBO_TEST3
CORBO_TEST4
0x50 /* Simulate input trigger 16-bit */
0x52
0x54
0x56
#define
#define
#define
#define
CORBO_CLEAR1
CORBO_CLEAR2
CORBO_CLEAR3
CORBO_CLEAR4
0x58 /* Clear busy 16-bit */
0x5A
0x5C
0x5E
#define CORBO_RAM
*/
0x40 /* Time-out interrupt registers
0x01 /* Interrupt control */
0x03
0x05
0x07
0x09 /* Interrupt vector */
0x0B
0x0D
0x0F
0x60 /* Static memory (max. 0xFE) 16-bit
76
VME access and trigger system
The bits and masks used in the CSR and other registers are defined in Listing 7.4.
An earlier definition file can be found in /date/readList/corbo.h.
An example of all the functions that can be performed on the CORBO can be found
in /date/readList/corbo_lib.c.
Listing 7.4
Bits and masks for the CORBO registers
1:
2:
3:
4:
5:
6:
7:
8:
9:
10:
11:
12:
13:
14:
15:
16:
17:
18:
19:
20:
21:
22:
23:
/* CORBO bits definition */
#define CSRMASK
0xfff
#define FULLBYTE
0xff
#define CHANNELENABLE
0x0
#define CHANNELDISABLE
0x1
#define BUSYLATCHED
0x0
#define BUSYNOTLATCHED
0x2
#define INPUTFRONTPANEL
0x0
#define INPUTDIFFIN
0x4
#define INPUTDIFFOUT
0x8
#define INPUTINTERNAL
0xc
#define LOCALBUSYOUT
0x0
#define DIFFBUSYOUT
0x10
#define COUNTINPUT
0x0
#define COUNTBUSY
0x20
#define FASTCLEARENABLE
0x0
#define FASTCLEARDISABLE
0x40
#define PUSHBUTTONENABLE
0x0
#define PUSHBUTTONRESETIRQ 0x80
#define INPUTPRESENT
0x100
#define LOCALBUSYPRESENT
0x200
#define DIFFBUSYPRESENT
0x400
#define IRQPENDING
0x800
7.4 Triggering with the CORBO
7.4.1 Using the CORBO as LDC trigger module
In the example described here we use two channels of the CORBO for different
purposes.
1. Channel 1 is used to trigger the LDC and activate the readout program.
Interrupts are not used. The readout program polls the channel until a trigger
has arrived. The busy output is used to gate off subsequent triggers, until
removed by software. The internal counter is used to count the triggers received
(and seen) by the LDC. The dead-time counter is used to measure the readout
dead-time.
2. Channel 2 is used to count all the events, whether seen by the LDC or not. This
number should be written in the sub-event header, since it uniquely identifies
the event. An event can only be built by putting together all the sub-events with
the same event number, since the trigger number may vary from one LDC to
another.
ALICE DATE V3 User’s Guide
Triggering with the CORBO
77
7.4.2 Start of run initialization
The CORBO module must first be initialized. This is done in the routine ArmHw.
Since this routine may initialize other interfaces besides the CORBO, we shall refer
here to a routine called ArmCorbo, which may be called by ArmHw.
The code of ArmCorbo performs a series of operations.
First it maps a virtual-memory window to the VME address space occupied by the
CORBO, as shown in Listing 7.5.
Listing 7.5
Mapping the virtual-memory window to the CORBO VME address space
1:
2:
3:
4:
5:
6:
7:
8:
9:
10:
11:
12:
13:
14:
15:
16:
17:
18:
19:
20:
21:
22:
23:
24:
25:
26:
27:
28:
29:
/* detectorList.c */
#include “corboDef.h”
insigned
unsigned
register
register
int corboBaseAddr;
int eventArrivedFlag;
unsigned char *regPtrChar
unsigned short *regPtrShort
ArmCorbo() {
/* Set the offset and the size of the VME window */
unsigned long vmeWinOffset, vmeWinSize;
vmeWinOffset = 0;
/* Start from the bottom */
vmeWinSize = 0xF00000; /* Map part of the 24-bit the VME
space */
/* Map the VME window onto a memory window.
A pointer to the first 32-bit word is returned */
unsigned long *vmeWinAddr;
vmeWinAddr=(unsigned long *)MapVME(vmeWinOffset,vmeWinSize);
/* Set the vme base address of the CORBO.
It may depend on a switch setting on the board */
unsigned int corboVmeBaseAddr;
corboVmeBaseAddr = 0x700000;
/* Calculate the memory base address of the CORBO */
corboBaseAddr=(unsigned int)vmeWinAddr +
corboVmeBaseAddr - (unsigned int)vmeWinOffset;
Then, it initializes the channel 1 of the CORBO, as shown in Listing 7.6.
ALICE DATE V3 User’s Guide
78
VME access and trigger system
Listing 7.6
CORBO channel 1 initialization
1: /* Channel 1 initialization.
2:
Input=trigger, output=busy,
3:
event counter=trigger number (events on this LDC) */
4: regPtrShort = (unsigned short *)(corboBaseAddr + CORBO_CSR1) ;
5:
*regPtrShort = COUNTBUSY | INPUTINTERNAL; /* Enable internal
trigger */
6: regPtrChar = (unsigned char *)(corboBaseAddr + CORBO_BIM1 +
OFST_CR0) ;
7:
*regPtrChar = 0; /* Disable event interrupt */
8:
regPtrChar = (unsigned char *)(corboBaseAddr + CORBO_BIM1 +
OFST_VR0) ;
9:
*regPtrChar = 0; /* Clear event vector */
10:
regPtrChar = (unsigned char *)(corboBaseAddr + CORBO_BIM2 +
OFST_CR0) ;
11:
*regPtrChar = 0; /* Disable time-out interrupt */
12:
regPtrChar = (unsigned char *)(corboBaseAddr + CORBO_BIM2 +
OFST_VR0) ;
13:
*regPtrChar = 0; /* Clear time-out vector */
14: regPtrShort = (unsigned short *)(corboBaseAddr + CORBO_TEST1) ;
15:
*regPtrShort = 0; /* Prepare to trigger */
16:
*regPtrShort = FULLBYTE; /* and then trigger once ( set busy)
*/
17:
regPtrShort = (unsigned short *)(corboBaseAddr + CORBO_CNT1)
;
18:
*regPtrShort = 0; /* Clear event counter */
19:
regPtrShort = (unsigned short *)(corboBaseAddr + CORBO_TOU1)
;
20:
*regPtrShort = 0; /* Clear dead time counter */
21:
regPtrShort = (unsigned short *)(corboBaseAddr + CORBO_CSR1)
;
22:
*regPtrShort = COUNTBUSY | INPUTFRONTPANEL; /* Enable front
panel trigger */
Then, it initializes the channel 2 of the CORBO, as shown in Listing 7.7.
ALICE DATE V3 User’s Guide
Triggering with the CORBO
Listing 7.7
79
CORBO channel 2 initialization
1: /* Channel 2 initialization.
2:
Input=event number, output not used,
3:
event counter=event number (all the events) */
4: regPtrShort = (unsigned short *)(corboBaseAddr + CORBO_CSR2) ;
5:
*regPtrShort = INPUTINTERNAL; /* Enable internal trigger */
6: regPtrChar = (unsigned char *)(corboBaseAddr + CORBO_BIM1 +
OFST_CR1) ;
7:
*regPtrChar = 0; /* Disable event interrupt */
8:
regPtrChar = (unsigned char *)(corboBaseAddr + CORBO_BIM1 +
OFST_VR1) ;
9:
*regPtrChar = 0; /* Clear event vector */
10:
regPtrChar = (unsigned char *)(corboBaseAddr + CORBO_BIM2 +
OFST_CR1) ;
11:
*regPtrChar = 0; /* Disable time-out interrupt */
12:
regPtrChar = (unsigned char *)(corboBaseAddr + CORBO_BIM2 +
OFST_VR1) ;
13:
*regPtrChar = 0; /* Clear time-out vector */
14: regPtrShort = (unsigned short *)(corboBaseAddr + CORBO_TEST2) ;
15:
*regPtrShort = 0; /* Prepare to trigger */
16:
*regPtrShort = FULLBYTE; /* and then trigger once ( set busy)
*/
17:
regPtrShort = (unsigned short *)(corboBaseAddr + CORBO_CNT2)
;
18:
*regPtrShort = 0; /* Clear event counter */
19:
regPtrShort = (unsigned short *)(corboBaseAddr + CORBO_TOU2)
;
20:
*regPtrShort = 0; /* Clear dead time counter */
21:
regPtrShort = (unsigned short *)(corboBaseAddr + CORBO_CSR2)
;
22:
*regPtrShort = COUNTINPUT | INPUTFRONTPANEL; /* Enable front
panel trigger */
Finally, a flag is set to inform the routine EventArrivedCorbo that it is called for
the first time, as shown in Listing 7.8. The flag will instruct the routine
EventArrivedCorbo, when called, to perform the same action as after an event.
Listing 7.8
Set flag for EventArrivedCorbo
1: /* Initialize trigger flag */
2:
eventArrivedFlag = 1;
3: }
7.4.3 End of run tidy-up
The only tidy-up to be made at end of run is the releasing of the virtual-memory
space, as shown in Listing 7.9.
Listing 7.9
Releasing the virtual-memory space
1: DisarmCorbo() {
2:
3: /* Unmap the memory window */
4:
UnmapVME();
5: }
ALICE DATE V3 User’s Guide
80
VME access and trigger system
7.4.4 Trigger processing
The routine EventArrivedCorbo is repeatedly called by the readout program.
The purpose of this routine is to return a non-zero code when a trigger has fired the
CORBO. The method used is to check the status of the CSR to see whether the busy
signal is on, as shown in Listing 7.10.
Initially the CORBO is ready (not-busy). It reverts to busy when the trigger signal
arrives to the input. Then, the return code being not null, the readout program
will call the ReadEvent routine to perform the readout operations.
When the he ReadEvent routine has completed, the routine
EventArrivedCorbo starts again being repeatedly called. The first time it will
reset the busy condition.
Listing 7.10
The routine EventArrivedCorbo
1: int EventArrivedCorbo{} {
2:
3:
/* Returns a value > 0 when a trigger has occurred */
4:
int value;
5:
if (eventArrivedFlag == 1) { /* First time after a trigger,
or very first */
6: regPtrShort = (unsigned short *)(corboBaseAddr + CORBO_CLEAR1) ;
7: *regPtrShort = FULLBYTE; /* Clear busy */
8:
}
9:
regPtrShort = (unsigned short *)(corboBaseAddr + CORBO_CSR1)
;
10:
value = *regPtrShort & (LOCALBUSYPRESENT | DIFFBUSYPRESENT);
11:
12:
if (value == 0)
13: eventArrivedFlag == 0;
14:
else
15: eventArrivedFlag == 1;
16:
17:
return (eventArrivedFlag);
18: }
19:
7.4.5 Reading the CORBO counters
The CORBO counters may be readout. This is usually done in the routine
ReadEvent. Since this routine may readout other interfaces besides the CORBO,
we shall refer here to a routine called ReadEventCorbo, which may be called by
ReadEvent.
An example of such routine is shown in Listing 7.11. It reads the trigger counter
from channel 1 and the event counter from channel 2.
The way these counters are used is not shown in this code fragment.
The trigger counter must be equal to the value of the variable triggerNb in the
sub-event header. The latter is set by the software, the former by the hardware. A
consistency check may be performed and the suitable diagnostics generated.
The event counter should be copied into the variable nbInRun in the sub-event
header. As explained above (see 7.4.1), this is necessary to be able to build the
complete event.
ALICE DATE V3 User’s Guide
Using the CORBO to control the trigger
81
Other counters may also be read from the CORBO, such as the dead-time counter.
Listing 7.11
Reading the CORBO counters
1: ReadEventCorbo() {
2:
int triggerNb, nbInRun;
3:
4: /* Read local trigger counter from channel 1 (twice 16 bits) */
5:
regPtrShort = (unsigned short *)(corboBaseAddr + CORBO_CNT1)
;
6:
nbInRun = (*regPtrShort << 16);
7:
regPtrShort++;
8:
nbInRun |= *regPtrShort;
9:
10: /* Read all event counter from channel 2 (twice 16 bits) */
11:
regPtrShort = (unsigned short *)(corboBaseAddr + CORBO_CNT2)
;
12:
triggerNb = (*regPtrShort << 16);
13:
regPtrShort++;
14:
triggerNb |= *regPtrShort;
15: }
7.5 Using the CORBO to control the trigger
The DATE run-control software may optionally launch at start of run a script called
EnableTrigger and conversely launch at end of run a script called
DisableTrigger.
The purpose of this is to generate via software the general trigger enable
signal described in 7.2.
The CORBO module may be used as a simple signal generator. The internal
flip-flop is set by software and the output signal is latched to the flip-flop status.
We suppose here to use one of the CORBOs already in use for triggering a LDC,
where channels 1 and 2 have a defined task. Therefore, we will use in the example a
spare channel, namely the channel 4.
The program EnableTrigger performs the following operations:
1. Map to the VME space, in the same way shown in Listing 7.5.
2. Initialize the CORBO channel 4, as shown in Listing 7.12.
3. Clear the busy output, as shown in Listing 7.13.
4. Unmap the VME space, as shown in Listing 7.9.
ALICE DATE V3 User’s Guide
82
VME access and trigger system
Listing 7.12
CORBO channel 4 initialization
1: /* Channel 4 initialization.
2:
Input not used, output = enable signal */
3: regPtrShort = (unsigned short *)(corboBaseAddr + CORBO_CSR4) ;
4:
*regPtrShort = INPUTINTERNAL; /* Enable internal trigger */
5: regPtrChar = (unsigned char *)(corboBaseAddr + CORBO_BIM1 +
OFST_CR3) ;
6:
*regPtrChar = 0; /* Disable event interrupt */
7:
regPtrChar = (unsigned char *)(corboBaseAddr + CORBO_BIM1 +
OFST_VR3) ;
8:
*regPtrChar = 0; /* Clear event vector */
9:
regPtrChar = (unsigned char *)(corboBaseAddr + CORBO_BIM2 +
OFST_CR3) ;
10:
*regPtrChar = 0; /* Disable time-out interrupt */
11:
regPtrChar = (unsigned char *)(corboBaseAddr + CORBO_BIM2 +
OFST_VR3) ;
12:
*regPtrChar = 0; /* Clear time-out vector */
13: regPtrShort = (unsigned short *)(corboBaseAddr + CORBO_CNT4) ;
14:
*regPtrShort = 0; /* Clear event counter */
15:
regPtrShort = (unsigned short *)(corboBaseAddr + CORBO_TOU4)
;
16:
*regPtrShort = 0; /* Clear dead time counter */
Listing 7.13
Clear CORBO busy
1: regPtrShort = (unsigned short *)(corboBaseAddr + CORBO_CLEAR4) ;
2: *regPtrShort = FULLBYTE; /* Clear busy */
The program DisableTrigger does the same, but instead of clearing the busy
signal it sets it, as shown in Listing 7.14.
Listing 7.14
Set CORBO busy
1: regPtrShort = (unsigned short *)(corboBaseAddr + CORBO_TEST4) ;
2:
*regPtrShort = 0; /* Prepare to trigger */
3:
*regPtrShort = FULLBYTE; /* and then do it (set busy) */
ALICE DATE V3 User’s Guide
Guide to use
the infoLogger
system
8
A
‘typical’ distributed data acquisition system is made of several processes
running on one or more CPUs, often belonging to incompatible domains. The
development and operation phases of such a system need a set of primitives for
logging all sorts of information (debug, run-time, statistics), plus the tools to
manipulate, format and browse the resulting messages. The DATE infoLogger
package gives to both the developer and the operator a set of tools to perform the
above functions. This section describes the facilities available within the
infoLogger, how to use them and how to exploit their features.
ALICE DATE V3 User’s Guide
8.1
Introduction. . . . . . . . . . . . . . . . . . . . . . . . . . . . . 84
8.2
The infoBrowser . . . . . . . . . . . . . . . . . . . . . . . . . . 86
8.3
Browsing HTML help pages . . . . . . . . . . . . . . . . . . . 87
8.4
The information repository . . . . . . . . . . . . . . . . . . . . 87
8.5
Extracting portions of the log files . . . . . . . . . . . . . . . . 89
8.6
Injection of messages . . . . . . . . . . . . . . . . . . . . . . . 91
84
Guide to use the infoLogger system
8.1 Introduction
A DATE Acquisition System is composed on several processes running on one or
more CPUs. These processes are often detached from the operator’s and the
developer’s environment (they can be started as network daemons, they can be
child of network daemons or they can run as standalone images). However, all
DATE processes should be able to generate asynchronous information - such as
debug statements, run-time information and statistic records. Furthermore, the
DATE operator/developer should be able to gather, sort and browse these
messages in real-time. All this can be achieved via the DATE infoLogger package
whose basic features are:
•
capability to merge the messages coming from different sources, facilities and
hosts in centralized data streams;
•
capability to classify the messages according to their source, severity and
information stream;
•
possibility to follow the evolution of a DATE system while this develops;
•
capability to handle information stream based on local and networked file
systems (e.g. AFS and NFS);
•
possibility to grep the information streams in real-time using standard Unix
tools (cat, grep, tail) and/or ad-hoc filtering facilities;
•
simplified installation, use and maintenance;
•
integrated with the DATE environment and the DATE file system structure;
•
capability to gather data coming from all sorts of sources (daemons, child
processes, shell scripts, interactive processes, interactive shell commands)
written in any of the languages commonly used by DATE developers and
DATE users (C, Java, Tcl/Tk, Unix shells).
The choice of implementation made for the infoLogger scheme is based on TCP/IP
sockets (see fig. 8.1). Each source of messages (a generic process running on any of
the DATE hosts) may open at any time a TCP/IP link with a central infoLogger host
where a dedicated daemon is started. Once a message is shipped from the client
process, the daemon running on the infoLogger host accepts and validates the data,
reformats it and stores it into the appropriate information stream. The messages are
“tagged” using various bits of information, such as the time of creation, the client
DATE hostname, the source process ID, the source facility (the package or utility
that created the message), the severity of the message and the user owner of the
DATE process (if applicable).
Each facility (usually associated to a DATE package) can open at any given time
several information streams:
a. from processes running simultaneously on multiple hosts (e.g. readout);
b. from processes running simultaneously on the same host (e.g. a common
library used by two or more packages);
c. from a single process (separate streams for different purposes: debug
statements, statistics records, run-time errors etc).
ALICE DATE V3 User’s Guide
Introduction
85
Each DATE process can have at any given time at most one TCP/IP channel open
with the infoLogger host.
DATE host1
DATE host2
DATE hostN
...
DATE Process
DATE Process
DATE Process
TCP/IP
DATE
infologger
host
DATE infoLogger
daemon
DATE infoLogger
daemon
DATE infoLogger
daemon
${DATE_SITE_LOGS}
runLog
logFile1
logFile2
...
logFileN
DATE infoBrowser
utility
infoLogger
information
repository
other utilities
DATE operator/developer
Figure 8.1
The DATE infoLogger architecture
The set and the syntax of the information stream identifiers is completely free and
can be reconfigured at will at any time. Therefore, all tools who need to handle the
infoLogger information streams must be able to perform a quick online
reconfiguration on demand of the infoLogger client processes. Streams can
suddenly appear (creation of new streams) and disappear (cleanups, filtering) from
the information repository area. All this is under control of the DATE processes and
of the DATE operator: its behavior is therefore unpredictable.
ALICE DATE V3 User’s Guide
86
Guide to use the infoLogger system
The various streams can then be merged (either online or offline) and can be used
for browsing or processing. A standard browser called infoBrowser is available
via the DATE infoLogger package (see “The infoBrowser” on page 86).The
infoLogger package is also used to implement the DATE statistics scheme, where
multiple sources can contribute to common statistics records concerning the whole
Data Acquisition system. For more details see the chapter dedicated to DATE
statistics.
8.2 The infoBrowser
The infoBrowser is a tool that allows browsing and filtering of messages
generated via the infoLogger package. It can run on any system capable to open a
link with a X11 server and where the standard DATE kit has been installed and
properly configured. To start the infoBrowser, the following procedure should be
followed:
1. set the DISPLAY environment variable to the appropriate value:
> DISPLAY=”displayHostName:displayNum”; export DISPLAY
or whatever is the syntax of your preferred shell (the above example works for
/bin/sh).
Alternatively one might do:
> xterm -display displayHostName:displayNum &
This will create a brand new X11 terminal emulator where the environment is
properly set.
The string displayHostName:displayNum must correspond to a valid X11
display identifier (e.g. ion01.cern.ch:0.0);
2. if not done yet, run the DATE shell setup procedure;
3. start the infoBrowser from the shell prompt:
> infoBrowser
The infoBrowser tool allows a set of run-time flags to enable special functions.
For a complete list of these flags and to get their description, issue the command:
> infoBrowser -help
Once the tool is started, an online help is available via Help menu. The help pages
are written in HTML and can be browsed online using Netscape (see section 8.3 for
more details). The infoBrowser documentation can also be accessed offline using
any HTML browser at the (protected) URL:
http://aldwww.cern.ch/documents/DATE/DATE/infoLogger/infoBrow
ser.docs.html
ALICE DATE V3 User’s Guide
Browsing HTML help pages
87
8.2.1 The infoBrowser operator mode
The infoBrowser can run in operator mode. Main features of this mode are:
•
browsing of the standard information stream (dedicated to run-time operators);
•
reduced functionality for simpler and faster usage.
The operator mode can be selected when the infoBrowser is started via the
-operator switch, e.g.:
> infoBrowser -operator
8.3 Browsing HTML help pages
The infoBrowser help pages are written in plain Hypertext. Upon request, the
infoBrowser starts the Help browser by trying to “reuse” any Netscape window
already opened on the X11 server and - if none are available - starts a new, local
instance of Netscape. This works only if Netscape has been installed on the online
host. We recommend to install Netscape on the online host: this will allow quick
and easy browsing of the complete documentation kit.
8.4 The information repository
The infoLogger daemons write their messages in log files stored in the
DATE_SITE_LOGS repository. The same area is used by the infoBrowser - if
used in the default configuration - to get its input data.
The information repository contains:
1. the common file ${DATE_SITE_LOGS}/runLog (shared between all DATE
facilities and processes and used for all sorts of generic information);
2. an arbitrary number of package-specific package streams per each DATE
package (the name of the stream is given at run-time by the infoLogger client);
3. an optional ${DATE_SITE_LOGS}/logBook stream used for DATE statistics.
The number of streams and their identifier is decided at run-time by each client of
the infoLogger package. It is obvious that not all the DATE processes/packages
need to open an infoLogger channel: the decision to use a given stream can be
taken on the fly and introduces no extra overhead.
The number of information streams stored in the repository can be arbitrary big.
Fragmentation of information on more streams can result in more overhead on the
infoLogger host although it may give easier and quicker filtering and browsing of
the various records. The quantity of information stored in the repository is limited
by the file system and by some practical constraints (each stream needs a separate
polling thread, process or process cycle per each browser running on the
ALICE DATE V3 User’s Guide
88
Guide to use the infoLogger system
infoLogger host, and this needs the allocation of resources from the O.S.). When the
content of the DATE_SITE_LOGS repository becomes too big, the following effects
can be observed:
1. the file system may reach the maximum limit, therefore blocking completely the
logging scheme: the Unix command
> df -k ${DATE_SITE_LOGS}
shows a used % near or equal to 100;
2. the infoBrowser tool uses more system resources (memory & CPU),
especially at startup;
3. the infoBrowser tool starts to throw away messages from the display area (a
warning message is shown on the display);
4. the statsCollector daemon (see the chapter relative to DATE statistics for
more details on the statsCollector tool) uses more system resources (memory &
CPU) at startup only;
5. any other browsing/filtering/grepping tool on the content of the information
repository may begin to consume too many system resources (CPU, memory)
both at startup and at run-time.
When any of the above conditions is met, it is a good idea to start a cleanup of the
information repository. We also suggest to plan a periodic cleanup, either by
manual or automatic procedure. As the information streams are implemented as
plain text files, any tool capable of moving and archival of such entities can be used
(tar, zip, gzip, backup). We suggest not to remove the files, as their content can
be used at any time to trace back running conditions and/or statistics for any given
time of a run. The files should instead be moved to an offline area for long-term
archival, eventually packed and compressed to gain flexibility and to save
resources.
With the acquisition system preferably in quiescent state (no run in progress, no
processes active), dump the content of the DATE_SITE_LOGS in a save set, e.g.:
> tar cf /offline/logs.xxx.tar ${DATE_SITE_LOGS}/*
> gzip -9 /offline/logs.xxx.tar
The field xxx should be a unique identifier for the save set content (e.g. run dates,
run numbers, shift number). The /offline directory can be another disk or a
permanent storage device, according to the architecture of the data acquisition
system infrastructure. It should be noted that - whenever the
${DATE_SITE_LOGS} partition becomes too full - the /offline area MUST be
on a different partition where enough disk space shall be made available prior to
issue the above commands.
The whole content of the repository can now be removed:
> rm -f ${DATE_SITE_LOGS}/*
Any active daemon/tool using the DATE_SITE_LOGS area at the moment of the
cleanup should be able to “sense” the cleanup and must adapt itself to the new
running conditions. If not, it may be necessary to stop the image and restart it once
the cleanup has been performed. The standard infoBrowser tool can re-configure
itself during the cleanup procedure and does not need to be restarted.
ALICE DATE V3 User’s Guide
Extracting portions of the log files
89
8.5 Extracting portions of the log files
Whenever the content of the ${DATE_SITE_LOGS} area becomes too big or too
dispersed, it is possible to filter out the unimportant bits to produce a single file
containing only what is of most interest. The selection can be based on any of the
fields included in the messages: time-of-day, source, facility, username, messages.
Standard Unix tools (grep, egrep, sort) can be used to perform rather complex
selections. The output of the procedure is a new log file that can be stored for future
reference or simply discarded after use.
The situation is the following: in ${DATE_SITE_LOGS} we have a set of log files
where a subset is of interest to us. This subset can be selected via one or more fields
using regular expressions. We want to extract the subset of messages and save it in
a new log file, e.g. /tmp/logs/result.log. The commands - to run on the
machine hosting the ${DATE_SITE_LOGS} repository - is the following:
> cat input|egrep 'pattern'|sort|uniq > /tmp/logs/result.log
The input parameter is the name of the input information stream(s), wild cards
allowed, such as ${DATE_SITE_LOGS}/runLog or ${DATE_SITE_LOGS}/*. It
is possible to specify an explicit list of two or more files.
The selection pattern is a standard egrep regular expression. Details can be found
in the Unix egrep manual page. Several fields - following the infoLogger standard
formatting scheme - can be used to restrict the filtered set. The available selection
fields - together with some examples - are illustrated in table 8.1.
Table 8.1
Selection fields
Pattern
Action
Example
^MMDDhhmmss
Selection based on the
time of
generation of the message:
MM: month (01-12)
DD: day-of-month (01-31)
hh: hour-of-day (00-23)
mm: minutes-of-hour
(00-59)
ss: seconds-of-minute
(00-59)
^1012110000 selects all
messages generated on
12 October, 11:00.00 AM
@hostname@
Selection based on the
source host name
@mppcal07@ selects all
messages coming from
the host named mppcal07
:PID:
Selection based on the
source PID (Process IDentifier)
:19672: selects all messages coming from the
process whose PID is
19672 (decimal)
%facility%
Selection based on the
source facility
%readout% selects all
messages coming from
the facility readout
ALICE DATE V3 User’s Guide
90
Guide to use the infoLogger system
Table 8.1
Selection fields
Pattern
Action
Example
#severity#
Selection based on the
messages’ severity:
I: Info
E: Error
F: Fatal
#F# selects all messages
with severity level Fatal
=username=
Selection based on the
originator username
=nobody= selects all messages generated from
automatic daemons
+text
Selection based on the
messages’ text
+Error 23 selects all
messages starting with
the string Error 23
All sorts of egrep regular expressions can be used with the above field. Some
examples are given in Table 8.2.
Table 8.2
Some examples of regular expressions
What to select
How
Messages generated on October 12
^1012
Messages generated between October 12
and October 14
^101[2-4]
Messages generated October 14
between 10:00 and 10:59
^101410
Messages generated October 14
^10142[0-2]
between 20:00 and 22:59
Messages generated October 14
^1014(0[6-9]|1[0-2])
between 06:00 and 12:59
Messages coming from the package
monitor
%monitor%
Messages coming from monitor or
%(monitor|readout)%
readout
Error messages
#E#
Error and Fatal messages
#(E|F)#
Multiple selection patterns can be specified in the regular expression, e.g.:
((expression1) & (expression2)) | (expression3)
will select messages matching ( expression1 and expression2 ) or
expression3.
Once the selection has been preformed, it is possible to browse them via the
command:
> infoBrowser -dir directory
ALICE DATE V3 User’s Guide
Injection of messages
91
where the directory is where the result file is (in our example /tmp/logs). The
infoBrowser will allow browsing of all files contained in the given directory, as
long as their format agrees with the infoLogger conventions.
8.6 Injection of messages
Any process running on any DATE host can make use of the infoLogger to
transfer debug, information and error logs. This can be done from executable
images (main support is given for programs written in C using the C callable
interface), interpreted environments (Java via the LogChannel class, Tcl using the
shell interface) and interactive/batch processes (via the shell interface).
The first choice to be made by any DATE developer is where the log messages
generated by his/her package should go. If the message is of common interest to
the whole Data Acquisition system then it should belong to the standard
${DATE_SITE_LOGS}/runLog stream: this is where all processes send their
general-interest information. If the developer needs a dedicated stream, this can be
established and created at run-time without prior configuration needed. There are
no limits on the number of streams to be created and there is no convention outside
the “common” stream rule. A running image can alternate between different
streams according to the situation or to the type of message to exchange. It is also
possible to ship a message both the generic log stream and to a package-specific
stream with a single call to the infoLogger library. The ${DATE_SITE_LOG} area
may also contain a special stream dedicated to DATE statistics, but this should be
accessed only via its dedicated interface (see the chapter on DATE statistics for
more details).
Once the information stream has been clearly defined, the developer must choose
the information value of each message. The infoLogger scheme proposes three
levels of severities:
•
Information: used for messages concerning normal running condition: time
stamps, important events, debug statements;
•
Error: an abnormal situation has been encountered but execution can
somehow continue after some (optional) recovery actions;
•
Fatal: an unrecoverable situation has been detected and normal execution
cannot be guaranteed.
The combination of information stream and severity should provide enough
flexibility for all types of filtering and grouping of messages. The infoBrowser
tool highlights Error and Fatal messages for easy detection.
Several DATE products (readout, recorder, eventBuilder, runControl) use
the above strategy plus a variable logging level: this gives an extra level of freedom
to the developer/operator for the generation of different level of details according
to the situation.
ALICE DATE V3 User’s Guide
92
Guide to use the infoLogger system
8.6.1 The messaging system
When a message is exchanged using the infoLogger library, an atomic exchange
takes place between the client process (who generates the message) and the
daemon running on the infoLogger host. This operation can run concurrently
with other requests coming from several processes. This means that no guarantee is
given on the order of delivery of messages coming simultaneously from several
DATE hosts and processes. The only facts that can be given for certain are:
1. all log requests will block the issuer until the request has been accepted by the
TCP/IP communication library (maybe before the request is actually sent, see
the next point);
2. several messages - coming from the same or from different infoLogger client
processes - might be packed by the TCP/IP communication library on the client
host before the actual delivery takes place;
3. no feedback is returned by the daemon running on the infoLogger host
(therefore it is not possible to guarantee the proper delivery of a given
message);
4. consecutive messages coming from the same process will be delivered and
recorded in the same order as they have been issued;
5. multi-line messages (containing embedded carriage returns) will be delivered
in one single exchange and will be recorded with one atomic operation, thus
excluding all interleaving with other process.
All the messages exchanged via the infoLogger library must be native strings
and can contain embedded carriage returns (to create multi-line messages).
However, they should not be terminated with a carriage return (the library will
remove it prior to shipping). Messages should also contain printable characters
only (the library will remove non-printable characters prior to shipping).
8.6.2 Setting the facility name
One of the tags used to identify each message exchanged via the infoLogger
package is the package name. This is a unique identifier that can be specified by the
owner of the client process and where some default values are proposed.
A shell process by default sends messages tagged operator. This can be
overridden setting the environment variable DATE_FACILITY to the desired value.
A C program by default sends messages tagged with the package name (for DATE
packages) or with the image filename (for non-DATE packages). This behavior can
be overridden by setting the C preprocessor variable DATE_FACILITY to the
desired value. This must be done before including the infLogger.h file, e.g.:
Listing 8.1
Setting the Facility name in C programs
1: #define DATE_FACILITY “myFacility”
2: include “infoLogger.h”
Java programs are tagged by default as javaCode. This behavior can be changed
by calling the setFacility method of the LogChannel class. Please note that the
ALICE DATE V3 User’s Guide
Injection of messages
93
setFacility method is static: one call and all instances of the LogChannel class
will use the same facility identifier.
8.6.3 The infoLogger callable interface
This section describes the macros and the methods available for programs written
in C or Java and running on any DATE host.
Compilation of C programs require the inclusion of the file infoLogger.h part of
the infoLogger distribution kit, pointed by the environment variable
DATE_INFOLOGGER_DIR. The proper include path is automatically set if a
standard DATE makefile is used. Linking of C programs require the libInfo.a
library available on ${DATE_INFOLOGGER_DIR}/${DATE_SYS} directory (this is
done automatically if a standard DATE makefile is used to link the executable
image). Some system libraries are also needed for run-time support: the
environment variable DATE_SYSLOADLIBES, defined by the standard DATE shell
setup, can be used to resolve all symbols needed by the infoLogger library.
Compilation and execution of Java programs requires the inclusion of the directory
${DATE_INFOLOGGER_DIR} in the CLASSPATH environment variable.
LOG/log
C Synopsis
#include “infoLogger.h”
void LOG( char severity, char *message );
severity can be one of:
LOG_INFO
LOG_ERROR
LOG_FATAL
Java Synopsis
void log( char severity, String message );
severity can be one of:
DB.severityInfo
DB.severityError
DB.severityFatal
Description
The given message is sent to the infoLogger host, runLog stream, with the given
severity.
LOG_TO/logTo
C Synopsis
#include “infoLogger.h”
void LOG_TO( char *stream, char severity, char *message );
severity can be one of:
LOG_INFO
ALICE DATE V3 User’s Guide
94
Guide to use the infoLogger system
LOG_ERROR
LOG_FATAL
Java Synopsis
void logTo( String stream, char severity, String message );
severity can be one of:
DB.severityInfo
DB.severityError
DB.severityFatal
Description
The given message is sent to the infoLogger host, to the given information
stream, with the given severity.
LOG_ALL/logAll
C Synopsis
#include “infoLogger.h”
void LOG_ALL( char *stream, char severity, char *message );
severity can be one of:
LOG_INFO
LOG_ERROR
LOG_FATAL
Java Synopsis
void logAll( String stream, char severity, String message );
severity can be one of:
DB.severityInfo
DB.severityError
DB.severityFatal
Description
The given message is sent to the infoLogger host, both to the default runLog and
to the given information stream, with the given severity.
INFO/info
C Synopsis
Java Synopsis
Description
#include “infoLogger.h”
void INFO( char *message );
void info( String message );
The given message is sent to the infoLogger host, standard information stream,
with Info severity.
ERROR/error
ALICE DATE V3 User’s Guide
Injection of messages
C Synopsis
Java Synopsis
Description
95
#include “infoLogger.h”
void ERROR( char *message );
void error( String message );
The given message is sent to the infoLogger host, standard information stream,
with Error severity.
FATAL/fatal
C Synopsis
Java Synopsis
Description
#include “infoLogger.h”
void FATAL( char *message );
void fatal( String message );
The given message is sent to the infoLogger host, standard information stream,
with Fatal severity.
INFO_TO/infoTo/info
C Synopsis
Java Synopsis
Description
#include “infoLogger.h”
void INFO_TO( char *stream, char *message );
void infoTo( String stream, String message );
void info( String stream, String message );
The given message is sent to the infoLogger host, to the given information
stream, with Info severity.
ERROR_TO/errorTo/error
C Synopsis
Java Synopsis
Description
#include “infoLogger.h”
void ERROR_TO( char *stream, char *message );
void errorTo( String stream, String message );
void error( String stream, String message );
The given message is sent to the infoLogger host, to the given information
stream, with Error severity.
FATAL_TO/fatalTo/fatal
ALICE DATE V3 User’s Guide
96
Guide to use the infoLogger system
C Synopsis
Java Synopsis
Description
#include “infoLogger.h”
void FATAL_TO( char *stream, char *message )
void fatalTo( String stream, String message );
void fatal( String stream, String message );
The given message is sent to the infoLogger host, to the given information
stream, with Fatal severity.
INFO_ALL/infoAll
C Synopsis
Java Synopsis
Description
#include “infoLogger.h”
void INFO_ALL( char *stream, char *message );
void infoAll( String stream, String message );
The given message is sent to the infoLogger host, to the default and to the given
information stream, with Info severity.
ERROR_ALL/errorAll
C Synopsis
Java Synopsis
Description
#include “infoLogger.h”
void ERROR_ALL( char *stream, char *message );
void errorAll( String stream, String message );
The given message is sent to the infoLogger host, to the default and to the given
information stream, with Error severity.
FATAL_ALL/fatalAll
C Synopsis
Java Synopsis
Description
#include “infoLogger.h”
void FATAL_ALL( char *stream, char *message );
void fatalAll( String stream, String message );
The given message is sent to the infoLogger host, to the default and to the given
information stream, with Fatal severity.
ALICE DATE V3 User’s Guide
Injection of messages
97
8.6.4 The Java LogChannel Class constructors, fields and methods
This section describes the LogChannel Class, basic element for all the exchange of
information using the infoLogger Java callable interface. Please note that all this
information is available online at the URLs:
file:/date/infoLogger/LogChannel.html
http://aldwww.cern.ch/documents/DATE/DATE/infoLogger/LogChann
el.html
The first URL is relative to the local machine (we suppose that the DATE has been
locally installed). The second URL is protected and belongs to the DATE developer
team (the VID field can be used to validate the coherency of what is installed with
what is documented in the above URL).
Class LogChannel
Constructors
LogChannel channel = new LogChannel();
LogChannel channel = new LogChannel( String logHost );
where logHost is the name of the infoLogger host.
Description
Public fields
A LogChannel object is created, ready to send messages to default infoLogger host
or to a given alternative logHost.
static final String VID;
The version ID of the LogChannel Class.
static boolean quiet;
Disable (when true) and enable (when false) generation of error and warning
messages.
static boolean verbose;
Disable (when true) and enable (when false) generation of debug messages.
validate
Java Synopsis
Returns
Description
static final boolean validate();
True if the LogChannel object can be used to transfer log records, false if the
state of the LogChannel object is not correctly set.
The LogChannel is validated and set ready for use (if possible). All the fields and
parameters are checked and all the TCP/IP channels are validated and - if
necessary - created. This call can be used to ensure that the class can be
immediately used to log new information. It does not ensure that the infoLogger
host daemon will actually perform the operation (however, it ensures that the
remote daemon has been started and is responding as expected).
ALICE DATE V3 User’s Guide
98
Guide to use the infoLogger system
getError
Java Synopsis
Returns
final String getError();
A string describing the last error encountered.
clearError
Java Synopsis
Description
final void clearError();
The “last error” string is cleared (see getError).
setFacility
Java Synopsis
Description
static final void setFacility( String facility );
The facility used to identify the source of messages is set to the given facility
value (default value: LogChannel.DEFAULT_FACILITY).
getFacility
Java Synopsis
Returns
Description
static final String getFacility();
The facility identifier associated with the object.
The facility identifier used for the LogChannel Class is returned.
toString
Java Synopsis
Returns
final String toString();
A string describing the object.
8.6.5 Interactive injection of messages
At any moment, the DATE operator can inject messages in the information stream.
The only pre-requisites are to have executed the DATE setup procedure which
enables the use of the standard logging primitives log and logTo and to have
defined the DATE_SITE_LOGS environment variable.
ALICE DATE V3 User’s Guide
Injection of messages
99
The log command sends a message to the common log stream
${DATE_SITE_LOGS}/runLog. By default the message is logged as
Information but this behavior can be changed via command-line flags. To get a
complete list of these flags, use the -help option.
An example of use of the log command is:
> log “This is a log message”
The logTo command performs the same function of the log command, but the
message is directed to a named information stream, e.g.:
> logTo infoStream “This is a log message”
will store the log messages in the file ${DATE_SITE_LOGS}/infoStream. As
usual, the -help flag can be used to get a description of all the available options.
For more details on all the above subjects, please refer to the file
/date/infoLogger/README or to the (protected) document at the URL:
http://aldwww.cern.ch/documents/DATE/DATE/infoLogger
ALICE DATE V3 User’s Guide
100
Guide to use the infoLogger system
ALICE DATE V3 User’s Guide
Guide to use
the
bookkeeping
system
9
To get the maximum results from a Data Acquisition system run, the
experimental data may not be enough. Other information has to be stored and
made available for post-run analysis: the status of the beam, of the hardware, of the
software, the identifier of the data files and so on. The DATE bookkeeping system
provides a way to edit a “run record”, describing all the relevant facts concerning a
given run, by assembling the information coming from all the components of the
Data Acquisition system. This section describes the features of the bookkeeping
system and how to use it.
ALICE DATE V3 User’s Guide
9.1
The DATE bookkeeping package. . . . . . . . . . . . . . . . 102
9.2
The statsCollector . . . . . . . . . . . . . . . . . . . . . . . . 103
9.3
The statsBrowser . . . . . . . . . . . . . . . . . . . . . . . . . 105
9.4
Browsing HTML help pages . . . . . . . . . . . . . . . . . . 106
9.5
The bookkeeping repository . . . . . . . . . . . . . . . . . . 106
9.6
The bookkeeping callable interface. . . . . . . . . . . . . . . 107
9.7
The standard DATE bookkeeping record . . . . . . . . . . . 110
102
Guide to use the bookkeeping system
9.1 The DATE bookkeeping package
The role of the DATE bookkeeping package is to assist all the processes belonging
to a DATE Data Acquisition system to create and update an online database were
all the relevant information concerning the development of a given period of data
taking (called run) are stored. The flow of information handled by the bookkeeping
package can be summarized as follows:
DATE process
bookkeeping user
central
DATE process
bookkeeping
repository
bookkeeping user
......
DATE process
Figure 9.1
To long-term archive
DATE bookkeeping schematic view
An arbitrary number of sources, all belonging to the same DATE Data Acquisition
System, contribute to the editing of a central bookkeeping repository, where the
relevant data concerning the hardware and the software aspects of each run can be
stored. The central repository can then used to retrieve these records and to extract
specific or generic parameters concerning each run.
Some examples of typical users of the central bookkeeping repository are:
•
an offline reconstruction program, looking for the location and the
characteristics of a given run data file;
•
an operator/developer, checking the characteristics of the hardware and the
software involved in the acquisition;
•
an operator, checking the behavior of the Acquisition System and its interaction
with the external resources (beam, cooling, control, network).
As the bookkeeping package is mainly used to collect statistics concerning the
running characteristics of the Data Acquisition system, the terms bookkeeping
and statistics are often intermixed and - in the context of this document - may
be used to point to the same entity.
The implementation of the current release of the bookkeeping package makes
intensive use of the infoLogger scheme. The sources of information for the
bookkeeping repository - processes belonging to the Data Acquisition system,
either from online (LDCs/GDCs) or offline hosts (PDS drivers, experiment control)
- ship their data using the infoLogger library. This data is stored in a dedicated
stream named ${DATE_SITE_LOGS}/logBook. A specialized daemon called
ALICE DATE V3 User’s Guide
The statsCollector
103
statsCollector scans the content of the logBook stream, formats the data,
assembles the data blocks and builds the run records that will be saved in the
central bookkeeping repository. This daemon can run on any host with online
access to the ${DATE_SITE_LOGS} area. The output of the daemon is a set of log
files, one for each run, where in one snapshot it is possible to access a complete run
record. The log files are saved in a dedicated directory (defaulting to
${DATE_SITE_STATS}). The whole scheme is illustrated in details in figure 9.2.
DATE process
DATE process
${DATE_SITE_LOGS}/logBook
DATE process
DATE
infoLogger
host
DATE statsCollector
DATE
bookkeeping
host
bookkeeping repository
${DATE_SITE_STATS}/run###.log
DATE statsBrowser
utility
other utilities
DATE operator/control/offline
Figure 9.2
Detailed view of the bookkeeping system
9.2 The statsCollector
The sources of statistics information belonging to a DATE system use the
infoLogger primitives to ship records to the infoLogger host. This data has to
be extracted from the associated log file, assembled, sorted and saved in a run
ALICE DATE V3 User’s Guide
104
Guide to use the bookkeeping system
description file. This function is performed by the statsCollector daemon, a
standalone process that can be run on any of the DATE hosts (called bookkeeping
host) in one and only one instance.
To start the statsCollector the following procedure should be followed:
1. if not yet done, run the DATE shell setup procedure;
2. start the statsCollector from the shell prompt:
> statsCollector &
The daemon can be customized using a set of run-time flags: to see their description
use the -help option. The daemon can be started both from interactive and
detached shells, as long as the proper environment is available.
If by accident more then one instance of the statsCollector is started within
one DATE cluster (from the same or from different hosts), the daemon initiates a
self-termination procedure. A non-deterministic algorithm is followed to kill all the
instances of the daemon excepted one, which continues to perform its normal
function.
When first started, the statsCollector daemon scans the whole content of the
${DATE_SITE_LOGS}/logBook stream, if necessary updating - or creating - the
relative stats records in the ${DATE_SITE_STATS} repository. Once the scan is
completed, the daemon keeps polling the ${DATE_SITE_STATS}/logBook
stream waiting for the submission of new records. It is possible to force the daemon
to immediately terminate the polling cycle once the end of the input file is reached
via the -nopoll flag.
The statsCollector uses - by default - the online ${DATE_SITE_LOGS}
repository. It is possible to scan an alternate repository area via the -inputDir
command-line option. In this case, the use of the -nopoll flag is also
recommended (there is no use to start polling an offline logBook file, as no updates
are expected). The above procedure can be used to restore the stats records for a
given run period (saved in an old logBook file), e.g.:
> statsCollector -nopoll -inputDir /offlineLogs
In the above example, the statsCollector will create the statistics records
relative to the runs stored in the file /offlineLogs/logBook - saved copy of an
old run. It is also possible to direct the output of the daemon to a separate
repository area via the -outputDir flag. This avoids possible confusions between
online and offline stats records.
9.2.1 The statsCollector configuration file
It is possible to fine tune the statsCollector daemon using a dedicated
configuration file. One of the optional parameters for the daemon can be used to
specify the path to this file (use the -help flag for a complete description of the
relative option). The content of the configuration file can be:
1. Empty or comment lines (starting with #);
2. Output order directives:
outputOrder [facility|*]*
ALICE DATE V3 User’s Guide
The statsBrowser
105
This directive can be used to order the contributions coming from the various
facilities using a fixed order, e.g.:
outputOrder readout recorder eventBuilder * pds
will create records with the contribution of readout (from all hosts) followed
by recorder and eventBuilder. Finally all other contributions will be
appended in the given order excepted for the section generated by the pds
facility that - if present - will be always put as last.
9.3 The statsBrowser
The information gathered from the statsCollector can be browsed using the
statsBrowser. This tool can run on any system capable to open a link towards an
X11 server and where the standard DATE kit has been installed and properly
configured. To start the statsBrowser, the following procedure should be
followed:
1. set the DISPLAY environment variable to the appropriate value:
> DISPLAY=”displayHostName:displayNum”; export DISPLAY
or whatever is the syntax of your preferred shell (the above example works for
/bin/sh).
Alternatively one might do:
> xterm -display displayHostName:displayNum &
This will create a brand new X11 terminal emulator where the environment is
properly set.
The string displayHostName:displayNum must correspond to a valid X11
display identifier (e.g. ion01.cern.ch:0.0);
2. if not done yet, run the DATE shell setup procedure;
3. start the statsBrowser from the shell prompt:
> statsBrowser &
For a complete list of the run-time flags, issue the command:
> statsBrowser -help
An online help is available via the statsBrowser Help online menu. The help
pages are written in HTML and can be browsed via Netscape (see section 9.4 for
more details). The statsBrowser documentation can also be accessed offline
using any HTML browser at the (protected) URL:
ALICE DATE V3 User’s Guide
106
Guide to use the bookkeeping system
http://aldwww.cern.ch/documents/DATE/DATE/infoLogger/statsBro
wser.docs.html
9.4 Browsing HTML help pages
The statsBrowser tries to “reuse” any Netscape window already opened on the
X11 server and - if none are available - start a new, local instance of Netscape. This
obviously works only if Netscape has been installed on the online host. We
recommend to install Netscape on the online host: this will allow quick and easy
browsing of the complete documentation kit.
9.5 The bookkeeping repository
The statsCollector and the statsBrowser use - if running in their default
configuration - the ${DATE_SITE_STATS} repository to respectively write and
get the bookkeeping records. This area contains a flat set of files, one per each run
record, whose filename follows the syntax
${DATE_SITE_STATS}/daqStats.###.log
where ### is the run number.
In theory the only limits imposed on the number of records and to the quantity of
information stored in this repository are imposed by the host’s file system features.
What we suggest to do is to create, at the end of each beam period, a save set of all
the run records (tar, zip or any other archival tool will do). Once the
${DATE_SITE_STATS} area has been archived, the run descriptor files can be all
removed without problems.
9.5.1 How to re-create the ${DATE_SITE_STATS} repository
To re-create the content of the ${DATE_SITE_STATS} repository, it is necessary to
recover the file ${DATE_SITE_LOGS}/logBook relative to the complete beam
period to re-create. Multiple logBook files can be merged via the following
command:
> cat logBook1 logBook2 ... | sort | uniq >/logBookDir/logBook
At this point it is possible to re-create the ${DATE_SITE_STATS} area via the
command:
> statsCollector -inputDir /logBookDir -outputDir /stats
-nopoll
The above command instructs the statsCollector to pass the
/logBookDir/logBook file once, to create the corresponding run records and to
ALICE DATE V3 User’s Guide
The bookkeeping callable interface
107
save the result in the directory /stats. It is possible to use alternative file names
via the -inputFile flag.
The same operation can be used to restore all the run records relative to the current
${DATE_SITE_LOGS}/logBook: all the operator has to do is to stop the
statsCollector currently running (if any) and to start a fresh copy of the daemon.
This will recreate all the run records relative to the current logBook and can be used
to restore a lost or corrupted ${DATE_SITE_STATS} area.
9.6 The bookkeeping callable interface
The bookkeeping package proposes a callable interface for C, Java and shell. Tcl/Tk
code can make use of the shell interface. As the bookkeeping transport layer is
based upon the infoLogger package, the same rules and definitions used for the
infoLogger are also valid for the bookkeeping. For more details concerning the
features and the use of the infoLogger package, please refer to Chapter 8.
The basic principle for the injection of bookkeeping records is the following. A
DATE process provides the information for each record on a run-by-run basis: for
each record there must be a run identifier, the record itself and a trailer marking the
end of the record. The union of these three elements constitutes a single logical
message to be sent to the logBook stream. This message can be sent in one single
packet or split over several packets. The statsCollector daemon will use the
run identifier to associate the record to the proper run descriptor, the record trailer
to know when to use the data received and the record body to compile the final
record. Intermixing with similar data coming from other DATE processes does not
constitute a problem: each client process is uniquely identified by the
package/hostname/PID tags used by the statsCollector for its “record
building” phase.
9.6.1 The run record structure
t
r
a
i
l
e
r
Figure 9.3
Run record
R
u
n
I
D
The source run record
Each contribution to a run record must have a header, specifying the run ID
relative to the record, the body and a trailer marking the end of the record. A
bookkeeping data source can give the required information either via multiple
calls or with a single multi-line call.
The syntax for the Run ID is the following:
ALICE DATE V3 User’s Guide
108
Guide to use the bookkeeping system
Run: ###
where ### is the (unique) ID of the run. This ID can be extracted either from the
DATE shareable data segment or from the stamp file
${DATE_SITE_CONFIG}/runNumber.config.
The syntax for the trailer field is the following:
++++++++++++++++++++
The trailer string must have at least 10 ‘+’ characters.
9.6.2 The bookkeeping calls
As the bookkeeping transport method is based on the infoLogger package, the
same rules described for the infoLogger callable interface are valid also for the
bookkeeping callable interface. Please refer to the ALICE DATE Reference
Manual for more details. This section describes the specific bookkeeping entries
available for C programs, Java code, Tcl code (via the shell library) and Unix shells.
LOGBOOK/logBook/logBook
C Synopsis
#include “infoLogger.h”
void LOGBOOK( char *message );
Java Synopsis
void logBook( String message );
Shell Synopsis
> logBook “message”
Description
The given message is sent to the bookkeeping stream of the infoLogger host. The
message can be a record header, part of - or the whole of - a record body and a
record trailer (although trailers can be sent using a logBook marker call).
LOGBOOK_MARKER/logBookMarker/logBookMarker
C Synopsis
#include “infoLogger.h”
void LOGBOOK_MARKER;
Java Synopsis
void logbookMarker();
Shell Synopsis
> logBookMarker
Description
An record trailer marker is sent to the bookkeeping stream of the infoLogger host.
ALICE DATE V3 User’s Guide
The bookkeeping callable interface
109
9.6.3 Single-line records examples
Here are some examples of single-line bookkeeping record.
Listing 9.1
Example of single-line C bookkeeping record
1:
2:
3:
4:
5:
6:
7:
Listing 9.2
Example of single-line Java bookkeeping record
1:
2:
3:
4:
5:
Listing 9.3
char line[ 1000 ];
sprintf( line, “Run: %d”, runNb ); /* runNb: run number */
LOGBOOK( line );
LOGBOOK( “First line” );
LOGBOOK( “Second line” );
LOGBOOK( “Third and last line” );
LOGBOOK_MARKER;
logChannel.logBook( “Run: “ + runNb ); // runNb: run number
logChannel.logBook( “First line’ );
logChannel.logBook( “Second line’ );
logChannel.logBook( “Third and last line’ );
logChannel.logBookMarker();
Example of single-line shell bookkeeping record
1:
2:
3:
4:
5:
>
>
>
>
>
logBook “Run: ${runNb}” # runNb: run number
logBook “First line”
logBook “Second line”
logBook “Third and last line”
logBookMarker
In the above examples, all logBook calls are consecutive and belong to the same
block: this is not a requirement. Between each logBook call it is possible to add as
many “foreign” instructions as needed. It is not necessary to group all calls in
consecutive statements. However, the statsCollector will timeout after a fixed
delay: this means that when too much time elapses between logBook calls (the
default timer is ~ 30 seconds) the statsCollector will flush whatever has been
received so far to the final log record. Therefore, it is better to leave as little time as
possible between the first and the last logBook call. The value of the delay timer of
the statsCollector can be changed at will (use the -help flag for a complete
description of the relative option).
9.6.4 Multi-line records examples
We will now see three examples of multi-line bookkeeping records. This
mechanism can be used to transfer all the information in one block and with a
single TCP/IP message. It is obvious that all the required information must be
available at the time of the call.
ALICE DATE V3 User’s Guide
110
Guide to use the bookkeeping system
Listing 9.4
Example of multi-line C bookkeeping record
1: char line[1000];
2: sprintf( line,
“\
Run: %d\n\
First line\n\
Second line\n\
Third and last line\n\
++++++++++++++++++”,
runNb ); /* runNb: run number */
3: LOGBOOK( line );
Listing 9.5
Example of multi-line Java bookkeeping record
1: logChannel.logBook( “Run: “ + runNb+ “\n” + // runNb: run number
“First line\n” +
“Second line\n” +
“Third and last line\n” +
“+++++++++++++++” );
Listing 9.6
Example of multi-line Bourne-shell bookkeeping record
1:
2:
3:
4:
5:
6:
> # runNb: run number
> logBook “Run: ${runNb}
First line
Second line
Third and last line
+++++++++++++++++”
The shell example should be taken with care, as the way each shell breaks
multi-line strings may vary from one implementation to another. The snipped in
listing 9.6 is valid for shells such as sh and bash on Solaris and AIX. On those two
OSs C-shells use a different syntax (where each line has to be terminated by a \
character). Other OSs may use different syntax for multi-line breaking.
9.7 The standard DATE bookkeeping record
As delivered in its standard configuration, a DATE readout system will produce a
standard bookkeeping record, available automatically for each run. The record will
contain the following information:
•
•
for each LDC:
–
readout version number
–
hostname where readout executes
–
number of data events + start of burst events + end of burst events
(combined)
–
number of physics events
–
number of bursts in the run
for each GDC:
ALICE DATE V3 User’s Guide
The standard DATE bookkeeping record
–
event builder version number
–
number of start of run events
–
number of end of run events
–
number of start of run files events
–
number of physics events
–
number of end of link events
–
output file name and number of files written
–
number of records written
–
number of bytes written
111
An example of the standard DATE bookkeeping record is available in Figure 9.4.
Figure 9.4
Example of standard DATE bookkeeping record
ALICE DATE V3 User’s Guide
112
Guide to use the bookkeeping system
ALICE DATE V3 User’s Guide
Conventions
and file
organization
10
This chapter describes the organization of directories in DATE and the conventions
adopted for naming files and directories. Other conventions concern the usage of
Inet dæmons.
ALICE DATE V3 User’s Guide
10.1
DATE environment . . . . . . . . . . . . . . . . . . . . . . . 114
10.2
File organization . . . . . . . . . . . . . . . . . . . . . . . . . 114
10.3
Environment variables and aliases . . . . . . . . . . . . . . . 116
10.4
Internet dæmons . . . . . . . . . . . . . . . . . . . . . . . . . 117
10.5
Package development . . . . . . . . . . . . . . . . . . . . . . 117
10.6
Logging information . . . . . . . . . . . . . . . . . . . . . . . 119
114
Conventions and file organization
10.1 DATE environment
The operation of DATE requires obeying a number of conventions concerning the
file organization and the Internet dæmons. These conventions have been
established in order to fulfil the following requirements:
•
DATE runs at a site made of a cluster of host machines communicating via
network (TCP/IP).
•
The hosts may be of different brands and run different operating systems.
•
The hosts may share the same file system.
•
Several independent experiments may run at the same site. They share the same
cluster and the same file system. Each host will be allocated to only one
experiment and all the experiments will use the same version of DATE.
•
The installation of the DATE software on a site is made by bringing the full set
of DATE packages, called the distribution kit, which contains all the
site-independent run-time files, plus all the source files and some templates of
the site-specific files. The distribution kit is complete, i.e. the DATE software can
be re-built from scratch starting from the kit. The installation is decided and
performed by the site manager. The procedure does not disrupt any of the
DATE run-time system files specific to the experiment.
•
Each DATE package can be developed and tested in conjunction with the
standard running system. DATE remains fully operational, while a developer
runs own versions of one or more packages.
10.2 File organization
The DATE run-time system makes use of two distinct areas on the file system
(figure 10.1).
The first area contains all the files belonging to the DATE distribution kit. It must
reside in a directory called /date and is pointed to by the environment variable
DATE_ROOT. The site manager may decide to put it elsewhere; then a symbolic link
/date must be created to the area. There may be only one such area in a given file
system. This area is totally overwritten when installing a new version of the
distribution kit, therefore no site-specific files may reside here. At run-time this area
can be considered as read-only.
The second area contains all the site-specific files, such as the configuration files
and all the files created at run-time by the DATE packages. It may reside in any
directory decided by the site manager and is pointed to by the environment
variable DATE_SITE. This area is left untouched by the installation procedure, so
that all the site-specific files be preserved. There may several site-specific areas on
the same file system, one per experiment.
ALICE DATE V3 User’s Guide
File organization
Figure 10.1
115
A view of the file organization in DATE
10.2.1 Structure of ${DATE_ROOT}
This area contains the following items:
•
Utility scripts
These are scripts used for the environment management, such as:
Install
setup.sh and setup.csh
README
•
The hidden directory .commonScripts, which contains a library of scripts.
•
The directory commomDefs, which contains all the common .h files.
•
The directory java
•
The directory makefiles
•
The directory ReleaseNotes
•
One directory per DATE package (named upon the package name):
dataRecorder
eventBuilder
infoLogger
monitoring
readList
readout
runControl
simpleFifo
10.2.2 Package directory
Each package directory has the following structure:
•
Utility scripts such as:
ALICE DATE V3 User’s Guide
116
Conventions and file organization
GNUmakefile
packageParams and testParams (configuration files use by dateSetup)
•
All the source files
•
One directory per operating system (named upon the operating-system name
as returned by ...), which contains the run-time system for all the hosts running
that type of system. Files in this directory are of type .obj, .lib, .bin, .sh
and .tcl. Currently supported systems are:
AIX
SunOS
10.2.3 Structure of ${DATE_SITE}
This area contains the following items:
•
The directory configurationFiles which contains all the configuration files
of an experiment:
runControl.config
runNumber.config
runControl.params
SOR.commands
SOR.files
infoLogger.config
•
The directory logFiles which contains:
a general log file called runLog
package-specific log files
•
One directory per package (named upon the package name) which contains all
the private configuration files of a package.
•
One directory per host (named upon the host name) which contains any host
specific software, such as:
readout
enableTrigger
disableTrigger
10.3 Environment variables and aliases
Any interactive session or shell using DATE must define an environment variable
DATE_SITE pointing to the site-specific directory and then invoke
/date/setup.sh. As a result of this operation, the following environment
variables are defined:
DATE_ROOT pointing to the site-independent directory
DATE_SITE pointing to the site-specific directory
DATE_SITE_LOGS pointing to ${DATE_SITE}/logFiles
DATE_SITE_CONFIG pointing to ${DATE_SITE}/configurationFiles
DATE_HOST indicating the host machine name
ALICE DATE V3 User’s Guide
Internet dæmons
117
DATE_SYS indicating the operating system of the host machine
In addition, the following aliases are defined and may be used as commands:
dateControl to start the run control program
readoutControl to start the readout configuration program
eventDump to start the event dump program
infoBrowser to start the browser of the messages of the logging system.
dateSetup to set up the specific environment for a package
dateSymbols to display all the common DATE environment variables
10.4 Internet dæmons
There are several dæmons used in DATE. They make use of the Internet services
dæmon (inetd).
The inetd services are specified by the following files:
/etc/services which declares the port number of all the services
/etc/inetd.conf which declares the server program to be invoked for all the
services.
In DATE the declared servers are shell scripts which first set up the environment
variables for the package concerned and then call a program.
The setup.sh script defines some environment variables corresponding to the
inetd services:
DATE_SOCKET_RCS
DATE_SOCKET_EB
DATE_SOCKET_INFOLOGGER
DATE_SOCKET_EBDAEMON
DATE_SOCKET_MON
6101
6201
6301
6401
6601
The DATE packages use these variables when declaring the socket port.
Remark: all the port numbers are found also in the file:
${DATE_COMMON_DEFS}/shellParams.common
Since the environment variables are defined by setup.sh or setup.csh, you
must not modify the port numbers in /etc/services unless you modfy
/date/setup.sh accordingly.
10.5 Package development
By convention, the packages access the resource they need at run-time (either files
or sockets) through environment variables.
ALICE DATE V3 User’s Guide
118
Conventions and file organization
Let us assume that the package is called package and its abbreviateed acronym is
pk. Before using a package, it is necessary to invoke:
dateSetup /date/package/packageParams
As a result, all the environment variables necessary to the package will be defined.
Their name will be of the type:
DATE_pk_variable
Each package must use a private definition of the run-time directories; for example:
DATE_pk_CONFIG points to DATE_SITE_CONFIG
DATE_pk_SITE points to $DATE_SITE
The same holds for the variables used by the GNUmakefile to locate the files. For
example:
DATE_pk_ROOT points to the package main directory
DATE_pk_BIN points to $DATE_pk_ROOT/$DATE_SYS which is the run-time
directory
DATE_pk_INC points to the include files
DATE_pk_OBJS points to the object files
It is possible to develop and test a package in a private directory, whithout
disturbing the other users DATE. To do so, the developer keeps in his private
directory a replica of /date/package and a replica of the date_site area with only
the files necessary to the package.
The usage of the private version of the package is obtained by re-defining the
environment variables DATE_pk_variable to point to the private area. The
private definition is kept by convention in the file testParams, and may be activated
by the command:
dateSetup /private_dir/package/testParams
If the program to be tested is a daemon, there is a further complication. The
convention adopted is the following:
For each dæmon, two services with different numbers and names are declared, one
to be used by the standard system and the other for testing purposes. The
declaration in inetd.conf will either indicate two different scripts or the same
script with two different parameters. In the latter case, it is up to the script to sort
out the two cases. Each DATE package refers to the service via an environment
variable giving the socket port number. It is sufficient to re-define this variable in
the testParams file to automatically switch to a private version of the dæmon.
The socket ports used for development are:
DATE_SOCKET_RCS
6102
DATE_SOCKET_EB
6202
DATE_SOCKET_EBDAEMON 6402
ALICE DATE V3 User’s Guide
Logging information
119
10.6 Logging information
The DATE packages may generate, at run-time, information messages that are
processed by the infoLogger system. The following conventions apply to such
messages.
10.6.1 Use of streams
Any DATE activity may send messages to three information streams1: its own
stream, the common runLog stream and the common logBook stream. By activity
it is meant a set of programs (processes) co-operating for a given purpose. The
largest collection of programs should be a DATE package, the smallest may be a
single program. A library of routines may also be considered as an independent
activity and have its own stream, when it has a purpose specific to the data
acquisition (e.g. the monitoring library).
1. The activity own stream.
The name of the stream should be the most significant name indicating the
related activity. It may be the name of the package or the name of the
program or any other. All the messages of any severity should go to this
stream. The routine calls to be used to inject messages into this stream are of
the type logTo.
2. The runLog stream.
This stream is used by all the programs to address messages to the operator.
The messages may have any severity. The messages on this stream must be
thought to be particularly significant to the operator; they are usually not
the same messages intended to the expert. Only a small fraction of all the
occurrences generating messages should be reported to the operator as well;
in this case, the designer should consider generating a stripped down
message for the operator, containing only the essential information, while
all the details are given in the message to the own stream. The messages in
this stream are also sent to the own stream, therefore the routine calls to be
used to inject messages into this stream are of the type logAll.
3. The logBook stream.
This stream may be used by any program to record messages on the run
bookkeeping file. The messages can only have the severity “information”.
Ar run-time, each process may produce messages addressed not only to the stream
assigned to its own package, but also to all the streams assigned to the libraries it
uses.
10.6.2 Use of the severity
The severity2 must be chosen and specified for each message, according to the
definitions given in the chapter on the infoLogger system. The infoTo,
1. Information streams are recorded by the infoLogger onto files; each stream has got its own
file.
ALICE DATE V3 User’s Guide
120
Conventions and file organization
infoAll ... call type force the developer to make the choice, while in the logTo
type the severity is an optional parameter.
The three possible severities are specified by the symbols: LOG_INFO, LOG_ERROR,
LOG_FATAL. A message should be flagged as fatal only if it signals a catastrophic
action such as a run abort. A fatal message should mark the end of a series of
unrecoverable errors that have generate normal error messages.
10.6.3 Use of the facility
The facility3 name identifies an activity (or a significant part of it). It is used to single
out the messages generated by one activity, when they are either intermixed with
other activities in the same stream or dispersed in several streams. whose routines
may be used by many different programs. Usually, for a given program, package,
stream and facility have the same name.
10.6.4 Filtering the logged messages at the source: the log level
Critical real-time processes may require to select at run-time whether to log
messages. In case of testing or debugging, there should be the possibility of
selectively logging some of the messages (of any severity), at variable levels of
detail. The designer will be aware that additional information will increase the
overhead. This selection mechanism, called log level, can only be implemented in
the code of each program and cannot be generalized. The selection cannot be done
within the logging routines, since the designer may want to dynamically exclude
fragments of his own code as well. There is a convention between the run control
and various programs in the data acquisition to share a variable called logLevel
in the rcShm shared memory segment. The run control sets this variable at start of
run, the other programs decide what to do according to the value they find. The
logLevel space is divided into ranges with a standard meaning, with thresholds
defined by the symbols LOG_NORMAL_TH (= 10), LOG_DETAILED_TH (= 20),
LOG_DEBUG_TH (= 30).
1. 0 <= logLevel < LOG_NORMAL_TH
No message will be logged.
2. LOG_NORMAL_TH <= logLevel < LOG_DETAILED_TH
Normal error and information messages will be generated. It should allow for
normal operation of the data acquisition, with the necessary indications in case
of troubles. The message generation should have no impact on the
performance.
3. LOG_DETAILED_TH <= logLevel < LOG_DEBUG_TH
Detailed information messages will be logged. A performance degradation
should be expected.
4. LOG_DEBUG_TH <= logLevel
Debugging information messages will be logged. A severe performance
degradation should be expected.
2. The severity is an attribute of the messages that makes it possible to make selections on the
seriousness of the problem reported.
3. The facility is an attribute of the messages that makes it possible to select sets of messages
across streams.
ALICE DATE V3 User’s Guide
Logging information
121
Each program may have its own internal convention within these ranges.
Other programs not accessing rcShm should use another mechanism to pass the
logLevel value, but still use the same log level convention.
ALICE DATE V3 User’s Guide
122
Conventions and file organization
ALICE DATE V3 User’s Guide
DATE
installation
guide
11
This chapter describes how to retrieve the DATE software from the reachieve and
how to install DATE on the target systems.
ALICE DATE V3 User’s Guide
11.1
Hardware and software platforms . . . . . . . . . . . . . . . 124
11.2
Getting the software . . . . . . . . . . . . . . . . . . . . . . . 124
11.3
First time installation . . . . . . . . . . . . . . . . . . . . . . 125
11.4
Installation of a new release. . . . . . . . . . . . . . . . . . . 129
11.5
Run control configuration . . . . . . . . . . . . . . . . . . . . 129
11.6
Information logger configuration . . . . . . . . . . . . . . . 140
11.7
Monitoring configuration . . . . . . . . . . . . . . . . . . . . 140
124
DATE installation guide
11.1 Hardware and software platforms
The system supports the platforms listed in table 11.1.
Table 11.1
Hardware and software platforms
Hardware
Operating system
LDC
GDC
Monitoring
Run control
Motorola MVME 2600
AOS
✓
✓
✓
✓
IBM 43P
AIX
✓
✓
✓
✓
SUN SPARC
Solaris
✓
✓
✓
HP
HP-Unix
PC
Windows 95
PC
Linux
✓
✓
✓
11.2 Getting the software
The distribution kits of DATE are accessible from the web. An authorization is
required.
The kit repository is located at the following URL:
http://aldwww.cern.ch/Collaborators/DATE/Releases
There are two types of kits, called respectively core and full (this is indicated in
the file name).
1. The full kit contains the DATE distribution and the distribution of Java. Its
size is around 80 MB. It should be used for the first installation and, in the
successive installations, when the Java version has changed. Since several
DATE packages are written in Java, it is important to make sure that the Java
release on the machine is in step with the one used by DATE
2. The core kit contains exclusively the DATE distribution. Its size is around 15
MB, therefore it is faster to retrieve. It may be used for upgrading the DATE
versions within a major release.
The name of the kit contains the date of generation and is suffixed with either .tar
or .tar.gz
Before retrieving the distribution kit on your file system (e.g. on /tmp) make sure
that the /tmp directory has the read/write/execute protections for everybody,
otherwise set the privileges in the following way:
> chmod a+rwx /tmp
ALICE DATE V3 User’s Guide
First time installation
125
11.3 First time installation
11.3.1 Setting up the file base
1. Login as root.
2. Authorize root to open a remote shell on all the machines that will be running
DATE. This is done by editing (or creating) the /.rhosts file to contain a line
with the name of the machine where you ar logged in.
3. Create the directory where the DATE software should be installed.
You should call it /date.
If you choose another name (e.g. /date_root), you must set up a symbolic
link in the following way:
> ln -s /date_root /date
Such a link must be declared in all the machines in the system.
4. Create a directory where your experiment specific files will reside.
5. Define the symbol DATE_SITE to point to the new directory above.
In Bourne shell do the following:
> export DATE_SITE; DATE_SITE=/directory
In C-shell do the following:
> setenv DATE_SITE /directory
In BASH do the following:
> declare -x DATE_SITE=/directory
where directory is the name of the new directory.
6. Login with a user account.
7. Expand the distribution kit, previously retrieved in /tmp. All the files will be
automatically placed in the right location.
> cd /date
> rm -rf *
> tar xf /tmp/distribution_kit.tar
Removing all the files before invoking tar is useful to make sure that files no
longer necessary are deleted. Be careful not to delete either the directory
.commonScripts or the files in it.
If you get the compressed version of the kit, suffixed with .tar.gz, you should
first de-compress it:
> gunzip distribution_kit.tar.gz
ALICE DATE V3 User’s Guide
126
DATE installation guide
If disk space is a problem, decompression and unpacking can be done in a
single step. With /date as your working directory, do:
> gunzip -c distribution_kit.tar.gz | tar xf 8. Setup all the DATE symbols:
In Bourne shell and in BASH do the following:
> . [ -r /date/setup.sh ] && . /date/setup.sh
In C-shell do the following:
> source /date/setup.csh
9. The operations described in the points 5 and 8 above are necessary each time
you want to use DATE. Therefore, you may want to add them to your login file
(e.g. in .zshenv, .profile or .bashrc).
10. Create under ${DATE_SITE} the following sub-directories:
logFiles
configurationFiles
runControl
eventBuilder/eb_host
where eb_host is the name of the machine hosting the event builder.
11. Create under ${DATE_SITE} one directory for each CPU in your system. The
name of each directory must be the name of the corresponding machine (e.g.
mppcal01)
12. Give write access for the group and for others to all the directories previously
created:
> chmod -R a+w ${DATE_SITE}
13. Create the file rcShmKey onto the site-dependent area:
> touch ${DATE_SITE}/runControl/rcShmKey
Make sure that rcShmKey has read access for all. If not, change the access
rights:
> chmod a+r ${DATE_SITE}/runControl/rcShmKey
11.3.2 Internet services
Some INETD services are needed by DATE:
•
date_rcs
Run control service, used to start the rcServer. It should be added to all the
ALICE DATE V3 User’s Guide
First time installation
127
machines declared as either LDC or GDC.
•
date_evb
Event builder service, used to start the gdcServer. It should be added to the
machines declared as GDC.
•
date_info
Info logger dæmon, used to start the infoDaemon. It should be added to the
machine declared as DATE_INFOLOGGER_LOGHOST in
${DATE_SITE_CONFIG}/infoLogger.config.
•
date_evbd
Event builder control service, used to start the ebDaemon. It should be added to
the machine declared as GDC.
•
date_mon
Monitoring service, used for hosts who wish to offer monitoring stream via
network. It should be added to any machine (online or offline) who wish to
offer monitoring streams to the outside world.
There is a procedure that implements all these services. It must be invoked from
root. Make sure that the DATE symbols are still defined, otherwise execute again
the procedure described in 11.3.1 point 8. The command to invoke the procedure is
the following:
> dateNetwork (-c|-i) [-g”GDC1 GDC2 ...”][-l”LDC1 LDC2
...”][-G”InfoLogger1 InfoLogger2 ...”][-m”MON1 MON2 ...”]
where:
-c performs the check that the network is properly setup to run DATE (no
modifications performed)
-g indicates the list of GDCs
-G indicates the list of machines where the infoLogger may run
-i installs the setup needed by DATE
-l indicates the list of LDCs
-m indicates the list of machines from which event monitoring is allowed
The list of machines must be a blank-separated sequence of hostnames, e.g.:
> dateNetwork -c -g”host1 host2 host3” -l”host4 host5”
-Ghost6 -m”host7 host8 host9”
All hosts shall be reachable directly by “rsh” and the caller must be authorized to
remote shell as user “root” on the remote machines. This is normally the case, if you
have followed the instructions in 11.3.1.
The command dateNetwork performs the following steps.
1. The file /etc/inetd.conf of each machine where the INETD services are
required will contain the code fragment in listing 11.1.
ALICE DATE V3 User’s Guide
128
DATE installation guide
Listing 11.1
INETD service configuration
1:
2:
3:
4:
5:
6:
7:
8:
#
# DATE service handlers
#
date_rcs stream tcp nowait nobody /date/runControl/OS/rcServer.sh
rcServer /date_site
date_info stream tcp nowait nobody
/date/infoLogger/OS/loggerDaemon loggerDaemon
date_evb stream tcp nowait nobody
/date/eventBuilder/OS/GDCserver.sh GDCserver /date_site
date_evbd stream tcp nowait nobody
/date/eventBuilder/OS/eventBuilderDaemon.sh eventBuilderDaemon
/date_site
date_mon stream tcp nowait nobody /date/monitoring/OS/mpDaemon.sh
mpDaemon /date_site
Note that the symbol /date_site represents the real name of the directory
indicated by the symbol DATE_SITE (the symbol DATE_SITE cannot be used
in this context). Conversely, the symbol OS points to the machine’s operating
system, available within the symbol DATE_SYS.
The service defined in line 4 is needed on GDCs and LDCs. The service defined
in line 5 is required by the infoLogger host. The services defined in line 6 and 7
are needed on the GDCs. Finally, the service defined in line 8 is needed by all
machines who wish to offer monitoring streams.
2. The file /etc/services of each machine - where the INETD services are
defined - will contain the code fragment in listing 11.2.
Listing 11.2
INETD services
1:
2:
3:
4:
5:
6:
7:
8:
#
#
DATE servers
#
date_rcs 6101/tcp
date_evb 6201/tcp
date_info 6301/tcp
date_evbd 6401/tcp
date_mon 6601/tcp
#
#
#
#
#
DATE
DATE
DATE
DATE
DATE
Run Control Server
Event Builder: GDC server
info logger daemon
Event Builder Daemon
Monitoring server
3. To make the modifications effective, the following command will be invoked:
On AIX:
> refresh -s inetd
On Solaris:
> kill -HUP inetdPID
where inetdPID is the process ID of the inetd process (it can be determined via
the command:
> ps -e|grep inetd
ALICE DATE V3 User’s Guide
Installation of a new release
129
11.4 Installation of a new release
The procedure of installing a new release of DATE consists of replacing all the files
in the ${DATE_ROOT} area.
1. Import the distribution kit, as described in 11.2.
2. Expand the distribution kit, as described in 11.3.1 point 6.
All the site-specific files are left untouched by the procedure. It is, though,
important to check the release notes to see whether the new packages require
modification or additions to the configuration files.
11.5 Run control configuration
11.5.1 Run-control windows configuration
The run control presents to the operator a few windows from which it is possible to
set up and modify the hardware configuration (by selecting the machines involved
in the run and their relationship) and to establish the parameters that define the run
conditions.
The content of the run-control windows is itself parametrized. Items to appear on
the display windows must previously be defined in the file
${DATE_SITE_CONFIG}/runControl.config. This file must be prepared with
an editor. An example is shown in Listing 11.3. Another example exists in the
distribution: /date/runControl/runControl.config, which may be copied
in the right place and edited there.
The file runControl.config is structured as a sequence of keywords (prefixed
with either > or *) followed by a list of definitions of the items related to the
keyword. Each item occupies one line and is made of a sequence of parameters.
The syntax rules are the following:
•
String parameters must be enclosed within quotes (“).
•
Blank lines are ignored.
•
Blank characters are used as parameter separators, otherwise they are ignored.
•
Lines starting with # are ignored (comment lines).
•
Lines starting with either > or * must specify a valid keyword.
•
A keyword followed by another keyword is ignored (even if not valid).
•
Keywords may be given in any order.
The file is interpreted in one pass. A syntax error stops the interpretation of the file
(remaining lines are ignored).
ALICE DATE V3 User’s Guide
130
DATE installation guide
Listing 11.3
Example of the file runControl.config
1:
2:
3:
4:
5:
6:
7:
8:
9:
10:
11:
12:
13:
14:
15:
16:
17:
18:
19:
20:
21:
22:
23:
24:
25:
26:
27:
28:
29:
30:
31:
32:
33:
34:
35:
36:
37:
38:
39:
40:
41:
42:
43:
44:
45:
46:
47:
48:
49:
50:
51:
52:
53:
54:
55:
56:
57:
58:
# Example of configuration file for the runControl program
# Compliant with DATE v3.2
>WINDOWTITLE
DATE run control
>PARFILE
runControl.params
>LDC
rsald01 “Front-end 1” 0
rsald02 “Front-end 2” 1
mppcal03 “Front-end 3” 2
mppcal04 “Front-end 4” 3
>GDC
mppcal05 “Event builder”
>RUNPAR
maxEvents “Max. number of events”
>CNFPAR
maxBytes “Max. kBytes to record”
maxEventSize “Max. event size (bytes)”
maxFileSize “Max. file size (kBytes)”
phaseTimeoutLimit “Max. time for SOR/EOR phases (sec)”
>LDCPAR
recordingDevice “Recording device”
monitorEnableFlag “Monitor enable flag”
randEventMinSize “Randev min size”
randEventMaxSize “Randev max size”
randEventInterval “Randev interval”
logLevel “Logging level”
>GDCPAR
ebRecordingDevice “EVB recording device”
monitorEnableFlag “Monitor enable flag”
logLevel “Logging level”
>LDCSTATUS
eventCount “Number of events”
triggerCount “Number of triggers”
eventsTransferred “Events transferred”
bytesTransferred “kBytes transferred”
readoutFlag “SOR/EOR phase”
>GDCSTATUS
eventCount “Number of events”
eventsRecorded “Events recorded”
bytesRecorded “kBytes recorded”
monitorEnableFlag “Monitor enable flag”
fileCount “File count”
bytesInFile “kBytes in file”
>TCLEVAL
set ldcEventBufferSize 1024000
source /date/runControl/bufferStatus.tcl
Valid keywords are the ones shown in table 11.2.
ALICE DATE V3 User’s Guide
Run control configuration
Table 11.2
131
Keywords of the configuration file
Keyword
Following items
COMMENT
Catch all: all the following lines are ignored, until the next
keyword.
WINDOWTITLE
The title of the run-control program main window.
PARFILE
The directory and file name of the run control parameters. If
specified, the run control program will try to read the parameters from this file and will propose this file as default location for further parameter saving and restoring.
LDC
The list of the machines where the front-end software runs.
Each item is the name of the machine followed by a label
which will appear in the run control main window. The last
parameter is the detector bit which will be written in the
detector mask field of the event header. Valid detector bits are
0 up to 126. This list contains all the machines among which
the active machines will be chosen.
GDC
The list of the machines where the event builder and the
monitor process should be launched at start of run. Each item
is the name of the machine followed by a label which will
appear in the run control main window. This list contains all
the machines among which the active machines will be chosen.
RUNPAR
The list of control parameters that will appear in the main
window, under the heading Run parameters. These
parameters will be set at start of run in the shared memory
segment of the run control of all the machines (LDCs and
GDCs). Each item is the conventional name of the parameter
followed by a label which will appear in the main window.
CNFPAR
The list of control parameters that will appear in the window
labelled Configuration parameters, under the heading Common parameters. The treatment is the same as for
the RUNPAR parameters; the only difference is the location
on the screen, which implies less visibility for the operator.
LDCPAR
The list of control parameters which will appear in the LDC
part of the window labelled Configuration parameters. These parameters will be set at start of run in the
shared memory segment of the run control of all the LDCs.
Each item is the conventional name of the parameter followed by a label which will appear in the parameter window.
GDCPAR
The list of control parameters which will appear in the GDC
part of the window labelled Configuration parameters. These parameters will be set at start of run in the
shared memory segment of the run control of all the GDCs.
Each item is the conventional name of the parameter followed by a label which will appear in the parameter window.
LDCSTATUS
The list of control parameters which will be displayed in the
LDC part of the window labelled Status display. Each
item is the conventional name of the parameter followed by a
label which will appear in the display window.
ALICE DATE V3 User’s Guide
132
DATE installation guide
Table 11.2
Keywords of the configuration file
Keyword
Following items
GDCSTATUS
The list of control parameters which will be displayed in the
GDC part of the window labelled Status display. Each
item is the conventional name of the parameter followed by a
label which will appear in the display window.
TCLEVAL
The list of tcl statements to be executed by the run control
program. The execution of these statements will happen after
the run control has processed the configuration file and is
properly configured, and before the optional parameter file is
read. The main use is to plug in additional tcl source code.
TCLEARLYEVAL
The list of tcl statements to be executed by the run control
program. These statements are immediately passed to the tcl
interpreter, line by line. A mistake in the statements will
cause an abnormal exit of the run control program, since the
proper recovery mechanism is not yet available at this point
in time. The main use is to define environment variables necessary to the run control but not available in some environments.
The keywords RUNPAR, CNFPAR, LDCPAR, GDCPAR, LDCSTATUS and
GDCSTATUS are followed by the declaration of some control parameters. The list
of the parameters is in Table 11.3, with a description of the parameters and the place
where they may be declared. The parameter names are conventional and must be
used in the declaration.
The complete list of all the parameters used in DATE can be found in the file:
/date/runControl/rcShm.h.
The parameters declared under the keywords CNFPAR, LDCPAR and GDCPAR
will appear in the run-control window labeled Configuration parameters
(Figure 11.1). These parameters are the ones that are relatively stable and do not
need to be changed by the operator in normal production runs.
The parameters declared under the keyword RUNPAR will appear in the main
run-control window. These parameters are supposed to be possibly changed from
run to run, such as maxEvents.
Table 11.3
Run control parameters
Parameter name
Description
Set by
To appear in window
maxEvents
Maximum number
of events to be collected in a run.
When a DAQ
machine hits the
limit, an end of run
request is issued.
Zero means no
limit.
The operator via the
run control.
Run control main
window - Run
parameters (under
>RUNPAR in runControl.config).
ALICE DATE V3 User’s Guide
Run control configuration
Table 11.3
133
Run control parameters
Parameter name
Description
Set by
To appear in window
maxBytes
Maximum number
of kBytes to be collected in a run.
When a DAQ
machine hits the
limit, an end of run
request is issued.
Zero means no
limit.
The operator via the
run control.
Configuration
parameters window - Common
parameters (under
>CNFPAR in runControl.config).
maxEventSize
Maximum event
size in bytes. Used
by readout to
reserve space in the
event buffer. If this
number is too large,
space is waisted at
the end of the
buffer. If it is too
small, the ReadEvent routine in
readList may
overwrite and corrupt valuable data
or code.
The operator via the
run control.
Configuration
parameters window - Common
parameters (under
>CNFPAR in runControl.config).
triggerCount
Incremented by
readout at each
physics event (not
for the other types
of events) after calling ReadEvent,
and then stored in
eventHeader.triggerNb.
Readout.
Status display window (under >LDCSTATUS in
runControl.config).
eventCount
Incremented by
readout for all types
of events before
calling ReadEvent.
It is compared to
maxEvents to stop
the run. Incremented by the
event builder as
well.
Readout and event
builder.
Status display window (under >LDCSTATUS and
>GDCSTATUS in
runControl.config).
burstCount
Set by readout at
each event, after
calling ReadEvent,
to the value found
in eventHeader.burstNb.
Readout.
Status display window (under >LDCSTATUS in
runControl.config).
ALICE DATE V3 User’s Guide
134
DATE installation guide
Table 11.3
Run control parameters
Parameter name
Description
Set by
To appear in window
eventsInBurstCount
Set by readout at
each event, after
calling ReadEvent,
to the value found
in eventHeader.nbInBurst.
Readout.
Status display window (under >LDCSTATUS in
runControl.config).
burstFlag
Not used by DATE.
It may be used to
indicate the burst
condition, to be
passed either from
the operator to
readout or the other
way round.
Either the operator
or readout (it
depends on the
purpose).
It depends on the
purpose.
eventsRecorded
Counter of events
recorded on disk,
either by the LDC
(if alone) or by the
GDC.
Either readout or
event builder.
Status display window (under either
>LDCSTATUS or
>GDCSTATUS in
runControl.config).
bytesRecorded
Counter of kBytes
recorded on disk,
either by the LDC
(if alone) or by the
GDC.
Either readout or
event builder.
Status display window (under either
>LDCSTATUS or
>GDCSTATUS in
runControl.config).
eventsTransferred
Counter of events
transferred from the
LDC to the GDC.
Readout.
Status display window (under >LDCSTATUS in
runControl.config).
bytesTransferred
Counter of kBytes
transferred from the
LDC to the GDC.
Readout.
Status display window (under >LDCSTATUS in
runControl.config).
readoutFlag
A number indicating the phase of the
start of run and end
of run procedures.
At the beginning of
the procedure it is
set to 1, then it will
run from 1000 to
6000 at start of run,
and from 11000 to
17000 at end of run.
Zero means completion.
Readout.
Status display window (under >LDCSTATUS in
runControl.config).
ALICE DATE V3 User’s Guide
Run control configuration
Table 11.3
135
Run control parameters
Parameter name
Description
Set by
To appear in window
phaseTimeoutLimit
Maximum duration (in seconds) of
any start of run and
end of run phase.
Suggested value is
30. Used by
rcServer to abort
the run if readout
does not complete
the phase in due
time.
The operator via the
run control.
Configuration
parameters window - Common
parameters (under
>CNFPAR in runControl.config).
randEventMinSize
Optional parameter used exclusively by the
example of readout
program contained
in the DATE distribution kit. Minimum event size for
the random generator.
The operator via the
run control.
Optional. Configuration parameters
window - LDC
parameters (under
>LDCPAR in runControl.config).
randEventMaxSize
Optional parameter used exclusively by the
example of readout
program contained
in the DATE distribution kit. Maximum event size for
the random generator.
The operator via the
run control.
Optional. Configuration parameters
window - LDC
parameters (under
>LDCPAR in runControl.config).
randEventInterval
Optional parameter used exclusively by the
example of readout
program contained
in the DATE distribution kit. Time
interval between
events in microseconds.
The operator via the
run control.
Optional. Configuration parameters
window - LDC
parameters (under
>LDCPAR in runControl.config).
ALICE DATE V3 User’s Guide
136
DATE installation guide
Table 11.3
Run control parameters
Parameter name
Description
Set by
To appear in window
maxFileSize
Each run may be
recorded on multiple files. This is the
maximum size of
each file in kBytes.
It is used either by
the recorder (LDC
alone) or by the
event builder
(GDC).
The operator via the
run control.
Configuration
parameters window - Common
parameters (under
>CNFPAR in runControl.config).
bytesInFile
Counter of kBytes
recorded in the current recording file.
It is set either by the
recorder (LDC
alone) or by the
event builder
(GDC).
Either readout or
event builder.
Status display window (under either
>LDCSTATUS or
>GDCSTATUS in
runControl.config).
fileCount
Counter of number
of files recorded in
the current run. It is
set either by the
recorder (LDC
alone) or by the
event builder
(GDC)
Either readout or
event builder.
Status display window (under either
>LDCSTATUS or
>GDCSTATUS in
runControl.config).
recordingDevice
A character string
indicating the
recording device of
an LDC. It may be
either a file name or
a machine name
(the latter followed
by :).
The operator via the
run control.
Configuration
parameters window - LDC parameters (under
>LDCPAR in runControl.config).
ebRecordingDevice
A character string
indicating the
recording device of
an GDC. It must be
a file name.
The operator via the
run control.
Configuration
parameters window - GDC parameters (under
>GDCPAR in runControl.config).
monitorEnableFlag
Switch to enable
and disable the possibility of monitoring from a given
machine. Zero (0)
means disabled,
one (1) enabled.
The operator via the
run control.
Configuration
parameters window - LDC and
GDC parameters
(under both >LDCPAR and >GDCPAR in
runControl.config).
ALICE DATE V3 User’s Guide
Run control configuration
Table 11.3
137
Run control parameters
Parameter name
Description
Set by
To appear in window
recorderSleepTime
The recorder goes
to sleep while
events are arriving
(if enableRecordingInBurst is disabled), to give
priority to readout.The time interval (expressed in
microsec.) is picked
up from this parameter. Default is
tuned to 10 millisec.
Optional (the
default is well
tuned). The operator via the run control.
Optional. Configuration parameters
window - LDC
parameters (under
>LDCPAR in runControl.config).
enableRecordingInBurst
Switch to enable
and disable the
recorder during a
burst of events.
Zero (0) means disabled, one (1)
enabled. Default is
disabled, which is
adapted to fixed
target experiments
(with bursts). Collider experiments
(continuous beam)
should enable it.
Optional. The
default is adapted
to fixed target
experiments (with
bursts). The operator via the run control.
Optional. Configuration parameters
window - LDC
parameters (under
>LDCPAR in runControl.config).
logLevel
It controls the generation of messages
by all the date processes running on a
DAQ machine.
The operator via the
run control.
Configuration
parameters window - LDC and
GDC parameters
(under both >LDCPAR and >GDCPAR in
runControl.config).
11.5.2 The LDC event buffer size
The event buffer size in the LDCs is given a default value of 1024000 bytes. This
value can only be changed by adding the following statements in the file
${DATE_SITE_CONFIG}runControl.config:
>TCLEVAL
set ldcEventBufferSize x
where x is the desired buffer size in bytes1.
1. The parameter recordingBufferSize defined in /date/runControl/rcShm.h cannot
be changed by the operator. It is used to save the size of the event buffer after the shared
memory segment has been created.
ALICE DATE V3 User’s Guide
138
DATE installation guide
When the value is changed, it is necessary to destroy all the shared memory
segments of the event buffers with IPCS (a simpler way is to bootstrap all the
LDCs.).
11.5.3 Run-control configuration parameters
The parameters declared under the keywords RUNPAR, CNFPAR, LDCPAR and
GDCPAR will appear in the run-control windows, either the main one or the one
labeled Configuration parameters (Figure 11.1). The operator is supposed to set the
values of these parameters in the corresponding entry fields on the windows.
•
maxEvents - See description in Table 11.3.
•
maxBytes - Maximum number of kBytes to be collected in a run. It is used to
limit the amount of data to be handled by the offline analysis for a single run.
The data may be saved on several files. according to the maxFileSize
parameter. See also the description in Table 11.3.
•
maxEventSize - It should indicate the maximum size in bytes of the sub-event
in the LDCs. It is not used in the GDCs. The ReadEvent routine must make sure
not to read more bytes than maxEventSize, otherwise memory corruption
may happen. On the other hand, maxEventSize cannot be indefinitely large,
since the same amount of bytes will be wasted at the top of the event buffer (in
any case it should be one order of magnitude smaller than the event buffer).
•
phaseTimeoutLimit - See description in Table 11.3.
•
randEventMinSize - Optional parameter. See description in Table 11.3.
•
randEventMaxSize - Optional parameter. See description in Table 11.3.
•
randEventInterval Optional parameter. See description in Table 11.3.
•
maxFileSize - See description in Table 11.3.
•
recordingDevice - To be set for all the LDCs. If not set, the LDC works in
isolation and discards the events. It may indicate either a disk file, for local
recording, or the name of the event builder GDC. In the latter case, it must
terminate with “:”.
•
ebRecordingDevice - Event builder recording device.This indicates the
directory and the name of the disk file where the full events data should be
written.
There is a special naming convention concerning the recording devices (both
recordingDevice and ebRecordingDevice) when they indicate a file
name. At start of run, these names are communicated to the respective
machines; before that, they are parsed and the following substitutions are
applied:
1. The first occurrence of the character “@” is replaced by the machine name.
2. The first occurrence of the character “#” is replaced by the run number.
This feature allows us to generate data files with different names for each
machine and each run. For example, if ebRecordingDevice is declared to be
Data.#.raw, the data of the run 321 will be stored on the file Data.321.raw;
the next run will be on Data.322.raw, and so on.
The actual communicated file name may be forced to be /dev/null, if the
recording is disabled on the main run-control window.
ALICE DATE V3 User’s Guide
Run control configuration
139
If the name of the recording device ends by “:” it is supposed to indicate a
remote machine instead of a file, therefore the substitutions do not occur.
•
monitorEnableFlag - See description in Table 11.3.
•
logLevel - It controls the generation of messages by all the date processes
running on a DAQ machine. Standard value is 10. All the possible values are
the following:
0 - No message is generated.
10 - Normal error and information messages. No impact on the
performance.
20 - Detailed information messages. Small performance degradation.
30 - Debugging information messages. Big performance degradation.
Figure 11.1
Run control configuration window
11.5.4 Run number
The run number is automatically incremented at each start of run. It cannot be
easily changed by the operator.
The run control creates a file ${DATE_SITE_CONFIG}/runNumber.config and
stores there the last run number used by DATE. If you want to modify the current
run number (in order to re-start the series) you may edit the file and replace the run
number with the new number minus one.
An example of the file exists in the distribution:
/date/runControl/runNumber.config, which may be copied in the right
place and edited there. The file contains the line shown in listing Listing 11.4.
Listing 11.4
Repository of the run number
1: set runNumber 0
ALICE DATE V3 User’s Guide
140
DATE installation guide
Make sure that the file has got write access for everybody:
chmod a+w ${DATE_SITE_CONFIG}/runNumber.config
11.5.5 Multiple run controls
It is not allowed to have several run controls active at the same time. If more than
one run control try to connect to the same machines, an alert window is opened,
offering as only option "give up".
In the case of a crash of the run control while connected to the DAQ machines, it
would be impossible to have a new run control connected to previously connected
machines. This limitation can be overcome by doing the following operations:
1. Select in the main run control window the option View-Tcl eval.
2. In the Tcl command entry area, type the following command:
set bypassMastership 1
3. Click on the Eval button. It is then possible to connect to the machines since the
"take over" option is proposed as well.
This statement can also be permanently set in the file
${DATE_SITE_CONFIG}/runControl.config, under the >TCLEVAL keyword.
Then it would be possible to have several run controls active at the same time. This
practice is strongly discouraged.
11.6 Information logger configuration
The information logger makes use of a dæmon running on a host machine. The
name of the machine must be indicated in the file
${DATE_SITE_CONFIG}/infoLogger.config.
This configuration file should contain one line as:
Listing 11.5
Repository of the host of the information logger dæmon
1: DATE_INFOLOGGER_LOGHOST infologger_host
where infologger_host is the name of the machine where you want to run the
infoLogger daemon.
11.7 Monitoring configuration
Functionally, hosts participating to a DATE monitoring scheme can be defined as:
ALICE DATE V3 User’s Guide
Monitoring configuration
141
1. monitoring hosts running specific monitoring programs, either written
by a specific experience or part of the standard monitoring package (e.g., the
utility eventDump);
2. monitored hosts offering monitoring streams to monitoring programs:
these streams can be online streams (from a live DAQ system) or offline
streams (typically files available from permanent data storage);
3. relaying hosts offering a liaison between monitored and monitoring
hosts that cannot establish a direct link due to the presence of network firewalls
or gateways.
It is possible to have any combination of those three functions, e.g. hosts who are
monitoring, are monitored and offer relayed monitoring to other hosts.
The DATE monitoring scheme needs configuration only for monitored and
relaying hosts in the following situations:
1. online monitored hosts (LDCs or GDCs) who wish to offer online, offline
or relayed monitoring to itself and/or to other hosts;
2. hosts part of a DATE system who wish to offer offline or relayed
monitoring to other hosts.
No setup is required for hosts only wishing to perform monitoring, either on the
same or on remote hosts and a complete DATE installation is not required. For the
developer of the monitoring program itself, a library is available and can be used in
stand-alone mode. Otherwise, monitoring programs can be exported to any type of
hosts (within the set of supported architectures) with no need for extra files or
special setups. No daemons are necessary and no configuration is required on the
monitoring hosts. If an upgrade from DATE V2 or earlier is performed, it is
recommended (although not necessary) to remove all existing setups eventually
present in the monitoring host.
We will now review the configuration needed on monitored and relayed hosts
to let them perform their function.
11.7.1 Creation of configuration files
The monitoring scheme can be configured using three separate files:
•
${DATE_SITE_CONFIG}/monitoring.config: this file is optional and can
be used to control a complete DATE site, all types of hosts;
•
${DATE_SITE}/${DATE_HOSTNAME}/monitoring.config: this file is
mandatory for online hosts and must be created by the DATE system
administrator. It is not required for offline, relayed or monitoring hosts;
•
/etc/monitoring.config: this file is optional and can be used to control the
behaviour of relaying hosts; it is useless for online or offline monitored
hosts.
The above files should be created using the following commands:
ALICE DATE V3 User’s Guide
142
DATE installation guide
Listing 11.6
Creation of configuration files
1: > touch file
2: > chmod u=rw,g=rw,o=r file
where file is the full path of the file to be created. Once created, the configuration
files can be edited and parameters can be specified as a list of names followed by
their associated values. Comments can be inserted via the “#” sign, e.g.:
# This is a comment
PARAMETER
VALUE
# comment
These files can be changed at any time. Some of the parameters (those labelled in
Table 11.4 as “Online monitoring only”) require the acquisition to be stopped and
no active clients (the command monitorClients - see 11.7.3 - can be used to
check for registered clients). All the other parameters can be changed at any time
and will become active for all new clients (producers and consumers) started after
the modification(s).
When the same parameter is defined in multiple files, a “last given” policy is
followed, that is:
•
parameters defined in ${DATE_SITE_CONFIG}/monitoring.config can
be overridden by equivalent definitions from any of the other files;
•
parameters defined in
${DATE_SITE}/${DATE_HOSTNAME}/monitoring.config are final for
local monitoring and can be overridden by equivalent definitions from
/etc/monitoring.config for relayed monitoring;
•
parameters defined in /etc/monitoring.config are final and cannot be
overridden.
Only exception to this scheme is the parameter LOGLEVEL, where the highest given
level is used (e.g. if the values 0, 10 and 20 are specified, the used value will be 20).
The parameters that can be specified in the configuration files are:
Table 11.4
Monitoring configuration parameters
Parameter name
Used for
Description
LOGLEVEL
All types of monitoring
Level for error, information
and debug statements generated by the monitoring
scheme
MAX_CLIENTS
Online monitoring only
Maximum number of clients allowed to be registered simultaneously
MAX_EVENTS
Online monitoring only
Maximum number of
events available for monitoring
EVENT_SIZE
Online monitoring only
Average event size
ALICE DATE V3 User’s Guide
Monitoring configuration
Table 11.4
143
Monitoring configuration parameters
Parameter name
Used for
Description
EVENT_BUFFER_SIZE
Online monitoring only
Size of buffer used to store
events data
EVENTS_MAX_AGE
Online monitoring only
Maximum age (in seconds) of the events available for monitoring
MONITORING_HOSTS
Online monitoring
Networked monitoring
Comma-separated list of
hosts allowed to perform
monitor-when-available
from this host
MUST_MONITORING_HOSTS
Online monitoring
Networked monitoring
Comma-separated list of
hosts allowed to perform
all types of monitoring
from this host
For the MONITORING_HOSTS and MUST_MONITORING_HOSTS parameters, a
comma-separated list of hosts should be given, e.g.
MONITORING_HOSTS
localhost, suxy, mppcxy05
In the above example, the hosts allowed to perform “normal” monitoring are the
local host, all hosts whose name begins with suxy (suxy01, suxy02 and so on)
plus the host mppcxy05.
A host who is defined within the MONITORING_HOSTS list can only perform
monitoring-when-available. To be able to perform 100% monitoring, a host must be
in the MUST_MONITORING_HOST list.
If the parameter MUST_MONITORING_HOSTS is not specified, all hosts can perform
100% monitoring on the monitored machine. Conversely, if the parameter
MONITORING_HOSTS is not specified, all hosts can perform monitoring functions
on the given machine.
11.7.2 Installation of the monitoring daemon
All machines wishing to offer monitoring (online, offline or relayed) to other hosts
should install the monitoring daemon mpDaemon. This can be done either via the
dateNetwork command or manually (see 11.3.2 for more details concerning the
installation of the daemon).
The proper setup of the daemon can be verified as follows. From any host wishing
to perform monitoring, run the command
ALICE DATE V3 User’s Guide
144
DATE installation guide
Listing 11.7
Remote monitoring test procedure
1:
2:
3:
4:
5:
6:
7:
> telnet host ${DATE_SOCKET_MON}
Trying...
Connected to host
Escape character is ’^]’.
Connection closed.
Substitute “host” with the name of the machine offering monitoring functions.
What reported above is a “good” example. When things go wrong, one should
expect some error messages that should lead to the culprit of the problem, e.g.:
Listing 11.8
Example of failed remote monitoring installation
1:
2:
3:
4:
> telnet host ${DATE_SOCKET_MON}
Trying host...
telnet: connect to address xxx.xxx.xxx.xxx: Connection refused
telnet: Unable to connect to remote host: Connection refused
In the above example, the mpDaemon service has not been properly installed.
Other useful debugging information may be available within the system console of
the machine target (the “host” mentioned above). In our previous example, we can
see the message:
host inetd[4692]: execv /date/monitoring/SunOS/monServer.sh:
No such file or directory
A more complete validation of the remote monitoring scheme can be done using
the eventDump facility part of the standard DATE monitoring scheme.
Hosts who wish only to perform monitoring functions do not need to install the
monitoring daemon.
11.7.3 Monitoring of the online monitoring scheme
The online monitoring scheme can be monitored using the following commands:
•
monitorClients displays a list of all registered clients, eventually with the
name of the host they are running on;
•
monitorSpy displays a more detailed snapshot of the monitor scheme.
A graphical monitoring tool is currently under development.
It is not possible to monitor the status of an offline or relayed monitoring host.
ALICE DATE V3 User’s Guide
Index
A
application, monServer 28
ArmHw routine 44, 47
B
Bookkeeping
callable interface 107
Guide to use 102
host 104
interactive addition of messages
108
package 102, 107
records 107, 109, 110
repository 102
C
Configuration
Detectors configuration file 68
End of Run file 53
End of Run script 52
Information logger 140
parameters 132
readout 54
Run-control 129
Start of Run file 53
Start of Run script 52
D
daemon, infoLogger 87
Data format
definition 21
in C/Fortran monitoring program
31
used in the readout program 49
DATE_HOST symbol
definition 116
DATE_HOSTNAME symbol
ALICE DATE V3 User’s Guide
use of 52, 53, 55, 70
DATE_INFOLOGGER_LOGHOST
symbol
use of 127
DATE_ROOT symbol
definition 116
use of 8, 66, 114, 115, 116, 125,
129
DATE_SITE symbol
definition 116
use of 8, 52, 53, 54, 55, 60, 87, 114,
116, 118, 125, 126, 128
DATE_SITE_CONFIG symbol
definition 116
use of 8, 52, 53, 60, 62, 68, 108,
127, 129, 139
DATE_SITE_LOGS symbol
definition 116
use of 15, 87, 88, 89, 91, 98, 99,
102, 103, 104, 106, 107
DATE_SITE_STATS symbol
use of 103, 104, 106, 107
DATE_SYS symbol
definition 117
use of 93, 118, 128
dateControl symbol
definition 117
dateSetup symbol
definition 117
dateSymbols symbol
definition 117
DisArmHw routine 44
DisarmHw routine 51
Distribution kits 124
E
ebDaemon program 5
End of run 11, 20, 21, 46
command 11
DisarmHw 64
DisarmHw routine 51
146
Index
files 24, 53
in readout 44, 45
maximum file size 21
operations performed at 45
records 24
script 52, 53
Error messages
browsing 15, 86, 102, 110
from the readout 51
error routine 94
errorAll routine 96
errorTo routine 95
Event type
CALIBRATION_EVENT 24, 35
END_OF_BURST 24, 35
END_OF_RUN 24, 35
END_OF_RUN_FILES 24, 35
PHYSICS_EVENT 23, 24, 35
START_OF_BURST 24, 35
START_OF_RUN 24, 35
START_OF_RUN_FILES 24, 35
EventArrived routine 48
eventBuilder program 3, 5
eventDump symbol
definition 117
F
fatal routine 95
fatalAll routine 96
fatalTo routine 95
G
GDC iii, 2, 3, 4, 10, 19, 20, 21, 25, 110,
124, 127
list of 131
parameters 131, 132
gdcServer program 3
I
info routine 94
infoAll routine 96
infoBrowser program 6, 86
infoBrowser symbol
definition 117
infoDaemon program 6
infoLogger daemon 87
infoTo routine 95
Installation
First time 125
of new release 129
K
kits, Distribution 124
L
LDC iii, 2, 3, 4, 10, 20, 21, 23, 25, 58,
60, 70, 74, 76, 78, 81, 110, 124,
127, 130, 131, 134, 135, 136,
137, 138
list of 131
parameters 131, 132
Log files
extracting portions of 89
repository 87
log routine 93
logAll routine 94
logBook routine 108
logBookMarker routine 108
logTo routine 93
M
MONITOR_FREE_EVENT routine 37
monitorControlWait routine 38
monitorDeclareMp routine 34
monitorDeclareTable routine 34
monitorDecodeError routine 39
monitorFlushEvents routine 37
monitorGetEvent routine 36
monitorGetEventDynamic routine 36
monitorLogout routine 40
monitorSetNowait routine 38
monitorSetSwap routine 38
monitorSetWait routine 37
monServer application 28
mpDaemon program 4
P
program, ebDaemon 5
program, eventBuilder 3, 5
program, gdcServer 3
program, infoBrowser 6, 86
program, infoDaemon 6
program, monServer 28
program, mpDaemon 4
program, rcServer 5
program, readout 4, 5, 45
program, recorder 3, 5, 20
program, statsBrowser 6, 105
program, statsCollector 6, 103
R
rcServer program 5
ReadEvent routine 48
readlist routines 47
readout program 4, 5, 45
Readout routine
ArmHw 47
ALICE DATE V3 User’s Guide
Index
147
DisarmHw 51
EventArrived 48
ReadEvent 48
recorder program 3, 5, 20
routine, ArmHw 44, 47
routine, DisArmHw 44
routine, DisarmHw 51
routine, error 94
routine, errorAll 96
routine, errorTo 95
routine, EventArrived 48
routine, fatal 95
routine, fatalAll 96
routine, fatalTo 95
routine, info 94
routine, infoAll 96
routine, infoTo 95
routine, log 93
routine, logAll 94
routine, logBook 108
routine, logBookMarker 108
routine, logTo 93
routine, MONITOR_FREE_EVENT 37
routine, monitorControlWait 38
routine, monitorDeclareMp 34
routine, monitorDeclareTable 34
routine, monitorDecodeError 39
routine, monitorFlushEvents 37
routine, monitorGetEvent 36
routine, monitorGetEventDynamic 36
routine, monitorLogout 40
routine, monitorSetNowait 38
routine, monitorSetSwap 38
routine, monitorSetWait 37
routine, ReadEvent 48
routines, readlist 47
RUN
parameters 132
run, End of 11, 20, 21, 46
run, Start of 8, 9, 10, 11, 46, 60
S
Start of run 8, 9, 10, 11, 46, 60
ArmHw 63, 64
ArmHw routine 48
command 11
conditions 9
files 24, 53
in readout 44, 45
operations performed at 45
parameters at 8
record 45
records 21, 24
ALICE DATE V3 User’s Guide
script 45, 52, 53
statsBrowser program 6, 105
statsCollector program 6, 103
T
Template
readlist 47
U
User
nobody 20, 90, 128
root 125, 127
V
VME
Access to the VME bus 72
CORBO module 75
148
Index
ALICE DATE V3 User’s Guide
List of Figures
Figure
Figure
Figure
Figure
Figure
Figure
Figure
Figure
Figure
Figure
Figure
Figure
Figure
Figure
Figure
Figure
Figure
Figure
Figure
Figure
Figure
Figure
Figure
Figure
Figure
Figure
Figure
Figure
Figure
Figure
Figure
Figure
Figure
Figure
Figure
Figure
Figure
Figure
Figure
Figure
ALICE DATE V3 User’s Guide
1.1
1.2
1.3
1.4
1.5
1.6
1.7
2.1
2.2
2.3
2.4
2.5
2.6
2.7
2.8
2.9
2.10
2.11
2.12
2.13
2.14
3.1
4.1
4.2
4.3
5.1
6.1
6.2
6.3
6.4
6.5
7.1
7.2
8.1
9.1
9.2
9.3
9.4
10.1
11.1
DATE features . . . . . . . . . . . . . . . . . . . 2
Dataflow architecture . . . . . . . . . . . . . . . . 3
Event builder architecture . . . . . . . . . . . . . . 4
Monitoring architecture . . . . . . . . . . . . . . . 4
Run control architecture . . . . . . . . . . . . . . . 5
Information logger architecture . . . . . . . . . . . . 6
Run bookkeeping . . . . . . . . . . . . . . . . . . 6
The main run-control window . . . . . . . . . . . . . 9
The main run-control window, after connection . . . . . . 9
The status display . . . . . . . . . . . . . . . . . 10
The file menu . . . . . . . . . . . . . . . . . . . 11
The view menu . . . . . . . . . . . . . . . . . . 12
The extended main run-control window . . . . . . . . . 12
The option menu . . . . . . . . . . . . . . . . . . 13
No-update indicator . . . . . . . . . . . . . . . . 13
The windows menu . . . . . . . . . . . . . . . . . 14
The configuration-parameters window . . . . . . . . . . 14
The buffer status window . . . . . . . . . . . . . . 15
Example of infoBrowser window . . . . . . . . . . . . 16
The infoBrowser operator window . . . . . . . . . . . 17
Example of statsBrowser window . . . . . . . . . . . 18
The full event format . . . . . . . . . . . . . . . . 26
The DATE online monitoring, local and remote configurations . 28
The DATE offline monitoring . . . . . . . . . . . . . 29
The DATE relayed monitoring . . . . . . . . . . . . . 30
Main event loop . . . . . . . . . . . . . . . . . . 44
Readout and the standard readList . . . . . . . . . . . 58
Readout and the generic readList. . . . . . . . . . . . 59
The readoutControl window. . . . . . . . . . . . . . 61
Sub-event structure . . . . . . . . . . . . . . . . . 62
The equipment header. . . . . . . . . . . . . . . . 62
VME to memory mapping . . . . . . . . . . . . . . 72
Trigger electronics . . . . . . . . . . . . . . . . . 74
The DATE infoLogger architecture . . . . . . . . . . . 85
DATE bookkeeping schematic view . . . . . . . . . . 102
Detailed view of the bookkeeping system . . . . . . . . 103
The source run record . . . . . . . . . . . . . . . 107
Example of standard DATE bookkeeping record . . . . . 111
A view of the file organization in DATE . . . . . . . . 115
Run control configuration window . . . . . . . . . . 139
150
List of Figures
ALICE DATE V3 User’s Guide
List of Listings
Listing
Listing
Listing
Listing
Listing
Listing
Listing
Listing
Listing
Listing
Listing
Listing
Listing
Listing
Listing
Listing
Listing
Listing
Listing
Listing
Listing
Listing
Listing
Listing
Listing
Listing
Listing
Listing
Listing
Listing
Listing
Listing
Listing
Listing
Listing
Listing
Listing
Listing
Listing
Listing
Listing
2.1
3.1
3.2
4.1
4.2
5.1
5.2
5.3
5.4
5.5
5.6
5.7
6.1
6.2
6.3
7.1
7.2
7.3
7.4
7.5
7.6
7.7
7.8
7.9
7.10
7.11
7.12
7.13
7.14
8.1
9.1
9.2
9.3
9.4
9.5
9.6
11.1
11.2
11.3
11.4
11.5
Installation of the buffer-status plug-in. . . . . . . . . . . . . . . 15
Event header structure . . . . . . . . . . . . . . . . . . . . . 22
Event types . . . . . . . . . . . . . . . . . . . . . . . . . 24
Example of event dump in C: . . . . . . . . . . . . . . . . . . 31
Example of analysis in FORTRAN . . . . . . . . . . . . . . . . 32
Calling EventArrived . . . . . . . . . . . . . . . . . . . . . 48
Calling ReadEvent . . . . . . . . . . . . . . . . . . . . . . 50
Example of ReadEvent routine . . . . . . . . . . . . . . . . . . 51
Bookkeeping information reported by the readout package . . . . . . 52
SOR.commands script . . . . . . . . . . . . . . . . . . . . . 53
SOR.commands . . . . . . . . . . . . . . . . . . . . . . . 53
SOR.files . . . . . . . . . . . . . . . . . . . . . . . . . . 54
The equipment.h file. . . . . . . . . . . . . . . . . . . . . . 63
Example of equipmentList.c library for the configuration file in Listing 6.3 67
Example of detector.config configuration file . . . . . . . . . . 69
Definition of the offset addresses of a device . . . . . . . . . . . . . 72
Example of an application accessing a VME device . . . . . . . . . . 73
CORBO registers . . . . . . . . . . . . . . . . . . . . . . . 75
Bits and masks for the CORBO registers . . . . . . . . . . . . . . 76
Mapping the virtual-memory window to the CORBO VME address space . . 77
CORBO channel 1 initialization . . . . . . . . . . . . . . . . . 78
CORBO channel 2 initialization . . . . . . . . . . . . . . . . . 79
Set flag for EventArrivedCorbo . . . . . . . . . . . . . . . . 79
Releasing the virtual-memory space . . . . . . . . . . . . . . . . 79
The routine EventArrivedCorbo . . . . . . . . . . . . . . . . 80
Reading the CORBO counters . . . . . . . . . . . . . . . . . . 81
CORBO channel 4 initialization . . . . . . . . . . . . . . . . . 82
Clear CORBO busy . . . . . . . . . . . . . . . . . . . . . . 82
Set CORBO busy . . . . . . . . . . . . . . . . . . . . . . . 82
Setting the Facility name in C programs . . . . . . . . . . . . . . 92
Example of single-line C bookkeeping record . . . . . . . . . . . 109
Example of single-line Java bookkeeping record . . . . . . . . . . 109
Example of single-line shell bookkeeping record . . . . . . . . . . 109
Example of multi-line C bookkeeping record . . . . . . . . . . . 110
Example of multi-line Java bookkeeping record . . . . . . . . . . 110
Example of multi-line Bourne-shell bookkeeping record . . . . . . . 110
INETD service configuration . . . . . . . . . . . . . . . . . 128
INETD services . . . . . . . . . . . . . . . . . . . . . . 128
Example of the file runControl.config . . . . . . . . . . . . 130
Repository of the run number . . . . . . . . . . . . . . . . . 139
Repository of the host of the information logger dæmon . . . . . . . 140
ALICE DATE V3 User’s Guide
152
List of Listings
Listing 11.6
Listing 11.7
Listing 11.8
Creation of configuration files . . . . . . .
Remote monitoring test procedure . . . . . .
Example of failed remote monitoring installation
.
.
.
.
.
.
.
.
.
.
.
.
.
.
.
.
.
.
.
.
.
.
.
.
.
.
.
.
.
.
142
144
144
ALICE DATE V3 User’s Guide
List of Tables
Table
Table
Table
Table
Table
Table
Table
Table
Table
Table
Table
Table
Table
Table
Table
3.1
3.2
3.3
3.4
4.1
4.2
4.3
4.4
5.1
8.1
8.2
11.1
11.2
11.3
11.4
Event header fields . . . . . . . . . . . . . . . . . . . .
List of record types . . . . . . . . . . . . . . . . . . . .
Usage of the detector identification mask header field . . . . . . .
Usage of the header len and of the size . . . . . . . . . . . . .
Monitor source parameter syntax . . . . . . . . . . . . . . .
Event types . . . . . . . . . . . . . . . . . . . . . . .
Monitoring types . . . . . . . . . . . . . . . . . . . . .
Bytes swapping control . . . . . . . . . . . . . . . . . .
LOGLEVEL definitions for the readout and the recorder processes
Selection fields . . . . . . . . . . . . . . . . . . . . . .
Some examples of regular expressions . . . . . . . . . . . . .
Hardware and software platforms . . . . . . . . . . . . . .
Keywords of the configuration file . . . . . . . . . . . . . .
Run control parameters . . . . . . . . . . . . . . . . . .
Monitoring configuration parameters . . . . . . . . . . . . .
ALICE DATE V3 User’s Guide
.
.
.
.
.
.
.
.
.
.
.
.
.
.
.
22
24
. 25
. 25
. 34
. 35
. 35
. 39
. 52
. 89
. 90
124
131
132
142
.
.