1
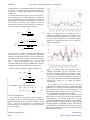
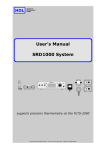
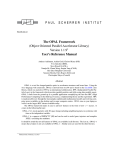
Proceedings of LINAC2014, Geneva, Switzerland THPP078 TROUBLESHOOTING AND PERFORMANCES OF TYPE-B SPIRAL2 SERIES CRYOMODULE D. Longuevergne, F. Chatelet, C. Commeaux, N. Gandolfo, D. Grolet, C. Joly, J. Lesrel, R. Martret, G. Michel, G. Olry, L. Renard, A. Stephen, P. Szott IPNO, UMR 8608 CNRS/IN2P3 - Université Paris Sud, France. SPIRAL2 aims at building a multi-purpose facility at GANIL in Caen, France [1]. It will be dedicated to nuclear physics studies, including the production of rich-neutrons isotopes. The multi-beam linear accelerator is composed of superconducting accelerating modules operating at 4.5K and warm focusing magnets. IPN Orsay is in charge of the seven high energy (Type-B) accelerating modules, each hosting two superconducting 88 MHz quarter-wave resonators made of bulk Niobium operating at an accelerating gradient of 6.5 MV/m (β=0.12). The first Type-B series cryomodule has been validated in April 2013. Since then, four additional cryomodules have been validated in a row showing a very high-quality and reliable assembly procedure. Some of encountered problems (tuner hysteresis, magnetic shielding,…) and associated solutions will be presented. Moreover, a comparison of cavity performances between vertical cryostat and cryomodule tests will be done. INTRODUCTION The superconducting linac is now in its installation phase [2]. Five cryomodules out of seven of the high beta section have been validated in a row in terms of cryogenic and RF performances since April 2013. This systematic validation, proof of the high quality of cavity preparation and assembly procedure, is following a very long and intense period of troubleshooting (first series cryomodule tested in October 2010). First, several issues caused a significant degradation of the cavity performances compared to these obtained in vertical cryostat. Magnetic shielding, cavity and power coupler preparations had to be enhanced in order to meet the requirements meaning less than 10W (Qo > 1.37 E+09 at 4.2K) of RF dissipations at the operating gradient of 6.5 MV/m and a maximum gradient of at least 8 MV/m. Secondly, the innovative tuning system by movable superconducting plunger had to be improved mechanically. Indeed, while tested at cryogenic temperature, a significant hysteresis was measured on the cavity frequency when the plunger was moved by the stepper motor. After a summary of the performances of the five validated cryomodule, all issues encountered as mentioned previously will be explained as well as the technical solution applied. CRYOMODULE TESTING This section will describe most of RF tests done to perform the cryomodules validation. 03 Technology 3E Cryomodules and Cryogenics Power Coupler Conditioning The Spiral2 power couplers have been designed at LPSC in Grenoble, France. These are cleaned and assembled at LPSC and RF conditioned in standing wave at room temperature up to 20 kW in CW [3] before shipping to IPN Orsay for cryomodule assembly. Once the cryomodule fully assembled and ready for cool down, RF tests begin with two RF conditioning of the power couplers in open loop, first at room temperature and then at 4.2 K, out of cavity resonance (usually 88.0 MHz) and at a power up to 6 kW in CW. All couplers show in a very reproducible way multipacting events (vacuum deterioration and current measured on a polarized pick-up antenna installed close to the ceramic windows) for low forward power between 80 and 150 W. This behaviour is very similar to what is observed at LPSC. Once conditioned with increasing duty cycle (1, 5, 10, 25, 50% and CW), nothing else has to be reported. Cavity RF Conditioning The cavity RF conditioning starts first with the processing in closed loop (self-oscillating loop) of lowlevel multipacting barriers between 10 and 30 kV/m and another between 1 and 1.3 MV/m. These are usually processed within an hour by RF pulses of 1 kW at around 5 Hz at a duty cycle below 5 %. Some X-rays events of tens of μSv/h and helium flow bursts are measured while processing the 1 MV/m barrier. For all cavities tested in cryomodules, the accelerating gradient has been ramped up in CW up to 6.5 MV/m with no difficulties. Cavity Calibration Cavity calibration consists in evaluating coupling factor of the power coupler (Qext) and the pick-up antenna (Qt) in the cavity thanks to equations (1) and (2). This is done in three different ways (See figure 1 and 2) in order to crosscheck the value of the pick-up coupling factor already evaluated during the previous vertical test: (1) Measurement of S11 and S21 parameters with a network analyser at room temperature (cavity is undercoupled). Because of the difference between the Qo of the warm cavity (~ 4500) and the external coupling Q ext, S11 and S21 are very small (respectively of the order of - 0.1 dB and - 90 dB). Even-though the error bars are quite significant, this measurement is a good way to check RF connections before cooling down. (2) Measurement of S11 and S21 parameters with a network analyser at 4.2 K (cavity is over-coupled). This second way is the most precise way to evaluate the ISBN 978-3-95450-142-7 1037 Copyright © 2014 CC-BY-3.0 and by the respective authors Abstract THPP078 Proceedings of LINAC2014, Geneva, Switzerland coupling factors. As the loaded Q (noted QL) is dominated by Qext, the S11 measurement is not required and S21 is way bigger (~ - 45 dB). Qt measured here is usually taken as reference. (3) Measurement of decay time (τ0) at about 6.5 MV/m. This measurement is not really interesting to evaluate the pick-up coupling factor as the uncertainties are relatively big (attenuations of the RF loop are difficult to estimate due to the limited accessibility). This technique is however interesting to evaluate Qext as it equals QL (see equation 5). Qext measured here is usually taken as reference. 2 Qext 1 r 10 2 Qt F0 'F F0 'F § S 11R S 11FFR · ¨ ¸ 20 © ¹ . (1) § S 11R S 11FFR · § ¸· ¨ 20 ¹¸ ¨1 r 10© ¨ ¸ © ¹. 10 S 11FFR S 11T § ¨ S 21 2 2 ¨ 10 ¨ ¨ © Figure 1: Coupling factor Qext measured on the 5 validated cryomodules. Qext_RT corresponds to the room temperature measurement (case 1), Qext_4.2K to the second case and Qext_tau to the third one. Black dashed lines represent the interval to be within the Spiral2 specifications. (2) · ¸ ¸ ¸ ¸ ¹ F0 and 'F are the resonance frequency and the bandwidth of the cavity, S11R and S11FFR the reflection coefficient at resonance and far from resonance, S21 the transmission coefficient and S11T the reflection coefficient on pick-up side. “+” has to be used when the cavity is over-coupled and “-” when under-coupled. S11FFR and S11T are measured to take into account the attenuations between the calibration plan of the network analyser and the cavity. In the second case, equations (1) and (2) simplify as: F0 . QL 'F F 4 0 'F Copyright © 2014 CC-BY-3.0 and by the respective authors Qext Qt 10 S 11FFR S 11T § ¨ S 21 2 2 ¨ 10 ¨ ¨ © (3) · ¸ ¸ ¸ ¸ ¹ . (4) In the third case, Qext and Qt are given by: Qext Qt 2 S F0 W 0 . P 8 S F0 W 0 ext Pt QL (5) (6) Cavity Performances The evaluation of cavity quality factor installed in a cryomodule is done by measuring the power dissipations through the helium gas flow as the RF coupling is strong (Qext = 1.0E+06). As uncertainties are significant and measurement time consuming, the Qo is only evaluated at 4, 6.5 and 8 MV/m. ISBN 978-3-95450-142-7 1038 Figure 2: Coupling factor Qt measured on the 5 validated cryomodules. Qt_theo corresponds to the theoretical coupling deduced from antenna length, Qt_VT to the coupling measured during test in vertical cryostat, Qt_RT to the room temperature measurement (case 1), Qt_4.2K to the second case. Black dashed lines represent the interval to be within the Spiral2 specifications. As a result, all ten cavities tested in the five cryomodules showed RF losses below 7 W at the operating gradient (Qo > 2.0 E+09 @ 6.5 MV/m) and do not quench below 8 MV/m (See figure 3). The quench limit is not reached during the cryomodule tests so as not to take any risks of performance degradation after a quench. An interesting fact to point out is that cavities showing field emission are always on the same side (upstream), corresponding to the vacuum pump side. The first cryomodule validated had the upstream cavity (MB10) showing significant field emission (about 20 mSv/h at the operating gradient at cryomodule contact). The following cryomodules had an upstream cavity showing less and less field emission. None cavities of the two last cryomodules showed any field emission. 03 Technology 3E Cryomodules and Cryogenics Proceedings of LINAC2014, Geneva, Switzerland THPP078 cooling pipe, instead of a single 1.5-mm-thick layer. Only one 1-mm-thick layer (made of A4K material) shields the top of the cavity, and none on the bottom (See figure 4). CRYOMODULE TROUBLESHOOTING Accelerating Gradient Limitation and Strong Field Emission During the very first series of cryomodule tests in 20102011, none of cavities achieved the 6.5 MV/m operating gradient and showed very strong field emission, whereas previous vertical tests were satisfactory. A cavity has been re-tested in vertical cryostat just after a cryomodule test with a light additional HPR. The cavity recovered good performances showing that the limitation was not only coming from cleaning procedures or the tuning system but also from the power coupler antenna (only part removed for the test in vertical cryostat). Because of strong coupling, the antenna tip is subject to very high electric fields (> 10 MV/m) triggering presumably discharges as the surface roughness is not perfect. Power coupler antennas are now electro-polished and all parts in cavity vacuum space are carefully cleaned and checked with particle counting [3]. Indeed some rust particles were observed in some stainless steel vacuum pipes [4]. Since then, no field limitation or strong field emission has been reported. Quality Factor Limitation During prototyping phase, the quality factor of cavities was not as good as in vertical cryostat. Warming up the cavity above transition appears to help recovering the Qo. This limitation was coming from the cold magnetic shield made of Cryoperm® which has not shielded correctly the cavity during the first cool down. Because of bad thermal contact, the magnetic shield was still warm while the cavity was going through transition and thus Cryoperm® material was not in the temperature region (<50K) were its permeability is maximal. The solution adopted to optimize the shielding was to first actively pre-cool the shield. Liquid helium is flowing in a pipe running along the shield before entering the helium tank. Secondly, in order to enhance the magnetic field attenuation, the shield around the helium tank is composed of two 1-mm- thick layers sandwiching the 03 Technology 3E Cryomodules and Cryogenics Since then, the Qo factor is very close to the one measured in vertical cryostat as plotted on figure 3. Frequency Tuning System The frequency tuning system of the high beta cryomodules is very innovative. The frequency is not tuned by deforming the cavity volume but by inserting a movable superconducting plunger in the magnetic region of the QWR [5]. During prototyping phase many RF simulations and tests have been carried out to ensure that this actively cooled niobium plunger was not degrading significantly the cavity performances [5]. Problems of premature quench have been observed at the beginning as plungers were not prepared with the same recipe as the one used for the cavities (BCP of >100 μm + HPR). Before being integrated in cryomodules, all cavities have been validated in vertical cryostat with their plunger fully inserted. However serious mechanical problems have been encountered. A significant hysteresis and frequency overshoot were noticeable when the plunger direction was changed. This was due to a swing motion of the plunger because of mechanical backlash. The solution found to cancel the frequency overshoot was to change the position of plunger guiding rods so that the swinging motion is parallel to magnetic field direction [6]. CONCLUSION Following a long period of troubleshooting because of problems with preparation procedures, magnetic shield and tuning system, five cryomodules have been fully validated in a row. This proves the high quality of cleaning procedure and experience acquired by the technical staff. REFERENCES [1] http://www.ganil-spiral2.eu/?set_language=en [2] P.-E. Bernaudin & al., “SPIRAL2 Cryomodule Production Result and Analysis”, THIOB02, LINAC’14, Geneva, September 2014. [3] Y. Gómez Martínez & al., “Last Spiral 2 Couplers Preparation and RF Conditioning”, SRF’13, Paris, September 2013. ISBN 978-3-95450-142-7 1039 Copyright © 2014 CC-BY-3.0 and by the respective authors Figure 3: Comparison of Q-curves measured in vertical cryostat and in cryomodules (large dots). Figure 4: (left): magnetic shield fully assembled (left cavity) and with only one layer and cooling pipe. (right): magnetic shield installed on cavity without the top cover. THPP078 Proceedings of LINAC2014, Geneva, Switzerland Copyright © 2014 CC-BY-3.0 and by the respective authors [4] G. Olry & al., “SPIRAL2 CRYOMODULES B TESTS RESULTS”, SRF’13, Paris, September 2013. [5] D. Longuevergne & al., “An Innovative Tuning System for Superconducting Accelerating Cavities”, NIMA56503. [6] D. Longuevergne & al., “A cold tuner system with mobile plunger”, SRF’13, Paris, September 2013. ISBN 978-3-95450-142-7 1040 03 Technology 3E Cryomodules and Cryogenics