1
User Guide
Zend Platform V3.6
By Zend Technologies, Inc.
www.zend.com
Table of Contents
Zend Platform ......................................................................................................................... 1
Contribute to the Documentation ....................................................................................... 1
Introduction ....................................................................................................................... 3
Preface ............................................................................................................................. 3
Software and Hardware Requirements .................................................................................. 4
About Platform ................................................................................................................... 5
Navigation ...................................................................................................................... 5
A Central Control Center................................................................................................... 5
Standard and Enterprise Servers ....................................................................................... 6
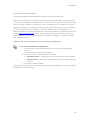
Support Tool ...................................................................................................................... 7
Getting Support............................................................................................................... 8
Change Server ................................................................................................................... 8
Overview .......................................................................................................................... 10
Environments .................................................................................................................. 11
Architecture..................................................................................................................... 13
Central Server ................................................................................................................. 14
Nodes ............................................................................................................................. 15
Central-Node Communication............................................................................................. 17
Platform Administration, a Single Point of Access ............................................................... 17
Getting Started................................................................................................................. 18
Configuration Check List.................................................................................................... 20
Performance Lifecycle Check List ........................................................................................ 21
Performance Management Server .................................................................................... 22
Platform Tab .................................................................................................................... 23
Dashboard .................................................................................................................... 24
Status .......................................................................................................................... 25
Preferences................................................................................................................... 26
User Management.......................................................................................................... 28
Cluster Management ...................................................................................................... 35
License Management...................................................................................................... 42
PHP Intelligence ............................................................................................................... 47
Event Trigger Settings and Analysis ................................................................................. 48
Why Configure Event Triggers?........................................................................................ 50
Finding Events that Interest You...................................................................................... 50
The Problem Resolution Lifecycle ..................................................................................... 51
System Health .............................................................................................................. 53
Graphs ......................................................................................................................... 55
Event List ..................................................................................................................... 57
Event Triggers............................................................................................................... 62
Event Types .................................................................................................................. 65
Security ....................................................................................................................... 83
Event Actions ................................................................................................................ 85
Event Details................................................................................................................. 89
Performance .................................................................................................................. 104
Overview .................................................................................................................... 104
ii
Table of Contents
Performance ............................................................................................................... 106
Performance Lifecycle .................................................................................................. 107
Implementing the Performance Lifecycle......................................................................... 109
Performance Optimization Tools .................................................................................... 110
Configuring Performance .............................................................................................. 111
Performance Console ................................................................................................... 113
Settings ..................................................................................................................... 114
Content Caching .......................................................................................................... 120
URLs .......................................................................................................................... 141
Testing....................................................................................................................... 143
Tuning ....................................................................................................................... 149
Tuning Performance in i5 OS ......................................................................................... 150
Zend Optimizer ........................................................................................................... 152
Configuration Tab ........................................................................................................... 153
Studio Settings............................................................................................................ 154
Tunneling (Communication Settings).............................................................................. 156
Configuring Preferences for Tunneling ............................................................................ 157
Configuring Tunneling with Studio ................................................................................. 159
On Demand Connection ................................................................................................ 165
Debugger Tunneling Port Limits ..................................................................................... 166
PHP Configuration........................................................................................................ 167
PHP Info ..................................................................................................................... 170
Clone Wizard............................................................................................................... 171
Web Services ................................................................................................................. 172
System Requirements .................................................................................................. 172
General Tasks ............................................................................................................. 173
Get/Set Actions ........................................................................................................... 174
Add/Remove Server Actions.......................................................................................... 175
Event Handling ............................................................................................................ 176
Using Web Services ..................................................................................................... 179
Enterprise Server ........................................................................................................... 181
Session Clustering .......................................................................................................... 182
What is Session Clustering? .......................................................................................... 182
Session Clustering and HA (High Availability) .................................................................. 184
Session Clustering Statistics.......................................................................................... 186
Session Clustering Settings ........................................................................................... 188
The Importance of Session IDs...................................................................................... 190
Session Clustering Storage Models................................................................................. 191
Defining Storage Models ............................................................................................... 193
Fine Tuning Session Clustering ...................................................................................... 193
Job Queues.................................................................................................................... 194
Jobs ........................................................................................................................... 195
Job Queue API............................................................................................................. 196
Job Management ......................................................................................................... 198
Queues ...................................................................................................................... 199
Jobs Tab..................................................................................................................... 202
Job Details.................................................................................................................. 205
Job Queue Settings ...................................................................................................... 207
iii
Zend Platform User Guide
Zend Download Server (ZDS) .......................................................................................... 210
Configuring the Zend Download Server (ZDS) ................................................................. 210
ZDS Settings............................................................................................................... 213
Testing the ZDS .......................................................................................................... 214
Test Download ............................................................................................................ 216
Understanding Test Results........................................................................................... 217
Integration Server ......................................................................................................... 218
Java Bridge.................................................................................................................... 219
About the Java Bridge Technology ................................................................................. 220
Operating and Configuring ............................................................................................ 222
Java Status Page ......................................................................................................... 223
Common Tasks............................................................................................................ 226
Usability Issues ........................................................................................................... 231
BIRT Reports ................................................................................................................. 235
Using BIRT.................................................................................................................. 235
BIRT Reports Tab ........................................................................................................ 236
Setting-Up the BIRT Report Engine ................................................................................ 237
BIRT Report Examples.................................................................................................. 238
Reference ....................................................................................................................... 242
Useful Links ................................................................................................................... 242
Zend Platform Built-In Services and Extensions.................................................................. 243
Setup Tool..................................................................................................................... 244
Running the Setup Tool ................................................................................................ 244
Services ........................................................................................................................ 245
Java Bridge................................................................................................................. 245
Session Clustering ....................................................................................................... 245
Job Queues ................................................................................................................. 246
Cache Cleaner ............................................................................................................. 247
Collector Center .......................................................................................................... 247
Extensions..................................................................................................................... 249
zend_extension_manager.optimizer ............................................................................... 249
zend_extension_manager.download_server (not applicable in Windows) ............................ 249
zend_extension_manager.platform ................................................................................ 249
zend_extension_manager.monitor ................................................................................. 249
Zend Platform Action (Windows Only) ............................................................................ 250
Zend Platform Pinger (Windows Only) ............................................................................ 250
Zend Platform Collector Center...................................................................................... 250
Zend Platform Node Collector ........................................................................................ 250
Deprecated Caching APIs and Directives............................................................................ 251
Deprecated Functions................................................................................................... 251
Deprecated Directives .................................................................................................. 251
APIs.............................................................................................................................. 252
Accelerator Functions ................................................................................................... 253
Output Cache Functions................................................................................................ 253
Zend Cache Functions .................................................................................................. 254
Full Page Caching Functions .......................................................................................... 255
Monitor Functions ........................................................................................................ 256
ZDS Functions............................................................................................................. 258
iv
Table of Contents
Java Bridge Functions .................................................................................................. 259
Job Queue Functions .................................................................................................... 260
BIRT Report Functions.................................................................................................. 268
Directives ...................................................................................................................... 269
Accelerator Directives .................................................................................................. 270
Zend Cache Directives.................................................................................................. 272
Full Page Caching Directives.......................................................................................... 273
Monitor Directives........................................................................................................ 275
Platform Administration Directives ................................................................................. 282
Collector Center Directives............................................................................................ 283
Debugger Directives..................................................................................................... 284
ZDS Directives ............................................................................................................ 285
Java Bridge Directives .................................................................................................. 286
Session Clustering Directives ........................................................................................ 287
Job Queue Directives ................................................................................................... 290
Tutorials........................................................................................................................ 292
Integrating Existing and Legacy Applications ................................................................... 293
Calling an EJB on Websphere from PHP .......................................................................... 296
Partial and Preemptive Page Caching.............................................................................. 297
About SNMP ................................................................................................................ 305
Appendices .................................................................................................................... 311
Appendix A - Troubleshooting Zend Platform................................................................... 312
Appendix B - Event Aggregation Mechanism.................................................................... 317
Appendix C - Zend Platform Support .............................................................................. 319
Appendix D - Network Port Requirements ....................................................................... 320
Index ................................................................................................................................. 323
v
Zend Platform
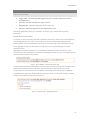
Contribute to the Documentation
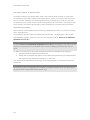
Your feedback is important to us. Therefore, at the bottom of each page is a link for sending e-mails
directly to the Zend documentation team.
You can also let us know your thoughts and suggestions on Zend documentation by participating in
our Zend Documentation Satisfaction survey:
http://www.zoomerang.com/survey.zgi?p=WEB226L47RWR8P
1
Zend Platform User Guide
Disclaimer
The information in this document is subject to change without notice and does not represent a
commitment on the part of Zend Technologies Ltd. No part of this manual may be reproduced or
transmitted in any form or by any means, electronic or mechanical, including photocopying, recording,
or information storage and retrieval systems, for any purpose other than the purchaser’s personal
use, without the written permission of Zend Technologies Ltd.
All trademarks mentioned in this document, belong to their respective owners.
© 1999-2008 Zend Technologies Ltd. All rights reserved.
Zend Platform User Guide issued January2008.
DN: ZP-UG-010108-3.6-001
2
Zend Platform
Introduction
Preface
Zend Platform is a diverse, runtime-environment management application. As such, a greater
understanding of the underlining concepts is required to benefit from the Zend Platform capabilities
and features. This User Guide reflects these concepts by providing a workflow driven description of
Zend Platform’s features.
The Overview is an introduction to Zend Platform describing the background and architectural design
of Zend Platform along with who should read this guide and how to maximize the benefits of deploying
Zend Platform in your environment.
Getting Started describes the different configuration options and workflow implementations of Zend
Platform including implementing the Performance Lifecycle.
Performance Management Server describes the features and functionality included with the
”Performance Management Server”. This part includes functional descriptions of the performance
management components, which include: Platform (Management Console), PHP Intelligence,
Performance and Configuration.
Enterprise Server describes the features and functionality included with the ”Enterprise Server”. This
part includes functional descriptions of Enterprise grade components, which include: Session
Clustering, Job Queues and SNMP Traps.
Integration Server describes the features and functionality included with the ”Integration Server”. This
part includes functional descriptions of Integration components, which include: Zend Platform’s Java
Bridge and advanced reporting facilitated by Actuate’s BIRT Reporting Tool.
The Reference section provides additional reference information. This part includes a list of APIs and
Directives, Tutorials and Appendixes.
3
Zend Platform User Guide
Software and Hardware Requirements
Zend Platform requires that each installation of Zend Platform (Central and Node) meet the following
hardware and software specifications:
Hardware Requirements
Minimum 350MB Hard Disk space for installation
4GB HD space required for a typical live system with 1000-2000 events
Recommended minimum CPU - Pentium 4, 3.2GHz
Recommended 1GB RAM for a Central Server with 3 Nodes
Network card
Software Requirements
To be sure you have the most current details regarding the Platform compatibility with platforms, PHP
versions, and Zend's other products refer to the information available online at:
http://www.zend.com/store/products/zend-platform/system-requirements.php. The Zend team
regularly updates this information.
4
Zend Platform
About Platform
Platform is the only robust PHP production environment that ensures your applications run smoothly
at all times.
Designed for IT personnel and businesses that require industrial-strength applications in highly
reliable production environments, Platform offers high performance and scalability to provide your
customers with the best possible Web experience and response time.
Platform uniquely guarantees application up time and reliability through enhanced PHP monitoring and
immediate problem resolution that removes the troubleshooting guesswork out of the equation and
replaces it with peace-of-mind.
You spent time and money developing your state-of-the-art PHP application, now it is time to ensure
its up and running.
Navigation
Platform is a browser-based application. The general layout of functionality is in a tabbed view where
each tab represents a unique functionality.
Platform Tab - Management functionality
PHP Intelligence - Monitoring and event generation capabilities
Introduction to Performance - Performance enhancement tools
Configuration - Integration settings and PHP configurations
Session Clustering - Session Clustering statistics
Zend Download Server (ZDS) - Configure settings for the Zend Download Server to offload
large downloads
Job Queues - Streamline offline processing
Integration - Incorporate a Java environment to enrich your applications
The tab colors indicate the server type that is determined by the license type you have. The pale blue
tabs belong to the Performance Management Server and the darker blue tabs belong to the Enterprise
and Integration servers.
A Central Control Center
Platform handles clusters and standalone servers. As such, users can use the Administration Console
to transparently navigate between the Central Server and nodes.
Users stay on the central server until they select a tab that prompts to select a server; as soon as a
server is selected, subsequent actions and settings will be applied to the selected server only.
A status bar showing the date, time and login name will also display the name of the server on which
the user is currently working.
When no server name appears, you are on the Central Server. Not only can you configure and monitor
activity by server you can also clone settings from one server to be applied to one or more servers
providing enhanced management fluidity in your clustered environment.
5
Zend Platform User Guide
Standard and Enterprise Servers
Platform is distributed as either a Performance Management Server or an Enterprise Server. Choosing
the appropriate server depends on your organization's requirements.
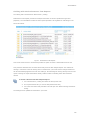
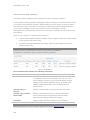
The following table lists the different servers and their respective functionality:
Feature
Performance
Enterprise
Comments
Management
Platform
This includes the Dashboard, Server Status
indicator, User and license Management.
PHP Intelligence
This includes the System Health overview,
Event management and the Graph
generator.
Performance
This includes performance management
features: Code Acceleration, Dynamic
Content Caching, File Compression,
Updating Virtual Hosts and testing URLs.
Configuration
This includes the advanced configuration
features for configuring your PHP directly
from Platform Administration and enabling
the connectivity with Studio to provide a
complete development lifecycle.
Session
Enterprise Session management for cluster
Clustering
based environments.
Job Queues
Improve response time during interactive
web sessions and utilizing unused resources.
Integration
This includes Java Bridge connectivity and
integration with business intelligence
reporting using Actuate's BIRT reporting
system.
ZDS
This includes settings and performance
tests.
6
Zend Platform
Support Tool
The support tool is accessed from the Dashboard as a link in the "Configuration and Management
Tools" Section.
The Zend Support Tool gathers server configurations and setup information. Information can be
gathered from more than one server at a time depending on your preferences.
The gathered information is used to aid in the support process to troubleshoot support issues and
provide comprehensive and efficient support.
The type of information collected is as follows (partial list):
The type of information collected it as follows (partial list):
php.ini (content and location)
httpd.conf (content and location)
Results of phpinfo() on the server
Output of 'df'
Output of 'uname -a'
All of the various logs our products generate (installation log, etc.)
Output of 'ls -lR of /usr/local/Zend/Platform' (The install_dir)
Use the support tool wizard to create, gather and send information regarding your Server's
configuration and setup.
The information collected by the Support Tool can be stored and distributed in several
ways:
1.
Submit a ticket to Zend.com support
2.
Collect information and save it in an archive
The support tool is accessed from Platform Administration by going to:
Platform | Dashboard | Configuration and Management Tools | Support Tool
In case of problems during Installation or later on when using Platform Administration, the Support
Tool can be run on a specific server from:
Unix: <Install_dir>/bin/support_tool.sh
Windows: <install_dir>\bin\support_tool.bat
Note:
Multi server (distributed) information collection is not available from the command line.
7
Zend Platform User Guide
Getting Support
The Zend Support Center allows users to benefit from other user's experiences by viewing Knowledge
Base articles, participating or viewing posts made to one of the product User Forums. Easily access
the Support Center from the online help by clicking the Support button.
Change Server
The Change Server button is accessed from the Main Info bar (located at the top of each tab) and is
available from features that can be applied to nodes belonging to the cluster.
Platform provides a single user interface for activities that are performed both on the Central (the
cluster governing component) and nodes (servers that have been assigned to the central). The
transparent user interface provides users with the ability to transition between servers.
Note:
The Change Server screen is a pop-up. If you have a Pop-up Blocker activated on your browser, make
sure that pop-ups are allowed for the Platform URL or deactivate the Pop-up Blocker entirely.
The user interface is divided into actions that are performed on the central server and actions that are
performed on a selected node.
The actions performed on the Central server are as follows:
Platform (administration menu): Dashboard, Status, Preferences, User Management, Cluster
Management and license Management.
PHP Intelligence: System Health, Graphs, Event List, Event Triggers Event Actions and
Security.
Session Clustering: Statistics and Settings.
Job Queues: Queues, Jobs and Settings.
Integration: BIRT Reports (The Java Bridge must be up and running on the central server in
order to render the reports).
The actions performed on a selected node are as follows:
Performance: Console, Settings, File View, URLs, Testing and Tuning.
Configuration: Studio, PHP Configuration, PHP Info and Clone wizard.
Integration: Java Bridge.
ZDS: Settings
The Server Indicator displays the name of the server on which you are currently working, the user
name used to log-in, a log-out option and the current date and time.
When on a node, the Server Indicator will add an additional option to change the server. This option
will not appear on when performing actions on the central server.
The following procedure describes how to change the server on which you are working. The "Change
Server" option opens a tree that displays all the available servers that the currently logged-in user is
permitted to view. Servers can be displayed in the tree by Groups or alphabetically.
8
Zend Platform
To change a server:
1.
Click "Change Server".
2.
Choose a Server from the list and click Select.
3.
If you cannot see a specific server, it is possible that you do not have the correct
user permissions, in that case go to: Platform | User Management and check to see
if your User has a "Server Restriction". Alternately, contact your System
administrator to grant access to this server through your Platform user permissions.
Platform will "remember" the last server selection for the next log-in.
9
Zend Platform User Guide
Overview
Contents:
Environments
Nodes
Architecture
Central-Node Communication
Central Server
Zend Platform is a complete runtime environment for managing and maintaining mission critical and
enterprise PHP applications from a single, centralized location.
This environment consists of cluster management; performance management, monitoring, detection
and recovery; and Java integration.
Zend Platform improves both the end user experience and IT productivity by combining cluster and
performance management; automated monitoring and detection capabilities; and powerful Java
Integration capabilities into one integrated environment.
Zend Platform provides the PHP-enabled enterprise with the ability to:
Manage every aspect of PHP from a single, Web-based interface
Quickly drill-down to critical issues to resolve and optimize
Create user defined thresholds and error values
Configure servers from a remote management station and to perform controls at a click of a
button
Clone servers: one-to-one and one-to-many
Monitor performance improvement with Code Acceleration, Content Caching and File
Compression
The Zend Download Server
Integrate with Java system elements over Platform’s fully implemented PHP/Java Bridge.
Zend Platform is a central management solution and run-time environment for:
Configuration Management - Platform’s architecture provides full control of the PHP
application platform, including performance management settings, event thresholds, etc.
allowing administrators to set up groups of multiple identical servers via:
•
Remote server configuration.
•
Clone configurations or parts of configurations from one server to another or from
one server to an entire group of servers.
Performance Management * - Platform is equipped with three management modules for
tracking and improving speed and responsiveness of Web applications. These include Code
Acceleration, Dynamic Content Caching and File Compression.
PHP Intelligence - Platform features new technology that detects and recovers crashes,
whether they occur in PHP itself, the database software, or your own application. The
integrated suite of monitoring, detection and recovery features allows users to drill down to
critical issues and optimizations quickly and easily.
Session Clustering * - Zend Platform is equipped with a comprehensive solution for
synchronizing session data across a cluster. Protect your applications from session corruption
and erratic application behavior while providing an additional performance boost (up to x10).
10
Zend Platform
Immediately implement this solution to existing PHP code and attain linear scalability. Fully
integrated with load balancers the Session Clustering module is a mechanism to ensure
session data quality and integrity.
Job Queues - Zend Platform’s Job-Queue provides PHP production environments with a
standard approach to streamline offline processing. A Job-Queue server is services the Job
Queue that provides the ability to reroute and delay the execution of processes that are not
essential during user interaction with the Web Server.
BIRT Reports - Advanced reporting capabilities: have been integrated into Zend Platform, to
provide enterprise users with expandable reporting functionality. Actuate's reporting
application is the chosen application, together with Zend Platform's Java Bridge it can extract
reports from Java libraries and generate reports on any information. This solution is
essentially a PHP API to the Actuate BIRT 2.0 run time environment that supports both PHP 4
and PHP 5.
Java Bridge - The Platform PHP/Java Bridge module provides PHP centric companies with a
well-rounded environment making sure that the organization benefits from the ”best of both
worlds”. Be it, existing investments in J2EE application servers that require this solution, or
to provide a means for organizations - if they choose, to bridge language limitations by use
of Java applications. The Java Bridge is not limited to interactions strictly with J2EE and
legacy systems, the Platform PHP/Java Bridge also provides the ability to interact with plain
Java objects.
Environments
A typical environment for running any Web application consists of three basic components: Web
servers for running the Web application, a load-balancer to handle traffic and a Firewall to protect
form unauthorized entry into the hosting network.
Zend Platform, once introduced to this kind of an environment becomes a control environment for web
server activity.
In an environment where a single web server manages activity, Zend Platform resides on the web
server to provide system health and analysis information.
Moreover, environments that include several web servers, as clusters servicing a single Web
application or a collection of clusters servicing different Web applications, Zend Platform serves as a
single control center for system health information, cluster management and runtime process
optimization.
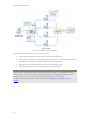
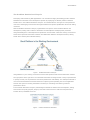
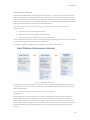
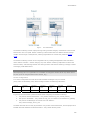
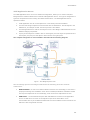
The Zend Platform system diagram below, demonstrates where Zend Platform components typically
reside in the PHP- enabled enterprise.
11
Zend Platform User Guide
Figure: Zend Platform System Diagram
The system diagram illustrates the following points:
Zend Platform’s Standalone Cluster Server is installed on a Web server.
The System Administrator controls all Platform Central functions. Providing the ability to work
with Platform from a single workstation using a standard Web Browser.
Nodes host resident PHP-based services that fill requests from the Web.
Load Balancing directs requests to available servers in the web farm.
Note:
Platform Server and the Platform nodes are separate entities; therefore, it is important to configure
Firewall and security devices to allow communication between the nodes and the Platform Server.
Identify which ports are in use and if necessary, open these ports on your Firewall.
To read more about working with Firewalls and Nat go to ”Configuring Zend Studio Tunneling
settings”.
12
Zend Platform
Architecture
Platform is a complete environment that provides rich functionality by interacting with the existing
PHP in a simple and generic way. Platform is a non-intrusive extension to an existing environment
with minimal overhead that helps obtain enhanced performance and reliability.
Platform extends the Zend Engine with the organization's execution environment, providing the
platform on which to base Web services, business to commerce applications, content-management,
Intranet and business-to-business applications.
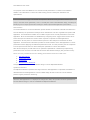
Figure: Platform and the PHP-enabled Enterprise
Platform consists of two deployed components the Central Server (consists of a Server + Node) and
the Node component.
The Central Server is a central management component for governing node configurations and script
performance information. The Central Server can be deployed as a standalone Platform environment
for a single server and for this reason, contains fully functioning node components. However, the
prominent application for Platform is multiple server/cluster based environments.
The Central provides a single point of access and control for multiple nodes.
Nodes are web servers that run with Apache and service a PHP application. The Platform components
are installed on the node to report script, database and system activity to the Central Server. Each
node installation also includes a debugger that is integrated with Studio extended code management
features such as profiling, debugging and correcting code directly on a node.
In essence, similar components are installed on the Central Server and the Nodes since the Central
Server also performs as a node. However, the Central Server and the Node Components employ
different modules for their overall activity.
13
Zend Platform User Guide
Central Server
The Central Server provides the necessary functionality for handling event information, node
management and performance monitoring.
No matter how many nodes are registered in the cluster, from the users point of view Central provides
an efficient and useful single point of entrance. Central resides on the Central Server and is in charge
of displaying Platform Administration for Central Server and Node configuration. The Central is the
main communication component for collecting, storing, configuring and receiving information from the
nodes.
Communication is carried out via regular TCP/IP communication and event information is stored in a
dedicated database. Zend Central governs the PHP application performance and monitoring features
including configurations for nodes, PHP and event collection.
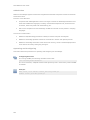
The following illustration is a representation of Platform Server components:
Figure: Platform Server Components
The Central Server is a central management component for managing and configuring nodes. The
Central server component is installed once. All subsequent installations are for node components that
are registered to this server in the installation process. Standalone environments base on one server
only require the central component that also includes all the node components necessary for working
in a single server environment.
The installation includes three main components:
1.
Central that includes information collection and functionality: Performance, PHP Intelligence
and the Java Bridge.
2.
The Database is the main repository for event information collected from all registered nodes.
3.
One of the main components of Central is the Collector. This component collects and
aggregates information from nodes in the cluster that is displayed in Platform's PHP
Intelligence module. The collector collects and aggregates information according to
configurations applied to a single server or to several servers (grouped servers).
14
Zend Platform
Nodes
Nodes are the web servers that run PHP. Nodes are individual servers that service a Web application
and a collection of nodes are referred to as a cluster.
The central server governs clusters.
The following components need to be on each Node:
Basic:
•
A supported operating system (Linux, Unix, Mac, i5/OS and Windows)
•
A Supported Web Server (Apache, IIS)
PHP:
•
PHP version 4 or 5
Zend Products
•
Platform
•
Download Server
•
Monitor
•
Optimizer
•
Debugger
Nodes have to be registered with the Central Server by a user with administrator rights in order to
enable communication between the Node and the Central Server. There are two ways to register a
Node to the Central Server: through the installation process or by manually registering the Node.
Platform Nodes consist of several components that report information to the Central Server and
provide debug capabilities for PHP scripts residing on a node.
A Collector Component for transferring event information to the central
Debug Infrastructure for debugging live pages directly from a node (This option is supported
by Studio)
The following illustration is a representation of Platform Node components:
Figure: Platform Node Components
15
Zend Platform User Guide
The Collector component listens to the running processes and collects event information (For more on
Events go to ”Configuring Events”), to be reported to the Central Server over a regular TCP/IP
connection). However, only if the node and the central have the same key will the Central Server
agree to receive event information from a node’s collector (the key is generated when Nodes are
registered in the installation process or in the "Setup Tool".
The type of information the Collector listens to and collects is event information determined by Event
Rules that are configured on the Central Server. Event information is sent to the Central server where
it is aggregated according to event type (more about event aggregation can be found in "Appendix B Event Aggregation Mechanism"). Different Rules can be applied to different nodes in a cluster
environment or specific settings can be applied to more than one node in a cluster (by using the Clone
Server feature).
The Debugger Infrastructure is enabled via the Studio/Platform Communication Tunnel that is geared
to work in development and production environments. With the appropriate configuration, the
Debugger Infrastructure can work through Firewalls or NAT devices that may be positioned between
the Node and Studio (more about Firewall traversal can be found in ”Configuring Communication with
Studio". The Debugger Infrastructure provides full lifecycle support for editing debugging, profiling
and deploying code by enabling to view and edit Event source code in the Studio development
environment. This provides Zend Studio users with access the remote debugger via the same
communication tunnel that routs full-duplex traffic over HTTP. The Debugger Infrastructure utilizes the
Communication Tunnel, ensuring that multiple servers can be debugged through the same
Communication Tunnel at once.
Figure: Communication with Studio
16
Zend Platform
Central-Node Communication
Traffic between the Central Server and Node clusters mostly occurs from the nodes to the central
server with the nodes reporting event information through the collector component to Zend Central.
However, Platform has a Server Status feature that periodically checks the availability of each Node in
the cluster and provides up to date information regarding the components installed on the nodes.
The following diagram illustrates the communication between the Central Server and Nodes
in a Cluster:
Figure: Central Node Communication
Platform Administration, a Single Point of Access
Platform’s sophisticated architecture enables to use the Central Server as a single point of access for
node availability and configuration, enabling to configure node settings and behavior from the Central
Server itself. This connectivity is achieved by the addition of Platform Administration components on
the Nodes as well as on the Central Server in the installation process. In this process the Central
Server’s URL is specified to the Nodes as a central control unit and from that point onwards, access
and read write permissions to nodes, can be established from the Central Server.
17
Zend Platform User Guide
Getting Started
Contents:
Configuration Check List
Performance Lifecycle Check List
Platform is an out-of-the-box fully functioning product. This includes basic default settings for
monitoring events and code acceleration. At this stage (immediately after installation) Platform
already generates events and improves code generation. However, to benefit from Full-Power Cluster
Management, Development integration with Studio, Audit Trails, and much more, it is necessary to
tune Platform’s performance settings to suit your individual work environment.
In this section, basic configuration tasks are listed in chronological order beginning from initial
configuration tasks to configurations that may rely on other settings.
There are two checklists:
1.
Configuration Check List - chronologically lists all the initial configuration tasks that should be
done to customize Zend Platform to suit your requirements.
2.
Performance Lifecycle Check List - Lists the different stages of implementing the Performance
Lifecycle for streamlining Production and Development environments.
The initial configuration actions are:
Cluster Management - Add the servers that you want Platform to control. Each server should
be added and then grouped to create a cluster environment to be treated as a single entity in
terms of event collection.
Configuring Event Triggers - customize the Event Triggers to suit your working environment.
The Platform installation comes ready with default configurations; however, it is
recommended that a person with an understanding of the environments settings and
performance standards, configure Event Triggers accordingly.
Configure Event Actions - once Event Triggers are configured, determine the actions that can
be applied to Events for using PHP Intelligence to send event information by e-mail or to a
URL.
Performance - Adjust performance requirements as a way to benefit from Platform's
advanced performance features.
Configure Studio / Tunneling - Platform’s tight integration with Studio provides an efficient
means for improving the development lifecycle. Environments that contain security
precautions such as Firewalls and NAT can set up Platform to provide a secure means for
obtaining integration with Studio without compromising an organization's security measures.
Configuring PHP Settings - configure your PHP and Zend products directly from Platform.
Clone Wizard- once all initial settings have been configured, the Clone Settings feature can
be used to apply settings to other nodes in one single step.
User Management - Grant different levels of permissions to different users provides a means
for controlling actions performed in the environment and for enforcing work procedures. This
is the last step to customizing Platform to your working environment.
18
Zend Platform
License Management - Manage licenses for the central server and all nodes belonging to the
cluster.
19
Zend Platform User Guide
Configuration Check List
This Check List details all the Platform configuration tasks in chronological order. This list can be
printed and used as an extra aid for setting-up Platform.
1.
Configure Clusters and Groups when working in a cluster environment to enable event
aggregation over multiple servers.
Platform |Status | Manage Cluster or use the Shortcut Platform | Dashboard | Manage Cluster
2.
Event Triggers, to modify default settings to suit the new environment:
PHP Intelligence | Event Triggers
Or use the shortcut Platform | Dashboard | Event Triggers
3.
Configure Action Rules, to send Event Details data by e-mail or to a URL:
Platform | Dashboard | Event Actions
4.
Configure Performance, to define initial performance settings for Code Acceleration, Dynamic
Content Caching, File Compression and Download optimization:
Performance | Settings
5.
Configure Virtual Hosts and fine tune performance setting per file:
Performance | File View
6.
Setup integration with Studio Server: Platform | Preferences and then go to Configuration |
Studio
7.
Establish a persistent connection with Zend Studio for Debugging Profiling and Editing code:
Platform | Preferences
8.
Configure PHP settings to customize the php.ini and zend.ini to your environment:
Configuration | PHP Configuration or use the Shortcut: Platform | Dashboard | Configure PHP
Settings
9.
Use the Clone Wizard to apply configurations from one node to other nodes:
Platform | Dashboard | Clone Wizard
Alternatively use the Quick Clone buttons to apply specific performance and PHP Intelligence
settings.
10. Define User and Group permissions
Platform | User Management
20
Zend Platform
Performance Lifecycle Check List
This Check List details all the Platform Performance Lifecycle tasks in chronological order. This list can
be printed and used as an extra aid for calibrating Platform.
1.
Benchmark Web application, to establish optimization-starting point:
Performance | Testing | Analyze Site - Run Performance Tool
2.
Calibrate Event rules to configure PHP Intelligence events to the Web application's
performance parameters:
PHP Intelligence | Event Triggers
Or use the shortcut Platform | Dashboard | Event Actions
3.
Benchmark Web application, to establish a second optimization-starting point:
Performance | Testing | Analyze Site - Run Performance Tool
4.
Analyze Event Details, to pinpoint performance issues:
PHP Intelligence | Event List
Recommended: Focus on the following performance related event types:
•
Slow Script Execution (Absolute and Relative)
•
Slow Query Execution
•
Slow Function Execution
•
Excess Memory Usage (Absolute and Relative)
5.
Apply Caching to boost Web application performance:
•
Define Dynamic Content Caching: Performance | File View
(or from the Site Analysis results).
•
Apply Partial Page Content Caching APIs (see Tutorial)
6.
Configure Acceleration to save code compilation time:
•
Acceleration Settings: Performance | Settings
•
Acceleration Blacklist: Performance | File View
7.
Configure Compression to consume less bandwidth:
•
Compression Settings: Performance | Settings
•
Compression Blacklist: Performance | File View
Important: Deactivate compression entirely if the server is set to handle compression
(Performance |Settings | File Compression).
8.
Configure Optimization optimize script and detect encoded files:
Platform | Dashboard | Configure PHP Settings | Zend | Zend Optimizer
9.
Benchmark Web application, to view optimization boost:
Performance | Testing | Analyze Site - Run Performance Tool
21
Zend Platform User Guide
Performance Management Server
Contents:
The Problem Resolution Lifecycle
Performance
PHP Intelligence
Web Services
The Performance Management server is a comprehensive set of tools for boosting PHP script
performance and managing PHP applications.
The Performance Management Server components are:
Platform (Management Console) - Includes the Dashboard, Preferences, license Management
and User Management.
PHP Intelligence - Event configuration, handling and management.
Performance - Code Acceleration, Dynamic Content Caching, Benchmark and File
Compression.
22
Configuration - PHP and server configurations.
Web Services - Use Platform using Web Services.
Zend Platform
Platform Tab
Contents:
Dashboard
About License Management
Status
Manage License
Preferences
Acquiring a License
The Platform tab is a central management viewpoint for monitoring the health and availability of PHP
applications and Zend products.
Platform includes the following configuration and management features:
Dashboard - configure groups of servers, distribute configurations, and observe servers/node
statuses.
Status - displays system information about the servers managed by Platform.
Preferences - view and edit the global settings for the Platform installation and the Monitoring
page.
User Management - displays information about the users currently defined in the system. It
also provides shortcuts to the User Management functions supported by Platform.
Cluster Management- manage clusters from a single location. Options include server, group
and virtual host management.
License Management - manage licensing for the central server and related nodes.
23
Zend Platform User Guide
Dashboard
The Dashboard tab is accessed from the main Platform tab.
Use the Dashboard to configure groups of servers, distribute configurations, and observe the status of
the servers/nodes.
The main Platform tab Includes:
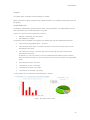
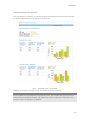
Events at a Glance - An event display table that displays latest events by filters and ID and
a graphical representation of event statistics (see Graphs for more information).
Configuration and Management Tools - configure and manage settings and servers:
•
Configure Event Actions - Define settings for sending event information via e-mail or URL.
•
Configure Event Triggers - Change the Event triggers on a selected server.
•
Configure PHP Settings - Change PHP Settings on a server.
•
Support Tool - Gathers comprehensive system information and allows users to open a
Support Ticket.
Useful Links
•
Zend Technical Support - Connects users to the Zend Support Center, where they are able
to submit a Support Ticket.
•
Zend Store - Links users to Zend's on-line store, to purchase Zend products.
•
Zend Platform - Connects users www.zend.com for additional details and information about
Platform.
•
24
Zend Framework - Connects users to the Zend Framework.
Zend Platform
Status
The Status tab is accessed from Platform | Status.
This tab displays system information about the servers managed by Platform in a sortable table.
Information can be sorted by: Server Name, Group or Status.
Use the Filter option to reduce the amount of information displayed on screen.
Information can be filtered by Group and Specific components such as: Operating System, Web
Server, PHP Version, Zend Engine Version, Java Bridge, Optimizer etc.
Status: Each Server is periodically checked for availability.
The Status indicator changes color according to the server's current status.
There are four statuses: Green = OK / Red = Error / Yellow = Notice / Grey = N/A.
Status information includes the reason for the status and the time stamp (the
Central's last attempt to access the Server). This information is added to the
indicator's tool-tip (To view the Tool-tip, hover over the status indicator with the
cursor).
Zend Products: Each product is detailed in the table displaying the product's Version and
Status.
The Status indicator may show the following statuses:
Green = OK / Orange = Notice / Red = Error / Grey = N/A
The product status indicator includes information about the status in the Tool-tip (To
view the Tool-tip, hover over the status indicators with the cursor).
25
Zend Platform User Guide
Preferences
The preferences tab is accessed from Platform | Preferences.
The Preferences tab is the location for viewing and editing Platform global settings
Use this tab to configure settings for:
Platform (including integration with Studio)
Mail Settings for sending Events
License Settings
Job Settings
Monitoring Settings
PHP ini settings
Preferences Fields and Functions
Zend Platform Settings:
Auto Detection Port - Indicates that Studio will listen to the local host on the signified Auto
Detection port - Default=20080.
Test - Verifies if Studio is listening to this port. This test should only be run when Studio is
running.
Method of passing the Studio Server parameters - Defines the means for passing
communication parameters from Platform to Studio. Choose COOKIE or GET method.
E-mail Settings
Configuring these settings ensure that messages will not be filtered as "Spam". If these settings are
not defined all Event e-mails will be sent with the system default sender name (If these settings are
already configured in your php.ini those settings will be used unless you configure different settings in
the preferences and then the settings in the preferences override the php.ini settings).
In windows and i5:
SMTP server - The IP of the server delivering the e-mail.
SMTP port - The port handling the e-mail transfer.
E-mail Account - The e-mail account that will be identified in the message as the "sender".
In UNIX, MAC, Linux etc.:
E-mail Account - The e-mail account that will be identified in the message as the "sender".
Note:
Mails are sent using your Operating System's default sendmail configuration.
License Expiration Notice Settings:
Notify by e-mail when licenses are about to expire - When selected, users are
automatically notified when product licenses are about to expire, default=Off.
Number of days to notify before license expires - Enter the prior notice period (in days)
for sending a license expiration notice.
26
Zend Platform
Jobs Settings
Maximal number of Jobs displayed in a page - The number of Jobs to display per page in
the Jobs tab (If there are more than the number of Jobs to display a message asking to
refine the Jobs settings in Platform | Preferences will be displayed).
Auto refresh the Jobs - The page refresh rate in seconds for Jobs information.
Auto refresh the Queues - The page refresh rate in seconds for Queues information.
Monitoring Settings:
Number of events in a page - Defines the number of Events that are displayed in the
Event List. Default=300 (accepted values 1 to 1000)
Auto-refresh the Event List - Number of seconds between automatic refresh of the Event
List screen.
Auto-refresh the System Health - Number of seconds between automatic refresh of the
System Health screen.
Auto-refresh the Platform Dashboard - Number of seconds between automatic refresh of
the Zend Central Console.
PHP ini Settings
Zend password for php.ini - The password used for the ini_modifier. If left empty the
password is the same as the one defined in the installation process. Use this field to change
the password and update the password in the php.ini. changes here will not affect the login
password to change that, go to Adding and Editing Users.
Note for Core users: These changes will also change Core's ini_modifier and login
password. You can also change the password in Core and it will change Platform's
ini_modifier password (Platform's login will stay the same).
Password Confirmation - Retype your password.
27
Zend Platform User Guide
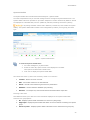
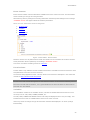
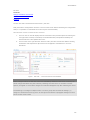
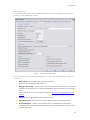
User Management
Contents:
Adding and Editing Users
User Settings
Adding and Editing Groups
Password Administration
Granting different levels of permissions to different users provides a means for controlling actions
performed in the environment and enforcing work procedures.
Central’s User Management tab includes Platform’s multiple users functionality. This feature set allows
different users to login to Platform.
Each user has a set of permissions that are defined by the system administrator that
determine:
Data the user is allowed to view
Zend products the user is allowed to access
Actions the user is allowed to perform
The User Management tab is accessed from Platform | User Management.
The User Management tab displays information about the users currently defined in the system. It
also provides shortcuts to the User Management functions supported by Platform.
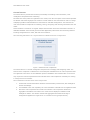
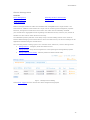
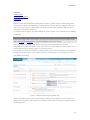
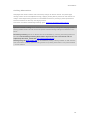
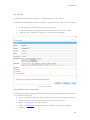
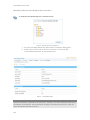
Figure: User Management
The information fields and functions that make up the User Information workspace are as follows:
User Name - Displays the name of the User who is currently logged in to Platform.
Existing Users - A list of users currently defined in the system.
Group Name - Users are defined within the system as belonging to a particular group and
not as independent entities. This is the name of the Permission Group to which the User
belongs.
Has Server Restriction - The specific user is restricted from performing certain actions on a
specific server.
28
Zend Platform
Handle Groups - Selects the group whose attributes you wish to edit or remove entirely (is
added when there is more than one group). Edit/Remove - Allows you to edit or remove
entirely the settings for a specific User of a specific Group.
Add a New User - A shortcut to the Add a New User Wizard.
Add a New Group - A shortcut to the Add a New Group Wizard.
Click here to see how to use user permissions to restrict access to virtual hosts.
29
Zend Platform User Guide
Adding and Editing Users
The Add and Edit user options are accessed from Platform | User Management.
The following describes how to Add/Edit Platform users under the following conditions:
1.
The master user adding new users must have administrative level permissions in the system.
2.
New users must be added to an existing group. Users are defined as belonging to a particular
group - not as independent entities.
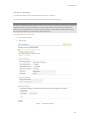
Adding a User
The following procedure describes how to enable Administrator-level users create new users.
To add a new user:
1.
Click the Add a New User button in the lower left corner of the User Management
workspace.
The Add a New User wizard opens.
2.
In the Add New User wizard, define the following General User Settings:
•
User Name - Enter a User Name that the User will use when logging in to
Platform Administration.
•
Password - Enter a Password that the User will use when logging in to
Platform Administration.
Platform Administration Passwords, may contain, between 4-16 characters
including the following: the alphanumeric characters 'a' through 'z', 'A' through
'Z' and '0' through '9' and the special characters (-) dash, (_) underscore and
(.) period.
•
Confirm Password - Confirm the Password.
•
Permissions Group - Select the Permissions Group to which the New User
will be assigned from the list of Permissions Groups that are currently defined
in the system.
3.
Click Next to go to the second step.
4.
In the Add New User wizard (2) Select the servers that you wish to allow the New
User to access.
5.
Click Finish.
The new user will be created in the database, with the defined permissions.
Note:
Added/Edited users can only view and edit events for the servers the User has permission to access.
Conversely, servers denied to the User will not appear in the server tree when the User logs in to the
system.
Editing a User
The following procedure describes how to enable administrator-level users to edit the preferences for
any User currently defined in the system. Non-administrator users can use this option to modify their
password.
30
Zend Platform
To edit user preferences:
1.
Click the Edit button to the right of the user whose preferences you wish to edit.
The Edit User Wizard opens with the user’s name appearing in the User Name field.
2.
In the Edit User wizard - Step 1, define the following General User Settings:
•
Password - Enter a Password only if you wish to change the Password for
that User; otherwise leave the Password field empty.
•
Confirm Password - Confirm the Password only if you are changing the
Password for the User.
•
Permissions Group - Select the Permissions Group to which the User will be
assigned from the list of Permissions Groups that are currently defined in the
system.
3.
Click Next to go to the second step.
4.
In the Edit User wizard (2) screen, select the servers that you wish to allow the User
to access.
5.
Click Finish.
The changes will be applied to the User settings and saved in the database.
31
Zend Platform User Guide
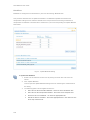
Adding and Editing Groups
The Group editing option is accessed from Platform | User Management.
The following procedure describes how to enable Administrator-level users to create new groups and
define user access permissions.
To create a New Group:
1.
Click the Add a New Group button in the lower left corner of the User Management
workspace to open the Add a New Group dialog.
2.
In the Add New Group dialog, select the preferences and permissions to assign to
the New Group from the table.
3.
Enter a name for the New Group.
Remember to click Save to save changes or create a Group in the database and register its settings.
The following is a list of group preferences and their definitions:
Group Name - Enter a name for the New Group
Delete an event - Enables the Delete Event option, for deleting events in the Event Details
screen and the Event Window.
Ignore an event - Enables the Ignore Event option, for ignoring events in the Event Details
screen and the Event List Window.
Close an event - Enables the Close Event option, for closing events in the Event Details
screen and the Event List Window.
Reopen an event - Enables the Reopen Event option, for reopening events in the Event
Details screen.
Preserve an Event - Enables the Preserve Event option, for preserving (saving) events in the
Event Details screen and the Event List Window.
See the event context data in Event Details - Allows users belonging to group to view the
event internal data (variables, included files) from the Event Details screen.
See the event source code in Event Details - Allows users to view the event source code in
the Event Details embedded viewer.
Use the Zend Studio Integration - Allows users to view, profile and debug event source code
in Zend Studio.
Changing Zend Platform Settings (in the Preferences) - Allows users to change preferences in
Platform | Preferences.
Configure and change the Event Actions - Allows users to configure and change Event Actions
from the Event Actions screen.
Configure and change the Event Action Rules - Allows users to configure and change Action
Rules from the Define Action Types/Rules screen.
32
Manage Server - Allows users to manage servers from the Manage Cluster screen.
Manage VHosts - Allows users to manage Virtual Hosts from the Manage Cluster screen.
Zend Platform
Manage Groups - Allows users to add and change group settings from the Manage Clusters
screen.
Cloning configuration between servers - Allows users to clone server configuration to
additional servers from the Clone Wizard.
Update all Information - Allows users to update server data.
Use Support Tool - Allows users belonging to the group to access the Support Tool from the
Support Tool link.
Go into the Event Triggers Section - Allows users to configure and change Event Triggers
from the Event Triggers screen.
Configure PHP settings - Allows users to configure and change PHP settings from the
Configure PHP Settings screen.
Go into the Performance section of nodes - Allows users to access the Performance Tab for
nodes.
Go to the Configuration section of nodes - Allows users to access the Configuration Tab for
nodes.
Go in the Integration section of nodes - Allows users to access the Integration (Java Bridge,
BIRT Reports) Tab for nodes.
Go into the Session Clustering section of Nodes - Allows users to access the Session
Clustering Tab for nodes.
Go into the Queue Section - Allows users to access the Job Queues Tab.
Manage Licenses - load and edit licenses.
Use Web Services - Use the web Services API
Go into the Security section of node - Grant permission to go into the specified section on a
node.
Go into the ZDS section of nodes - Grant permission to go into the specified section on a
node.
33
Zend Platform User Guide
User Settings
User settings are retained in the system in several ways:
User Group settings are stored in the configuration database.
Platform's User Management Tab remembers each user’s last settings. The user’s last
settings automatically populate the component fields, when opening any of the sub-screens
and dialog boxes that make up the User Management Tab.
Password Administration
The option to change a password is accessed from Platform | User Management (by selecting a user
and editing the preferences).
Platform Administration Passwords, may contain, between 4-16 characters including the following: the
alphanumeric characters 'a' through 'z', 'A' through 'Z' and '0' through '9' and the special characters () dash, (_) underscore and (.) period
System Passwords
There are three kinds of passwords:
1.
The admin user for the Platform Administration account
2.
The central registration password (you need this password to register a new node)
3.
Each node's ini_modifier/Platform Administration password
Password Specifications
1.
The admin user password and the ini modifier password can be changed from the same
location in: Dashboard |Preferences.
2.
Unix/Linux/Mac users can change their Admin account and the Central registration password
by running the change_gui_password.sh script or change the Admin password only by
running the setup_tool.sh. Windows users can change the password with the Setup Tool Start
| Programs | Zend Platform | Setup Tool.
3.
If you have a node/s on the central machine, then 2+3 (above) are the same.
4.
If you install a node that is registered to a Central Server, then the change_gui_password.sh
script will not be installed and you will not be able to change the ini_modifier password for
the specific node. Moreover, it will be permanently set to be the same as the central
registration password at the time of the registration. Therefore, you will only be able to
change the Central's password which will be in turn automatically applied to the central's
registered nodes.
change_gui_password.sh can be used to change two types of passwords:
change_gui_password.sh --ini -Changes the INI modifier password, which is the password
used to register nodes to the central. This password is also the required password that the
users need to make changes to the php.ini in the GUI.
change_gui_password.sh --admin - Changes the administrator password, which is the
password used to login to the web interface.
34
Zend Platform
Cluster Management
Contents:
Server Management
Restricting Access to Virtual Hosts
Group Management
Change Server
VHost Management
Platform manages clusters to make them available and manageable from a single location - the
Central Server. Platform treats clusters as a single unit for monitoring and management purposes.
Moreover, through the Central Server each node in the cluster can be individually accessed.
(The Central Server aggregates events originating from different servers; however, they include an
identifier for each node on which the Event occurred).
The installation process (and later on the Setup Tool) is used for adding servers to the cluster to
become Nodes belonging to the Central Server. Once users add a server, the server's settings can be
applied and modified using the Central Server.
The following cluster setting options are available from: Platform | Cluster Management:
Manage Servers - Configure, delete and define servers.
Manage Groups - Group servers together for event reporting and configuration purposes.
Manage VHost (Virtual Hosts) - Manually delete and define Virtual Hosts
Figure: Manage Clusters Dialog
Define Event Triggers once the servers have been configured and grouped.
35
Zend Platform User Guide
Server Management
The Manage Servers tab is accessed from Platform | Cluster Management by selecting Manage
Servers.
The Manage Servers tab provides options for configuring and defining settings for servers added to
Platform using the Setup Tool.
Only servers installed with the Zend Platform Setup Tool will appear in the Manage Server tab.
The options available from this tab are:
Add Server
Remove Server
Change Server
Adding a Server
The following procedure describes how to add a server to Platform so that it appears in the Manage
Clusters screen.
To add a server:
1.
Run the Setup Tool (Please see the Zend Platform Installation Guide for details on
Node installation).
2.
Zend Platform automatically identifies registered servers and displays them in the
Manage Servers tab.
3.
The installation script sets the Server Name and users can now define the new
server's settings.
Server settings are defined from Platform | Cluster Management | Manage Servers.
The Server management settings are as follows:
Server Address - The actual hosts address (not editable).
Server Name - The server’s name for identification and all references to the server from Zend
Platform.
Group - Designate a server to an existing group (new groups are added to the list from the
Manage Groups tab).
GUI Directory - States the location of the server’s Platform Administration Installation.
SSL - Check the box if the server uses SSL.
Port - Specifies the port with which the specific server works.
Remove - Removes the server from the database (unregistered) and deletes all events
related to the removed server.
These settings should only be changed if changes that may affect these settings, occurred since the
node installation.
36
Zend Platform
Removing a Server
The following procedure describes how to remove a server.
To remove a server:
1.
Go to: Platform | Cluster Management and select Manage Servers.
2.
Select a server from the list and click "Remove".
3.
Manage Servers will remove the server from Zend Platform and all functionality will
be disconnected.
Attempting to remove a server while another user is working on the server (through Platform), will
activate a prompt message asking the user to select another server. Active Pop-up Blockers may
interfere with this action causing a notification message to appear asking the user to actively select
the "Select Server" option. This message will only appear once furthermore, deactivate all Pop-up
Blockers when using Platform or activate the option to allow Pop-ups from Platform's URL.
Note:
To add a removed server, uset the Setup Tool to re-register:
In UNIX: ...<install dir>/bin/setup_tool.sh
In Windows: Start | Programs | Zend Platform | Setup Tool.
More information on the Setup tool can be found in the Zend Platform Installation Guide.
Changing a Server
The following procedure describes how to re-configure a server after changing the port Apache listens
on. Changing the port Apache listens on means that platform also has to be updated.
To update a server:
1.
Go to: Platform | Cluster Management and select Manage Servers.
2.
Locate the server in the list and manually change the port number click "Save" to
apply the changes.
3.
Go to: Configuration | PHP Configuration and use the search toll to locate the
directive "zend_central.gui_address".
4.
Change the port number in the address and click "Save" to apply the changes.
5.
Restart Apache.
The server is now configured to listen to the new port.
Click here to see how to use user permissions to restrict access to Virtual Hosts.
37
Zend Platform User Guide
Group Management
The Manage Groups tab is accessed from Platform | Cluster Management by selecting Manage Groups.
The Group Management tab provides options grouping servers together for event reporting and
configuration purposes.
Groups are created to:
Aggregate Events across nodes (only if the nodes are running the same Web application).
Enable configurations to be automatically applied to other servers belonging to the same
group (using the Clone Configurations feature).
Facilitate handling and managing groups of servers.
The following procedure describes how to create a new group.
Groups should only be aggregated when the PHP application on all servers in the group is identical.
To create a new group:
1.
Go to Platform | Cluster Management and select "Manage Groups".
2.
Give the Group a name and click "Add" to add the group.
A new group will be added to the list below.
3.
If you want to aggregate all events that occur on the servers associated with the
specific group select the 'Aggregated' option.
Click here to see how to use user permissions to restrict access to Virtual Hosts.
38
Zend Platform
VHost Management
Manage VHosts tab is accessed from Platform | Cluster Management by selecting Manage VHosts.
The Manage VHosts tab provides a way to manually define Virtual Hosts.
In general, virtual hosts are automatically added based on Event activity. However, Virtual Hosts only
appear in the lists after an event is generated for a specific virtual host.
To ensure that all Virtual Hosts can be visible, an additional option has been added to manually add
Virtual Hosts. This option allows users to create the actual virtual host list for any given server.
Virtual hosts can be added or deleted from this tab.
Virtual hosts are added per server and deleted in one of two ways:
1.
Per virtual host name - do not select a specific server name before adding or deleting the
virtual host.
2.
Per virtual host for a specific server - select a specific server name before adding or
deleting the virtual host.
When deleting a virtual host the database will permanently delete all events related to the deleted
virtual host.
Click here to see how to use user permissions to restrict access to virtual hosts.
Restricting Access to Virtual Hosts
Defining Virtual Hosts provides a way to prevent certain users from gaining access to information
regarding certain Virtual Hosts. This procedure describes how to restrict user access using virtual
hosts. Restricting access to a Virtual Host by user name is an additional level of authorization that is
more precise than granting permissions per server.
To restrict user permissions by virtual host:
1.
2.
Go to Platform | User Management.
Select the User (who should be denied permissions) and click "Edit".
The Edit User Wizard opens (see Adding and Editing Users for complete instructions
on the Edit User Wizard).
3.
In step two make sure the check box next to "No Server Restriction" is left
unchecked.
4.
Select the check box next to the virtual hosts that should be granted access.
This will grant access to the selected virtual hosts only
5.
Click "Finish" to close the Edit User Wizard and return to the User Management
Screen.
39
Zend Platform User Guide
Change Server
The Change Server button is accessed from the Main Info bar (located at the top of each tab) and is
available from features that can be applied to nodes belonging to the cluster.
Platform provides a single user interface for activities that are performed both on the Central (the
cluster governing component) and nodes (servers that have been assigned to the central). The
transparent user interface provides users with the ability to transition between servers.
Note:
The Change Server screen is a pop-up. If you have a Pop-up Blocker activated on your browser, make
sure that pop-ups are allowed for the Platform URL or deactivate the Pop-up Blocker entirely.
The user interface is divided into actions that are performed on the central server and actions that are
performed on a selected node.
The actions performed on the Central server are as follows:
Platform (administration menu): Dashboard, Status, Preferences, User Management, Cluster
Management and license Management.
PHP Intelligence: System Health, Graphs, Event List, Event Triggers Event Actions and
Security.
Session Clustering: Statistics and Settings.
Job Queues: Queues, Jobs and Settings.
Integration: BIRT Reports (The Java Bridge must be up and running on the central server in
order to render the reports).
The actions performed on a selected node are as follows:
Performance: Console, Settings, File View, URLs, Testing and Tuning.
Configuration: Studio, PHP Configuration, PHP Info and Clone wizard.
Integration: Java Bridge.
ZDS: Settings
The Server Indicator displays the name of the server on which you are currently working, the user
name used to log-in, a log-out option and the current date and time.
When on a node, the Server Indicator will add an additional option to change the server. This option
will not appear on when performing actions on the central server.
The following procedure describes how to change the server on which you are working. The "Change
Server" option opens a tree that displays all the available servers that the currently logged-in user is
permitted to view. Servers can be displayed in the tree by Groups or alphabetically.
To change a server:
1.
Click "Change Server".
2.
Choose a Server from the list and click Select.
3.
If you cannot see a specific server, it is possible that you do not have the correct
user permissions, in that case go to: Platform | User Management and check to see
40
Zend Platform
if your User has a "Server Restriction". Alternately, contact your System
administrator to grant access to this server through your Platform user permissions.
Platform will "remember" the last server selection for the next log-in.
41
Zend Platform User Guide
License Management
Contents:
Manage License
Updating a License
Acquiring a License
About License Management
The License Management tab (Platform | License Management) allows you to manage licenses and
view their status. the License Management tab is a central management tab for all the nodes
governed by the Central Server.
There are four different types of licenses available for Platform:
Production-Enterprise: The Enterprise Server includes the performance management features
along with Session Clustering, Job management and Integration tools for Multi-Cluster
enterprises.
Production-Performance Management: The Performance Management Server includes the
Platform, PHP Intelligence, Performance and Configuration tabs. This version is suited for
production environments that can benefit from the information collected in events and the
performance optimization tools.
Development-Enterprise: The Enterprise Server is a full featured development version. This
version includes features that can assist in the development lifecycle (PHP Intelligence and
Performance) and provide an environment suitable for developing multi-cluster enterprise
web applications (Session Clustering, integration with Studio, Actuate Reports etc.).This
license is suitable for development environments and licenses a single Central Server
(without additional nodes).
Trial: A 30 day fully featured evaluation version of Platform. After the 30 days, only the
Server functionality for remote debugging and tunneling will continue to work without a
license.
42
Zend Platform
Manage License
The License Management tab is accessed from Platform | License Management.
The Manage License screen, displays a summary of all the licenses by type and if they are Active
(valid) or Expired. The summary includes details about the number of licenses by type and total
quantity of licenses. Licenses that have errors in them (for example: a corrupted license file) are
included in the Expired license summary.
Below the License Summary is a detailed table that displays the details of each license, per server.
The actions that can be performed through the table are: sort, acquire license and update information.
1.
Sort: rearranges the licenses displayed in the table, by a selected column. To do so, click the
column heading and the contents of the table will be automatically sorted by server name,
type, status or expiration date.
2.
Acquire License: This option is used to obtain and install license files. This option should be
used to activate new licenses for each server that appears in the list. Once the license has
expired use this option again to update the license.
3.
Update Information: Updates information for a specific node to the Central Database.
To manage your licenses:
Go to Platform | License Management. The License Management screen will appear.
Figure: License Management Tab
This screen displays the names of all servers (servers that are currently available and servers that
were once connected), related statistics, license type and Platform license status.
From this screen you can:
Update All Information: Located in the top right corner of the screen, this button reads the
license data from all the nodes and updates the Central Database. This action has to be done
after making changes to the node licenses. This button should be used when you need to
update all the nodes. If you need to update only a specific node, use the Update Information
option.
43
Zend Platform User Guide
Update Information: Located in the license details table, this button reads the license data
from a selected node and updates the Central Database. This action has to be done after
making changes to the node's license. This button should be used when you need to update a
selected node. If you need to update all the nodes, use the Update all Information option.
44
Acquire License: obtain and attach a license file to a specific server.
Zend Platform
Acquiring a License
The acquire license option is available from Platform | Manage License when clicking Acquire License
in the licenses.
The following procedure describes how to acquire a license.
To acquire a license:
1.
Go to Platform | License Management.
2.
Click on the "Acquire License" icon corresponding to the server that requires a
license.
The "Acquire License Wizard" will appear.
Figure: Acquire License
2.
The Acquire License screen includes 5 steps, follow the instructions in steps 1-3 in
order to obtain, store and upload your license file.
3.
Once the license file is put into place follow step 4 and restart the designated server
(if the license is for a node the designated node should be restarted.
4.
After restarting the server use step 5 to update the server with the new license's
information.
The Server's status in the table should change to show the uploaded license type, if this does not
happen, open a ticket with support at: http://www.zend.com/en/support-center/.
45
Zend Platform User Guide
Updating a License
The option to update a license is available from Platform | Manage License. License settings should be
updated each time a license file is changed.
Before updating your license make sure the new license is placed in the correct location. The proper
location is defined by the directive "zend.license_path" the default setting is
/usr/local/Zend/Platform/etc/licenses (for i5 users the location is usr/local/Zend/)
The following procedure describes how to update a license.
Note:
The recommended action is to remove the old/trial license (delete) or change the file's extension
(backup) before placing the new license file in the same location.
To update a license:
1.
Replace the license on the server (see above) and restart the Web Server.
2.
Go to Platform | License Management.
3.
Click on the "Update all Information" button located in the top right corner of the
screen.
The update process will begin.
2.
Once the update process is completed, go to 'License Management' and verify that
the correct license data has been updated.
The new license has been successfully updated.
46
Zend Platform
PHP Intelligence
Contents:
Event Trigger Settings and Analysis
Event List
Why Configure Event Triggers?
Event Triggers
Finding Events that Interest You
Security
The Problem Resolution Lifecycle
Event Actions
System Health
Event Details
Graphs
PHP Intelligence provides a means for monitoring activity on clusters and servers.
PHP Intelligence Includes:
System Health - provides an up-to-date "snapshot" of events monitored by Platform
categorized by Host and Event Type.
Graphs - display Event relates information in a graphical representation.
Event List - a table of events that includes events that occurred during a user-defined time
frame. The information displayed in the Event List can be filtered by Events From, Event
Type, Virtual Host, Alert Severity, Status, and Time Filter. You can also find a specific Event
by ID.
Event Triggers - define and/or change triggers for monitoring events on a specific node. From
this screen you can: configure Event Triggers, view Event Triggers currently defined for the
node, and filter the view of events displayed in the Define Event Triggers table.
Security - control the information collected for events by eliminating potentially unsecured
data from event details.
Event Actions - apply actions to triggered Events, send to URL or mail or SNMP trap.
Event Details - view and diagnose event related information.
47
Zend Platform User Guide
Event Trigger Settings and Analysis
Initially Platform Event settings are based on predefined default parameters. As such these settings
require calibration to suit specific environments. The anticipated results are Event Details generated
based on default triggers. Running Platform for the first time will most probably cause abnormal event
generation behavior (too many or too little events).
This behavior is attributed to two causes:
1.
The Default triggers need to be calibrated.
2.
The PHP needs to undergo additional performance Optimization.
Before making any adjustments to the PHP code that may turn out to be unnecessary, first calibrate
PHP Intelligence.
Calibrating Event Triggers for Performance Optimization
Calibrating PHP Intelligence is the process of adjusting Event Triggers to accommodate a specific Web
application.
Event Triggers are calibrated from PHP Intelligence | Event Triggers.
Note:
Rules are configured on a selected server and can be subsequently applied to additional nodes with
the Clone Wizard. This option should be used in node cluster environments.
When calibrating Event Triggers for performance optimization, the following performance-related
event types should be addressed:
Slow Script Execution (Absolute and Relative) - generates an event when script
execution exceeds defined limits
Slow Query Execution - generates an event whenever database related functions exceed
the threshold defined in the event.
Slow Function Execution - Generates an event when a specified PHP function’s execution
time exceeds the threshold defined in the event.
Excess Memory Usage (Absolute and Relative) - Generates an event when memory use
for PHP script execution is above or below average.
These event types are performance related indicators. Each one of these events should be configured
to generate an Event according to your environments performance requirements. Events generated
following calibration indicate that certain areas of the application are not performing according to your
requirements and need further investigation.
Investigating Performance Related Events
Performance related events are investigated when events continue to occur after initial calibration.
The contents of Event Details provide in-depth diagnostic information and tools for investigating the
occurrence. A generated event does not necessarily indicate a problem with the PHP Code, it can also
indicate that the Event Trigger settings need to be adjusted or the PHP code should be reevaluated.
The most effective performance diagnostic tool is the Studio Profiler. The Studio Profiler is a Studio
component that can be employed on Event Detail information through Platform’s integration with
Studio.
48
Zend Platform
Profiling PHP Code with Studio
Running the Studio Profiler on PHP code provides time-related snapshot of the Code’s overall
performance. Profiling is a Studio component for analyzing PHP code. When profiling, the event’s
information is transferred from Platform to Studio. This information includes all the information
necessary to precisely recreate of the actual occurrence that generated the event. The Studio Profiler
is so accurate that this process is paramount to running the Profiler when the event originally
occurred. Profiler information is generated by, placing timers within the code and running them over
and over. The profiling tool is able to build a "profile" of how fast or slow specific areas of the
application will run.
The Profiler is activated through Event Details from the Zend Studio Diagnostics section by selecting
the option, Profile URL.
Figure: Event Details - Zend Studio Diagnostics, Profile URL
The Profiling process takes place in Studio and automatically opens the Profiler results.
Note:
Studio has to be installed and running to profile code. Also, the Server settings have to be configured
in Core or Platform to allow connectivity between Platform and Studio .
Understanding Profiler Results
Based on the information provided with the Profiler, developers can identify the cause for the
performance problem and implement changes to the code accordingly.
The Profiler user interface contains 3 tabs:
Profiler Information - provides general information on the profiling duration and date,
number of files constructing the requested URL and more. In addition, it displays a Time
Division Pie Chart for the files in the URL.
Function Statistics - provides you with the list of files constructing the URL and detailed
information on functions in the files.
Call Trace - provides a hierarchical display of functions according to process order, enabling
you to jump to the function, view the function call, function declaration, details and more.
Note:
Additional information about the Studio Profiler can be found in the Zend Studio Online Help.
To perform in-depth examinations of slow code or functions the Studio Debugger can be used to
debug information in the occurrence’s relevant context.
The Debugger is also activated through Event Details from the Studio Diagnostics section by selecting
the option, Debug URL.
Figure: Event Details - Studio Diagnostics, Profile URL
49
Zend Platform User Guide
This completes the description of the investigation and diagnostics tools that can be used to identify
performance bottlenecks in the code. The next step is to see what performance tools can be applied to
optimize the Web application’s performance.
Why Configure Event Triggers?
Event Triggers are an essential tool for pinpointing bottlenecks in Web applications. Events not only
indicate that one of the thresholds was breached they also collect information relevant to the
occurrence to provide a full audit-trail for diagnostics.
In terms of the outcome, these thresholds can be directly translated into performance issues the end
user may encounter. Therefore, the more Events resolved the better the application will run.
By using Event Triggers, scripts can be monitored to identify with precision the number of milliseconds
or percentage it takes to execute a script. This identification is based on parameters that you can
determine as acceptable performance thresholds.
Finding Events that Interest You
Platform provides several ways for viewing Events that occur; each way has different advantages and
can be used to suit different requirements as follows:
Platform | Dashboard | Events at a Glance displays the top five events that occurred, on
all the servers. Double clicking on an Event in the Console opens its Event Details screen.
PHP Intelligence | System Health displays an up-to-date "snapshot" of events monitored
by Platform and listed by server and Event Type. Selecting a Location (Node) or a specific
Event Type automatically filters the view to display relevant Events in the Event List.
PHP Intelligence | Event List is a filterable display for viewing events in a table according
to various parameters. Choosing "Change Table Fields" modifies these parameters. This
opens a selection list of all the possible field options. This window also includes an option to
locate events by their Event ID.
Platform | Dashboard |Configuration and Management Tools | Event Actions for
sending events of a certain type to e-mail or URL according to predefined rules. This provides
a proactive means for sharing information either with parties that need to be informed when
certain events occur (e-mail) or for integrating event information to other applications (URL).
For example: a manager may only want to know about Severe PHP errors that indicate some
or all of the Web application is not working. Setting an Event Action to send event
information by e-mail means that this manager is immediately informed of the event, as long
as the e-mail account is accessible
Note:
Read more about how your organization can leverage information generated by events in the Tutorial
- Integrating Existing and Legacy Applications.
50
Zend Platform
The Problem Resolution Lifecycle
Developing and maintaining Web applications is an intricate and highly demanding process. Platform
facilitates the intricacies of the development process by employing an efficient problem resolution
infrastructure "The Problem Resolution Lifecycle". This infrastructure’s main goal is to help make the
most out of challenging environments and tight schedules and prevent problematic issues from falling
unnoticed.
With the Problem Resolution Lifecycle, organizations can improve communication between the
development, testing and IT teams to streamline the development and deployment processes.
Using PHP Intelligence in development and production environments unifies the working environment
and ensures improved information collection and distribution between development teams, testing
teams and IT teams (See illustration below).
Figure: Problem Resolution Lifecycle
Using Platform in your working environment ensures that pertinent and focused information reaches
the right person at the right time. The enhanced information exchange results in major improvements
in quality of code, time to production and overall performance and stability. The subsequent benefit is
more resources dedicated to activities focused on improving and expanding the current application
and less time spent on locating information necessary for recreating and resolving code and
performance issues
In the Problem Resolution Lifecycle, PHP Intelligence assists the efforts of the development, testing
and IT teams to quickly pinpoint, analyze, and resolve issues such as: PHP Slow Script Execution,
Function Errors, Database Errors etc.
Figure: Problem Resolution Workflow
51
Zend Platform User Guide
Zend Platform’s PHP Intelligence functionality is enhanced by:
Implementing customized Event Rules to areas prone to problems in your unique
environment - facilitating focused and efficient problem resolution.
Analyzing "Full Problem Context" grants a detailed insight of problematic occurrences.
Integrating with Studio to resolve problems with state-of-the-art development and debugging
tools.
The Problem Resolution Lifecycle is based on a process of defining PHP Intelligence Event Triggers
according to acceptable run-time, performance parameters. PHP Intelligence enforces Event Triggers
and issues Event information in an Event Details screen according to the Event Trigger definitions.
When an Event occurs, PHP Intelligence compiles a complete profile of the Event’s occurrence and its
precise details. An Event Details screen includes comprehensive details in order to enable developers
and testers to recreate the Event in a way that mirrors the conditions of the original occurrence. This
information can then be used to diagnose problems by fine-tuning Event Triggers to accommodate
normal occurrences or resolve actual run-time problems and errors.
With Studio Diagnostics, problems and errors can be easily diagnosed using the Event Details screen
functions, Test URL and Profile URL, and further information can be analyzed using Debug URL and
Show Source Code. In addition, problems in code can be immediately resolved using the Studio Editor
which allows changes to be immediately made and deployed, not only to a single server but also to all
nodes belonging to the same Group.
Events can be preserved to leave an indicator of these occurrences if necessary. Furthermore, user
permissions can define who is permitted to perform actions inside an Event Details screen; enforcing a
structure that encourages communication between the different teams.
52
Zend Platform
System Health
The System Health tab is accessed from PHP Intelligence | System Health.
The most comprehensive way to view and manage events is through the System Health screen. The
System Health sub-screen provides an up-to-date "snapshot" of events monitored by Platform. Events
are displayed in a filterable table, which is updated by manually refreshing the browser (Clicking
) or by setting automatic refresh rate in Platform | Preferences, Auto refresh the System
Health). The System Health table includes events categorized by location (server/group) and event
type.
Figure: System Health Screen
To view the System Health table:
1.
Go to PHP Intelligence | System Health.
2.
Select the "Filter By" option to filter events displayed in the table.
Filter options are described in detail below.
3.
Click "Go" to display the System Health table.
The fields that make up the Event Summary table are as follows:
Location - Where the event occurred.
PHP - Current PHP events for the selected Host.
Server - Overall events related to general server performance.
Database - Events related to database query handling.
End User - The output size; field includes status information about output size.
Filtering Table Data
Zend Platform allows you to filter the event information displayed in the System Health table.
There are four group options:
1.
All - Displays System Health information for all servers (and groups).
2.
Ungrouped - Displays System Health information for servers that do not belong to a specific
group.
3.
Server by name - Displays System Health information for the selected server group only.
53
Zend Platform User Guide
4.
Aggregate servers - Aggregates the servers belonging to the same group into one row.
To filter the data displayed in the System Health table:
1.
Select Filter By to expand the filter options and select the group name by which to
filter.
2.
Click "Go" to display the filtered results in the System Health table.
Aggregation Groups
Event aggregation / reporting is the process of identifying events that were generated for the same
reason and can be reported as one event that occurred X times rather that reporting multiple
occurrences of the same event.
There are two options for aggregating events:
1.
By Server
2.
By Group
Aggregation by group happens when several servers are placed in a group that is defined as
"Aggregated” (Platform | Cluster Management | Manage Groups).
At the bottom of the System Health table there is a message stating that:
(*) Events that took place on the server before the server was a member of an aggregated group.
Aggregation by server happens when identical events are generated on different servers. The same
event is reported (for each server) separately. This is the default.
Event information can only be aggregated at the time of the occurrence and for information integrity
purposes will not be retroactively aggregated. Therefore, events that occur on individual servers (ungrouped) before they were grouped will be reported as un-aggregated events.
54
Zend Platform
Graphs
The Graphs tab is accessed from PHP Intelligence | Graphs.
Platform includes an option to display event related information in a graphical representation (Pie and
Bar graphs).
Graph Behavior
The Platform graphs display general statistics about event segmentation. All graphs display tool-tips
with a description of the results displayed in the graph.
Graphs are viewed from two different locations:
1.
Platform | Dashboard (only Pie Charts)
2.
PHP Intelligence | Graphs
The following lists the available list of graphs, their display type and other additional information:
Top 5 Events by Aggregation Hints - Pie Chart
Top 5 Events by Event Type - Pie Chart, Drill down to view a list of events relevant to the
selected part of the chart
Top 5 Events by Location - Pie Chart, Drill down to view a list of events relevant to the
selected part of the chart.
An asterisk (*) next to the name of a server indicates that the statistics contain numbers
about events that took place on the server before the server was a member of an aggregated
group.
Top 5 Events by Script - Pie Chart
*Total Events by Hour - Bar Graph
*Total Events by Month - Bar Graph
*Total Events by Weekday - Bar Graph
* These graphs can only viewed from PHP Intelligence | Graphs
Figure: Bar Graph and Pie Chart
55
Zend Platform User Guide
Generating Graphs
This procedure describes how to generate graphs. Regular pie charts do not require any additional
actions in order to generate a graph. However, bar charts display information based on a specific
parameter therefore, a parameter has to be selected and defined in order to generate a Bar Chart
representation.
To generate a Bar Chart:
1.
Go to PHP Intelligence | Graphs.
The Graphs screen opens.
2.
Select one of the bar chart options: Total Events by Hour, Total Events by Month,
and Total Events by Weekday.
The display changes to add input fields to select the range for the Graphs.
3.
Define the range and click "Generate Graph".
The graph will be generated and displayed on screen.
56
Zend Platform
Event List
Contents:
Database Maintenance
Change Virtual Host
The Event List tab is accessed from PHP Intelligence | Event List.
The Event List is a filterable table that displays Events that occurred within a user definable period of
time.
Information displayed in the Event List can be displayed as follows:
Events can be filtered by the following categories: Events From, Event Type, Virtual Host,
(Event) Severity, Status, Time Filter and URL.
Events can be located in this screen by the event’s ID.
Columns in the Event List table can also be customized (Use Change Table Fields).
Specialized filters can be created and saved using the Manage Filters option.
Filtering by Virtual Host
Several servers can be added to a user-defined group and used to filter the display to show Events
that occurred on a specific selection of servers.
To define a virtual Host name that will be added to the list in the filter, go to the Virtual Host filter
field and choose "Selected". This option opens the Change Virtual Host screen.
The Manage Filters section allows users to save user defined filter definitions.
To save user defined filter definitions:
1.
Define the filter settings in the Filter By section.
2.
Select Manage Filters to expand the filter management options.
3.
Enter a user defined name for the filter and press Save to add the new filter.
4.
Use Load Filter each time you want to use a user defined filter.
5.
Use Remove Filter to delete filters from the Load Filter List.
The filter section of this screen also includes a search field for searching for a specific Event by ID.
Zend Platform also allows you to change the table fields displayed on-screen. (Click "Change Table
Fields "and select the fields you want to view from the list).
Working with the Event List
This procedure describes how to work with the event List.
To view the Event List:
1.
Go to PHP Intelligence | Event List.
2.
Select the "Filter By" option you wish to apply to the table.
Filter operations appear as follows:
•
Events from - Filter Events according to grouping definitions. These definitions list
events according to where they were generated (in the PHP, Database) or what type
57
Zend Platform User Guide
of event (slow response, error). The values are: All, Bandwidth-Other, Web serverOther, PHP-Slow Response, PHP-Error, PHP-Other, Database-Slow Response,
Database-Error
•
Event Types - Filter Events displayed in the table according to event type. The
values are: All, Slow Script Execution (absolute/relative), PHP Error, Java exception,
Function Error, Slow Function Execution, slow Content Download, Maximum Apache
Processes, Excess Memory Usage (absolute/relative), Database Error, Slow Query
Execution, Inconsistent Output Size, Load Average, Custom Events, HTTP Error.
•
Virtual Hosts - View Event information for either All hosts or selected hosts. Click
Selected to open the Change Virtual Host Selection dialog box. All, Selected or
predefined user selections.
•
Severity - Filters Event information according to severity. The values are: All,
Moderate, Severe
•
Status - Filters information displayed in the Event List according to the Event’s
handling status. The values are: All, Opened, Closed, Ignored
•
Time Filter - Filters information displayed in the Event List according to a userdefined time frame. The values are: All, Past Hour, Past Day, Past Week, Past Month
•
Find Event by ID - Finds (and displays) an event with a specific ID number. (By
entering an event id and clicking "Find"). The values are: Sequential numbers that
were assigned to Event Details.
•
Filter by URL - This is a free text field for filtering events generated from a specific
URL.
3. Click Go to display filtered events in the Event List table.
Figure: Event List
58
Zend Platform
The Following list describes the fields that make up the Event List.
ID - Sequential number assigned to an event.
Event Type - A descriptive name assigned to the event.
Count - Number of occurrences of the event.
First Occurrence - Date and time of event’s original occurrence.
Last Occurrence - Date and time of event’s most recent occurrence.
Location - The name of the server or Aggregated Group where the event occurred.
Vhost - Name of the Vhost where the event occurred.
URL - The URL where the event occurred.
Source File - Path to PHP source file.
Line - Line in code where event occurred.
Aggregation Hint - The hint in the code that caused the event to be aggregated.
Function Name - Name of PHP function where event occurred.
Status - Status of the event.
Severity - Severity of the event.
Actions that can be performed on the events in the Events Table:
To apply one of these actions to an event/events select the event by checking the check-box next to
the events:
Delete - Deletes the Events form the database.
Ignore - A new Event Details screen will not be created for this specific - occurrence
Additional occurrences of this event will be added to the original Event's details.
Close - Changes the status of the event to "Closed" and preserves the Event in the Database.
If the same event occurs again a new Event Details screen will be created.
Preserve - Preserve the selected event from being deleted during Database cleanups.
Reopen - Changes the status of ignored or closed events to "Open". This option is available
from the Event details i.e. double-click on an Event in the list to view the details and clicking
Reopen from the Buttons located at the bottom of the Event Details.
Note:
The default value for database cleanup is 7 days.
Depending on the operating system database cleanup settings can be changed in:
for unix/linux/mac the file location is:<install_dir>/etc/php-embed.ini and for windows is:
<install_dir>\etc\php-embed.ini
59
Zend Platform User Guide
Database Maintenance
Once the cause of the event has been fixed, we can decide what to do with the event: Preserve,
Ignore or Delete. If no actions are done to an event, it will be automatically deleted from the
database.
Apart from closing events, other additional advantages can be obtained by customizing user
permissions. Granting different users separate authorizations, by configuring different user
permissions can facilitate different organizational requirements such as enforcing responsibilities and
work structures. For example: by providing 'Read Only" authorization to people who only need to see
event details and granting authorization to Close events only to those who should close events (such
as managers or team leaders) we can create and maintain a structured working environment.
The Event List provides four options for handling events in the system:
Close Event - Closes the event (i.e., changes the event status to closed). Therefore, if this
event occurs again, Platform will open a new event.
Ignore Event - Ignores future instances of this event (i.e., changes the event status to
ignore). Therefore, if the same event occurs again, Platform will not open a new event.
Delete Event - Deletes the event (i.e., removes the event entirely from the database.)
Manual Override - Users can also manually change the status of an event by clicking on the
event in the Event List and changing its status. This method is helpful, for example, if you
want to "un-ignore" an ignored event and restore it to the main screen.
60
Zend Platform
Change Virtual Host
To access this option go to PHP Intelligence | Event List, this option is activated when using the filter
and selecting to filter by "Virtual Host".
This procedure describes how to change a Virtual Host. Use this option to add several servers to a
user defined group and help filter the Event List to show Events and Alerts that occurred on a specific
selection of servers.
To create a virtual Host:
1.
Choose the servers from the tree.
2.
Name the current selection.
3.
Click "Save".
To view a Virtual Host’s settings:
1.
Select a Virtual Host from the Load Selection field.
2.
Click "Load".
Virtual Hosts can be deleted by clicking "Remove Selection".
61
Zend Platform User Guide
Event Triggers
Creating Events
Contents:
Filtering Event Triggers
Choosing and Defining Event Triggers
The Event Triggers tab is accessed from PHP Intelligence | Event Triggers.
Event generation is an out-of-the-box feature. Directly after installation, Platform’s PHP Intelligence
will begin to monitor events according to Default Settings. To further enhance the effectiveness of PHP
Intelligence, events thresholds can be customized. In a similar manner thresholds can be gradually
modified to not only reflect improvements in performance but also to verify that problematic issues
have been resolved.
Configuring Events
Events can be configured according to each environment’s specific requirements. The main
configuration changes that should be done are to do with tuning Event Trigger values and defining a
list of Functions and PHP errors to be monitored.
To Configure Event Triggers:
Go to PHP Intelligence | Event Triggers and change the default settings according to your
requirements.
A help button
appears next to each Event Type. Pressing this button will display a
description of the selected Event and the Event’s parameters (alternately go to Choosing and
Defining Event Triggers).
Disabling Events (Triggers)
In some cases there may be Events that are either not applicable to your system or unnecessary.
Events are disabled from the PHP Intelligence module. When an event is disabled the event will not be
monitored and no event information will be stored.
To disable Event Triggers:
1.
Go to PHP Intelligence | Event Triggers and select "Configure Event Triggers".
2.
In the Define Event Triggers Table, the Check box in the Active Column indicates if
an Event Type is monitored or not.
To prevent a selected Event from being monitored, disable the Rule by de-selecting the Check Box.
This will deactivate and stop collecting event related information.
List Entry of Watched Functions
Platform allows you to monitor a list of functions by referencing a text file that includes the functions
you wish to monitor. Users who must monitor large numbers of functions will find this method of
defining watched functions a convenient alternative to editing the 'php.ini' file line by line.
Use the following PHP functions to reference a text file containing the list of functions to monitor.
The following function is typically used to create a list of functions to watch. It forms part of the
'php.ini' file.
62
Zend Platform
zend_monitor.watch_functions=mysql_connect,mysql_query
The following function refers zend_monitor.watch_functions to a text file at a specific location. This file
contains the list of functions to monitor.
Note:
Functions returning 'null' as an expected result, should not be included in this list.
UNIX, Linux, i5/OS and Mac:
'zend_monitor.watch_functions=@<installation_dir>/lib/watch_funcs.txt'
'zend_monitor.watch_results=@/<installation_dir>/lib/watch_res.txt'
Windows:
'zend_monitor.watch_functions="@<installation_dir>\lib\watch_funcs.txt"'
'zend_monitor.watch_results="@<installation_dir>\lib\watch_res.txt"'
(In Windows the quotes must be present)
The text file should contain one function name per line.
Example:
mysql_connect
mysql_pconnect
mysql_query
mysql_db_query
mysql_unbuffered_query
User functions can also be included in the Watch Functions file. Each user function must be added with
its Class (class::function).
If necessary, inheritances should also be included in the file as only functions explicitly specified in the
Watched Functions file are watched.
63
Zend Platform User Guide
Filtering Event Triggers
The Filter Events option is accessed from PHP Intelligence | Event Triggers.
The following procedure describes how to filter event triggers. Platform is equipped with Events for
monitoring performance and script execution. The default Event Trigger display is a non-filtered view
that shows all the available Alerts. A filter is provided to allow displaying a selection of events by type.
To filter events:
1.
Click "Filter By" to expand the filter list.
2.
Use the two drop-down fields to select the Events to display by:
•
Events from - The area where the event originated (script, database, web
server, etc.)
•
Event Types - Filter view to display Events according to their Event Type (The
selection changes according to the area chosen in the "Events From" field).
3.
Click "Go" to filter the view.
A list of events matching the search criteria will be displayed.
64
Zend Platform
Event Types
Choosing and Defining Events
The Event Triggers feature is accessed from PHP Intelligence | Event Triggers.
The fields that make up the "Configure Event Triggers" table are:
Event Type - The type of event under the rules defined, will produce an alert in the
monitoring system.
Active - When enabled for a specific event, Zend Monitor (node) will report alerts when they
occur (This gives the user the right to disable an event for a particular server).
Rules - Defines the conditions under which an event will produce a report. For example,
(Red) Script Runtime Exceeds 500 Seconds means that the system will generate a critical
(red) event-for Slow Script Execution (Absolute) type events, when meeting the condition (>
500 sec.).
Note:
Define thresholds for both moderate and severe events although, some events have only one level of
severity (like function error).
To define whether Zend Monitor will report a specific event, enable/disable the event in the
Active column of the Define Event Triggers table.
To save the changes to Event Trigger definitions, click Save Rules.
The database will update with the changes.
Each event type has its own advantages and characteristics.
Note:
Events marked as "Performance Monitoring Events" have a special role in optimizing web application
performance. See "Implementing the Performance Lifecycle".
Each Event Type has its own advantages and characteristics. Listed below are the different Event
Types, their descriptions and recommended usage.
The following is a list of event types, click on the event name for more information about a specific
event:
Slow Script Execution (Absolute and Relative) - Generates an event when executing a script
exceeds defined limits or is lower or higher than the average script execution time.
PHP Error - PHP Errors are used to identify all types of PHP errors. This type of event is useful
in QA processes to identify problems that may have slipped through the cracks during
production.
Java Exception - Java exception events increase the visibility of issues originating from the
Java Side by indicating when uncaught Java exceptions occur in Java Code invoked from PHP
using the Java Bridge.
Function Error - Generate a severe event when an error in one of the specified PHP Functions
occurs
Slow Function Execution - Identify bottlenecks within functions.
65
Zend Platform User Guide
Slow Content Download - Slow Content Download Events identify slow downloads that are
related to download performance that can directly influence Web server performance and
download times.
Maximum Apache Processes Exceeded - Maximum Apache Processes Events detect Apache
Process activity that can directly influence Web Server Performance and indicate activity
peaks.
Excess Memory Usage (Absolute and Relative) - Identify when scripts are using excess
memory that can hinder the application's ability to perform.
Database Error - Report database-related function fails.
Slow Query Execution - Identify database performance slow queries that can directly
influence Web server performance.
Inconsistent Output Size - Verify the script is sending the same size of output each time,
taking into consideration a margin as defined in the event's settings.
Load Average - Monitor the overall health of processes running on the server.
Custom Events - Generate an event whenever the API function monitor_custom_event() is
called from a PHP script.
HTTP Error - HTTP Error events detect broken links and other application-level malfunctions
by indicating when HTTP errors occur when trying to access a Web page.
66
Zend Platform
Slow Script Execution (Absolute and Relative)
This is a performance-monitoring event.
Absolute Slow Script Execution is used to generate an event when executing a script exceeds defined
limits. This function is used to maintain performance standards.
Default parameters are 500 msec for moderate, 2000 msec for severe alerts.
Relative Slow Script Execution generates an event when script execution is lower or higher than the
average script execution time. Parameters should be set to a certain percentage for moderate and
severe alerts. The default values for this event type are set to 0. To generate events, configure these
settings to a value that suits required script run-time.
Additional Rules:
Suppress in case a "Slow Function Execution" event occurs. Selecting this option ignores
"Slow Script Execution" events caused by a slow function. This is to prevent double reporting,
as PHP Intelligence will report these events as "Slow Function Execution" events.
Suppress in case the load average is above X - Selecting this option ignores events that occur
when the average number of active processes waiting for CPU time is above x active
processes (3 active processes is the default value).
Note:
These additional rules are applied to the Absolute and Relative Slow Script Execution event types.
Relative Events:
Event definitions are based on relative values i.e. percentage. Relative values are set according to
warm-up settings, default value of 500 requests. If necessary, modify the default value by
changing the zend_monitor.warmup_requests directive in the 'zend.ini'.
The warm up period is per "top script" and there is a warm up for each script after every Apache
restart.
67
Zend Platform User Guide
PHP Error
PHP Errors identify all types of PHP errors such as:
Hard errors that cause stops in page execution.
Warnings that interrupt the end user experience.
Notices that could lead to larger problems.
This type of event is useful in QA processes to identify problems that may have slipped through the
cracks during production. Production environments can benefit from using this PHP Intelligence
feature to alert administrators about runtime errors in their application that could seriously impact the
end user's experience.
Description:
Used to generate severe or moderate events on selected PHP errors, when they occur, and identify
real-time failures for given users.
To select a PHP Error Level, scroll through the selection and use CTRL for multiple selections. The
trigger type list is the same; therefore severe event selection takes priority over moderate event
selection.
Additional Rules:
Event reporting for PHP errors can be changed by setting error reporting to 0 or using the silence
operator @.
There are three options for activating Additional Rules:
1.
Always Report Errors - Ignore the error-reporting setting and the silence operator and report
all PHP errors.
2.
Report errors that match the error-reporting criteria - Ignore all PHP errors silenced using
either the error-reporting setting or the silence operator.
3.
Report any errors not silenced with the operator @ - Ignore the error-reporting setting and
only ignore errors silenced with the silence operator.
68
Zend Platform
Java Exception
Java exception events increase the visibility of issues originating from the Java Side by indicating
when uncaught Java exceptions occur in Java Code invoked from PHP using the Java Bridge.
This Event identifies uncaught Java Exceptions and provides Java related backtrace information of the
occurrence as including information regarding the location in the PHP code that triggered the error.
Description:
Generates an event each time a Java Bridge related Java Exception occurs.
Note:
Caught Java exceptions are considered part of normal exception flows therefore only un-caught
exceptions are reported.
69
Zend Platform User Guide
Function Error
Functions return Function Errors and therefore offer specific information about the root of the error
that does not always arise from PHP errors.
QA and Production use this Event for identifying run-time events, as opposed to PHP errors that
identify code-related/syntactical events.
Function Errors can prove to be invaluable to an organization as they provide a different perspective
on problems (view the outside problems through the eyes of PHP). Despite the fact that the code may
be running okay, this Event indicates what other outside problems (i.e. network, database, web
services, file system etc.) you may have, based on the PHP function’s behavior. Issues like these used
to be difficult to reproduce however with the complete audit trail and full problem context, Function
Errors can be easily reproduced to a level of accuracy that mirrors the actual time of occurrence.
Description:
Generate a severe event when an error in one of the specified PHP Functions (built-in or user-defined)
fails (returns a FALSE value).
To add a function, enter the name into the + field and press Add (+).
There are three ways to monitor PHP functions:
1.
Specify the function name, object methods can also be used (for example, bar::foo).
2.
Use wild cards (*) to specify a range of function names for example myFunc_* will select all
functions beginning with myFunc_.
3.
Specify the full path to a file containing a list of functions, each in a new line.
Note:
Database related functions are directed and reported as Database Errors (see the "Database Error"
event type).
Watched Functions File Event Types
The Watched Functions file can add Function Error and Slow Function Execution event types (PHP
Intelligence | Event Triggers) by entering a function in the field and pressing Add or specifying the full
path to a file containing a list of functions.
When users apply the Watched Functions file to the "Function Error" Event Type, the functions
included in the file will be monitored and an Event Details screen will be generated.
70
Zend Platform
Slow Function Execution
This is a performance-monitoring event.
Slow Function Execution identifies bottlenecks within functions providing a more granular approach
than finding bottlenecks in pages.
This type of event is useful in the production process for pinpointing performance bottlenecks by
watching functions that the user specifies.
Slow Function Execution events provide a different perspective on problems (view outside problems
through the eyes of PHP). Despite the fact that the code may be running okay, this Event indicates
what other outside problems (i.e. network, database, web services, file system etc.) you may have,
based on the PHP function’s behavior. This Event is also useful for catching pure PHP functions that
are performing slowly.
Description: Generates an event when function execution exceeds the setting defined in the rule. The
default values are, 500 msec for moderate, 1000 msec for severe alerts. This applies to the functions
selected in the additional rules section.
Additional Rules:
Generate events for specified PHP functions (built-in or user-defined).
There are three ways monitor functions:
1.
2.
Specify the function name. Object methods can also be used (for example, bar::foo).
Use wild cards (*) to specify a range of function names for example mysql_* will select all
functions beginning with mysql_.
3.
Specify the full path to a file containing a list of functions, each in a new line.
Note:
Database related functions reported as Slow Query Execution events (see the "Slow Query Execution"
event type).
When applying a Watched Functions file to "Slow Function Execution" events, the functions included in
the file are monitored and Event Reports are generated when the function execution exceeds the
values defined to trigger a moderate or severe event.
71
Zend Platform User Guide
Slow Content Download
This is a performance-monitoring event.
Slow Content Download Events identify slow downloads that are related to download performance that
can directly influence Web server performance and download times.
Slow Content Downloads, if not pinpointed, can bring the server down by causing excess download
activity causing slower response times.
Slow Content Download Events provide a different perspective on problems (view outside problems
through the eyes of PHP). Despite the fact that the code may be running okay, this Event indicates
what other outside problems (i.e. network, database, web services, file system etc.) you may have,
based on the content download’s behavior.
Description:
Generates "Slow Content Download" events whenever an invocation of the API function fpassthru()
rises above the given threshold. The default values are, 5000 msec for moderate, 10000 msec for
severe alerts.
The Zend Download Server (ZDS) is the optimal solution for handling large downloads. Use the ZDS
API to optimize download performance and reduce download traffic from your Web application.
72
Zend Platform
Maximum Apache Processes Exceeded
Maximum Apache Processes Events detect Apache Process activity that can directly influence Web
Server Performance and indicate activity peaks.
Max Apache Processes can assist in identifying peak activity.
Description:
Generates an event whenever the Apache process count rises above the given threshold.
The default values for triggering an event are 200 processes for a moderate Event and 250 processes
for a Severe Event.
73
Zend Platform User Guide
Excess Memory Usage (Absolute and Relative)
This is a performance-monitoring event.
(Absolute - a customer configured hard number; Relative - a customer configured percentage)
Excess Memory Usage events identify when scripts are using excess memory that can hinder the
application's ability to perform.
Production environments mainly use this event type but QA can also benefit from monitoring by KB or
percentage of memory used by a script to execute.
Description:
Excess Memory Usage (Absolute) - Generates an event when memory for PHP script
execution uses more than a set amount of KB for moderate events and severe events.
Excess Memory Usage (Relative) - Generates an event when memory use for PHP script
execution is above or below average, a set percent for moderate and severe events.
Note:
Both Event Types are only active if the PHP is compiled with memory limit. (Compile the PHP, with the
configure switch "--enable-memory-limit".
The default values for both of these event types are set to 0. To generate events, configure these
settings to a value that suits required memory usage.
Relative Events:
Event definitions are based on relative values i.e. percentage. Relative values are set according to
warm-up settings, default value of 500 requests. If necessary, modify the default value by
changing the zend_monitor.warmup_requests directive in the 'zend.ini'.
The warm up period is per "top script" and there is a warm up for each script after every Apache
restart.
74
Zend Platform
Database Error
Database Error Events report function errors such as:
Connection errors
Database selection errors
General database function errors
These events do not require any additional configurations to the database. Production environments
can use the information to delineate between a PHP problem and a database problem.
Database Errors can prove to be invaluable to an organization as they provide insight into the
Database reliability along with a different perspective on problems (view outside problems through the
eyes of PHP). Issues like these used to be difficult to reproduce however with the complete audit trail
and full problem context, Database Errors can be easily reproduced to a level of accuracy that mirrors
the actual time of occurrence.
Description:
Database errors generate events when database-related functions fail. This event is directly
associated to the "Function Error" event and is activated and defined in correlation with this event
type.
Database functions that should be reported are defined (or deleted) from the "Function Error"
functions list.
Note:
To view supported databases, see the database related function prefixes listed in 'linux/unix/mac/
i5OS' <install_dir>/lib/db_functions.txt or in windows <install_dir>\lib\db_functions.txt.
75
Zend Platform User Guide
Slow Query Execution
Slow Query Execution events identify slow queries that are related to database performance that can
directly influence Web server performance.
Slow queries, if not pinpointed, can bring the server down by:
Causing excess web server processes (Apache).
Hang up queries in the database causing slower responses in the database.
These events do not require any additional configurations to the database. Production environments
can use this information to pinpoint performance bottlenecks in the database.
Description:
Generates an event whenever database related function execution rises above the given threshold.
This event is directly associated to the "Slow Function Execution" event and is activated and defined in
correlation with this event type.
Database functions that should be reported are defined in the "Slow Function Execution" function list
(in additional rules).
Note:
To view supported databases, see the database related function prefixes listed in
linux/unix/mac/i5OS <install_dir>/lib/db_functions.txt or in Windows
<install_dir>\lib\db_functions.txt.
76
Zend Platform
Inconsistent Output Size
Inconsistent Output Size events verify that pages render the same output to the client each time. If
pages do not render the same each time, some clients are seeing different output than others and an
error has occurred.
Production environments use this event as an indicator for possible usability issues.
Description:
Inconsistent Output events generate an event whenever the output size is below or above the
normally produced average output. The default values for this event type are set to 0. To generate
events, configure these settings to a value that suits acceptable variance in percents from output to
output of scripts.
Relative Events:
Event definitions are based on relative values i.e. percentage. Relative values are set according to
warm-up settings, default value of 500 requests. If necessary, modify the default value by
changing the zend_monitor.warmup_requests directive in the 'zend.ini'.
The warm up period is per "top script" and there is a warm up for each script after every Apache
restart.
77
Zend Platform User Guide
Load Average
Load Average events monitor the overall health of processes running on the server.
This event is used in production to highlight critical situations that might require analysis during high
traffic situations.
Description:
In Unix, Mac, i5/OS and Linux this event is triggered when the number of active processes waiting
for CPU time, is higher than the number defined in the rule. The default definitions for are set to 0 for
moderate and 0 for severe events.
In Windows this event is triggered when the CPU exceeds a certain load percentage threshold. The
default definitions for Windows are 90% for moderate and 95% for severe.
To start generating events set a logical value based on the server’s capabilities.
78
Zend Platform
Custom Events
Custom events are a unique type of event to initiate events from scripts.
This type of event is different from other event types because it controls event generation as opposed
to other events that trigger events by a certain occurrence.
Custom events are used to generate an event whenever the API function monitor_custom_event() is
called from the PHP script.
Description:
This event type enables the generation of an event on occurrences that are not necessarily built-in
events (error and performance issues). Custom events are used whenever you decide that it is
significant to generate an event in a certain situation. Each event type is given a name for easy
identification ($class).
Function Usage:
monitor_custom_event(string $class, string $text[, integer $severe, mixed $user_data])
Parameters:
$class - helps to define several types of custom events. This description will be showed in
the Event List and in the Event Details.
$text - error text used to describe the reason for the event. This text will appear in the
Event Details.
$severe - (Optional) the severity level of the triggered event, where default the value is
Severe.
$user_data - adds a PHP variable that will be viewed in the Event Details (in Event Context> Variables->User Defined). This forms the stored event data (similar to the information
obtained in a PHP error event).
Aggregation takes place for these events when two events occur in the same place and have the same
$class $text $sever(ity)
Note:
Action Rules defined for these events should be set to "send to URL" rather than "sending by e-mail"
as there is only one definition for these events and event reports sent to a URL can be easily
forwarded elsewhere. This is to prevent the overloading of e-mail. If we use the e-mail action, for
every custom event, e-mail will be sent, and there can be many classes of custom events. However, if
the URL action is used, a script can be used to identify the event’s class and different behaviors can be
implemented according to class.
79
Zend Platform User Guide
HTTP Error
HTTP Error events detect broken links and other application-level malfunctions by indicating when
HTTP errors occur when trying to access a Web page.
Using HTTP errors assists in identifying problems in calling a Web page.
Note:
Multiple errors generated from the same URL are aggregated into a single event. The Event Details
report will display the amount of times the Event occurred.
Description:
Generates an Event whenever a standard HTTP client or server triggers an error code (e.g. 404 Not
Found Error, 406 Not acceptable, 403 Forbidden, Custom Error Handler Page, etc.) including
Customized Error Handler pages.
Setting up HTTP Error Events
In order to generate HTTP Errors the function monitor_httperror_event() should be added to the Error
Handlers that need to be monitored. In order for PHP Intelligence to pick-up on errors such as "404
Not Found Error" "406 Not acceptable" and "403 Forbidden" your error messages must be configured
to reach a certain PHP page that contains the function, monitor_httperror_event(). This function
triggers an HTTP Error event when it is called from a PHP script.
This following example demonstrates how to generate an event for a 404 error message on Apache 2.
The actual definitions should be done in http.conf or htaccess.
ErrorDocument 500 http://example.com/
ErrorDocument 404 /raise_event.php
The example above runs the file called raise_exent.php whenever a 404
error occurs. The PHP file calls the function
raise the event as follows:
<?php
monitor_httperror_event(404, 'error message');
?>
80
monitor_httperror_event() to
Zend Platform
Contents:
Creating Events
Filtering Event Triggers
Event Types
Platform comes ready with default configurations. However, a person with an understanding of the
environment’s settings and performance standards should construct the Event Triggers to suit each
unique environment. Event Triggers define the conditions under which events are captured by the
monitoring system (PHP Intelligence).
To Configure Event Triggers, go to PHP Intelligence | Event Triggers or use the Shortcut from Platform
| Dashboard.
Note:
If the Events Triggers tab is not populated, this may mean that the service was not available. Please
refer to Services and Extensions to verify the appropriate services are running.
Users are prompted to select a node before entering the Event configuration screen as all
configurations are made to a selected node. The top bars of screens display the name of the node, no
name means the user is working directly on the Central Server.
For example, the image below displays the following text: Server name "karnaf-deb". This means that
the user is no longer working on the Central Server but working directly on the node (in our case a
node aliased karnaf-deb).
Figure: Configure Event Triggers (Partial List)
The Event Triggers screen is used for defining and modifying Event Triggers to monitor events on a
specific node. The table is used to define the conditions under which an event will be captured by the
monitoring system.
81
Zend Platform User Guide
The possible actions on this screen are:
Configure Event Triggers for a specific server.
View Event Triggers currently defined for the node.
Filter the view of events displayed in the "Define Event Triggers" table.
Clone Events
To configure Event Triggers:
1.
Open the PHP Intelligence tab, you will be prompted to select a server (if you have
not already selected one) and click, Event Triggers.
2.
Activate events by marking the check-box next to the event.
3.
Modify the default settings in the Rules column to customize the event behavior and
severity.
4.
Click "Save Rules" to save changes.
5.
Click "Clone Event Triggers" (at the top of the screen) to apply these settings to a
different server.
The settings will be applied and saved to the selected server/s.
Notes:
To configure multiple servers or a server group with the same Event Triggers:
(1) configure a selected server
(2) use the Quick Clone button to propagate settings from that server to other server nodes.
Event Types are specific events configured by administrators for monitoring a server/node. The Define
Event Triggers procedure is used to define the conditions under which a server will generate an Event
of a specific severity when an event (of the type) occurs. The Event Types supported in the current
version of Zend Platform are described below.
82
Zend Platform
Security
The Security tab is accessed from PHP Intelligence | Security.
Note:
If the Message "Monitoring is currently disabled" appears on screen, go to Configuration| PHP
Configuration and set the directive zend_monitor.enable=On.
This tab allows users to select specific types of information that should not be included in the "Event
Context" section of Event Details.
Figure: Event Context
Information excluded from the Event Context will be replaced with the following message: <BLOCKED
VALUE>.
Why Configure Security Settings?
The primary reason for securing information is to prevent the storage, handling and distribution of
sensitive information such as user names, passwords and credit card numbers. This information is
collected as part of the Platform diagnostic process. However, only the context and not the
information can contribute to understanding why the Event occurred. Therefore, more sensitive
information can be chosen to not be collected when compiling Event Details.
An additional reason for using the Security Blacklist is to prevent inadvertently sending sensitive
information by e-mail when using the Event Triggers option that automatically distributes Event
Details to e-mail addresses.
Security settings can provide an ultimate Compliance solution for confirming to data security protocols
such as PCI Certification
The possible actions on this tab are:
Configure a list of variables to be excluded for a specific server (the value of excluded
variables will not be stored in the DB).
Choose specific Data Types that should not be displayed in Event Details
Clone Settings to be applied to other servers in the cluster.
83
Zend Platform User Guide
Configuring Security Settings
The following procedure describes how to configure the Security list for blocking the collection of
sensitive data in PHP Intelligence events.
To configure security settings:
1.
Go to PHP Intelligence | Security.
2.
In the Parameters area, add a list of parameters that their value should not be
collected and displayed in the Event's details.
Add parameters one at a time in the input field and click
to add the parameters
to the list.
Note: The parameters input filed is case sensitive, therefore if there are parameters
that appear in the code in different cases all the possible variations should be added
3.
In the Context areas, select the contexts that can possibly include the parameters.
4.
Click
to apply changes.
After saving the Security settings, all subsequent Events will not include the specified information in
the Event Details. additionally the information will no longer be be stored in the Events Database.
These settings will apply to the selected server (the server name appears on the top of the tab).
These settings can be applied to additional servers using the Clone Settings option.
Example:
If we have a parameter called password we can add it in the security tab as a parameter
that should not be included along with the possible parameter's context 'POST'. Now,
when an event occurs the 'password' parameter instead of displaying 'password=1234'
the Event Context's POST section, will show 'password=<BLOCKED_VALUE>'. If there is
also a parameter called 'PASSWORD' it too should be added to the list of parameters that
is case sensitive.
84
Zend Platform
Event Actions
The Event Actions tab is accessed from PHP Intelligence | Event Actions.
Event Actions provide several options for distributing the content of Events to a third party.
Distributing Event information can be leveraged to inform other people (e-mail) or to be implemented
into another application such as a bug tracking system (URL) or by using SNMP Traps.
Actions can be applied to Events in two ways:
1.
In cases when the Event Type itself should always be distributed.
For example set an Event Action on all HTTP Error Events to inform the Web administrator
that pages are returning an error.
2.
In cases when only a specific event should be sent on.
For example if there are specific Event Details that require the attention of someone who
does not have Zend Platform installed (this is done directly from the Event Details by clicking
"Report Event").
Note:
Use the Security tab options to prevent the storage, handling and distribution of sensitive information
To configure Event Actions go to: PHP Intelligence | Event Actions.
There are two steps to defining event actions. The first is to define "Actions" and the second is to
define "Action Rules".
Actions determine how the Event Details will be sent by specifying an e-mail address, a URL
or an SNMP alert.
Actions Rules determine which events by specific criteria will be sent.
Note:
Read more about SNMP Traps in About SNMP.
85
Zend Platform User Guide
Defining Actions
Clicking the Event Actions URL opens the Actions dialog. This dialog allows you to define or remove
Actions for the entire cluster.
Figure: Event Actions
From the Actions screen you can:
Add/remove global Action Types from a central administrative station
View Action Types currently defined in the system
To add an Action:
1.
Select one of the options from the Action Type drop-down list.
2.
Depending on the selection e-mail, URL or SNMP trap the action type details will
change.
3.
Enter the information according to the selected Action Type:
•
Target URL for the action type "Submit a report to the specified URL"
•
Recipient Address and Subject for the Action Type, "Send a report via e-mail".
•
SNMP:
o
o
NMS Target Machine - The SNMP Trap's destination address.
Community String - The Community and port (default port is 162, and the
default community string is 'public'). This is an identifier, without it the
NMS will not accept incoming messages.
o
Download MIB (Management Information Base) file - Browse to find the
MIB file and place it in the NMS. If a problem occurs accessing the MIB file,
the relevant error will be given instead.
•
86
Click "Add" to add the new Action Type to the "Current Action Types" list.
Zend Platform
Note:
These Action Types can now be associated with Action Rules (see below). You can also change or
remove the Action Type settings at any time.
Zend Platform supports three types of reports:
E-mail Report - sends a text report to an e-mail recipient. This type of report is typically
preferred by users who need to be notified of an event, but do not require the content of the
report to be available for further use. To properly report an event via e-mail, make sure to
set your preferences in the Mail Settings section of the Preferences page.
Send SNMP Trap - Sends an SNMP trap to a NMS address containing the events
parameters. SNMP traps are used in order to send an SNMP alert to a management server.
The process is as follows; once the SNMP trap action is set and an action rule with it is
defined, as soon as there is an occurrence in the system the rule is triggered and an SNMP
trap will be sent to the NMS address provided by the user when the action was set.
XML Report - a structured XML report which is not only informative, but which can be made
available for further use. For example, the .xml event data could be used as input for a
monitoring script. The structure of the .xml report follows the structure shown below:
Example:
#each attribute exists if it exists in the Event Details screen
<?xml version="1.0" ?>
<event type event_id timestamp time severity>
#if there is an error:
<error type>error text</error>
<stats triggered_value avg load_average/>
#if there is a source file:
<source file line/>
<script name host uri>
<vardata type name value/>
</script>
#if there is a function:
<function name>
<args>
<arg num value/>
</args>
</function>
#if there are included files:
<included_files>
<file name\>
</included_files>
#if there is a backtrace for this event:
<backtrace>
<call depth function file line/>
</backtrace>
</event>
87
Zend Platform User Guide
Defining Action Rules
The Define Action Rules screen is accessed from: PHP Intelligence | Action Rules.
This screen ties together the elements of the rule-based notification system (monitoring and
reporting) by creating a logical rule that can be understood as follows:
When an Event of a user-defined Severity occurs in the user-designated Server, a specific Event
Action (notification) will be invoked.
Figure:
Define Action Rules
From this screen you can:
Add/remove an Action Rule currently defined in the system.
View Action Rules currently defined for an Action Type in the system.
Edit an existing Action Rule and apply the changes.
Disable an Action Rule.
To define Action Rules for a server:
1.
Select the Define Action Rules tab
2.
Enter Action Rule parameters in the Add a New Action Rule area.
a.
Select an Event from the Events combo. (For a complete list of Events
supported in the current version of Zend Platform, refer to the Event List
tab above.)
b.
Select the severity from the drop-down list.
c.
Select a Server from the drop-down list of servers currently defined in the
system.
d.
Select an Action from the drop-down list of Actions currently defined in the
system.
3.
Click "Add" or "Save".
a.
Clicking "Add" adds the new Action Rule to the list of Action Rules defined
in the system.
b.
Clicking "Save" applies the changes to a rule that you have edited.
Note:
Read more about how your organization can leverage information generated by events in the Tutorial
- "Integrating Existing and Legacy Applications".
88
Zend Platform
Event Details
Contents:
Controlling Information Displayed in an Event
Aggregate Hints
Customizing Events
Event Aggregation Rules
Change Event Details
Event Diagnostics Settings
Event Details are accessed when clicking on an Event In the Dashboard and the Event List (The Event
list for a selected server is also accessible from the System Health Tab.
Event Details are generated in accordance to Event Triggers. Event Details are a diagnostic tool that
provides a complete audit trail and options for investigating and resolving events.
Event Details are viewed in several ways. The regular way of viewing events is from Platform. Events
can be configured to be sent by e-mail recipients or to a URL (in XML format). However, Event Details
always include the same information regardless of the viewed output (Regular Event Details, XML or
e-mail).
Figure: Event Details
89
Zend Platform User Guide
Event Details include five sections:
1. General Information
2. Event Occurrence Info
3. Zend Studio Diagnostics
4. Event Context
i.
Function Data
ii.
Variables
iii.
Backtrace
iv.
Included Files
v.
Show Source Code
5. Event Administration
The information included in Event Details varies according to event type. For example: PHP Error
Event Details include different information than a Slow Script Execution Event Details, simply because
these events require different information to perform diagnostic analysis.
For example: A PHP Error will include in the General Information, the error’s text and in the Event
Context, the Function’s Data. However, in a Slow Script Execution Error there is no need for the error
text or the function’s data and there will be information on how long the script ran for, included files
and the load average at the time of the event.
Note:
If there is not relevant data to display in an Event Details screen, the section will not be included
rather than appearing empty.
General Information
The general information section of the Event Details provides basic information about the event
(depending on the event’s type) as follows:
Figure: Event Details - General Information
Title - The top of the Event Details, displays the event that generated the Error and the Event
ID (Error #). The Event ID can later be used, to locate the event in the Event List or the
Console in the filter's Find section.
90
Severity Level - An additional notification is added to severe events.
Event Status - The Status of the event is indicated for all statuses except Opened.
Requested URL - The requested URL
Main Filename - The URL’s main file
Source File - The path to the Source File and line in the code that triggered the event.
Zend Platform
Note:
Especially with code related errors, this information can provide an immediate indication to the source
of the error in the code.
Trigger Value - The value type that triggered the event (runtime,output size,memory
consumption etc.).
CPU Load - The CPU load when the event occurred.
Aggregate Hint - Shows the Aggregate Hint for this event
PHP Error - Shows the type of error that triggered the event.
*Not all the parameters (above) are included in all events, only in events that require this
information.
Event Occurrence Info
To prevent an event from being continually reported for the same or similar event, PHP Intelligence
enforces Aggregation Rules. These rules are based on a set of predetermined algorithms that
determine which events are identical or are similar, to the extent they can be reported as a single
Event. Aggregation Rules are also aware of events that occur on nodes belonging to a cluster
(grouped servers).
Aggregation information is displayed in event details to identify the number of times the event
occurred and in case of Groups the information is expanded to include the servers on which the event
occurred and the number of occurrences.
Figure: Event Details - Event Occurrence Info
The Event Occurrence Info section shows, the total number of occurrences, the time and date of the
first and last occurrence and the first server (and virtual host) on which the event occurred.
In cases where an event occurred on several servers belonging to the same group, an additional
expandable list is added. This list displays occurrences per server, i.e. the server’s name, and total
number of times the event occurred on the server.
Figure: Event Details - Aggregated Event
91
Zend Platform User Guide
Zend Studio Diagnostics
The Studio Diagnostics section shows the advanced diagnostic options that can be performed on the
event’s data.
These diagnostic options reconstruct the precise conditions that generated the event by recreating the
request with the same parameters that were in the original request (Information such as:
GET/POST/COOKIE/etc.).
Note:
The recreation process will not create an additional event.
Figure: Event Details - Event Diagnostic Options
The diagnostic options that can be applied to event information are as follows:
Test URL - Loads the exact same URL from the event with the exact same parameters
(GET/POST/COOKIE/HTTP HEADERS/etc.) and shows the script’s output in the browser.
Note:
The Test URL option does not require the Integration with Zend Studio.
Reproduce in Debugger - Initiates a Debug session of this URL in Studio.
Reproduce in Profiler - Profiles the URL, using the Studio Profiler with the same parameters
(GET/POST/COOKIE/HTTP HEADERS/etc).
Show Source Code - Opens the file where the event occurred in Studio. This option provides
a means for editing files and implementing changes to multiple servers using Studio.
Change Server - This link opens the "Event Diagnostics Settings" dialog. Through this dialog
an event can be configured to be reproduced on a server other than the one that initially
triggered the Event.
Important: Debug URL, Profile URL and Show Source Code can be activated when the following
conditions are met:
1.
Zend Debugger is installed on the server where the event occurred.
2.
Studio is open.
3.
The Platform Administration preferences (Zend Central | Preferences) are configured to the
correct port (The port on which Studio is listening), the Studio IP is correct (the exact IP of
the computer where Studio resides), and the Debugger allows a debug session from Platform
Administration (by going to: Zend Central | Configure PHP Settings | Zend | Zend Debugger
and verifying the correct IP/S in the zend_debugger.allow_hosts directive).
92
Zend Platform
Event Context
Event context includes relevant information available at the time of the occurrence. This information
varies according to the type of event generated.
When defining Security settings for excluding information collected by PHP Intelligence the message
<BLOCKED VALUE> will appear instead of variable's parameters.
There are four main Event context categories:
1.
Function Data
2.
Variables
3.
Backtrace
4.
Included Files
Figure: Event Details - Event Context
Sensitive content such as passwords and credit card details can be excluded from the Event Context.
These parameters will be replaced by the message: <BLOCKED VALUE>.
To find out more about excluding values see "Security".
Function Data
Function Data is only added to function related Event Details. This addition shows the function’s name
and parameters at the time the event occurred.
The function always appears as a link. This link directs to the function’s description in the online PHP
manual at: http://devzone.zend.com/manual
Note:
The link to the PHP manual also appears for user-defined functions. These functions naturally, will not
be found in the PHP manual however, it is a good indication as to which functions are PHP functions
and which are user-defined.
Variables
The information included in the Variables section, includes all variables data saved when the event
occurred, such as: GET, POST, COOKIE, SERVER, etc.
The GET, POST, COOKIE and SERVER sections will always be displayed even if they are empty. This
indicates that there was no available data at the time the event occurred.
Users may choose to change the type of information collected and displayed in an event (Change
Event Details).
93
Zend Platform User Guide
Backtrace
Backtrace only appears in function related events. The listed functions are the functions that lead to
the actual function (occurrence) that triggered the error.
Functions are listed in chronological order from the most recent to the first function that was called.
There are two options for viewing Backtraced functions, in a pop-up screen or in Zend
Studio.
- Shows the function call in a pop-up screen.
- Shows the function call in Zend Studio.
Included Files
The Included Files section only appears in slow script error events. The files listed are all the files that
are included in the PHP script that caused the error to occur.
Show Source Code
Shows event data in the Event details in the form of an expandable text field. This option opens the
file in the section of code where the event occurred.
To view the source code in Event Details:
Click Show Source Code to expand the text area.
Figure: Show Source Code
94
Zend Platform
Event Administration
The Event Administration section includes all the actions that can be applied to an event. See
Controlling Information Displayed in an Event, to learn how to disable these options for certain users.
Figure: Event Details - Event Administration Actions
The applicable actions (Buttons) are as follows:
Ignore - Ignores future instances of this event (i.e., changes the event status to ignore).
Therefore, if the same event occurs again, Platform will not open a new event.
Preserve - Keeps the event in the database even during database cleanups.
Close - Closes the event (i.e., changes the event status to closed). Therefore, if this event
occurs again, Platform will open a new event.
Delete - Deletes the event (i.e., removes the event entirely from the database.)
Reopen - Changes the event’s status from closed to open.
Report - Adds an additional dialog for selecting an action to apply to a single event. The
options are Save as XML and e-mail (the e-mail address is as defined in PHP Intelligence |
Event Actions in the Actions tab).
Reproduce Event on Another Server
The ability to reproduce an Event on a different server provides an additional option for strengthening
the link between development and production by enabling development teams to reproduce an event
that occurred on a production server on a development server. Reproducing an Event on a
development server will allow to diagnose and investigate the event without causing and additional
disruption to the production server.
The "Reproduce Event on Another Server" option is only available from "Event Details".
Important: Reproduce Event on Another Server can be activated when the following conditions are
met:
1.
Zend Debugger is installed on the server where the event occurred.
2.
Studio is open.
3.
The Platform Administration preferences (Zend Central | Preferences) are configured to the
correct port (The port on which Studio is listening), the Studio IP is correct (the exact IP of
the computer where Studio resides), and the Debugger allows a debug session from Platform
Administration (by going to: Zend Central | Configure PHP Settings | Zend | Zend Debugger
and verifying the correct IP/S in the zend_debugger.allow_hosts directive).
95
Zend Platform User Guide
Controlling Information Displayed in an Event
Platform’s User Management settings (Zend Central | User Management), can be utilized to set
restrictions per User Group. These restrictions can control permissions to view event information and
prevent certain User Groups from changing Event Details status.
The following restrictions can be applied to Event Details information:
Delete an event
Ignore an event
Close an event
Reopen an event
See the event internal data in the Event Details
See the event source code in the Event Details
Use the Studio Diagnostics in the Event Details
Blacklist event context details.
These limitations can prove to be especially useful for the organization. For example: when working in
collaboration with external organizations that should not be permitted to view information such as the
source code.
Another example of the Event Details restrictions is seen when implementing development lifecycle
processes that require that certain groups be limited to the actions that they can do with an event
such as closing or reopening.
Note:
To find out how to create a User Group, go to: "User Management".
96
Zend Platform
Customizing Events
There are several ways to customize which suit different requirements.
Custom Events - for generating a User Defined event that is not based on specific PHP
Intelligence, Event Triggers.
Event Callbacks - for adding user defined information to Event Details.
Aggregation API - for setting different events to be aggregated with other events.
Note:
To exclude files from being monitored, add ini_set("zend_monitor.enable",0); at the beginning of the
script you don't want to monitor (you can enable again later in the request if you want by changing
the values to 1).
Custom Events
Custom events are a unique type of event that is provided for Platform users in order to initiate
events in their scripts. This type of event is different than other event types in that it allows
controlling event generation as opposed to the other events that are triggered by a certain
occurrence.
Custom events are used to generate an event whenever the API function monitor_custom_event() is
called from the PHP script.
Description:
This event type enables the generation of an event on occurrences that are not necessarily built-in
Platform events (error and performance issues). Custom events are used whenever you decide that it
is significant to generate an event in a certain situation. Each event type is given a name for easy
identification ($type).
Function Usage:
void monitor_custom_event(string $class, string $text[, integer $severe, mixed $user_data])
Parameters:
$class - helps to define several types of custom events. This description will be showed in the
Event List and in the Event Details.
$text - error text used to describe the reason for the event. This text will appear in the Event
Details.
$severe - the severity level of the triggered event, default value is Severe.
$user_data - adds a PHP variable that will be viewed in the Event Details (in Event Context->
Variables->User Defined). This forms the stored Event Context (similar to the information
obtained in a PHP error event).
Aggregation takes place for these events when, two events occur in the same place and have the
same $class $text $sever(ity).
When viewing these events in PHP Intelligence | Event List, they can be filtered by the Custom Events
category. More information about this API can be found in: Monitor Functions.
97
Zend Platform User Guide
Note:
Event Actions defined for these events should be set to "send to URL" rather than "sending by e-mail"
as there is only one definition for these events and Event Details sent to a URL can be easily
forwarded elsewhere. This is to prevent overloading e-mail. If we use the e-mail action, for every
custom event, e-mail will be sent, and there can be many classes of custom events. However if the
URL action is used, a script can be used to identify the event’s class and different behaviors can be
implemented according to class (To find out how to leverage Event Details information sent to URLs
go to:Integrating Existing and Legacy Applications).
Event Callbacks
The event callback mechanism is used for viewing additional information about local variables in order
to investigate what happened when an event was generated. The additional information is displayed in
the Event Details.
Event Callbacks are created by extending information already provided in Event Details to provide an
audit trail for problem conclusion.
Register and Un-register User Event Handlers
The event callback mechanism uses the following API functions:
register_event_handler
unregister_event_handler
Register Event Handler
To register a user function as an event handler, the following API can be implemented:
register_event_handler($event_handler_func
[[,$handler_register_name],$event_type_mask])
Parameters:
$event_handler_func - The first argument is a callback function that will be called when the
event is triggered. Object methods may also be statically invoked using this function, by
passing the array ($objectname, $methodname) to the function parameter.
$handler_register_name - The second argument is optional and represents the name under
which the function is registered. If no name is specified, the function will be registered under
its own name.
$event_type_mask - The third parameter is an optional mask of event types on which the
handler should called. The default setting is MONITOR_EVENT_ALL.
When a monitor event is triggered, all the user event handlers are called and the return value from
the handler is saved in an array keyed by the name under which the event handler was registered.
The 'event handler’ results array, is saved in the script_runs table. More information about this API
can be found in: Monitor Functions.
Notes:
The first parameter is the name of the called function and it has to be a user-defined function. Built-in
functions will not work with this API.
This function can get as a parameter the event type by which it was called.
If there is a PHP function register_error_handler in the script, events will not be reported. To report
events call the function monitor_pass_events in the error handler.
Global Events should not be changed under any circumstances as they may produce unpredictable
results.
98
Zend Platform
Un-register Event Handler
The un-register event handler allows you to un-register an event handler. The API returns false if it
cannot find a handler registered under the supplied name.
unregister_event_handler($register_event_handler)
Note:
Do not add the unregister_event_handler function to the end of scripts if you need to generate
memory and script execution Events. These event types generate the event only after the script is
executed and if unregister_event_handler is added it will stop the event from being generated.
The event types that should not include unregister_event_handler are as follows:
Slow Script Execution Absolute
Slow Script Execution Relative
Inconsistent Output Size
99
Zend Platform User Guide
Change Event Details
The information included in the Variables section, includes all variables data saved when the event
occurred, such as: GET, POST, COOKIE, SERVER, etc.
The GET, POST, COOKIE and SERVER sections will always be displayed even if they are empty. This
indicates that there was no available data at the time the event occurred.
Users may choose to change the type of information collected and displayed in an event at the time of
the occurrence.
The following procedure describes how to define the type of variables data that will be displayed in
Event Details.
To define variable data types:
1.
Go to: Platform | Dashboard | Configure PHP Settings and locate the function
zend_monitor.report_variables_data from the tree under: Directives | Extensions |
Zend Platform.
2.
Select the Variables types that you want displayed in Event Details by selecting the
check box to the left of each variable and clicking "Save".
The new settings will be applied as soon as the Web Server is restarted.
Note:
Changes applied to the Event Details will take affect after the Server is restarted. Events that occurred
before the changes will not be affected.
100
Zend Platform
Aggregate Hints
"monitor_set_aggregation_hint (page name)"
This API is a global variable that can be set anywhere and in any hierarchy. The purpose of this API is
to incorporate locations of occurrences in the script.
This API is used when there are events that require the location in the script for diagnosing the reason
behind the event occurring.
Example:
Global Events require the application that generated the event. Adding the Hint API can assist
in the identification process.
Usage Example:
Out of the box, Platform aggregates events of the same type under the same script. To
instruct Platform to aggregate even when your application loads other PHP scripts via the URL
get parameter, you need to use the "monitor_set_aggregation_hint()" function
This example uses opensource SugarCRM with URLs such as:
Calling up Calendar.php module in SugarCRM the url is
http://localhost/sugar/index.php?module=Calendar&action=index
Calling up Activities.php module in SugarCRM the url is
http://localhost/sugar/index.php?module=Activities&action=index
The actual aggregation should be done by the ?module=XXXXX loaded via index.php in
SugarCRM, so its referred to by the http get variable $_GET["getvariable"] and for
SugarCRM the get variable is "module" and we can aggregate all calendar.php events by
themselves, and all activities.php events under its own script. You would call this function at
the top of your index.php code as follows:
monitor_set_aggregation_hint($_GET["module"]);
// this example will work for SugarCRM
This instructs Platform to aggregate for specific applications.
101
Zend Platform User Guide
Event Aggregation Rules
Event aggregation rules determine which events are aggregated into a single Event Detail.
There are four types of checks depending on the event type:
1.
Database Error
2.
Zend Error (PHP Error)
3.
Function Error
4.
Query Error
The Collector checks to see if these events occurred in the same source file based on the Line,
Function and Hint. This is why it is important to used Hints if this level of separation is necessary.
Note:
To read more about the event aggregation mechanism go to: Appendix B - Event Aggregation
Mechanism.
102
Zend Platform
Event Diagnostics Settings
The Advanced Diagnostics Settings dialog is accessed from an Event Details page.
This procedure describes how to use the Event Details Event Diagnostics dialog. Through this dialog
an event can be configured to be reproduced on a server other than the one that initially triggered the
Event. This option is useful for reproducing an event on a different server to diagnose if the event is
globally reproducible or it occurred due to server specific issues. Reproducing an event on a different
server also means that you can reproduce a production related event on a development server
without interrupting your production environment. The actual reproduction is triggered from the Event
Detail's "Zend Studio diagnostics" section. The Event diagnostics settings determine the server on
which the diagnostics will be applied ("Test URL", "Reproduce in Debugger", "Reproduce in Profiler"
and "Show Source Code").
Diagnostic tools and Event Diagnostics can only be applied to existing Events.
To use the Event Details Event Diagnostics:
1.
In an Event, go to "Zend Studio Diagnostics" and Click the link called "Change
Server".
The Event Diagnostics dialog will be displayed.
2.
Choose the server on which to reproduce the event:
•
Originating Server - reproduces the event on the server the event originated.
•
Alternate Server - allows users to define another server on which to reproduce
the event.
3.
Click finish to save the settings.
These settings will be applied to all events they are also user specific (logging in with your user name
remembers your specific settings)
103
Zend Platform User Guide
Performance
Contents:
Performance Lifecycle
Settings
Implementing the Performance Lifecycle
File View
Performance Optimization Tools
URLs
Configuring Performance
Testing
Performance
Tuning
Performance Console
Zend Optimizer
The Zend Performance module provides a collection of comprehensive tools for enhancing PHP Web
applications and Server performance in Enterprises.
Using Performance Provides:
Increased server throughput, with less hardware
Improved user-experience, with faster response time and download time
Reduced stress on production database servers and HTTP servers
Reduced costs on new hardware purchases and IT maintenance operations
Better utilization of existing hardware resources and capacity
Overview
The Zend Performance module consists of several components for providing server performance
optimization:
Performance Tests
Code Optimization
Content Caching (full-page, partial, URL based and SHM/Disk caching)
Code Acceleration
File Compression
Performance Tests
Run tests to monitor the improvement achieved in performance by Platform Performance. The
available tests are: By URL, Downloads and Analyze Site.
Code Optimization
Code optimization begins from the first moment Platform is installed. The Zend optimization
component performs several passes, each pass searches for specific points in the PHP code that are
known to have a negative affect on performance and changes them for faster execution.
Content Caching
Content Caching dramatically reduces the number of times your server must run complex scripts,
execute resource-intensive database queries, or call external web services.
How it works: Server-side caching eliminates the need to return to databases, duplicate processes
or re-build a web page for each page access. Cached versions of any file or URL can be maintained for
any amount of time that you determine. Fully configurable parameters determine what to cache and
104
Zend Platform
based on which conditions. Full Page caching provides an additional performance boost for end-users
by utilizing Client-Side Caching. No code-level modifications are required. Moreover, you can use the
Zend API's for partial and conditional caching of parts of script functionality (Output Cache
Functions,Zend Cache Functions).
Code Acceleration
Code Acceleration begins from the first moment Platform is installed. The Zend acceleration
component performs a pre-compilation of your PHP scripts, eliminating the lag time and interpreter
time involved in script parsing. During compilation, the code is also optimized, resulting in even faster
execution time.
How it works: Server-side pre-compilation generates persistent bytecode. Modified scripts are
automatically detected. Compiled scripts are optimized using advanced code optimization methods.
File Compression
File Compression increases the end-user download speed and decreases the workload on your http
server. Better than any other compression option due to integration with Dynamic Content Caching
eliminating the time it takes to run the compression.
How it works: Specific browser capabilities are auto-detected. If browser supports gzip format, the
results are compressed prior to returning to the user. Both the original and the compressed version
are cached and reused, depending on browser capability and cache lifetime.
105
Zend Platform User Guide
Performance
Users are prompted to select a node before entering the Performance options therefore all actions and
settings will be applied to the selected node.
In addition, the top bar indicates the name of the node.
The Quick Clone option in the Settings and File View tab provide shortcut to propagating changes
done in these tabs to other nodes.
There are several Performance related features as follows:
Console - a summary for statistical information about all of Platform’s Performance’s
operating modules.
Settings - globally define performance settings for: Code Acceleration, Dynamic Content
Caching, File Compression and Zend Download Server.
106
File View - for configuring performance configurations for specific files or directories.
URL - for defining caching settings based on a URL.
Testing - to view the improvement achieved in performance by Platform Performance.
Tuning - for fine tuning Accelerator performance to improve PHP application performance.
Zend Platform
Performance Lifecycle
Maintaining Web applications at optimal performance levels is a necessary requirement for ensuring
customer satisfaction and organizational efficiency. Platform’s Performance module provides tools for
optimizing Web application performance by employing a detailed performance enhancement method "The Performance Lifecycle". The Performance Lifecycle is a process of calibrating Platform to provide
optimal performance boost to business critical Web applications.
Deploying Platform in organizations will improve the overall performance of Web
applications by:
Enhancing code and download performance.
Employing full and partial page caching capabilities.
Preserving memory consumption through file compression.
The use of Platform Performance tools in development and production environments provides a means
for testing and maintaining Web application performance.
The following illustration displays the three stages of the Performance Lifecycle.
Figure: Performance Lifecycle
The Platform Performance Lifecycle is an iterative cycle for analyzing Web application performance.
The purpose of this cycle is to identify areas that require Platform calibration and areas that require
PHP code optimization.
The Performance Lifecycle Baselines (stages) are as follows:
Zend Baseline
The first Baseline is the Zend Baseline. This baseline measures performance based on Platform’s
default parameters that are immediately activated upon installation. The default parameters are,
Event Trigger settings, Code Optimization and Code Acceleration. Once Platform is installed, these
components automatically begin to work on the PHP code. The result is an immediate improvement to
the Web application and initial PHP Intelligence event generation (based on default Event Trigger
settings).
107
Zend Platform User Guide
The purpose of the Zend Baseline is to evaluate overall performance in relation to the Platform
defaults. This information is used as an initial starting point for subsequent calibration and
optimizations.
Note:
In the Zend Baseline stage, it is common to experience abnormal event generation behavior (too
many or too little events generated). This is a normal part of the initial calibration stage, necessary for
identifying how to adjust performance settings to obtain optimal Web application performance.
Site Baseline
The second Baseline is the actual calibration process. Based on information collected and observed in
the first Baseline, the performance settings can be calibrated to suit each organization’s specific Web
application. The Site Baseline enables one to obtain insight into the overall performance of the Web
application. Once the Site Baseline is established by configuring Event Triggers these events can be
further analyzed to evaluate the mode of action required to optimize the Web application’s
performance. At this point it is recommended to perform a Site Analysis to benchmark the Web
application. The Benchmark information provides an initial indication of the Web application’s current
performance before applying the additional performance tools. This will provide a point of comparison
to view improvements that occur after subsequent optimization is done with Platform.
After the Site analysis, the PHP code can be optimized. Optimization is obtained by implementing
performance tools to areas in the PHP that exceed the Site Baseline settings (still generate events).
There are four possible choices for adding performance features to PHP code:
1.
Full page caching
2.
Partial page caching
3.
Compression
4.
Blacklist files or directories
Completing optimization of the Site Baseline brings us to the Optimized Baseline.
Optimized Baseline
The Optimized Baseline represents the stage where the Web application is optimized and Platform is
calibrated with the Web application. From this stable stage all that is left to do is to let Platform
perform regular production monitoring.
Note:
When the Web application is re-deployed or changes are made, this process should be repeated from
the Site Baseline stage in order to reestablish the Optimized Baseline.
108
Zend Platform
Implementing the Performance Lifecycle
The following section provides a detailed instructional overview of performance optimization features
and components for implementing the Performance Lifecycle.
Benchmark - Site Analysis
Site Analysis enables to obtain insight into the overall performance of Web applications. Benchmark
information provides an initial indication of the Web application’s current performance. This
information can be used as a starting point for observing the performance boost gained applying the
performance tools. Benchmarking measures Web server performance and durability.
In Platform, Benchmarking is achieved through the Testing screen (Performance | Testing).
This screen includes three options.
Test URL - tests a single script, running Performance and Compression tests at the same
time. The test results indicate the script improvements achieved by Code Acceleration,
Dynamic Content Caching and File Compression.
Analyze Site - tests performance for the entire Web application, running the Performance
test separate from the Compression test. The test results indicate the overall script
improvements achieved by Code Acceleration, Dynamic Content Caching and File
Compression and the popularity of each file.
Test Download - tests the efficiency of the Zend Download Server. This test is addressed in
the Enterprise Server chapter titled "Zend Download Server".
The above-mentioned tests analyze an entire site’s performance or monitor a single script. The test
results can be further used outside Zend Platform as they can be printed or sent by e-mail.
Notes:
Since testing may take a while to run, it is suggested that you choose only the most recently added
files. You may select as many files as you wish; nonetheless this will increase the duration of the test.
Prior to running the Compression Test and in order to ensure accurate results, you may want to add
query strings to the script path entries.
When running Performance Tests, query strings can only be added to cached scripts, to check for
performance gain.
109
Zend Platform User Guide
Performance Optimization Tools
Performance optimization tools are used once it is apparent the code is performing as it should, and
the Event Triggers are calibrated.
From this stage on the performance optimization tools can be applied to further enhance Web
application performance.
There are several levels of performance optimization that can be applied to files: Caching (full page),
Acceleration and Compression.
Applying these three settings to your PHP code provides optimal performance boost.
The default settings for these optimization tools are as follows:
Caching - Default setting Off
Description - Runs code and saves the output on the server
Acceleration - Default setting On
Description - Compiles the Code and saves the compiled code on the server
Compression - Default setting Off
Description - Saves a compressed version of the code on the server
To apply optimization tools to all of the PHP files on the server, caching and compression must be
activated.
To activate/disable Caching, Compression or Acceleration, go to Performance | Settings and modify
the different options.
110
Zend Platform
Configuring Performance
The Performance Settings are modified in the Console tab accessed from Performance | Console or
Performance | Settings.
Customizing performance settings is a way to benefit from Platform's advance performance features.
Setting initial defaults enable the use of basic performance features. Additional configurations can be
applied, to customize performance to correspond with organization-specific requirements. These
configurations are addressed in Performance Lifecycle.
Performance Tab
Platform’s Performance settings are configured and viewed from: Performance |Console.
The Console section of the Performance tab is a main performance management screen through which
basic details and commonly used Performance actions can be viewed as follows:
Figure: Performance Tab - Console
Initially the Console shows the installation defaults regarding which features are enabled (On or Off).
Once changes are applied the console will be automatically updated with the new configuration
settings (In some most changes are applied by restarting the Web-Server).
The following table lists the details and options available from the Console tab:
Component
Console Details
Actions
Overall
Shows the last
Update - leads to Performance | Testing | Analyze
Performance
performance test
Site. From this Tab site analysis tests can be run and
Gain
results.
results can be viewed. Get Latest Detailed
Performance Gain - leads to Performance | Testing |
Analyze Site, with the last performance test results
expanded on the screen.
Code
Shows the Code
Reset - Clears the Code Accelerator memory. Settings
Acceleration
Acceleration
- Leads to the Code Acceleration section of the
111
Zend Platform User Guide
Component
Console Details
Actions
component’s status
Settings Tab.
(On/Off) and basic code
acceleration statistics.
Full-Page
Shows the Content
Reset - Clears the content from the cache. Settings -
Content
Caching component’s
Leads to the Full-Page Caching section of the Settings
Caching
status (On/Off) and
Tab. Add/Remove - leads to Performance | File View,
basic Content Caching
where Cache settings can be added/Removed.
statistics.
Partial
Reset - Clears the content from the cache.
Caching
Settings - Leads to the Partial Caching section of the
Settings Tab.
File
Shows the Compression
Settings - Leads to the File Compression section of
Compression
component’s status
the Settings Tab.
(On/Off) and file
compression settings.
At the bottom of the Console there are shortcuts to individual Test functions as follows:
Run Performance Test - runs a test that evaluates improved performance via Code
Acceleration and Dynamic Content Caching.
Run Compression Test - runs a test that evaluates improved performance via File
Compression.
Note:
Selecting one of these options opens a link to the appropriate option in the Testing Tab (Performance
| Testing) and will not run the test before setting the preferences.
Once the overall functionality of the console has been established, the console can be used to apply
initial performance settings. These settings are related to the File View to make sure that all Virtual
Hosts are visible and select files to be cached (full page) in the Dynamic Content Caching section.
112
Zend Platform
Performance Console
The Console tab is accessed from Performance | Console.
The Performance tab's Console is a summary screen that provides statistical information about all of
Platform's Performance operating modules. Initially it shows the defaults at installation; it reflects
your changes as you customize your setup.
The Console tab includes shortcuts to individual Test functions, these include:
Run Performance Test - runs the test that evaluates improved performance via Code
Acceleration and Dynamic Content Caching
Run Compression Test - runs the test that evaluates improved performance via File
Compression
113
Zend Platform User Guide
Settings
Contents:
Code Acceleration
File Compression
Content Caching
Code Compression
The Settings tab is accessed from Performance | Settings.
From the Performance Settings tab for a specific node, you can globally define the settings for all the
modules of the Performance suite of tools: Code Acceleration, Content Caching and File Compression.
From this configuration pane, you can:
Configure performance monitoring and improve functions for a specific node
Manage Performance settings for the network from a central administrative station
Code Acceleration Settings
Code Acceleration Enable
"On" - The Code Acceleration is active and working.
"Off" - The Code Acceleration is not in use.
Accelerator Memory
The amount of memory allocated for use by the Code Acceleration for storing data structures
and accelerated files.
Recommended: The memory allocated should correlate with the amount of scripts that you
have, their size and complexity. Typically, 32MB is enough.
Memory Reclaim Threshold
During normal operation, some of the Code Acceleration memory may become unavailable
for use. When the Code Acceleration runs out of memory, it will check how much of its
memory is in use, and how much is unavailable. If the amount of unavailable memory is
beyond this reclaim threshold, the Accelerator will perform an automatic restart, to reclaim
all memory.
Recommended: 5%
Maximum Accelerated Files
The maximal number of files that will be accelerated
Recommended: Set this value to about 20% more than the actual number of scripts on
your server. Typical memory usage ratio is a few hundred KB per thousand accelerated
scripts.
Extensions for PHP Files
If your PHP files end with any other extension (rather than the default *.php extension), add
all the extensions here separated by commas.
Full Page Caching
Caching Enabled
"On" - Full Page Caching is active and working.
"Off" - Full Page Caching is not being used.
114
Zend Platform
Maximum Cache Size
The maximum disk size allocated for caching. Occasionally and for short periods, this value
may be exceeded but only until the next time that the cache cleaner deletes the files that
expired.
For unlimited cache size, enter "0".
Minimum Free Diskspace
The minimum amount of free disk space that cannot be exceeded during caching. Reaching
this value will end any further caching. The caching will resume as soon as the space is
greater than this value.
Maximum Cached File Size
The maximum output cache file size allowed. An output cache file that exceeds this value will
not be cached.
Default Cache Lifetime
The lifetime (in seconds) of a cached data. The data will be re-generated if the cached
version is older than the expiration time.
Default Dynamic Caching Conditions
By default, the Dynamic Content Caching will cache each request, based on its full URI. You
can modify the settings to be more general or more specific, as desired.
Partial Caching
Caching Enabled
"On" - Partial Page Caching is active and working.
"Off" - Partial Caching is not being used.
Caching Folders Depth Level
Define the level separation of content cached in the file system (can be used with
namespaces or without).
Maximum Shared-Memory Cache Size
For shared memory caching, set the maximum amount of memory allocated for caching. An
error message will be printed to the web server's log when this limit is exceeded.
File Compression
None
All files are sent to the browser as is.
Only cached files
The cached files are transferred to the browser in a GZIP format, if the browser supports the
format. Other files are sent to the browser as is.
All files
All files are sent to the browser in a GZIP format, if the browser supports the format.
Note:
Compressing all files may cause some overhead and affect the overall performance. Use "All files" if
your main concern is improving the download time for the user.
115
Zend Platform User Guide
Code Acceleration
Code Acceleration is the process of gaining a performance boost by eliminating the code compilation
time. Once PHP code is compiled for the first time, it is saved in the server’s memory. Each time the
code is called, the pre-compiled version is used instead of incurring a compilation lag each time the
code is used.
Note:
Acceleration should not be confused with Caching. Acceleration saves the compiled script in the
server’s memory whereas Caching saves the script’s output in the server’s memory.
When Should Files be Accelerated?
The general recommendation is to always use Code Acceleration to boost Web application
performance. Therefore, the default setting for Acceleration is set to "On".
When Not to Accelerate (Blacklist)?
There are some instances where it is preferable to disable acceleration for select files. Acceleration is
disabled by means of a Blacklist. Files should be added to the blacklist under the following conditions:
Directories containing files that are larger than the Accelerators memory allocation or
containing more files than the allocated quantity of files.
Large files that have high memory consumption
Files that have long execution time (makes the compilation save irrelevant).
Increasing Accelerator Memory Allocation
The following procedure describes how to change the Accelerator's memory allocation. This is used as
an alternative to blacklisting files is to increase the Accelerator memory allocation. The accelerator
settings can be changed to increase allocated memory and the maximum quantity of files that can be
accelerated. This alternative depends on the amount of memory available for allocation to the
Accelerator.
When the Zend Accelerator is disabled, only cached scripts are tested.
To enable the Accelerator, set the 'zend_accelerator.enabled' directive in the php.ini file to 'On'.
To change Accelerator memory allocation:
1.
Go to Performance | File View
2.
In the Code Acceleration section:
a.
Increase the Accelerator Memory
b.
Increase the Maximum Accelerated Files (default 2000)
Note:
If the memory fills up quickly, especially if there is only a small amount of Accelerated files. Increase
the memory allocation or blacklist the file. Files exceeding allocated memory or quantity will not be
accelerated.
116
Zend Platform
Accelerator Duplicate Functions Fix
Some PHP code produces different opcodes for different situations, function defined or not. This
causes a discrepancy for the accelerator in situations where the accelerator caches one version, and
then a different situation occurs that requires a different function. If not addressed the script would
just cease to work and raise a "duplicate functions" error.
To maintain proper performance in situations like these the zend_accelerator.dups_fix parameter
should be activated. This parameter shuts down the Zend Accelerator’s duplicate function check, so
that the errors will not occur.
This parameter belongs to The Zend Accelerator settings in the PHP Settings screen (Configuration |
PHP Configuration | Extensions | Zend Platform).
Reset Accelerator
Programmatically resetting the Accelerator with accelerator_reset()
You can programmatically reset the Accelerator by calling the PHP function accelerator_reset() from
within your PHP script.
Note:
Under certain circumstances, such as a busy server or complex PHP processes, it may take a few
minutes to reset.
While Platform Performance Accelerator is being reset, a certain degree of server performance
degradation takes place, since the accelerated scripts cannot be used during the reset period. The
server will run as if Platform Performance had not been loaded.
Note:
Platform Performance Accelerator memory is also reset whenever the Web server is restarted.
117
Zend Platform User Guide
File Compression
The File Compression settings are accessed from Performance | Settings.
In order to maintain that Cached files improve overall performance, compression settings should be
defined. These settings determine which files should be compressed. The mode of compression is
GZIP format - if the browser supports this format (If not, the data will be transferred unzipped).
To define compression settings:
Go to: Performance | Settings and go to the File Compression section of the settings screen. Select
the file compression option that reflects your requirements.
Figure: File Compression Settings
File compression options are as follows:
None - File outputs are sent to the browser as is.
Only Cached Files - Only the cached files are transferred to the browser in a GZIP format-if
the browser supports the format. If not, the data will be transferred unzipped.
All Files - Both accelerated and cached files are transferred to the browser in a GZIP format-if
the browser supports the format. If not, the data will be transferred unzipped.
Recommended:
The recommended compression option is "Only Cached Files", since the compression capabilities make
use of the Dynamic Content Caching and there is no extra overhead for generating the compressed
file (except for the very first time the URL is accessed.) Compressing accelerated files may cause
some overhead and affect the overall performance. Use "All Files" if your main concern is improving
the download time for the user.
Note:
There are some instances where it is preferable to deactivate compression for select files.
To deactivate compression:
Deactivate compression entirely - should be done if the server is set to handle compression
to prevent compressing files twice and rendering them unusable or when using PHP’s
compression feature zlib.
Setting compression to "cached files only" - should be done when there is a large quantity of
cached files and the rest of the files do not require compression.
Blacklist - selectively disable compression for files do not require compression such as
pictures that are already compressed or small files that do not require compression.
118
Files under 1k are not compressed at all.
Zend Platform
Code Compression
The Code Compression settings are accessed from Performance | Settings.
Code compression is the process of using less bandwidth and increasing performance by compressing
code before it is sent.
When to compress files
The default setting for file compression is Off. However, files should be compressed under the
following conditions:
When the Web application’s users are accessing the Web application with various low
bandwidths that can benefit from the extra performance gained by compression.
When there is a large quantity of Cached files.
When not to compress files
There are some instances where it is preferable to deactivate compression for select files.
Compression can be deactivated in several ways:
Deactivate compression entirely - should be done if the server is set to handle compression
to prevent compressing files twice and rendering them unusable.
Setting compression to cached files only - should be done when there is a large quantity of
cached files and the rest of the files do not require compression.
Blacklist - selectively disable compression for files do not require compression such as
pictures that are already compressed or small files that do not require compression.
When using PHP’s compression feature zlib.
Setting Code Compression
The following procedure describes how to change Code Compression settings.
To change File Compression settings:
1.
Go to Performance | File View
2.
Select the appropriate Setting:
a.
None - disables Compression
b.
Only Cached Files - applies compression to cached files only
c.
All Files - collectively applies compression to all files (The list of files can
be viewed in Performance | File View).
119
Zend Platform User Guide
Content Caching
Contents:
Caching with the File View
Caching with the Performance Test Reports
Zend Cache Extension
URLs
Dynamic Content Caching (Full Page Caching) is the process of running code once and saving the
output on the server for reuse in a set time frame (Cache Lifetime). Each time the code is requested,
performance is improved by using the already run output instead of generating the same output each
time.
An additional performance boost can be gained by utilizing client-side caching for "full page" cached
content. Client-side caching is transparently supported in most browsers, providing an additional
improvement to your user's experience (the performance boost is obtained when the client's browser
caches content for fast access in subsequent requests, only when the content changes will it be
physically retrieved from the Web Server).
When Should Files be Cached?
Files should be cached when their content is stable and does not require frequent changes.
When Not to Cache Files?
Caching is not recommended for files that have constantly changing output. For example: clocks,
timers and database queries. (See Caching Alternatives to find out how to apply Partial Page Caching).
How to Activate Caching
The following procedure describes how to activate and define global caching settings. The global
caching settings determine if Caching in general will be activated or not.
Caching by default is enabled (set to "ON"). In order to view/change the setting:
1.
Click the Performance tab.
2.
Pick a server to configure.
3.
Click the Settings tab.
The dynamic caching enabled settings status will be displayed. Next, define the default caching
settings. These settings are applied to all cached files.
To prevent unnecessary memory use, caching has to be actively applied to either a selected file or
directory.
The performance module provides three options for caching files:
120
Through the File View
Through the Performance Test Report
Through the URL Tab
Zend Platform
Caching Alternatives
Web pages that contain sections that continuously change can also be cached. This partial page
caching solution can be accomplished through, applying caching APIs to portions of code that do not
change. Partial Page Caching provides an intermediate solution for providing a partial performance
boost that sustains the accuracy of changing content.
To find out more about "Partial Page Caching" go to: Partial and Preemptive Page Caching.
Note:
Dynamic Content Caching can be deactivated from Performance | Settings and changing Dynamic
Caching Enabled to Off. This will remove all Dynamic Content Caching settings from the files on the
server.
Partial Page Caching will not be affected and can be disabled by, removing the Caching APIs from
the code. The Partial Page Caching APIs will be deprecated in the next release and are
replaced by the Zend _Cache API (List of deprecated functions).
Caching using the Zend_Cache APi can be disabled by setting "caching enabled" to "Off" from the
GUI: Performance | Setting | Partial Caching section or by setting the directive: zend_cache.enabled
= 0 in the zend.ini.
121
Zend Platform User Guide
Caching with the File View
Caching can be applied to single files or do entire directories.
Go to Performance | File View and choose one of the following options:
1.
Apply Caching to a single file
2.
Apply Caching to an entire directory.
Specific caching settings, given to files and directories, override the main settings defined in:
Performance | Settings.
122
Zend Platform
Caching with the Performance Test Reports
The Testing tab is accessed from Performance | Testing.
Performance Test Reports provide site analysis information in terms of performance gain and
popularity. The information included in these reports provides a strong basis for evaluating if a file
should be cached.
Figure: Performance Test Report
This screen shows if a file is cached and provides an option to cache a selected file from the list.
This procedure describes how to cache files directly from the Site Analysis Report. This method of
caching is a shortcut to the file caching done in Performance | File View and the changes made here
will be automatically applied to the File View settings. The advantage of caching directly from the test
report is having the report information directly visible to assist in deciding which files should be
cached.
To Cache a file from the Site Analysis Report:
1.
Go to Performance | Testing and select the Analyze Site Tab.
2.
Run a performance test (or view the last performance test)
3.
Go to the test results and press Edit. This will open the "Define Caching Conditions"
dialog.
The settings will be updated in Performance | File View.
123
Zend Platform User Guide
Zend Cache Extension
The Zend Cache Extension is a collection of APIs for realizing advanced partial caching capabilities.
This API complementary addition to the existing "full page caching" and "partial page caching".
The Zend Cache API extends caching capabilities to include the following functionality:
Basic:
•
Storing Variables to the Cache
•
Fetching Variables to the Cache
•
Deleting Variables from the Cache
•
Clearing the Cache
Advanced:
•
Disk/Memory (SHM) storage
•
Caching using namespaces
•
Cache folder depth configuration
•
Client-side caching utilization
All functions can be used to Cache using Memory or Disk.
A complete list of the Zend Cache APIs and Directives can be found in the References section.
Disk/Shared-Memory Caching
This feature provides the options to determine where to store cached variables. Memory caching
improves server responsiveness primarily in environments that are running high-traffic applications
that need to off-load activity directed towards their Hard Disk in order to help increase performance
and responsiveness. Disk caching is more suitable for smaller applications and also ensures the
cached content is available after restarting the machine.
SHM/Disk storage is implemented by using the appropriate API functions and configuring the Zend
Cache directives.
Note:
The memory option error messages have been put into place to maintain that if you run out of
allocated memory or the store operation fails you will be notified.
Example:
The following example shows the different storage options:
A simple key with no namespace stored on disk
if (zend_disk_cache_store("hello1", 1) === false){
echo "error2\n";
exit();
}
Shared memory:
if (zend_shm_cache_store("hello1", 1) === false){
echo "error2\n";
exit();
}
Store with namespace on disk
if (zend_disk_cache_store("ns1::hello1", 1) === false){
echo "error2\n";
124
exit();
Zend Platform
}
Shared memory:
if (zend_shm_cache_store("ns1::hello1", 1) === false){
echo "error2\n";
exit();
}
Store with namespace on disk with limited lifetime (3)
if (zend_disk_cache_store("ns3::test_ttl", 2, 3) === false){
echo "error12\n";
exit();
}
Shared memory:
if (zend_shm_cache_store("ns3::test_ttl", 2, 3) === false){
echo "error12\n";
exit();
}
'namespace' Support
Using 'namespaces' for caching provides the ability define a key that will serve as an identifier to
delete select items from the cache rather than unnecessarily removing shared instances. 'namespace'
support is intended for environments running large applications that are separated into modules.
Applying a 'namespace' to each module will provide the identification necessary to pinpoint all cached
items belonging to a given module and remove only them.
Naturally this does not mean that in order to clear the cache you will need to use the 'namespaces' as
there is still the option to clear the entire cache using the 'output_cache_remove' functions
Setting the cached 'namespace':
Cache name space could be set by adding it as a prefix to the cache with '::' as separator.
Example:
The following example shows how to manipulate variable caching using a 'namespace':
zend_cache_store("my_namespace::my_key",$data) can be fetched with
zend_cache_fetch("my_namespace::my_key"); zend_cache_clear("my_namespace") will
clear all the keys starting with "my_namespace::")
Cache Folder Depth Configuration
Defining the Cache folder depth is intended for environments that use a large amount of keys. By
definition, cached content is separated into different directories by key to prevent performance
degradation caused by accessing files containing large amounts of content. This option is only
available with Disk Caching. Increase the cache folder depth according to the quantity of content that
requires caching (small amount = 0, large quantities = 2).
Note:
A single directory may include several keys depending on the quantity of cached content.
The cache folder depth is defined by the directive: zend_cache.disk.dir_levels. The accepted values
are 0,1,2 the values represent the levels that the cached files are stored.
0 = one directory containing all the Cache files
1 = a separate directory under the Cache directory
2 = an additional sub directory for cached content under the cache directory
125
Zend Platform User Guide
ETag/"Last modified" headers support
On the first request to the server, the server sends the client 'Last-Modified' entity-header field
containing the time-stamp, that is, the time when the page was created. If the client makes a
conditional request for the content by sending an 'If-Modified-Since' header (or If-Unmodified-Since
header), when the server gets the request, one of the following occurs:
•
The server validates the requests against the current validator for the entity, and if there is a
match then the cache is valid and it can be used by the client. In this case, the server
responds with a special status code 304 (Not Modified) and no entity-body - i.e. it doesn't
send the actual body. In this case, the client will use the content from the local cache.
•
Otherwise, the cache has expired, and a new content is returned to the client.
Cache tag is a feature of HTTP usually implemented by proxy or reverse proxy servers, that enables
the server to identify content (page) by an identifier or tag. It uses attributes in the HTTP headers
(see detailed requirements section for more details). On the client side, this feature is supported outof-the-box in all modern browsers.
If the same URL is requested again, the tag is sent in the request. The server can decide whether to
send the entire content again (if it was changed for example) or to reply with an HTTP 304 response,
meaning the content is unchanged. In such case, the response does not include the body in the
content and the content is fetched from the browser's cache.
For Platform 3.5, only the HTTP Caching Validation model is to be implemented.
The Expiration Model may raise some inconsistencies when content on the server-side is updated or
'clear-cached'.
Detailed Requirements
Full information can be found at HTTP RFC 2616 Chapter 13 - Caching in HTTP: [1]
(http://www.w3.org/Protocols/rfc2616/rfc2616-sec13.html)
Basically, there are 2 models of client-side caching utilization in HTTP – Expiration Model; Validation
Model - where E-tags can be used in the latter one.
E-tag (Entity tag) response-headers are used in order to implement this functionality. It provides a
more reliable validation in situations where it is inconvenient to store modification dates. That is,
instead of working with time-stamps in the attributes mentioned above, entity tags, that are
identifiers for the server, are put for any content. E-tags are used as request validators and they are
put in one of the following header fields:
•
If-Match
•
If-None-Match
•
If-Range
Pros: More safe on the server.
Cons: more complex to be implemented, a bit more efficient.
126
Zend Platform
File View
Contents:
Change and Define Virtual Hosts
Dynamic Content Caching
Blacklists
The File View tab is accessed from Performance | File View.
Most performance configurations are done in the File View screen. Before describing the configuration
tasks, it is important to understand the screen’s layout and functionality.
The File View screen consists of two sections:
1.
The Tree View on the left displays the list of directories and provides options for filtering the
view (By status: Cached, Accelerated, Acceleration Blacklist, Compression Blacklist) the
Virtual Hosts list is also updated from here.
2.
The File View on the right lists files and their status, and also includes the different caching,
acceleration and compression options that can be applied to selected files or to entire
directories.
Figure: File View - Tree View and File View Sections
Note:
Status changes made in the File View screen are immediately reflected on the screen. However, the
actual changes take affect only after manually restarting the HTTP Server. A reminder to restart
Apache, will appear on screen after changes are made and disappears only after restarting the server.
Clone Settings: To configure multiple servers or a server group with the same file settings: (1)
configure a selected server and (2) then use the Quick Clone button to propagate settings from that
server to other server nodes.
127
Zend Platform User Guide
Tree View
The Tree View on the left displays the directories available under a selected document root. All the
directories are listed by default.
The list includes filtering options to display directories by file type. To filter the list, select the file type
from the drop down list.
The filtering options are: All Files, Cached Files, Acceleration Blacklist Files, and Compression Blacklist
Files.
To refresh the list of files displayed on the right: click a directory’s name.
Tree View - Virtual Hosts List
The Tree View lists all the directories and files in the default Document Root as well as any Document
Root listed in the Vhost List. Displaying all the directories and files enables to view files included in the
Document Root directly from Zend Platform and select files for Dynamic Content Caching.
Upon initial setup it is important to verify that all the applicable Virtual Hosts are included in the
Virtual Hosts List for two distinct purposes:
1.
To Benchmark test cached files. The Zend Benchmark (Performance | Testing) tests URLs per
Virtual Host.
2.
To update the File View option to reflect all Virtual Host’s Document Roots.
The Tree View option maps the entire Server’s Document Roots providing a single view for displaying
all the available directories and their contained files. Adding and deleting a Virtual host should reflect
the actual Document Root activity on the server (i.e. if you add/remove a document root from the
server, you should add/remove its respective Virtual Host from the list).
Note:
The initial installation process creates a default Virtual Host list however; this may not include all the
required virtual hosts and some may need to be added/removed.
128
Zend Platform
Updating the Virtual Hosts List:
In order for Platform Performance to display files residing in a particular Document Root, you must
add the Virtual Host to the list
The Virtual Host list in the File View reflects the current Virtual Host list as defined in Manage Cluster.
You can update the list directly from the File View.
To Add or Remove a Document Root:
Go to Performance | Settings, and select Update Virtual Hosts to open the Virtual Hosts list.
Figure: Update Virtual Hosts List
This screen includes two sections:
•
Update Virtual Hosts List - add a Virtual Host
•
Current Settings - Remove a Virtual Host and view current virtual hosts on the
server.
Make sure that all the necessary Virtual Hosts are displayed in this list if not use "Update
Virtual Host" to modify the list as necessary.
To update the Virtual Host list:
1.
Go to Performance | File View and select Update Virtual Hosts List from the options
at the top of the screen. This will open the Update Virtual Hosts List screen.
2.
Specify the virtual host’s details and provide an alias for the Virtual Host under
Vhost Name.
3.
Press Add to save the new Virtual Host and add it to the Virtual Hosts list.
129
Zend Platform User Guide
File View - Dynamic Content Caching
The File View displays files in a table, which can be sorted by column. The sorting options are: Status,
File Name, Lifetime and Conditions.
Once all the Virtual Hosts have been established, and the default Caching Conditions have been set;
specific Content Caching settings can be applied to selected files or directories.
Content Caching activities include the following in chronological order:
1.
Define default caching settings
2.
Modify file settings
3.
Fine tune caching conditions
4.
Define files to blacklist
Define Caching Settings:
The File View screen lists all the directories and files in the default Document Root as well as any
Document Roots listed in the "Vhost List".
Any cached file that has not been explicitly defined, automatically inherits the default cache settings
To open the File View screen, go to: Performance | File View.
Figure: File View
The File view screen provides the following Full Page Content Caching options:
Cache - Select files to be cached and select, to enable content caching for the selected
files.
Do not Cache - Disables Content Caching for the selected files.
Define Cache - Displays the "Define Caching Conditions" screen to add detailed
configurations for selected files.
130
Update Blacklists - Opens and modifies the current Blacklist.
Clean - Cleans cached file copies.
Undo - Cancels the last change to the settings.
Zend Platform
Modify File Settings
To Modify File Settings:
1.
Select a directory in the Tree View. The list of files residing in that directory is
displayed in the File View.
2.
Check the box next to the file(s) you wish to modify or the directory to select all files
(and sub-directories) under it.
3.
Click on the relevant icon in the toolbar.
Fine Tune Caching Conditions
The following procedure describes how to change caching conditions per file or group of files.
To modify Caching Conditions:
1.
Check the box next to the directory or cached file(s).
2.
Click Define Cache to open the Define Caching Conditions Dialog. (Alternately, click
on a Cached file i.e. a file with the Cached indicator
3.
next to it).
Apply Caching settings and press Save to save and close the dialog.
Figure: Define Caching Conditions
Modified settings are displayed in the File View Tab next to the selected file/s. Restart the Web server
in order to activate the new caching conditions. The restart server message remains on the screen
until the server is restarted.
The Define Caching Conditions dialog includes three buttons:
Restore Defaults - Returns to the default caching settings.
Save - The new settings are saved and are reflected on the screen but the changes will take
effect only after restarting the server.
Cancel - Cancels the new changes and returns to the previous settings.
131
Zend Platform User Guide
Caching conditions may also apply to Variables stored in an Array.
Note:
Go to "Default Dynamic Caching Condition Parameters" for a complete list of applicable conditions.
Note:
The zend_cache.ini file contains the list of all the files and directories assigned for Dynamic Content
Caching including all the Conditions, as follows:
Use the File View to define the files and directories to be cached.
Do not edit this file manually!
zend_cache.lifetime=360
zend_cache.depends=ALLGET
zend_cache.path="/usr/local/apache/htdocs/hello.php"
zend_cache.lifetime=360
zend_cache.depends=COOKIE:my_cookie
A large cache.ini file can possibly result in slow performance. Therefore, it is recommended to uncache (in the File View) any file deleted from the server.
Define files to Blacklist
The Blacklist separates acceleration and compression settings for files. With the blacklist users can
prevent files from being accelerated or compressed. Click here for more information on Blacklists.
132
Zend Platform
Change and Define Virtual Hosts
Change Virtual Hosts is accessed from Performance | File View and clicking "Update Vhosts List"
This procedure describes how to change and define virtual hosts. Virtual Hosts enable Zend Platform
users to maintain more than one server by differentiating them by host name - virtual hosts.
To update the Virtual Host list:
1.
Go to Performance | File View and click "Update Virtual Hosts List" from the options
at the top of the screen.
The Update Virtual Hosts List screen opens
2.
Specify the virtual host’s details and provide an alias for the Virtual Host under
Vhost Name.
3.
Click "Add" to save the new Virtual Host and add it to the Virtual Hosts list.
Make sure that all the necessary Virtual Hosts are displayed in this list if not use "Update Virtual
Host"; to modify the list as necessary.
This screen includes two sections:
1.
Update Virtual Hosts List - add a Virtual Host
2.
Current Settings - Remove a Virtual Host and view current virtual hosts on the server.
133
Zend Platform User Guide
Dynamic Content Caching
Dynamic Content Caching is accessed from Performance | File View and clicking "Define Cache"
The concept behind Dynamic Content Caching is to store results of a first execution of a dynamically
generated Web page. In this way, further requests made to the same page, will go to the Cache.
Consequently, avoiding the overhead incurred by executing an application that renders output that
does not change.
Zend Platform offers three ways to Content Cache files:
Full Page Content Caching - for cases where it is possible to cache an entire output.
Partial Page Content Caching - for cases where it is impractical or impossible to cache the
entire output.
URL based Content Caching - for cases where the URL should indicate the content for
caching.
Caching Definitions
The following definitions apply to both Caching methods. Make sure to configure Caching definitions
before starting to cache content.
Output Location
The output location for cached content (Full Page) is defined in the directive:
'zend_accelerator.output_cache_dir'.
A directory structure mirroring your directory will be added under this location and cached content will
be placed and taken from this directory. The Partial Page caching content directory will also include
additional sub directories to handle the partial content.
Partial caching's disk content cache location is defined in the directive: 'zend_cache.disk.save_path'.
Disk Space
Cache disk space limits are defined in by Performance | Settings | Dynamic Content Caching using the
following directives:
zend_accelerator.max_cached_filesize - Max cached size for content cache (Kbytes)
zend_accelerator.min_free_disk - Min disk space to leave free for content cache (in M or %)
There are two caching conditions that can be applied to files:
Default Full Page Content Caching settings can be applied to all files marked as cached in:
Performance | Settings and going to the Dynamic Content Caching section of the settings
screen.
Specific Full Page Content Caching configurations can be applied to specific files by going to:
Performance | File View.
Full Page Content Caching
Default Full Page Content Caching settings are applied to all files marked as cached in: Performance |
Settings and go to the Dynamic Content Caching section of the Settings screen.
134
Zend Platform
The content caching options are as follows:
Dynamic Content Settings
Default Caching Conditions
Default Dynamic Caching Condition Parameters
Figure: Dynamic Content Caching Settings
Dynamic Content Settings
The lifetime and conditions settings in the Settings tab are default values. These settings can be
modified per file or per directory in the File View workspace.
Dynamic Content Caching Settings are as follows:
Dynamic Caching Enabled - On The Dynamic Content Caching is active and working. Off The Dynamic Content Caching is not in use.
Maximum Cache Size -The maximum size allocated for cache. Occasionally and for short
periods of time, this value may be exceeded but only until the next time that the Cache
Cleaner deletes the files that expired. Set to "0" for an unlimited cache size.
Minimum Free Disk space - The minimal reserved free disk space required. Reaching this
value will end any further caching. The caching will resume as soon as the space is greater
than this value.
Maximum Cached File Size - The maximum allowed output cache file size. An output cache
file that exceeds this value will not be cached. Set to "0" for an unlimited cache size.
Default Cache Lifetime - The lifetime, in seconds, of cached data. The data will be regenerated if the cached version is older than the expiration time.
Note:
The Cache Cleaner is directly related to the directive zend_accelerator.cache_cleaner_freq that can be
defined in the Configure PHP Settings screen. This directive defines when expired cache files are
removed from the cache.
Default Caching Conditions
By default, Dynamic Content Caching, caches each request based on its full URL (ALLGET). You can
condition the settings to be more general or more specific, as desired.
To change default caching conditions:
Go to Performance | Settings and go to the Dynamic Content Caching section of the settings screen.
Select, "Change Default Conditions" to open the "Define Default Caching Conditions" dialog.
135
Zend Platform User Guide
Figure: Define Caching Conditions Dialog
The default caching condition is ALLGET, which means that the entire GET string is used to identify a
cached item. The GET string includes everything that appears after the question mark in a URL. (The
ALLGET variables can be found in the $_GET PHP array as well).
The following actions and conditions can be applied to the Default Caching settings:
To limit the ALLGET condition, select "Except" from the restrictions drop down list, to exclude
a specific GET variable from the ALLGET.
To change the ALLGET condition, select a new condition from the drop down list.
To add another condition, click "Add Condition" and select another condition type from the
list. Type the variables in the new condition row and restrict if necessary. The same condition
can be used several times, each time with a different restriction.
To remove any condition, click the delete icon next to the condition you wish to cancel.
To change the Cache Lifetime’s duration, type the new number (in seconds).
When all configurations are completed, click "Save" to save and close the dialog. Modified settings will
be immediately displayed in the Settings tab. Click "Apply Changes" and restart the Web server to
activate the new caching conditions. The message will remain on the screen until the server is actually
restarted.
Note:
Caching conditions may also apply to Variables stored in an Array.
Using Regular Expressions to Define Cache Conditions
Caching conditions can also be set using regular expressions to create conditions. Use the Match
regexp and Dismatch regexp options to define caching conditions. These can either be case-sensitive
or incase-sensitive. The regexp format is: "Unix Regular Expressions Format".
Default Dynamic Caching Condition Parameters
The following lists and describes each of the applicable parameters.
GET - Indicates that you have selected certain GET variables. For example, consider the URL:
http://www.mysite.com/myscript.php?color=blue&size=L. When set to ALL GET, a new
request for myscript.php?color=blue&size=M, will not be taken from the cache and will be
regenerated. If, however, the setting is changed to GET, with the value ’r;color’, then the two
URL requests would both be taken from the same cache content, regardless of the order of
136
Zend Platform
the variables in the request string. (The GET variables can be found in the $_GET PHP array
as well).
COOKIE - The Cookie variable is the variable given in the HTTP cookie. (It can be found in
PHP $_COOKIE array as well). By selecting a cookie variable, it will also be considered a
determining factor for cache hits, in the same way that GET variables are considered.
REQUEST - The variable is set by the GET or COOKIE methods. (Can be found in PHP
$_REQUEST array as well).
SERVER - Server variable is set as a server environment variable When selecting a server
variable, (those listed in PHP $_SERVER array) it will also be used as a determining factor for
cache hits, in the same way that GET variables are considered. To define a Server variable,
select a variable from the list or choose Add a new variable to type in another variable.
SESSION -The SESSION variable is useful when PHP sessions are in use. (Can be found in
PHP $_SESSION array as well).
Notes:
1. If a script is cached using a SESSION variable and the session does not start in this script,
the script will not be cached.
2. If a script is cached using a SESSION variable, yet the cookies are disabled on the user
side and the SESSION ID is embedded directly into the URL, the caching will not take place.
ALLSESSION - The script depends on all of the variables present in the session. (Can be
found in $_SESSION PHP array as well).
Note:
It is mandatory to choose at least one Dependency.
137
Zend Platform User Guide
Blacklists
Blacklists are configured from Performance | File View and clicking "Blacklist Files"
This procedure describes how to update the Blacklist. The Blacklist separates acceleration and
compression settings for files. With the blacklist users can prevent files from being accelerated or
compressed. The blacklist is accessed from: Performance | File View and pressing the Update Blacklist
Files button.
Figure: Update Blacklists Dialog
To update the Blacklist:
1.
Select a file or files from the File View by clicking the check box next to the file
names.
2.
Click "Update Blacklist".
This will open the Update Blacklists dialog with a list containing the selected files in
the dialog.
3.
The following options can be applied to each file:
•
Add a file into the Acceleration Blacklist - Check the 'Don't Accelerate' box.
•
Add a file into the Compression Blacklist - Check the 'Don't Compress' box.
•
Remove a file from a blacklist - Un-check the appropriate box.
•
Add all the files to a blacklist - Check the appropriate box in the 'Select all' line
at the top of the files list.
138
Zend Platform
This dialog has two distinct sections:
1.
Update the Blacklist - for defining blacklist criteria for selected files
2.
Current Blacklisted Files - for viewing current blacklist settings
Current Blacklisted Files:
This section displays a list of files that are either not accelerated or not compressed or both. Files in
the Compression Blacklist are not compressed (whether they are cached or accelerated).
To see the files in a blacklist, click on the Expand button.
Note:
Only single files (not directories) are added to the Blacklist.
139
Zend Platform User Guide
When to Blacklist Files
There are some cases where files should be blacklisted. In general, files are blacklisted when an entire
directory except several files should not be accelerated or compressed. Another distinct instance is
when files are automatically generated or change more than twice a day. Auto generated files (like
Smarty cache) may impede performance by causing a lot of cache misses. This instance requires that
you manually blacklist the entire directory.
There are three distinct instances where files should be blacklisted:
1.
Incompatible Files - some files change their behavior when accelerated due to the way
they were written such as in cases where there is a dual declaration with an else condition
using the same class names.
2.
Extreme File Size - always blacklist files that are very large and contain extremely long
amounts of code as they generally consume large amounts of shared memory cancelling the
performance gain archived by the Accelerator.
3.
Auto Generated Text - always blacklist files that are automatically generated or change
more than twice a day as they can cause caching problems which will influence the overall
performance. In this case, the entire directory should be blacklisted. If the directory includes
files that should be accelerated it is recommended to move them to a separate directory.
The Platform User interface does not permit blacklisting an entire directory as it works on a per-file
basis. Essentially you can in Performance | File View select a directory (by clicking the checkbox next
to file name in the file view) and then in the "Blacklist files" dialog expand the file list and select each
file to be blacklisted. However, this method is only practical for directories that have a small amount
of files. Large directories can be manually blacklisted. In cluster environments the settings can
subsequently be applied to other servers in the cluster by using the "Clone files" option.
The following procedure describes how to manually blacklist entire directories:
To Blacklist an entire directory:
1.
Open and edit the file user_blacklist.ZendAccelerator.txt.
The file's location is defined in your php.ini under the directive
zend_accelerator.user_blacklist_filename and the default location is
$ZP_PREFIX/etc/cache/user_blacklist.ZendAccelerator.txt
2.
Add the directories the need to be Blacklisted and make sure that only content that
is automatically generated in included in these directories so to not exclude files that
could benefit from being accelerated.
3.
Save and close the file.
After completing the procedure the blacklist definitions can be applied to other servers belonging to
the cluster by clicking "Clone Files" and selecting the server/s to which you want to apply the settings.
140
Zend Platform
URLs
The URLs tab is accessed from Performance | URLs.
This procedure describes how to apply caching to content by URL. URL based caching extends the
concept of caching files and applies it to URLs. Caching by URL facilitates the ability to eliminate
situations when the same file is used in multiple instances such as when using the same file as a redirector to several pages.
Before applying Caching settings to a URL, review the global default settings in Performance | Settings
and if necessary, modify the change the default settings before applying caching conditions to a URL.
To define URL base caching settings:
1.
Go to Performance | URLs
2.
Click "Add URL".
The "Add New URL Caching Conditions" dialog will open.
3.
Enter the URL and configure the different settings (see below for a list of the
settings and their descriptions).
4.
Click "Add Condition" to add more than one caching condition to the URL and click
"Save" to save the settings and close the dialog.
The new Caching Setting will be applied to the content for the specified URL.
This process can be repeated for different URLs only. If you have other conditions that should be
applied to a URL that is already in the list, click on the item in the list to display the settings in
editable format and apply the changes to the URL.
Caching Options
Add URL - Opens the 'Add New URL Caching Conditions' dialog.
Clone URL - Enabled only if one row is checked (multiple selections are not accepted). Opens
the 'Add New URL Caching Conditions' dialog, populated with the content of the selected row
in editable mode. Modifying the settings and clicking "Save" creates a new URL entry.
Clicking save without changing anything will not create a duplicate entry.
Remove URL - Enabled only if one or more rows are checked. Used to delete an item from
the caching list.
Cache - Enables caching on the selected URL(s) and turns the status indicator green.
Don't Cache - Disables caching on the selected URL(s) and turns the status indicator grey.
Define Cache - Enabled only if 1 or more rows are checked. Clicking it opens the 'Define URL
Caching Conditions' dialog to edit caching conditions for one or more selected entries
together.
Clean - Empties the cache for the selected URLs.
Undo - Undo previous operation.
141
Zend Platform User Guide
Add New URL Caching Conditions Options
URL - The URL to be cached. A valid URL contains http or https and must have at least one'
/' after the host name (domain) for example:
http://example.com - not valid but, http://example.com/ - valid.
Exact Match - This option will make sure that only the specified URL is cached and not any
other variants or URLs that contain the string. For example selecting the option "Exact Match"
for the URL 'http://example.com/categories' will ascertain that only this specific URL is
cached and nothing else. However, if the user doesn't select 'Exact Match' the URL must start
in the same prefix but can have anything after the prefix.
Lifetime - the lifetime of the cache in seconds.
Conditions - similar to the one used in File View Caching Conditions. The data will be regenerated if the cached version is older than the expiration time.
142
Zend Platform
Testing
Contents:
Test URL
Test Download
Additional Variables
Analyze Site
The Testing tab is accessed from Performance | Testing.
The Testing workspace shows you the improvement achieved in performance by Zend Platform
Performance.
In addition, it identifies files that are prime candidates to be cached-a convenient feature during initial
configuration.
There are three tests, which you can run:
Test URL - Tests a single script, running both the Performance and the Compression tests at
the same time. The test results indicate the script improvements achieved by Code
Acceleration, Dynamic Content Caching and File Compression.
Test Download - Tests the efficiency of the Enterprise Server feature, Zend Download Server.
Analyze Site - Tests performance for the entire site by running the Performance test
separately from the Compression test. The test results indicate the overall script
improvements achieved by Code Acceleration, Dynamic Content Caching and File
Compression and the popularity of each file.
All test results can be sent by e-mail to view or archive performance information.
143
Zend Platform User Guide
Test URL
The Test URL option is accessed from Performance | Testing and selecting the Test URL tab.
The following procedure describes how to test URLs. Test URL, tests a single script, running
Performance and Compression tests at the same time. The test results indicate the script
improvements achieved by Code Acceleration, Dynamic Content Caching and File Compression.
To test a URL (Benchmark Web applications):
1.
Go to: Performance | Testing and select the Test URL tab.
2.
Click "Test URL" and type the full path of the script. To select a previously tested
URL, click "Show History". By default, URLs are tested using GET variables defined in
the query string.
3.
Click "Add variables to URL" to add the variable Name and Value to test URLs using
specific SESSION or COOKIE variables. Add the User Name and Password to test
URLs that are restricted by HTTP Authentication.
4.
To delete any variable from the list, click "Delete" next to the variable.
5.
To determine a test's duration, specify the time in seconds (per script) in the
"Duration of test" box.
6.
Press Run.
Note:
To add specific SESSION variables to the test, make sure that your PHP is configured correctly to work
with sessions. For example: if you use 'files' as your session.save_handler, confirm that the
session.save_path is a valid path. If you use 'user' as your session.save_handler, you must prepend
the file containing the user-level session storage functions.
Test Results
The Test Results screen depicts the Dynamic Content Caching Results, the Code Acceleration Results,
and the File Compression Results:
Dynamic Content Caching Results compare between the Base script and the script after it has
been cached, and calculates the total performance improvement accomplished due to
caching.
Code Acceleration Results display the performance gain. If the script is cached, acceleration
does not improve performance acceleration is therefore not necessary
File Compression Results compare between the original file size and the compressed file size
and calculates the savings in bytes and the improvement in percentage.
Additional Variables
By default, URLs are tested using GET variables defined in the query string.
144
To test URLs using a specific SESSION or COOKIE variable, add the variable Name and Value.
To test URLs restricted by HTTP Authentication, add the User Name and Password.
Zend Platform
Test Download
The Test Download tab is accessed from Performance | Testing | Test Download.
The Zend Download Server (ZDS) is a transparent process that runs in the background to service
large downloads. The performance gain obtained by using the ZDS is measured with the Test
Download option.
The Test Download option checks the efficiency of the Download Server. Test Download simulates
multiple requests for a specified URL with and without the ZDS, thereby creating its own benchmark
for comparison. This feature is currently not applicable for Windows Operating Systems.
To Run a Download Test:
Go to: Performance | Testing and choose the Test Download tab.
1.
Enter the URL for Testing. (The default is a proprietary Zend PHP script which uses
zend_send_file() to send a file.)
Note: Testing very large files will take a very long time.
2.
Enter the bandwidth limit you want to simulate for the clients (For a faster test,
select a higher bandwidth).
Note: Do not select full bandwidth; doing so will saturate your network card that
will make the test irrelevant. The test tries to simulate a typical Internet server that
has clients connected either by ISDN or DSL.
3.
Enter the Max Clients value defined for your server. Insert the accurate value by
checking the MaxClients directive in the httpd.conf file.
Note: The ZDS installation tries to identify your MaxClients value via the httpd.conf
file that is the GUI’s default value, but this value can be changed after the
installation, so it is important to verify that the value listed is correct.
4.
Click "Run" to run the Download Test.
Viewing Download Test Results
Once the tests have completed, you can view the test results both statistically and graphically.
To view the results of the most recent Download Test:
From the Test Download Tab click, "Show Last Download Test Report". The test report
includes tables and graphs that display the Requests per Second and Number of Concurrent
Requests for each test run.
Note:
The Download Test is a simulation. The most meaningful test results are obtained by running ZDS on
the production server and monitoring the log file to see how many concurrent jobs the ZDS is
handling.
145
Zend Platform User Guide
Analyze Site (Benchmark)
The Analyze Site tab is accessed from Performance | Testing | Analyze Site.
The following procedure describes how to benchmark Web Applications.
To Benchmark Web Applications:
Go to Performance | Testing and select the Test URL Tab.
To test a script, follow these steps:
1.
Click Test URL and type the full path of the script. To select a previously tested URL,
click Show History. By default, URLs are tested using GET variables defined in the
query string.
2.
Click "Add variables to URL" to add the variable Name and Value to test URLs using
specific SESSION or COOKIE variables. Add the User Name and Password to test
URLs that are restricted by HTTP Authentication.
3.
To delete any variable from the list, click next the variable (To add specific SESSION
variables to the test, make sure that your PHP is configured correctly to work with
sessions. For example: if you use 'files' as your session.save_handler, confirm that
the session.save_path is a valid path. If you use 'user' as your
session.save_handler, you must prepend the file containing the user-level session
storage functions).
4.
To determine the Duration of test, specify the time in seconds (per script) in the
Duration of test box.
5.
Click Run.
Test Results
The Test Results screen depicts the Dynamic Content Caching Results, the Code Acceleration Results,
and the File Compression Results.
The Dynamic Content Caching Results compares between the Base script and the script after
it has been cached, and calculates the total performance improvement accomplished due to
caching.
The Code Acceleration Results displays the performance gain. If the script is cached,
acceleration does not improve performance acceleration is therefore not necessary.
The File Compression Results compares between the original file size and the compressed file
size and calculates the savings in bytes and the improvement in percentage.
When running the Analyze Site test, you can choose to run the Performance test separately from the
Compression test:
Performance Test results - indicate the average improvement achieved by Code Acceleration,
Content Caching and the average overall improvement achieved.
Compression Test results - present the improvement accomplished due to the File
Compression.
146
Zend Platform
To Analyze a Site:
Go to: Performance | Testing and select the Analyze Site tab.
The following options are presented in the tab:
Run Performance Test
Run Compression Test
Show Last Performance Test Report
Show Last Compression Test Report
Performance Test
To run a performance test:
1.
Select the number of scripts to test and press Next.
2.
The following screen lists the scripts selected. To change the number of the scripts
to be tested, click "Previous". To continue, click "Next"
3.
The Site Analysis Report appears indicating the Performance Gain and Popularity
Rank of the scripts.
N/A Test Results
The following procedure describes how to investigate N/A test results. N/A test results can be caused
by various reasons.
To check the cause of a N/A test result:
Place the cursor on top of the N/A and the cause of the problem appears in a Tooltip.
N/A can be caused when a script cannot be accessed or if the access time to the script is
greater than the test duration (3 sec). If this is the case, test the script separately using the
Test URL option.
After analyzing the test results you may wish to modify the caching status of the scripts and
re-run the test.
To re-run the test:
Click "Edit" next to the script you wish to modify, change the caching conditions and save the
new settings. If the message appears, the test results are incorrect since the changes you
made did not take effect. In this case, restart the server and simulate a typical user session
to get valid results.
Compression Test
The Compression test analyzes download time improvement of the popular scripts as the result of
Compression.
To run a compression test:
1.
Click "Run Compression Test".
2.
Choose the number of scripts to test and click "Next".
3.
To ensure accurate results for the scripts, add query strings in the Script Path
entries. For example: /site/example.php?var1=value1&var2=value2).
4.
Click "Run" to run the test.
147
Zend Platform User Guide
The Site Analysis Report screen details the results for the compression test. The report shows the
original script size, along with the compressed size and the compression improvement rate. The actual
compression functionality is not affected.
Note:
If one or more scripts failed the test, an indicative message appears on the screen. The Compression
Test failed since Platform Performance cannot resolve the URL from some script paths or the URL
cannot be accessed. Note that scripts defined on a virtual host or a symbolic link can cause the test to
fail.
Show Last Test Reports
The last Test Results summary is displayed in the Testing environment.
To display last Test Reports, click "Show Last Performance Test Report" or "Show Last
Compression Test Report".
The displayed Test Report will be updated as soon as you run another test.
Note:
Test results can also be sent by e-mail and stored outside Zend Platform
148
Zend Platform
Tuning
The Tuning tab is accessed from Performance | Tuning.
This tab allows users to define their Accelerator's performance level to increase PHP application
performance. Tuning helps improve performance by disabling the following features: Performance
(Caching, Acceleration and Testing), PHP Intelligence (Event collection) and Zend Guard (Obfuscation
and Licensing).
Depending on the environment some of these features may not be necessary for example: in
environments that do not deploy obfuscation and licensing the Guard features can be disabled by
using the Custom tuning level and selecting the options that disable licensing and obfuscation.
Tuning settings are applied to a selected node, the name of the server to which the changes will be
applied is displayed beneath the top navigation bar (use the "Change Server" option to select a
different server to tune).
There are four Accelerator Performance Levels:
Normal - Preserves normal activity without disabling any functionality.
Enhanced - Disables PHP Intelligence and Performance.
Extreme - Disables PHP Intelligence, Performance and Guard.
Custom - Allows to independently select which out of the six options should be disabled.
To apply Tuning Settings:
Select an option from the "Accelerator Performance Tuning Level" drop-down and press
Apply.
To view advanced options:
Click on the "Advanced Options" button to expand the list. A list of options with a detailed
description will be displayed. Use this list to also view and read the descriptions of the
options included under each tuning level.
To apply advanced options:
1.
Select Custom from the "Accelerator Performance Tuning Level" drop-down.
2.
Click on the "Advanced Options" button to expand the list.
3.
Check the options from the list to apply then to the server.
149
Zend Platform User Guide
Accelerator Performance Level Descriptions
Enhanced Accelerator performance tuning level
Applying this Accelerator performance tuning level impacts the following features:
PHP Intelligence - New events will not be collected.
Performance - File timestamps, consistency checksums and script timing will not be checked.
Therefore, Accelerator tests will be disabled, and the Accelerator cache will not be refreshed.
Extreme Accelerator performance tuning level
Note:
This Accelerator performance tuning level would, in some cases, cause your environment to become
unstable and even in-operable.
Applying this Accelerator performance tuning level impacts the following features:
PHP Intelligence - New events will not be collected.
Performance - File timestamps, consistency checksums and script timing will not be checked.
Therefore, Accelerator tests will be disabled, and the Accelerator cache will not be refreshed.
Guard - Obfuscated pages will become inaccessible along with files using Guard licenses.
Tuning Performance in i5 OS
The following procedure describes the actions that need to be performed to tune Zend Platform for
Optimal performance on i5/OS.
To tune performance, make sure that:
Zend Optimizer 3.3.2 or above is installed. This version is available as part of the Zend Core
2.5 package or as an update for Core 2.0.X. (Download Zend Core for free from:
http://www.zend.com/downloads)
The directive 'zend_optimizer.disable_licensing' is set to '1'
(zend_optimizer.disable_licensing=1) in Configuration | PHP Configuration.
Note: when set to Off, all code using Zend Guard Licenses will not be executable.
The directive 'zend_accelerator.use_cwd' is set to '0'
(zend_accelerator.use_cwd=0) in Configuration | PHP Configuration.
Important Note:
When set to Off (0), performance will be increased however, some existing applications including Zend
Core and the Zend Platform Administration Console will not be available.
All modules are loaded and enabled. These by default are loaded and enabled out-of-the-box.
Check to see they are loaded through the PHP Info tab (Configuration | PHP Info) or go to the
Configuration tab to load the modules (Configuration | PHP Configuration). The modules are:
Debugger, Download Server, Optimizer and Platform.
The Job Queues and Java Bridge daemons have been stopped. This is critical for weaker
machines. To disable the daemons, Go to the i5/OS command line and type "go
zendplat/zpmenu" Select the "Stop service menu" (option 2 ZPSTOP) and select the
options:
•
150
3 - Stop JavaMW server
Zend Platform
•
6 - Stop Job Queue Daemon
Set the Tuning Settings to Extreme (Performance | Tuning).
This will deactivate all non-critical functionality as follows:
•
zend_accelerator.validate_timestamps=0
Notes:
- Not needed for PHP 5.2.x
- When set to Off all changes to existing files require that you restart the Accelerator using
'accelerator_reset' to reset the contents of the Accelerator cache (or go to the section titled,
Code Acceleration).
•
zend_accelerator.consistency_checks=0
•
zend_accelerator.perform_timings=0
Note: When set to Off, Platform stops collecting acceleration info making the results in the
option: Performance | Testing | Analyze Site incomplete.
•
zend_optimizer.obfuscation_level_support=0
Note: when set to Off, all code obfuscated with Zend Guard will not be executable.
Note:
Performance tuning is set to Extreme by default since version 3.0.3a.
151
Zend Platform User Guide
Zend Optimizer
The Optimizer is a passive performance component that runs within the Platform Framework and
automatically optimizes scripts. Optimizer is also designed to detect and load files encoded with the
Encoder.
Note:
The Zend Optimizer’s default setting is 'On' which means the Optimizer will start to run as soon as
Platform is installed. The Optimizer component does not require any additional configurations.
If you do not plan to use the Optimizer to load encoded files, you can slightly improve the Optimizer’s
performance by adding the zend_optimizer.enable_loader = 0. This disables the transparent autoloading mechanism that is built into the Zend Optimizer.
To change zend_optimizer.enable_loader settings:
Go to Configuration | Configure PHP Settings and choose from the list of directives Zend |
Optimizer.
152
Zend Platform
Configuration Tab
Contents:
Studio Settings
Debugger Tunneling Port Limits
Configuring Preferences for Tunneling
PHP Configuration
Configuring Tunneling with Studio
PHP Info
On Demand Connection
Clone Wizard
Users are prompted to select a node before entering the configuration options tab. All configurations
are applied to the selected node. In addition, the top bars of screens indicate the name of the node.
The Quick Clone option in the Settings and PHP Configuration tab provides a shortcut to propagating
changes done in these tabs to other nodes.
This section includes the following options:
Server
PHP Configuration
PHP Info
153
Zend Platform User Guide
Studio Settings
The Studio Settings tab is accessed from Configuration | Studio.
Studio is Platform’s embedded integration with Studio's debugger. The Studio component is part of
the Platform node installation, ensuring that an instance of the debugger resides on every node.
Studio settings provide a way for allowing or denying accessibility to a selected server or to a
selection of servers (using a Net Mask which implements Wildcards on IP addresses).
Figure: Studio Server Settings
The Studio Settings screen displays the Studio settings for the selected node (The server is selected in
the server tree).
There are four settings categories:
Allowed Hosts - These are the hosts that are allowed to initiate debugging and profiling
sessions.
Denied Hosts - These are the hosts that are not allowed to initiate debugging and profiling
sessions, even if they are on the Allowed Hosts list.
154
Zend Platform
Allowed Hosts for Tunneling - These are the hosts that are allowed to use this node for
tunneling. The Zend Studio Tunnel is used for debugging PHP code across a Firewall to use
the integration with the Zend Studio. Note: Tunneling is not supported in Windows.
Other Settings - These are additional settings supported by Platform. Currently, "Expose
Remotely" is the only setting in this category. This setting determines whether the Debug
Server will expose itself to remote clients. This is required if you want the Zend Studio
Browser" toolbar to automatically detect pages that can be debugged.
The Settings screen is for Adding, Editing or Removing a host from the Allowed Hosts, Denied Hosts,
or Allowed Hosts for Tunneling categories. You can also assign a value (Always, Selective, or Never) to
the Expose Remotely setting for the selected node.
"Expose Remotely" settings:
Always - Will expose all hosts
Selective - Only exposes the hosts in the allowed host list
Never - Will not expose any host
To access the Studio Server tab:
1.
Go to Configuration |Studio.
2.
From the Server Tree, select the server you wish to configure (or whose settings
you wish to view).
3.
Click "Select "to open the Studio Server tab for the selected node.
To change or add a host to allow or deny tunneling:
1.
Go to Configuration | Studio.
2.
Click "Add" - for example, in the Allowed Hosts category to open the Add New
Allowed Host dialog box opens.
3.
Enter the Settings for the new Allowed Host.
4.
Click "Apply" - A new Host will appear in the Allowed Hosts category on the Server
Settings screen.
5.
To edit or remove a Host - for example, in the Allowed Hosts category, click "Edit"
or" Remove" (To the right of the Server Host you wish to edit).
You will be prompted to confirm your new settings click "Save" to save the settings to the database.
To set the Expose Remotely setting for the selected node, select a value, Always, Selective, or Never,
from the drop-down list provided and click save.
Net Masks:
The Net Mask option is used to define a string of IP addresses using wildcards * to specify the range
of IPs that are either allowed or denied hosts. This option, allows to specify a range of IPs from 0-255
according to the selected amount of wildcards for example if you choose to use the Net Mask option to
deny the following IPs: 24 (10.1.3. *) all IP addresses beginning with 10.1.3 will be denied access to
the Studio Server (i.e. Integration with Studio will not be permitted for these IP addresses).
155
Zend Platform User Guide
Tunneling (Communication Settings)
Communication with Studio facilitates the integration that combines Platform’s event reporting
capabilities with Studio’s editing, debugging and profiling features.
This integration provides an efficient way for managing the different stages of the development lifecycle. Platform’s PHP Intelligence inspects performance and Studio debugs, profiles and provides a
means for resolving issues and deploying changes.
There are two modes of communication with Zend Studio that accommodate different
requirements:
Tunneling (*Auto Detect Mode) - creates a secure communication tunnel with Studio that
keeps a persistent connection with the designated communication port. This mode of
communication is the recommended mode of communication. It is also responsible for
solving communication problems that arise when Studio is behind a security devices such as
a Firewall or NAT.
On-Demand Communication - creates a connection on demand. Selecting to edit, debug or
profile code opens a connection that is closed once the action is completed. This requires
defining the port and IP for direct communication with Studio.
*This feature is currently not applicable for Windows Operating Systems.
Choosing a mode of communication depends on how your environment is set-up. If there are security
devices and there is no limitation to keeping a persistent connection, use the Tunneling option - the
preferred mode of communication. However, if for some reason it is not possible to keep the port
connection open at all times, use the On-Demand Communication option, this option should be used
when Platform and Studio are not separated by any security mediation devices.
To Setup the Integration with the Studio, there are several tasks that need to be performed
(depending on the type of connection you want to establish):
156
Configuring Preferences for Tunneling
Configuring Tunneling with Studio
On Demand Connection
Studio Settings
Debugger Tunneling Port Limits
Zend Platform
Configuring Preferences for Tunneling
This persistent connection operates even when separated by a Firewall. The advantage of this method
is that it is possible to use the Studio Integration on several nodes at once. For example, to debug an
entire cluster of machines behind a load-balancer using only a single debugger connection to
Platform's Studio Server component.
The technology is based on two functional elements:
The Studio that includes an internal Web server that listens on the local host on a specific
Auto Detection port.
Platform auto-evaluates Studio’s Auto Detection port, by evaluating Studio’s settings. These
are the Tunnel Settings defined in Platform.
To establish a communication tunnel between Platform and Studio:
Go to: Platform | Preferences.
Figure: Communication Tunnel Method
In the Platform Settings section, enable Auto detect the Studio Settings by clicking On.
This informs Platform of the method of connection to Studio. The relevant options/fields for
configuring Tunneling are as described below:
Auto Detection Port - Indicates that Studio will listen to the local host on the signified Auto
Detection port - Default=20080. Leave empty to automatically identify the IP from the
browser.
Test - Verifies if Studio is listening to this port. This test should only be run when Studio is
running.
Method of passing the Studio Server parameters - Defines the means for passing
communication parameters from the Platform to Studio. Choose COOKIE or GET method.
Configure communication as follows:
1.
Use the "Test" option to verify that Studio’s Broadcast Port is set to the same port
number as Platform’s Auto Detection Port.
2.
Select a method of passing Zend Studio parameters.
3.
Click "Save".
Note:
The default method is Cookie, and it is recommended that you use the default. Platform supports a
Get method as well that can be used if experiencing problems with Cookies.
157
Zend Platform User Guide
Platform establishes a communication tunnel with Studio based on the default detection port.
Note:
Tunneling to Debug and Profile code with the Studio is only possible if Studio is open and running and
Studio’s Tunneling settings are properly configured in Platform and Studio.
158
Zend Platform
Configuring Tunneling with Studio
This procedure describes how Platform users can configure the Studio side to connect with Platform
using a Communication Tunnel. Communication tunnels are used to circumvent Firewalls and other
security devices to enable the use of Platform's advanced diagnostics options. These options include
editing, debugging and profiling Event source code using Studio.
Tunneling is used for editing PHP code with Studio in instances when the code and the IDE are located
on different machines separated by a Firewall.
The following instructions pertain to the following IDEs:
Studio for Eclipse 6.0
Studio 5.5
Note:
The Debug port for Studio 5.5 is 10000 and in Studio for Eclipse 10137.
Studio for Eclipse 6.0
There are several steps to defining Tunneling in Studio for Eclipse as follows:
1.
Define a server
2.
Configure Server Preferences
3.
Configure Platform Integration
4.
Set Tunneling Settings
To configure Tunneling Settings for Studio for Eclipse:
1.
Open the PHP Server Preferences dialog from the shortcut menu by clicking
or from the main menu: Window | Preferences | PHP |PHP Servers.
2.
Click New to define a New Server (or Edit if the server has already been defined).
3.
Give the server a unique name and enter the URL of the server on which Platform is
installed.
Click Next to continue or go to the next Tab.
4.
You can ignore the Path Mapping option. Before running a Debugging or Profiling
session you will be automatically prompted to define path mapping. Read more
about Path Mapping in the Studio for Eclipse Help.
Click Next to continue or go to the next Tab.
5.
In the Platform Integration dialog, check the option "Enable Platform
Integration".
6.
In the Platform GUI section keep the option Use Default and the "/ZendPlatform"
suffix - this information is used to locate Platform
7.
In the Authentication section enter your Platform User Name and Password.
Click Next to continue or go to the next Tab.
8.
In the Tunneling Settings section, check the option "Enable Tunneling"
9.
Specify your "Return Host" which should be the IP address of the machine on
which Studio is installed (if the response should be sent to the same machine you
can leave this option empty).
10. Configure your Authentication Information - Use this option when working with a
159
Zend Platform User Guide
Web server that requires HTTP authentication. Zend Studio sends the authentication
information in the header.
Note: This assumes the user account is set up on the Web server
Click Finish or OK.
11. Activate Tunneling to a server by clicking the Tunneling icon
.
The statuses are; Green - connected and Red - disconnected. To know which server
is connected click on the arrow next to the icon to display the mane of the server.
Now when clicking the Event Details options: Reproduce in Debugger and Reproduce in
Profiler, a Studio Session will be initiated.
When debugging and profiling make sure you are in the correct perspective or that you
confirm the perspective switch in Studio Eclipse otherwise the session will not start.
Note:
To start a Debug Session click the Resume button in Studio Eclipse's Debug perspective.
Useful Information:
1.
Information in Studio's Debug Preferences, must match the information in Studio’s Tunneling
Settings for tunneling to work.
2.
Several Tunneling sessions can be configured. Therefore, If the debug session is not working,
check to see that the Tunnel to the correct server is connected.
To do so in Studio Eclipse, click on the drop-down arrow next to the Tunneling Icon
and verify that the name of the server is correct.
3.
If running a session times-out, make sure the "Client Host ID" is defined in Preferences |
PHP | Debug. This will direct the response to a single address.
Debug Preferences
To view debug preferences to ensure that the information is suits the Tunneling Preferences go in
Studio for Eclipse to: Window | Preferences | PHP | Debug:
160
Zend Platform
Figure: Studio for Eclipse Debug Preferences
In the section called "Connection to debug server", make sure the following settings are
configured:
Debug Options:
PHP Debugger - Defines the component for running the debug session. The integration with
Platform works with the Zend Debugger only.
Default Server - Defines which server the debugger will use by default. Click the "PHP
Servers" category to be taken to the PHP Servers management page.
Set this to Zend Platform
Default PHP Executable - the required PHP version. Select the version which Platform is
using.
Debug Transfer Encoding - Click the arrow to select the required transfer encoding from
the drop-down list.
Debug Output Encoding - Click the arrow to select the required output encoding from the
drop-down list.
Break at First Line - Mark this checkbox to force the debugging process to stop at the first
line of code.
Client Host/IP - Enter the Client's Host/IP.
161
Zend Platform User Guide
Studio 5.5
To configure Tunneling Settings for Studio:
1.
Open the Tunneling dialog: Tools | Tunneling Settings:
2.
Define values for the following settings:
•
Tunnel Target Host - Address of the Web server on which the debugger
resides.
•
Tunnel Target Port - Port of the Web server on which the debugger resides
the default port is 80.
•
Specify Return Host - When enabled, this should contain the address of the
server on which Studio resides.
•
Automatically Connect on Startup - Enables the communication tunnel
when Zend Studio starts up.
•
HTTP Authentication - Tunneling supports HTTP authentication. This enables
users to send HTTP authentication information (user name, password) together
with the header sent to the server. Therefore, you can specify that tunneling to
a server will require authentication, and improve security by adding information
in the following fields:
o
Send Authentication Information - Use this option when working with a
Web server that requires HTTP authentication. Zend Studio sends the
authentication information in the header.
Note: This assumes the user account is set up on the Web server.
o
o
User Name - User name as defined on the Web server.
Password - User password as defined on the Web server. Note: Whenever
you use the debugger, the server will use the User Name and Password
specified here.
3.
Click "Connect" for Studio to connect to the Tunnel Target Host over the specified
port.
Note:
Information in Studio's Debug Preferences, must match the information in Studio’s Tunneling Settings
for tunneling to work.
162
Zend Platform
Debug Preferences
To view debug preferences to ensure that the information is suits the Tunneling Preferences go in
Studio to: Tools | Preferences | Debug:
Figure: Studio Debug Preferences
In the section called "Connection to debug server", make sure the following settings are
configured:
Debug Mode - Sets the Debugger to Internal or Remote.
Select remote for integrating with Platform
Debugger Server URL - The IP or URL of the host that runs the Debug Server. To check the
connection to the debug server, select the Check Debug Server Connection, from the Debug
menu.
If the test fails, check the list of common problems in Appendix A - Troubleshooting Zend
Platform
Client IP - Set the IP address of Studio’s host machine.
Client Debug Port - Set the port number for communication with the Debug Server.
Broadcasting Port - Studio’s communication tunnel is implemented via a persistent
broadcasting port that broadcasts information about tunneling to Platform. Specify the port
number in this field.
163
Zend Platform User Guide
Dummy File - This file used during the debug process for storing interim information.
Server Response Timeout - The amount of time allowed for a server response. If no
response is received within this time, a notification will be generated to inform you that the
Server is not responding.
Encrypt Communications using SSL - To enable SSL encryption make sure this option is
selected here and in Platform’s Dashboard | Preferences.
164
Zend Platform
On Demand Connection
Platform supports on demand communication with Studio.
This method should be used if your organization’s security policies do not permit persistent
connections.
To enable on-demand communication between Platform and Studio disable the Auto
Detect function as follows:
1.
In the Platform Settings section, disable Auto detect the Studio Settings by clicking
Off.
2.
The Debug Studio Port and Studio IP fields become active.
3.
Enter the Debug Studio Port and Studio IP address in the fields provided. Manually
enter the Port and IP Address for Studio - Default Port=10000. The default address
is auto-evaluated from the browser.
4.
Click "Save".
Figure: On-Demand Communication Settings
Note:
The Studio debug port is the port number with which the Studio communicates with Zend's Debug
Server (Platform); this field is active only if Auto Detect is disabled (Off). The Zend Studio IP uses the
default IP as the address for communicating with Studio (The IP assigned to the Studio host machine;
if the value is not correct, enter Studio's correct IP address).
165
Zend Platform User Guide
Debugger Tunneling Port Limits
To ensure persistent connections while using Tunneling over firewalls for debugging event information
in Platform or debugging scripts edited in Studio, you can modify the following php.ini directives that
define a port range.
The directives are:
'zend_debugger.tunnel_min_port'
Description: Minimal possible value of Debugger tunneling port
Default value: 1024
'zend_debugger.tunnel_max_port'
Description: Maximal possible value of Debugger tunneling port
Default value: 65535
Note:
The Debugger uses the default values either when the directives are not present in the php ini, or if
one of them is invalid. If the directives are not present, the Debugger will revert to random port
allocation and not from a predefined range of ports.
These directives define a port range for Tunneling. While Tunneling, the Debugger will try to locate a
free port starting from the minimum value defined in the directive 'zend_debugger.tunnel_min_port' ,
but not above the maximal value defined in the directive 'zend_debugger.tunnel_max_port'. Another
consideration when defining a port range is, to ensure the amount of ports opened correspond to the
amount of possible debugger connections that may occur i.e. the range should reflect the amount of
Studio’s you have in your organization.
In parallel, the System Administrator must ensure the proper firewall policies [rules] are set to allow
communication via the selected ports, in order for the tunneling to work.
The tunnel server, and not the debugger, uses these tunnel settings. The debugger will still use
random ports for debugging.
Possible Error Message:
"Could not find a free TCP port for tunneling. Please re-adjust the 'zend_debugger.tunnel_min_port'
and 'zend_debugger.tunnel_max_port' directives in the php.ini file."
This means the Debugger could not find a free port to establish a communication tunnel, make sure
you have defined an adequate port range in the directives. If the problem persists, consider checking
the firewall policies.
166
Zend Platform
PHP Configuration
The PHP Settings screen is the configuration tool for customizing PHP and Zend products, by
modifying directives and extensions in the php.ini and zend.ini files.
Configuration options are separated by type (Directives and Extensions) in expandable lists. The [+/-]
signs indicate if there are more options related to that list item or not.
Clicking on the Plus Icon [+] will expand the lists to expose the different options and where
applicable, input fields are added to change an option's value. Alternatively, clicking the Minus Icon [-]
will contract the list leaving only the option type visible.
The content of these lists is based on the exact content of the php.ini on the selected server.
Changing directives in this section will change the server's php.ini settings.
Changes to Zend Product directives (Platform; Optimizer, Monitor, Debugger, etc.) are applied to the
zend.ini or the php.ini according to their origin.
Some directives do not require restarting the server. An indication will be given regarding which
directives require restart and which changes will be automatically applied. (See the Reference section
for a complete list of directives and their settings)
Note:
Most of the directives can be viewed and modified. Directives that should not be changed under any
circumstances are disabled (grayed out). Directives that are commented in the php.ini are only viewed
in the PHP Configuration screen when the comment is removed. As an added precaution, changes that
will be done to the php.ini will require entering your php.ini password, as defined in the
'zend_gui_password' directive (the password is MD5'ed). To change the password go to: Dashboard |
Preferences.
PHP Settings can be configured per Server (Node) and subsequently be applied to other servers using
the "Clone Wizard".
Finding a Directive/Extension
Search for a directive or an extension by using the "Quick Filter" field. The "Quick Filter" allows to
search for a directive or an extension that contains a certain word or combination of letters in its
name or description.
To find a Directive or extension:
Go to Configuration | PHP Configuration and enter the directive into the Quick Filter Field.
Configuring Settings for a Server (Node)
To configure Settings:
1.
Go to Configuration | PHP Configuration or use the shortcut from Platform |
Dashboard | Configure PHP Settings. (To configure multiple servers or a server
group with the same PHP Settings, first configure a selected server and then run the
Clone Wizard to propagate settings from that server to other server nodes.
2.
Use the + symbol to select and expand the PHP entry you wish to edit or use the
"Quick Filter" to search for a directive or an extension that contains a certain word
or combination of letters in its name or description.
In both cases the expanded line will open with an active field for editing directive’s
167
Zend Platform User Guide
parameters.
3.
In the Value column, enter a new setting in the editable field provided.
Changed setting's backgrounds will automatically change to a darker shade of blue
indicating that it has been modified and will stay that way until the "Save Settings"
button is clicked.
4.
Click "Save Settings".
The new settings will be registered to the php.ini configuration file (you may be
asked for your php.ini password for critical changes).
Note:
Use the "Clone Wizard" if you want to apply these changes to nodes belonging to a cluster.
168
Zend Platform
Figure: PHP Configuration
169
Zend Platform User Guide
PHP Info
The php Info screen is a read-only screen that outputs a large amount of information about the
current state of PHP. This includes information about PHP compilation options and extensions, the PHP
version, server information and environment, the PHP environment, OS version information, paths,
master and local values of configuration options, HTTP headers, and the PHP License.
Note:
The values displayed in the php.info page may differ from the system-wide settings as they display
the "Local View". To see the system-wide settings check the "master value" column.
170
Zend Platform
Clone Wizard
This option is available from select tabs and from Configuration | Clone Wizard.
The following procedure describes how to Clone settings defined on one server to other servers. Once
all settings have been configured on a node, the Clone Settings feature allows for applying these
settings to the different nodes in one single process.
This option is only available in tabs that require the ability to transfer configured settings to other
server/s.
To clone configurations:
1.
Wherever the option is available Click "Clone ... ".
The Clone wizard dialog opens after selecting a source server.
2.
Use "View Tree By field" to quickly find the source server.
3.
Select the Source Server, i.e. the server whose configuration settings you wish to
distribute to other servers in the network. the selection is done from the list of
servers in the tree display.
4.
Click "Next" to open the Configuration Selection screen.
Note:
The Configuration Selection screen is a collapsible list of configuration parameters to be
taken from the source server that was selected. Only selected parameters are cloned. By
default, all configuration parameters are de-selected.
5.
Select the PHP configuration, Zend products settings or entire Configuration file (of
the Zend products) for the source server with the settings you wish to clone.
6.
Select additional configuration parameters you wish to clone.
7.
Click "Next", to select the destination server or servers.
8.
In View Tree By field, select the tree view you wish to use to find the destination
server quickly.
9.
Select the Destination Server(s) - i.e. the server(s) with the configuration settings
that you wish to change to match parameters selected from the source server (from
the list of servers in the tree display).
10. Click "Clone".
The Clone Wizard distributes the selected parameters from the source server to the destination
server(s). A Broadcast Summary screen appears indicating that the configuration settings have been
cloned to the selected destination servers.
171
Zend Platform User Guide
Web Services
Contents:
System Requirements
Add/Remove Server Actions
General Tasks
Event Handling
Get/Set Actions
Using Web Services
Web services are a standardized way of allowing applications to interface and share data across the
network. Web service messages are written in XML, to facilitate communication between different
applications in different programming languages.
Platform provides an API that extends Platform's functionality making it accessible via Web Services.
Users will be able to get information and perform several tasks as follows:
General Tasks - Login to the server and get information about the servers and services in
your environment.
Get/Set Actions - View and change directives.
Add/Remove Server Actions - Add or Modify allowed host settings or remove hosts. These
actions can be applied to nodes or server groups (clusters).
Event Handling - Get Event information and Change Event Statuses.
Note:
Most of the functions check to see if the user is already logged-in to the system. Therefore, before
calling a function call the login() function with the correct user information (user name and password).
System Requirements
In order to run Web Services in your environment. Please make sure you have the following:
PHP 5
SOAP extension
You must have the following zend.ini entry - zend_central.web_services.enabled=1 (this
setting is set by the installer when choosing to use Web Services in the installation process).
172
Zend Platform
General Tasks
ServiceResponse login
ServiceResponse login(username, password)
Description: Used to login to the system with your given user name and password (the
same user name used in order to log into Platform Administration).
Return Values: ServiceResponse
Parameters:
string $username: Username to use for login. Same user name used in order to log into
Platform Administration.
string $password: Password use for authenticating the user name.
Important Note:
This function must be called before calling any other function that needs the user to be logged in.
ServiceResponse getServers()
ServiceResponse getServers()
Description: Get a list of servers.
Return Values: Returns a response object that will hold a list of all the clusters (and a list of
their servers) and un-clustered servers (The term 'cluster' means a group of aggregated
servers).
Parameters: None
Example:
cluster1 =>
server1
server2
server5
cluster2 =>
server3
server6
server4 =>
null <- unclustered server
server7 =>
null <- unclustered server
ServiceResponse getVersion()
ServiceResponse getVersion()
Description: Get the Web Service version to know what functionality it supports or not.
(This function does not require login)
Return Values: Returns a response object with the web service version.
Parameters: None
173
Zend Platform User Guide
Get/Set Actions
getAllDirectives
DirectiveServiceResponse getAllDirectives(server)
Description: Gets information about directives on a given server.
Return Values: Returns an object containing all the directives read from the given server
name and their relevant data (name, current value, loaded value, INI file the directive was
read from).
Parameters: string $server: Server alias of the server you would like to get directives from
getDirective
DirectiveServiceResponse getDirective(server, name)
Description: Gets the desired directive name and the server from which the directive value
will be read.
Return Values: Returns a response object holding the following information: directive name
current value, loaded value, name of INI file the directive was read from.
Parameters: string $server: Server alias of the server you would like to get directives from
string $name: Directive name
setDirectiveOnServer
ServiceResponse setDirectiveOnServer(server, name, value, ini_file, password)
Description: Sets a new value for the given directive on the specified server. The user must
specify the ini file this directive will be set in. The Password is only needed if the ini_file is
php.ini.
Return Values: None
Parameters: string $name: Directive name to set
string $value: New directive value
string $ini_file: Name of INI file to save the directive in
string $server: Server alias of the server you would like to set directives on
string $password: Password for INI modifier (required only if INI file is php.ini)
setDirectiveOnCluster
ServiceResponse setDirectiveOnCluster(cluster, name, value, ini_file, password)
Description: Sets a new value for the given directive on all the servers belonging to the
given cluster. The Password is only needed if the ini_file is php.ini. (assuming all servers in
cluster use same password).
Parameters: string $cluster: Server Group name
string $name: Directive name
string $value: Directive Value
string $ini_file: Name if INI file to use in order to set the directive
string $password: Password for INI modifier (required only if INI file is php.ini)
174
Zend Platform
Add/Remove Server Actions
addAllowedHostOnServer
ServiceResponse addAllowedHostOnServer(server, host_ip)
Description: Adds the given IP to the list of allowed hosts on the given server.
Parameters:
string $server: Name of the server on which to allow the host's IP.
string $host_ip: Host IP to allow
addAllowedHostOnCluster
ServiceResponse addAllowedHostOnCluster(cluster, host_ip)
Description: Adds the given host IP to the allow_hosts directive in the zend.ini file (if it's not
already there), on all servers in the given cluster
Parameters:
string $cluster: Name of the server group on which to allow the host's IP.
string $host_ip: Host IP to allow
removeAllowedHostOnServer
ServiceResponse removeAllowedHostOnServer(server, host_ip)
Description: Removes the given IP from the list of allowed hosts on the given server by
adding it to the denied hosts list.
Parameters:
string $server: Name of the server on which to deny the host's IP.
string $host_ip: Host IP to deny
removeAllowedHostOnCluster
ServiceResponse removeAllowedHostOnCluster(cluster, host_ip)
Description: Removes the given IP from the list of allowed hosts on all the servers on the
given cluster by adding it to the denied hosts list.
Parameters:
string $cluster: Name of the group we want to deny the host's IP access.
string $host_ip: Host IP to deny
isHostAllowed
ServiceResponse isHostAllowed(server, host_ip)
Description: Checks if the given IP is in the allowed list on the given server.
Parameters:
string $server: Name of server to check if the host IP is allowed or not string $host_ip: Host
IP to check
175
Zend Platform User Guide
Event Handling
getAllEvents
EventServiceResponse getAllEvents(filter, offset, number_of_rows,sort_by,desc_order)
Description: Gets a list of Events along with a short version of the Event Details. It is also
possible to get a range of event rows by specifying an offset and number of rows from that
offset.
Parameters:
array $filter_array: Associated array where the key is the filter name and the value is the
filter value integer $offset:
integer $number_of_rows: Number of events to get
string $sort_by: Value to sort by
$desc_order: Ascending order (false) or descending order (true). Default is descending order.
getTotalNumberOfEvents
ServiceResponse getTotalNumberOfEvents(filter)
Description: Shows the total number of events according to the given filter. This function
should be used along with the getAllEvents() function in order to get the total number of
events matching a given filter and show these events by pages
Parameters:
array $filter_array: Associated array where the key is the filter name and the value is the
filter value.
getEventData
EventServiceResponse getEventData(event_id)
Description: Gets a specific event ID and returns all data available for the given event.
Parameters:
integer $event_id: The ID of the event you would like to get
getEventFilterNames
ServiceResponse getEventFilterNames()
Description:
Return Values: Returns a list (array inside a ServiceResponse) of all available filter names
that can be used with the getAllEvents() function.
Parameters: None
getEventFilterAvailableOptions
ServiceResponse getEventFilterAvailableOptions($filter_name)
Description:
Return Values: Returns all the possible options that the given filter name can accept (filter
name is one of the elements returned by the getEventFilterNames() function.
176
Parameters: string $filter_name:
Zend Platform
getEventSortOptions
ServiceResponse getEventSortOptions()
Description:
Return Values: Returns all the possible sort options for events
Parameters:
debugEvent
ServiceResponse debugEvent(event_id)
Description: Starts a debug session while recreating the exact conditions that resulted in
this event (same as the 'Debug' button in the 'Event Details' page).
(This option works with Studio)
Return Values: Will start a debug session
Parameters:
integer $event_id: The ID of the event you would like to debug.
profileEvent
ServiceResponse profileEvent(event_id)
Description: Profiles the script that originated the given event (same as the 'Profile' button
in the 'Event Details' page).
Return Values: Will start profile session
Parameters:
integer $event_id: The ID of the event you would like to profile
deleteEvent
ServiceResponse deleteEvent(event_id)
Description: Use this function to remove events from the Database (same as the 'Delete'
button in the 'Event Details' page).
Parameters:
integer $event_id: The ID of the event you would like to delete.
ignoreEvent
ServiceResponse ignoreEvent(event_id)
Description: Changes the Event's status to Ignored (same as the 'Ignore' button in the
'Event Details' page).
Parameters:
Integer $event_id: The ID of the event you would like to set as 'ignored'
closeEvent
ServiceResponse closeEvent(event_id)
Description: Changes the Event's status to Closed (same as the 'Close' button in the 'Event
Details' page).
Parameters:
integer $event_id: The ID of the event you would like to set as closed
177
Zend Platform User Guide
preserveEvent
ServiceResponse preserveEvent(event_id)
Description: Sets the Event's status to Preserved (same as the 'Preserve' checkbox in the
'Event Details' page).
Parameters:
integer $event_id: The ID of the event you would like to set to be preserved
unpreserveEvent
ServiceResponse unpreserveEvent(event_id)
Description: Changes the status of a preserved so that it will be deleted in the next
periodical Database cleanup.
Parameters:
integer $event_id: The ID of the event you would like to set to be un-preserved.
178
Zend Platform
Using Web Services
Web Services are a method for directly communicating with Platform.
There are two methods for using the Web Services API.
The first method is called "Non WSDL Mode". This method directly uses the API without referencing a
WSDL file. This is done by using the API functions as described in "Web Services API" and connecting
via SOAP to a server to start calling the functions.
The second method is called "WSDL Mode". This method allows referencing a file that contains the API
and its options in order to use the functionality or automate communication using Web Services. This
file is in XML format so that it can be easily read by without knowing the API. A description and
example of using this method is included below.
The following procedure describes how to reference a WSDL file (using the second method "WSDL
Mode") to define communication with Platform. This procedure also demonstrates how to gain Code
Completion for the WSDL file using Studio.
In order to perform this procedure you must have the following: Platform, Studio (4 or above, Eclipse
or PDT) and you must know the location of the WSDL file (commonly located in: <docroot>/ZendPlatform/server/PlatformWS.wsdl
To reference the WSDL file:
1.
Open Studio
2.
Create a new SOAP client and reference the WSDL file:
$soap = new SoapClient('http://gollum/ZendPlatform/server/PlatformWS.wsdl');
3.
If the server requires login information add that after referencing the WSDL file:
$soap->login('Admin','zend');
4.
The code completion will be activated, making all the functions available to you
including a description parameters and return values of the API's functions.
5.
Enter the command you require.
6.
Save the file and run it from your browser to get the results.
The following Example shows how to create a query for displaying event data collected by Platform.
This type of query can be imported into a third party application for example; The Zend development
team uses this method to get event information from Platform and display it in Studio.
Example:
How to get a list of the servers registered to the Central:
<?php
try {
// Connecting to the Platform central, where the web service is
available, using WSDL file.
$platformWS = new
SoapClient('http://fireforge/ZendPlatform/server/PlatformWS.wsdl');
// Logging into platform. Without that, no other action can be done.
$result = $platformWS->login('admin','1234');
// Some code to check the result should be added
// Getting list of servers registered in the central
$result = $platformWS->getServers();
179
Zend Platform User Guide
} catch(Exception $e) {
echo $e->getMessage();
}
?>
180
Zend Platform
Enterprise Server
Contents:
Session Clustering
Job Queues
Zend Download Server (ZDS)
The Enterprise Server provides the most comprehensive feature set as it is bundled with the
Integration Server and the Performance Management Server. The Enterprise Server provides
enterprise grade functionality for managing multi-server environments, ensuring interoperability and
information consistency between nodes belonging to a cluster.
The Enterprise Server includes:
Session Clustering - A highly scalable solution for synchronizing session data across a cluster
of PHP servers.
Job Queues - Platform’s Job-Queue provides PHP production environments with a standard
approach to streamline offline processing.
Zend Download Server - A PHP (Zend Engine) plug-in which deals with serving large
downloads which are served over the HTTP protocol.
181
Zend Platform User Guide
Session Clustering
Contents:
Session Clustering Statistics
Session Clustering Storage Models
Session Clustering Settings
Defining Storage Models
The Importance of Session IDs
Fine Tuning Session Clustering
The Session Clustering module is designed to provide a highly scalable solution for synchronizing
session data across a cluster of PHP servers. This means that PHP implementations that were not
originally designed with scalability in mind, can now grow beyond a single server, to a Web Cluster.
The Session Clustering module is applied to your servers and nodes through the installation process
and immediately begins to work transparently.
With Zend Platform users can define Session Clustering Settings and view Session Clustering
Statistics.
What is Session Clustering?
Sessions "reside" on the machine on which they were first created. Later on, sessions are delivered
from one machine to another, following requests from alternate servers to the original server. This
solution is fully distributed and delivers high performance and scalability.
The session clustering module is intended for PHP applications in clusters dealing with heavy loads.
This module addresses the focal point of best practices - PHP development with the intent to elevate
concerns over corruption of session data and erratic application behavior.
The Session Clustering module provides a comprehensive solution for synchronizing session data
across a cluster. In this module the sessions that "reside" on the server where they were first created
are subsequently, delivered to other servers in the cluster. This is done by having the alternate
server, request the session data from the original server. This means a fully distributed solution delivering high performance, linearly scalable solution utilize existing hardware investment, while
ensuring the ability to continue growing.
The figure below illustrates the session clustering module components:
Session storage: where sessions are stored, this can be either memory, or disk-based
storage with a tunable memory cache
Zend Session Manager (SCD): the Session clustering daemon, that transfers sessions from
session storage to the PHP engine and from remote nodes
182
mod_cluster: the PHP session handler that communicates with the session clustering Daemon
Zend Platform
Figure:
SC Architecture
The Session Clustering module employs strong locking and data integrity mechanisms to ensure that
sessions are never corrupted. Session Clustering is also tunable with two different session storage
models: write through or delayed write, allowing organizations to choose their preferred storage
model.
The Session Clustering module can be integrated into any existing PHP application that uses PHP’s
native session extension - without changing any code. Session Clustering implements a native PHP
session module, and switching between the existing solution and session clustering is simply a matter
of changing a PHP.INI directive.
Important Note:
When deploying SC in an organization it is forbidden to change the Session ID for any reason and in
any way (such as using the PHP function session_id() ).
Cluster Configuration
In a cluster configuration the SCD issues UDP broadcast messages every 30 seconds
(mod_cluster.ha.broadcast_delta). Each message contains the following information:
msg ID
32bit
protocol
sender's
sender's
sender's
payload
ID
ID
port
load
size
32bit
32bit
32bit
32bit
32bit
payload
optional
In general, there should be 3 ports of interest when configuring the Session Clustering:
1.
TCP port for inbound connections - mod_cluster.network.tcp_port_remote [34567]
2.
UDP port for broadcasts - mod_cluster.ha.udp_port (no relation to HA whatsoever) [45678]
3.
TCP port for the Messenger to connect to the SC daemon mod_cluster.message_server_port
The Node should be set correctly by hostname: mod_cluster.network.hostname, and the proper IPs or
IP Mask should be added to the allowed hosts in: mod_cluster.allowed_hosts.
183
Zend Platform User Guide
There are four reasons behind cluster node communications in a cluster:
1.
TCP: Relaying a Session (RelayNode -> MasterNode)
2.
TCP: Relaying a Session to Backup (RelayNode -> MasterNode) if the Master does not
responded properly (HA only).
3.
TCP: Sending a notification that a Session has been changed to Backup (RelayNode ->
BackupNode) (HA only).
4.
UDP: "I am alive" broadcasts with load statistics (a backup is selected by Master
automatically from the minimally loaded host).
Adding New Servers to the Session Clustering Environment
The following procedure describes how to add a new server to a Session Clustering environment in
order to enable session sharing in a cluster.
To make sure that a new server will share session information:
1.
Add the new server by installing the node installation on the server
2.
Configure the new server in the Central Server (through Platform Administration in
Platform | Cluster Management | Manage Servers) to be a member of the required
group.
3.
If you are reallocating an existing server to a different Group, un-attach the server
from its existing group and then add it to the new group.
Session Clustering will be applied to the added server.
Session Clustering and HA (High Availability)
HA is a solution that uses the SC infrastructure to provide availability and continuity of mission critical
business applications.
Session Clustering HA (High Availability), is an additional safety layer for maintaining session
information integrity in Web cluster environments. HA ensures that sessions will be serviced in case of
a single failure.
Session Clustering HA provides all the current Session clustering functionality and is an optional
feature for environments that require High Availability.
Note:
As an additional functionality layer, running HA may have a slight impact on performance in
comparison to regular session clustering response time.
184
Zend Platform
About HA
The HA layer preserves session information when a server fails. Each session is saved twice, once on
the master (originating) SCD and one on the master's backup SCD. This means that in the event that
a master server fails, requests are re-routed to the backup SCD. Once a request is re-routed to the
backup SCD, the Backup SCD turns into a master SCD and creates a new backup SCD. A backup SCD
is chosen based on it activity locating the SCD with the least amount of sessions and open sockets. In
the event that two servers fail session information will be preserved in the backup and can be
replicated if requested in its lifetime.
Regarding response time, the HA layer will not impose more than a 10% performance degradation
over the existing session clustering solution (number of session requests per second).
As mentioned earlier, all nodes that need to share session information have to be associated to a
cluster in Zend Platform (Grouped). The HA layer is also capable of identifying when a fallen server
has been recovered and will automatically return the fallen server into service.
185
Zend Platform User Guide
Session Clustering Statistics
The Session Clustering Statistics tab is accessed from Session Clustering | Statistics.
The SC (Session Clustering) Statistics tab displays statistical information on SC sessions that occurred
in the system. This information provides a detailed insight into the SC activity occurring on clusters
and nodes monitored by Zend Central. Consequently, statistical information is displayed by name,
server name for standalone servers and group name for servers belonging to a group.
Data displayed in the Statistics tab, relates to the SC information collected since the last time a node
was restarted.
There are two options for updating the information:
To get the latest statistics (refresh the display) use the "Update Clusters Data" button located
in the right-hand side of the top bar.
To reset the information displayed in the tables, restart the node’s web server and click
"Update Clusters Data".
Notes:
Statistics can only be collected from servers running an active SC installation.
SC Statistics are accessed by going to: Session Clustering | Statistics
Figure: SC Statistics
The SC Statistics table displays the following information:
Column
Description
Cluster Name
Displays the name of the node or group depending on if the server
is a standalone server or the server belongs to a group. If the
server belongs to a group, the group name will appear as a link,
pressing the link adds an additional "Servers for Cluster" table
detailing statistical information per server belonging to the
selected group.
Quantity (Qty.) of
Number of sessions that occurred since the last node restart.
Sessions
Quantity (Qty.) of Saves
Number of saves that occurred since the last node restart.
Session Size
Size of sessions that occurred since the last node restart
separated to the largest, smallest and average.
Comments
Displays system comments relating to server availability.
Note:
Additional information on how to configure groups can be found in Manage Groups.
186
Zend Platform
A Statistical information itemization of the servers belonging to a group can be viewed by, doubleclicking on a Group name in the Cluster Statistics table.
Double-clicking on a Group name opens an additional table that lists information on all the servers
belonging to the selected group.
Figure: Group Statistical Itemization
187
Zend Platform User Guide
Session Clustering Settings
The Session Clustering Settings tab is accessed from Session Clustering | Settings and selecting a
node or group from the selection tree.
The SC (Session Clustering) settings tab enables to define individual SC settings per server (node) or
Group.
Note:
The settings defined for a specific node/group can be later applied to additional nodes/groups by using
the Clone Settings option from the Settings tab. (Additional information about cloning settings can be
found in Clone Wizard).
The active buttons on the SC Settings tab are:
Stop - Shuts down the SC Daemon.
Start/Restart - Restarts the SC Daemon.
Save - Applies and saves the settings.
Clone Settings - Applies settings to another server or group.
Note:
Windows all supported versions should use the service manager to Start and Stop services (Start/Stop
options in the Tab will not be available).
SC settings are separated by category and provide configuration options as follows:
General Settings
General settings determine the basic session's behavior and output.
Mod Cluster Verbosity Level - Set the verbosity of the Mod Cluster’s output to the log
Daemon Verbosity Level - Set the verbosity of the Daemon’s output to the log
Sessions Lifetime - Define the session’s time-out limit
Garbage Collection Frequency - Define garbage collection intervals, for deleting unused
sessions (Unused sessions are sessions, that the last time they were used, is larger than the
interval)
Session Clustering Daemon Threads - Determine how many Daemon threads can be
active at once.
Figure: SC General Settings
188
Zend Platform
Storage Settings
The initial storage settings were defined in the installation process, where the user could choose one
of the two available storage methods. However, this setting can be easily changed at any time by
selecting a different storage method from the Session Clustering Settings tab.
Note:
Additional information on storage methods can be found in "Session Clustering Storage models".
Figure: SC Storage Settings
Network Settings
Zend SC settings provides a way to grant communication to the SC Daemon by server (for multiple
servers you can use a Net Mask which implements Wildcards on IP addresses)
To change or add a host:
1.
Go to Session Clustering | Settings.
2.
Click "Add".
The Add New Allowed Host dialog box opens.
3.
Enter the Settings for the new Allowed Host.
4.
Click "Apply".
A new Host will appear in the Server Hosts category on the Network Settings screen.
5.
To edit or remove a Host, click "Edit" or "Remove" (To the right of the Server Host
you wish to edit).
6.
You will be prompted to confirm your new settings click "Save" to save the settings
to the database.
Figure: SC Network Settings
Net Masks:
The Net Mask option is used to define a string of IP addresses using Wildcards '*' to specify the range
of IPs that are either allowed or denied hosts. This option, allows to specify a range of IPs from 0-255
according to the selected amount of Wildcards for example if you choose to use the Net Mask option
to grant communication to the following IPs: 24 (10.1.3. *) all IP addresses beginning with 10.1.3 will
be granted access to the SC Daemon on this server.
189
Zend Platform User Guide
The Importance of Session IDs
The Session Clustering (SC) process starts when a user’s browser sends a request to a web server.
The Web Server then sends a request to the Session Server, which in turn checks if with the request
there is, a cookie, specifically one containing a Session ID. If a Session ID is found, the web server
can find the server by session and resume the previous session. If a Session ID is not found, the web
server creates a new Session ID and sends a cookie containing the new Session ID to the browser.
Session Key Format
When a session is saved without Session Clustering (modfied php extension), you will see in the logs
only in the Session Key.
The Session Key format is: Master-Port-Backup-Port-Version-Key. The backup port is only used for
High Availability therefore, when HA is not in use, the session key will be: Master-Port-0000000000000000-Version-Key.
HA Note:
The format Master-Port-00000000-00000000-Version-Key will also appear in HA mode if you are
working on a cluster with only one available server or when evaluating the product with only one
server.
To obtain SC functionality the SC module changes the Session ID’s standard format as follows:
1.
Internal information is stored in the Session ID.
2.
Session IDs are stored by the Session Cluster module and therefore do not resemble Session
IDs created by other PHP session modules (e.g. mod_files).
As a result of these dependencies and changes, other modules should not use Session Clustering's
Session IDs.
Important Note:
When deploying SC in an organization it is forbidden to change the Session ID for any reason and in
any way (such as using the PHP function session_id() ).
190
Zend Platform
Session Clustering Storage Models
The Session Clustering module has two methods of writing session information. Each method provides
enhanced capabilities in different areas and should be selected according to organizational
preferences.
The methods are:
Memory
Disk - Within the Disk storage model are two methods:
•
Write Through
•
Delayed Write
Memory
The Memory method stores session information to the memory based on the memory allocate for this
purpose by the Platform installer. The Memory method is a solution for temporarily storing session
information that does not need to be permanently stored. All session information is deleted from the
memory once the server is restarted.
Write Through
The "Write Through" method immediately writes session information to both memory and disk,
preventing additional actions while the session information is being stored.
Use the "Write Through" method if information integrity is more important than performance. The
action of writing to the disk and memory takes longer, however; the session information is more
secure, and less vulnerable to possible hardware failures that may occur and cause information loss.
The "Write Through" method is the recommended method for employing on mission critical
applications as session information is immediately written to the disk without any time intervals that
could cause loss of information if the Daemon fails. This method should be used for critical session
information such as, credit card information or social security numbers. Although, the preferred
method for storing mission critical session information is by deploying HA in your environment.
Delayed Write
Use the "Delayed Write" method if enhanced performance is high priority. This method writes session
information to the memory and only later after X seconds) stores the session information to the disk
providing enhanced performance.
191
Zend Platform User Guide
The "Delayed Write" method saves session information to the memory and every X seconds flushes
the session information to be stored on the disk.
192
Zend Platform
Defining Storage Models
The storage methods are determined from the directive: mod_cluster.storage.flush_delta.
Description:
Determines the storage method and intervals for storage flush.
To set the Write Through method: mod_cluster.storage.flush_delta = 0
To set the Delayed Write method: mod_cluster.storage.flush_delta = 1-n (seconds)
The Session Clustering installation script prompts to select a Storage Method. If the delayed write
method is selected the delay will be set by default to 5 seconds. To change the defaults after
installation go to this directive in Configuration | PHP Configuration | Extensions | Zend Session
Clustering and change the mod_cluster.storage.flush_delta value.
Fine Tuning Session Clustering
The following instructions describe your tuning options for Session Clustering. A complete list of the
Session Clustering directives is located in the Reference section. Additional information can also be
found in Appendix A - Troubleshooting Zend Platform.
Fine Tuning Options
In most cases, Session Clustering should be set to memory:
mod_cluster.storage.use_permanent_storage=0 (in HA mode, storing sessions permanently
is overkill, so if you do so, at least cache the sessions in memory and flush infrequently).
In case HD is used, you might like to tune the mod_cluster.storage.memory_cache_size and
mod_cluster.storage.flush_delta directives, to get a better performance by using Memory-toHD wisely. Flush_Delta=0 means direct write to disk, otherwise number of seconds until
flushed from memory to HD.
If you don't need the Sessions Statistics, you can set a lower rate of updates to the log, with
the directive: mod_cluster.statistics_delta_minutes.
Session Lifetime and Garbage Collection: mod_cluster.session_lifetime = 900 (15 min)
mod_cluster.garbage_collection_delta = 1800 (30 min)
To fine tune the broadcast, you should concentrate this directive:
mod_cluster.ha.broadcast_delta. What needs to be considered is the possibility of all SC
daemons broadcasting at the same time.
Have the mod_cluster.storage.dir_levels directive set to min 2 and max 2.
Other Directives
Log rotation - you can set the number of minutes between checks and minimum log size to
rotate in the following directives:
•
mod_cluster.log_rotation_delta
•
mod_cluster.log_rotation_size
•
mod_cluster.storage.filename_cache_num_entries - (1-1024) [200]
193
Zend Platform User Guide
Job Queues
Contents:
Creating Jobs
Job Details
Job Queue API
Job Queue Settings
Job Management
Job Queue Server
Queues
Jobs
Platform’s Job Queues feature provides PHP production environments with a standard approach to
streamlining offline processing.
Job Queues are serviced by the Job Queue Server and provide organizations with the ability to preschedule and determine Job activity to the level of even defining the processing server. Job Queues
provide the necessary functionality to delay the execution of processes that are not essential during
user interaction with the Web Server. Off loading non essential processes frees up your servers to
provide a better user experience in terms of response time.
Requests can be off-loaded in one of two ways:
By rerouting the requests to different Web server (Such as a server that does not perform
customer-facing processes).
By scheduling requests to be performed in low traffic hours to reduce the traffic on the Web
server
Incorporating job management functionality into Platform provides several obvious benefits such as
the ability to manage queues in one-stop-shop fashion to managing your Web application environment
from a "single point of access".
Along with these advantages, Platform also enables you to:
Manage Job fault and Performance using PHP Intelligence which fully monitors Jobs run by
the Job Queue. Subsequently, whenever a Job generates a fault or performance degradation
occurs, PHP Intelligence will generate a system Event containing the occurrence's details information that can be later used to debug the occurrence.
Generate real-time and historical reports for Jobs - Platform offers Queue and Job reporting
according to various criteria including: Current Jobs and Job History as well as current Queue
load statistics that indicate any potential performance degradation.
Leverage Job performances through code caching and content caching - Jobs can run under
the Platform performance environment.
Flexible installation options - Queues are optionally created during Platform Node installation.
After installation the Queue becomes immediately available in the Central and can be
configured and controlled from a central location.
Additional Information:
View our Job Queue FAQ for commonly asked questions and the answers
194
Zend Platform
Jobs
Jobs are scheduled routines, that are processed at a certain point in time, whether it be time based or
action based.
Zend platform's Job Queue functionality provides the means to run jobs in several ways to suit
different needs using the following tools:
The Job Queue API
The Job Queue Tab in Zend Platform
Jobs can be created by directly adding functions to the Code using the Job Queue API. These Jobs are
automatically detected by the Job Queue. Additional, simpler jobs can be created directly from the
Jobs Tab by basically, defining the Jobs METADATA and directing to a script that needs to be run.
Once Jobs are defined or identified by the Job Queue functionality you gain the ability to change,
modify and reschedule the Job details and settings while storing historical information for future
reference.
Additional Information
The following points refer to Job behavior in specific situations:
Can Jobs be scheduled on a specific server and setup a backup server that would run even
if the server is down?
It is possible to install several Job Queue daemons on different servers to run the same Job, but
currently it is not possible to create a dependency between Jobs. If you still require a solution to
monitor Job execution, an additional option is to create a separate queue on a server that has
sufficient access rights to monitor the expected results of running the Job and create a script, using
the Job Queue API to re-run run the Job (on a different server) if for some reason the original Job was
not executed.
What happens if the server was down and then comes up again?
If the server falls all jobs are recovered. If server went down while actually executing a job it will be
re-executed.
Execution of jobs that weren't executing depends on the specific Job's attributes:
If the job's end time has passed while server was down it won't be executed
If the job's scheduled time has passed while server was down it will be executed immediately
If the job wasn't supposed to run yet, it will be executed as usual.
195
Zend Platform User Guide
Job Queue API
The Job Queue API contains a set of functions that enables to run a Job directly from your
application's scripts. Running Jobs with the API, is beneficial in situations where a certain query has to
be run in parallel with other actions. Such a situation could be in an online store where a user's credit
card details have to be authenticated. In such a case the authentication process can be a Job that is
activated when the user enters the credit card details. The authentication process, may take some
time therefore, this job can be run separately on a separate server or even on a dedicated secure
server (for credit card details). These Jobs can even be scheduled to run the authentication query at a
later time when there is less traffic.
Example:
An example of this kind of script is as follows:
<?php
$job = new ZendAPI_Job('/usr/local/scripts/scrip1.php');
$job->setJobPriority(JOB_QUEUE_PRIORITY_HIGH);
$job->setUserVariables(array('name' => 'customer name', 'email' =>
'[email protected]'));
?>
This script should be added to the application's script, at the point where you want to run a query. As
we can see from this example, the new Job ($job) contains information indicating to the location of a
script (scrip1.php). This script will contain the query that we want to run. Surrounding that script are
different parameters that define the Job's variables, priority and other essential information. This
information is also picked up by Platform so that it can be viewed in the Jobs Tab eliminating the need
to open numerous small files in order to find information relevant to managing Jobs.
Important Note:
All scripts managed by the Job Queue have to be placed in a set location. To view the default location
or define a different location go to Job Queue | Settings and in the General Settings section view or
change the Scripts Folder.
This naturally is only a simplified example of a basic Job that will run a query (script) and send an email. The sections on APIs and Directives contain a complete description of the Job Queue API.
Additional Example:
Change the recurrence data of an existing job and add to it a dependency (assuming that
the job id is known)
<?php
$job_queue = new ZendAPI_Queue('gollum.zend.office');
$job_queue->login('1234');
$job = $job_queue->getJob(8);
$job->setRecurrenceData(3600, time()+3600*24);
$job->setJobDependency(16);
// This job will perform only after job
16 was successfully executed
$job_queue->updateJob($job);
// The job queue will update job #8
with the new properties of the given Job object
?>
Get all the jobs from a queue with urgent priority that waiting for process and belong to
application id 8, change their priorities to LOW
196
Zend Platform
<?php
$job_queue = new ZendAPI_Queue('gollum.zend.office');
$job_queue->login('1234',8);
$jobs = $job_queue->getJobsInQueue(
array('priority' => JOB_QUEUE_PRIORITY_URGENT,
'status' => JOB_QUEUE_STATUS_WAITING
// we could also request for jobs in application id using the following
line:
//'application_id' => 8
)
);
foreach ($jobs as $job) {
/* @var $job Job */
$job->setPriority(JOB_QUEUE_PRIORITY_LOW);
$job_queue->updateJob($job);
}
?>
197
Zend Platform User Guide
Job Management
The Job Queue tab is accessed from Job Queues | Jobs.
The Job Queue tab is accessed by clicking the Job Queues option. The Job queue configuration and
management options include the following tabs:
Queues - Displays Queue information and statistics.
Jobs - A filterable display of Job information.
Settings - Configure Queue settings.
Note:
In all of the tabs, the selected Queue name is displayed in the upper status line.
198
Zend Platform
Queues
The Queues tab is accessed from Job Queues | Queues.
A queue is a logical container which contains a set of Jobs to be executed concurrently. Currently it is
possible to setup a single Queue for a single machine.
The Queue page allows users to handle and manage queues across a cluster.
The Queue page is accessed from: Job Queues | Queues.
Through this screen users can:
View Queue details and statistics.
Queue Operations:
•
Add Jobs.
•
Suspend a Queue.
•
View/Edit Settings.
Figure: Queue Statistics Page
Queue Details and Statistics
Queue Statistics table displays information regarding a specific queue.
The table's columns are grouped into three different groups pertaining to different information as
follows:
Completed Jobs - Displays the number of completed jobs, divided into Successful and
Failed:
•
Successful - Number of Jobs belonging to the queue that ran successfully.
•
Failed - Number of Jobs belonging to the queue that ran but failed.
Current Jobs - Displays the number of Jobs that are currently being processed, by type. The
types are:
•
Recurring - Number of recurring jobs belonging to the queue.
Note
All recurring jobs are counted in this column regardless of their execution status i.e. including 'Ready
to Run' and 'Waiting' jobs.
•
Ready to Run - Number of jobs belonging to the queue that are ready to be executed.
•
Waiting - Number of jobs belonging to the queue that are waiting to be executed.
199
Zend Platform User Guide
Note:
Jobs with the status Scheduled (i.e. waiting to future schedule time) and Dependent (i.e. waiting for a
previous job to be completed) jobs are counted in this column.
Load Statistics - Displays statistics regarding job occurrences such as jobs that
entered/exited the queue etc. The Statistics can be defined to display information on
occurrences in the last X minutes. To define the duration go to Job Queues | Settings and set
the time in the field "Save statistics history". This part of the table displays four types of
statistics for queues:
•
Average Waiting Time - The average time it took for all of the jobs to move from the
'Ready to Run' status to 'Running'.
•
Average Time in Queue - The average time it took for all of the jobs to move from the
'Running' status to Successful/Failed.
•
# of Requested Jobs - The number of jobs that have exited the queue (either successful
or failed).
•
# of Served Jobs - The number of jobs that have entered the queue (i.e. added to the
queue).
The bottom row of the table displays the statistical accumulation of the entries in the table.
Queue Additional Details
Clicking on a row will automatically open the Jobs page which will display the Jobs related to the
selected queue. The selected queue will also be remembered for further operations so that when
entering the Settings page the settings for the previously selected will be displayed.
Queue Operations
The Queues table has an additional column that includes the different actions that can be performed
on a queue as follows:
Operations - The possible actions that can be performed on a queue. the operations are as
follows:
•
Add Job - Add a new job to the queue. Clicking this button opens the 'Job Details' page
in add mode.
•
Suspend - Suspend the entire Queue (Jobs belonging to a queue can be individually
suspended by clicking on the Queue and modifying the queues displayed in the jobs
page).
•
Settings - View and Edit Queue settings.
Add Jobs
Clicking the "Add Jobs" button in the table opens the Job Details screen in edit mode. To add a Job
enter the Job information and click " Save" (For more information on creating new Jobs see Job
Details).
Note:
Jobs can only be added if there is an existing Job script located in the "Scripts folder" you defined in
the Job Queue | Settings screen.
Suspend a Queue
Clicking the "Suspend" button in the table changes the status of the Queue to Suspended. In this
status, all Jobs belonging to the Queue will not be executed and running jobs will be completed and
200
Zend Platform
only then suspended. Clicking this button again will toggle the status of a suspended queue to not
suspended and the Jobs belonging to this queue will be resumed at the next possible time (for
recurring jobs).
New Jobs can be added to a suspended queue however, they will not be executed until the queue is
not suspended.
View/Edit Settings
Clicking the "Settings" button opens the Job Queue Settings screen and loads it with the selected
queues settings (For more information on viewing and editing queue settings see Job Queue Settings)
201
Zend Platform User Guide
Jobs Tab
The Jobs tab is accessed from Job Queues | Jobs.
A Job is a specific task that can be independently executed. Using the Platform's Job Queue feature,
Jobs can be handled in queues providing an easy way to manage and handle Job execution.
The Jobs screen is accessed from: Job Queues | Jobs.
Through this screen users can:
Filter Table Data
Locate Jobs by their ID number
View Job Details in a sortable table
Manage Jobs
Figure: Job Queue Screen
202
Zend Platform
Filtering Table Data
Zend Platform allows you to filter the Jobs displayed in the Jobs table.
The filter options are as follows:
Queue - The name of the Queue
Status - The statuses are: Scheduled, Dependant, Ready to Run, Running, Suspended,
Successful and Failed.
Priority - High, medium or low.
Host - The host on which the Job is to be executed.
Application
Recurrence - Jobs can be nonrecurring (run once) or recurring (defined to be executed
repeatedly).
Name - The alias for the Job script. Defined when creating a new Job or in Code based Jobs
defined in the function: setJobName($name), if left empty the filter by script name.
The status line (above the filter by options) changes to show a summary of the items that are
currently displayed in the table.
To filter the data displayed in the Jobs table:
1.
Select the filter criteria to apply to the table by clicking "Filter By" and selecting the
options from the drop-down lists..
2.
Click "Go" to display the filtered events in the Jobs table.
The Jobs Table displays the following information:
ID - a unique identifier given to each Job managed through Platform.
Name - an alias for the Job script. Defined when creating a new Job or in Code based Jobs
defined in the function: setJobName($name), if left empty the script name will be displayed.
Status - the current state of the Job (see list of statuses below)
Priority - the importance of the job, the priorities are (in order of importance) Low, High,
Normal, Urgent. Defined when creating a new job or in code based Jobs defined in the
function: $_priority = JOB_QUEUE_PRIORITY_[TYPE];
Application - an additional identifier for grouping and filtering Jobs. Defined when creating a
new Job or in Code based Jobs defined in the function: $_application_id = null, if left empty
no name will be displayed.
Host - the name of the Host on which the Job was generated.
Script - the name and location of the actual script initiated by the Job.
203
Zend Platform User Guide
Job Statuses
A Job can hold one of the following statuses:
Scheduled - a Job which is waiting to be executed since it has been scheduled to a time
later than the current time.
Dependent - a Job which is waiting to be executed since it waits for a previous Job to finish
running.
Ready to run - a Job which is ready to be executed.
Running - a Job which currently runs.
Suspended - a Job which can run but is currently suspended (paused). A Suspended Job can
be resumed and hence moved to another status.
Successful - a Job which has completed and resulted in a success.
Failed - a Job which has completed and resulted in a failure. There are two types of failures:
•
Execution - when the Job Queue failed to execute the script (for example, the file was not
found).
•
Logical - When the script's logic produced some kind of error that terminated its execution
(e.g. when using the set_job_failed() API function).
Note:
The maximum amount of Jobs displayed in this page is configured in Platform | Preferences.
Locating Jobs by Job ID
Each Job is given a unique ID number when it is created. If you know the Job ID of a specific Job you
want to view, enter the number into the "Find Job by ID" field and click Find to display the Job in the
Jobs table.
View Job Details
The Jobs table displays various details regarding the displayed Jobs.
Apart from the basic information displayed users can click on a Job in the Jobs table and open the Job
Details Page (for more information on Job Details see Job Details).
Manage Jobs
The Jobs tab includes the following Job management options:
Delete - Remove a Job from the list. Jobs that are in progress will complete running and
then be deleted.
Resume - Resume a Job that was previously suspended.
Suspend - Suspend a Job from running.
To apply one of these options to a Job, select a Job by marking the check box (you can select more
than one) and click one of the Job management options (Delete, Resume or Suspend).
If you want to apply one of the options to all the Jobs in the table click "Select All".
Note:
When applying one of the management options to multiple Jobs make sure their current state does
not conflict with the option for example, you cannot delete active Jobs.
204
Zend Platform
Job Details
Job Details tab is accessed from Job Queues | Jobs and clicking on a job in the list.
The Job Details tab, displays a specific Job's properties. This page has two modes: Read-only and Edit.
To add Jobs go to: Job Queues | Queues and click "Add Job".
To view Job details go to: Job Queues | Jobs and click on one of the Jobs in the table.
To edit Jobs go to: Job Queues | Jobs, click on one of the Jobs in the table.
Figure: Job Details
Job Details Page Components
The following is a detailed description of the Job Details page components (Components marked with
* can be edited in edit mode):
Job Id - A unique identifier that is given to each Job. You can use this identifier to search for
Jobs in Job Queues | Jobs by entering the ID into the "find Job by ID" field.
Name - The name given to the Job by the user.
Status - The statuses are: Scheduled, Dependant, Ready to Run, Running, Suspended,
Successful and Failed.
205
Zend Platform User Guide
*Priority - High, low or medium.
Application - The application running the Job
Host - The host on which the Job runs.
Script File -The location of the script for running the Job.
*Dependency - Create a dependency on another Jobs completion. In edit mode, clicking here
will open a pop-up with a "search Job by name" option.
*Scheduling - View or define when the Job will run, recurrence details and effective date.
Last Run - Details of when the Job last ran.
•
Show job output - Opens the Job's script, the default mode "Show as secured
output" that opens the un-rendered script (this is the default setting) the second
option "Show as plain text" will show the rendered output". The secure output option
is a default setting that cannot be changed and has been implemented to prevent
displaying unsecured scripts.
Context - Includes the following Variables:
•
*User Variables - Shows the name and value of the Job's user variables.
•
Globals - Shows the name and values of the Job's global parameters.
Preserve (E) - if this flag is turned on, it means that the Job history will be saved in the
history data even after the 'Time to Save History' time has passed. This is useful if the Job
history needs to be saved.
Job Details Page Buttons:
The following actions can be applied to Jobs.
OK - Closes the dialog.
Delete - Opens a dialog asking whether the user is sure he wishes to delete the Job. Clicking
"No" will close the dialog, and clicking "Yes" will delete the Job and the Jobs page would be
displayed. Deleting a Job would delete its instances from the historical data as well.
Suspend/Resume - this is a toggle button, it will be active for suspended Jobs and disabled
when a Job is not suspended.
(This button is only displayed when Jobs are still running)
Edit - Displays the same page in the "Edit" mode.
(This button is only displayed when Jobs are still running)
Re-queue - Displays the same page in "Edit" mode. As a result users will be able to re-set the
scheduling data, and then re-queue the Job (add it back to the Queue).
(This button is only displayed when Jobs are still running)
The following buttons are only displayed in Edit mode:
206
Save - Saves the Job's data.
Cancel - Closes the Job Details page without saving changes.
Zend Platform
Job Queue Settings
The Job Queue Settings tab is accessed from Job Queues | Settings.
The Job Queue Settings tab displays settings associated with a specific Queue.
Note:
Windows all supported versions should use the service manager to Start and Stop services (Start/Stop
options in the Tab will not be available). To view a Job Queue service's status or to stop/start it,
please open your Windows Services panel (by clicking Start | Control Panel | Administrative Tools |
Services) and locate and run the Platform Job Queue service.
Through this screen users can:
View Queue settings.
Edit Queues
Figure: Job Queue Settings
207
Zend Platform User Guide
Viewing Queue Settings
The following procedure describes how to view queue settings. Queue settings are the specific
definitions that define the Queue's behavior.
There are two ways to determine which Queue will be displayed in the Settings
screen:
1.
Select a queue from the "Settings for Queue" drop-down list.
2.
Navigate to the Job Queue Settings tab from the Queues tab (Job Queues |
Queues).
Clicking the Settings button in the Queue Statistics table automatically opens the
Job Queue Settings screen and loads the selected queues details.
Queue Settings
The title of the Job Queue Settings tab always states the name of the Queue displayed in the tab.
Typically, the recently-selected Queue (i.e., the one recently selected in the Queues page) will be
selected in the drop-down list. If a Queue was not previously selected the user has to choose a queue
from the "Settings for Queue" drop-down list. Displayed queues are remembered therefore users may
switch tabs and when they return to the Job Queue Settings tab and the same queue will still be
displayed.
The Job Queue Settings are divided into three sections:
1.
General Settings:
Maximal Queue Depth - Specifies the amount of concurrent Jobs for the queue or
leave it unlimited.
Save Statistics History - Specifies how much of the queue's history should be saved.
Maximal re-queue times - Specifies how many times a Job can be re-queued.
Sliding window - Collects Job Statistics
Queue Alias - Displays the Queue's name according to the name given in the
installation process.
Script folder - Specifies the file name and location of the script the Queue should
run.
2.
Password Settings - Specifies the security settings to limit editing and deleting a Queue to
authorized users only. Not entering a password will mean the specific Queue will not require
authorization.
3.
Enter New Queue Password - Specifies a password for limiting access to the Queue.
Confirm New Password - Confirm the password.
Network Settings - List of allowed hosts.
Add/Edit/Remove Server Host - Configure the IP's that are permitted to
communicate with the Queue Daemon on this server.
Editing Queues
The following procedure describes how to edit Queues.
208
Zend Platform
To edit a Queue:
1.
Go to Job Queues | Queues
2.
In the Queue Statistics table, Click "Edit"
The Job Queue Settings tab will open with the selected queue's information
3.
Edit the Queue's settings and press Save.
The changes will be saved.
The Job Queue Server is a container for Queues, it executes Queues according to a scheduling
algorithm (e.g. Round Robin). Typically a machine only runs one Job Queue Server.
A Queue is a logical container which contains a set of Jobs. The Queue executes the Jobs and contains
information about each Job. Each Queue is associated with a set of settings. For additional
information, please refer to Job Queue Settings.
209
Zend Platform User Guide
Zend Download Server (ZDS)
Contents:
Configuring the Zend Download Server (ZDS)
Test Download
ZDS Settings
Understanding Test Results
Testing the ZDS
The Zend Download Server* is a PHP (Zend Engine) plug-in which efficiently deals with serving large
downloads such as videos e.g. .mpeg files, binary products such as .exe and .msi files, and any other
large files which are served over the HTTP protocol.
How it works:
The Download Server supports two modes of operation (both of which can be used together or
separately according to your needs):
Manual mode - The download is initiated by a PHP script using one simple PHP API function
call. Not only does it allow you to serve files which aren't under your web server's document
root but also it allows you to run logic such as access restriction checks before the download
is started.
Transparent mode - In your web server's configuration file you map the files you want to
be sent through the efficient downloading mechanism to PHP, and the Zend Download Server
will jump into action automatically and serve them.
*The Download Server is currently not applicable for Windows Operating Systems.
Configuring the Zend Download Server (ZDS)
Zend Download Server settings are accessed from ZDS | Overview.
(This feature is currently not applicable for Windows Operating Systems)
The ZDS (Zend Download Server) is a PHP (Zend Engine) plug-in. The purpose of this plug-in is to
efficiently deal with serving large, downloads. This is done to preserve Website performance levels
when handling large downloads that are served over the HTTP Protocol and consume bandwidth.
Downloads include, Video Files, Binary Products (such as .exe and .msi files), and other large files
which are served over the HTTP protocol, and can potentially limit the performance of your Website.
The ZDS provides two options:
1.
Configure ZDS Settings
2.
Test ZDS
ZDS functions in two modes:
Manual Mode - Calling the API function zend_send_file() from PHP scripts.
Transparent Mode - mapping file extensions to zend_mime_types.ini
Either mode can be run separately or in conjunction. Read on to find out how to configure the ZDS to
run in either mode.
210
Zend Platform
Manual Mode
In Manual mode, downloads are initiated by a PHP script that uses one all-purpose PHP function call.
ZDS includes the PHP functions zend_send_file(filename[,mime_type][,custom_headers]) and
zend_send_file(string buffer[, string mime_type][, string custom_headers]).
Calling zend_send_file() immediately starts the file download and terminates your PHP script's
execution. This effectively frees up the Apache process to handle the next incoming request.
The zend_send_file() function can also serve files that are not under the Web server's document root.
Furthermore, it can be used to run logical functions such as access restriction checks, before
downloads are started. From an external point of view, the effect is similar to fpassthrou ($fh) and
then exit.
zend_send_buffer is used when servicing large downloads created on-the-fly (such as PDF files, large
images etc.). When using this function it is important to specify the mime_type. From an external
point of view, the effect is similar to echo and then exit.
Example:
If a download function is called my_send_file($filename), you should integrate the
zend_send_file() call in the following way in your source code:
if (function_exists("zend_send_file")) {
zend_send_file($filename);
} else {
my_send_file($filename);
}
Alternate Method
zend_send_file can also be set to accept a second argument, the mime type of the file. This will
override the default mime type setting.
The parameters are: zend_send_file(string filename[, string mime_type]).
Example:
It would be called in the following way in your source code:
if (function_exists("zend_send_file")) {
zend_send_file("/path/to/file.wma", "video/my-wma-type");
} else {
my_send_file($filename);
}
zend_send_buffer
The parameters are bool zend_send_file(string buffer[, string mime_type][, string custom_headers]).
Example:
It would be called in the following way in your source code:
if (function_exists("zend_send_buffer")) {
zend_send_buffer($my_picture_content,"image/giff");
} else {
my_send_buffer($my_picture_content);
}
211
Zend Platform User Guide
Note:
If the mime_type is not specified or empty, the first mime type mechanism is used.
Manual Mode Usability Notes:
Do not create any output in Manual mode, before calling zend_send_file() - neither headers nor body
- as headers will not have any effect when sent by the ZDS (they will only take affect if sent outside
the ZDS).
Once you call zend_send_file(), the script terminates, so make sure all of your business logic runs
before you call this function.
Sometimes files that are not under the same document root need to be served. Therefore, It is
recommended to use the full path name to the file you want to serve. This will guarantee your script
will work, even if you move it from your Web server's document root.
Transparent Mode
In Transparent mode, the file types that should be downloaded via ZDS are pre-configured, by
mapping these files in the configuration file of your Web server. Files greater than the min_file_size
directive will be automatically served by the ZDS.
To run ZDS in Transparent mode, make sure you meet the following requirements:
The file extensions appear in the zend_mime_types.ini file and the file is mapped to the
correct mime type.
For example: to serve .mpeg files via the ZDS, add the following line in
zend_mime_types.ini:
video/mpeg mpeg
In your Apache Server’s configuration file, map the file type to PHP.
For example, to map all .mpeg files to the ZDS in Apache by adding the following line to the
Apache Server’s configuration:
AddType application/x-httpd-php .mpeg
Both methods (manual mode and transparent mode) ensure that the Web application will continue to
work even if, for some reason, you decide to temporarily disable the ZDS, (as long as the ZDS module
was loaded).
To Configure the ZDS:
Go to ZDS | Overview.
Figure: Zend Download Server Settings
212
Zend Platform
The settings screen contains the general ZDS configuration settings:
Download Server Enabled - Indicates if the Download Server extension is running
(Activating the Download Server here applies the changes to the Extensions list in
Configuration | PHP Configuration.
Minimum File Size - The minimum size of files that will be served by the ZDS. Small files
need not be served by the ZDS, since performance gain is insignificant. Default: 64Kbytes.
Server MaxClients - The testing tool (in Platform Administration) uses this value to
determine your server’s MaxClients. Keep this value updated to the actual number of max
clients of your server.
Log File - The name and location of the log file where the ZDS reports completed downloads.
Default: <install_dir>/logs. Make sure the directory exists and that the user who starts the
Web server (usually root) has "write" permissions.
Server MaxClients Recommendation:
The MaxClients setting depends on your server hardware. To achieve accurate test results the server
should be set between 50-150 MaxClients. The MaxClients value must be the same in the Download
Server Settings and the Web server’s configuration file.
These settings are applied to downloads handled in one of the two handling modes: Manual and
Transparent.
ZDS Settings
The Zend Download Server Settings tab is accessed from ZDS | Settings.
Download Server Enabled
An on/off switch for activating and deactivating the 'download Server (when set to Off large
downloads will be serviced through the regular channels).
Minimum File Size
The minimum size of files that will be served by the 'Download Server.
Small files do not need to be served by the 'Download Server (although they can be) since
the gain is insignificant.
Default: file size is 64Kbytes.
Log File
The name and location of the log file where the 'Download Server reports completed
downloads.
Log Verbosity Level
This setting determines type of content to be added to the log file where the option
Informational includes the other options.
Server Process Priority
The Priority of ZDS server process. A Higher value means lower priority. The value range is
1-19 and is calculated as max with the apache.nice setting. Anything computed value higher
than 19 will be converted to 19.
Note:
Make sure the file's directory exists and is writable by the user who starts the web server (typically
root). The default is <install_dir>/logs/ZDS.log.
213
Zend Platform User Guide
Testing the ZDS
The Test ZDS tab is accessed from Performance | Testing | Test Download.
Once the ZDS has been configured a test can be run to check and analyze the overall efficiency.
The default ZDS test uses the Manual mode of operation to invoke a PHP script, which sends
a file of approximately 300KB.
The same test tool can be used to check the 'Transparent' mode. Make sure that you
correctly map the file type you are checking in your Web server's configuration file according to the configuration instructions.
The test simulates multiple requests for a specified URL, with and without ZDS. There are three sets
of tests; each test is performed twice (once with the ZDS disabled and once with the ZDS enabled).
These tests differ in the number of concurrent clients that simultaneously perform requests to the
server.
Note:
It is extremely hard to artificially test ZDS. The main reason is that testing it on a LAN can easily
saturate your local network, and if your MaxClients is very high, Apache Benchmark (ab) may have
difficulty handling the concurrency. For this reason, it is recommended to test ZDS with a relatively
low MaxClients setting (e.g., 50-150) so that you don't reach any of these limits. The ZDS includes a
version of ab, which was modified to support bandwidth throttling, which is used by the testing tool.
Caution:
During a test, your Web server will be fully loaded. A test can take several minutes so you should run
it on a development machine or on an offline production machine.
To Test the ZDS:
Go to Performance | Testing and go to the Test Download tab.
Figure: Performance - Testing - Test Download Tab
214
Zend Platform
The Test Download Tab consists of two sections: The test options are on the upper section and the
test results appear below (after running a test or displaying the last test results).
Running a Test
1.
Type in the URL you want to test.
The default test is a PHP script which uses zend_send_file() to send a 300K zip file
(Testing very large files will take a very long time).
2.
Choose the bandwidth limit you want to simulate for the clients. For a faster test,
select a higher bandwidth (You cannot choose full bandwidth because your network
card will be saturated, making the test irrelevant. The test tries to simulate a typical
Internet server that has clients connected either by ISDN or DSL).
3.
Enter the number of maximum clients that your server can handle.
Use the precise value by checking the value of the MaxClients directive in your
server’s configuration file (The ZDS tries to identify your MaxClients value in the
installation process, via the httpd.conf file, which is the default value. However, this
value can be changed after the installation; and should be double-checked. Using an
inaccurate MaxClients value, may not present accurate results).
4.
Click Run.
215
Zend Platform User Guide
Test Download
The Test Download tab is accessed from Performance | Testing | Test Download.
The Zend Download Server (ZDS) is a transparent process that runs in the background to service
large downloads. The performance gain obtained by using the ZDS is measured with the Test
Download option.
The Test Download option checks the efficiency of the Download Server. Test Download simulates
multiple requests for a specified URL with and without the ZDS, thereby creating its own benchmark
for comparison. This feature is currently not applicable for Windows Operating Systems.
To Run a Download Test:
Go to: Performance | Testing and choose the Test Download tab.
1.
Enter the URL for Testing. (The default is a proprietary Zend PHP script which uses
zend_send_file() to send a file.)
Note: Testing very large files will take a very long time.
2.
Enter the bandwidth limit you want to simulate for the clients (For a faster test,
select a higher bandwidth).
Note: Do not select full bandwidth; doing so will saturate your network card that
will make the test irrelevant. The test tries to simulate a typical Internet server that
has clients connected either by ISDN or DSL.
3.
Enter the Max Clients value defined for your server. Insert the accurate value by
checking the MaxClients directive in the httpd.conf file.
Note: The ZDS installation tries to identify your MaxClients value via the httpd.conf
file that is the GUI’s default value, but this value can be changed after the
installation, so it is important to verify that the value listed is correct.
4.
Click "Run" to run the Download Test.
Viewing Download Test Results
Once the tests have completed, you can view the test results both statistically and graphically.
To view the results of the most recent Download Test:
From the Test Download Tab click, "Show Last Download Test Report". The test report
includes tables and graphs that display the Requests per Second and Number of Concurrent
Requests for each test run.
Note:
The Download Test is a simulation. The most meaningful test results are obtained by running ZDS on
the production server and monitoring the log file to see how many concurrent jobs the ZDS is
handling.
216
Zend Platform
Understanding Test Results
Once the tests have completed, you will see two tables and graphs with results that show Requests
per Second and Average Time per Request for each test run.
Figure: Download Server - Test Results
Disabling the Accelerator changes the test configuration to cached scripts only.
Note:
If you do decide to run the ZDS Test on a production server, you can watch the log file to see how
many concurrent jobs ZDS is handling. This indicates the number of Apache processes that would
have been used if the ZDS were not installed.
217
Zend Platform User Guide
Integration Server
Contents:
Java Bridge
BIRT Reports
SNMP Traps
The Integration Server includes features for integrating with external technologies and environments:
The Integration Server includes the following functionality:
Java Bridge - used to access Java based applications running in a Java application server.
Platform’s Java Bridge offers significant performance and scalability advantages. Specifically,
the memory consumption in the PHP/Java Bridge is constant, regardless of the number of
PHP sessions-unlike the equivalent solution, for example, in PHP 5.
BIRT Report Integration - extract Business Intelligence reports from Java libraries using PHP
(Requires the Java Bridge).
SNMP Traps - An additional means of delivering Event information and parameters in a
standardized way to a management console. The Event information includes details about
occurrences (events) inside the system (For more information on SNMP, see About SNMP.
218
Zend Platform
Java Bridge
Contents:
About
Common Tasks
Operating and Configuring
Usability Issues
Java Bridge Tab
The Platform PHP/Java Bridge is a PHP module that connects the PHP object system with the Java
object system. It can be used to access Java based applications running in a Java application server.
Platform’s Java Bridge offers significant performance and scalability advantages. Specifically, the
memory consumption in the Platform PHP/Java Bridge is constant, regardless of the number of PHP
sessions-unlike the equivalent solution, for example, in PHP 5.
The PHP/Java Bridge feature should interest three types of enterprises:
Companies that have investments in J2EE application servers can take advantage of PHP's
Web-enablement capabilities, while preserving the utility of their Java investment.
PHP-centric companies that want to take advantage of J2EE services that are not present in
scripting languages-specifically, PHP.
Companies that are not highly invested in J2EE and legacy systems can take advantage of
Platform’s PHP/Java Bridge to interact with plain Java objects.
Companies that use or want to use Actuate reports.
219
Zend Platform User Guide
About the Java Bridge Technology
The Java Middleware module (JavaMW) provides PHP connectivity to Java. The API is analogous to the
standard PHP Java API (http://www.zend.com/manual/ref.java.php), however the implementation is
different. JavaMW uses a stand-alone Java server process, which allows it to efficiently process Java
requests. It adds stability and reliability to the PHP/Java connection. Unlike a standard PHP/Java
connector, it uses a single Java virtual machine for all the requests, which makes memory and
processor requirements significantly more modest while improving scalability.
The diagram below illustrates the Java Bridge technology:
Figure: Java Bridge Process Level
The Java Bridge Process Level diagram illustrates the following:
Platform Node
Platform Nodes include two bridging components: the PHP-side Bridge and the Java-side Bridge.
Platform Nodes operate as follows:
1.
A JVM (Java Virtual Machine) is installed first-before installing the Platform Node-on the
machine that is to be set up with Platform.
For the Java Bridge to function, you must install a compatible version of JVM. Platform will
find the compatible version automatically. Supported versions are SUN J2SE 1.4 or SUN
J2SE1.5 (J2SE 5).
2.
Platform then installs the two components required-the PHP-side and the Java-side-to create
the Java Bridge.
3.
A PHP application can call a Java object from any Java library that resides on the Node.
For example, JVM can be downloaded with all its component libraries.
When a PHP application calls a Java object over the Java Bridge, a proxy for that object is created in
PHP. In the diagram, the Java object is represented as a dark square; the proxy for that object in PHP
is shown as a light square.
220
Zend Platform
J2EE Application Server
The J2EE Application Server in its more advanced configuration, allows you to create a PHP/Java
Bridge between a Platform Node and an external J2EE Application Server. This type of configuration is
typical of companies that have existing Java-based infrastructure. The J2EE Application Server
operates as follow:
1.
A PHP application can call a Java object from a Java library external to Platform.
2.
The Java-side Bridge component communicates with the J2EE Server. It finds objects in the
J2EE Server, for example an EJB. The entire process is Java based.
3.
The PHP application then calls the Java object over the Java Bridge created between the two
Platform bridging components.
4.
A proxy for that object is created in PHP. In the diagram, the Java object is represented as a
dark square; the proxy for that object in PHP is shown as a light square.
The complete integration of Java and PHP is described in the following diagram:
Figure: Java Bridge System Level
The Java Bridge System Level diagram illustrates the following about the network
architecture:
Platform Nodes - In order for a Platform Node to function as a Java Bridge, it must have a
properly functioning Java installation. Once Java is installed,the Platform installation installs
the required components for the Java Bridge, some of which are implemented in Java.
J2EE Server - The Java-based enterprise that adds Platform will have its own application
servers. A J2EE Server is shown in the diagram as part of the Front Office. It can
communicate with any of the Platform Nodes that have Java installed on them and which are
defined in Java as legitimate accounts.
221
Zend Platform User Guide
Added Value
Platform’s Java Bridge supports a PHP-Java integration that benefits enterprises on both the business
and technical level.
Business Level Benefits:
Companies with J2EE application servers can begin to realize the advantages PHP offers over
other Web-enablement languages, including: shortened development time, shortened timeto-market, lower TCO (Total Cost of Ownership), etc.
PHP-centric companies can take advantage of J2EE services that are not present in scripting
languages.
Technical Level Benefits:
Platform’s PHP/Java Bridge provides the ability to interact with plain Java objects.
Platform’s Java Bridge operates without the overhead of a JVM for each Apache process.
Platform’s Java Bridge consumes a finite amount of memory, which is almost disproportional
to the amount of activity that’s going through it.
Operating and Configuring
This section describes procedures for operating and configuring the Java Bridge.
Configuring Run-time:
For running JavaMW, the following command can be used:
java com.zend.javamw.JavaServer
For correct execution, classpath should include javamw.jar file in the directory where JavaMW
is installed.
Example:
UNIX, Linux, i5/OS and Mac <install_dir>/bin/javamw.jar
Windows <install_dir>\bin\javamw.jar
222
Zend Platform
Java Status Page
The Java Bridge tab provides status information about the Java servers connected to the network. The
information displayed in the Java Status page, shows information about a selected server.
To access the Java Bridge tab go to Integration | Java Bridge.
The active buttons on the Java Status page are:
Stop - Shuts down the Java Bridge daemon.
Start/Restart - Restarts the Java Bridge daemon.
Refresh - Refreshes the page for the selected server.
Help - Opens the Online Help for the Platform Java Bridge.
OS Compatibility Note:
- Windows all supported versions should use the service manager to Start and Stop services
(Start/Stop options in the Tab will not be available).
- FreeBSD - The Java Bridge is currently not available.
The Java Status page includes information about:
Java Environment - The Java Environment includes the Java Version, Java Vendor, OS
Name, OS Version, Class Path and Java Home
Bridge Statistics - Bridge Statistics information includes the Number of connections and
Requests.
•
Number of connections - The accumulated number of processes holding a connection to the
Java Bridge server (the full amount).
•
Number of Requests - The number of 'worker threads' available for processing requests to
the Java server.
Note:
The Java Bridge requires that you have SUN’s JRE 1.4 or later or IBM's Java 1.4.2 or later installed on
your computer. While installing Platform you were prompted to direct the installer to the JRE’s
location. Therefore, you should already have JRE installed. If you did not choose to setup the Java
Bridge in the installation process you can do so after the installation using the Setup Tool (from
UNIX, Linux and Mac: <install_dir>/bin/setup_tool.sh from i5/OS: GO ZENDPLAT/ZPMENU from
Windows: Start | Programs | Zend Platform | Setup Tool).
More information about JRE’s and the latest updates can be obtained from SUN Microsystems’s
website: http://java.sun.com.
223
Zend Platform User Guide
Working with the Java Bridge User Interface
To view the Java Status Page for a selected server:
Figure: Select Server to Configure
1.
Go to the Java Bridge tab and the "Select Server to Configure" dialog opens.
2.
Select a server from the list of servers in the Server Tree and click "OK".
The Java Status Page opens for the selected server.
Figure: Java Status Page
Note:
Statistical information is gathered on the Java server. Therefore, even after restarting the Web server,
the statistics are maintained. This naturally does not apply to restarting the Java server, which will
restart the statistics collection from zero.
224
Zend Platform
Using the command buttons provided on the Java Bridge user interface, you can stop the Java Bridge,
start the Java Bridge, or refresh the Status Information shown on-screen, for the selected server.
To stop the Java Bridge:
1.
Click "Stop".
Platform opens an information screen that tells you that the Java Bridge was
successfully stopped.
2.
Click "OK" to close the window.
Platform closes the window and returns to the Java Bridge main screen.
Configuring the Java Bridge
Zend Platform’s Java module has two configuration parameters:
zend.javamw.threads - Specifies how many worker threads the server is using; allowing
this number of concurrent requests to be executed. The default value is 20.
zend.javamw.port - Specifies the TCP port on which the server is listening. The default
value is 10001.
Example Script
The following example is the shell script for running JavaMW (this script should be customized when
necessary):
export CLASSPATH=$CLASSPATH:`pwd`/javamw.jar
java -Dzend.javamw.threads=20 -Dzend.javamw.port=10001 com.zend.javamw.JavaServer
Note:
Add other entries into CLASSPATH if you use non-standard Java packages.
PHP Configuration
The PHP module uses the following configuration directives:
java.server_port - Specifies the TCP port on which the server is listening. The default value
is 10001.
Note:
This must be the same as zend.javamw.port for the server.
Java.ints_are_longs - converts PHP’s integer to Java’s java.lang.Long. By default and if
this option is off, the PHP’s integers are converted to java.lang.Integer.
225
Zend Platform User Guide
Common Tasks
This section describes some of the common uses for the Java Bridge. The usage scenarios and
examples discussed here provide a framework for the Java Bridge’s uses, rather than a complete
picture. Real world experience indicates that companies are finding more and more applications for
the Java Bridge, beyond what was initially anticipated.
Usage Scenarios
There are two usage scenarios that describe the most common applications for Platform’s PHP/Java
Bridge:
Integration with Existing Java Infrastructure - PHP is a fully featured scripting language
engineered to cover virtually all of an enterprise’s requirements. At the same time, many
enterprises have a long history of application development in Java. Platform’s Java Bridge
enables enterprises to keep on using their Java infrastructure - applications, databases,
business logic, and various Java servers (WebLogic, JBoss, Oracle Application Server, etc.)
Accessing Java Language and Architecture - Some enterprises require the full set of
PHP’s capabilities, yet have a specific need for select Java based applications. SIP signaling in
the communications industry or JDBC for creating connectivity to SQL databases are two
examples of impressive, industry specific products. Platform’s Java Bridge enables
enterprises to adopt a PHP standard and to use their preferred Java based applications.
Activities
This section describes two sample activities that indicate some of what you can do with Platform’s
PHP/Java Bridge. In the sample activities, it is important to differentiate between Java and J2EE. The
difference will impact on architecture, and in turn, on the script code.
The important differences are:
Java is a programming language. Java applications created in Java for the enterprise are not
bound to a specific framework. Therefore, it is possible and perhaps preferable for an
enterprise to relocate code libraries to a Zend Platform node.
J2EE is a structured framework for application scripts developed for J2EE. It is preferable that
J2EE servers be left intact. (See the Zend Platform System Diagram above.)
Example 1: Typical Code
The code sample below is a functional example-you can run it! The example demonstrates the
interaction between the PHP application and Java objects that occurs in the Java Bridge
implementation.
Example:
<?
// create Java object
$formatter = new Java("java.text.SimpleDateFormat",
"EEEE, MMMM dd, yyyy 'at' h:mm:ss a zzzz");
// Print date through the object
print $formatter->format(new Java("java.util.Date"))."\n";
// You can also access Java system classes
$system = new Java("java.lang.System");
print $system."\n"; // will use toString in PHP5
226
Zend Platform
print "Java version=".$system->getProperty("java.version")." <br>\n";
print "Java vendor=".$system->getProperty("java.vendor")." <p>\n\n";
print "OS=".$system->getProperty("os.name")." ".
$system->getProperty("os.version")." on ".
$system->getProperty("os.arch")." <br>\n";
?>
The example code can be understood as follows:
1.
The code example is written in PHP and forms part of a PHP Web application.
2.
The PHP code creates the Java object-"java.lang.System"-which is the PHP proxy.
3.
The purpose of the PHP code is to print the date and system information; however, it does so
through the Java object.
Example 2: A Case Study Java Bridge Performance
The Forever Times newspaper maintains a PHP-based Website-let’s call it ForeverOnline.com. The
newspaper has been searching for a real-time Stock Ticker application to add to their already
successful and heavily visited Website. The Forever Times Newspaper feels that real-time financial
information is the one thing their web site is lacking.
Forever Times believes they have found exactly the Stock Ticker application they need. The
application provides up-to-date quotations from all the major markets, currency rates, and even links
to some of the local exchanges. However, the application is written in Java and uses existing Java
libraries.
Forever Times realizes that a PHP based Web implementation that handles Java requests-a Java
Bridge-is their best bet. At the same time, they are concerned that the performance of their Website
remains optimal. To Forever Times’ horror, in testing the new application, they found that loading the
site with user-requests for the stock ticker slows down the performance of the whole Website.
The following code example illustrates how Platform’s Java Bridge applies to this business scenario
and others like it:
Example:
<?
// create Java object
$stock = new Java("com.ticker.JavaStock");
// call the object
$news = $stock->get_news($_GET['ticker']);
// display results
foreach($news as $news_item) {
print "$news_item<br>\n";
}
?>
The example code can be understood as follows:
The code example is written in PHP and forms part of a PHP Web application.
The PHP code creates the Java object-"com.ticker.JavaStock"-which is the PHP proxy.
Requests come into the PHP based Website - ForeverOnline.com - which then references the
Stock Ticker application.
Stock Ticker references a custom object- get_news-in the JVM library. This is all in native
Java.
227
Zend Platform User Guide
The PHP code then outputs the results on the Website.
The Typical Java Bridge Implementation and the Platform’s Java Bridge Implementation diagrams
below show how Forever Times’ concern about performance is addressed, through the Java Bridge
architecture. The diagrams focus on how problems in scalability arise in a typical Java Bridge
Implementation.
Figure: Typical Java Bridge Implementation
The Java Bridge Implementation diagram shows how scalability issues are addressed in the Java
Bridge.
Figure: Zend Platform’s Java Bridge Implementation
Note:
While the single JVM constitutes a single point of failure, the fact is Zend’s PHP-Java connection is the
most robust on the market. Failures in systems of this type generally tend to occur when the Java
Server is overloaded, rather than as a result of glitches in the applications. Platform’s system
architecture insures performance by diminishing overhead. However, in the event of failure, the Java
Bridge supports a Restart feature that makes monitoring the status of the Java Server and restarting
quick and simple. One last point: if the failure was caused by a glitch in the application, the same
thing would most likely occur in each of the JVMs in the non-Zend system!
228
Zend Platform
Example 3: Case Study in Management Integration
A company called FlowerPwr.com, sells flowers over the Internet. They are a successful East coast
based firm that has an aggressive management profile. They are currently in the process of acquiring
a West coast competitor-let’s call it Yourflowers.com-that provides a similar service.
FlowerPwr.com has its own website, and its various enterprise applications were written in PHP.
Yourflowers.com has its own Website, however all its applications are Java based and were developed
for J2EE. They have their own J2EE application server. FlowerPwr.com needs to begin operating as an
integrated commercial entity as soon as possible in a way that conceals the fact that the companies
have merged.
Platform’s Java Bridge offers a solution. Using Zend Platform, FlowerPwr.com can create a common
portal in PHP. The company can leave Java up and running and take full advantage of their
acquisition’s existing Java services. FlowerPwr.com can do this over an existing portal using PHP.
The following code example illustrates how Platform’s Java Bridge can apply to this business scenario
and others like it:
Example:
<?
// EJB configuration for JBoss. Other servers may need other settings.
// Note that CLASSPATH should contain these classes
$envt = array(
"java.naming.factory.initial" => "org.jnp.interfaces.NamingContextFactory",
"java.naming.factory.url.pkgs" => "org.jboss.naming:org.jnp.interfaces",
"java.naming.provider.url" => " jnp://yourflowers.com:1099");
$ctx = new Java("javax.naming.InitialContext", $envt);
// Try to find the object
$obj = $ctx->lookup("YourflowersBean");
// here we find an object - no error handling in this example
$rmi = new Java("javax.rmi.PortableRemoteObject");
$home = $rmi->narrow($obj, new Java("com.yourflowers.StoreHome"));
$store = $home->create();
// add an order to the bean
$store->place_order($_GET['client_id'], $_GET['item_id']);
print "Order placed.<br>Current shopping cart: <br>";
// get shopping cart data from the bean
$cart = $store->get_cart($_GET['client_id']);
foreach($cart as $item) {
print "$item['name']: $item['count'] at $item['price']<br>\n";
}
// release the object
$store->remove();
?>
229
Zend Platform User Guide
The example code can be understood as follows:
1.
The code example is written in PHP and forms part of a PHP Web application.
2.
The PHP application first initializes an operation with the EJB, located at a specific URL that
has the name:"//yourflowers.com:1099."
3.
The code then specifies the bean-YourflowersBean-that the application will look for.
4.
Next, the bean object is returned from the EJB server.
5.
The application then calls methods-in this case, the Java application includes two functions:
•
place_order receiving two numbers - client ID and the item ID to add to shopping
cart
•
get_cart receiving one number - client ID and returning the list of the items placed
in the shopping cart so far.
After script execution the referenced class may be disposed.
230
Zend Platform
Usability Issues
The Java Bridge’s PHP 4 module has a number of usability issues compared to native Java code, which
stem from the limitations imposed by the PHP 4 language. Most of these limitations do not exist in
PHP 5 and those that do will be mentioned as such.
Chain Functions Call
In pure Java, you can program the following chain function:
result = object.Method1().Method2().Method3();
In this example, the result of one method becomes the object for another method. PHP 4’s Java
module, however, does not allow you to write a chain function in a similar way, as per example:
$result = $java_object->Method1()->Method2()->Method3();
This is due to the fact that PHP 4 disallows chaining method calls. Instead, a chain function must be
expressed as follows:
$result1 =
$java_object->Method1();
$result2 = $result1->Method2();
$result = $result2->Method3();
Note:
In PHP 5, you can use chaining.
Exceptions
Since PHP 4 has no concept of exception, you may not include Java exceptions in your PHP code.
However, you can use functions to deal with exceptions.
java_exception_get:
http://www.zend.com/manual/function.java-last-exception-get.php
java_last_exception_clear:
http://www.zend.com/manual/function.java-last-exception-clear.php
PHP 5 has a concept of exceptions and therefore can handle Java exceptions and translate them into
PHP exceptions.
The following examples display the different exception scenarios and what they look like:
How Exceptions Work:
In this example exceptions are inherited from an exception class.
Example:
<?
try {
$stack=new Java("java.util.Stack");
$stack->push(1);
$result = $stack->pop();
print "$result\n";
$result=$stack->pop();
} catch(Exception $ex) {
print "Exception in pop: ";
print $ex->getCause()->toString();
print "\n";
}
?>
231
Zend Platform User Guide
Caught Exceptions:
This example shows what an exception looks like when a Java Code exception is caught. This is an
example of a typical exception that will appear instead of the expected PHP output when specified in
the code i.e using print_r ($exception) or var_dump ($exception).
Example:
JavaException Object
(
[message:protected] => Java Exception java.util.EmptyStackException:
java.util.EmptyStackException
at java.util.Stack.peek(Stack.java:79)
at java.util.Stack.pop(Stack.java:61)
[string:private] =>
[code:protected] => 0
[file:protected] => /vector.php
[line:protected] => 7
[trace:private] => Array
(
[0] => Array
(
[file] => /vector.php
[line] => 7
[function] => pop
[class] => java.util.Stack
[type] => ->
[args] => Array
(
)
)
)
[javaException] => java.util.EmptyStackException Object
)
232
Zend Platform
Uncaught Exceptions:
Uncaught exceptions are also reported but because they lack an immediate relation to a specific
exception class they are less detailed and can only indicate basic details regarding the occurrence of
an exception. This type of exception typically appears in your error log or wherever you have defined
your php.ini to store errors.
Note:
Please refer to the PHP manual for more information regarding the php.ini eror reporting definitions.
Example:
Fatal error: Uncaught exception 'JavaException' with message 'Java
Exception java.util.EmptyStackException:
java.util.EmptyStackException
at java.util.Stack.peek(Stack.java:79)
at java.util.Stack.pop(Stack.java:61)
' in /vector.php:7
Stack trace:
#0 /vector.php(7): java.util.Stack->pop()
#1 {main}
thrown in /vector.php on line 7
Java Array/Hashtable Objects
In PHP, arrays and hashtables are used interchangeably. This is because in PHP hashtables are
indexed by integers or strings-not by objects. In Java, the key and value must be objects to be
associated, so primitive types have to be converted to objects first, before parsing.
In Zend Platform’s Java interface, if a method returns array/hashtable, it is immediately translated
into a PHP native array/hashtable type. This means that if you want to work with a Java array/hash
from PHP you cannot preserve it as a Java object. Of course, the contents are preserved, but the
object identity is lost. In such a case, when an array/hash is returned, you will lose the ability to use
Java methods since the array/hash loses the object identity and becomes a regular PHP array.
There are several ways to handle Java arrays and hashtable descendants. The following example
shows a possible scenario of how Java arrays and hashtable descendants can be converted into PHP
arrays by splitting the class pattern method and returning an array of strings which is then converted
into a PHP array as follows:
Example:
<?
$exp = new Java("java.util.regex.Pattern");
$p = $exp->compile(":+"); // Create new patten object
$arr = $p->split("a::b:c:::d:e"); // Use pattern to split string into array
print_r($arr);
?>
To deal with Array/Hashtable objects originating in Java:
Implement the code dealing with the array in Java and then call it from PHP, or encapsulate the object
in a different class.
233
Zend Platform User Guide
Iterators
Iterators are not handled by the Java Bridge in any special way and they are treated like any other
Java object.
234
Zend Platform
BIRT Reports
Contents:
BIRT Reports Tab
Setting-Up the BIRT Report Engine
BIRT Report Examples
Advanced reporting capabilities, have been integrated into Platform, to provide enterprise users with
expandable reporting functionality. Actuate's reporting application is the chosen application. Together
with the Java Bridge it can extract reports from Java libraries and generate reports on any
information. This solution is essentially a PHP API to the Actuate BIRT 2.1.1 run time environment that
supports both PHP 4 and PHP 5.
To access the BIRT Reports tab go to: Integration | BIRT Reports.
The BIRT reporting framework was developed by Actuate as a project under the eclipse foundation.
The BIRT reporting system is a Java reporting tool for building and publishing reports against data
sources ranging from typical business SQL databases, to XML data sources, to in-memory Java
objects.
Types of reports that can be generated:
Lists that include sorts, groups, totals, top N reports, averages and summaries
Statements, invoices, documents, letters, forms and other business correspondence
Charts including pies, lines, bars, gauges and many more formats
Actuate BIRT reports can combine text, images, rules, charts, tables and other elements in a single
document or web page. Actuate BIRT also provides extensive support for the language needs of global
application deployment. Using Actuate BIRT, a single report can display strings in various languages
and can adapt date and numeric formatting and item widths to global languages.
Using BIRT
Platform includes Actuate’s report run-time environment allowing users to run BIRT reports, directly
from Platform Administration. In addition, Studio includes the BIRT reports design interface (See the
Zend Studio Online Help for more about creating BIRT reports). Both components complement each
other in providing an overall solution for developing and creating business intelligence reports.
235
Zend Platform User Guide
BIRT Reports Tab
The BIRT Reports tab is a BIRT report demo page.
Through this tab, users can:
View examples of BIRT reports.
View exampled of the actual code.
Report Examples
The BIRT Reports tab includes four different examples of reports. These reports demonstrate different
types of reports that can be created. To view the generated output of a report click "Render this
code...".
The type of output you will see, depends on the output type defined in the code. The options are PDF
or HTML (For more about creating reports see BIRT API)
Report Code
When selecting a report, the display beneath the report selection section changes to show the actual
code of the selected report. This provides users with a detailed example of the makeup of reports
including the Rendering option that allows users to also view the code's output.
236
Zend Platform
Setting-Up the BIRT Report Engine
The Platform installer includes all the necessary components for rendering BIRT use-cases directly
from Platform Administration. These use cases demonstrate the reporting capabilities in terms output
types and the necessary functions used in order to gather and render the reports.
Assuming the Java Bridge component has already been setup, the BIRT use cases will work out-ofthe-box. The Java Bridge component is needed in order to support the interaction between the PHP
scripts and the BIRT reporting tool written in Java.
If while installing Platform, the option to setup the Java Bridge was not selected, the Setup Tool can
be deployed to setup the Java Bridge.
Using the Setup Tool to Setup the Java Bridge:
Access the Setup Tool, from UNIX, Linux and Mac: platform_dir/bin/setup_tool.sh from i5/OS: GO
ZENDPLAT/ZPMENU from Windows: Start | Programs | Zend Platform | Setup Tool.
Note:
The Java Bridge requires that you have SUN’s JRE 1.4 or later installed on your computer. More
information about JRE’s and the latest updates can be obtained from SUN Microsystems’s website:
http://java.sun.com.
If you are using IBM's Java use version 1.42 or later obtained from:
http://www.ibm.com/developerworks/java/jdk
To enable the interaction between Platform and the BIRT reporting tool, first activate the Java Bridge,
by going to: Integration | Java Bridge and click "Start".
237
Zend Platform User Guide
BIRT Report Examples
The following are the report examples set in the BIRT Reports Tab:
Note:
Please Refer to the sections on APIs and Directives for more details about BIRT integration.
Sales Invoice (html)
Prints an invoice for the selected order, including customer and invoice details and products ordered.
Demonstrates use of a parameter to select the order to invoice and expressions for several calculated
fields, including discount and order total. Uses expression to build customer address string and
illustrates suppression of nulls in database fields with javascript function replace. Also shows image
inclusion and sophisticated use of grids and tables to organize report content. Finally, the report
makes use of styles to simplify maintenance and achieve a consistent look.
<?php
2
// include Zend Birt report design API
3
require_once('Zend/Birt_Report/Zend_Birt_Report_Design.php');
5
// create report design object from rptdesign file
6
$birt = new Zend_Birt_Report_Design(dirname(__FILE__) . '/usecase1.rptdesign');
7
8
// set parameter sample, in this case:
9
// show only order number 10101
10
$birt->setParameter('OrderNumber','10102');
11
12
// "BIRT_TMP_DIR" represent a path to writable directory, while
"birtImage.php?image=" is
13
// a php script that display the image from its original location
14
$birt->setImageConfiguration(BIRT_TMP_DIR, 'birtImage.php?image=');
15
16
// render a report.
17
// BIRT_REPORT_FORMAT_HTML - render an html report
18
echo $birt->renderReport(BIRT_REPORT_FORMAT_HTML, false);
19
?>
238
Zend Platform
Top Selling Products (embedded html)
This report uses a pie chart to show the revenue by product line. The chart lists the top selling
products, sorted by revenue. This example, demonstrates use of a chart and sorting a result set. Also
shows image inclusion and use of grid and tables to organize report content. Finally, the report makes
use of styles to simplify maintenance and achieve a consistent look.
<html>
2
<head>
3
<meta http-equiv="Content-Type" content="text/html; charset=UTF-8" />
4
<title>Zend birt sample</title>
5
</head>
6
<body>
7
<div style="width:600px;margin:0 auto;">
8
<?php
9
// include Zend Birt report design API
10
require_once('Zend/Birt_Report/Zend_Birt_Report_Design.php');
12
// create report design object from rptdesign file
13
$birt = new Zend_Birt_Report_Design(dirname(__FILE__) .
'/usecase2.rptdesign');
14
15
// "$birt_tmp_directory" represent a path to writable directory, while
"birtImage.php?image=" is
16
// a php script that display the image from its original location
17
$birt->setImageConfiguration(BIRT_TMP_DIR, 'birtImage.php?image=');
20
// render html report embedded in html page
21
echo $birt->renderReport(BIRT_REPORT_FORMAT_HTML, true);
22
?>
23
</div>
24
</body>
25
</html>
239
Zend Platform User Guide
Product Catalog (PDF)
This report prints the Classic Models product catalog, grouped by product category. The information is
sorted by, product name, cost and description. This example, demonstrates one level grouping and
using a grid within a table row to structure spacing. Also shows image inclusion and use of the tag in
text item to include the content of a database column. Finally, the report makes use of styles to
simplify maintenance and achieve a consistent look.
<?php
2
// include Zend Birt report design API
3
require_once('Zend/Birt_Report/Zend_Birt_Report_Design.php');
4
5
// create report design object from rptdesign file
6
$birt = new Zend_Birt_Report_Design(dirname(__FILE__) . '/usecase3.rptdesign');
7
8
9
10
// render report to PDF file and save it on a temporary folder
if (!$birt->renderReportToFile(BIRT_REPORT_FORMAT_PDF, true, BIRT_TMP_DIR .
'/temp_report.pdf')) {
11
// display error if renering return false
12
echo $birt->getError();
13
} else {
14
// send pdf file to browser
15
// if function for zend_send_file
16
zend_send_file(BIRT_TMP_DIR . '/temp_report.pdf', 'pdf');
17
}
18
?>
240
Zend Platform
Product Catalog (using caching)
This report prints the Classic Models product catalog, grouped by product category. The information is
displayed by, product name, cost and description. This example, demonstrates one level grouping and
using a grid within a table row to structure spacing. Also shows image inclusion and use of the tag in
text item to include the content of a database column. Finally, the report makes use of styles to
simplify maintenance and achieve a consistent look.
<?php
2
// include Zend Birt report design API
3
require_once('Zend/Birt_Report/Zend_Birt_Report_Design.php');
4
// include Zend Birt report document API
5
require_once('Zend/Birt_Report/Zend_Birt_Report_Document.php');
7
// create report design object from rptdesign file
8
$birt = new Zend_Birt_Report_Design(dirname(__FILE__) . '/usecase4.rptdesign');
10
// caching a report using report document file
11
// savng rptdoc file to a temporary folder
12
$rptdoc_cache_file = BIRT_TMP_DIR . '/temp.rptdoc';
13
if (!file_exists($rptdoc_file)) {
14
15
$birt_doc = $birt->generateReportDocument($rptdoc_cache_file);
} else {
16
$birt_doc = new Zend_Birt_Report_Document($rptdoc_cache_file);
17
}
18
if(!$birt_doc) {
19
die($birt->getError());
20
}
22
// "$birt_tmp_directory" represent a path to writable directory, while
"birtImage.php?image=" is
23
// a PHP script that displays the image from its original location
24
$birt_doc->setImageConfiguration(BIRT_TMP_DIR, 'birtImage.php?image=');
26
// rendering report from cache (rptdoc file) to output
27
$birt_doc->renderReportToOutput(BIRT_REPORT_FORMAT_HTML,false);
28
?>
241
Zend Platform User Guide
Reference
Contents:
Zend Platform Built-In Services and Extensions
APIs
Setup Tool
Directives
Services
Tutorials
Extensions
Appendices
Useful Links
This page includes links to commonly used online reference information. This page can be used as a
bookmarks area for web links. If you have a resource that you would like to see in this area send a
mail to the Zend Documentation Team and the link will be added for the next version.
PHP Manual (English)- http://www.php.net/
Zend Framework - http://framework.zend.com/
Zend Devzone - http://devzone.zend.com/public/view
Zend Forums - http://www.zend.com/forums/
PHP Certification - http://www.zend.com/education/zend_php_certification
PHP Yellow Pages - http://www.zend.com/store/education/certification/yellow-pages.php
Support Center - http://www.zend.com/en/support-center/
Knowledge Base Search - http://www.zend.com/support/knowledgebase.php
242
Zend Platform
Zend Platform Built-In Services and Extensions
Services are the backbone of Platform's production level features. To allow a wider control over the
production level features, in this chapter we will describe the different services used by Platform and
how they can be enabled and disabled.
Note:
Before disabling Services and removing extensions from your php.ini make sure you are aware of the
following dependences:
In Unix, Linux, i5/OS and Mac
A message will be added to the log indicating that an extension with dependences was disabled and
the implications of this action.
In Windows
'Zend Platform Job Queue' 'Zend Platform Pinger' and 'Zend Platform Collector Center' depend on
'Zend Platform MySQL'
'Zend Platform Action' depends on 'Zend Platform Collector Center'
Stopping a service will result in a message that all its dependants’ will be also stopped, for example
stopping ZPMySQL will display that ZPJobQ, ZPPinger, ZPCollector and ZPAction will be stopped.
Warning: Stopping ZPMySQl will disable the Administration User Interface for all operating systems.
Services are part of the installed package and in some situations are already running out of the box.
This is determined according to the chosen installation method. The Platform Installer has two types
of installation methods, Custom and Express. The Custom installation prompts users to decide which
services to run and the Express method only runs three essential components (PHP Extensions:
Optimizer, Download Server, Accelerator, Monitor, Zend Cache and Debugger).
Naturally, services only run according to selected license type. Therefore, Development and Enterprise
Licenses will include the Session Clustering, Job Queues and Java Bridge services. These services will
be applicable either when selected in the Custom installation or available from the Setup Tool, if not
selected in the Custom installation or after installing using the Express method.
Note:
If you are using Platform as a debugger (Remote Debugger) for use with Studio, the recommended
installation method is express. This will provide only the essential services for using the debugger.
243
Zend Platform User Guide
Setup Tool
The Setup Tool provides users with an easy way to activate services and change settings. The Setup
Tool also is a means to configure options that were not setup in the installation process.
Running the Setup Tool
The setup Tool is a separate component and resides outside the Platform user interface.
To run the Setup Tool:
In UNIX, Linux and Mac run /usr/local/Zend/Platform/bin/setup_tool.sh from the shell.
In i5/OS run: GO ZENDPLAT/ZPMENU in the i5/OS command line
In Windows go to the Start menu and select Programs | Zend Platform | Setup Tool (in Windows a
welcome screen will be displayed, choose the option "Modify" to access the configuration options).
The Setup Tool includes the following options:
1. Setup Session Clustering - Setup Session Clustering module.
2. Setup Java Bridge - The Java Bridge access Java based applications running in a Java
4. Setup Job-Queues - The Job Queues server services Job Queues
5. Register a Node - Register a server to belong to the Central server and be part of a cluster.
6. Change Platform Administration Password
Refer to the Installation Guide for more information about the Setup Tool.
244
Zend Platform
Services
The following section provides a complete description of each service along with instructions on how to
run and stop the services.
Java Bridge
Description
Integrates Java libraries and classes within PHP applications.
To Enable
Run the setup tool and select option number, 2 "Setup Java Bridge" and input the
required data.
To Disable
In Unix, Linux and Mac: Execute:
/usr/local/Zend/Platform/bin/javamw.rc stop.
In i5/OS Execute GO ZENDPLAT/ZPMENU option 2 and then option 3.
In Windows: Go to Services (Start | Settings | Control Panel |
Administrative Tools | Services) and stop the service (double-click on the
service name and in the "Startup Type" field select the option "Disabled')
"Zend Platform Java Bridge", you can also run one of these commands in
the command line (Start | Run, enter CMD in the text area and press
enter to open the command line):
net stop ZPJava
or
net stop "Zend Platform Java Bridge"
*Quotes are mandatory.
To completely disable the Java Bridge, remove the directive
zend_extension_manager.java_bridge from the php.ini to prevent loading a
redundant shared object (in UNIX, linux i5/OC and Mac .so in Windows .dll).
Resulting
If stopped, integration with Java libraries and classes within PHP applications will
Outcome
be not be available.
Session Clustering
Description
Session Clustering increases PHP application scalability.
To Enable
Run the setup tool and select option number, 1 "Setup Session Clustering"
To Disable
In Unix, Linux and Mac: Execute: /usr/local/Zend/Platform/bin/scd.sh
stop and the directives zend_extension_manager.mod_cluster and
session.save_handler=cluster from the php.ini to prevent loading a
redundant shared object (in Unix .so in Windows .dll).
In Windows: Go to Services (Start | Settings | Control Panel |
Administrative Tools | Services) and stop the service (double-click on
the service name and in the "Startup Type" field select the option
"Disabled') "Zend Platform Session Clustering", you can also run one of
these commands in the command line (Start | Run, enter CMD in the
text area and press enter to open the command line):
245
Zend Platform User Guide
net stop ZPSC
or
net stop "Zend Platform Session Clustering"
*Quotes are mandatory.
To completely disable Session Clustering, remove the directives
zend_extension_manager.mod_cluster and session.save_handler=cluster from
the php.ini to prevent loading a redundant shared object (in Unix .so in
Windows .dll).
Resulting
If stopped, the ability to make sessions accessible to all cluster members will
Outcome
not be available.
Job Queues
Description
Job Queues reroutes and delays the execution of processes and to improve
response times during interactive Web sessions.
To Enable
Run the setup tool and select option number, 3 "Setup Job Queues".
To Disable
In Unix, Linux and Mac: Execute: /usr/local/Zend/Platform/bin/jqd.sh
stop and remove the directive
zend_extension_manager.jobqueue_client from the php.ini to prevent
loading a redundant SO.
In Windows: Go to Services (Start | Settings | Control Panel |
Administrative Tools | Services) and stop the service (double-click on
the service name and in the "Startup Type" field select the option
"Disabled') "Zend Platform Job Queues", you can also run one of these
commands in the command line (Start | Run, enter CMD in the text
area and press enter to open the command line):
net stop ZPJobQ
or
net stop "Zend Platform Job Queue"
*Quotes are mandatory.
To completely disable Job Queues, remove the directive
zend_extension_manager.jobqueue_client from the php.ini to prevent loading a
redundant shared object (in Unix .so in Windows .dll).
Resulting
If stopped, the ability to reroute and delay execution of jobs will be disabled
Outcome
(jobs that are already running will not be stopped).
Note:
To ensure the Java Bridge, Session Clustering and Job Queue services do not start again next time the
server is booted, erase the following:
1) Open /usr/local/Zend/Platform /etc/rc.d/, and remove these symbolic links:
- S10mysql.sh -> /usr/local/Zend/Platform/MySQL/bin/mysql.sh
- S20jqd.sh -> /usr/local/Zend/Platform/bin/jqd.sh
- S30scd.sh -> /usr/local/Zend/Platform/bin/scd.sh
- S40javamw.rc -> /usr/local/Zend/Platform/bin/javamw.rc
*Not all will appear depending on your configuration preferences.
246
Zend Platform
2) Delete platform_init.sh.
In Windows, open the Service Manager (Start | Settings | Control Panel | Administrative Tools |
Services and set them to Disabled.
When reactivating these services this information will be restored automatically.
Cache Cleaner
Description
Cleans old files from the cache directory and maintains cache size below
the limits. It runs as a stand-alone background program (daemon), it
may be signaled by the user manually, or from the crontab, or from httpd
when the cleanup is needed.
To Enable
Automatically configured during installation
To Disable
In Unix, Linux Mac: Run the command:
#crontab -u $apache_user -e as root and remove the following
line:
"r;*/10 * * * *
/usr/local/Zend/Platform/bin/cache_clean -l
/usr/local/Zend/Platform/etc/zend.ini &>/dev/null"
In i5/OS Execute GO ZENDPLAT/ZPMENU option 2 and then
option 5.
In Windows: Go to Services (Start | Settings | Control Panel |
Administrative Tools | Services) and stop the service (doubleclick on the service name and in the "Startup Type" field select
the option "Disabled') "Zend Platform Cache Cleaner", you can
also run one of these commands in the command line (Start |
Run, enter CMD in the text area and press enter to open the
command line):
net stop ZPCache
or
net stop "Zend Platform Cache Cleaner"
*Quotes are mandatory.
Resulting Outcome
This stand-alone background program cleans the cache directory from old
files and maintains cache size below the limits. Deactivating it should
only be done in the event you choose not to use Platform's caching
abilities.
Collector Center
Description
Collects PHP events for PHP Intelligence.
To Enable
Automatically configured during central installation. In Windows the node
collector service (that is part of the four collector services) is also installed
in the Node installation.
To Disable
In Unix, Linux and Mac: Run the command:
#crontab -u $apache_user -e as root and remove the following
line:
*/2 * * * *
/usr/local/Zend/Platform/bin/collector_center
247
Zend Platform User Guide
/usr/local/Zend/Platform/etc -D
In i5/OS Execute GO ZENDPLAT/ZPMENU option 2 and then
option 2.
In Windows: Go to Services (Start | Settings | Control Panel |
Administrative Tools | Services) and stop the services (doubleclick on the service name and in the "Startup Type" field select
the option "Disabled') "Zend Platform Action", "Zend Platform
Pinger" "Zend Platform Collector Center" "Zend Platform Node
Collector" you can also run one of these commands in the
command line (Start | Run, enter CMD in the text area and press
enter to open the command line):
net stop ZPAction
net stop ZPPinger
net stop ZPCollector
net stop ZPNodeCollector
or
net stop ”r;Zend Platform Action”
net stop ”r;Zend Platform Pinger”
net stop ”r;Zend Platform Collector Center”
net stop ”r;Zend Platform Node Collector”
*Quotes are mandatory.
Resulting
If deactivated, PHP events will not be captured. This should be done in the
Outcome
event you do not wish to utilize PHP Intelligence's monitoring abilities.
248
Zend Platform
Extensions
Platform extensions provide additional functionality. In order to disable an extension, open you php.ini
with a text editor and remove the extension lines (if present) or in Windows go to Services (Start |
Settings | Control Panel | Administrative Tools | Services) and stop the service (double-click on the
service name and in the "Startup Type" field select the option "Disabled'):
zend_extension_manager.optimizer
Description
Controls the Zend Optimizer component.
To Enable
Automatically configured during installation.
To Disable
Remove the line from your php.ini
Resulting
PHP code will not be optimized and files encoded with Guard will not run.
Outcome
Users may notice a decrease in performance after disabling the Optimizer.
zend_extension_manager.download_server (not applicable in Windows)
Description
Controls the Zend download server component.
To Enable
Automatically configured during installation.
To Disable
Remove the line from your php.ini
Resulting
Files defined in the mime_types file will not be serviced by the download
Outcome
server and will start consuming additional bandwidth.
zend_extension_manager.platform
Description
platform.so or platform.dll (in Windows) includes the components;
Accelerator and Zend Cache.
To Enable
Automatically configured during installation.
To Disable
Remove the line from your php.ini
Resulting
Disables Acceleration and Caching.
Outcome
zend_extension_manager.monitor
Description
monitor.so or monitor.dll (in Windows) includes the monitoring
component.
To Enable
Automatically configured during installation.
To Disable
Remove the line from your php.ini
Resulting
Disables Monitoring (PHP Intelligence).
Outcome
249
Zend Platform User Guide
Zend Platform Action (Windows Only)
Description
Checks if there are actions associated with an Event when an Event is
added to the DB and executes them.
To Enable
Automatically configured during installation.
To Disable
Remove the line from your php.ini
Resulting
Actions associated with events will not be executed.
Outcome
Zend Platform Pinger (Windows Only)
Description
This process periodically makes a query to nodes to verify activity and
status (OS, PHP version, etc.)
To Enable
Automatically configured during installation.
To Disable
Remove the line from your php.ini
Resulting
Nodes will not be checked for activity and status and should be manually
Outcome
checked.
Zend Platform Collector Center
Description
Collects and aggregates information from nodes in the cluster that is
displayed in the PHP Intelligence module.
To Enable
Automatically configured during installation.
To Disable
Remove the line from your php.ini
Resulting
Event information will not be collected from Nodes, this is equivalent to
Outcome
disabling the cluster configuration and deactivating PHP intelligence
Zend Platform Node Collector
Description
A daemon process that receives Events from Platform Nodes.
To Enable
Automatically configured during installation.
To Disable
Remove the line from your php.ini
Resulting
Event information will not be collected from nodes, this is equivalent to
Outcome
disabling the cluster configuration and deactivating PHP intelligence.
250
Zend Platform
Deprecated Caching APIs and Directives
Deprecated Functions
The Caching module has been upgraded and therefore the following partial page caching functions will
no longer be available in the next version.
Function
Suggested Replacement*
output_cache_disable()
NA
output_cache_fetch()
NA
output_cache_output()
NA
output_cache_remove_key
zend_[shm|disk]_cache_delete
output_cache_put
zend_[shm|disk]_cache_store
output_cache_get
zend_[shm|disk]_cache_fetch
output_cache_exists
NA
output_cache_stop
NA
* The suggested replacements are not identical to the deprecated functions, please read their
descriptions before implementing them.
Deprecated Directives
The following directive will not be used in the next version:
zend_accelerator.php_api_lifetime
251
Zend Platform User Guide
APIs
Contents:
Accelerator Functions
Output Cache Functions - Deprecated
Zend Cache Functions - New
Full Page Caching Functions
Monitor Functions
ZDS Functions
Java Bridge Functions
Job Queue Functions
BIRT Report Functions
This chapter is a reference chapter for Platform APIs.
252
Zend Platform
Accelerator Functions
accelerator_set_status
void accelerator_set_status(bool status)
Description: Disable/enable the Code Acceleration functionality at run time.
Return Values: none
Parameters: status - if false, Acceleration is disabled, if true - enabled
Output Cache Functions
Note:
These functions are deprecated
output_cache_disable()
Description: Disables output caching for currently running scripts.
Return Values: none
Parameters: none
output_cache_fetch()
string output_cache_fetch(string key, string function, int lifetime)
Description: Gets the code’s return value from the cache if it is there, if not - run function
and cache the value.
Return Values: function's return
Parameters: key - cache key, function - PHP expression, lifetime - data lifetime in cache
(seconds)
output_cache_output()
string output_cache_output(string key, string function, int lifetime)
Description: If the cache for the key exists, output it, otherwise capture expression output,
cache and pass it out.
Return Values: expression output
Parameters: key - cache key, function - PHP expression, lifetime - data lifetime in cache
(seconds)
output_cache_remove_key
bool output_cache_remove_key(string key)
Description: Remove item from PHP API cache by key
Return Values: true if OK
Parameters: key - cache key as given to output_cache_get/output_cache_put
output_cache_put
bool output_cache_put(string key, mixed data)
Description: Puts data in cache according to the assigned key.
253
Zend Platform User Guide
Return Values: true if OK
Parameters: key - cache key, data - cached data (must not contain objects or resources)
output_cache_get
mixed output_cache_get(string key, int lifetime)
Description: Gets cached data according to the assigned key.
Return Values: cached data if cache exists, false otherwise
Parameters: key - cache key, lifetime - cache validity time (seconds)
output_cache_exists
bool output_cache_exists(string key, int lifetime)
Description: If data for assigned key exists, this function outputs it and returns a value of
true. If not, it starts capturing the output. To be used in pair with output_cache_stop.
Return Values: true if cached data exists
Parameters: key - cache key, lifetime - cache data validity time (seconds)
output_cache_stop
Description: If output was captured by output_cache_exists, this function stops the output
capture and stores the data under the key that was given to output_cache_exists().
Zend Cache Functions
zend_[shm|disk]_cache_store
boolean zend_shm_cache_store(string [namespace::]key, mixed var [, int ttl])
boolean zend_disk_cache_store(string [namespace::]key, mixed var [, int ttl])
Description: store var identified by key into the cache. If a namespace is provided, the key
is stored under that namespace. (Identical keys can exist under different namespaces)
Return Value: FALSE when stored failed, TRUE otherwise
Parameters:
key - the data's key. Possibly prefixed with namespace
var - can be any PHP object that can be serialized.
ttl - time to live in seconds. ZendCache keeps the objects in the cache as long as the TTL is
no expired, once expired it will be removed from the cache
zend_[shm|disk]_cache_fetch
mixed zend_shm_cache_fetch(string [namespace::]key)
mixed zend_disk_cache_fetch(string [namespace::]key)
Description: fetch data from the cache. The key can be prefixed with a namespace to
indicate searching within this namespace only. If no namespace is provided, ZendCache
searches for the key in the global namespace
Return Value: NULL when no data matching the key is found, else it returns the stored data
Parameters:
key - the data's key. Possibly prefixed with namespace
254
Zend Platform
zend_[shm|disk]_cache_delete
boolean zend_disk_cache_delete( string [namespace::]key )
boolean zend_shm_cache_delete( string [namespace::]key )
Description: find and delete an entry from the cache, using a key to identify it. The key can
be prefixed with a namespace to indicate deleting a key from within that namespace only. If
no namespace is provided, ZendCache searches for the key in the global namespace
Return Value: TRUE on success, FALSE otherwise
Parameters:
key - the data's key. Possibly prefixed with namespace
zend_[shm|disk]_cache_clear
bool zend_disk_cache_clear([string namespace])
bool zend_shm_cache_clear([string namespace])
Description: delete all entries from the cache, from all namespace. If 'namespace' is
provided, delete all entries from that namespace only
Return Value: TRUE on success, FALSE otherwise
Parameters:
namespace - [optional] namespace to delete
Full Page Caching Functions
output_cache_disable_compression()
Description: Does not allow the cache to perform compression on the output of the current
page. This output will not be compressed, even if the global settings would normally allow
compression on files of this type.
Return Values: none
Parameters: none
output_cache_remove
bool output_cache_remove(string filename)
Description: Removes all the cache data for the given filename.
Return Values: true if OK, false if something went wrong
Parameters: filename - full script path on local file system
output_cache_remove_url
bool output_cache_remove_url(string url)
Description: Remove cache data for the script with given URL (all dependent data is
removed)
Return Values: true if OK
Parameters: URL - the relative path for the script
255
Zend Platform User Guide
Monitor Functions
monitor_pass_error
void monitor_pass_error(integer $errno, string $errstr, string $errfile, integer $errline)
Description: Should be called from a custom error handler to pass the error to the monitor.
The user function needs to accept two parameters: the error code, and a string describing
the error. Then there are two optional parameters that may be supplied: the filename in
which the error occurred and the line number in which the error occurred.
monitor_set_aggregation_hint
void monitor_set_aggregation_hint(string $hint)
Description: Limited in the database to 255 chars, this API is a global variable that can be
set anywhere and in any hierarchy. The purpose of this API is to incorporate locations of
occurrences in the script. This API is used when there are events that require the location in
the script for diagnosing the reason behind the event occurring. For example: Global Events
require the application that generated the event. Adding the Hint API can assist in the
identification process. This string that is supplied by the user to differentiate between pages
that have the same URL but different parameters.
Return Values: If the user did not supply a hint the default hint is an empty string.
Parameters: $hint
monitor_custom_event
void monitor_custom_event(string $class, string $text[, integer $severe, mixed $user_data])
Description: Custom Events are used to generate an event whenever the API function
monitor_custom_event() is called from the PHP script. This event type enables the
generation of an event on occurrences that are not necessarily built-in Platform events (error
and performance issues). Custom Events are used whenever you decide that it is significant
to generate an event in a certain situation. Each event type is given a name for easy
identification ($type).
Parameters:
$class - helps to define several types of custom events. This description will be showed in
the PHP Intelligence, Event List and in the Event Details (report).
$text - error text used to describe the reason for the event. This text will appear in the
Event Details.
$severe - the severity level of the triggered event, default value is Severe.
$user_data - adds a PHP variable that will be viewed in the Event Details screen (in Event
Context-> Variables->User Defined). This forms the stored Event Context (similar to the
information obtained in a PHP error event).
256
Zend Platform
monitor_httperror_event
void monitor_httperror_event(integer $error_code, string $url [, bool $severe])
Description: Create an HTTPERROR event
Parameters:
$error_code - the http error code to be associated with this event
$url - the URL to be associated with this event
$severe - the severity of the event: 0 - not severe, 1 - severe
[edit]monitor_license_info
void monitor_license_info()
Description: Returns an array containing information about:
1.
Module loading status (and cause of error if module failed to load)
2.
Module license status (and cause of error if license not valid)
register_event_handler
boolean register_event_handler($event_handler_func
[,$handler_register_name],$event_type_mask])
Description: Allow you to register a user function as an event handler. When a monitor
event is triggered all the user event handler are called and the return value from the handler
is saved in an array keyed by the name the event handler was registered under. The event
handlers results array is saved in the event_extra_data table.
Return Value: TRUE on success and FALSE if an error occurs.
Parameters: The first argument is a callback function that will be call when the event is
triggered, object methods may also be invoked statically using this function by passing array
($objectname, $methodname) to the function parameter. The second (optional) argument is
name this function is registered under - if none is supplied, the function will be registered
under it's own name. The third (optional) parameter is a mask of event types that the
handler should be called on by default it's set to MONITOR_EVENT_ALL.
unregister_event_handler
boolean unregister_event_handler(string handler_name)
Description: Allow you to un-register an event handler.
Return Value: TRUE on success and FALSE if no handler we registered under the given
name.
Parameters: string handler_name - the name you registered with the handler you now wish
to un-register.
257
Zend Platform User Guide
ZDS Functions
zend_send_file
bool zend_send_file(string filename[, string mime_type])
Description: Send a file using ZDS
Return Value: Returns FALSE if sending the file failed (does not return otherwise).
Parameters:
filename - path to the file.
mime_type - MIME type of the file, if omitted, it will be taken from the configured MIME
types file.
custom_headers - user defined headers that will be sent instead of regular ZDS headers. A
few essential headers will be sent anyway.
zend-send_buffer
bool zend_send_file(string buffer[, string mime_type][, string custom_headers])
Description: Send a file using ZDS
Return Value: Returns FALSE if sending the file failed (does not return otherwise).
Parameters:
buffer - the content that will be sent.
mime_type - MIME type of the file, if omitted, it will be taken from the configured MIME
types file.
custom_headers - user defined headers that will be sent instead of regular ZDS headers. A
few essential headers will be sent anyway.
Note:
The ZDS is not currently supported in Windows.
258
Zend Platform
Java Bridge Functions
java_last_exception_get
object java_last_exception_get()
Description: Returns a Java exception object for the last exception
Return Value: Java Exception object, if there was an exception, false otherwise
java_last_exception_clear
void java_last_exception_clear()
Description: Clear last Java exception object record.
java_set_ignore_case
void java_set_ignore_case(bool ignore)
Description: Set case sensitivity for Java calls.
Parameters:
ignore - if set, Java attribute and method names would be resolved disregarding case.
NOTE: this does not make any Java functions case insensitive, just things like $foo->bar and
$foo->bar() would match Bar too.
java_set_encoding
array java_set_encoding(string encoding)
Description: Set encoding for strings received by Java from PHP. Default is UTF-8.
java_throw_exceptions
void java_throw_exceptions(int throw)
Description: Control if exceptions are thrown on Java exception. Only for PHP5.
Parameters:
throw - If true, PHP exception is thrown when Java exception happens. If set to false, use
java_last_exception_get() to check for exception.
java_require
void java_require(string path)
Description: include an additional classpath/JAR in the context of a PHP script
Parameters:
URL pointing to the location of the Jar file. The function accepts the following protocols:
https://, http:// file://, ftp:// and it can also be a local path e.g. c:\.
259
Zend Platform User Guide
Job Queue Functions
A Queue of Job is described using the JobQueue class, when you want to manage a queue (or add
more than one job to it) you should instantiate a JobQueue object.
The JobQueue object enables several job control functions such as: add/remove/suspend/resume, and
some manage/info queue functions like: getJobsInQueue, getHistory, getStatistics etc.
A job is described by a Job class, whenever you want to add/update a job you can handle the Job
object using the Job methods.
After a job is in the queue, you can retrieve it to change remove or suspend the Job by using the job
id (the job id is assigned when a Job is added to the queue or by querying the jobs in the queue)
To add one job to a queue, for simplicity of usage, you can create the Job object (with it's required
attributes) and then add the job directly from the Job object (without instantiating the JobQueue
object), using the Job::addJob() function.
To change a Job's attributes, first get it from the queue (JobQueue::getJob() function), change the
attributes and then update the queue with the changed Job object (JobQueue::updateJob() functions).
Global Functions and Constants
Constants for Job statuses
define('JOB_QUEUE_STATUS_SUCCESS', 1);
Job was processed and succeeded
define('JOB_QUEUE_STATUS_WAITING', 2);
Job is waiting to be processed (was
not scheduled)
define('JOB_QUEUE_STATUS_SUSPENDED', 3);
Job was suspended
define('JOB_QUEUE_STATUS_SCHEDULED', 4);
Job is scheduled and waiting in queue
define('JOB_QUEUE_STATUS_WAITING_PREDECESSOR',
Job is waiting for it's predecessor to
5);
be completed
define('JOB_QUEUE_STATUS_IN_PROCESS', 6);
Job is in process in Queue
define('JOB_QUEUE_STATUS_EXECUTION_FAILED', 7);
Job execution failed in the
ZendEnabler
define('JOB_QUEUE_STATUS_LOGICALLY_FAILED', 8);
Job was processed and failed logically
either because of job_fail command or
script parse or fatal error
Constants for different priorities of jobs
define('JOB_QUEUE_PRIORITY_LOW', 0);
define('JOB_QUEUE_PRIORITY_NORMAL', 1);
define('JOB_QUEUE_PRIORITY_HIGH', 2);
define('JOB_QUEUE_PRIORITY_URGENT', 3);
Constants for saving global variable's bit mask
define('JOB_QUEUE_SAVE_POST', 1);
define('JOB_QUEUE_SAVE_GET', 2);
define('JOB_QUEUE_SAVE_COOKIE', 4);
define('JOB_QUEUE_SAVE_SESSION', 8);
define('JOB_QUEUE_SAVE_RAW_POST', 16);
define('JOB_QUEUE_SAVE_SERVER', 32);
define('JOB_QUEUE_SAVE_FILES', 64);
260
Zend Platform
define('JOB_QUEUE_SAVE_ENV', 128);
set_job_failed
set_job_failed( $error_string );
Description: Causes a job to fail logically. It can be used to indicate an error in the script
logic (e.g. database connection problem).
Parameters: @param string $error_string the error string to display
jobqueue_license_info
jobqueue_license_info();
Description: returns an array containing following fields:
"license_ok" - whether license allows use of JobQueue
"expires" - license expiration date
Queue Class
class ZendAPI_Queue {
var $_jobqueue_url;
Queue Class Functions
zendapi_queue($queue_url) {}
Constructor for a job queue connection
@param string $jobqueue_url - Full address where the queue is, in the form host:port
@return zendapi_queue - object
login($password, $application_id=null) {}
Opens a connection to a job queue
@param string $password - for authentication, password must be specified to connect to a
queue
@param int $application_id - optional, if set, all subsequent calls to job related methods will
use this application id (unless explicitly specified otherwise). I.e. When adding new job,
unless this job already set an application id, the job will be assigned the queue application id
@return bool - success
addJob(&$job) {}
Insert a new job to the queue, the Job is passed by reference because its new job ID and status will
be set in the Job object
@param Job $job - the Job we want to insert to the queue (by ref.)
@return int - the inserted job id
getJob($job_id) {}
Returns a Job object describing a job in the queue
@param int $job_id - the job id
@return Job Object - describing a job in the queue
updateJob(&$job) {}
Updates an existing job in the queue with it's new properties. If job doesn't exist, a new job will be
added. Job is passed by reference and it's updated from the queue.
261
Zend Platform User Guide
@param Job $job - the Job object, the ID of the given job is the id of the job we try to
update. If the given Job doesn't have an assigned ID, a new job will be added
@return int - the id of the updated job
suspendJob($job_id) {}
Removes a job from the queue
@param int|array $job_id - the job id or array of job ids we want to remove from the queue
function removeJob($job_id) {} - suspend a job in the queue (without removing it)
@param int|array $job_id - the job id or array of job ids we want to suspend
@return bool - success/failure
resumeJob($job_id) {}
Resume a suspended job in the queue
@param int|array $job_id - the job id or array of job ids we want to resume
@return bool - success/failure (if the job wasn't suspended, the function will return false)
requeueJob($job) {}
Re-queue failed job back to the queue.
@param job $job - job object to re-queue
@return bool - true or false.
getStatistics() {}
returns job statistics
@return array with the following:
•
"total_complete_jobs"
•
"total_incomplete_jobs"
•
"average_time_in_queue" [msec]
•
"average_waiting_time"
•
"added_jobs_in_window"
•
"activated_jobs_in_window"
•
"completed_jobs_in_window"
[sec]
moving window size can be set through the ini file
isScriptExists($path) {}
Returns whether a script exists in the document root
@param string $path - relative script path
@return bool - TRUE if script exists in the document root FALSE otherwise
isSuspend() {}
Returns whether the queue is suspended
@return bool - TRUE if job is suspended FALSE otherwise
getJobsInQueue($filter_options=null, $max_jobs=-1, $with_globals_and_output=false) {}
Returns a list of jobs in the queue according to the options given in the filter_options parameter,
doesn't return jobs in "final states" (failed, complete). If the application id is set for this queue, only
jobs with this application id will be returned.
262
Zend Platform
@param array $filter_options - array of optional filter options to filter the jobs we want to get
from the queue. If not set, all jobs will be returned. Options can be: priority, application_id,
name, status, recurring.
@param int max_jobs - maximum jobs to retrieve. Default is -1, getting all jobs available.
@param bool with_globals_and_output - whether to get the global variables data and job
output. Default is false.
@return array - Jobs that satisfies filter_options.
getNumOfJobsInQueue($filter_options=null) {}
Returns a list of jobs in the queue according to the options given in the filter_options parameter
If application id is set for this queue, only jobs with this application id will be returned
@param array $filter_options - array of optional filter options to filter the jobs we want to get
from the queue. If not set, all jobs will be returned. Options can be: priority, application_id,
host, name, status, recurring.
@return int - number of jobs that satisfies filter_options.
getAllhosts() {}
Return all the hosts that jobs were submitted from @return array.
getAllApplicationIDs() {}
Return all the application ids exists in queue @return array.
getHistoricJobs($status, $start_time, $end_time, $index, $count, &$total) {}
Return finished jobs (either failed or successes) between time range allowing paging.
Jobs are sorted by job id descending.
@param int $status - filter to jobs by status, 1-success, 0-failed either logical or execution.
@param UNIX timestamp $start_time - get only jobs finished after $start_time.
@param UNIX timestamp $end_time - get only jobs finished before $end_time.
@param int $index - get jobs starting from the $index-th place.
@param int $count - get only $count jobs.
@param int $total - pass by reference. Return the total number of jobs satisfied the query
criteria.
@return array of jobs.
suspendQueue() {}
Suspends queue operation
@return bool - TRUE if successful FALSE otherwise
resumeQueue() {}
Resumes queue operation
@return bool - TRUE if successful FALSE otherwise.
getLastError() {}
Returns a description of the last error that occurred in the queue object. After every method invoked
an error string describing the error is stored in the queue object.
@return string.
setMaxHistoryTime() {}
263
Zend Platform User Guide
Sets a new maximum time for keeping historic jobs.
@return bool - TRUE if successful FALSE otherwise
Job Class
This class describes a job in a queue
In order to add/modify a job in the queue, a Job class must be created, retrieved and than saved in a
queue or, a job can be added directly to a queue without creating an instant of a Queue object.
class ZendAPI_Job {
var $_id;
Description: Unique id of the Job in the job queue.
@var int
var $_script;
Description: Full path of the script that this job calls when it's processed.
@var string
var $_host;
Description: The host from where the job was submitted.
@var string
var $_name;
Description: A short string describing the job.
@var string
var $_output;
Description: The job output after executing.
@var string
var $_status = JOB_QUEUE_STATUS_WAITING;
Description: The status of the job, by default, the job status is waiting to being executed.
The status is determined by the queue and can not be modified by the user.
@var int
var $_application_id = null;
Description: The application id of the job. If the application id is not set, this job may get an
application id automatically from the queue (if the queue was assigned one). By default it is
null (which indicates no application id is assigned).
@var string
var $_priority = JOB_QUEUE_PRIORITY_NORMAL;
Description: The priority of the job, options are the priority constants. By default the
priority is set to normal (JOB_QUEUE_PRIORITY_NORMAL).
@var int
var $_user_variables = array();
264
Zend Platform
Description: An array holding all the variables that the user wants the job's script to have
when it's called.
The structure is variable_name => variable_value i.e. if the user_variables array is
array('my_var' => 8), when the script is called, a global variable called $my_var will have
the int value of 8. By default, there are no variables that we want to add to the job's script.
@var array
var $_global_variables = 0;
Description: A bit mask holding the global variables that the user wants the job's script to
have when it's called.
Options are prefixed with "JOB_QUEUE_SAVE_" and may be:
POST|GET|COOKIE|SESSION|RAW_POST|SERVER|FILES|ENV. By default there are no global
variables we want to add to the job's script i.e. In order to save the current GET and COOKIE
global variables, this property should be JOB_QUEUE_SAVE_GET|JOB_QUEUE_SAVE_COOKIE
(or the integer 6). In that case (of GET and COOKIE), when the job is added, the current
$_GET and $_COOKIE variables should be saved, and when the job's script is called, these
global variables should be populated.
@var int
var $_predecessor = null;
Description: The job may have a dependency (another job that must be performed before
this job). This property holds the id of the job that must be performed. If this variable is an
array of integers, it means there are several jobs that must be performed before this job. By
default there are no dependencies.
@var mixed (int|array)
var $_scheduled_time = 0;
Description: The time that this job should be performed, this variables is the UNIX
timestamp. If set to 0, it means that the job should be performed now (or at least as soon as
possible). By default there is no scheduled time, which means we want to perform the job as
soon as possible.
@var int
var $_interval = 0;
Description: The job running frequency in seconds. The job should run every _internal
seconds. This property only applies to recurrent jobs. By default, its value is 0 e.g. run it only
once.
@var int
var $_end_time = null;
Description: A UNIX timestamp of the last time this job should occur. If _interval was set,
and _end_time was not, then this job will run forever. By default there is no end_time, so
recurrent jobs run forever. If the job is not recurrent (Occurs only once) then the job will run
at most once. If the end_time has reached and the job was not yet executed, it will not run.
@var int
265
Zend Platform User Guide
var $_preserved = 0;
Description: A bit that determines if the job can be deleted from history. When set,
removeJob will not delete the job from history.
@var int
function ZendAPI_Job($script) {}
Description: Instantiates a Job object, describing all the information and properties of a job.
@param script $script relative path (relative to document root supplied in the ini file) of the
script this job should call when it's executing.
@return Job
function addJobToQueue($jobqueue_url, $password) {}
Description: Adds the job to the specified queue (without instantiating a JobQueue object).
This function should be used only when adding a single job, to insert more than one job
and/or manipulate other jobs (or job tasks) create and use the Job Queue object. This
function creates a new Job Queue and logs in to it (with the given parameters), adds this job
and logs out
@param string $jobqueue_url - the full address of the queue we want to connect to.
@param string $password - for authenticating, the queue password.
@return int - the added job id or false on failure.
function setJobPriority($priority) {}
Description: Set a new priority to the job.
@param int $priority, priority options are constants with the "JOB_QUEUE_PRIORITY_" prefix
All properties SET functions
function setJobName($name) {}
function setScript($script) {}
function setApplicationID($app_id) {}
function setUserVariables($vars) {}
function setGlobalVariables($vars) {}
function setJobDependency($job_id) {}
function setScheduledTime($timestamp) {}
function setRecurrenceData($interval, $end_time=null) {}
function setPreserved($preserved)
function getProperties() {}
Description: Get the job properties.
@return array The same format of job options array as in the Job constructor.
function getOutput() {}
266
Description: Get the job output.
@return An HTML representing the job output.
Zend Platform
All properties GET functions
function getID() {}
function getHost() {}
function getScript() {}
function getJobPriority() {}
function getJobName() {}
function getApplicationID() {}
function getUserVariables() {}
function getGlobalVariables() {}
function getJobDependency() {}
function getScheduledTime() {}
function getInterval() {}
function getEndTime() {}
function getPreserved() {}
function getJobStatus() {}
Description: Get the job’s current status. If the job was created and not returned from a
queue (using the JobQueue::GetJob() function), the function will return false. The status is
one of the constants with the "JOB_QUEUE_STATUS_" prefix.E.g. the job was performed and
failed, job is waiting etc.
@return int
function getTimeToNextRepeat() {}
Description: Get how many seconds until the next time the job will run. If the job is not
recurrence or it past its end time, then return false@return int
function getLastPerformedStatus() {}
Description: For recurring jobs get the status of the last execution. For simple jobs,
getLastPerformedStatus is equivalent to getJobStatus. Jobs that haven't been executed will
return STATUS_WAITING.
@return int
267
Zend Platform User Guide
BIRT Report Functions
Zend has created a PHP API in PHP that uses the Java Bridge to communicate with BIRT classes and
generate reports.
In order to begin benefiting from the advanced reporting capabilities, the BIRT APIs have to be
incorporated into the PHP application’s code.
The Use Cases in Platform Administration provide a demonstration of how the APIs work and how to
insert them in the code. These Use Cases are viewed from Integration | BIRT Reports. In the same
page is a download option "Download BIRT API and Samples" this option is used to download the BIRT
APIs.
To incorporate Zend BIRT APIs in PHP Applications:
1.
Download the BIRT API by clicking: "Download BIRT API and Samples"
2.
Extract the files into your PHP application’s directory
3.
Include these files to the project.
Once the files are incorporated into your PHP application’s project the different APIs can be inserted
into your code to generate various reports.
The following is a detailed description of the BIRT API:
The Zend_Birt Class is a base class for Zend_Birt_Report_Document and Zend_Birt_Report_Design.
Zend_Birt_Report_Design is used for creating reports from a design file
Zend_Birt_Report_Report is used for creating reports from report document.
The Zend_Birt_Report_Design class, sets a design file in its constructor that can run to create a report
document from a design file. The report's output can be rendered as a document in PDF or HTML
format. Or the report document can be saved in a file and used later by the Zend_Birt_Report_Report
object. The class also has runAndRenderReportToStream/runAndRenderReportToFile functions that will
run and render a report in one step. The 'running report" functions get a parameter array that
contains key=>value parameter.
The createReport function knows to run a design report and return the Zend_Birt_Report_Report
object that is set with the created report document.
The Zend_Birt_Report_Document class sets a report document in its constructor and renders a report
from the report document in HTML or PDF format.
This class inherits from Zend_Birt and handles the BIRT Report object created from a report
document. It also gets an array of bookmarks, TOCs, report information, and an html page of
bookmarks and the html page count.
Note:
If you are using the function setHyperlinkConfiguration($formatString) to create a report that
automatically generates hyperlinks, make sure to add a parameter otherwise the function will return a
fatal error.
There are three basic actions that should be done in order to create BIRT Reports:
268
1.
Instantiate the report design that contains the information and display type.
2.
Define the parameters.
3.
Render the report.
Zend Platform
Directives
Contents:
Accelerator Directives
Zend Cache Directives
Full Page Caching Directives
Monitor Directives
Platform Administration Directives
Collector Center Directives
Debugger Directives
ZDS Directives
Java Bridge Directives
Session Clustering Directives
Job Queue Directives
This chapter is a reference chapter for Platform directives.
269
Zend Platform User Guide
Accelerator Directives
Directive
Mode
Reload
zend_accelerator.max_wasted_percentage
ZEND_INI_SYSTEM
Yes
Description
Max
percentage of
"wasted"
memory until
restart is
scheduled
zend_accelerator.max_warmup_hits
ZEND_INI_SYSTEM
Yes
How many hits
are considered
'warmup' (for
statistics)
zend_accelerator.consistency_checks
ZEND_INI_ALL
Yes
Check cache's
checksum each
N requests
zend_accelerator.force_restart_timeout
ZEND_INI_SYSTEM
Yes
Time to wait
for cache being
unused when
restart is
scheduled
(seconds)
zend_accelerator.perform_timings
ZEND_INI_ALL
Yes
Collect
performance
statistics
zend_accelerator.validate_timestamps
ZEND_INI_ALL
Yes
Check file
timestamps
zend_accelerator.revalidate_freq
ZEND_INI_ALL
Yes
How often to
check file
timestamps on
Windows
(seconds)
zend_accelerator.user_blacklist_filename
ZEND_INI_SYSTEM
Yes*
Path for a file
that contains a
list of files not
to accelerate
zend_accelerator.compress_all
ZEND_INI_PERDIR
No
Enable
compression
for accelerated
files
zend_accelerator.enabled
ZEND_INI_SYSTEM
No
Enable
acceleration
zend_accelerator.max_accelerated_files
ZEND_INI_SYSTEM
No
Maximum
number of
keys (scripts)
270
Zend Platform
Directive
Mode
Reload
Description
in accelerator
hash table
zend_accelerator.mmap_base_file
ZEND_INI_SYSTEM
No
Windows:
location of
mmap address
file
zend_accelerator.httpd_uid
ZEND_INI_SYSTEM
No
UID of httpd
process
zend_accelerator.memory_consumption
ZEND_INI_SYSTEM
No
Accelerator
shared
memory block
size (Mbytes)
zend_accelerator.allow_noshm
ZEND_INI_SYSTEM
No
Allow running
in "no shared
memory mode"
(cgi, cli)
zend_accelerator.use_cwd
ZEND_INI_SYSTEM
No
Use current
directory as a
part of script
key
zend_accelerator.preferred_memory_model
ZEND_INI_SYSTEM
No
Shared
memory model
to use
zend_accelerator.dups_fix
ZEND_INI_ALL
Yes
Use hack to
prevent
"duplicate
definition"
errors
zend_accelerator.cgi_base_shm_address
ZEND_INI_SYSTEM
No
The base
address for the
CGI/CLI shared
memory block
271
Zend Platform User Guide
Zend Cache Directives
Directive
Mode
Description
zend_cache.disk.dir_levels
PHP_INI_SYSTEM
Disk cache API only. Sets the
directory depth for storing the
keys. (e.g. by setting dir_level to 2
and storing 'KEY', the new partial
caching will place the 'KEY' under 2
directories below the save path
(see below)). Possible values are
0,1 or 2.
zend_cache.disk.save_path
PHP_INI_SYSTEM
Disk cache API only. sets the path
for the disk caching.
zend_cache.shm.memory_cache_size
PHP_INI_SYSTEM
Shared memory cache API only.
Sets the memory size to be used
by the cache.
zend_cache.shm.max_segment_size
PHP_INI_SYSTEM
Shared memory cache API only.
Defines the Shared Memory's
segment size.
Defining the segment size to the
same size as the cache size will
create one segment. If you set the
segment size to a smaller value the
cache will be segmented. For
example: cache size = 4 and
segment size = 1, creates 4
segments in the cache.
zend_cache.enabled
PHP_INI_SYSTEM
Enables partial caching. To disable
set to 0 and all API functions will
return false, or NULL.
272
Zend Platform
Full Page Caching Directives
Directive
Mode
Reload
Description
zend_accelerator.max_cached_filesize
ZEND_INI_ALL
Yes
Max cached
size for
content cache
(Kbytes)
zend_accelerator.min_free_disk
ZEND_INI_ALL
Yes
Minimum disk
space to leave
free for
content cache
(in M or %) if
not stated
otherwise it
will hold the
default value
10%
zend_accelerator.php_extensions
ZEND_INI_SYSTEM
No*
List of
extensions to
consider for
content cache
when directory
is configured
zend_accelerator.compress_blacklist_filename
ZEND_INI_SYSTEM
Yes*
Path for a file
that contains a
list of files not
to compress
zend_accelerator.compression
ZEND_INI_PERDIR
No
Enable
compression
for content
cached files
zend_accelerator.output_cache_enabled
ZEND_INI_SYSTEM
No
Enable content
caching
zend_accelerator.output_cache_config
ZEND_INI_SYSTEM
No
Content Cache
configuration
format|Content
cache
configuration
file]
zend_accelerator.output_cache_dir
ZEND_INI_SYSTEM
No
Content cache
storage
directory
zend_accelerator.max_cache_size
Maximal
amount of
diskspace to
273
Zend Platform User Guide
Directive
Mode
Reload
Description
be occupied by
Content Cache
zend_accelerator.php_api_lifetime *
ZEND_INI_SYSTEM
No
Determines the
cache's max
lifetime
overriding the
partial cached
object's
lifetime.
Default values
are: 60*60*24
=24hours.
This value is
the maximum
lifetime of the
cached object.
Using the
cache API
allows to set
values BELOW
that value, but
not above.
(*) Deprecated
274
Zend Platform
Monitor Directives
Directive
Mode
Reload
Description
Default
Value
"zend_monitor.max_var_len"
ZEND_INI_ALL
Yes
Maximum variable
length for
collected data in
POST/SERVERS.
Limit applies to
each single value.
"zend_monitor.warmup_requests"
ZEND_INI_ALL
Yes
Number of
requests until
monitor would
use averaging
statistics to
produce events
"zend_monitor.load_sample_freq"
ZEND_INI_SYSTEM
Yes
Frequency of
checking for load
events (seconds)
"zend_monitor.rotate_freq"
ZEND_INI_SYSTEM
Yes
Frequency for
rotating monitor
internal logfiles
(seconds)
"zend_monitor.reconnect_timeout"
ZEND_INI_SYSTEM
Yes
How long monitor
will wait until
trying to restore
broken connection
to central
(seconds)
"zend_monitor.watch_functions"
ZEND_INI_SYSTEM
Yes*
List of functions
to watch for time
events (@file
reads list from
file)
"zend_monitor.watch_results"
ZEND_INI_SYSTEM
Yes*
List of functions
to watch for
failure return
events (@file
reads list from
file)
"zend_monitor.collector_host"
ZEND_INI_SYSTEM
No
Hostname for
central
"zend_monitor.collector_port"
ZEND_INI_SYSTEM
No
Port for central
"zend_monitor.log_dir"
ZEND_INI_SYSTEM
No
Directory where
275
Zend Platform User Guide
Directive
Mode
Reload
Description
Default
Value
monitor logs will
be kept
zend_monitor.server_key_dir
ZEND_INI_SYSTEM
No
Path to the
directory for the
RC4 key files:
Node: The server.
key file
Collector Center:
List of files (for
each node in the
cluster), which
contains the RC4
key. The file
names are the
MD5
representation of
the contained
key.
"zend_monitor.server_key"
ZEND_INI_SYSTEM
No
Filename for Node
RC4 key
"zend_monitor.enable"
ZEND_INI_ALL
Yes
Monitoring is
enabled
"zend_monitor.error_level"
ZEND_INI_ALL
Yes
Errors reported as
events
"zend_monitor.error_level.severe"
ZEND_INI_ALL
Yes
Errors reported as
severe events
"zend_monitor.silence_level"
ZEND_INI_ALL
Yes
Three options:
0 - always Report
Errors - Ignore
the errorreporting setting
and the silence
operator and
report all PHP
errors.
1 - report errors
that match the
error-reporting
criteria - Ignore
all PHP errors
silenced using
either the errorreporting setting
or the silence
276
Zend Platform
Directive
Mode
Reload
Description
Default
Value
operator.
2 - report any
errors not
silenced with the
operator @ Ignore the errorreporting setting
and only ignore
errors silenced
with the silence
operator. "
zend_monitor.error_reporting
ZEND_INI_SYSTEM
No
Bitmask for
events to be
reported.
"zend_monitor.max_script_runtime_
ZEND_INI_ALL
Yes
load_cutoff"
Load value which
would suppress
time-related
events
"zend_monitor.report_variables_data"
ZEND_INI_ALL
Yes
which variables to
report (*)
"zend_monitor.max_script_runtime"
ZEND_INI_ALL
Yes
Script runtime
above which
event is produced
(ms)
"zend_monitor.max_function_runtime"
ZEND_INI_ALL
Yes
Function runtime
above which
event is produced
(ms)
"zend_monitor.max_memory_usage"
ZEND_INI_ALL
Yes
Memory usage
above which
event is produced
(K)
"zend_monitor.max_load"
ZEND_INI_ALL
Yes
Load above which
event is produced
"zend_monitor.max_script_runtime.
ZEND_INI_ALL
Yes
severe"
Script runtime
above which
severe event is
produced (ms)
"zend_monitor.max_function_runtime.
ZEND_INI_ALL
Yes
severe"
Function runtime
above which
severe event is
produced (ms)
"zend_monitor.max_memory_usage.
severe"
ZEND_INI_ALL
Yes
Memory usage
above which
277
Zend Platform User Guide
Directive
Mode
Reload
Description
Default
Value
severe event is
produced (K)
"zend_monitor.max_load.severe"
ZEND_INI_ALL
Yes
Load above which
severe event is
produced
"zend_monitor.max_time_dev"
ZEND_INI_ALL
Yes
Deviation from
average script
runtime above
which event is
produced (%)
"zend_monitor.max_output_dev"
ZEND_INI_ALL
Yes
Deviation from
average output
size above which
event is produced
(%)
"zend_monitor.max_mem_dev"
ZEND_INI_ALL
Yes
Deviation from
average memory
usage above
which event is
produced (%)
"zend_monitor.max_time_dev.severe"
ZEND_INI_ALL
Yes
Deviation from
average script
time above which
severe event is
produced (%)
"zend_monitor.max_output_dev.severe"
ZEND_INI_ALL
Yes
Deviation from
average output
size above which
severe event is
produced (%)
"zend_monitor.max_mem_dev.severe"
ZEND_INI_ALL
Yes
Deviation from
average memory
usage above
which severe
event is produced
(%)
"zend_monitor.mem_threshold"
ZEND_INI_ALL
Yes
If memory usage
below this value,
no deviation
events are
produced
"zend_monitor.time_threshold"
ZEND_INI_ALL
Yes
If script runtime
goes below this
value, no
278
Zend Platform
Directive
Mode
Reload
Description
Default
Value
deviation events
are produced
"zend_monitor.output_threshold"
ZEND_INI_ALL
Yes
If output size
goes below this
value, no
deviation events
are produced
"zend_monitor.event_overload_threshold"
ZEND_INI_SYSTEM
Yes
Depreciated
If more then 1000
events happen in
this time
(seconds), extra
events will be
dropped
"zend_monitor.disable_script_runtime_
ZEND_INI_ALL
Yes
after_function_runtime"
Disable "script
slow" event after
"function slow"
event happened
"zend_monitor.tmp_dir"
NONE
No
Directory where
monitor temp files
are written
"zend_monitor.max_content_download_
ZEND_INI_ALL
Yes
time"
If fpassthru()
5000
execution is
above this value
event is produced
(ms)
"zend_monitor.max_content_download_
ZEND_INI_ALL
Yes
time.severe"
If fpassthru()
10000
execution is
above this value
severe event is
produced (ms)
"zend_monitor.max_apache_processes"
ZEND_INI_ALL
Yes
If number of
200
Apache processes
is more than this
value an event is
produced
"zend_monitor.max_apache_processes.
ZEND_INI_ALL
Yes
severe"
If the number of
Apache processes
is more than this
value a severe
event is produced
"zend_monitor.security_filtered_variables"
ZEND_INI_ALL
Yes
The superglobal
variables (*) that
279
250
Zend Platform User Guide
Directive
Mode
Reload
Description
Default
Value
are filtered for
blacklisted words
(given in the
security_black_list
directive) PRGCVF
"zend_monitor.security_black_list"
ZEND_INI_ALL
Yes
The words that
are filtered out of
the chosen
superglobal
variables (@file
reads list from
file)
"zend_monitor.debug_level"
ZEND_INI_ALL
No
Debug level for
log printouts
"zend_monitor.max_script_lifetime"
ZEND_INI_ALL
No
Max lifetime of a
script statistic
data within the
monitor.
"zend_monitor.longscript.enable"
NONE
Yes
Enables this event
"zend_monitor.longfunction.enable"
NONE
Yes
Enables this event
"zend_monitor.zenderror.enable"
NONE
Yes
Enables this event
"zend_monitor.devscript.enable"
NONE
Yes
Enables this event
"zend_monitor.funcerror.enable"
NONE
Yes
Enables this event
"zend_monitor.devmem.enable"
NONE
Yes
Enables this event
"zend_monitor.outsize.enable"
NONE
Yes
Enables this event
"zend_monitor.memsize.enable"
NONE
Yes
Enables this event
"zend_monitor.load.enable"
NONE
Yes
Enables this event
"zend_monitor.custom.enable"
NONE
Yes
Enables this event
"zend_monitor.slowcontentdownload.enable"
NONE
Yes
Enables this event
1
"zend_monitor.maxapacheprocesses.enable"
NONE
Yes
Enables this event
1
"zend_monitor.javaexception.enable"
NONE
Yes
Enables this event
1
"zend_monitor.httperror.enable"
NONE
Yes
Enables this event
1
The maximum
8
"zend_monitor.max_events_per_second"
events per second
the monitor
collector will
report.
Limitations:
Values may range
between 1 to 999
higher or lower
values are
280
Zend Platform
Directive
Mode
Reload
Description
Default
Value
ignored
(*) G - GET, P - POST, C - COOKIE, R - RAW_POST_DATA, E - ENV, V - SERVER, S - SESSION, F FILES
Zend Monitor Event Types
For each event type there is a zend_monitor.<event_type>.
zend_monitor.<event_type> - can be set to off then this event type will not be reported. E.g.:
zend_monitor.memsize.enable = Off however the same settings can be easily defined from PHP
Intelligence | Event Triggers.
The following list displays the event types and the respective directive for enabling and
disabling Events:
Slow Script Execution Absolute - zend_monitor.longscript.enable
Slow Script Execution Relative - zend_monitor.devscript.enable
PH P Error - zend_monitor.zenderror.enable
Java Exception - zend_monitor.javaexception.enable
Function/Database Error - zend_monitor.funcerror.enable
Slow Function Execution/Slow Query Execution - zend_monitor.longfunction.enable
Slow Content Download - zend_monitor.slowcontentdownload.enable
Maximum Apache Processes Exceeded - zend_monitor.maxapacheprocesses.enable
Excess Memory Usage (Absolute and Relative) zend_monitor.devmem.enablezend_monitor.memsize.enable
Database Error - zend_monitor.funcerror.enable (same as the Function Error event).
Slow Query Execution - zend_monitor.longfunction.enable
Inconsistent Output Size - zend_monitor.outsize.enable
Load Average - zend_monitor.load.enable
Custom Event - zend_monitor.custom.enable
HTTP Error - zend_monitor.httperror.enable
Note:
All event types are enabled, by default. zend_monitor.enable when turned off will disable all event
reporting activity.
281
Zend Platform User Guide
Platform Administration Directives
Directive
Description
zps.install_dir
The place the Zend directory was installed to (Platform/ZPS)
studio.install_dir
The place the Zend directory was installed to (Studio Server)
zend_gui.language
Language code Platform Administration uses for texts (i.e. en for
English)
zend_gui.language_charset
If set, all the Platform Administration files will send a ContentType header with this charset also used to send specific charset
in Email (should be used in the Japanese version)
zend_gui.ini_modifier
The path to the ini_modifier utility
zend_central.error_logging
If enabled, Platform Administration will log errors into the file
'zend_central_error_log' that is located in the <install-dir>/logs
directory.
zend_central.gui_address
The full address of Platform Administration, this address is used
by the node to access Platform Administration (login process)
The address is in http(s)://host:port/path format
zend_central.node_address
Each node has this directive set with his address, the same
address that he gave the central during installation (this is the
way the central identify the server in the DB) The address is
ONLY the hostname/IP address.
zds.your_servers_max_clients
Use for the ZDS tests in Platform Administration (Performance
section in Platform), to "know" what is the value of the
maxClients of the server.
282
Zend Platform
Collector Center Directives
Directive
Default
Description
zend_monitor.collector_cert
Certificate file for the Collector Center
zend_monitor.collector_key
Private key file for the Collector Center
zend_monitor.collector_port
10010
Port to listen
zend_monitor.server_key_dir
Directory to store node keys
zend_monitor.events_db
Event Database URI
zend_monitor.pull_freq
3600
How often to pull node data (seconds)
zend_monitor.ping_freq
300
How often to check node availability (seconds)
zend_monitor.log_dir
Directory to store logs
zend_monitor.gui_dir
Directory where Platform Administration files
reside
zend_monitor.event_lifetime
24*7*3600
How long until event is considered too old
(seconds)
zend_monitor.cleanup_freq
500
283
Zend Platform User Guide
Debugger Directives
Directive
Mode
Reload
zend_debugger.allow_hosts
ZEND_INI_SYSTEM
Yes
Description
Hosts allowed to connect
(hostmask list)
zend_debugger.deny_hosts
ZEND_INI_SYSTEM
Yes
Hosts denied to connect
(hostmask list)
zend_debugger.allow_tunnel
ZEND_INI_SYSTEM
Yes
Hosts allowed to use
tunnel process (hostmask
list)
zend_debugger.expose_remotely
ZEND_INI_SYSTEM
Yes
Which client can know
debugger is installed
zend_debugger.max_msg_size
ZEND_INI_ALL
Yes
Maximum message size
accepted by Debugger
zend_debugger.httpd_uid
zend_debugger.tunnel_min_port
ZEND_INI_SYSTEM
No
UID for the httpd process
Minimal possible value of
Debugger tunneling port
Default value: 1024
zend_debugger.tunnel_max_port
Maximal possible value of
Debugger tunneling port
Default value: 65535
284
Zend Platform
ZDS Directives
Directive
Mode
Reload
Description
zds.enable
ZEND_INI_SYSTEM
Yes
Enable ZDS file serving
zds.mime_types_file
ZEND_INI_SYSTEM
No*
Location of the MIME types file
zds.log_file
ZEND_INI_SYSTEM
No
Log file
zds.log_level
ZEND_INI_SYSTEM
No
Log verbosity level (0-5)
zds.min_file_size
ZEND_INI_SYSTEM
Yes
Minimal file size to serve via ZDS
process (smaller files served via
Apache)
zds.disable_byterange
ZEND_INI_SYSTEM
Yes
Disable handling byte-range requests
(all requests would return entire file)
zds.mmap_chunk
ZEND_INI_SYSTEM
No
Memory chunk to map when serving
file, in K. Bigger chunks imply higher
memory usage by ZDS.
zds.nice
ZEND_INI_SYSTEM
No
Priority of ZDS server process. A
Higher value means lower priority.
Value range [1-19] anything higher
than 19 will be converted to 19.
zds.etag_params
ZEND_INI_SYSTEM
No
Defines the file attributes that ZDS will
use to build an ETag for the file it
sends.
zds.child_max
ZEND_INI_SYSTEM
No
Maximum number of ZDS subprocesses.
zds.poll_delay
ZEND_INI_SYSTEM
No
Delay between poll invocations, in
order to enable other processes to run
better
zds.uid
ZEND_INI_SYSTEM
No
UID of the ZDS file server
285
Zend Platform User Guide
Java Bridge Directives
Directive
Mode
Description
java.server_port
PHP_INI_SYSTEM
Port for Java Bridge
java.ints_are_longs
PHP_INI_ALL
If true, convert PHP integer to Java Long type
(otherwise converted to Java Integer)
java.encoding
Set encoding to expect from PHP for Java
Server
java.exception_error_level
For PHP4, error level which is used for
reporting exceptions. PHP5 uses PHP native
exceptions.
java.use_java_objects
PHP_INI_ALL
Set to 0 for Java Bridge to preserve the current
implementation (which converts basic java
objects to primitives, e.g. java.long.Short to
short). Set to 1 for Java Bridge to return Java
objects and not attempt to convert them to
primitives.
286
Zend Platform
Session Clustering Directives
Session Clustering is a transparent application that does not require a user interface or a command
line utility.
Session Clustering is configured by changing the session clustering directives in the zend.ini.
Directive
Value
Description
mod_cluster.daemon_verbosity_level
[1..3]
The verbosity level of the Session
Clustering daemon messages.
mod_cluster.number_of_threads
[1..n]
Number of worker threads run by the
Session Clustering daemon, mainly
handling connections. Increase
according to the running machines
strength.
mod_cluster.garbage_collection_delta
[0..n]
The number of seconds between
executions of the Session Clustering
daemon’s garbage collector
frequency.
mod_cluster.session_lifetime
[1..n]
The lifetime of a session (in seconds
either as file or in memory).
Sessions older than that will be
removed by garbage collection.
mod_cluster.statistics_delta_minutes
[0..n]
The number of minutes between
statistics dump to the log file
mod_cluster.network.hostname
<machine
The IP/hostname of the machine on
hostname>
which the Session Clustering daemon
runs. Note: Change the
mod_cluster.network.hostname’s
value to the name of the machine
in the network.
mod_cluster.network.tcp_port_remote
[1..65535]
The TCP port the Session Clustering
daemon listens to in order to
communicate with other Session
Clustering daemons
mod_cluster.network.unix_socket_permissions
[octal permission]
Permission to set for Unix socket file.
When the daemon is run, it creates a
ZendSessionManager.sock file, with
these permissions
mod_cluster.ha.udp_port
45678
HA communication port
mod_cluster.ha.broadcast_address
default
cluster's broadcast mask
255.255.255.255
mod_cluster.ha.broadcast_delta
default 30
The time, in seconds between
broadcasts.
mod_cluster.message_server_port
The port on which the daemon
listens for control messages (which
287
Zend Platform User Guide
Directive
Value
Description
can be sent using the messenger
utility).
mod_cluster.allowed_hosts
A comma separated list of IPs or IP
masks. these masks indicate
machines which the daemon will
agree to connect and to receive
connections
mod_cluster.storage.use_permanent_storage
0
Session Clustering data storage:0memory, 1-disk Note:
Environments that have large
amounts of session data (over a
Mega) should save session
information to the disk.
mod_cluster.storage.memory_cache_size
[1..n]
When using DISK STORAGE and not
memory, this number specifies the
amount of memory (in bytes) used
as a cache by the Session Clustering
daemon.
mod_cluster.ha.allowed_ips_file
<Platform install
The File containing list of allowed IPs
dir>/etc/allowed_ip
to connect with the Session
Clustering daemon
mod_cluster.storage.flush_delta
0
Determines the storage method and
intervals for storage flush
mod_cluster.storage.save_path
The location on disk where saved
sessions are stored
mod_cluster.storage.dir_levels
[1..n]
The number of dir levels used in
saving files
mod_cluster.storage.filename_cache_num_entries
[1..1024]
The Maximum number of session file
pointers held in an internal cache
zend_temp_dir
The location in which the
ZendSessionManager.sock and the
ZendSessionManager.lock are stored
zend_monitor.log_dir
The location in which log files are
stored
mod_cluster.network.use_unix_sockets
Communication with the
mod_cluster.so Note: Do not
change this value, It should
always be set to = 1.
mod_cluster.network.tcp_port_local
[1..65535]
If use_unix_sockets=0 then this will
be the TCP port the Session
Clustering daemon listens to. Note:
The Session Clustering daemon
will accept communication from
localhost on that port only.
mod_cluster.verbosity_level
288
[1..5]
The verbosity level of the Session
Zend Platform
Directive
Value
Description
Clustering debug messages.
mod_cluster.log_rotation_delta
The number of minutes after which a
check for log rotation is performed
mod_cluster.log_rotation_size
The size of the log file in MBs
Additional Information
mod_cluster.storage.flush_delta
Determines the write policy for sessions, when disk-mode is used.
If 0, then sessions are written to disk "on the spot" (write-through). there's no delay and when the
WRITE function returns, then either the session is written or an error has occurred. This method may
reduce performance.
If a positive number is specified, then write-back is used. For example, if 3 is specified, then a session
is not written immediately, but only 3 seconds later. This method may increase performance.
However, when the WRITE functions returns, data that has not been actually written! it can cause the
following effects:
if the daemon crashes, then all data written but not yet flushed (3 seconds max) will be lost
if an error occurs, but WRITE already returned, then we have no way to inform the user of
the failure
mod_cluster.storage.dir_levels
Determines the number of directory levels used when storing sessions on disk. The following example
shows what dir levels are:
Example:
mod_cluster.storage.save_path = /tmp/zend_sessions/
mod_cluster.storage.dir_levels = 2
Assuming session ID is abc123def456, then the actual file saved to disk will be
/tmp/zend_sessions/a/ab/abc123def456. So, the more dir levels there are, the level of
indirection increases. What is it good for? it makes sure that you don't have a single
directory with hundreds or thousands of sessions, since this situation reduces disk
response time when accessing a single file.
289
Zend Platform User Guide
Job Queue Directives
Directive
Mode
Reload
Description
zend_jq.host (string)
daemon
no
The host's IP
zend_jq.alias (string)
daemon
no
The alias of the JobQueue
daemon in the platform GUI
zend_jq.port (int)
daemon
no
The port on which the daemon
listens for requests (such as
adding a job)
zend_jq.message_server_port (int)
daemon
no
The port on which the daemon
listens to control signals from
Platform Central (such as
stopping the daemon)
zend_jq.data_dir (string)
daemon
no
The path to the base directory
for the file system persistency
zend_jq.fastcgi_conf (string)
daemon
no
The path to configuration file
for the fastcgi used to perform
the jobs
zend_jq.document_root (string)
daemon
no
The root directory in which
the scripts for execution
reside
zend_jq.login_pwd (string)
daemon
no
The MD5 of the login
password for the queue
zend_jq.max_num_of_request_workers
daemon
no
(int)
The number of threads used
to accept incoming requests
(jobs)
zend_jq.max_num_of_process_workers
daemon
no
(int)
The number of threads used
to process jobs (should be
equal to the number of fastcgi
processes)
zend_jq.debug_level (int)
daemon
yes
Level of debug messages
(1..3)
zend_jq.max_queue_depth (int)
daemon
yes
The maximum jobs allowed in
the queue. if no directive is
provided depth is unlimited
zend_jq.initial_backoff (int)
daemon
yes
The time in seconds used as
the basis for the for the
backoff time
zend_jq.backoff_factor (int)
daemon
yes
The factor by which the the
backoff time is multiplied after
each execution failure
zend_jq.max_exec_failures (int)
290
daemon
yes
The maximum number of
Zend Platform
Directive
Mode
Reload
Description
allowed retries for an
execution failed job
zend_jq.allowed_hosts (string)
daemon
yes
The IPs that are allowed to
connect to the daemon
zend_jq.max_history_time (float)
daemon
yes
The maximum time (in hours)
a job is kept in history (unless
it has property
preserved=yes). If no
directive is provided time is
unlimited.
zend_jq.history_refresh_interval (float)
daemon
yes
The interval in hours between
persistent storage refreshes
(jobs that passed their
max_history_time are
removed).
zend_jq.db_host (string)
daemon
no
The hostname of the database
used by daemon
zend_jq.db_port (int)
daemon
no
The port of the database used
by daemon (if omitted the
default database port is used)
zend_jq.db_socket (int)
daemon no the socket file of
the database used by daemon
( relevant only for UNIX)
zend_jq.log_rotation_size (int)
daemon
no
The maximum size of the log
(in MB) before it is rotated
zend_jq.log_rotation_delta (int)
daemon
no
The frequency to check
whether to rotate log
zend_jq.db_user (string)
daemon
no
the username of the database
used by daemon
zend_jq.db_password (string)
daemon
no
The password of the database
used by daemon
zend_jq.db_password (string)
daemon
no
the password of the database
used by daemon
zend_jq.moving_window_size (int)
daemon
no
The size of the moving
window in seconds used for
queue statistics
zend_jq.client_connection_timeout (int)
client
no
The number of seconds until
connection from client to
daemon is timed out
291
Zend Platform User Guide
Tutorials
Contents:
Integrating Existing and Legacy Applications
Calling an EJB on Websphere from PHP
Partial and Preemptive Page Caching
About SNMP
This section is dedicated to tutorials on different subjects.
Tutorial Feedback
Please send feedback and suggestions for new tutorials to: [email protected]
292
Zend Platform
Integrating Existing and Legacy Applications
This tutorial details the integration of Zend Platform’s Event Details screens with other legacy
applications.
Reproducing and resolving bugs, one of the most problematic challenges of development, is often time
consuming, and in most cases, almost impossible when information is not collected at the time of the
occurrence. PHP Intelligence is an event driven system that provides real-time analysis of PHP
applications.
By enabling you to obtain immediate insight into your PHP applications, PHP Intelligence provides a
fast and efficient means to reproduce and resolve problems, while maintaining a complete audit trail
of the occurrence's details.
PHP Intelligence pro-actively alerts you to problematic occurrences in your application. This means
that if you are a Developer or System Administrator you will not need to monitor the Platform console
at all times-instead, the information comes to you! An event, containing the audit trail of an
occurrence, can be made known to you through an E-mail Notification. If you require full event details
available outside of the Platform console, an Event Details screen can be published to a URL in XML
format. Both Event Details screens contain aggregated information relevant to the occurrence of an
event, or in other words "Full Problem Context": Event type, Event ID, Timestamp, Severity, number
of occurrences, etc.
Full Problem Context provides valuable information for the entire PHP application lifecycle
(development, production and deployment). Exposing the source of an occurrence along with the
ability to drill-down and investigate details pertaining to an event’s location, time and context,
provides in-depth insight to the reasons why the event occurred and a basis for resolving the issue.
PHP Intelligence includes the following Event Details screen Types: Slow Script Execution, PHP Errors,
Function Errors, Memory Usage, Database Errors, Query Execution, Output Sizes, Load Averages and
more...
Each Event Details screen Type includes basic and event-specific details such as: event type, event
ID, Timestamp, Severity, number of occurrences, error type, error text, triggered value, load average,
Source File Line, Script Name, Host URI, Vardata Type & Name, Function Name, Argument Numeric
Value, Function, Included Files, Backtrace, etc.
Contents of the XML output can be easily utilized and integrated to provide an information feed to
various legacy systems such as: Bug tracking systems for development and QA, CRM applications for
managing customer care, management systems such as Tivoli and HP OpenView for system health
information, and most commonly, generic monitoring systems such as Nagion or BigBrother that only
provide OS service information.
Using event information, developers and administrator teams have a single point of reference to
streamline the maintenance workflow. You can further enhance your development lifecycle by
debugging your PHP code referenced in Event Details screens directly through the built-in integration
with Studio. This feature includes debug capabilities that enable you to add watches, define
conditional breakpoints, view the stack trace and step into the source code to immediately debug the
problem.
Platform's XML output enables information to be easily interchanged. Using "Event Details",
developers can be sure that information pertaining to code, database and performance issues can be
easily reused in a multitude of applications. Examples of this use include sending SMS messages
containing event details, or triggering a mailing system to send a promotional gift to a customer who
encountered a performance problem. Done by, extracting customer ID information provided to you in
the Event Details screen (cookies).
293
Zend Platform User Guide
Event Details screens are delivered as XML, by defining the relevant action ("Submit Report to the
Specified URL") for an event. The report information is submitted as XML data to the specified URL.
Submission is done using the POST method, and the data is supplied through a variable named
'event_data'. This variable is accessible in PHP through $_POST['event_data'].
XML reports are structured as follows:
Each attribute is included if it exists in the Event Details screen:
<?xml version="1.0" ?>
<event type event_id class
timestamp time severity>
If there is an error:
<error type>error text</error>
<stats triggered_value avg load_average/>
If there is a source file:
<source file line/>
<script name host uri>
<vardata type name value/>
</script>
If there is a function:
<function name>
<args>
<arg num value/>
</args>
</function>
If there are included files:
<included_files>
<file name\>
</included_files>
If there is a backtrace for this event:
<backtrace>
<call depth function file line/>
</backtrace>
</event>
By viewing the XML tagged file as fielded text, the fielding makes it possible to break Event Details
screens down to their component parts to any degree of granularity for storage in a database. Once in
the database, the data can be utilized by another application.
The following example shows how Event Details data can be extracted from an XML file and inserted
into a database for use in a different system (could be any system based on a database, such as: Bug
Tracking, CRM, management or any other application).
<?PHP
$event_xml_data = (isset($_POST['event_data']))?$_POST['event_data']:null;
if (!$event_xml_data) {
// no Event Context arrvied
die();
}
$xml = simplexml_load_string($event_xml_data);
Implement different behaviors according to Class
$event_type = (string) $xml['type'];
// if this event is a Custom Event, we may implement different behaviors according to
the Custom Event’s class
if ($event_type == 'custom') {
$custom_class = (string) $xml['class'];
294
Zend Platform
switch ($custom_class) {
// different behaviors according to the class
}
}
// get the new event id
$event_id = (int) $xml['event_id'];
// insert a new event with its genreal info (type and timestamp) to the db
insert_new_event_into_db($event_id,$event_type ,(int)
$xml['timestamp']);
// parse the function parameters of the function where the event occured
$function_parameters = array();
foreach ($xml->function->args->arg as $arg) {
$function_parameters[(int) $arg['num']] = (string) $arg['value'];
}
// insert the function data (function name and parameters, where the
event occured) to the db
update_event_function_data($event_id, (string) $xml->function['name'],
$function_parameters);
/**
* insert a new event (with some genreal info) to the db
*
* @param int $id id of the new event in the ZendPlatform events database
* @param string $type the event type
* @param int $timestamp the unix timestamp when the event occured
*/
function insert_new_event_into_db($id,$type,$timestamp) {
}
/**
* update a specific event function data in the database
*
* @param int $id the event id we want to update
* @param string $function_name name of the function where the event occured
* @param array $function_params array of the function parameters (num
=> value)
*/
function update_event_function_data($id,$function_name,$function_params) {
}
?>
The first part of the example uses a PHP 5 Simple XML extension to parse XML to PHP objects that can
be processed with normal property selectors and array iterators. The second part extracted data from
the event XML data, and inserted it into a database.
As this tutorial demonstrated, XML Event Details generated by the PHP Intelligence component,
provides Developers and System Administrations a single point of reference for production
environments, and to streamline maintenance workflow. In environments where multiple
management applications are an everyday reality, Platform provides a flexible information feed to
legacy systems, relieving the overhead normally required to integrate with these applications.
295
Zend Platform User Guide
Calling an EJB on Websphere from PHP
This tutorial reviews the steps needed to call an EJB on WebSphere from PHP using the Java Bridge.
These instructions assume that the developer has a system(s) with WebSphere, PHP, and the Zend
Platform installed.
To call an EJB on Websphere from PHP, a script file needs to be created. This script should start the
javaMW server with the correct settings to run a Websphere client.
Some of the important things to remember are:
1.
Use IBM's java that ships with the Application Client to run the javaMW server.
2.
The jars containing the client classes for any EJB that is to be called need to be classpath of
the javaMW server.
3.
The jars and environment variables for the WebSphere application client runtime need to be
on the command line staring the javaMW server.
The following is an example script file for starting the javaMW server with the WebSphere runtime
configuration options and the jars needed to call the Basic Calculator Technology sample shipped with
Websphere.
Note:
This script is a modified version of the Basic Calculator Thin Client script file shipped with the
Websphere Client Install.
#!/bin/sh
. /opt/IBM/WebSphere/AppClient/bin/setupClient.sh
# Change the PROVIDER_URL to point to this machine or another server.
if [ "${SERVERPORTNUMBER}" != "" ]
then
PROVIDER_URL=iiop://$DEFAULTSERVERNAME:$SERVERPORTNUMBER
else
PROVIDER_URL=iiop://$DEFAULTSERVERNAME
fi
"$JAVA_HOME/bin/java" $WAS_LOGGING -classpath
/usr/local/Zend/Platform/Bin/javamw.jar:/opt/IBM/WebSphere/AppClient/samples/lib/Tec
hnologySamplesThinClient/BasicCalculatorClientCommon.jar:/opt/IBM/WebSphere/
AppClient/samples/lib/TechnologySamplesThinClient/BasicCalculatorThinClient.
jar:/opt/IBM/WebSphere/AppClient/samples/lib/TechnologySamplesThinClient/Bas
icCalculatorEJB.jar
-Djava.ext.dirs="$WAS_EXT_DIRS" -Djava.naming.provider.url=$PROVIDER_URL
-Djava.naming.factory.initial=com.ibm.websphere.naming.WsnInitialContextFac
tory
-Dzend.javamw.threads=20 -Dzend.javamw.port=10001 "$SERVER_ROOT"
"$CLIENTSAS" com.zend.javamw.JavaServer
Instructions
Start the javaMW server using the script.
Write a PHP client, which uses the Java Bridge functionality to call the ejb running on
Websphere.
The following is an example PHP client for calling the Basic Calculator Technology sample.
<?php
296
Zend Platform
// Get the provider URL and Initial naming factory
// These properties were set in the script that started the Java Bridge
$system = new Java("java.lang.System");
$providerUrl = $system->getProperty("java.naming.provider.url");
$namingFactory = $system->getProperty("java.naming.factory.initial");
$envt = array(
"javax.naming.Context.PROVIDER_URL" => $providerUrl,
"javax.naming.Context.INITIAL_CONTEXT_FACTORY" => $namingFactory,);
// Get the Initial Context
$ctx = new Java("javax.naming.InitialContext", $envt);
// find the EJB
$obj = $ctx->lookup("WSsamples/BasicCalculator");
// Get the Home for the EJB
$rmi = new Java("javax.rmi.PortableRemoteObject");
$home = $rmi->narrow($obj, new
Java("com.ibm.websphere.samples.technologysamples.ejb.stateless.basiccalcula
torejb.BasicCalculatorHome"));
// Create the Object
$calc = $home->create();
// Call the EJB
$num = $calc->makeSum(1,3);
print ("<p> 1 + 3 = $num </p>");
?>
This tutorial detailed how developers can use EJB on WebSphere from PHP using the Java Bridge.
The two steps are: to create a script file to start the JavaMW server and to write a PHP client
which uses the Java Bridge functionality to call the EJB running on WebSphere.
Partial and Preemptive Page Caching
This tutorial will review one of Platform’s most powerful features, Partial Page Caching. Partial Page
Caching is used in cases where it is impractical or impossible to cache the entire output such as when
sections of the script are fully dynamic or when the conditions for caching the script are too
numerous. An example of this type of usage is when some of the output is a form, that has credit card
numbers, addresses and all kinds of information that for security reasons, should not be cached
The following tutorial is a step-by-step guide to mastering Partial Page Caching.
Inside this tutorial, you will find several ways to cache you output:
Partial Page Caching APIs - a general overview of the Caching APIs with usage examples.
Action Based Partial Page Caching - Cache using buttons and conditions
297
Zend Platform User Guide
Partial Page Caching APIs
Partial Page Caching can also be achieved using the following functions for almost all situations:
Output Caching Functions
Function
Action
output_cache_fetch()
Gets the code's return value from the cache, if
it is there.
output_cache_output()
Calls a function and checks if the function
exists in the cache. Yes - Print No - Puts
function output in cache and prints.
output_cache_exists()
Checks if the key exists in the cache. Yes Print, No - Runs code, output in cache and
prints until it reaches the stop command:
output_cache_stop().
output_cache_stop()
Indicates the end of a block of code.
Data Caching Functions
Function
Action
output_cache_put()
Enters a single variable into the cache
output_cache_get()
Gets the Variable from the cache at the end of
its lifetime.
Invalidate Cache
Function
Action
output_cache_remove_key (string key)
Respectively remove items from the cache
according to their type (Key, URL or File)
The partial caching functions are divided into two groups, output caching and data caching. This
document will explain each of the two groups and give practical examples of each function call.
Output Caching
The first groups of functions are the output caching functions. These functions capture the output from
a function or block of PHP code and cache it. These functions are:
output_cache_output()
output_cache_exists()
output_cache_stop()
Output caching functions allow programmers to remove the execution of blocks of code with static
output, such as looping over and printing the day’s news headlines. This output changes infrequently,
so instead of reprocessing it for every user caching allows PHP to skip execution and print the results.
298
Zend Platform
Prototype:
void output_cache_output(string key, string code, int lifetime)
The first time output_cache_output() is called, it will execute the function defined in argument two,
and store any output in the cache under the retrieval key specified in argument one. Each subsequent
call to output_cache_output () with the same value as argument one will result in the output of this
cached data instead of the execution of the function in argument two, until the cache lifetime in
argument three expires.
output_cache_output () is typically used to capture the output created by a function call. In order to
use it, you would need to wrap a section of code as a function. When you call output_cache_output (),
it will call this function and cache it's output.
output_cache_output () takes three arguments:
1.
The key value with which this output will be cached.
2.
The function call.
3.
The cache lifetime in seconds.
output_cache_output() has no return value.
Usage Example
<?
function content($time) {
/* Create a function to Wrap the code that produces
the output */
print "<p>Cached Time: $time </p>";
/* The actual value of $time will be printed
only once every 30 seconds. The output from
the print statement will be cached, and the
function call will be ignored until the cache
lifetime expires */
}
$time = time();
/* Get current time, in seconds */
print "<p>Current Time: $time </p>";
/* Print the real current time */
output_cache_output("Current Time","content($time);",30);
/* Cache all output for the function content() and
store it based on the key "Current Time" for 30
seconds */
?>
Usage Notes:
output_cache_output() is used to cache the output generated from functions. To utilize it, wrap a
section of code (which generates the output you wish to cache) as a function. Any output statements
in this new function will be captured into a buffer and stored as cached data with the key specified.
The other two functions, output_cache_exists () and output_cache_stop (), are used in tandem to
simplify the task of caching output from a given section of code.
299
Zend Platform User Guide
Prototype:
boolean output_cache_exists(string key, int lifetime)
void output_cache_stop()
output_cache_exists() is called from a conditional statement. The conditional statement should wrap
the section of code producing the output you are intending to cache.
output_cache_exists() takes two arguments:
1.
The key value with which this output will be cached.
2.
The cache lifetime in seconds.
output_cache_exists() returns a boolean. TRUE is the key exists, FALSE if it doesn't.
output_cache_stop() takes no arguments.
output_cache_stop() has no return value.
Usage Example
<?
if (!output_cache_exists("Some_Key2", 3)) {
echo time();
output_cache_stop(); // Stop buffering...
}
?>
Data Caching
In cases where caching the output from a script isn't possible, we offer a set of functions for caching
data. These functions are output_cache_fetch(), output_cache_put() and output_cache_get().
Data caching allows programmers to skip execution of repetitive database calls, increasing script
performance and reducing overhead on the database. Typical uses of data caching include caching
user preferences, caching product pricing, or any SQL call which changes infrequently.
Prototype:
string output_cache_fetch(string key, string code, int lifetime)
output_cache_fetch() works in a similar manner to the output caching function,
output_cache_output(). The major difference is that instead of caching the output from the function it
caches the return value as a string.
output_cache_fetch() receives 3 arguments:
1.
Unique identifier string for the data (string)
2.
PHP code to be cached (string)
3.
Cache lifetime in seconds (integer)
output_cache_fetch() returns a string containing the return value of the cached code section as
defined in argument 2. The ID, defined in argument 1, serves to differentiate the code section and
give it a name. Lifetime, defined in argument 3, is handled in the same way the Performance module
handles cache lifetimes for all cached files -- cached copies older than the lifetime will be refreshed
when the function is called.
Note:
Unlike normal caching only the return value of the given PHP code is cached.
300
Zend Platform
Usage Example
<?
function get_content($time, $sec, $usec) {
/* I define an arbitrary function which
returns data. */
$data = array();
$data["time"] = $time;
$data["sec"] = $sec;
$data["usec"] = $usec;
/* Create an array to store the data.
This is where you would generate the data
you wish to cache, such as making database
calls. */
$ser_data =
serialize($data);
/* serialize the array for return */
return ($ser_data);
}
$time = time(); /* get current timestamp */
$micro = microtime();
/* get current timestamp
including microseconds */
list ($usec, $sec) = explode(" ", $micro);
/* Print the real current time */
print "<p>Current Time: $time, $sec, $usec</p>";
$cached_string = output_cache_fetch("Example: Fetch","get_content($time, $sec,
$usec);",30);
/* Call the function via the 'output_cache_fetch()'.
If the content key exists and the lifetime hasn't
expired, the function execution will be skipped
and the cached data will be returned via the cache
API call. */
$data = unserialize ($cached_string);
/* unserialize the data */
/* Print the cached time */
print "<p>Cached Time: " . $data["time"] . "," . $data["sec"]. "," .$data["usec"] .
"</p>";
print "<p><b>Refresh to see caching in action!</b></p>";
?>
The strength of output_cache_fetch is that it allows the developer to offload repetitious database calls
by wrapping these calls in a function. The following example illustrates how this would work.
<?php
/* Note that this code is kept as simple as possible,
with no return type checks etc., in order to focus
on the caching features. */
/* Display greetings and read user info from database this part must remain dynamic */
$user_id=($_SESSION['user_id']);
$result = mysql_query("SELECT name,country,airport
301
Zend Platform User Guide
FROM users
WHERE id=$user_id");
list($name,$country_id)=mysql_fetch_array($result,MYSQL_ASSOC);
echo "<P>Welcome $name ".date("F j, Y, g:i a") ."</P> ";
/* Note that the code to be cached should be wrapped as
a single function call (see argument 2 in above
example) - this is to improve readability and code
reuse (the code we want to cache is usually longer
than one line.) */
// Display list of destination countries
$sql = "SELECT id,name FROM countries";
echo "<P>Destinations: ";
$destination_str=output_cache_fetch("destinations","GetQuery('$sql')",3600);
$destination_arr = unserialize($destination_str);
$out = "<P>Destination Airport: <SELECT NAME=\"destination_airport\">";
foreach ($destination_arr as $destination) {
$out .= "<OPTION VALUE=\""
.$destination['id']."\">"
.$destination['name']."</OPTION> ";
}
$out .= "</SELECT></P> ";
echo $out;
echo "</P>";
/* In the first caching example (above), we cache the
list of destinations. This is the same for every
user, and so the cache id is a simple string. In
the second example (below), the list of airports
depends on the user's country. So, the country_id
is added in the ID string. This will create a
different cache copy for each continent. */
// Display list of airports in the user's home country
$sql = "SELECT id,name FROM airports WHERE country='$country_id'";
$airports_str = output_cache_fetch("airports_$country_id","GetQuery('$sql')",3600);
$airports_arr = unserialize($airports_str);
$out = "<P>Departing Airport: <SELECT NAME=\"depart_airport\"> ";
foreach ($airports_arr as $airport) {
$out .= "<OPTION VALUE=\"".$airport['id']."\">".$airport['name']."</OPTION> ";
}
$out .= "</SELECT></P> ";
echo $out;
/* This function is more general purpose, meant to be
used with output_cache_fetch () it performs an SQL
query and returns the results as a serialized string.*/
function GetQuery ($sql_query) {
$result = mysql_query($sql_query);
$res_arr = mysql_fetch_array($result, MYSQL_ASSOC));
$res_str = serialize($res_arr);
return $res_str;
}
?>
302
Zend Platform
Usage Notes:
You can use output_cache_fetch() to cache non-string types (e.g. arrays and objects) of PHP variables
by using PHP's serialize() and un-serialize() to convert them to strings and vice versa.
output_cache_fetch requires the code which generates the cache data to be wrapped in a function.
This allows the cache routine to skip the execution of this code if the data is already cached
output_cache_put() and output_cache_get() provide a direct way to store and retrieve data from the
cache.
Prototype:
void output_cache_put(string key, mixed data)
void output_cache_get(string key, int lifetime)
output_cache_put() takes two arguments:
1.
The key value with which this data will be cached.
2.
The data to be cached. (scalar, string, or serialized data).
output_cache_put() has no return value.
output_cache_get() takes two arguments:
1.
The key value with which the data is stored.
2.
The lifetime that this data should be considered valid.
output_cache_put() returns the cached data, if it exists and is valid. Otherwise it returns false.
Usage Example
<?
if(($result = output_cache_get("TestFunctionResult", 30)) === false) {
$result = microtime();
/* Current timestamp */
print "<br><i>Fetching Fresh Content</i><br>";
/* Should only print this every 30 seconds when
the content is fetched fresh */
output_cache_put("TestFunctionResult", "Cached: $result");
}
print "<b>$result</b><br>";
?>
Usage Notes:
The put/get routines are a simpler method for caching data than output_cache_fetch. They are
typically used for the storage and retrieval of small bits of data.
303
Zend Platform User Guide
Action Based Partial Page Caching
Action Based Partial Page Caching pertains to caching part of an output based on the occurrence of an
action. This type of Caching is necessary in instances where it is preferable to refresh the Cache when
an action occurs rather than time based.
For example: If we have a list of people who are "Currently Online" and we were to use time based
caching, we would have to set an extremely short time limit to make sure that the list is updated at all
times. We would also waste valuable system resources every time we refresh the cache. Instead, we
can adopt a more efficient approach: refreshing the cache based on an action, for instance, every time
a member goes online or logs out.
How do we do this?
There are two "Partial Page Cache" options based on an action:
1.
Conditional Partial Page Caching
2.
Button Based Partial Page Caching
Conditional Partial Page Caching
With this option, we predetermine conditions for caching and invalidating (If X occurs then do Y).
For example: we can cache our list of people who are "Currently Online" based on their log-on
action. Whenever someone logs-on, their name will be added to the cache. Subsequently, when the
same person logs-off we could set another condition will remove the name from the cache.
The following code example demonstrates how to empty the cache when a certain action occurs:
if (check_some_condition()) {
output_cache_remove_key (...);
}
Button Based Partial Page Caching
With this option, we set a specific button to initiate refreshing the Cache (Pressing button X does Y).
For example: we can cache our list of people who are "Currently Online" based on a specific button
that the person logging-in will press (such as: login, next, go, etc). Whenever someone presses the
button, his or her name will be added to the cache. Subsequently, when the same person presses a
different button, his or her name will be removed from the cache.
The following example demonstrates the button triggered Partial Page Caching technique:
<form action="clean_cache.php">
<input type="submit" value="Clear Cache">
</form>
The 'action' attribute points to the clean_cache.php script. Therefore, when the user submits the form,
clean_cache.php is executed+.
The clean_cache.php clears the cache (with output_cache_remove()) and then builds it again with
fopen("http://..") to get a real cache refresh.
This tutorial detailed Action Based Partial Page Caching, with conditional or button-oriented
options.
304
Zend Platform
About SNMP
Contents:
Available Operations
The MIB
SNMP Trap
The OID
SNMP Message Structure
MIB file Structure
Message Headers
Using NET SNMP
The PDU
Catching an SNMP Trap
SNMP (Simple Network Management Protocol) is a method of monitoring devices or applications from
a single location, without the need to check each device/application at any given time.
This is done by having an SNMP agent running on each of the monitored devices. A NMS (Network
Management Software/Station) is then installed on a central machine to monitor the activity.
The Rational behind this method is to enable the user (in most cases, the system administrator) to
use the NMS in order to 'operate' the monitored devices.
The SNMP agent can inform the NMS about any occurrence.
Communication between the SNMP agent and the NMS is done using UDP, which makes SNMP
somewhat unreliable and it is up to the SNMP implementation to make sure messages reach their
destination.
Available Operations
The SNMP protocol defines five basic operations (later SNMP include more):
1.
Get
2.
Get-Next
3.
Get-Response
4.
Set
5.
Trap
The first four operations are available to the NMS and are used to control a monitored device.
The last operation (Trap) is used by the SNMP agent in order to inform the NMS about an occurrence
the device. Traps are employed by Zend Platform’s Event Actions and therefore, will be further
described.
SNMP Trap
The SNMP Trap is used by the SNMP agent in order to inform the NMS about an occurrence on a
device (the same device on which it is installed). An occurrence can be anything ranging from:
"detecting a new device", "device shut down", ”"application crash" or "computer temperature is high".
This facilitates the purpose of sending a trap, which is to transmit only essential data to indicate there
is a problem. The other SNMP commands (like 'set' and 'get') can then be used to investigate the
actual details of the occurrence.
Note:
The following section describes the SNMP V2c message structure which is only slightly different than
the SNMP V1 message structure.
305
Zend Platform User Guide
SNMP Message Structure
All SNMP messages have the same general structure. They are constructed of Message Headers and
the PDU (Protocol Data Unit).
Note:
The PDU may differ in some SNMP operations.
Message Headers
Message Headers contain the following information:
Version number - Specifies the SNMP version in use (for example '2c').
Community name - Specifies the access environment for a group of NMSs (for example
'public').
Community names serve as a form of authentication (much like a password).
For example, when the NMS gets an SNMP Trap from an SNMP agent, it checks if the community
name that was sent with the trap is authorized to send this trap from this agent.
The PDU
The PDU is the format for sending data in an SNMP operation.
SNMP PDU structure is as follows:
PDU type
Enterprise OID
Agent Address
Generic trap number
Specific trap number
Up-time
Variable-binding
The MIB
MIB (Management Information Base) is a hierarchically organized collection of information definitions.
MIBs are a collection of managed objects that are identified by object identifiers.
A managed object represents an element of a device. Managed objects are a collection of one or more
object instances, which are essentially variables.
Why do we need the MIB?
The MIB server as a common ground for both the NMS and the SNMP agent (MIB is saved in a text file
in a specific structure).
The MIB defines the entities that take part in SNMP communication. For example, traps are set in the
MIB file with the definition of the data that can be sent in the trap. This allows the NMS that gets the
trap from the SNMP agent to read and interpret the data.
306
Zend Platform
The OID
The OID (Object ID) is a set of numbers, separated by '.', that together assemble a unique identifier
that identifies a managed object in the MIB hierarchy.
The MIB hierarchy can be depicted as a tree. For example, the OID: 1.3.6.1.4.1.20815 broken down
to each of it's elements, means:
1 - ISO
3 - Identified Organization
6 - DOD
1 - Internet
4 - Private
1 - Enterprise
20815 - Zend
The first six elements in the OID are constant. Each organization can register itself with an institute
called 'IANA' (Internet Assigned Numbers Authority). Registration with IANA is not mandatory, but
strongly recommended in order to maintain order in the Hierarchy (making sure each organization
uses it's own unique OID).
Registration with IANA is free from: http://www.iana.org/cgi-bin/enterprise.pl).
Each element in the MIB file can be (and is eventually) represented by OID. However, using a MIB file
allows enables to represent each element in a more 'human readable' way.
MIB file Structure
The following is an example of a basic MIB file:
MIB-NAME DEFINITIONS ::= BEGIN
IMPORTS
enterprises
FROM RFC1155-SMI
OBJECT-TYPE, NOTIFICATION-TYPE
FROM RFC-1212;
zend OBJECT IDENTIFIER ::= { enterprises 20815 }
SimpleTrapExample NOTIFICATION-TYPE
STATUS current
DESCRIPTION "This is a simple trap example"
::= { zend 1 }
ComplexTrapExample NOTIFICATION-TYPE
STATUS current
DESCRIPTION "This is complex trap example with variable-binding in it"
OBJECTS { IntVariable, StringVariable }
::= { zend 2 }
IntVariable OBJECT-TYPE
SYNTAX INTEGER
MAX-ACCESS accessible-for-notify
STATUS current
DESCRIPTION "This is an integer variable"
::= { ComplexTrapExample 1 }
StringVariable OBJECT-TYPE
SYNTAX STRING
MAX-ACCESS accessible-for-notify
307
Zend Platform User Guide
STATUS current
DESCRIPTION "This is a string variable"
::= { ComplexTrapExample 2 }
END
The first line defines the name of the MIB (in the sample file, it's called 'MIB-NAME'). Then, the
required imports are set (the 'enterprise' import actually sets all the required data up to the
'enterprise' level, which is one level above our organization level, in this case - one level above Zend).
From this point, in order to mention the '1.3.6.1.4.1' OID level, all we need to write is 'enterprise', as
illustrated below.
It also imports two 'element' definitions: the NOTIFICATION-TYPE (this is actually a 'trap-type' that
defines a trap) and OBJECT-TYPE (which defines variables).
Once the required data is imported, we can start setting our MIB.
Now we define 'zend' to be the OID 1.3.6.1.4.1.20815 by stating zend OBJECT IDENTIFIER ::= {
enterprises 20815 }
From this point on, we start setting the trap types and the variables.
More detailed information on how to write MIB files can be found in RFC-1212
(http://www.faqs.org/rfcs/rfc1212.html)
Online MIB Validators
Once an MIB file is written it is prudent to pass the MIB file through a MIB validator engine. The
validator engine will check to see if the MIB file is written correctly and validates to content.
There are several online validator engines such as*:
•
Online MIB Validator (http://www.muonics.com/Tools/smicheck.php)
•
MIB module validation (http://www.simpleweb.org/ietf/mibs/validate/)
*Zend Technologies does not indorse or recommend these sites. The links herein are simply provided
as examples of online providers.
Using NET-SNMP
NET-SNMP is a free implementation of the SNMP protocol. NET-SNMP that can be obtained from
http://www.net-snmp.org/.
Sending an SNMP Trap
Sending a trap using NET-SNMP is quite easy once you know the parameters you need to send and
how.
SNMP traps are sent using the snmptrap command. The syntax is:
snmptrap -v 2c -c <community string> -M <MIB directory> -m <MIB name> <NMS
address:port> <uptime>
<<MIB name::>Trap name> <<MIB name::>var> <type> <value>
The following describes the different parameters:
-v - The version of the SNMP protocol to use in order to send the trap.
-c - The community string to be sent with the trap.
-M - TThe directory where the MIB is located. If all you want is to add another directory to
the MIB dir list, you should place the plus sign (+) before the directory, like this: -M
+/my/MIB/dir. Multiple MIBs directories are seperated by ':'.
308
Zend Platform
-m - The MIBs to be used. If all you want is to add another MIB to the list of MIBs used, you
should place the plus sign (+) before the MIB name, like this: -m +MY_MIB_NAME. Multiple
MIBs are separated by ':'.
NMS address:port - The address and port of the target NMS machine.
uptime - The time passed since the machine came up or since something happened on the
machine. You can send an empty string as the uptime.
Trap name - The name / type of the trap you are sending. Generic trap is only used in SNMP
V1, therefore, we only specify the 'specific trap' type. Specifying the MIB name before the
trap name (followed by '::') is used to avoid instances where two traps have the same name
in different MIBs.
Variable binding variables - The following elements must be sent together or not at all !
(Several variables can be sent in each trap).
•
var -The name of the variable in the MIB. Specifying the MIB name before the variable
name (followed by '::') is used to avoid instances where two variables have the same
name in different MIBs.
type - The type of the variable being sent. Several types are available:
•
i - for INTEGER
•
u - for UNSIGNED
•
c - for COUNTER32
•
s - for STRING
•
x - for HEX STRING
•
d - for DECIMAL STRING
•
n - for NULLOBJ
•
o - for OBJID
•
t - for TIMETICKS
•
a - for IPADDRESS
•
b - for BITS
value - The value for the variable being sent.
Catching an SNMP Trap (emulating NMS)
In order to catch a trap, you need an NMS, and in case you don't have one installed, you can use the
'snmptrapd' command.
The command syntax is as follows:
snmptrapd -P -M <MIB directory> -m <MIB name>
The following describes the different parameters:
-P - This parameter prints formatted incoming traps to stderr (resulting in 'interactive'
output). This option is deprecated and can (should) be replaced with -f -Lo.
-M - Same as in the snmptrap command.
-m - Same as in the snmptrap command.
309
Zend Platform User Guide
Other Sources of Information
310
SNMP tutorial - Explains what is SNMP and how it works.
NET-SNMP project home page (http://www.net-snmp.org/)
Some short tutorial about SNMP (http://www2.rad.com/networks/1999/snmp/index.htm)
Another, more detailed, tutorial about SNMP
Zend Platform
Appendices
Contents:
Appendix A - Troubleshooting Zend Platform
Appendix B - Event Aggregation Mechanism
Appendix C - Zend Platform Support
Appendix D - Network Port Requirements
311
Zend Platform User Guide
Appendix A - Troubleshooting Zend Platform
The following troubleshoot list, covers possible issues that may rise while working with Zend Platform
and using Tunneling. These issues have been listed by category.
Web Server
Possible Issue
Recommended Action
Images are not displayed in the
Add "EnableSendfile Off" to your httpd.conf.
Administration User Interface
Note: this is not a Platform issue if the Sendfile support is
(GUI) when using Apache 2.
broken, images of other web pages on the same server will
suffer from the same problem and this action will fix the
problem for the entire server.
Job Queue
The primary tool for investigating Job Queue related issues is the log file. This file is by default located
in $install_prefix/logs/JobQueue.log. The php.ini directive for defining the log file's location is:
zend_monitor.log_dir=.
Possible Issue
Recommended Action
API use and queue functionality
Re-queuing job fails
When adding jobs, failure can be caused by various reasons, (e.g.
repeatedly
illegal file path, queue is full etc. Look at the log or
ZendAPI_Queue::getLastError() for error details).
As the failure might be inherent in the job itself, re-queueing the
job won't help in some cases.
Only re-queue when it could solve the problem (e.g. if queue was
full try re-queuing after jobs were removed).
Job that was added to the
Make sure to test the return value of addJob(). addJob() returns
queue isn't in it.
false upon failure.
Use the ZendAPI_Queue::getLastError() which returns the error
string and can help determine if the failure reason is related to the
queue. If so correct the value and check again.
If the failure is due to high load (for example queue is full or
connections get timed out) the relevant JobQueue parameters may
be changed (e.g. higher maximum queue depth or longer timeout).
Another approach is to try scheduling these jobs to a less busy
time.
How can I detect jobs that
Logical Job failures (such as an invalid credit card number) can be
had some kind of logical
detected and tracked if you use the set_job_failed() API. If this
failure in them?
function is called when job is being run, it will show as Logically
Failed in the Administration Console in Job Queues | Jobs..
What happens to jobs that
When a job fails, all it's dependent jobs will remain in state "waiting
were dependent on a job that
for predecessor", handling such cases is up to the user (possibly fix
failed?
the job that failed or run a cleaner job to remove dependent jobs).
What happens to a job that
If a job fails logically, but still has recurrences it will keep recurring
312
Zend Platform
Possible Issue
Recommended Action
failed logically (e.g. because
as usual.
database was temporarily
unavailable) but still has
recurrences?
A job changes to status
When job execution failure occurs, due to the re-queuing
scheduled although it wasn't
mechanism, it's state will immediately change to Scheduled. Job
scheduled
states will get the status "execution failure" only after it failed all
retries.
Execution retry policy can be configured with the directives:
zend_jq.initial_backoff, zend_jq.backoff_factor,
zend_jq.max_exec_failures
The job isn't performed at the
There are no absolute guarantees on job execution times. Jobs are
exact time it was scheduled to
usually performed very close to their scheduled time, but if the load
is very high the Job Queue prioritizes execution to be delayed to
prevent overloading the system.
The JobQueue's log shows
Jobs may be performed successfully by the JobQueue, but the script
jobs as complete but the job
performed might have an error, thus it is best to monitor the fastcgi
didn't do anything.
processes that perform the jobs to catch these errors (e.g. by
loading a Monitor extension ( no need to load other extensions such
as Platform)
The daemon isn't updated
JobQueue is an asynchronous system, therefore you need to allow
immediately after actions
time for the commands from the API and other operations to take
from the client.
place (e.g. need to wait between adding addJob() and getJob() )
Performance
Requests from the client
The "number of requested worker threads" should be adjusted to
aren't handled quickly by the
the incoming connections load. This is usually the number of
daemon.
Apache clients, but if the application has jobs that add jobs the
amount should be increased - this also includes the JobQueue's
number of fastcgi clients.
Note: The "number of request worker threads" can be lower than
the max concurrent requests, as connections are queued (currently
up to 30 connections are queued, this can't be configured by the
user).
Jobs from the daemon aren't
The "number of process workers" should equal the number of max
handled quickly by the fastcgi
fastcgi processes. A lower number may mean under-utilization of
processes
the fastcgi processes.
Is there a limit to the number
The JobQueue is reliant on the MySQL database that contains the
of jobs that can be stored?
jobs, and therefore, database capacity etc. must be taken into
account to set the amount of Jobs to suit the database's capacity
(such as determining history cleanup times etc.).
JobQueue shows low
Make sure your hardware can handle the load and that there are
performance
enough:
Threads to support the configuration for process workers
and request workers
313
Zend Platform User Guide
Possible Issue
Recommended Action
Memory
Disk space
General
There is no communication
Communication between the client and daemon is via TCP, make
between client and daemon
sure it's configured correctly (ports, firewalls etc.) and that the
requests reach the daemon.
A simple way to verify this is to increase the JobQueue log verbosity
level and check for messages about connections received. If there
are none, the request hasn't reached the JobQueue daemon.
Session Clustering
The ModCluster PHP extension when associated with a webserver (like Apache) communicates with
the SCD (Session Cluster Daemon.)
There are two log files that may be checked for problems:
modcluster.log (associated with the ModCluster extention output)
ZendSessionManager.log (associated with the SCD output)
The modcluster log hardly every shows hard errors, however, the following actions can be tracked:
Connectivity with local SCD
Cookies, received from clients
The level of debug messages in the logs is defined by the following zend.ini directives:
ModCluster - mod_cluster.verbosity_level (0-5) [1] (the log level can be changed only upon
restart)
SCD - mod_cluster.daemon.verbosity_level (0-5) [1] (0 - CRITICAL and WARNING, 1 informative, others - debug. The debug level can be adjusted in runtime (see the section
about messenger), log rotation is possible also.
The logs are saved in the location defined by the directive: zend_monitor.log_dir.
On a single session clustering machine, there can be several Modcluster processes (up to hundreds)
talking to the SCD. They are forked as parts of the Apache processes. The SCD daemon can run
several threads as defined in the zend.ini directive mod_cluster.number_of_threads.
As a general guideline, this number can match the count of "virtual" CPUs installed on the system, so
if the system has 1 hyper-threading CPU, the number of threads can be set to 2.
Raising this value higher WILL NOT significantly improve the overall system throughput, since each
SCD thread is already designed to support multiple MC clients.
314
Zend Platform
ModCluster communicates with the SCD via UNIX domain (much faster) or TCP sockets on UNIX and
TCP sockets on Windows. This is set by the directive: mod_cluster.network.use_unix_sockets=0.
The UNIX domain socket appears as a file in the location, set by the directive: zend_temp_dir. If, for
some reason you are unable to use the socket (or using Windows), a TCP port for the local
communication is set in the directive: mod_cluster.network.tcp_port_local [23456].
Possible Issue
Recommended Action
SC in cluster is not
Check that all Nodes have the same SC version installed (both modcluster and
working
SCD)
SCD cannot be
Check the mod_cluster.network.unix_socket_permissions (octal) [0600] and
contacted
change the permissions and perform scd.sh restart.
No connection can
Check the mod_cluster.allowed_hosts, and make sure it includes the Node IP of
be made between
the calling SC daemon.
SCD's
SCDs are not
All the appropriate ports must be open at the appropriate levels of the cluster
communicating
network in order for the cluster to operate properly. Firewalls in particular can
block essential ports so that the SCD's will not be able to communicate with
one another. The local firewall (on the machine itself) needs to be opened for at
least 2 of the 3 used ports (the messenger's TCP port is less essential, but
recommended). Any firewall that sits between any 2 SCDs must be configured
so that the appropriate ports are open or the SCD's will not be able to
communicate.
Logs show that
check HD space available, quota, and the following directive:
sessions cannot be
mod_cluster.storage.save_path - it might be full or without permissions for the
written to the
SCD daemon running under: System user / Apache user. This might be solved
disk.
by running as root, or giving another location for the Sessions [for instance
/tmp/zend_sessions/].
No backup was
Check if the broadcast is being received in one of the other nodes.
found for HA mode
sessions
Accelerator
Possible Issue
Recommended Action
Received Error Message: Cannot
The connection to the monitoring reporting process was
communicate with reporting daemon.
broken. This happens when daemon process is either
Reporting disabled. Please restart httpd
dead or can not timely respond to events sent to it
to re-enable reporting.
(either stuck or overloaded).
Immediate work-around would be to, restart Apache,
that will launch a new copy of reporting process. Also
examine logs for the evidence of reporting process
logging any errors or crashing.
315
Zend Platform User Guide
The Communication Tunnel
The Communication Tunnel includes settings in Zend Platform and Zend Studio. The following lists the
possible causes and solutions depending on the origin of the problem.
Troubleshooting Studio
If Studio is unable to connect to the target server, you will get an error message with the response
from the server. The table below describes the most likely causes and recommended actions for
successfully establishing a connection with the target server.
Possible Issue
Recommended Action
The server address or the
Enter the correct server information in the Tunneling Settings dialog.
port you entered is
incorrect.
HTTP authentication is
Enter authentication information in the Tunneling Settings dialog box;
required.
then click the 'Send authentication information' checkbox.
The dummy file content or
The dummy file on the server side was changed or does not exist. You
location on the server is
will need to insure that the correct dummy file with the correct content
incorrect.
is placed in the correct directory on the target server (The correct
dummy file is created and located properly as part of the Installation
procedure. The problem here is post-installation).
You are not allowed to
You must have tunneling permissions in the Zend Platform Allowed
connect with the server
Hosts Studio Server | Settings.
via the Communication
Tunnel.
Troubleshooting Platform
If Platform is unable to communicate, there are a number of possible reasons. The table below
describes the likely reasons and suggests possible solutions.
Possible Issue
Recommended Action
Zend Studio is not running.
Run Studio.
The version of Zend Studio you are
Please install a newer version, if available. Platform’s
using is lower than 4.0.0.
interface with Studio requires Studio 4.0 (or higher).
Port for auto detection not the same
Check that Studio is listening to the same port as the one to
which you are trying to connect.
Some other failure happened in the
Use manual settings and if that doesn't work contact Zend
browser or in the Zend Studio
Support
316
Zend Platform
Appendix B - Event Aggregation Mechanism
This appendix covers the event aggregation mechanism in the Central Server. It will try to answer the
fundamental question: "When are two events considered to be of the same origin (or cause) and
therefore reported as one?"
Event properties
To answer this question we first have to define the different properties (or attributes) that define an
event. Here is a list of the attributes that are used for aggregation along with a short definition:
Event type - the type of the error that triggered the event (PHP error, Function error etc').
Perhaps the most important property since it also determines which other properties will be
compared.
Source file, Line number - the name of the PHP file and the line that contains the code that
triggered the event. This file may not be the file that the user requested. Not all events have
code location - e.g., "slow script" events and other events related to the whole script do not.
Function name - the name of the function that contains the code that triggered the event. If
the event happened in the global scope it's reported in the 'main' function.
Location - one of two: either the server id of the server that triggered the event or the group
id if the server belonging to an aggregated group.
Aggregation Hint - this is a string that is supplied by the user to differentiate between pages
that have the same URL but different parameters. If the user did not supply a hint the default
hint is an empty string (The limit for Aggregation hints is 255 chars, longer hints will not be
aggregated).
Error text - the error text that was attached to the event.
Script id - refers to the record for the script that the user requested (i.e., derived from
original request URL).
Severity - the severity of the event - currently, has two levels - regular and severe.
Another property that is taken into account is the event status. Only events that are not closed are
aggregated.
Events are not aggregated when they are one of the following:
Events of different types.
Events that happened on different non-aggregated servers.
Events with different aggregation hints.
Events with different severity.
317
Zend Platform User Guide
Zend Error Events
The following properties must be equal for events that are of type "zenderror":
1.
Type (note: this is a Zend error type, like E_WARNING, not monitor error type)
2.
Source file
3.
Line number
4.
Function name
5.
Location
6.
Aggregation hint
The Error text attribute must be 75% similar. (To learn more about text similarity read
http://uk.php.net/manual/en/function.similar-text.php)
Function Error Events
The following properties must be equal for events that are of type "funcerror" or "dberror":
1.
Source file
2.
Line number
3.
Function name
4.
Location
5.
Aggregation hint
If one of the events has an Error text attribute than the Error texts must be the same (not similar!).
Long Function Events
The following properties must be equal for events that are of type "longfunction" or "longquery":
1.
Script id
2.
Source file
3.
Line number
4.
Function name
5.
Location
6.
Aggregation hint
7.
Severity
Custom Events
The following properties must be equal for custom events:
1.
Type (this is the first parameter user provides)
2.
Severity
3.
Event text
4.
Source file
5.
Line number
Additional Events
The rest of the events are aggregated according to following attributes if two conditions are met:
1.
The event type is one of the following: "devmem", "memsize", "devscript", "outsize" or
"longscript".
2.
The event has a script id attribute
For these events the following attributes must be equal:
318
1.
Type
2.
Script id
3.
Location
4.
Severity
Zend Platform
Appendix C - Zend Platform Support
Platform Support provides Product owners and prospective Product owners with information
regarding: System Requirements, Installation Instructions, General FAQ, Quick Start Guide and much
more.
Visit: http://www.zend.com/support/support_platform.php
Zend Support Center
The Zend Support Center is your online destination for information and assistance for Zend's best-ofbreed PHP products and technologies:
Knowledge Base
Support FAQ
Submit a Support Ticket
Visit: http://www.zend.com/en/support-center/
319
Zend Platform User Guide
Appendix D - Network Port Requirements
Platform utilizes several network ports for regular component operation. The Platform installer
automatically defines these ports based on default settings that are located in the zend.ini.
To change the port settings, open the zend.ini and locate the port number (ports are assigned a
specific directive).
The following table lists the ports by component and zend.ini directive.
Component
Directive
Port
Description
Number
Session
mod_cluster.network.tcp_port_remote
34567
Clustering
Data communication
between nodes.
mod_cluster.network.tcp_port_local
23456
(UNIX, LINUX and MAC only)
Internal data
communication (scd and
mod_cluster), when NOT
using UNIX sockets (the
default on UNIX is to use
UNIX sockets)
Job Queue
mod_cluster.message_server_port
10002
Messaging service
mod_cluster.ha.udp_port
45678
HA broadcast (UDP)
zend_jq.port
10003
Incoming connections for
data communication, tcp.
zend_jq.message_server_port
10004
Incoming connections for
messaging service, tcp.
Monitoring
zend_monitor.collector_port
10010
Incoming/outgoing traffic.
On Central allow incoming
traffic from nodes to port
10010, tcp.
On Nodes allow outgoing
traffic to central, tcp, port
10010.
Debugger
The port number is controlled by the
10000
Studio Client preferences.
Direct connections without
Tunneling.
Allow outgoing connections
from the debug server to
the <studio client IP>, port
10000, tcp.
Note: may require an
available outbound tcp
connection to the internet.
zend_debugger.tunnel_min_port (default
1024-
Connections using
1024) zend_debugger.tunnel_max_port
65535
Tunneling.
(default 65535)
Allow connections from
(UNIX, LINUX and MAC only)
node to "tunnel server"
(specify "return host" in
Studio tunneling settings),
320
Zend Platform
Component
Directive
Port
Description
Number
to "tcp port range" where a
"tcp port range" is defined.
General Comments
The Firewall should be set to not drop idle connections between the nodes/central (internal in
the cluster).
All nodes/central servers should allow connections to themselves (accept connections to
127.0.0.1).
321
Index
#
authentication ....................................... 159
# of Requested...................................... 199
Authentication Information ..................... 159
# of Served........................................... 199
Auto detect ........................................... 165
A
Auto Detection Port........................... 26, 157
Absolute ...................................... 65, 67, 74
Auto-detect............................................. 26
accelerated .................................... 118, 127
Automatically Connect on Startup ............ 159
acceleration ...................................127, 138
Auto-refresh ........................................... 26
Acceleration Blacklist.............................. 138
average.................................................. 67
Acceleration Blacklist Files....................... 127
Average Time in Queue .......................... 199
Accelerator Memory ............................... 114
Average Waiting Time ............................ 199
Accelerator Performance Tuning Level ...... 149
B
Action..................................................... 85
Backtrace ............................................. 89
Action Rule parameters............................. 85
bandwidth ..................................... 145, 216
Action Types ........................................... 85
Bar graphs.............................................. 55
Actions Rules........................................... 85
Benchmark ........................................... 144
Add Jobs ............................................... 199
Blacklist ........................................ 118, 138
Add/Edit Users......................................... 30
Blacklisted ............................................ 127
additional performance ....................... 182
bottlenecks ........................................65, 71
Additional Rules ............................ 67, 68, 76
Bridge .................................................. 223
admin..................................................... 34
Broadcasting Port .................................. 159
Aggregate Hint...................................... 89
C
Aggregate Hints ..................................... 101
Cache .................................................. 127
Aggregate servers.................................... 53
Cache Cleaner ....................................... 134
Aggregation ............................................ 79
Cache Lifetime ...................................... 134
Aggregation Rules................................. 89
Cached................................... 114, 118, 127
Alert Rule................................................ 65
cached files.................................... 118, 127
Alert Rule event types .............................. 65
Caching ................................................ 134
Alert Rules ........................................ 24, 81
caching conditions .......................... 127, 134
Alert Window .................................. 47, 57
Cancel.................................................. 127
Alerts .................................................... 57
Central.................................................. 23
All .......................................................... 53
central machine....................................... 34
All Files...................................114, 118, 127
central registration .................................. 34
ALLGET................................................. 134
Change and Define Virtual Hosts.............. 133
allowed................................................... 28
Change Event Report Information ............ 100
Allowed Hosts........................................ 154
Change Server ............................. 8, 40, 149
Allowed Hosts for Tunneling .................... 154
Choosing and Defining Alert Rules ............. 65
ALLSESSION ......................................... 134
Clean ................................................... 127
Always.................................................. 154
Client ..............................154, 156, 157, 165
Always Report Errors ................................ 68
Client Debug Port .................................. 159
Analyze Site ................................... 143, 146
Client IP ............................................... 159
Apache ................................................... 76
Client Side Caching ................................ 104
Apache Server MaxClients ....................... 114
Client-side caching................................. 120
API............................................ 65, 79, 101
Clone ................................................... 171
Array.................................................... 134
Clone Configurations .............................. 171
audit trail .............................................. 89
Clone Settings....................................... 171
323
Zend Platform User Guide
Clone Wizard ....................................24, 171
Custom Event ......................................... 65
Close Event ....................................... 60, 89
Custom events ...................................79, 89
Close Selected....................................... 57
D
Cluster Name ........................................ 186
daemon................................................ 223
Code Acceleration ....................106, 114, 144
Dashboard .............................................. 26
Code Acceleration Enabled ...................... 114
data..................................................... 114
Code Acceleration Settings ...................... 114
Database ...........................................53, 76
communication ............................... 157, 165
database cleanup.................................. 57
communication tunnel ..............156, 157, 159
Database Error ...................................65, 75
Completed Jobs ..................................... 199
database function errors........................... 75
compressed.................................... 118, 127
Database Maintenance ............................. 60
compression............................118, 127, 138
Database selection errors ......................... 75
Compression Blacklist ............................. 138
databases ............................................... 75
Compression Blacklist Files...................... 127
Deactivate compression.......................... 118
Compression Test ............ 113, 143, 144, 146
debug ........................................... 156, 157
Compression Test results ........................ 146
Debug Mode.......................................... 159
concurrent jobs............................... 145, 216
Debug Preferences................................. 159
Concurrent Requests ....................... 145, 216
Debug Studio Port ................................. 165
configuration .................................23, 167
Debug URL............................................ 89
Configuration and Management Tools ......... 24
Debugger................................89, 154, 159
configuration settings ............................... 24
Debugger Server URL............................. 159
configurations........................................ 127
Default Cache Lifetime .................... 114, 134
configure ........................................ 23, 24
default configurations .......................... 81
Configure Alert Rules..................... 24, 47, 81
Default Dynamic Caching Conditions ........ 114
Configure communication........................ 157
define .................................................... 24
configure groups ...................................... 24
Define Action Types ................................. 85
Configure performance ........................... 114
Define Action Types/ Rules ....................... 24
Configure PHP Settings ............................. 24
Define Alert Rules................................. 81
Configure Preferences for Tunneling ......... 157
Define Cache......................................... 127
configure security settings ........................ 83
Define Caching Settings.......................... 127
Configuring Zend Studio Client Tunneling
delayed write...................................... 182
Settings ............................................. 159
Delete Event ......................................60, 89
Confirm Password .................................... 30
Delete Selected..................................... 57
Connection errors .................................... 75
Denied Hosts ........................................ 154
Console ............................. 23, 24, 106, 113
deny tunneling ...................................... 154
Content ................................................ 134
diagnostic ............................................. 89
Content Caching .................................... 144
directives.............................................. 167
Context .................................................. 83
Disable an Action Rule.............................. 85
Cookie ....................................134, 144, 157
disable monitoring ................................... 97
CPU........................................................ 67
Dismatch .............................................. 134
CPU Load............................................... 89
distribute configurations ........................... 24
create a New Group ................................. 32
Do not Cache ........................................ 127
critical situations...................................... 78
do not monitor ........................................ 97
Current Blacklisted Files.......................... 138
document root ...................................... 127
Current Existing Users .............................. 28
Download ...................................... 145, 216
Current Jobs.......................................... 199
Download Server ............................ 145, 216
Current Settings .................................... 133
Download tab................................. 145, 216
Custom................................................. 149
Download Test ........................ 113, 145, 216
324
Index
Dummy File........................................... 159
File View........................................ 106, 127
Duration ............................................... 144
Filter ...................................................... 25
Dynamic ............................................... 134
Filtering.............................................53, 57
Dynamic Caching Enabled ................ 114, 134
Filtering Alert Rules.............................. 81
Dynamic Content Caching 106, 114, 118, 134,
Filtering Table Data.................................. 53
144
Fine Tune Caching Conditions.................. 127
Dynamic Content Caching Settings........... 114
firewall ................................................. 157
E
Full Filepath Identification....................... 114
edit ........................................... 26, 28, 156
Full Page Content Caching ...................... 134
Editing a User.......................................... 30
function.................................................. 76
Editing Groups......................................... 32
Function Data ....................................... 89
Editing Users ........................................... 30
Function Error ......................................... 65
e-mail ............................ 24, 26, 85, 89, 143
function errors ...................................70, 75
Email Report ........................................... 85
Function Execution................................... 71
Encrypt Communications using SSL.......... 159
Function Usage........................................ 79
End User................................................. 53
functions ................................................ 70
Enhanced.............................................. 149
G
Environment.......................................... 223
General database function errors ............... 75
Error Description................................... 89
Get ........................................ 134, 144, 157
error-reporting criteria.............................. 68
Getting Support......................................... 7
Errors ..................................................... 68
Global Events ........................................ 101
establish ............................................... 156
global settings .................................23, 26
establish a communication tunnel ............ 157
global variable....................................... 101
Event ....................68, 70, 71, 74, 76, 77, 78
graphical representatio ........................ 47
Event Context.......................................... 83
graphical representation .................47, 55
Event Data ............................................ 89
Graphs ..............................................24, 47
Event List.......................................... 26, 57
Gray ...................................................... 25
Event Name ............................................ 53
Green..................................................... 25
Event Occurrence Info .......................... 89
Group ......................................... 25, 28, 53
Event Report .........................24, 85, 89, 100
Group Name ........................................... 28
Event Reports.................................... 85, 89
groups .................................................. 23
Event Summary............................... 47, 53
GUI........................................................ 34
Event Summary table ............................... 53
gzip ..................................................... 118
Event Type ...................................... 57, 81
H
Event Types .......................................... 81
Handle Groups ........................................ 28
events .......................53, 57, 75, 78, 83, 101
Hard errors ............................................. 68
Events From .................................... 57, 81
health ..............................................23, 78
Excess Memory........................................ 74
Host....................................................... 53
Excess Memory Usage ........................ 65, 74
host machine ........................................ 165
exclude files from being monitored............. 97
HTTP Authentication........................ 144, 159
expandable lists..................................... 167
HTTP headers........................................ 170
expire..................................................... 26
HTTP Server.......................................... 127
extensions ............................................ 114
I
Extreme................................................ 149
IDE ...................................................... 156
F
Ignore Event ......................................60, 89
failure recovery................................... 182
Ignore Selected .................................... 57
File Compression.............. 106, 114, 118, 144
Included Files ....................................... 89
File Settings .......................................... 127
Inconsistent Output Size .....................65, 77
325
Zend Platform User Guide
information ...............................................7
Never................................................... 154
Integration ....................................89, 157
New Group ............................................. 32
investigating ......................................... 89
New Users .............................................. 30
IP .................................... 26, 154, 156, 165
node ............................... 23, 106, 114, 154
J
None............................................. 114, 118
Java Bridge ......................................25, 223
Normal ................................................. 149
Java Environment .................................. 223
Notices................................................... 68
Java Home ............................................ 223
Number of alerts ..................................... 26
Java Status ........................................... 223
O
Java Vendor .......................................... 223
on demand .................................... 156, 165
Java Version.......................................... 223
On Demand Connection .......................... 165
Job-Queue........................................... 194
On-Demand .......................................... 156
Jobs .................................................... 194
On-Demand Communication ................... 156
K
Only Cached Files ........................... 114, 118
Knowledge Base.................................. 242
Operating System.................................... 25
L
operator ................................................. 68
Last Download ................................ 145, 216
Optimizer ............................................... 25
licenses .................................................. 26
Orange................................................... 25
Load Average .................................... 65, 78
OS Name.............................................. 223
load balancer......................................... 157
OS Version .................................... 170, 223
locking ................................................ 182
output site .............................................. 53
Log ...................................................... 114
Output Size............................................. 65
Log File................................................. 114
P
login....................................................... 28
parameters ...................................... 83, 157
M
Partial Page Content Caching .................. 134
Manage Cluster........................................ 24
passing .................................................. 26
management ................................... 23, 28
Password ............................ 30, 34, 159, 167
Manual Override ...................................... 60
Password Administration........................... 34
Match ................................................... 134
Password Specifications............................ 34
Max Clients .................................... 145, 216
Password Structure.................................. 34
MaxClients ............................................ 114
Performance .... 106, 113, 127, 143, 144, 146,
Maximum Accelerated Files ..................... 114
194
Maximum Cache Size ...................... 114, 134
performance configurations.............. 106, 127
Maximum Cached File Size ............... 114, 134
Performance Console ............................. 113
Memory .................................................. 74
Performance Lifecycle .......................... 81
Memory Reclaim Threshold ..................... 114
Performance Monitoring Event........ 67, 71, 74
Method ................................................... 26
Performance Test ........................... 113, 146
Minimum File Size .................................. 114
Performance Test results ........................ 146
Minimum Free Disk space........................ 134
Performance Tuning ............................... 149
Minimum Free Diskspace ........................ 114
Permission Group .................................... 28
Modified File Detection............................ 114
permissions .......................................30, 32
Monitor............................................. 78, 81
Permissions Group ................................... 30
monitor_set_aggregation_hint ................. 101
PHP ................................................ 53, 167
Monitoring ................................. 26, 47, 114
PHP Certification ................................ 242
multiple users.......................................... 28
PHP compilation .................................... 170
N
PHP environment ................................... 170
N/A Test Results .................................... 146
PHP Error ..........................................65, 68
Net Mask .............................................. 154
PHP events ............................................. 53
326
Index
PHP function............................................ 71
Rules ...............................................81, 85
PHP Info ............................................... 170
S
PHP Intelligence ................................... 47
Save .................................................... 127
PHP Manual......................................... 242
scheduling .......................................... 194
PHP Section........................................... 167
script ................................................... 144
PHP Settings ....................................24, 167
scripts ...............................................74, 79
PHP Version ............................................ 25
Security ............................................83, 89
PHP Yellow Pages ............................... 242
Selective .............................................. 154
php.ini.................................................. 167
Send a report via e-mail ........................... 85
Pie ......................................................... 55
sending the information............................ 85
Pop-up Blocker .................................... 8, 40
Server....................................... 25, 53, 134
Port........................................156, 159, 165
Server Address........................................ 25
Preferences........................................... 23
Server by name....................................... 53
Preserve Event...................................... 89
Server Name......................................25, 53
Preserve Selected ................................. 57
Server Response Timeout ....................... 159
Previous Test Results ............................. 146
Server Status...................................23, 25
processes................................... 67, 78, 194
servers ................................................. 23
Product directives .................................. 167
SESSION ....................................... 134, 144
Production .............................................. 70
Session Clustering .............................. 182
profile .................................... 89, 156, 157
Session Clustering Statistics ................... 186
Profile URL ............................................ 89
session data ....................................... 182
Q
Session Size.......................................... 186
QA ................................................... 68, 70
Sessions ............................................. 182
Quantity (Qty.) of Saves ......................... 186
settings .............. 24, 106, 114, 154, 194, 199
Quantity (Qty.) of Sessions ..................... 186
severe event ........................................... 70
Query Execution ................................ 65, 76
severe problems ...................................... 24
Queue .................................................. 199
Severity ................................................ 57
Queues................................................ 194
Severity Level ....................................... 89
Quick Clone........................................... 106
shortcuts .............................................. 23
R
Show Source Code ................................ 89
Red ........................................................ 25
silence operator....................................... 68
Refresh................................................. 223
silenced.................................................. 68
regexp.................................................. 134
simulation...................................... 145, 216
registration ............................................. 34
Site Analysis ......................................... 146
Regular Expression................................. 134
Site Analysis Report ............................... 146
Regular Expressions Format .................... 134
slow function........................................... 67
Relative ............................................ 65, 74
Slow Function Execution ......................65, 71
Relative Events.................................. 74, 77
slow queries............................................ 65
Remove .................................................. 28
Slow Query ............................................. 76
Reopen Event ........................................ 89
Slow Query Execution ................... 65, 71, 76
Reopen Selected ................................... 57
Slow Script Execution............................... 67
reports ................................................. 114
Slow Script Execution Absolute.................. 65
REQUEST .............................................. 134
Slow Script Execution Relative................... 65
Requested URL...................................... 89
solve problems .......................................... 7
resolving events.................................... 89
source code .......................................... 89
Restart ................................................. 223
Source Info........................................... 89
Restore Defaults .................................... 127
Specify Return Host ............................... 159
rule-based notification .............................. 85
SSL...................................................... 159
327
Zend Platform User Guide
SSL encryption ...................................... 159
un-zipped ............................................. 118
Standalone Central................................... 26
update ................................................. 133
Start .................................................... 223
Update Blacklists ................................... 127
Statistics.................................186, 199, 223
Update the Blacklist ............................... 138
Status ..................................25, 57, 89, 223
Update Virtual Hosts List ........................ 133
Status indicator ....................................... 25
URL ............................ 24, 85, 144, 145, 216
Stop ..................................................... 223
Useful Links ............................................ 24
Structure ................................................ 34
User....................................................... 28
Studio .................................................. 156
User Forums ............................................. 7
Studio Client ...........................154, 156, 159
User Management...................... 23, 28, 32
Studio Client Tunneling........................... 159
User Name....................................... 30, 159
Studio Server ........................................ 154
users ...............................................23, 30
Studio Server parameters ..................26, 157
V
Studio Server Settings............................ 154
variable matches ................................... 134
Submit a report to a Specified URL............. 85
Variables ........................ 89, 100, 134, 144
Support ....................................................7
variables data ....................................... 100
Support Center .................................. 7, 242
vhost .................................................... 89
Support Ticket ......................................... 24
View Tree By field.................................. 171
Support Tool ....................................... 7, 24
Virtual Host ................................... 57, 133
supported databases ................................ 76
Virtual Hosts ......................................... 127
Suppress ................................................ 67
Virtual Hosts List ................................... 127
Suspend ............................................... 199
W
synchronizing session data ................. 182
Warnings ................................................ 68
system health.................................... 24, 26
Watched Functions................................... 70
System Health Overview ........................... 24
Web application..................................... 144
system information ............................... 23
Web Cluster ........................................ 182
System Passwords ................................... 34
Web Server............................................. 25
T
wildcards .............................................. 154
table ...................................................... 53
write through ..................................... 182
Test ..........................26, 144, 145, 157, 216
X
Test Download.........................143, 145, 216
XML ...................................................... 89
Test functions........................................ 113
XML data ................................................ 85
Test Report ....................................145, 216
XML Report ............................................. 85
Test Results .................... 144, 145, 146, 216
Y
Test URL ................................ 89, 143, 144
Yellow Pages ...................................... 242
Testing .................... 106, 143, 145, 146, 216
Z
Time Filter ............................................ 57
ZDS .............................................. 145, 216
Title ...................................................... 89
Zend Central ......................................... 23
Tool .........................................................7
Zend Debug Port ..................................... 26
Top Alerts ............................................... 24
Zend Dev Zone.................................... 242
Tree View ............................................. 127
Zend Download Server ............. 106, 114, 143
Tuning .................................................. 149
Zend Engine ........................................... 25
Tunnel Target Host................................. 159
Zend Error ............................................ 89
Tunnel Target Port ................................. 159
Zend Forums....................................... 242
Tunneling........................ 154, 156, 157, 159
Zend Framework................................. 242
U
Zend Monitor ........................................ 81
Undo .................................................... 127
Zend password........................................ 26
Ungrouped .............................................. 53
Zend Platform ......................................... 24
328
Index
Zend Platform Settings ........................... 165
Zend Studio Client ............. 26, 156, 159, 165
Zend Product directives .......................... 167
Zend Studio IDE .................................... 157
Zend products ................................. 23, 25
Zend Studio Integration ......................... 157
ZEND Section ........................................ 167
Zend Technical Support ............................ 24
Zend Store.............................................. 24
zend.ini ................................................ 167
Zend Studio....................................89, 159
329