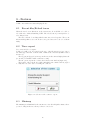
1
ViTE - Visual Trace Explorer
September 7, 2010
User Manual
Release 1.2
1
Contents
1 Licence of ViTE
4
2 Overview
2.1 What is ViTE? . . . . . . . . . . . . . . . . . . . . . . . . . . . . . .
2.2 ViTE: As Easy As... . . . . . . . . . . . . . . . . . . . . . . . . . . .
5
5
5
3 Introduction
6
4 How to use
4.1 First use . . . . . . . . .
4.1.1 Launching ViTE
4.1.2 Open a file . . .
4.1.3 Navigation under
. . . . . .
. . . . . .
. . . . . .
the trace
5 Installation
5.1 Direct installation from packages
5.2 Compilation . . . . . . . . . . . .
5.2.1 Using CMake . . . . . . .
5.2.2 Using the configure script
.
.
.
.
.
.
.
.
.
.
.
.
.
.
.
.
.
.
.
.
.
.
.
.
.
.
.
.
.
.
.
.
.
.
.
.
.
.
.
.
.
.
.
.
.
.
.
.
.
.
.
.
.
.
.
.
.
.
.
.
.
.
.
.
.
.
.
.
.
.
.
.
.
.
.
.
.
.
.
.
8
8
8
9
9
.
.
.
.
.
.
.
.
.
.
.
.
.
.
.
.
.
.
.
.
.
.
.
.
.
.
.
.
.
.
.
.
.
.
.
.
.
.
.
.
.
.
.
.
.
.
.
.
.
.
.
.
.
.
.
.
.
.
.
.
.
.
.
.
.
.
.
.
.
.
.
.
.
.
.
.
10
10
10
10
12
6 Generate traces
7 Supported formats
7.1 Paj´e . . . . . . .
7.2 Paj´e extented . .
7.3 OTF . . . . . . .
7.4 TAU . . . . . . .
13
.
.
.
.
.
.
.
.
.
.
.
.
.
.
.
.
.
.
.
.
.
.
.
.
.
.
.
.
.
.
.
.
.
.
.
.
.
.
.
.
.
.
.
.
.
.
.
.
.
.
.
.
.
.
.
.
.
.
.
.
.
.
.
.
.
.
.
.
.
.
.
.
.
.
.
.
.
.
.
.
.
.
.
.
.
.
.
.
.
.
.
.
.
.
.
.
.
.
.
.
14
14
14
14
15
8 Features
8.1 Recent files/Reload traces
8.2 Trace export . . . . . . .
8.3 Minimap . . . . . . . . . .
8.4 Preferences menu . . . . .
8.4.1 The settings . . . .
8.4.2 The plugins . . . .
8.4.3 Other options . . .
.
.
.
.
.
.
.
.
.
.
.
.
.
.
.
.
.
.
.
.
.
.
.
.
.
.
.
.
.
.
.
.
.
.
.
.
.
.
.
.
.
.
.
.
.
.
.
.
.
.
.
.
.
.
.
.
.
.
.
.
.
.
.
.
.
.
.
.
.
.
.
.
.
.
.
.
.
.
.
.
.
.
.
.
.
.
.
.
.
.
.
.
.
.
.
.
.
.
.
.
.
.
.
.
.
.
.
.
.
.
.
.
.
.
.
.
.
.
.
.
.
.
.
.
.
.
.
.
.
.
.
.
.
.
.
.
.
.
.
.
.
.
.
.
.
.
.
.
.
.
.
.
.
.
.
.
.
.
.
.
.
.
.
.
.
.
.
.
16
16
16
16
17
17
17
17
9 Shortcuts
9.1 Launching by command line . . . . . . . . . . . . . . . . . . . . . . .
9.2 In the graphical interface . . . . . . . . . . . . . . . . . . . . . . . .
18
18
19
.
.
.
.
.
.
.
.
.
.
.
.
.
.
.
.
2
10 Plugins
10.1 Statistic plugin . . . . . . . . . . . . . . . . . . . . . . . . . . . . . .
10.2 Distribution . . . . . . . . . . . . . . . . . . . . . . . . . . . . . . . .
20
20
20
11 Authors
22
12 FAQ
23
3
1 - Licence of ViTE
ViTE is under the licence CeCILL-A.
This software is governed by the CeCILL-A license under French law and abiding
by the rules of distribution of free software. You can use, modify and/or redistribute
the software under the terms of the CeCILL-A license as circulated by CEA, CNRS
and INRIA at the following URL: http://www.cecill.info.
As a counterpart to the access to the source code and rights to copy, modify and
redistribute granted by the license, users are provided only with a limited warranty
and the software’s author, the holder of the economic rights, and the successive
licensors have only limited liability.
In this respect, the user’s attention is drawn to the risks associated with loading,
using, modifying and/or developing or reproducing the software by the user in light
of its specific status of free software, that may mean that it is complicated to
manipulate, and that also therefore means that it is reserved for developers and
experienced professionals having in-depth computer knowledge. Users are therefore
encouraged to load and test the software’s suitability as regards their requirements
in conditions enabling the security of their systems and/or data to be ensured and,
more generally, to use and operate it in the same conditions as regards security.
The fact that you are presently reading this means that you have had knowledge
of the CeCILL-A license and that you accept its terms.
4
2 - Overview
2.1
What is ViTE?
ViTE is a powerful, portable and open-source profiling tool designed to visualize traces produced by parallel applications.
It allows to open several and common trace formats (OTF, TAU, Paj´e , etc.),
browse, export, filter, retrieve information and draw graphical statistics from
these trace files.
These traces can be generated using Eztrace or GTG. (cf chapter 6 p.13)
2.2
ViTE: As Easy As...
Open
Close
Zoom
Horizontal Scrolling
5
3 - Introduction
With the ever increasing dissemination of multi-core architectures, parallel and/or
distributed applications are becoming the norm, so as to use computer resources
as efficiently as possible. Trace collection and visualization is useful for developers
willing to debug and monitor the performance of their parallel applications. Yet,
most existing trace visualization tools are proprietary or cannot handle large trace
files.
ViTE is a powerful, portable and open-source profiling tool which visualizes
the traces produced by parallel applications. Thanks to its scalable design, ViTE
efficiently helps programmers to analyze the performance of potentially large applications running on many nodes, cores and communicating processes.
ViTE allows one to visualize traces written in the Paj´e open format (see
http://www-id.imag.fr/Logiciels/paje/) and the OTF. Its features include the
ability to export views in the SVG format, so as to integrate them easily into reports,
and the production of statistics.
The aim of ViTE is to have a free and open software able to display different
traces format with a user-friendly interface. That is why it is under Cecill-A licence
(you can see the content on chapter 1).
More information are available on the official website of
ViTE : http://vite.gforge.inria.fr/,
or on the forge itself : http://gforge.inria.fr/projects/vite/.
This document is a start guide for understanding how to use ViTE .
The figures 3.1a and 3.1b are examples of a trace you can watch with ViTE .
6
(a) Example of a trace on linux (ubuntu 8.04)
(b) Example of a trace on windows XP
Figure 3.1: Example of traces
7
4 - How to use
Software/Libraries requirements ViTE uses the Qt library for its graphic
window and OpenGL library for the trace graphic render. You need to have the
following version at least to run ViTE :
• Qt 4.4 or greater.
• opengl 1.5 or greater.
A list of operating system (not exhaustive) where ViTE runs :
• Ubuntu 8.04, 8.10, 9.04.
• MacOS X.
• Windows XP/Vista.
It also run in a lot of Linux systems like Mandriva, Fedora...
4.1
4.1.1
First use
Launching ViTE
After getting ViTE (by compiling or executables), you can go to the vite directory.
The executable is in bin/vite if you have just compiled from the source directory
with configure or src/vite with cmake.
When you launch ViTE without any options (these will be described in the
section 9), you will have a window like the one in the figure 4.1 :
Figure 4.1: Launching of Vite
8
4.1.2
Open a file
Go to the File menu and click on Open. A dialog box will appear and you will have
to choose the file you want to open.
After choosing it, you must click on Open to open the file or Cancel if you do
not want to open the selected file.
The other option to open a trace is to use drag and drop. Select your trace in
a file manager and drop it on the ViTE window.
Moreover, a recent file list has been done in order to easily open the recent
traces. It keeps in memory the last ten traces opened.
You can also reload the current trace. This is useful when you visualize a trace,
do some modifications on the file and do not want to launch ViTE again.
If you try to open a file which is not recognised by ViTE , error messages will
be displayed.
4.1.3
Navigation under the trace
You can change the position and the scale by moving the horizontal and vertical
scroll bars.
You can also zoom in or out by clicking in the zoom button. You can select an
area with the mouse to zoom in. You can also directly set a zoom level by selecting
a zoom level in the bottom right. It is also possible to select an area to zoom by
clicking, and keeping the clic while moving, the zoom will be in the rectangle defined
by the beginning and the end of the clic. The use of the right clic undo the previous
zoom.
You can go to the beginning or the end of the trace by clicking on the left and
rigth arrow button and view the whole trace by clicking on the Show all button.
You can see the trace in fullscreen going on the View menu and picking fullscreen.
Moreover, it is possible to hide the links and/or the events using the No arrow
and No Event buttons of the toolbar. An other option is to get informations about
an event, a state, a communication in the trace by clicking over this element on the
screen. If a lot of elements are grouped, you may be forced to zoom to be able to
get the right information about the element.
9
5 - Installation
5.1
Direct installation from packages
ViTE can be downloaded from its website : http://vite.gforge.inria.fr/. Go
into the download section where you will find the different packages (for Linux,
Windows...) and its sources. If you want to compile the source code, please read
the instructions on the paragraph 5.2.
Quick install for Debian/Ubuntu users: Since ViTE is already available
on Debian repository, you can install it with the following:
$ apt-get install vite
or
$ aptitude install vite
The available version for these packages is the 1.1. These commands should also
install the needed package.
Otherwise, in order to install ViTE , you need to have the following libraries on
your computer :
• libqt4-dev.
• libqt4-opengl-dev.
5.2
Compilation
The compilation of ViTE can be useful to customize it. ViTE can be compiled
using the cmake software or the configure script provided.
Currently, there are optional features that can be enabled or disabled :
• OTF trace files support ;
• Tau trace files support (experimental) ;
• Spinning rabbit (which is fun 5 minutes but no more).
5.2.1
Using CMake
The first way is to use cmake (http://www.cmake.org/), a portable way to compile.
On Windows system, a GUI is provided in order to compile. The rules to follow
are the same as for Linux. For Linux users, the easiest way is to build a directory
at the root of ViTE sources :
mkdir obj && cd obj
ccmake ..
Then type ’C’ to configure the CMake cache. You will see the windows 5.1. After
that, you can check if the options set are good (additional directories and libraries).
Then, type ’C’ then ’G’ to generate the Makefile. If libraries or directories are not
found, you will get errors warning you to check the paths (like in the figure 5.2).
To finish, type make and it will compile.
For Windows users, the easiest way is to create a visual C++ project if you
have it and compile with it. You can also create create a mingw Makefile, however, the OTF library is only supported with visual c++ compiler so it could not
compile/work with mingw.
10
Figure 5.1: CMake window
Figure 5.2: CMake error
11
5.2.2
Using the configure script
The second way is to use the configure script. It works on Linux and MacOS. Go
to the source directory and type ./configure and then make on the console.
The configure script is useful because on some implementation, in order to compile Qt sources, you have qmake or qmake-qt4. Also, options are available to customise your compilation. See ./configure -h (figure 5.1) for more informations.
For example, if the directory of ViTE is in your home, hit :
cd ~/vite/src && ./configure && make
The binary will be in the bin/ directory under the name of vite.
Listing 5.1: ./configure -h
ViTE c o n f i g u r a t i o n s h e l l −s c r i p t
Usage :
./ configure [ options ]
Options :
−h , −−h e l p
p r i n t t h i s page
−−r e l e a s e
c o m p i l e s i n r e l e a s e mode ( by d e f a u l t )
−−debug
c o m p i l e s i n debug mode
−−e n a b l e s p i n n i n g l o g o
makes t h e r a b b i t t o t u r n when no t r a c e i s l o a d e d
−−e n a b l e o t f
e n a b l e s t h e o t f s u p p o r t (An OTF r e l e a s e i s p r o v i d e d
in the e x t e r n a l s / o t f d i r e c t o r y )
−− o t f d i r=<path>
path t o t h e OTF l i b r a r y
−− o t f i n c d i r=<path>
i n c l u d e path t o t h e OTF h e a d e r s
−− o t f l i b d i r =<path>
l i b r a r y path t o t h e OTF l i b r a r i e s
−−e n a b l e t a u
e n a b l e s t h e tau s u p p o r t
−−t a u d i r=<path>
path t o t h e TAU l i b r a r y
−−t a u i n c d i r=<path>
i n c l u d e path t o t h e TAU h e a d e r s
−−t a u l i b d i r=<path>
l i b r a r y path t o t h e TAU l i b r a r i e s
12
6 - Generate traces
Important : Remember that ViTE does NOT generate traces. To generate traces,
there are various ways, depending on the format. In this section, we are going to
present two easy ways.
Dynamically It is possible to generate traces without modifying the source code
using EzTrace . EzTrace is an INRIA project that enables the creation of traces in
the Paj´e format. For more information on this project, you can visit their website
at http://www.gforge.inria.fr/projects/eztrace.
Intrusive method An other way is to insert functions in your code to generate traces. To easily adapt to ViTE and easily change the generated format, we
recommend you to use the GTG (Generic Trace Generator) library. This library
offers a generic interface to generate traces in various format (only Paj´e is currently
available, OTF is being written, TAU is the next step). There is a C and also a
Fortran interface. For more information on this project, you can visit the project
webpage http://www.gforge.inria.fr/projects/gtg.
13
7 - Supported formats
ViTE can draw traces obtained from four main formats : Paj´e , Paj´e extented,
OTF and TAU.
7.1
Paj´
e
The Paj´e format is the first format supported by ViTE . The main reason is ViTE
was designed to display Paj´e traces. Paj´e [1, 2, 3] is originally an other trace viewer
with its own format. The Paj´e format[4] is a self-explained format including the
declaration of each event, state, communication, . . . present in the trace.
ViTE supports most of the Paj´e features: forest of containers, events, communications, states, variables, color of states. These files are recognize by the .trace
extension.
Warning: for now, ViTE doesn’t support:
• the push/pop function allowing to stack several states to one container,
• several state lines per container,
• color on events and communications
These functionnalities will be included as soon as possible.
7.2
Paj´
e extented
This format is an extension of the Paj´e format to allow the user to have one file per
container instead of only one sorted for the Paj´e format. One main file contains
the definitions item and the name (relative to the directory of the main file, not
absolute) of the extra files. To follow the Paj´e format, you just need to add the
following field to the definition of the PajeCreateContainer event:
FileName string
So each creation of container using a filename different form ’’ will include the
specified file. For example, if there are n MPI processes running, you can make
each process open and fill a different file (filename.rank. The same features as for
the Paj´e format are supported. You can include files in an include file to create the
same tree as your architecture (program, node, thread for example) but FileName
are only supported for PajeCreateContainer event.
To read theis format with ViTE , the main file has to have the .ept extension.
The included ffiles can have any extension you want as soon as their name are
correctly spelled in the first one.
7.3
OTF
OTF or Open Trace Format[5] was developed by TU Dresden. It is a free format
available created to replace VampirTrace and used by Vampir[6]. ViTE does not
bear some OTF features such as snapshots. ViTE only stands states, communications and eventlike actions. Althought some functionnalities are missing, ViTE
generate random colors for the OTF format the first time you open a file because
they are not stored in the file, and you can use the color settings to change for a
better choice of color.
14
7.4
TAU
TAU [7] is the latest format added. ViTE possibilities on this format have not
been fully tested and any bug report is welcome. The basic features are supported:
states, events, communications.
Any bug report or suggestion about what format should be included in ViTE is
welcome and can be posted on ViTE gforge website: https://gforge.inria.fr/projects/vite/.
15
8 - Features
ViTE comes with some features helping the use.
8.1
Recent files/Reload traces
When the user does modifications on the current trace he would like to be able to
reload the trace without launching ViTE . The reload button (or menu) is here to
solve this problem.
The user could also be working with the same traces for a long time. The recent
files menu helps him to store the most recent opened traces in order to load them
fastly.
8.2
Trace export
Go to File and choose export.
A dialog box will open. You can select the type of the file among svg, jpeg, png or
txt. Then type the name of the file with or without the extension (it will be added
if it is not).
The svg, png and jpeg selections export the trace in the current displayed interval
(zoom and/or translation will be taken in account).
The txt option exports the counter chosen in the next windows (figure 8.1).
The format of the text file is readable with third part software such as gnuplot
to easily have use some data concerning the counters.
Figure 8.1: Selection of the counter to export
8.3
Minimap
The minimap is a thumbnail of the current trace view. It is helpful to situate where
you are looking in the trace when you have zoomed a lot.
16
8.4
Preferences menu
This menu contains the settings you can modify to customize ViTE .
8.4.1
The settings
It is where the user can customize its ViTE . You can modify global informations as
for the use of palette for looking the trace. Also there are more specific options for
configuring the palettes, the directories where to look for plugins and informations
about the minimap.
8.4.2
The plugins
Plugins are created by users in order to interact with ViTE . They do not need a
recompilation of ViTE when you want to add one. For now, they are two main
plugins : one giving the distribution and the other one showing some statistics on
the trace. The existing ones are explained in the paragraph 10.
8.4.3
Other options
You can show or hide the information window by choosing Show infos window in
the View menu.
You can hide the warning messages shown in the information window by chosing
No warning in the View menu.
17
9 - Shortcuts
9.1
Launching by command line
There are useful shortcuts for launching ViTE or functionalities of ViTE . For
example, the export of a file in a svg format can be done without launching the
graphical interface, in one line.
Shortcut
Action
Example
-f [file path]
Open a file.1
./vite -f example.trace
-h
Display the help
./vite -h
-a [file path]
Open the file and display ./vite -a example.trace
all of it.
[file path] -t ([start]):([end])
Open the trace file and ./vite file -t [0]:[10]
display it in the interval
(in seconds). 2
-f [path-source] -e [path-dest] export the trace file in the ./vite -f in.trace -e out.svg
svg format.
-f [source] -e [dest] -t export the trace file in the ./vite -f in.trace -e out.svg
([start]):([end])
svg format in the interval -t [1]:
given.
1 The
-f is facultative : ./vite filename works too.
could be no time init or time end : ./vite file -t :[1]
2 There
18
9.2
In the graphical interface
Here is a list of all the shortcuts implemented in ViTE that you can find in the
menu bar :
Shortcut
Action
CTRL+O
Open the open file dialog box.
CTRL+W
Close the file.
CTRL+E
Open the export file dialog box.
CTRL+S
Save the current configuration for the file opened.3
CTRL+Q or ALT+F4
Quit ViTE .
CTRL+SHIFT+A
Show all the trace.
Mouse wheel or + or Horizontal zoom in or out.
CTRL + Mouse wheel or + or Quick horizontal zoom in or out.
ALT + Mouse wheel
Quick vertical zoom in or out.
HOME
Show the start of the trace.
END
Show the end of the trace.
PAGE UP (resp. PAGE DOWN)
Move the visualisation to the left (resp. right).
UP, DOWN, RIGHT, LEFT
Move the trace.
CTRL + UP, DOWN, RIGHT, LEFT
Quickly move the trace.
SELECT AN AREA WITH LEFT Select a square area of the view and display it.
CLIC
RIGHT CLIC
Backup the previous square area selection view.
3 Not
yet implemented
19
10 - Plugins
The plugins are libraries made by users that can be integrated in ViTE to get
information which is not given immediately by the software. It is distributed under
the form of a dynamic library and should be placed in the right directory in order
to be loaded. To set these directory, read the paragraph .
If you want to create plugins, please refer to the technical manual.
Some plugins are integrated directly in ViTE (because there were developed by
developers or other dark reasons) like the statistic one.
The windows is separated by tabs, one for each plugin as you can see in figure
10.3.
10.1
Statistic plugin
Inside it, you can have important informations from the trace file. You can choose
the containers you want (check the box beside the node in order to have all the children of it). Then, you can watch the percentage of each states for these containers
by two ways like in figures 10.1 and 10.2.
Figure 10.1: Vertical diagram
Moreover, you can export them in a svg file.
10.2
Distribution
See figure 10.3.
20
Figure 10.2: Horizontal diagram
Figure 10.3: Distribution plugin
21
11 - Authors
ViTE authors and developers are :
• Kevin COULOMB.
• Mathieu FAVERGE.
• Johnny JAZEIX.
• Olivier LAGRASSE.
• Jule MARCOUEILLE.
• Pascal NOISETTE.
• Arthur REDONDY.
• Cl´ement VUCHENER.
The documentations were also written by them.
We thank Fran¸cois Broquedis for the help for the MacOS compilation.
We thank Samuel Thibault for the time he spends to make the debian package
available.
We thank C´edric Augonnet for making the Distribution plugin.
We thank the rabbit for being.
The website was designed by :
• Olivier LAGRASSE.
• Pascal NOISETTE.
• Cl´ement VUCHENER.
22
12 - FAQ
Question : How can I help improving this beautiful software ?
nswer : ViTE is not perfect yet. Some features that could be implemented are
A
written in the technical manual but it is just a start and a lot of other things
can be done.
Q
uestion : I have some problems when I want to see a trace because
the window glitters ?
Answer : If you use Compiz, you have to disable it while using ViTE .
Q
uestion : Why do I only have a black screen when I try to open a
trace ?
: Are you sure the trace is right ? Some errors of meaning may have
Answer
not been detected in the data structure.
Question : Why does a new window open when I open a trace?
: Make sure you close the current trace before opening the following. Or
Answer
it will open it in another window in order to let the user visualize both traces.
Question : Why can’t I open my svg export?
nswer : The export of a trace in svg format can be more than three times bigger
A
than the trace file. So if the trace you want to export is big the svg reader can
be slow. You can try using another software to open it (inkscape, mozilla, ...) or
convert the svg in a png file (this feature is not include in ViTE ) or export only a
part of the trace.
Q
uestion : While compiling the sources, I have a uic error (too old Qt
Designer version) and/or qformlayout.h can not be found?
: Check your Qt version by ”qmake –version” and be sure that it is at
Answer
least the Qt4.4 one.
Q
uestion : I just installed the rpm package and when I type vite on the
console, it returns me the following error : GLIBCXX 3.4.9 is missing?
: Try to update the package of the lib c++. Else install the software
from the sources (instructions are given in the README in order to help you).
Answer
Q
uestion : I got Qt errors when I compile or launch ViTE like :
/bin/vite: symbol lookup error: /usr/lib/libQtOpenGL.so.4: undefined
symbol : ZN14QWidgetPrivate15checkWindowRoleEv or symbol lookup
error: vite: undefined symbol: ZN9QHashData13detach helperEPFvPNS 4NodeEPvEPFvS1 Ei
23
: It is a Qt problem. Check if your qt version is the same for all Qt
libraries like libQtOpenGL and libQtCore.
Answer
Q
uestion : I am on Windows and I double click on the executable and
an error tell me that a dll is not found?
nswer : If you launch ViTE by the Qt prompt, the path to find dll libraries is
changed and these dll missing are found. A solution is to find (there are on
A
your computer) the dll missing and to copy them in the bin/ folder of ViTE .
Question : Why does not ViTE run well?
Answer : Check if ViTE is runnable on your computer (cf configuration).
24
Bibliography
[1] ID-IMAG. Paje. http://www-id.imag.fr/Logiciels/paje/index.html.
[2] B. de Oliveira Stein J. Chassin de Kergommeaux. Flexible performance visualization of parallel and distributed applications. pages 735–747, 2003.
[3] B. de Oliveira Stein J. Chassin de Kergommeaux. Paj´e: an extensible environment for visualizing multi-threaded programs executions. In Proceedings of
the 6th International EuroPar Conference, LNCS, pages 133–140, Munich, Germany, 2000. Springer.
[4] G. Mouni´e J. Chassin de Kergommeaux, B. de Oliveira Stein. Paje input data
format. Technical report, 2003.
[5] TU Dresden. Open trace format. http://www.paratools.com/otf.php.
[6] Vampir - performance optimization. http://www.vampir.eu/.
[7] University
of
Oregon.
Tuning
and
analysis
http://www.cs.uoregon.edu/research/tau/home.php.
25
utilities.