1
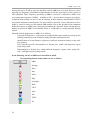
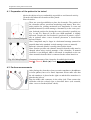
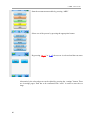
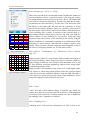
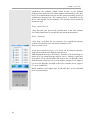
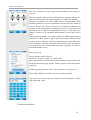
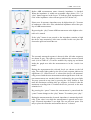
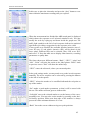
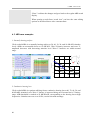
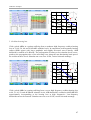
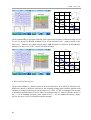
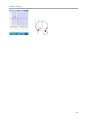
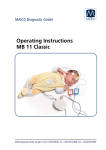
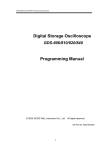
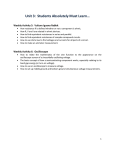
6
ABR – How-to use
Auditory brainstem responses (ABRs) recorded from electrodes placed on the scalp represent
the far field of potentials generated by the fiber tracts and nuclei of the ascending auditory
pathway between the cochlea and the brainstem. The ABR latency epoch consists of up to
seven prominent wave peaks which appear within the first 10 ms. Commonly ABRs are elicited by transient stimuli (click, tone-burst, chirp). ABRs represent the sum of synchronized
neural activity of the ascending auditory pathway. Wave I and II stem from auditory nerve,
wave III from cochlear nucleus, wave IV and V from lateral lemniscus and inferior colliculus
(brain stem), and wave VI and VII from sub-cortical regions. Due to the fact that the velocity
of the traveling wave running into the cochlea is highest in the basal region, click-evoked
ABRs mirror mainly the activity of basal (high-frequency) cochlear regions. This is also true
for low frequency tone-bursts and chirps when high stimulus levels are applied. Wave V has
the highest whereas wave I the lowest amplitude. Wave amplitudes decreases wave latencies
increases with decreasing stimulus level.
ABRs are a common clinical tool in audiology and neurology. Also, ABRs are used for newborn hearing screening when elicited at a distinct screening stimulus level (e.g. 35 dB nHL).
Conductive and cochlear hearing loss exhibit different wave amplitude and latency patterns.
Especially. wave V latency and threshold are used for audiological diagnostics in children or
handicapped persons who are not able to reliably report on their hearing disability. The interpeak latency (IPL) between wave I and V represent the neural transmission time between
cochlea and brainstem. IPL is therefore used for assessing retrocochlear pathology (eighth
nerve and low brainstem lesions). It is important to note, that due to the maturation of the
neural pathway IPL varies during the first year of life. The influence of age on ABRs in the
elderly is a matter of controversy. While some authors have reported a change in IPL, others
claim that there is no delay in neural transmission time with ageing. Also, no significant correlation was observed between the score of speech discrimination tests and IPL
Sensitivity of ABRs is quite low below 1000 Hz due to poor synchrony of neural aktivity in
the apical region of the cochlea. Click-evoked ABR does not allow direct frequency-specific
assessment of hearing loss. Click-evoked ABRs exhibit nearly normal patterns in patients with
low- and/or mid-frequency hearing loss. Low-frequency stimulation at high stimulus levels
will also stimulate basal sensory cells. Thus, assessment of low-frequency functionality is only
possible at low stimulus levels. For getting more frequency-specific information DPOAE (at a
37
6 ABR – How-to use
hearing-loss up to 50 dB) or tone-pip and chirp-evoked ABR have to be used. However, when
applying low-frequency stimulation at high stimulus levels the basal region of the cochlea is
also stimulated. Thus, frequency specificity of ABRs is restricted. Compared to ABRs, auditory steady-state responses (ASSRs) – available in 2012 - provide better frequency specificity.
In patients with hearing loss wave I may be missing. In these patients, determination of IPL is
not possible and thus neural disorders can not reliably be assessed. Correct placement of electrodes is crucial in order to yield optimal ABR patterns. Due to the fact that electro-magnetic
fields have impact on ABRs proper measuring conditions are essential. Proper measuring conditions are present if ABRs are measurable down to 10 dB nHL in a young normally hearing
subject.
Intended clinical applications of ABRs are as follows:
⋅ Topological diagnostics - assessment of peripheral and central sound processing on the
auditory pathway up to the brainstem along with other audiological tests
⋅ Identification of neural disorders (eight nerve and low brainstem lesions) on the auditory pathway
⋅ Non frequency-specific determination of hearing loss within mid-frequency region
when using clicks
⋅ Determination of hearing loss within different frequency regions when using low-,
mid-, and high-frequency chirp-stimuli
In the following, the use of ABR test is described in detail.
Corresponding button names and icons are as follows:
ABR
Settings
Enter
Play
Pause
Skip
Left/right
Back
I III V
Print
Info
I/III/V
Set
38
Preparation of the patient to be tested
6.1 Preparation of the patient to be tested
⋅
⋅
⋅
Advise the subject to lay as comfortable as possible to avoid muscle activity.
Clean the skin where the electrodes will be placed.
Place electrodes.
Fig. 1a: Screen pictogram
There are several possibilities to place the electrodes. The position of
the electrodes affects waveform morphology and latency. Best electrode position for yielding maximum wave amplitudes is vertex and
ipsilateral mastoid (vertical montage). Alternatively to the vertex position, forehead position for placing the vertex electrode is possible (see
Fig. 1a and 1b). However, in this case ABR amplitude is slightly
decreased. Despite this fact forehead is preferred in practice, especially in patients where vertex electrode placement is inconvenient
because of hairs.
Wave I amplitude may be larger in a horizontal montage (mastoid to
mastoid) than in the standard vertical montage (vertex to mastoid).
Reference electrode (black) is usually placed on the cheek.
Since Sentiero provides one channel, mastoid electrode cable must be
changed when using vertical montage of the electrodes. If mastoid
electrode is not changed, ABR is decreased in amplitude at the ear
where mastoid electrode cable is connected to the contra-lateral ear.
Fig. 1b: Cable pictogram
Common placement of the electrodes for audiological testing:
Red( ): Mastoid, Black (●): Cheek, _White (●): Forehead_
6.2 Perform measurements
After placing the electrodes electro-acoustic transducers (headphones
or insert phones) have to be fitted. Important: Please make sure that
the red transducer is placed at the right ear and the blue transducer is
placed at the left ear.
Plug the ABR cable connector in the white jack. Then connect the
electrodes with the colored clips as described above (red: mastoid,
white: vertex or forehead, black: cheek).
39
6 ABR – How-to use
Start the measurement module by pressing “ABR”
Select one of the presets by pressing the appropriate button.
By pressing “Right” or “Left” the test ear is selected and the test starts.
Alternatively, the selected preset can be edited by pressing the “settings” button. There
are 4 settings pages. Each has to be confirmed with “enter” in order to store the settings.
40
Perform measurements
Select stimulus type “Click” or “Chirp”
Both clicks and chirps are broad-band stimuli. Broad-band stimuli are
used to stimulate as many as possible sensory cells along the cochlea
for getting highest neural activity on the nerve fibers. The band-width
of a click (see frequency domain Fig. 2b, blue line) depends on stimulus duration (see time domain Fig. 2a, blue line). The shorter the click
the higher is the band-width and with that the synchrony of neural
activity on the auditory pathway. However, synchrony is decreased in
the more apical regions of the cochlea in accordance with the decrease
of the travelling wave velocity. In contrast to the click the chirp is a
long-lasting stimulus which starts with low and ends with high-frequency signals (see time domain Fig. 2a, red line). Using this rising
frequency chirp, the decrease of the travelling wave velocity along the
basilar membrane is compensated resulting in an enhancement of the
synchrony of neural activity and with that in higher response amplitudes. Chirp provides a broader frequency band compared to that of
the click (see frequency domain Fig. 2a, blue and red line).
S tim u li - tim e d o m a in
1
0 .8
0 .6
0 .4
0 .2
0
-0 .2
-0 .4
-0 .6
-0 .8
C h ir p
C lic k
-1
0
0 .5
1
tim e [ m s ]
1 .5
2
Select polarity: “Condensation” (C), “Rarefaction” (R) or “Alternating” (A)
Fig. 2a Time domain
S t im u li - f r e q u e n c y d o m a in
10
0
m a g n it u r e [ d B ]
-1 0
-2 0
-3 0
-4 0
-5 0
-6 0
-7 0
C h ir p
C lic k
0
1000
2000
3000 4000 5000
fr e q u e n c y [H z ]
6000
7000
Fig. 2a Frequency domain
8000
Single-polarity stimuli (C or R) produce different initial movement of
the basilar membrane. Initial firing of the nerves coincides with R stimuli resulting in different wave latencies and amplitudes with C and
R. Thus different waveform morphology appears when using singleor alternating-polarity clicks.
Single-polarity click stimulation may evoke wave I with higher amplitude. However, when using single-polarity clicks the electrical signal
of the electro-acoustic transducer interferes with the ABR. Therefore A
click stimuli are preferred especially when using headphones. When
using insert phones electrical artifacts are lower.
Select “Jitter”
“Jitter” will add a small random change in stimulus rate, which can
reduce the sensitivity to certain electrical interference. ABR amplitude
is known to be decreased at a constant stimulus rate due to adaptation.
By enabling “Jitter” adaptation is reduced.
Select “Masking noise”
“Masking noise” will mask the contralateral ear. This is done to de-
41
6 ABR – How-to use
synchronize the stimulus related neural activity on the auditory
pathway of the non tested ear which might be stimulated by cross hearing. It is recommended to always use this option especially in cases of
asymmetrical hearing loss. The masking level is controlled by the
device and depends on the stimulus level and the electro-acoustical
transducer used.
Select “Auto Proceed”
“Auto Proceed” will proceed the measurement at the next stimulus
level when significance is reached for the current measurement.
Select “Auto Stop”
“Auto Stop” will abort the test sequence if no significant response
could be recorded for two consecutive stimulus levels.
Select stimulus levels
At the level selection screen 1 to 5 levels can be selected. Measurement will be started at the highest stimulus level.
ABR amplitude decreases and latency increases with decreasing stimulus level. In normal hearing subjects wave V latencies varies between about 5.6 ms (80 dB nHL) and about 9 ms (10 dB nHL). Standard deviation of latency is low at the higher stimulus levels (approx.
0.2 ms at 80 dB nHL) and high at the lower stimulus levels (approx.
0.7 ms at 10 dB nHL)
Initial stimulus levels higher than 70 dB nHL have to be confirmed
prior to measurement!
42
Perform measurements
Select the stimulus rate, plot range, and the number of averages per
response
The inter-stimulus interval, the test duration per response and the estimated overall test duration will be shown as a result of the settings.
Changes in stimulus rate affect ABR latency and amplitude. With
increasing stimulus rate wave amplitudes decrease and wave latencies
increase. Please note: Wave I latency is less affected resulting in an
increase of inter peak latencies with faster rates. For assessing neural
disorders a rate of 10Hz is recommended. If wave V is the only component of interest (e.g. threshold determination), faster rates can be
used.
With increasing number of averages quality of ABR measurement is
increased. In quiet subjects and at good measuring conditions 2000
averages may be sufficient. If there is high muscle activity, high electrode impedance, ambient acoustical and electrical noise the number
of averages has to be considerably increased, especially, at close-tothreshold stimulus levels.
Select age group
Several groups can be selected:
Newborn, 2 month, 6 month, 12 month, Adult.
The selection will only affect the normative latency range which is different for the different age groups. Latency ranges are shown with the
responses.
Further age group options: Don’t show normatives, Ask before test.
By pressing “Edit Preset Name” the preset can be renamed.
Type in the new preset name by using the screen keyboard. Confirm
your input with “enter”.
Continue Measurement
43
6 ABR – How-to use
Before ABR measurement starts electrode impedance is checked.
When the impedance is within an acceptable range (below 12 kΩ) a
“play” button appears in the footer. To indicate good impedances the
color of the impedance value will turn green if it is below 6 kΩ.
Please note: In neonates impedance may be higher than 6 kΩ because
of tenderness of the skin. Also, unbalanced impedance affects the quality of ABR measurements.
By pressing the “play” button ABR measurement at the highest selected level is started.
If the “play” button is not pressed or the impedance remains to high
the device stops measuring after some seconds. In this case place the
electrodes again and restart the test.
The currently measured response is shown in blue. All other responses
are shown in gray. The right top corner indicates the current selected
scale (100 to 2000 nV). It can be modified by wiping up and down
inside the graph area after the measurement or in the “result view
mode”.
During the measurement the selected levels are shown on the left
edge. The traffic light symbol to the left of each response indicate its
significance. If “Auto Proceed” is selected the device will automatically proceed with the next measurement when significance of the current measurement was reached which is indicated by the green light.
You may proceed at any time by pressing the “skip” button or wait
until the maximum recording time per response is reached. After the
maximum recording time is reached the device proceeds to the next
stimulus level.
By pressing the “pause” button the measurement is paused and the
“pause” button changes to the “play” button. To continue press “play”.
During the measurement the electrode impedance is measured periodically. If the value is too high the measurement is paused and a message “Electrode impedance is too high. The test will now pause. You
may re-place the electrodes and continue the test” is shown.
44
Perform measurements
In this case re-place the electrodes and press the “play” button to continue within the maximum recording time per response.
When the measurement has finished the ABR result panel is displayed
which shows the responses at all selected stimulus levels. You may
modify the scale by wiping up and down inside the graph area. The
traffic light symbols to the left of each response indicate its statistical
significance providing a suggestion for the responses to be valid.
If wave peaks were marked, the available absolute latencies (wave I,
wave III, wave V) and relative latencies (IPL) will be shown in the
lower panel. Different IPLs can be selected; Wave I-III, wave III-V,
and wave I-V. Press the table area to display either latencies, recording
parameters or quality data.
The footer shows now different buttons: “Back”, “I III V”, “print” and
“info”. “Print” will print the results to the label printer. “Back” leads
to previous screen. “Info” will show the online help.
“I III V” enters the edit mode, where you can mark peaks.
In the peak settings mode, you may mark wave peaks in each response
manually. The active response can be selected by pressing the buttons
to the left of each response.
“I/III/V” selects the marker to be modified indicated the red point on
top of the marker.
“Set” makes a peak marker permanent, so that it will be stored with
the test. The marker will turn green to indicate this.
“Left/right” moves the selected marker to set the latency of the corresponding wave. You may also set the marker by pressing on the desired latency position. Please note that order of the markers is always
preserved with a minimum distance of 0.5 ms.
“Back” leaves the screen without saving new peak positions.
45
6 ABR – How-to use
“Enter” confirms the changes and goes back to the regular ABR result
display.
When opening a result from “result view” you have the same editing
options as described above after a measurement.
6.3 ABR-case examples
1. Normally hearing subject
Click-evoked ABRs in a normally hearing subject at 50, 40, 30, 20, and 10 dB nHL stimulus
levels. ABRs are measurable down to 10 dB nHL. Wave-V-latency increases and wave-Vamplitude decreases with decreasing stimulus level. Wave-V latencies are within normal
range.
W ave V
8
7 .5
la te n c y [m s ]
7
6 .5
6
5 .5
5
30
40
50
60
c lic k le v e l [ d B n H L ]
70
80
2. Conductive hearing loss
Click-evoked ABRs in a patient suffering from a conductive hearing loss at 80, 70, 60, 50, and
40 dB nHL stimulus levels. Wave-V latency is increased being out of normal wave-V latency
range. ABR threshold is reached at 50 dB dB nHL corresponding to the hearing loss at high
frequencies. Stimulus rate was set to 20 Hz, vertical electrode montage.
46
ABR-case examples
W ave V
8
7 .5
la t e n c y [ m s ]
7
6 .5
6
5 .5
5
30
40
50
60
c lic k le v e l [ d B n H L ]
70
80
3. Cochlear hearing loss
Click-evoked ABRs in a patient suffering from a moderate high frequency cochlear hearing
loss at 70, 60, 50, 40, and 30 dB nHL stimulus levels. In comparison to the normally hearing
subject ABRs appear with lower amplitude and slightly increased wave-V-latency. ABR
threshold is reached at 30 dB nHL. The prolongation of latency at low stimulus levels corresponds to the propagation time of the travelling wave along the non-functioning basal part of
the cochlea at these levels. Stimulus rate was set to 20 Hz, vertical electrode montage.
W ave V
8
7 .5
la te n c y [m s ]
7
6 .5
6
5 .5
5
30
40
50
60
c lic k le v e l [d B n H L ]
70
80
Click-evoked ABRs in a patient suffering from a severe high frequency cochlear hearing loss
at 80, 70, 60, 50, and 40 dB nHL stimulus levels. ABR threshold is reached at 60 dB dB nHL
approximately corresponding to the hearing loss at high frequencies. Low-frequency
thresholds can not be assessed. Stimulus rate was set to 20 Hz, vertical electrode montage.
47
6 ABR – How-to use
W ave V
8
7 .5
la te n c y [m s ]
7
6 .5
6
5 .5
5
30
40
50
60
c lic k le v e l [d B n H L ]
70
80
Click-evoked ABRs in a patient suffering from a pan-tonal frequency cochlear hearing loss at
70, 60, 50, 40 and 30 dB nHL stimulus levels. At all stimulus levels – with exception of the
lowest one – latencies are within normal range. ABR threshold is reached at 40 dB dB nHL.
Stimulus rate was set to 20 Hz, vertical electrode montage.
W ave V
8
7 .5
la te n c y [m s ]
7
6 .5
6
5 .5
5
30
40
50
60
c lic k le v e l [d B n H L ]
70
80
4. Retrocochlear hearing loss
Click-evoked ABRs in a female patient with neural disorders at 80 dB nHL stimulus level.
ABR wave pattern is different compared to the normally hearing subject and the patients with
cochlear or conductive hearing loss with respect to I-V IPL. I-V ILP is prolonged (4.4 ms) due
to disturbed synchronisation of nerve fibers exceeding normal I-V interval (female: mean 3.8
ms, +/- 0,2 ms standard deviation; male: mean 4.0 ms, +/- 0,2 ms standard deviation). Stimulus rate was set to 10 Hz, horizontal electrode montage.
48
ABR-case examples
49