1
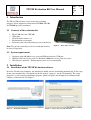
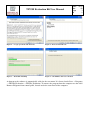
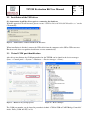
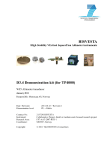
Doc
Rev.
Page
Of
TPUSB Evaluation Kit User Manual
Evaluation Kit User Manual
for
TP to USB converter
Author
Checked
Approved
Date
Sign
Rev
Reference
Date
Doc
010206
PN
00
Archive
337/06
010206
BE
010206
JaL
02
EM
907/08
200208
BE
010206
ALA
03
EM
925/08
200208
BE
Stamp
0213
03
1
8
TPUSB Evaluation Kit User Manual
DOC
Rev
Page
of
0213
03
2
8
1 Introduction
The TP to USB converter is only meant for evaluation
purposes. It has support for connection of TP2000, TP3100
and TP4000 pressure transducers.
1.1 Contents of the evaluation kit
•
•
•
•
•
TP to USB converter (TPUSB)
USB cable
CD with demo software ++
Evaluation kit user manual
Extension cable (for differential pressure transducers)
Note: The pressure transducer to be used with this kit must
be ordered separately.
Figure 1 – TP to USB converter
1.2 System requirements
•
•
•
Computer with 100 Mbytes free space on HDD and one free USB port.
Windows XP with service pack 2 or Windows 2000 with service pack 4 or newer.
Web browser (optional – documentation can be accessed manually)
2 Installation
2.1 Installation of the TPUSB Evaluation software
Insert the CD into your computer. An autorun-file should start the installation automatically. If the setup
do not start automatically, you should run the file named “setup.exe” on the CD manually. The setup
program is a self-extracting installation program, which will guide you through the installation of the
software as illustrated in 2 to Figure 7.
Figure 2 – Wait while initialising
Figure 3 – Select directory and click next
TPUSB Evaluation Kit User Manual
DOC
Rev
Page
of
Figure 4 – Accept agreement and click next
Figure 5 – Review and click next
Figure 6 – Wait while installing
Figure 7 – Click finish, and reboot if asked
0213
03
3
8
A shortcut to the software is automatically added to the start menu. It is located under Start ĺ Programs
ĺ TPUSB_Evaluation ĺ TPUSB_Evaluation. To remove the program from the computer use the Add /
Remove Programs from control panel, located under the start menu of the computer.
TPUSB Evaluation Kit User Manual
DOC
Rev
Page
of
0213
03
4
8
2.2 Installation of the USB driver
It is important to install the drivers prior to connecting the hardware.
With the appended CD still inserted, please execute “\CP210x Driver\CP210xVCPInstaller.exe” on the
CD manually.
Figure 8 – Click install to continue and follow the directions
When installation is finished, connect the USB cable from the computer to the SPI to USB converter.
Hardware and driver recognition should now execute automatically.
2.3 Virtual COM port identification
After driver installation, the COM port number for the TPUSB can be found in the device manager
(Start ĺ Control panel ĺ System ĺ Hardware ĺ Device manager ĺ Ports):
Figure 9 – Hardware in system properties
Figure 10 – Device manager
The COM port number can be found in parenthesis behind “CP210x USB to UART Bridge Controller”
inside “Ports (COM & LPT)” in 10.
TPUSB Evaluation Kit User Manual
DOC
Rev
Page
of
0213
03
5
8
3 Running the demo system
3.1 Connecting hardware
Connect the TP to USB converter to your
computer using the USB cable. How to identify
the virtual serial-port (com-port) to use is
described in chapter 0. Make a note of the specific
com-port used. Place the TP unit onto the
converter. Figure 11 shows the orientation of a
TP2000 unit while connecting. Connection must
be according to the TP to USB converter marking.
3.1.1
Extension cable
In cases where a TP unit has a differential
Figure 11 – Connection of a TP2000 unit
pressure sensor, the extension cable must be used
to be able to connect the TP unit onto the TP to USB converter. When using the extension cable, make
sure that the TP is not rotated to obtain the correct orientation. Failure to observe this requirement can
permanently damage the TP to USB converter.
3.1.2
Power supply
The TP to USB converter and the connected TP unit is supplied with 5 VDC from USB. To be able to
supply TP units with required power, the converter contains a voltage doubler. The supplying computer
must comply with the USB standard (from 4.375 to 5.25 V, 100 mA).
TPUSB Evaluation Kit User Manual
DOC
Rev
Page
of
0213
03
6
8
3.2 TPUSB Evaluation software
Start the TPUSB Evaluation software, located in
the start menu (Start ĺ Programs ĺ
TPUSB_Evaluation ĺ TPUSB_Evaluation).
Figure 12 shows the initial graphical user interface
(GUI) for the software. Select COM port (as
identified in chapter 0) in the pull-down menu in
this GUI, and click start. Optionally the port can
be typed in.
Documentation of Memscap products can by
found by using the “Info” button in Figure 12,
which will open a browser window. This
documentation is available after installation,
independently of the CD.
Figure 12 – Initial GUI for TPUSB_Evaluation
Version information of the connected TPUSB
Converter can be obtained by using the “Version”
button in Figure 12.
3.2.1
Description of the main GUI
The main GUI in Figure 13, Figure 14 and Figure
15 consists of a graph showing the pressure and
temperature from the TP unit elapsed during time
of measurement. The graph auto scales pressure
(y-axis left side, white curve) to make the best
Figure 13 – Main GUI for the software (TP4000 P)
resolution during time. The y-axis on the right
side shows the temperature (red curve). The pressure and temperature values are digitally displayed
above the graph together with a status field.
Figure 14 – Main GUI for the software (TP31XX)
Figure 15 – Main GUI for the software (TP2000)
TPUSB Evaluation Kit User Manual
DOC
Rev
Page
of
0213
03
7
8
Start or Stop – When you click on the “start” button the serial number, pressure value and value unit
are read from the TP and visualized in the upper parts of the program. If there is a communication error
the message: “Connection Failed” is written in the same location as the serial number (status field) after
approximately 0.5 minute. When communicating, the “start” button becomes a “stop” button, and
clicking it will end communication.
Filter – The filter function is implemented in the computer software and can be changed while the
program is running. Moving the “filter” control with the PC-mouse changes the filter constant.
Sample rate – The number of seconds between each time the sensor signal is measured. The “sample
rate” control can be moved with the PC-mouse while the program is running, to change sample rate.
Timescale – The time scale (x-axis) is set to buffer a certain amount of data. The buffer size can be
adjusted by using the F1 and F2 on the keyboard. F1 increases and F2 decreases the buffer size. The
current buffer size value in time can be found in the lower right corner of the GUI. To achieve the
highest possible timescale, set the “sample rate” to maximum (slowest). F5 sets the timescale back to
default. Tip: adjustment of timescale is quickest when “sample rate” is set to minimum (fastest).
Pressure scale – The graph auto scales pressure (y-axis) to make the best resolution during time. F3 and
F4 can be used to adjust the pressure scale. F3 increases and F4 decreases the pressure scaling factor. F5
sets the pressure scale back to default. Tip: adjustment of pressure scale is quickest when “sample rate”
is set to minimum (fastest).
Clear graph – When you press the “clear graph” button the data in the graph is deleted.
Save data – The data present in the graph can be stored in an ASCII file at any time. To be able to do
this, the program must be stopped by clicking “stop” button and then the “save data” button. The user
will be prompted for a filename and location of the file.
Time stamp and pressure value is stored in the file. The most easy method to view the data is to drag and
drop the ASCII file from Explorer into Excel. Note that the timestamp does not include milliseconds.
dT() – Applies to TP4000 Prototype only. This is ¨T° between bridge resistance temperature read from
ADC1 and temperatures read from ADC2. Temperatures that can be read are RB (Bridge Resistance),
TB (Temperature Bridge) and RT (Temperature Resistor).
3.2.2
Keyboard shortcuts
F1 – Increase time scale buffer size in the graph
F2 – Decrease time scale buffer size in the graph
F3 – Increase pressure scaling of results in the graph
F4 – Decrease pressure scaling of results in the graph
F5 – Set F[1..4] settings back to default
TPUSB Evaluation Kit User Manual
DOC
Rev
Page
of
0213
03
8
8
APPENDIX A. Frequently asked questions
Why is there a delay from a physical pressure change to an update on the display?
Assuming that filter and sample rate is at a requested level it may be that the driver for the USB
communication is not the correct version. The USB communication is tested with the appended driver
CP210x USB to UART Bridge Controller version 4.40.1.0. Due to plug and play functionality and
windows update it might be that you use a newer driver with a known bug. It is important to install the
driver prior to connecting the hardware. To check the current driver version - do the following:
1) Connect HW
2) Locate the unit (“CP210x USB to UART Bridge Controller” ) in the device manager (Start ĺ
Control panel ĺ System ĺ Hardware ĺ Device manager ĺ Ports)
3) Right click on the unit and choose properties(Figure 16).
Figure 16 – Open properties for the TPUSB unit
4) Find the driver version which is located under the Driver(Figure 17). If the driver version is not
4.40.1.0 this might be the reason for your observation. In such a case you should disconnect the
HW and uninstall the driver using the add or remove programs from the Control panel. Refer to
chapter 2.2 installation of the correct driver.
Figure 17 – Current driver version