1
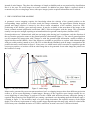
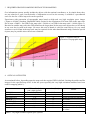
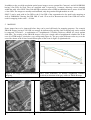
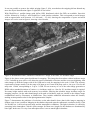
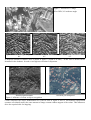
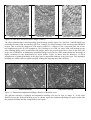
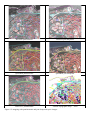
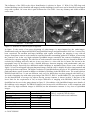
Topographic mapping from space
K. Jacobsen* , G. Büyüksalih**
* Institute of Photogrammetry and Geoinformation,
Leibniz University Hannover
** BIMTAS, Altunizade-Istanbul, Turkey
KEYWORDS: WorldView-1, IKONOS, QuickBird, OrbView-3, EROS-B, mapping, information contents
ABSTRACT: Mapping today is a data acquisition for geographic information systems (GIS). Actual GIS
information is required for any project planning. Especially in developing countries often no actual
information is available. The data acquisition can be based on aerial, but also on space images for
topographic maps up to a scale 1:5000. Sometimes aerial images are not available or classified and photo
flights may be expensive and time consuming if no aerial survey craft is stationed in the country. So the use
of space images for mapping often is an economic solution.
The ground sampling distance (GSD) has been shown as the key factor for object identification. In addition
the object contrast, atmospheric condition, incidence angle, sun elevation and azimuth, spectral range and
multispectral information plays a role. With WorldView-1 a GSD of 45cm is available, distributed with
50cm GSD, corresponding to medium aerial photo scale. But also with QuickBird (62cm GSD), IKONOS
(82cm / 1m GSD), OrbView-3 (1m GSD) and EROS-B (0.7m GSD) as well as with the other new very high
resolution optical space imagery a topographic mapping is possible. The results of mapping, using
QuickBird, IKONOS and OrbView-3 images, are compared with large scale topographic maps. The
influence of pan-sharpening against panchromatic images is shown.
1 INTRODUCTION
80% of the available information has a positional relation, requiring geo-positional knowledge of our
environment, which may be included in a Geo Information Systems (GIS). Topographic mapping today is a
data acquisition for GIS. It is required as basic information for any planning. Without actual information about
the environment no country or local administration can be managed. Especially in developing countries we
have a growing inequality between rural and urban population, leading to migration to larger cities. This again
leads to problems in rural and urban areas, causing unplanned growth in cities and development of slum areas.
The globalizing economy causes international competition of farm products, farmers do not invest if they do
not believe to reach a satisfactory quality of life, causing a degradation of rural areas and agricultural
production. It is necessary to increase of living and working condition in rural areas to reduce the migration. A
possibility for this is a land consolidation with a rearrangement of ownership for the improvement of
production and working conditions on farm land and in forests, sustainable development. In addition the
migration causes severe problems up to unmanageable conditions in the cities, requiring a strict urban
planning. An important pre-condition for an optimal land management is the registration of land ownership.
With certified land ownership the owners can get bank credits with good conditions because of the security by
the ownership. All this requires the knowledge of the actual situation of a country, which is today not possible
without updated GIS information.
Traditionally the required detailed mapping was based on aerial images. With the today available very high
resolution space images with up to 0.5m ground sampling distance (GSD) it is possible to use space images
instead of aerial images. They have the advantage of simple availability and are not restricted by classification
like it is the case for aerial images in several countries. In addition no photo flight is required, which is
economic only for covering larger areas, with space images just the required information can be ordered.
2 PRE-CONDITION FOR MAPPING
A geometric correct mapping requires the knowledge about the relation of the ground position to the
corresponding image position, or in other words, the image orientation. The approximate relation between
ground and image position is known by the direct sensor orientation of the satellites, based on GPSpositioning of the satellite, gyros and star sensors. It may be available in the meta-data of the image or the
sensor oriented rational polynomial coefficients (RPC), delivered together with the image. This orientation
usually is not precise enough, requiring an orientation based on ground control points (Jacobsen 2007).
Ground positions are 3-dimensional, with just one image point, having just 2 coordinates, only the direction of
the ray from the projection centre to the ground position is determined (figure 1). The correct ground position
can be computed by intersection with 2 images or with the ground height information, usually available as
digital elevation model (DEM). Also if the images are available as projection to a plane with constant height,
with geo-coded position, named as level 1B, Geo or Ortho Ready Standard, such an image corresponds to the
position shown as rectification in figure 2. In any case a so called terrain relief correction is required to get the
correct geo-position, or in other words an ortho-image has to be generated. In an ortho-image the points have
the location of a map.
Figure 1: 3D point determination
Figure 2: ortho-image
Maps can be generated by stereo-measurement based on 2 overlapping images taken from different projection
centres or by on-screen digitizing of ortho-images. Because of the expensive space images usually an onscreen digitizing of ortho-images is preferred. For this a DEM with sufficient accuracy and point spacing is
required. Discrepancies of the height (DZ) are causing a positional error depending upon the incidence angle ν
(formula in figure 2). The incidence angle of a space image determines the required accuracy of the height
model. The accuracy requirement of a map or ortho-image depends upon the map scale, which is related to the
GSD. In any case a standard deviation of 2 GSD is sufficient, in most cases also 3 GSD are tolerated.
3 REQUIRED GROUND SAMPLING DISTANCE FOR MAPPING
Geo information systems usually include the objects with the national coordinates, so by simple theory they
are not related to a scale, but the details of information as well as the accuracy is related to a presentation
scale. So also for a GIS a map scale can be specified.
Experiences with generation of topographic maps based on high and very high resolution space images
(Topan et al 2004) (Jacobsen, Büyüksalih 2006) resulted in the requirement of 0.1mm GSD in the map scale
like 0.1mm x 50000 = 5m GSD for the map scale 1:50 000 or 1m GSD for the map scale 1:10 000 (figure 3).
But also for smaller map scales the GSD should not be larger than 5m because some objects have to be shown
in any case also in small scale maps. Of course this rule of thumb is valid for usual objects, for very small
structures even 0.05mm in the map scale may be required. On the other hand thematic maps, limited to special
objects, may be possible also with a lower resolution.
Figure 3: required GSD for
generation of topographic maps
4 OPTICAL SATELLITES
As mentioned before, depending upon the map scale the required GSD is defined, limiting the usable satellite
images for the specified map scale. In the last years especially the very high resolution satellites have been
used for mapping (table 1).
Sensor
IKONOS
QuickBird
past OrbView-3
EROS B
KOMPSAT-2
Resource DK1
Cartosat-2
Worldview-1
GSD (nadir) [m]
pan / multi spectral
0.82 / 3.2
0.61 / 2.44
1/4
0.7 / 1/4
1/3
1/0.45 / -
Table 1: very high resolution optical space systems
swath
11.3
16.4
8
14
14
28
10
16
[km]
remark
colour and pan not together
no colour
elliptical orbit
no colour
distributed with 0.5m GSD,
no colour
In addition to the very high resolution optical space images, stereo systems like Cartosat-1 and ALOS-PRISM,
having 2.5m GSD, are used. They are equipped with 2 respectively 3 cameras, allowing a stereo imaging
within the orbit. Also SPOT-5 has with the high resolution stereo (HRS) an additional stereo sensor. It has 5m
x 10m GSD. The images are usually not distributed, only the generated height models are sold.
SPOT-5 can be used with its 5m GSD or the 2.5m GSD of the supermode also for small scale mapping as
well as FORMOSAT having 2m GSD. IRS-1C and -1D as well as Resourcesat with 5.8m GSD also can be
used for mapping in the scale 1 : 50 000.
5 MAPPING
Some images have to be improved before they can be used efficiently for mapping purposes. For example
EROS-B images, having 0.7m GSD, are strongly be influenced by striping. Such a striping only can be caused
by staggered CCD-lines – a combination of 2 neighboured CCD-lines which are shifted 0.5 pixels against
each other. The striping of the EROS-B images is not just a simple shift of neighboured columns like in the
case of ASTER images; it includes a very strong trend (figure 4). The grey value differences also vary over the
scene like shown at the 4 lines from different parts of the scene in figure 4, right hand side.
Figure 4: sub-image of EROS-B effected by Grey value difference of directly neighbored columns
stripping
(vertical) as function of the grey values in EROS-B image
Figure 5: corrected EROS-B image
Build up area in corrected EROS-B-image
It was not possible to remove the whole striping (figure 5, left), nevertheless the stripping did not disturb any
more the object identification (figure 5 right) like it was before.
With WorldView-1 satellite images with 0.45m GSD, distributed with 0.5m GSD, are available. Soon this
will be followed by GeoEye-1 and WorldView-2 with similar resolution. This corresponds to aerial images
with an approximate scale between 1:15 000 and 1 : 25 000, showing the competition of space and aerial
images as it can be seen in figure 6, showing a lot of details.
Figure 6: Dolmabahce Palace, Istanbul in WorldView-1 image, 0.5m GSD, 29° incidence angle
Figure 6 also shows some general problems for mapping. This image has been taken with an incidence angle
of 29°. In build up areas such a view direction causes remarkable occlusions and the on-screen digitizing with
ortho-images is difficult. Images with 0.5m GSD can be used for mapping in the scale 1:5000. The accuracy
requirement of maps usually is in the range of 0.2mm up to 0.3mm in the map scale or 1m up to 1.5m for the
map scale 1:5000, corresponding to 2 up to 3 GSD. For an accuracy of 1m of the ortho-image generation a
DEM with a standard deviation of 1m/tan ν (ν=incidence angle) or 1.8m for 29° incidence angle is required.
Not many height models with such accuracy are available, reducing the tolerable image incidence angle for
mapping purposes. On the other hand images with such an incidence angle are similar to the oblique image
combinations used by Pictometry or Multivision. They include additional information about the facades,
making an interpretation also for not-photogrammetrists simpler.
Figure 7 demonstrates the problems of occlusion; on the other hand it shows that in this image a mapping in
shadow areas is not a problem. Mapping in the shadows depends upon the radiometric resolution, being 12 bit
for WorldView-1, the used spectral range and the atmospheric conditions. The light in shadows is caused by
scattering in the atmosphere, which is quite stronger for short wave length. So the shadows are dominated by
blue light. In the case of a very clear atmosphere there is not so much light in shadows.
Figure 7: WorldView-1 image
0.5m GSD, 29° incidence angle
Figure 8: IKONOS-images Zonguldak taken with different sun elevation of
46°
41°
61°
A different situation of shadow areas is shown in figure 8 (Topan et al 2005) – in this case no details can be
identified in the shadows. In such a case high sun elevation is important.
IKONOS panchromatic
IKONOS pan-sharpened
Figure 9: influence of colour to object recognition
Colour simplifies the object identification as it can be seen in figure 9 and 12. Nevertheless experienced
operators can identify nearly the same amount of image content without support of the colour. This influences
more the required time for mapping.
OrbView-3 1m GSD
IKONOS 1m GSD
QuickBird 0.61m GSD
Figure 10: same area in different space images (Turkey)
The object identification is also depending upon the image quality (figure 10). OrbView-3 and IKONOS have
nominally the same GSD, nevertheless OrbView-3 images are always looking a little less sharp than IKONOS
images. This is caused by staggered CCDs used by OrbView-3. Orbview-3 has a projected pixel size of 2m,
but neighboured pixels are over-sampled by 50%, leading to 1m GSD. Of course with such method not the
same imaging quality can be reached like with images, where the projected pixel size is close to the GSD, like
in the case of IKONOS. In addition the QuickBird image, having 0.61m GSD, demonstrates the advantage of
higher resolution for the identification of object details. Figure 10 shows also the difference of object
identification of planned buildings in the upper part to unplanned buildings in the lower part. The unplanned
buildings are smaller and not regular arranged, making the mapping quite more difficult.
Planned buildings
Unplanned buildings
Figure 11: Planned and unplanned buildings (Brazil) in IKONOS-scene
The different situation of planned and unplanned buildings can also be seen in image 11. In the same
IKONOS scene the different building types are shown. Again the unplanned buildings are quite smaller like
the planned buildings and the arrangement is not regular.
IKONOS panchromatic
IKONOS pan-sharpened
QuickBird panchromatic
QuickBird pan-sharpened
OrbView-3 panchromatic
Turkish topographic map 1 : 5000
Figure 12: mapping with panchromatic and pan-sharpened space images
The influence of the GSD to the object identification is obvious in figure 13. With 2.5m GSD large and
isolated buildings can be identified and mapped, smaller buildings in most cases can be identified, but mapped
only with a symbol. Of course this is quite different for 0.5m GSD – here any chimney and visible window
can be seen.
Cartosat-1
2.5m GSD
WorldView-1
0.5m GSD
Figure 13: influence of GSD to object recognition
In figure 12 the result of on-screen digitizing of ortho-images is super-imposed to the ortho-images.
Panchromatic and pan-sharpened IKONOS and QuickBird images and panchromatic OrbView-3 scenes have
been vectorized. For medium and larger buildings with regular roof-shape, the mapping is easy with all
images. Sometimes concrete roofs cannot be separated from the surrounding garden if no shadow is increasing
the contrast. Even in the very high resolution QuickBird images sometimes the contrast of buildings is not
sufficient for a precise mapping. The side-line of roads cannot be extracted since they are located in shadow or
occluded by buildings and trees and not in any case there is a clear side line in nature like shown in the
topographic map. In fact there is only a limited difference between mapping with panchromatic and pansharpened images. Especially few additional smaller buildings in unplanned areas (lower centre of maps in
figure 12) have been mapped with pan-sharpened images. But the color is helpful for object interpretation and
speeds up the data acquisition. The higher resolution of QuickBird allows the plot of few additional unpaved
paths and shorter streets located in shadows or hidden by buildings in the IKONOS scene. The result based on
IKONOS and OrbView-3 is not too different, only very few details have not been mapped with OrbView-3.
As result of mapping also with other space images like SPOT-5, IRS-1C and KOMPSAT-2, the required GSD
for the identification of average size objects, having average contrast, is shown in table 2. Because of the
lower limit for the requirement of 2m, no major difference of mapping with IKONOS, OrbView-3 and
QuickBird can be seen in the maps shown in figure 12. Nevertheless with QuickBird images more details of
the buildings can be mapped. The EROS-B images have been used in a different area, so the comparison with
the other very high resolution images is difficult, but the information contents is very close to QuickBird
images.
urban buildings
foot path
minor road network
rail road
fine hydrology
major road network
building blocks
4 CONCLUSION
required GSD
2m
1 - 2m
5m
5m
5m
10m
10m
Table 2: required GSD for object
identification under usual conditions
Very high resolution space images can be used for the generation of large scale topographic maps also under
the more difficult situation of urban areas. The geometric accuracy is not the limiting factor for the map scale;
it is limited by the information contents of the images; that means the possibility of object identification.
However, in relation to a topographic map 1 : 5000 not all objects could be mapped. This confirms the rule of
thumb, that a GSD of at least 0.1mm in the map scale is required or reverse that IKONOS and OrbView-3
images can be used for the topographic map scale 1 : 10 000. With the 0.6m GSD of QuickBird images more
details can be seen like with 1m GSD, also the morphologic details are better, but the details of the reference
map has not been reached. Of course this is also influenced by not so experienced operators and the extreme
difficult test area, but also with aerial images not all details can be extracted and a field check is required. In
not so mountainous terrain and in planned build up areas it is quite easier to generate topographic maps and
QuickBird as well as WorldView-1 images can be used up to the map scale 1 : 5000. Also the EROS-B
images are including a similar information contents if the striping is removed. The map scale 1 : 5000 is
sufficient as base of a cadastre or a land consolidation as well as for urban planning.
Not only the GSD; also the imaging conditions are important. The sun elevation plays a major role because
mapping in the shadow may be quite difficult. A larger incidence angle may cause not acceptable occlusion in
city areas. On the other hand a larger incidence angle gives an oblique view like used by Pictometry, this may
be helpful for object interpretation especially by untrained staff. The colour is helpful for object identification,
speeds up the mapping but does not lead to more details and higher accuracy.
REFERENCES
Jacobsen, K., Büyüksalih, G., 2006: Mapping from Space - a Cooperation of Zonguldak Karaelmas University
and University of Hannover, 5th Turkish-German Geodetic Days, Berlin 2006, http://www.ipi.unihannover.de/ (access 4/2008)
Jacobsen, K., 2007: Orientation of high resolution optical space images, ASPRS annual conference, Tampa
2007, on CD
Topan, H., Büyüksalih, G.,Jacobsen, K., 2004: Comparison of Information Contents of High Resolution
Space Images, ISPRS Congress, Istanbul 2004, IntArchPhRS. Vol XXXV, B4. pp 583-588
Topan, H., Büyüksalih, G., Jacobsen, K., 2005: Information contents of High Resolution Satellite Images,
EARSeL workshop 3D-remote sensing, Porto, 2005, on CD, + http://www.ipi.uni-hannover.de/ (access
4/2008)