1
User Manual
Computer Integrated Documentation - PRO 4.02
User Manual
CTS GmbH
Lotzenäcker 21
72379 Hechingen
Section 1
Table of Contents
CTS GmbH CID-Pro
Rev. 2013-04-15
4.02
User Manual
©1997-2013
CTS GmbH • Lotzenäcker 21 • 72379 Hechingen • Germany
http://www.cts-umweltsimulation.de
Text, figures, and examples were created with the greatest care. The issuer assumes neither
legal nor any other liability for erroneous information and its consequences.
This document is copyright protected. All rights reserved. No part of this documentation may
be reproduced in any form, by photocopy, microfilm, or other processes, or translated into a
language usable by machines, particularly data processing equipment, without the issuer’s
written consent. The rights to reproduce via lecture, radio, and television are also reserved.
Microsoft, Windows and Windows NT, Windows 2000, Windows XP, Windows 2003,
Windows Vista, Windows 7 and Windows 8 are registered trademarks of the Microsoft Corp.,
Redmond, USA. CTS and the CTS logo are registered trademarks of the CTS GmbH,
Hechingen, Germany.
2
CID-Pro 4.02
User Manual
Section 1
1
Table of Contents
Table of Contents
1
Table of Contents .........................................................................................................3
2
Installation and system requirements .........................................................................7
2.1
Licensing notes ..................................................................................................... 7
2.2
System requirements............................................................................................. 7
2.3
Authorizations........................................................................................................ 7
2.4
Installation ............................................................................................................. 8
2.4.1
CID-Pro 4.02 .................................................................................................10
2.4.2
Driver for the hardware key (dongle) .............................................................12
2.4.3
ASCII protocol test program ..........................................................................13
2.4.3.1
ASCII protocol for the serial interface ........................................................13
2.4.3.2
ASCII protocol for the Ethernet interface ...................................................14
2.4.4
Manuals and Adobe Acrobat Reader .............................................................14
2.5
Uninstall ...............................................................................................................15
3
Program start-up ........................................................................................................17
3.1
Software ...............................................................................................................17
3.2
Units .....................................................................................................................17
4
Program parts and functions .....................................................................................19
4.1
Status overview ....................................................................................................19
4.1.1
Preface..........................................................................................................19
4.1.2
Symbol and menu bar ...................................................................................20
4.1.3
Test Units ......................................................................................................21
4.1.4
Unit information .............................................................................................22
4.1.5
Unit and error status ......................................................................................23
4.1.6
Program automatic ........................................................................................26
4.1.7
Trend graph...................................................................................................27
4.1.8
Messages (change, warning, and error messages) .......................................29
4.1.9
Digital channels .............................................................................................30
4.1.10
Analogues channels ......................................................................................31
4.1.11
Disable control terminal .................................................................................32
4.1.12
Error list.........................................................................................................33
4.2
Configuration (CID-Pro 4.02 - Settings) ................................................................35
4.2.1
Settings .........................................................................................................35
4.2.2
Communication .............................................................................................36
4.2.2.1
Help for adding Test Units into software ....................................................40
4.2.3
Program mode (temporary/transient display) .................................................41
4.2.4
Test specimen protection ..............................................................................43
4.2.5
Generally.......................................................................................................44
4.2.6
Login Option ..................................................................................................46
4.2.6.1
Simple password .......................................................................................46
4.2.6.2
Access Configuration - Settings .................................................................48
4.2.6.3
Access Configuration - In runtime operation ..............................................53
4.2.7
PDF Settings .................................................................................................54
4.3
Overview of all test units.......................................................................................55
4.4
Test-cycle program editor .....................................................................................57
4.4.1
Preface..........................................................................................................57
4.4.2
Buttons ..........................................................................................................59
User Manual
for CID-Pro
4.02
3
Section 1
Table of Contents
4.4.3
Generate a test cycle ....................................................................................60
4.4.3.1
Edit lines (insert, change, delete, cut, and copy) with keyboard/menu
functions ...................................................................................................60
4.4.3.2
Insert line and change graph with the mouse ............................................64
4.4.4
Functions ......................................................................................................69
4.4.4.1
New test program ......................................................................................69
4.4.4.2
Open test program ....................................................................................69
4.4.4.3
Save (as) test program ..............................................................................70
4.4.4.4
Delete test program ...................................................................................70
4.4.4.5
Printer/page setup and print … ..................................................................71
4.4.4.6
Print as PDF... ...........................................................................................72
4.4.4.7
Copy/insert a block of lines / delete a block of lines ...................................72
4.4.4.8
Loop (loop beginning and end) ..................................................................74
4.4.4.9
Call Subprogram .......................................................................................75
4.4.4.10 Conditional jump........................................................................................76
4.4.4.11 Insert Program...........................................................................................77
4.4.4.12 Templates .................................................................................................78
4.4.4.13 Editor options ............................................................................................79
4.4.4.14 Set Gradient ..............................................................................................82
4.4.4.15 Save file in data pool .................................................................................86
4.4.4.16 Save file as library .....................................................................................86
4.4.4.17 Editor comments .......................................................................................87
4.4.4.18 Editor zoom functions ................................................................................88
4.5
Graphical measurement-data analysis .................................................................91
4.5.1
Preface..........................................................................................................91
4.5.2
Buttons ..........................................................................................................92
4.5.3
Graphical measurement-data analysis functions ...........................................93
4.5.3.1
Open and load measurement ....................................................................93
4.5.3.2
Working with graphical measurement-data analysis ..................................95
4.5.3.3
Delete measurement .................................................................................95
4.5.3.4
Print measurement ....................................................................................96
4.5.3.5
Print measurement as PDF .......................................................................96
4.5.3.6
Zoom functions (graphical measurement-data analysis) ............................97
4.5.3.7
Display ......................................................................................................99
4.5.3.8
Analysis .....................................................................................................99
4.5.3.9
Options (graphical measurement-data analysis) ......................................100
4.5.3.10 Excel conversion program .......................................................................103
4.5.3.11 Display Measurement Values ..................................................................106
4.5.3.12 Copy to clipboard ....................................................................................106
4.5.3.13 Merge measurement files ........................................................................107
4.5.3.14 Cut current Measurement File (Cursor) ...................................................107
4.5.3.15 Settings ...................................................................................................108
4.5.3.16 Comments (graphical measurement-data analysis) .................................110
4.6
Starting test programs (automatic)......................................................................111
4.6.1
Selection the test-cycle program .................................................................111
4.6.2
Recording the test-cycle program ................................................................112
4.6.3
Start options ................................................................................................114
4.6.4
Automatic mode ..........................................................................................115
4.7
Manual measurement recording .........................................................................117
4.7.1
Starting a manual measurement recording ..................................................117
4.7.2
Stopping a manual measurement recording ................................................122
4.8
Operating hours and event counter ....................................................................123
4.9
Event logs (reports) ............................................................................................125
4.9.1
Preface........................................................................................................125
4.9.2
Buttons ........................................................................................................127
4
CID-Pro 4.02
User Manual
Section 1
Table of Contents
4.9.3
Event log functions ......................................................................................127
4.9.3.1
New report...............................................................................................127
4.9.3.2
Load report ..............................................................................................127
4.9.3.3
Delete report ...........................................................................................127
4.9.3.4
Print report … ..........................................................................................128
4.9.3.5
Export report … .......................................................................................128
4.9.3.6
Error list ...................................................................................................129
4.9.3.7
Power fail ................................................................................................131
4.9.3.8
E-Mail message.......................................................................................132
4.9.3.9
Options (event logs) ................................................................................135
4.10
Visualization .......................................................................................................137
4.10.1
Preface........................................................................................................137
4.10.2
Buttons ........................................................................................................137
4.10.3
Display the Visualization .............................................................................138
4.10.4
Visualization functions .................................................................................139
4.10.4.1 Configure setting .....................................................................................139
4.10.4.2 Save setting ............................................................................................141
4.10.4.3 Load setting .............................................................................................142
4.10.4.4 Reset setting ...........................................................................................142
4.10.4.5 Display Test Units ...................................................................................142
4.11
Special menus for particular test unit types ........................................................143
4.11.1
Temperature Shock Test Cabinets ..............................................................143
4.11.1.1 Overview menu .......................................................................................143
4.11.1.2 Pretempering ...........................................................................................144
4.11.1.3 Program start...........................................................................................146
4.11.1.4 Test program creation .............................................................................147
4.11.1.5 Manual and program operation ................................................................148
5
Networking ................................................................................................................149
5.1
Serial interface (RS 232) ....................................................................................150
5.2
Serial interface (RS 485) ....................................................................................151
5.3
Network (TCP/IP) ...............................................................................................153
5.4
Network Version (Remote PC) ...........................................................................154
5.5
External devices .................................................................................................154
6
Buttons of the CID-Pro 4.02 software ......................................................................155
6.1
Status overview ..................................................................................................155
6.2
Editor ..................................................................................................................156
6.3
Graphical measurement-data analysis ...............................................................157
6.4
Event logs ..........................................................................................................158
6.5
Visualization .......................................................................................................158
7
Software updates ......................................................................................................159
7.1
Support section on the Internet ...........................................................................159
7.2
Software information...........................................................................................160
8
End user license agreement ....................................................................................161
8.1
Copyright memo .................................................................................................161
8.2
License agreement .............................................................................................161
8.3
Warranty.............................................................................................................162
8.4
Place of fulfilment, place of jurisdiction, applicable law .......................................162
9
10
Index ..........................................................................................................................163
Technical support .....................................................................................................167
User Manual
for CID-Pro
4.02
5
Section 1
6
CID-Pro 4.02
User Manual
Section 2
2
Installation and system requirements
Installation and system requirements
2.1
Licensing notes
The CID-Pro 4.02 can be tested free and without obligation. You can evaluate
measurement files and create test programs with the demo version; communication over the
serial interface is available exclusively in the full version.
If you have an Ethernet connection at the test unit, licensing would be carried out over this
connection and communication would occur via the CID-Pro network version.
CID-Pro 4.02
is licensed per computer or per test unit. That means, you need a
hardware key (dongle) to communicate via serial interface or an Ethernet connection to the
test unit to communicate via Ethernet interface.
2.2
-
System requirements
PC with 1 GHz Pentium processor or higher
Microsoft Windows 7/8 (32 and 64 bit), Windows Vista/XP or
Windows 2000 Service Pack 3 or higher
VGA (256 colours, 1280 x 1024 pixels or higher)
Min. 256 MB RAM, 512 MB recommended
(Memory is dependent on the operating system)
200 MB free disk space, 1 GB recommended
Microsoft compatible mouse
CD ROM drive
Free serial interface or Ethernet interface
Free USB port for a hardware key (dongle)
-
2.3
Authorizations
You must be a member of the local administrators’ group, or have the authorization to install
CID-Pro 4.02. If you are a domain administrator, then you generally have the
appropriate privileges.
For modifications and updates of the various files (programs, measurement records or report
files) you must have read and write access to the CID-Pro installation folder while
operating the software.
User Manual
for CID-Pro
4.02
7
Section 2
2.4
Installation and system requirements
Installation
It’s very easy to install the CID-Pro
4.02-Software. Please proceed as follows:
1. Start the computer on which you want to install CID-Pro 4.02.
2. Log on as a user with administrative privileges.
3. It is recommended that you close all running windows programmes before starting the
installation.
4. Place the CD into the drive of the computer.
5. If the CID-Pro 4.02 installation file does not start automatically, please open
it directly from your CD (e.g. d:\CD_Start.exe).
6. Select your language.
7. In the following there are different CID-Pro 4.02 software versions and a few
tools available:
-
CID-Pro 4.02:
When the CID-Pro
software is installed, the standard network
version installed only allows Ethernet communication.
If the test units are to be connected via the serial interface, the full
version has to be activated using the supplied dongle. Besides this,
the driver for the hardware key is also necessary and has to be
installed.
The installation, the manual, the quick start guide and the driver for
the hardware key are displayed when you click on the button 'CID-Pro
4.02'.
8
CID-Pro 4.02
User Manual
Section 2
Installation and system requirements
-
ASCII Protocol test program
The test program for the ASCII protocol installs an application with
which you can investigate transmitted data based on this protocol.
This can be helpful when you control the test unit using your own
software and want to try out the necessary commands and data for
this.
-
Adobe Reader
Acrobat Reader is needed to be able to display the documentation,
also located on CD, in electronic form.
-
Quick Start Guide (PDF)
The Quick Start Guide describes all the important standard functions
in two pages.
-
Driver for the hardware key (dongle)
Your computer system needs the driver in order to recognize the USB
dongle.
-
Manuals
Manuals in the respective languages as PDF-format.
User Manual
for CID-Pro
4.02
9
Section 2
Installation and system requirements
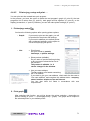
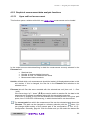
2.4.1 CID-Pro 4.02
Follow the software assistant’s directions after you have started the installation.
During the installation, you can select the destination directory into which
4.02 software should be installed. The default is:
CID-Pro
C:\CID-PRO 4.00\
You can change this directory. It is recommended, that you install the software on the local
hard drive of the computer.
10
CID-Pro 4.02
User Manual
Section 2
Installation and system requirements
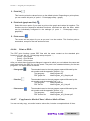
After successful installation, the following message appears:
You can now close the start up window and use the software.
Take note:
First install CID-Pro 4.02 software if you want to use the full
version. Finally, start the Sentinel hardware key’s (dongle)
installation. Only insert the provided dongle after installing the driver
on the PC.
You may be asked to connect the dongle with the PC during driver
installation. In that case, follow the directions in the menu.
Check whether the USB dongle is in a USB port and the Sentinel
driver is installed. Otherwise, the software is started as a network
version.
If the software version, which you have selected, is already installed,
it will be updated if necessary.
User Manual
for CID-Pro
4.02
11
Section 2
Installation and system requirements
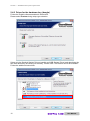
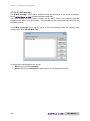
2.4.2 Driver for the hardware key (dongle)
Follow the English software assistant’s instructions.
Please select Custom during setup type selection.
Select only the Sentinel System Drivers (parallel and USB System Driver) and deactivate the
two other entries by left clicking on the entry. Confirm with “This feature will not be available.”
Follow the additional instructions.
12
CID-Pro 4.02
User Manual
Section 2
Installation and system requirements
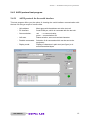
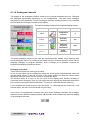
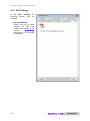
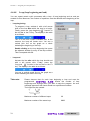
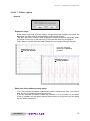
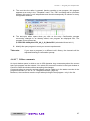
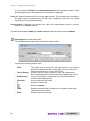
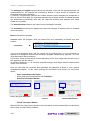
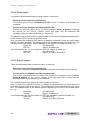
2.4.3 ASCII protocol test program
2.4.3.1
ASCII protocol for the serial interface
This test program offers you the option of checking the serial interface communication with
the test unit using a couple of mouse clicks.
- Unit address:
- PC interface:
Must agree with the address set at the test unit.
Serial COM port, which is connected with the test unit.
- Communication:
red
- no communication
green - communication OK
Status selection, sent and received character.
- Left area:
- Possible commands:
- Display mode:
User Manual
Selection of all commands which can be sent to the
equipment
Display of characters in plain text (see figure) or in
actual transmitted bytes
for CID-Pro
4.02
13
Section 2
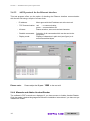
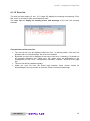
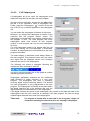
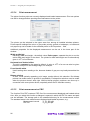
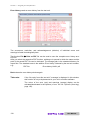
2.4.3.2
Installation and system requirements
ASCII protocol for the Ethernet interface
This test program offers you the option of checking the Ethernet interface communication
with the test unit using a couple of mouse clicks.
- IP address:
Must agree with the IP address set at the test unit.
- TCP Communication: red
- no communication
green - communication OK
- left area:
Status selection, sent and received character.
- Possible commands:
- Display mode:
Please note:
Selection of all commands which can be sent to the
equipment
Display of characters in plain text (see figure) or in
actual transmitted bytes
Please adjust the IP port:
1080
to the test unit!
2.4.4 Manuals and Adobe Acrobat Reader
The software’s PDF manuals are displayed if you have access to Adobe Acrobat Reader.
Click the reader’s desired language and follow the installation instructions if you have not yet
installed the reader.
14
CID-Pro 4.02
User Manual
Section 2
2.5
Installation and system requirements
Uninstall
To remove CID-Pro 4.02 from your system, open Control Panel from the start
menu’s Settings and select Software resp. Programs and Features.
Please select CID-Pro
resp. Uninstall button.
4.02 from the installed software list and click on the Remove
Confirm uninstall of CID-Pro 4.02.
CID-Pro 4.02 is now removed from your system.
All files installed while working with CID-Pro 4.02 like programs, measurements,
report files, initialization files, as well as personal settings remains during uninstall. They can
be re-used during re-installation into the same installation directory.
If you don’t need any of them you can delete all files in the CID-Pro 4.02 directory
after uninstall.
User Manual
for CID-Pro
4.02
15
Section 2
16
Installation and system requirements
CID-Pro 4.02
User Manual
Section 3
3
Program start-up
Program start-up
3.1
Software
Click on:
Start (All) Programs CID-PRO
4.00 CID-Pro 4.02
or
on a short cut „CID-PRO
4.02“ on the desktop
During FIRST program start-up, you directly find yourself in the software’s program settings
(cf. section 4.2 - Configuration (CID-Pro 4.02 - Settings), page 35).
Before you can work with the program you have to define how many test units there are, how
the test units are connected to the software and at what interval they are to be queried.
At all subsequent program starts the software independently searches for test units on the
basis of these settings and, if the test units are switched on, retrieves the current unit data.
If the test unit configuration is not available, it is read in by the CID-Pro software. If no
communication can be established, the test unit cannot be integrated.
You now find yourself in the status overview (cf. section 4.1 - Status overview, page 19).
3.2
Units
Check the set protocol and the unit address directly at the test unit if you get no connection
to your test unit.
Network parameters like IP address, IP port, subnet mask, and default gateway must be set
correctly during communication via network. You usually get these data from your network
administrator.
You find out how parameters must be entered at the test unit in your test unit's operation
manual.
User Manual
for CID-Pro
4.02
17
Section 3
18
Program start-up
CID-Pro 4.02
User Manual
Exit!
Preface
User Manual
for CID-Pro
4.02
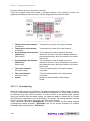
4.1.8 Messages (change, warning,
and error messages)
4.1.1
4.1.6
Program
automatic
4.1.7 Trend graph
or
program
diagram
Status overview
4.1.10
Analogues
channels
4.1.9
Digital
channels
4.1
4.1.5
Unit and
error
status
4.1.12 Error list
4
4.1.3
Test Units
4.1.4
Unit
information
4.1.2 Symbol and
menu bar
Section 4
Program parts and functions
Program parts and functions
19
Section 4
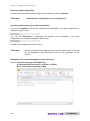
4.1.2
Program parts and functions
Symbol and menu bar
Main symbol and menu bar functions are listed in the following:
Exit
Exit!
Visualization
(section 4.10, page 137)
Display your test units in a self-generated environment.
Ctrl+V
Functions
Overview of all test units
(section 4.3, page 55)
Display all your connected test units in a overview.
Ctrl+O
Functions
Test-cycle program editor
(section 4.4, page 57)
Create, edit, change, and delete your test-cycle programs.
Ctrl+E
Functions
Graphical measurement-data analysis
(section 4.5, page 91)
Display your test data in a diagram and analyze them.
Ctrl+G
Functions
Starting test programs (automatic)
(section 4.6, page 111)
Start a test-cycle program from CID-Pro 4.02 in automatic mode.
Ctrl+A
Functions
Manual measurement recording
(section 4.7, page 117)
Document the progress of analogous and digital channels’ test units with
test value records.
Ctrl+M
Functions
Configuration (CID-Pro 4.02 - Settings)
(section 4.2, page 35)
Configure your software according your requirements.
Ctrl+S
Functions
Operating hours and event counter
(section 4.8, page 123)
Display your operating hours and events.
Ctrl+C
Functions
Event logs (reports)
(section 4.9, page 125)
All changes, warnings, and errors can be displayed and provided with
comments.
Ctrl+R
Functions
F1
Help
Ctrl+I
Information
Help
Info
Software information (section 7.2, page 160)
20
CID-Pro 4.02
User Manual
Section 4
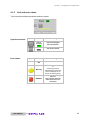
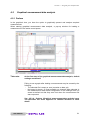
4.1.3
Program parts and functions
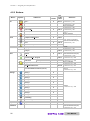
Test Units
The symbols give an overview of the current status of all test units set in the configuration.
See list below for a description of the colours:
Symbol
Colour
Configuration
Test Unit
red X
not configured
not present
white
configured
Doesn’t answer
Main switch off or
No connection
grey
configured
connected
not started
green
configured
connected
in operation
orange
configured
connected
in operation
Pause
yellow
configured
connected
warning
red
configured
connected
error
Clicking on a symbol changes the status-overview screen
to display the selected test unit and show the current
values.
The selected test unit respective the current test unit which
is displayed is bolded in the list of all test units.
If you have entered more then 16 test units in the configuration you will get the two paging
symbols ( and ).
With version 4 of the CID-Pro software, entered test units can be assigned names.
This unit name can be freely entered into the configuration and changed (cf. sec. 4.2.2 Configuration: Communication, page 36). If no name is recorded, the default designation
“Test Unit xx” is displayed. xx stands in this case for the unit number.
If an active measurement recording, such as
has been started, this
measurement record can immediately be opened by left-double-clicking on the symbol for
the test unit.
User Manual
for CID-Pro
4.02
21
Section 4
4.1.4
Program parts and functions
Unit information
In this area, you can read off the unit’s information for the selected and displayed test unit.
You can see the following information:
Field
Significance
Example
Unit name +
default designation
In the configuration
modifiable value
(cf. sec. 4.2.2, page 36)
Climate Cabinet (U01)
Commission
number
Unit commission
Constant value read from the
test unit control
C70350
Unit type
Unit device type
Constant value read from the
unit control
C-70/350
Name
Information in this area is not changeable; it is only for display!
22
CID-Pro 4.02
User Manual
Section 4
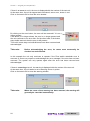
4.1.5
Program parts and functions
Unit and error status
Test units status shows operational and error status.
Operational status:
Error status:
Symbol
Symbol
Status
On clicking
unit is
running
(ON)
Unit will be stopped
after confirmation.
unit off
(OFF)
Unit will be started.
Status
On clicking
OK
-
--Warning
ERROR!
User Manual
for CID-Pro
4.02
A warning cannot be
acknowledged because the
status is displayed for as
long as the warning exists.
Attempt to acknowledge
the error.
Only operates when the
cause of the error was
removed!!!
23
Section 4
Program parts and functions
If there is an error at a unit, the error is displayed with the number of the test unit.
At the same time, the unit is stopped and unit status is set to error, shown in red.
Click on the button OK to close the error window.
By clicking on the error button, the error will be removed if it is no
longer present.
If the button is no longer shown, the error is no longer present and
the unit continues to run error free. On the other hand, if the button
stays visible and red, then the error is still present.
This unit’s button stays red until all errors have been removed and
acknowledged.
Take note:
Before acknowledging the error, its cause must necessarily be
checked out and removed.
In this example the unit only continues to operate if the Float switch waterbath error is
removed. It serves no purpose to acknowledge the error message if the error has not been
removed. The system can only operate again after the error has been removed and
acknowledged.
If there is a warning at a unit, the warning is displayed with the number of the test unit.
At the same time, the unit status is set to warning, shown in yellow.
Click on the button OK to close the warning window.
Take note:
24
When the cause of the warning has been removed, the warning will
generally be cancelled automatically.
CID-Pro 4.02
User Manual
Section 4
Yellow signal:
Program parts and functions
Text output about automatic operation status
Automatic mode
Automatic mode
-InterruptedProgrammed start time:
14:30 08.08.2010
Selection field (Manual-Mode):
automatic quick-start selection
If the unit is stopped, i.e. it is not running right now, clicking on the selection field opens
a list of all programs that are stored in this unit’s controller.
During selection of a program and activation of the start button, this program is started
in automatic mode without going through the “automatic” menu.
Normally, a created test program is loaded to the selected unit controller and started if
necessary via the "Automatic" menu.
If you now want to carry out changes to this program, whether in the CID-Pro
4.02 editor on the PC or in the unit editor, the PC program and the controller
programs with the same name will no longer match.
When the quick start selection is carried out, both programs (PC and unit programs)
will be completely evaluated and compared:
1. Programs the same
2. Programs different
- Unit PC:
- PC Unit:
- Cancel:
User Manual
Unit program is started
User will be asked which program is newer and
therefore which should be overwritten.
Unit program overwrites PC program. Unit starts
PC program sent again to unit Unit starts
Cancel to check which program is more up-to-date.
for CID-Pro
4.02
25
Section 4
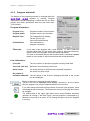
4.1.6
Program parts and functions
Program automatic
The display of the program automatic is changed while the
CID-Pro 4.02 software is running. Program
information is shown depending on which test unit you have
chosen and which operational state the test units have.
This includes:
Program information:
Program (no.):
Program number in the controller
Program name:
Program name in the controller
Elapsed Time:
Time elapsed since starting
Format: [hh:mm:ss]
(hours:minutes:seconds)
Probable End:
Time calculated to
program completion
Take note:
If you start a test program with a wait function, i.e. that a channel's
nominal value waits for the actual value (within a particular tolerance),
then the end of the program cannot be exactly calculated.
The time is calculated without wait functions and is constantly updated
based on the number of wait functions and their actual durations.
Line information:
(Line) No:
The line number on which the program currently finds itself.
Time Left: (the line)
Execution time remaining on this line
Active loops:
Are loops still active? Number and completed repetitions
are shown for active loops.
Set values of
Individual channels: The set values of the first four analogue channels of the current
line are displayed.
Button to interrupt or continue the test program.
The test unit is set to interrupt status (display “continue”) if an error exists.
Now the program can only be restarted after the error is fixed.
If you have saved comments during creation of the test-cycle program, these
are displayed with this button. The comments are only for display and cannot
be changed.
The rotating disk in the upper right hand corner shows whether automatic
operation is running. If the disk is grey, the test program is interrupted (e.g.
because of a pause or an error). If it is rotating and green, then the program
is running.
26
CID-Pro 4.02
User Manual
Section 4
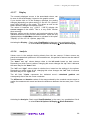
4.1.7
Program parts and functions
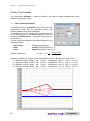
Trend graph
In the screen's top centre area, a symbol bar offers selection options between different
displays. Not all of these buttons are visible under some circumstances. This depends on the
unit’s type and operational state.
If the trend graphic button
is activated, the status overview window will show the
trend graph. This graph shows the temperature profile (and the humidity profile when
present) with set and actual values respectively.
The trend graph always shows a constant time window up to the current instant. The special
configuration of this time windows is illustrated in more detail in sec. 4.2.2 - Configuration:
Communication, page 36. This scale applies for both channels (temperature and humidity as
needed).
The channels’ colours are assigned as follows:
Temperature - actual value
light red
Temperature - set value
dark red
Humidity actual value
light blue
Humidity set value
dark blue
Take note:
User Manual
Trend graph data are only stored temporarily. You cannot replace a
measurement record!
for CID-Pro
4.02
27
Section 4
Program parts and functions
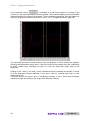
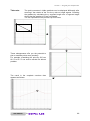
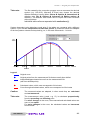
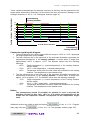
If the automatic button
is activated or a test-cycle program is running in the
current unit, the automatic display will be activated. The automatic display gives you detailed
information about the current test program. This is displayed graphically (see next figure) as
well as in program-automatic screen form (cf. sec. 4.1.6 - Program automatic, page 26).
The yellow bar shows the current position in the test program. It moves through the program
following the temperature index value. If there are loops in the program they are symbolised
as white vertical lines. Reaching the end of a loop the yellow bar jumps back to the
beginning.
Scaling of the Y axis (Y min and Y max) is determined by the smallest and largest Y values
of all the analogue channels depicted. Y min and Y max are rounded down resp. up and
adapted with ±10.
The push buttons for temper and (if necessary) humidity or up to three other analogue
channels change the scaling to the range of the selected channel.
28
CID-Pro 4.02
User Manual
Section 4
4.1.8
Program parts and functions
Messages (change, warning, and error messages)
This short, six line excerpt from the Event logs (reports) give you a short overview of the
latest messages, which are shown independent from the unit. Furthermore, the red errors
display and the orange warnings display are often very helpful.
The messages are:
-
All changes of the system:
• Software changes like CID-Pro start
• Configuration changes like changed number of units
-
All changes of the unit:
• Changes to the unit’s operation like e.g. manually starting the unit
• Changes to digital or analogue channels like e.g. changed temperature
• Connection messages like e.g. no connection to test unit 5
-
All errors of the unit (red entry)
-
All warnings of the unit (orange entry)
The columns have the following meaning:
-
Date:
Time:
Unit:
-
(empty):
Action:
Date on which the message was created
Time at which the message was created
Unit number information, if a
unit-specific message is involved
Information, whether warning or error
Message
-
Index:
Number of messages in the list
User Manual
for CID-Pro
4.02
29
Section 4
4.1.9
Program parts and functions
Digital channels
The display of the digital channel relates to the currently displayed test unit. Softkeys and
marker channels are displayed dynamically depending on unit configuration - like how many
channels this unit possesses. Only the digital channels actually present in the controller and
activated for viewing are shown on the display.
The two kinds of digital channels are:
Softkeys:
These digital channels are switching channels that
execute permanently defined functions or actions.
Softkeys are displayed and can be changed
programmatically or manually. The Softkey is set (1) or
reset (0) during program operation in the provided
program. (For manual operation, see Changing a Softkey
(next section))
Indicators:
These digital channels present digital inputs or functions,
whose current state can be displayed, but cannot be
changed.
Changing a Softkey:
In manual operation, the Softkey is set by directly clicking on the grey square (not active). If
the active test unit could confirm the new state, the grey button changes its colour to green.
Click on the green square if you would like to reset this channel. The green button returns to
grey after unit confirmation.
e.g. the “deep dehu” (deep dehumidification) Softkey
OFF (=0)
Take note:
Click on the channel
Click on the channel
ON (=1)
OFF (=0)
The states are only changed when the active test unit confirms this
change!
If your unit configuration contains more than eight Softkeys or marker channels, the digital
channel screen adds two paging symbols ( and ), which enable back and forth paging of
the digital channels.
30
CID-Pro 4.02
User Manual
Section 4
Program parts and functions
4.1.10 Analogues channels
The display of the analogues channel relates to the currently displayed test unit. Channels
are displayed dynamically depending on unit configuration - like how many analogue
channels this unit possesses. Only the analogue channels actually present in the controller
and activated for viewing are shown on the display.
The various analogue channels are represented as follows:
Representation
Channel
Unit
red
Temperature
channels
°C
blue
Humidity
channels
%rH
green
Channels
with water
information
l (liter)
Other
channels
arbitrary
green
Symbol
-
The actual analogue values on the right are represented with weaker colour intensity than
the set analogue values. In contrast to the actual values in manual operation, these can be
arbitrarily changed. In program operation, such a change is not possible, because the
program permanently presets the values.
Changing a set value:
There are two options for entering a set value:
In one, the set value can be changed by sliding the arrow symbol located directly under the
set and actual values. To do this, left click on the arrow symbol and keep the mouse button
depressed. Now you can move the mouse to change the value.
The second option is to click on the set value in the display field, thereby activating it
(numerical colour changes). Now you can enter the value through the keyboard. Note that a
point must be used as the decimal delimiter. The entry is confirmed with the enter key.
If you released the mouse button in the first option, or confirmed with the enter key in the
second option, the test unit receives this new set value.
If your test unit configuration contains more than three analogue channels, the analogue
channels screen adds two paging symbols ( and ), which enable back and forth paging
of the analogue channels.
User Manual
for CID-Pro
4.02
31
Section 4
Program parts and functions
4.1.11 Disable control terminal
Clicking the key icon
opens a window showing whether the active test unit’s control
terminal is enabled or disabled.
You can change the state with a mouse click on the desired switch position. The new setting
is transmitted to the unit with the OK button. All key presses at this unit’s control terminal are
ignored if the keyboard is disabled.
Take note:
The key switch will only be displayed if the "Enable locking terminal“
option is set in the configuration (cf. sec. 4.2.5 - Configuration: Generally Options - Enable locking terminal, page 44).
A power outage or toggling the unit’s main ON/OFF switch unlocks the
keyboard.
If the connected test unit’s software version does not allow keyboard
locking, this unit’s “key icon” is not visible.
32
CID-Pro 4.02
User Manual
Section 4
Program parts and functions
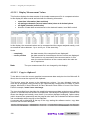
4.1.12 Error list
The Unit and error status (cf. sec. 4.1.5, page 23) displays the existing error/warning. From
this view it is not clear if other errors/warnings exist.
The error list will display all existing errors and warnings of the test unit currently
selected.
Characteristics of the error list:
•
•
•
•
The error list will only be displayed where an error / a warning exists. If the test unit
operates with no errors/warnings, the error list is masked.
By default, the error list is displayed in the event of an error / a warning. If it should not
be generally displayed, the "Show error list" option must be deactivated in the
configuration (cf. sec. 4.2.5 - Configuration: Generally - Options - Show error list, page
44).
The error list will be updated regularly.
Unlike the error list from the Event logs (reports), these entries cannot be
acknowledged, but only provide an overview of the current errors/warnings.
User Manual
for CID-Pro
4.02
33
Section 4
34
Program parts and functions
CID-Pro 4.02
User Manual
Section 4
4.2
Program parts and functions
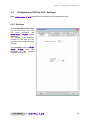
Configuration (CID-Pro 4.02 - Settings)
Basic CID-Pro
4.02 settings can be selected in the configuration menu.
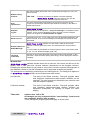
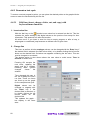
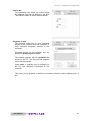
4.2.1 Settings
With the Number of test units,
you set how many test units
you have connected and
CID-Pro 4.02 should
administer.
This number is the maximum
number of units that you can
deal with in the communications
settings.
The Language sets all CIDPro 4.02 texts and
messages to the selected
language at run time.
User Manual
for CID-Pro
4.02
35
Section 4
Program parts and functions
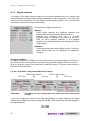
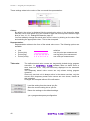
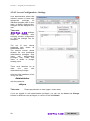
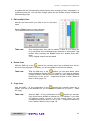
4.2.2 Communication
In the Test Unit Specific
Setting, you first select the
Unit No that you would like to
edit. In this connection, only
unit numbers from 1 to the
number chosen in the settings
(cf. sec. 4.2.1 - Configuration:
Settings, page 35) can be
selected.
All further settings in the
communications
parameters
always apply only for this
selected unit.
The following parameters can
be set for the selected unit:
-
Unit designation
Scanning rate
Length of trendgraph
Serial Port / Ethernet
Client/Server Setting
- test communication
- Configure Unit x
- Configure all Test Units
Unit designation:
The unit designation is a freely editable,
characteristic designation for the selected test unit.
Enter a name, location, or something else here.
Scanning rate:
The scanning rate in seconds is the interval during which the selected unit is cyclically
scanned. Too small a value leads to unnecessary data traffic. Too large a value leads
to unpleasantly long CID-Pro 4.02 reaction times. Ten seconds is a good
value in most cases.
The sampling rate is the smallest interval valid for recording measurement-data.
measurement value recording always occurs in multiples of the sampling rate.
36
CID-Pro 4.02
User Manual
Section 4
Program parts and functions
Length of trendgraph:
Change the trend graph’s time axis length in the status overview. The information is
given in minutes. Reasonable values lie between 60 and 120 min. and can be modified
depending on the test unit’s task.
Serial interface / Ethernet:
By selecting the appropriate selection box, either parameters for the serial interface or
for the Ethernet-TCP/IP become active.
Serial interface:
The serial interface denotes a digital input and output for a computer or a
peripheral device. During serial data transmission, bits are transmitted one after
another along a single conductor. The following parameters must be set for the
serial port:
Default values:
- COM port:
- Baud rate:
- Parity:
- Data bits:
- Stop bits:
PC interface
unit of transmission speed
erroneous information transmission
detection
transmission occurs in words
(word 5 to 9 bits)
up to two stop bits are used
because of synchronization
1
19200 Baud
odd parity
8 data bits
1 stop bit
Ethernet:
Ethernet is a wired data network technology for local data networks (LANs - Local
Area Networks). They enable data exchange in the form of data frames between
all devices connected to a local network (computer, printer, CTS units and the
like).
Assigned addresses must be unique. In other words, a selected IP address may
not be assigned a second time within this network.
The desired unit’s IP address, as well as an unused IP port number, are
necessary for communication over Ethernet.
(Entry at the unit via: Mainmenue 2/3 Settings Network).
Take note:
- IP address:
- IP port:
Please note:
User Manual
Your network administrator assigns IP addresses (as well as
subnet mask and default gateway) within your network.
unique unit address
port number in the suggested range
8000 to 8050
192.168.1.90
8001
Sensible numbering:
IP port 8001 for unit 1, IP port 8002 for unit 2, etc.
for CID-Pro
4.02
37
Section 4
Program parts and functions
Client/Server Setting:
With client/server communication, you can query the unit’s values from other PCs via
the computer connected to the unit. The PC that communicates with the test unit is set
up as the server. The other PCs, which access its data, are clients.
The server’s IP address and a port number common to client and server
(recommended range is 2000 to 2050) must be set up on the clients.
It can be furthermore specified on the server whether the connected clients may
change values in the unit.
Take note:
It makes sense to install the CID-Pro
otherwise a dongle will be needed.
4.02 network version,
Server setup example:
- Type:
- IP address:
- Port:
- Allow client control:
type determination
PC address
e.g. 192.168.1.100
common port number
server
--2010
Client setup example:
- Type:
- IP address:
- Port:
type determination
server IP address
common port number
client
192.168.1.100
2010
A further path adaptation for storing individual files makes sense for optimal use of the
networking. It is recommended that directories be set up on a file server to which the
participating PCs have access. These directories can be designated in the following
way:
Configuration files:
\\CID_Netz\konfig
Measurement files:
\\CID_Netz\messung
Test programs:
\\CID_Netz\zyklus
After the network administrator has set up these directories on the network, directory
paths must be changed in the configuration (cf. sec. 4.2.5 - Configuration: Generally,
page 44) of all participating PCs.
With access to the config files on the network, it is ensured that all PCs will have the
same unit’s settings. The correct server config file (e.g. KONFIG.K01) in the CIDPro 4.02 installation directory must be copied to the client if no network directory
is specified.
Without a config file, the software cannot display the unit’s setting. The unit is then
considered to be not connected, although communication functions in practice.
This way, the client now also has access to already completed measurement records.
Besides, test programs can be provided on all PCs. If a test program is already running
on a unit, the graphical program preview can also be activated on the client.
Selecting ASCII-Server enables a scan of current values on the selected test unit with
in-house software. You can get the data records description for this special application
from the CTS hotline.
38
CID-Pro 4.02
User Manual
Section 4
Program parts and functions
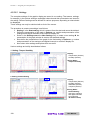
Test communication:
To ensure that the displayed communications parameters for the selected test unit
were correctly entered, the connection is checked with exactly these parameters.
If a connection can be established, the affected LED illuminates green, if not, it stays
grey.
Configure Unit x:
A unit’s configuration contains all the information displayed in the CID-Pro 4.02
software. This includes analogue and digital channels (e.g. number, type, name,
boundary values,...), meters (e.g. name, limits, …), operating hours, regulators, etc.
This configuration must be read in when you:
− want to integrate a new test unit,
− want to replace a test unit, or
− for example, want to assign a new address to a test unit.
This applies in general:
− when system settings change at the test unit
(e.g. enhancement of a new sensor) or
− when system settings change in the software
(e.g. other units numbers)
With the Configure Unit x function, you can re-read in the configuration for unit 1, for
example. The x stands for the unit number, depending on which unit is selected. After
activating the function and the subsequent confirmation prompt, the selected test unit’s
new configuration is requested.
Take note:
The selected test unit must be turned on for this!
Reading in a new configuration can take several
minutes!
Configure all Test Units:
With the Configure Test Units function, you can re-read the configuration into all units.
After activating the function and the subsequent confirmation prompt, the reconfiguration of all test units is requested.
You can find a complete description of the “Configure Units” function under “Configure
Unit x”!
Take note:
All test units must be turned on for this!
Reading in all new configurations can take
several minutes!
User Manual
for CID-Pro
4.02
39
Section 4
Program parts and functions
Only with the “Save” function are all modified parameters stored and the configuration of the
modified unit or units can be requested.
Take note:
Changing the unit number does not lead to the settings being stored. Only
with the “Save” function are the changes accepted in all test units.
The maximum admissible conductor length of 15 meters is to be observed
for the RS232 connection.
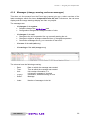
4.2.2.1
Help for adding Test Units into software
To add a new test unit into the CID-Pro
1.
2.
3.
4.
4.02 software, please proceed as follows:
Select the unit number
Enter an unit designation
Set the scanning rate in seconds
Select the type of communication:
a. Serial parameters:
- COM port
- Baud rate
- Parity
- Data bits
- Stop bits
b. Ethernet parameters:
- IP address
- IP port
5. Test the communication
6. Save the entries
7. Read out the unit configuration from the controller
40
CID-Pro 4.02
User Manual
Section 4
Program parts and functions
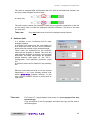
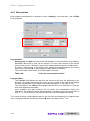
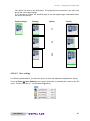
4.2.3 Program mode (temporary/transient display)
With this function, the actual
values of the current unit’s
selected
channel
are
temporarily,
i.e.
transiently
plotted on the automatic
graphic.
Select the desired unit with the
Unit No the channels, which
you can display during program
operation, are shown (dimmed).
Here temper in °C and humidity
in %RH:
Check
marking
Actvaluedisplay in the program mode
(temporary)
activates
the
function channel names are
activated
and
can
be
individually selected:
After activation of an individual
channel, here Temper in °C,
the channel’s settings are also
activated:
User Manual
for CID-Pro
4.02
41
Section 4
Program parts and functions
These settings relate to the colour of the curve and the representation:
Colour:
By default, the colour is displayed like the actual value colour in the channel’s status
overview, but a tone lighter (e.g. pink instead of light red and turquoise instead of light
blue) cf. sec. 4.1.10 - Analogues channels, page 31.
You can arbitrarily change the actual value curve’s colour by clicking on the colour field
and selecting the appropriate colour. This is then accepted.
Representation:
Representation relates to the form of the actual value curve. The following options are
available:
•
•
•
•
Line
Points (thin)
Points (big)
Points (cross)
Take note:
x x x x x x x x
solid line
one thin point per measurement
one big point per measurement
one cross per measurement
The defined actual value curves are temporarily plotted during program
execution, i.e. CID-Pro 4.02 software does not buffer them or
store them into a file. They are exclusively displayed on the automatic
graphic.
The temporary actual value curves are only shown during program
operation.
Since only one test unit is always active in the status overview, only the
current unit’s temporary actual value curves are ever shown, insofar as
this is desired.
Changes are accepted without OK confirmation.
Load the setting from the stored *ptc file.
Store the current setting into a *ptc file.
Return the settings to the default settings.
*ptc = program temporary configuration
42
CID-Pro 4.02
User Manual
Section 4
Program parts and functions
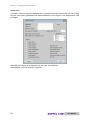
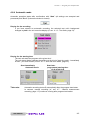
4.2.4 Test specimen protection
The selected unit channels for
which software limits can be
entered can be seen here. Two
value pairs are displayed for
each channel. These limits are
predefined with the channel’s
minimum and maximum values.
The unit reports an error and
shuts down if the channel’s
actual value undershoots the
minimum value or overshoots
the maximum value.
Manual operation values can be
changed. These values are
then transmitted to the unit and
apply when the unit is running
and was started in fixed value
operation.
The current limits return which
limits is currently stored in the
unit.
Manual operation and current
values can differ as long as an
automatic program is running in
the unit. If you change the
manual operation values during
this interval, they will only
become valid after program
completion.
Values valid during automatic
operation are defined in the
editor for the program in
question.
User Manual
for CID-Pro
4.02
43
Section 4
Program parts and functions
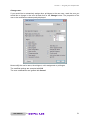
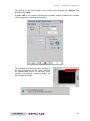
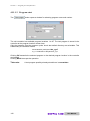
4.2.5 Generally
Global
settings,
default
directories, and general options
can be adjusted for CIDPro 4.02 software in this
menu.
Default Directories:
The default directories are the
paths for the measurement and
report files, test and sample
programs,
as
well
as
configuration and visualization
files.
The configuration files' path is
needed
to
exchange
configuration files over the
network (CID-Pro 4.02
client/server
operation).
Otherwise, the configuration
files can always be found in the
software’s installation directory.
For measurement data, it can
make special sense to convert
this path to a network path so
that backup can occur.
The adjoining button opens a
selection window to change the
path. A new path is written into
the field after confirmation.
Options:
Function
Ignore unused
test units:
Significance
If this option is set, units that fail to answer a query three times running will no
longer be queried. Querying only restarts after selection of the corresponding
unit in the status overview or after restarting the CID-Pro 4.02
software.
It can make sense to set this option if you have not consecutively numbered
your units starting with 1 because timeouts impacting the reaction time can
occur while querying non-present units.
44
CID-Pro 4.02
User Manual
Section 4
Program parts and functions
This option enables locking the unit’s control terminal using a key icon in the
status overview.
Enable locking
terminal:
Take note:
If the key icon does not appear even after restarting
CID-Pro 4.02
when the option is set, then the
connected unit does not support this function.
The unit’s nominal value progressions can be given in the form of expfunctions for special tests. Several input fields are necessary in the editor to
activate this function.
Prog.
exp-function:
CID-Pro 4.02 software can create an additional file to make
Separate
log file:
message entries in the report file - only error messages - accessible to other
systems. These can be evaluated by another program. The file’s storage
location can be given as “Path and Name of Logfile”.
If the error list (cf. sec. 4.1.12, page 33) is not to be generally displayed in the
Status overview, in the event of existing errors/warnings this option must be
deactivated.
Show error list:
CID-Pro 4.02 software can also send e-mails to inform other
systems or users of particular events. The desired sender can be entered
here.
Sender Address of
E-Mail-Message:
A correct sender is prerequisite on several systems, which even send e-mails
(cf. sec. 4.9.3.8 - E-Mail message, page 132).
Selection of the unit text language of the texts stored in the controller. In this
connection, channel names, among other things, can be displayed in German
or English.
Language
of unit text:
Window Size:
CID-Pro 4.02 software window sizes can be set here. All screens are laid out in the
default 1280 x 1024 pixel size. Several windows’ dimensions can be changed, however.
Enlarging the window does not just create a zoom effect, but also a partial rearrangement of
the window’s content so that the information can be presented as clearly as possible.
The setting can be selected by positioning the red marking arrow. The setting then applies to
all CID-Pro 4.02 software and is retained even after restart.
Use last size:
The sizes of the Status overview, Test-cycle program editor
and Graphical measurement-data analysis windows can be
changed. The most recently set dimensions are used the next
time the window is opened.
Fullscreen window:
The sizes of the Status overview, Test-cycle program editor
and Graphical measurement-data analysis windows are
expanded (maximized) on opening to exploit the entire
display.
Take note:
User Manual
smallest size: 1000 x 700
All changes are only accepted with the “save settings” function and
are completely effective after a restart.
These settings are program global and apply to all test units.
for CID-Pro
4.02
45
Section 4
Program parts and functions
4.2.6 Login Option
CID-Pro
4.02
is
provided with two access
authorization versions (the
menu changes depending on
the selected authorization):
4.2.6.1 Simple
password
A simple password should be
used when a complete CIDPro
4.02
software
lockdown is desired. The entire
interface can be locked this way
by entering a password. All
areas can be opened and
displayed
in
this
mode.
Changes, however are ignored
with the message
Password security is active.
Function is not available.
protect
CID-Pro
4.02 from unauthorized
access
with
Activate
password security.
You
Therefore the password query
opens. The password on initial program start is:
cid-pro
Take note:
46
Please pay attention to case (upper / lower case).
CID-Pro 4.02
User Manual
Section 4
If the password is correct,
the test unit or files.
Program parts and functions
CID-Pro 4.02 prevents all write accesses by the user to
The following actions are no longer possible:
• Setting set analogue channel values
• Changing digital channels
• Accessing the automatic display
• Accessing the recording display
• Recording termination
• Storing generated cycles in the editor
• Changing comments while measuring
• Configuring the test units
• Exiting CID-Pro 4.02
You can change the default password to your own password with the change password
button:
Enter the current password into the Actual password text field. If the password is correct,
you can enter a new password. You must re-enter your password to ensure that you haven’t
mistyped. The new password is accepted only when both entries are identical.
You deactivate simple password protection with a click on the Deactivate password
security function and subsequent entry of the correct password in the confirmation prompt.
Take note:
Simple password activation/deactivation acceptance occurs immediately
and requires no additional storage.
To accept mode change from simple password to access configuration
and visa versa, the setting must be stored with the save settings button
and CID-Pro 4.02 software must be restarted.
User Manual
for CID-Pro
4.02
47
Section 4
Program parts and functions
4.2.6.2 Access Configuration - Settings
User administration allows and
requires creation of users with
appropriate
privileges
for
individual program parts. A user
logon is always required then.
Changes can be assigned to a
user.
Take note:
CID-Pro 4.02
software
must
be
restarted
after
selecting access configuration
so that the settings can be
accepted.
The list of user names
presented here shows all
established users.
The second column shows
whether the user possesses
administrative privileges. Only
users
with
administrative
privileges may create new
users, or delete or change
existing users.
There must therefore be at
least
one
user
with
administrative privileges.
After the initial installation, there
is only one user:
Administrator
with the password:
cid-pro
Take note:
Please pay attention to case (upper / lower case).
If you are logged on with administrative privileges, you can use the Insert and Change
buttons to determine user privileges, or remove a user with Delete.
48
CID-Pro 4.02
User Manual
Section 4
Program parts and functions
Administrator settings:
The administrator has full access. That means that all privileges are checked for the
administrator so that he has no limitations in regard to individual functions and the various
test units.
Furthermore, he has the option of editing other users with the Admin function.
Delete user:
Mark the names of the users to be deleted in the list and click the Delete button. Your entry
will be subsequently checked with the following confirmation prompt:
The user to be deleted, here “cts”, will be redisplayed.
With Yes, the user is finally deleted; with No, the deletion function is ignored.
Take note:
User Manual
Deleted users are irrevocably lost!!!
for CID-Pro
4.02
49
Section 4
Program parts and functions
Insert user:
You add a new user with the Insert button. Hereupon a window opens that you can supply
with the user name, password and repeat password, timed logout, units assignments, and
privileges.
With OK, the settings, and therewith the new user, are accepted.
With Cancel, new user creation is ignored.
50
CID-Pro 4.02
User Manual
Section 4
Program parts and functions
Change user:
If you would like to retroactively assign other privileges to the new user, mark the user you
would like to change in the user list and click on the Change button. The properties of the
user to be modified are subsequently displayed.
Now modify the user’s name, timed logout, unit’s assignment or privileges.
The modified settings are accepted with OK.
The user modifications are ignored with Cancel.
User Manual
for CID-Pro
4.02
51
Section 4
Program parts and functions
Change password:
If you want to change a user’s password retroactively, mark the user whose password you
would like to modify in the user list and click on Change password. Now enter the current
password into the Old password text field in the window that appears. If the password is
correct, you can enter a new password. You must re-enter your password to ensure that you
haven’t mistyped. The new password is accepted with OK only when both entries are
identical.
Take note:
Acceptance of changes in access configuration occurs globally,
requiring no additional storage as long as you possess change privileges.
To accept mode change from simple password to access configuration
and visa versa, the setting must be stored with the save settings button
and CID-Pro 4.02 software must be restarted.
52
CID-Pro 4.02
User Manual
Section 4
Program parts and functions
4.2.6.3 Access Configuration - In runtime operation
The status of logged on users is displayed in the status overview if you have activated
access configuration:
The meaning of the “key” symbol and user text is as follows:
Access Configuration
Inactive
active
open /
logged on
inactive
Symbol
---
Entry
menu bar
---
Explanation
No entry
present.
locked /
not logged on
User:
Administrator
logged on
User:
cts
logged on
User:
No user
logged on
The user is logged
on as “administrator”
in this mode and
consequently has full
access to all of the
software’s functions.
In this mode, the user
has logged on as “cts”
and has the privileges
that were defined for user
administration.
In this mode, no user is
logged on. That means
you have no privileges to
execute the defined
functions to service the
software.
User logon:
Click the closed lock symbol and you can logon yourself with user name and password:
User logoff:
Click on the open lock symbol and the mode switches automatically to locked operation
mode.
User Manual
for CID-Pro
4.02
53
Section 4
Program parts and functions
4.2.7 PDF Settings
In the PDF settings
following options may
selected:
the
be
- open immediately?
Check this box to select
whether the PDF files
created and saved in the
various
CID-Pro
menus are to be opened
immediately.
54
CID-Pro 4.02
User Manual
Section 4
4.3
Program parts and functions
Overview of all test units
Here you receive clear information about the state of all displayed test units. The information
can be viewed but not changed.
The following information is displayed:
•
Self-defined Unit Name/
units commission-number:
To better distinguish the units,
the self-defined, meaningful unit name and
unique commission number are shown.
•
Unit Type:
Unit’s type (from unit’s controller)
•
Mode/
Program name:
Manual Mode:
Program Mode:
•
First 3 analog channels:
Display of set and actual values of the
first three analogue channels. If only two channels are present, the third channel’s set and
actual values field is empty.
•
Remaining Prog. time:
Manual Mode:
Program Mode:
•
Start status:
green:
orange:
grey:
white:
unit started
unit started - Pause
unit stopped
no communication with the unit
•
Error status:
green:
red:
yellow:
no error
ERROR
Warning
"Manual-Mode" entry
test program entry
with complete path.
---test program’s remaining
runtime
}
with display of the/an
error number
With the Back button, you return to the status overview display.
Take note:
User Manual
With more then 12 units, the window can be enlarged from top to bottom.
for CID-Pro
4.02
55
Section 4
56
Program parts and functions
CID-Pro 4.02
User Manual
Section 4
4.4
Program parts and functions
Test-cycle program editor
4.4.1 Preface
If you open the editor, you will find yourself in “New test program” and can get started
immediately. Now the editor’s layout can certainly differ somewhat depending on which unit
you want to create the test program for. You only have available the analogue and digital
channels enabled by the controller of the unit in question. The active unit’s, e.g. unit 1’s,
configuration is therefore loaded during editor start-up. Two analogue (temperature and
humidity) and three digital (deep dehumidification, digital output 1 and digital output 2)
channels are available to you here in this example. Unit 2 provided other channels again.
Editor layout is dynamic. This means that the editor is updated when a different unit is
selected.
Enter on the right a list of program lines that the test unit should execute into the area. This
list can contain
• value lines (lines in which selected digital and analogue values are defined),
• loops (a command sequence that is multiply repeated),
• subprograms (program parts (modules), which are separately stored), and
• conditional jumps (jump to a selected target when a condition is fulfilled).
User Manual
for CID-Pro
4.02
57
Section 4
Program parts and functions
These individual lines are depicted on the graph (large area). The upper area, the y-axis, is
reserved for analogue values and the lower area for digital values. The x-axis defines the test
program’s temporal progression.
Analogue value lines are connected by line (value and time axis).
Digital states are displayed as bars.
Loops, subprograms, and conditional jumps are seen as coloured, vertical markings.
Statement of all important line information at a glance:
•
•
•
58
Line number and time
Analogue and digital channels with wait function if available
Relationship to next line: ramp with gradient, constant distribution or jump with
statement of X and Y axis segments (time and temperature/humidity difference)
CID-Pro 4.02
User Manual
Section 4
Program parts and functions
4.4.2 Buttons
Menus
Symbol
File
---
Submenus
Key
Also in
combina
tool bar
tion
New …
X
Ctrl+N
Open...
X
Ctrl+O
Save
X
Ctrl+S
Save As
X
Ctrl+A
Printer/Page install
Print...
Print as PDF…
Reference
New test program
cf. sec 4.4.4.1, p. 69
Open test program
cf. sec 4.4.4.2, p. 69
Save (as) test program
cf. sec 4.4.4.3, p. 70
Ctrl+I
Print Graphic
Ctrl+G
Print List
Ctrl+L
Print Both
Ctrl+B
Print Screen
Ctrl+T
Printer/page setup and print …
cf. sec 4.4.4.5, p. 71
Print Graphic as PDF
Print as PDF...
cf. sec 4.4.4.6, p. 72
Print List as PDF
Print Screen as PDF
---
Edit
Files last opened
Open test program (4.4.4.2)
Exit
X
Ctrl+E
Insert Line
X
Ins
Delete Line
X
Del
Cut Line
X
Ctrl+X
Copy Line
X
Ctrl+C
Paste Line
X
Ctrl+V
Block copy/insert ...
Block delete ...
F6
F7
Insert Start of Loop
X
F2
Insert End of Loop
X
F3
Call Subprogram
X
F4
Insert Conditional Jump
X
F5
Insert Program
X
F10
Refresh
F11
Templates
Templates
Extras
Options
Ctrl+P
Delete Program
Ctrl+D
Gradient ...
...with (Valued Calculation)
F8
...to (Time Calculation)
F9
Save File in Data pool ...
Ctrl+F
Save File as Library ...
Delete Template(s) / Library(ies)
Comment!
for CID-Pro
Edit lines (insert, change,
delete, cut, and copy) with
keyboard/menu functions
cf. sec 4.4.3.1, p. 60
Block of lines
cf. sec 4.4.4.7, p. 72
Loop (loop beginning and end)
cf. sec 4.4.4.8, p. 74
Call Subprogram
cf. sec 4.4.4.9, p. 75
Conditional jump
cf. sec 4.4.4.10, p. 76
Insert Program
cf. sec 4.4.4.11, p. 77
Refresh the editor
Templates
cf. sec 4.4.4.12, p. 78
Options (editor)
cf. sec 4.4.4.13, p. 79
Delete test program
cf. sec 4.4.4.4, p. 70
Set Gradient
cf. sec 4.4.4.14, p. 82
Save file in data pool
cf. sec 4.4.4.15, p. 86
Save file as library
cf. sec 4.4.4.16, p. 86
Delete Templates and
Libraries
Comment (editor)
cf. sec 4.4.4.17, p. 87
Zoom functions (editor)
cf. sec 4.4.4.18, p. 88
Zoom functions
User Manual
Exit the editor
4.02
59
Section 4
Program parts and functions
4.4.3 Generate a test cycle
To enter a new test program's points, you can place the desired points on the graph with the
mouse or enter the values directly into the list.
4.4.3.1
Edit lines (insert, change, delete, cut, and copy) with
keyboard/menu functions
1. Insert value line
With the ‘Ins’ key or the
symbol a new value line is entered into the list. This line
contains the same analogue and digital values as the previous line except for time
information. This amounts to 0 after the insertion.
All values are 0 if you insert a new line into an empty program or after a loop, a
subprogram or conditional jump because no defined value is given here.
2. Change line
This time, as well as all other analogue values, can be changed with the ‘Enter’ key if
the desired field is selected (the field is then blue), or by double clicking the left mouse
button on the desired field. A window now appears containing the old value. This can
now be changed or re-entered.
The desired action is also shown above the new value to avoid errors. Time in
minutes is shown here.
Pressing OK accepts the
new value, updating the
graph and list if needed.
Pressing Back ignores
changes
closes
the
window.
Time changed this way in
the list is always the line’s
run time. These run times
are lined up on the graph
for the complete test cycle.
Digital values can be
changed or negated with
the ‘Enter’ key if the
desired field is selected, or
by double clicking the left
mouse button on the
desired field.
This updates the graph bar display in the lower
area.
60
CID-Pro 4.02
User Manual
Section 4
Program parts and functions
A window with the corresponding values opens when changing a loop, subprogram, or
conditional jump line. You can then change values like the number of loop interactions
when starting a loop.
3. Edit multiple lines
Indicate the fields which you want to set to the same
value:
Use the ‘Enter’ button to open a window.
The indicated fields can be edited here.
Take note:
Only multiple-value lines can be edited. If there is a no-value line
(e.g. loop start) in the indicated range, the action is interrupted. That
means, after pressing the ‘Enter’ button the window does NOT
open.
Thus, a digital channel can be edited.
4. Delete lines
With the ‘Del’ key or the
symbol the currently active line is deleted from the list,
and thus from the graph. For safety, you are requested to confirm line deletion.
Take note:
With the ‘Del’ key or the
symbol you can also delete entire
blocks besides a marked line. For example, if you mark an arbitrary
number of lines in the first column (time), you can completely delete
these lines (cf. sec. 4.4.4.7 - Copy/insert a block of lines / delete a
block of lines, page 72).
5. Copy lines
With the ‘Ctrl’ + ’C’ key combination or the
symbol the currently active line is
copied. This line is now available for you to insert as a copied line (cf. point 7 – Paste
line copy)
Take note:
User Manual
With the ‚Ctrl’ + ‚C’ key combination or the
symbol you can also
copy entire blocks besides a marked line. For example, if you mark
an arbitrary number of lines in the first column (time), you can
completely copy these lines (cf. sec. 4.4.4.7 - Copy/insert a block of
lines / delete a block of lines, page 72).
for CID-Pro
4.02
61
Section 4
Program parts and functions
6. Cut lines
With the ‘Ctrl’ + ‘X’ key combination or the
symbol the currently active line is
copied and removed from the list and graph. For safety, you are requested to confirm
line cut. This cut line is now available for you to insert as a copied line (cf. point 7 –
Paste line copy).
Take note:
With the ’Ctrl’ + ‘X’ key combination or the
symbol you can also
cut entire blocks besides a marked line. For example, if you mark an
arbitrary number of lines in the first column (time), you can copy
these lines into the cut buffer. This marked block is ultimately
deleted cut (cf. sec. 4.4.4.7 - Copy/insert a block of lines / delete
a block of lines, page 72).
7. Paste copied lines
The ‘Ctrl’ + ‘V’ combination or the
symbol inserts the copied line (cf. sec. 5 and 6 Copy/cut line) after the currently active line and updates the list and graph.
Take note:
With the ‘Ctrl’ + ‘V’ key combination or the
symbol you can
insert entire blocks besides a marked line. If you have previously
marked and copied or cut a block, it is inserted after the currently
active line and the list and graph are updated (cf. sec. 4.4.4.7 Copy/insert a block of lines / delete a block of lines, page 72).
8. Wait function
If you want to assign a wait function to a
particular value, proceed exactly as when
changing a value line (cf. point 2 - Change line):
With the ‘Enter’ key if the desired field is
selected, or by double clicking the left mouse
button on the desired field.
Now you have the option of marking (place point
in the preceding field) the Activate field in the
Wait function area. By setting the wait function,
you can now enter the tolerance within which the
value is permitted to move, so that the program
can continue running. This tolerance signifies the
discrepancy between the nominal and actual
value, which must be undershot before this line
counts as completed. That means that a
tolerance threshold of 0.0 stops the program at
this place since this difference cannot be
undershot.
For the most part, a tolerance of 1K for the
temperature channel and 3-5 %rH for the
humidity makes sense.
62
CID-Pro 4.02
User Manual
Section 4
Program parts and functions
The value is accepted after confirmation with OK. With an activated wait function, the
list entry format changes from thin black
to heavy blue
The wait function causes the controller to wait long enough after completion of the line
for the actual value to reach the analogue channel's tolerance. Only then is the next
line executed.
Take note:
Only one channel per line can be assigned a wait function.
9. Software limit
It is possible to set a software limit for each
analogue channel.
A software limit means that the unit reports an
error and shuts down as soon as the channel’s
actual value lies outside of the permitted range.
These limits are transmitted to the controller
when the test program is started. The limits are
valid while the program is running. If the program
terminates, the limits valid before the program
started become valid again (cf. sec. 4.2.4 Configuration: Test specimen protection, page
43).
A channel’s limits can be entered in any arbitrary
line.
Minimum and maximum limits of 0.0 are entered
respectively if you have already worked with
earlier CID-Pro program versions. In this
case, channel limitation occurs in accord with its
input limits.
Take note:
User Manual
For Points 5-7 (copy/cut/paste lines) there is a cross-program line resp
block storage:
Copy a line/block in the first program and insert this copy into the new or
second program.
for CID-Pro
4.02
63
Section 4
4.4.3.2
Program parts and functions
Insert line and change graph with the mouse
1. Insert value line
For an empty program, you have the option to set a point by clicking the left mouse
button. The first click in the graph plots a point at time 0 and the value at where the
mouse points (initialization point). All other points are plotted as follows:
- Time axis (x coordinate):
coordinate is snapped to the nearest
(forward or backward) full second, minute, or
hour.
- Values axis (y coordinate):
coordinate is plotted on the exact value
at which the mouse is pointing.
The point plotted with the channel's colour: temperature red
The information on the upper right edge
facilitates exact point plotting, since it shows
the mouse coordinates relative to the graph.
So, in this example:
902 min and 63 °C
(Information depends on displayed scale)
When clicking on the graph and plotting a point, a value line is simultaneously created
in the table showing the new point‘s values.
All points needed for the test cycle can now be successively plotted in the same way,
i.e. you plot one point after the other from a temporal perspective. Since points are
immediately connected, you can only plot points in a free area of the graph (toward the
right). If you want to plot a point between already existing points, please refer to the
procedure from point 3 - Retroactively insert a values line.
A green cursor tracks during the creation of
such a point, showing you where you last
clicked the graph or plotted a point. This
cursor orients itself to a grid that you can
define in the editor’s options (cf. sec. 4.4.4.13
- Editor options, page 79).
If the cursor changes, change parameters are shown in both dimensions:
- Change time in minutes and hours
- Current channel value
- Gradient in unit/min
64
897 min and 14.95 hours
64.0 °C
-1.67 K / min
CID-Pro 4.02
User Manual
Section 4
Program parts and functions
Up to now, a point on the graph was defined with one analogue channel and time.
That’s alright too, if you have a unit with one channel. If your unit has several
controllable channels, however, you must have the option of changing this control
channel:
Creation of (red) temperature points:
Click on:
Temper
in °C
Creation of (blue) humidity points:
Click on:
Humidity
in %rH
The conversion occurs via the table column definition, by which the editor shows what
kind of point you want to create.
If you define a point after the conversion to humidity, a blue point with a blue line is
drawn on the graph and a value line is created in the list with the new humidity value. In
this case, the last temperature value is copied, i.e. the graph shows a temperature line
with zero gradients and the list copies the last value.
If you try to create a point outside of the channel’s permitted range, it will be pegged to
the minimum or maximum permitted value. For example, if you plot a humidity point < 0
%rH, this will be pegged to zero.
Take note:
User Manual
Time information in the list is always relative time between
points.
for CID-Pro
4.02
65
Section 4
Program parts and functions
2. Changing a values line
Changing a values line means that the temperature, humidity, or other value is
changed. If you want to displace the point laterally, that is right to left, you must make a
time change in the line list.
If you want to change a defined point via mouse, point the mouse at the new point (xaxis (time) is unchanged, y-axis (value) is displaced) and double click.
The point is displaced vertically on the graph and the connection is adapted.
The desired channel's value is changed in the selected line in the list.
In the chart, the mouse points to the
. The point should be displaced upward by
°C.
You have the option of placing the mouse in the X direction (time) approximately on
the point. Thanks to the raster/grid, you have an area of
around the point to
“hit”. If you leave the area to the left or right, you displace the point aside left or right.
The area does not quite reach half of the distance to the next raster line in each case.
Take note:
66
As when inserting a value line with the mouse, you must also select
the right channel when changing the line, otherwise you will displace
a channel that you didn’t want to displace at all.
CID-Pro 4.02
User Manual
Section 4
Program parts and functions
3. Retroactively insert a values line
Retroactively inserting a values line means that a channel‘s point is inserted between
two other points (the values line in the list is inserted between two other values lines).
The point will be created at this place on the graph and the connection adapted.
The mouse points to the
in the chart. A new point should be created there.
You have the option of placing the mouse in the X direction (time) approximately on
the point. Thanks to the raster/grid, you have an area of
around the point to
“hit”. If you leave the area toward the left or right, create a new point there if necessary.
The area does not quite reach half of the distance to the next raster line in each case.
Take note:
When you plot a new temperature point, a new humidity point is also
created if necessary. Generally, all other displayed channels receive
a new point (a complete values line in the list is created) so that
nothing in the gradient of the other channels changes.
The new humidity point
was calculated and involves no
changes in regard to the gradient of the former to the next humidity
point. The point is, so to speak, simply inserted.
As when inserting a value line with the mouse, you must also select
the right channel when changing the line, otherwise you will plot a
new point for a channel that you didn’t want to create at all.
User Manual
for CID-Pro
4.02
67
Section 4
Program parts and functions
4. Edit digital channels
There is the possibility to edit the digital channels across multiple lines.
The channels Output1 and Output2 should be changed as follows:
1. A double-click on a phase directly sets this digital channel
+
2. Mouse movement:
press and hold down the left mouse button at the start of the phase,
release at the end of the desired range
+ +
+ +
+ +
Take note:
68
The values in the table are automatically adjusted and updated!
CID-Pro 4.02
User Manual
Section 4
Program parts and functions
4.4.4 Functions
4.4.4.1
New test program
You can create a new test-cycle program with this function.
First, a selection of which test unit you want to create a new test cycle for appears.
After selecting a unit from the list and confirming with OK, the editor is re-built using the
selected unit’s configuration (digital and analogue channels and their assignments).
A confirmation prompt appears if the previous entry was not yet stored.
4.4.4.2
Open test program
You can open previously created test-cycle programs and load them into the editor. To do
this, select the desired file from the list and click on load.
To open a file with another unit’s configuration, change the file type and file name, for
example from *.Z01 to *.Z02.
Z01 unit 1,
Z02 unit 2, etc.
User Manual
for CID-Pro
4.02
69
Section 4
4.4.4.3
Program parts and functions
Save (as) test program
You save your test program with this function.
A star * is appended to the program’s name in the title line if you changed something in your
program. That’s the sign that your program needs to be saved, e.g. when exiting the editor, if
that’s what you want. You now have two options:
- Save
:
- Save as
Save the test-cycle program under the same
name you opened it with.
For a new program save as
:
Save the test-cycle program under a new name
that you enter in the storage dialog.
You can also overwrite a previous file,
but Windows will ask you for confirmation.
A test program can be copied by saving it several times with other names and/or extensions.
That way, it can also be made available to other test units.
Saved test programs are located in the “Zyklus” directory by default. This directory can,
however, also be switched.
Take note:
A test-cycle program created for a particular unit, like *.Z01 for unit 1, can
be saved with a different extension for a different unit, like *.Z02 for unit 2.
It should be observed in the process, that the digital channels’ order as
well as the analogue channels’ area must agree so that the test program
works for the new unit. An appropriate message appears in this case,
because a few adjustments have to be carried out in the background:
The positions of the digital channels have changed!
The program is adapted to the actual test unit configuration.
You are saving the test unit 1 program … for another test unit.
Please confirm that number and position of analogue and digital channels
are equivalent!"
4.4.4.4
Delete test program
You can select several files at once here to remove no longer needed test-cycle programs.
Confirm your selection with Remove (All).
You ultimately delete all the files you selected after activating OK in the confirmation prompt.
Take note:
70
Handle deletion with care!!!
Deleted files and data are irrevocably lost!!!
CID-Pro 4.02
User Manual
Section 4
4.4.4.5
Program parts and functions
Printer/page setup and print …
You can print out the created test-cycle program.
In the process, you have the option to select the test program’s graph (cf. point 2), the test
program’s list of values lines (cf. point 3), both graph and list together (cf. point 4), or the
display (screenshot, cf. point 5). Besides, you can still make printer settings (cf. point 1):
1. Printer/page setup
You have the following options after opening printer options:
- Graph:
If you want to print out the graph, you will
be queried for the printer and settings.
If you want to address your default printer
with unchanged settings, set the option to
circumvent querying the printer.
- List:
• Print format:
Set your format to portrait,
landscape, or printer settings.
• Show preview (editable):
Do you want no preview before printing
or do you want to show the list first in
the preview?
The preview is editable, i.e. it
can be changed in the window.
• Use your own address:
The list contains a file header containing
the CTS address.
If you want to give your own address, check mark the box next to
“Use own address” and complete the address data - company,
street, location, telephone, fax and internet.
You can also label the fields in accordance with user
requirements.
2. Print graph
After selecting this function, you will be shown the printer selection - depending on
options setting (cf. point 1 – Printer/page setup - graph) - the graph will be output on
the selected printer or your default printer.
User Manual
for CID-Pro
4.02
71
Section 4
Program parts and functions
3. Print list
This function prints the values list out on the default printer. Depending on print options,
you can control this print (cf. point 1 - Printer/page setup - graph).
4. Print both (graph and list)
Select this menu option if you want to print out the graph and values list together. The
functions are the respective individual functions, executed one after the other, which
can be individually configured in the settings (cf. point 1 - Printer/page setup graph/list).
5. Print screen
The screen will be output for you as you see it on the monitor. This function prints a
screenshot, except for the tool and menu bars.
4.4.4.6
Print as PDF...
The PDF print functions create PDF files with the same content as the standard print
functions, cf. sec. 4.4.4.5 - Printer/page setup and print …,
- Point 2 - Print graph
- Point 3 - Print list and
- Point 5 - Print screen.
After you select these functions a dialogue is opened in which you can indicate the name and
path under which the PDF file is to be saved. The path is the standard directory for the test
programs. The name differs as follows:
- Print graph
The standard name is the test program opened followed by the
unit number and the appendix 'Graphic', e.g.:
Test program:
NewProgram.z01
PDF graph file:
NewProgram_z01_Graphic.pdf
- Print list
The standard name is the test program opened followed by the
unit number and the appendix 'List', e.g.:
Test program:
NewProgram.z01
PDF list file:
NewProgram_z01_List.pdf
- Print screen
The standard name is the test program opened followed by the
unit number and the appendix 'Screen', e.g.:
Test program:
NewProgram.z01
PDF screen file:
NewProgram_z01_Screen.pdf
4.4.4.7
Copy/insert a block of lines / delete a block of lines
You can not only copy, cut and/or insert a values line, but also a complete block of lines.
72
CID-Pro 4.02
User Manual
Section 4
Program parts and functions
1. ...copy and insert
The following window opens after clicking on the Block
copy and insert function (F6 key):
In the process, the lines to be copied (from yellow
through pink) and the line after which the block is to be
pasted (light blue) are colour coded. The list is
adjusted and updated if information is changed:
any line can be selected.
always < as
Take note:
The copied block is inserting after the selected line!!!
2. ...delete
The following window opens after clicking on the Block
delete function (F7 key):
In the process, the lines to be deleted (from yellow
through pink) are colour coded. The list is adjusted and
updated if information is changed:
always < as
User Manual
for CID-Pro
4.02
73
Section 4
4.4.4.8
Program parts and functions
Loop (loop beginning and end)
You can repeat certain cyclic processes with a loop. A loop beginning and an end are
needed for this. Moreover, the number of repetitions must be defined at the beginning of the
loop.
- Loop beginning:
To program a loop, activate it with a left mouse
click on the line after which the loop is to begin.
Finally, press the “loop beginning
” function in
the tool bar or the F2 key. The display in the table
is as follows:
The 1x in the time column indicates that, at the
moment, the loop will iterate once. You see a
vertical pink line on the graph as a check
indicating the beginning of the loop.
Double clicking on the loop beginning line opens
the adjacent window for entry of the loop number.
This is accepted with OK.
- Loop end
Activate the line after which the loop should end
with a left mouse click. Finally, press the
“loop end
” function in the tool bar or the F3
key. The display in the table is as follows:
You see a vertical purple line on the graph as a
check indicating the end of the loop.
Take note:
Please observe that for each loop beginning a loop end must be
programmed. CID-Pro 4.02 checks the number of loop
beginnings and endings when you want to save the program. An error
message appears if this check should turn up different numbers.
The loops can also nested:
{
{ } }
S2
S1
74
Maximum number of different loops:
20
Maximum number of the same loop:
9999
CID-Pro 4.02
User Manual
Section 4
4.4.4.9
Program parts and functions
Call Subprogram
If subprograms are to be used, the subprogram must
always be compiled first and then the main program.
Using the left mouse button, activate the line after which
the call is to be inserted to insert a subprogram call.
Finally, press the “Subprogram
” function in the tool
bar or the F4 key. A window appears for the subprogram
call.
You can select the subprogram's filename in this menu.
Moreover, you assign the subprogram a location in the
controller with the program number choice. The
subprogram is transferred to this program location when
the program is sent. The main program and every
subprogram called must receive its own program
number. A main program can run only one subprogram
at a time.
If a new subprogram needs to be started while the old
one is still running, the old subprogram is terminated.
Likewise, all subprograms are terminated when the main
program terminates.
The status display in automatic mode always relates to
the main program. That means the test unit’s set values
don’t agree with the displayed values if the analogue
channels are active in the subprogram.
The following call record is displayed following the
marked line after confirmation with OK.
You see a vertical turquoise line on the graph as a check
indicating program invocation.
Subprogram application examples are the occasional
rapid switching of digital channels in a long main
program. The subprogram can store a constantly
recurring digital channel switching pattern. The desired
set value progression is now programmed in the main
program. The subprogram is inserted at the place where
the digital channels are to be switched and only the
digital channels are switched active in the subprogram.
If the digital channels are active in this subprogram, they remain in the state they had on the
subprogram's last line until a new line is reached in the main program. So reset no longer
needed digital channels at the end of the subprogram.
Take note:
User Manual
If a program is loaded with a name that is too long (max. length: 16
characters including file extension) an error message is displayed:
for CID-Pro
4.02
75
Section 4
Program parts and functions
4.4.4.10 Conditional jump
Conditional jumps are program jumps resulting from
digital input states. The jumping function allows the test
program to terminate or adapt in response to external
events.
To insert a conditional jump, activate the line after which
the jumping function is to be inserted with the left mouse
button. Finally, press the “Jump
” function in the tool
bar or the F5 key. A window appears for the conditional
jump. The following line is temporarily displayed in the
table:
The line to which the jumping function is to jump if the
conditions are fulfilled is given next (jump to line:).
Select the desired line here. As an aid, the selected line
in the table is displayed in blue and black.
You can select one or more channels as jumping
conditions. If several channels are activated, they are
joined with a logical OR. Moreover, the state of the
respective channel can be defined.
To activate the temperature, for example, check mark
the active box next to the channel on the left. This
activates the state and it is no longer greyed out.
You define the state by setting or resetting the button.
The 0 or 1 state is displayed.
The following jump record is displayed following the
marked line after confirmation with OK.
You see a vertical dark green line on the graph as a check indicating conditional jump.
Take note:
76
The jump function is active during the entire run time of the line following
the jump function. This way, not just a single query is possible, but a sort
of interrupt operation.
The displayed loop count and level are no longer correct if the jumping
function is used within a loop and the jumping target is outside of the loop.
CID-Pro 4.02
User Manual
Section 4
Program parts and functions
4.4.4.11 Insert Program
If a module program should be inserted, the module
program must always be generated first and,
subsequently, the main program.
To enter a module program, use the left mouse button to
activate the line which should be inserted after the insert
program. Click on the "insert program
" button or
press F10 to display the window to insert a module
program.
You can use this menu to select the file name of the
module program.
In addition, when selecting the program number, the
module program is allocated a place in the controller.
When the main program is sent, the module program is
transferred to this place in the program. The main
program and each module program used must be
assigned a dedicated program number. Only one
module program can ever run in a main program.
The status display in automatic mode displays both the
main program and the module program.
By confirming OK the following insert line is displayed
after the marked line:
There is a vertical light green control line in the graph,
this identifies the module program.
The third column (90 min) are the total run time of the
inserted program.
Take note:
Inserted module programs interrupt the main program. The main
program continues when the inserted module program ends. In
inserted module program analogue and digital channels as well as
time control are active.
If a program is loaded with a name that is too long (max. length: 16
characters including file extension) an error message is displayed:
User Manual
for CID-Pro
4.02
77
Section 4
Program parts and functions
4.4.4.12 Templates
You have the option to create templates if you repeatedly access a certain program or test
cycle. You open templates via the menu and save them, possibly with small adaptations and
under a different name. This way you can separately save, call, and adapt ever-recurring
procedures. These templates are comparable to Microsoft ® Word document templates
(*.dot), which establish a document’s basic structure.
1. Create a
test-cycle program
2. Save it in the CID-installation-path\zyklus\sample directory.
e.g.: C:\CID-PRO 4.00\zyklus\sample\IEC_68_2_30.Z01
(You can change or adjust this path in the configuration, general paths register).
3. The next time the editor is opened, thereby creating a new program, this program’s
file name appears as an entry in the “Templates” menu.
4. A test program opens in the editor when you click on this template. Confirmation
prompts concerning changes to an already edited, new program are displayed first.
5. Modify this open program to meet your current requirements.
6. Save the modified templates in the CID-installation-path\zyklus directory with “Save
as …” under a new name characteristic of this application or test. The “Save as …”
dialog shows the Zyklus directory as the default path.
e.g.: C:\CID-PRO 4.00\zyklus\TestSensorAZ01
Take note:
The "Save" function without a path request - so saving into the
already open file - is only executed with an additional confirmation
prompt, to avoid overwriting the template by mistake.
7. If you want to change the template in the CID-installation-path\zyklus\sample
directory, open the template as previously described, change it and use the “Save as
…” function to store it with the same name in the sample directory. An additional
confirmation prompt serves to prevent important templates from being accidentally
overwritten.
Take note:
78
Unit X templates are only visible in the editor when unit X was
selected before opening the editor, or when a new program is
selected.
CID-Pro 4.02
User Manual
Section 4
Program parts and functions
4.4.4.13 Editor options
-
General
Expand all loops:
If this option is set and loops are used in the generated test program, the loops are
displayed one after another corresponding to the stated number.
This way, the correct nominal value progression can be monitored, especially within
the scope of the jump, to the beginning of the loop and after loop completion.
If this option is not set, then the graph shows only one iteration through the loop.
Loops are displayed
differently for identical
programs.
Expand all loop = 0
one loop iteration
Expand all loop = 1
6 loop iterations
Editor line delete without security query:
If you have created a program and perhaps need to delete many lines, you have to
deal with the confirmation prompt at every line.
If you are sure that you haven’t made any mistakes, or it is not serious if you delete
a line by mistake, set this option (delete without security query) and you can delete
the line without the query.
User Manual
for CID-Pro
4.02
79
Section 4
Program parts and functions
- Scaling
As y-axis scaling, you can select whether the
same value range applies to all channels. The
scale is always the same in this case. It
begins with the smallest and extends to the
greatest value of all the analogue channels.
In the second variation, each channel receives
its own range. If the active channel is
switched, the scale changes accordingly and
the area presented on the graph switches.
This way, you have the option to set the area
for each channel resulting in maximum
resolution.
-
Time Axis
Enter the new time axis here. The maximum
value for one thing - how “wide” in minutes,
for example, should the time axis be - and the
units - seconds, minutes or hours.
If you have set the “convert program lines?”
option active and you change the unit relative
to your previous setting, the editor tries to
convert the old time values into the new unit,
from minutes to hours, for example, when
whole hours (every 60 minutes) were entered
on the line in question. If conversion is
possible, you can perform it after the
confirmation prompt.
Conversion from hours to minutes is always
possible.
If the “convert program lines?” option is not set active, only the units are changed.
That means that 5 minutes just become 5 hours.
Possible conversions:
Conversions
convert program lines?
yes
Seconds to hours
conversion check
Seconds to minutes
conversion check
Minutes to hours
conversion check
no
Minutes to seconds
Hours to minutes
Hours to seconds
No line with values under five seconds should be used for the seconds time basis.
Correct synchronization is not guaranteed otherwise due to the controller's cycle time.
80
CID-Pro 4.02
User Manual
Section 4
Program parts and functions
- Cursor Net
The granularity with which the cursor jumps
for graphical input can be defined in the grid.
This makes it easier to hit the desired points.
- Programs in unit
The potential exists here to save programs
already in the controller onto the computer or
send individual programs directed to the
controller.
Programs stored on the selected unit are
listed with Read proglist of contr.
The marked program can be uploaded and
stored on the PC. The file path and program
name are still queried.
Using send, a program can be selected on
the PC and ultimately transmitted to the
controller.
This option is only possible in relation to controller’s software version (starting with V162).
User Manual
for CID-Pro
4.02
81
Section 4
Program parts and functions
4.4.4.14 Set Gradient
The extra option Gradient … helps you further if you want to create programs with exact
gradients from point to point.
1. ...with (valued calculation)
You determine the y coordinate of the next point (e.g.
temperature value) with the specified duration and
desired gradient using value calculation.
You mark the line in the value list that you want to serve
as the starting point for the defined gradient. Then you
activate the Gradient with … function in the Extra menu
or the F8 key.
You can enter the settings for the defined gradient in the
following window:
- Rise of line:
- Heat:
- Cool:
Gradient starting point
positive gradient in K/min (> 0)
negative gradient in K/min (< 0)
General calculation:
Gradient = m =
y Temperature
=
x
Time
Example with start line: 2 (time 2 min and temperature 40°C) next point (time 8 min):
1.)
2.)
3.)
4.)
Gradient: heating 5 K/min
Gradient: heating 1 K/min
Gradient: cooling 1 K/min
Gradient: cooling 5 K/min
Point 3:
Point 3:
Point 3:
Point 3:
temperature = 80 °C ( = 40 °C + 5*8 °C)
temperature = 48 °C ( = 40 °C + 1*8 °C)
temperature = 32 °C ( = 40 °C + 1*8 °C)
temperature = 0 °C ( = 40 °C - 5*8 °C)
1.)
2.)
3.)
4.)
82
CID-Pro 4.02
User Manual
Section 4
Take note:
Program parts and functions
The controller tries to execute the specified gradient while the program
runs.
Please check your given unit’s max. rate of change. If the gradient in the
program exceeds your test unit’s max. rate of change, it won’t be
achieved.
Only two value lines may be edited. If a line is not a value line, e.g. the
beginning of a loop, the function will be cancelled with an error message.
If the value is calculating outside the permissible Y range (e.g.
temperature min-max values), the function will be cancelled.
The time between two points must not be equal to zero. If you have programmed a jump, the function will be cancelled with an error message.
This approach also applies to the retrospective editing of the test program. In other words, you have defined two points (e.g. temperature value
and time) which you now wish to adapt.
If you select the last line as the start line, you will also require additional
information about how long the ramp should last:
The time field takes the temporal
distance over into the calculation.
The
Y
coordinate
(e.g.
temperature) is calculated with the
help of the gradient and the
temporal distance, and this point is
then created in the editor.
User Manual
for CID-Pro
4.02
83
Section 4
Program parts and functions
2. ...to (time calculation)
You use time calculation to determine the x coordinate
of the next point (temporal duration) with specified
y coordinate of the next point (e.g. temperature value)
and the desired gradient.
You mark the line in the value list that you want to serve
as the starting point for the defined gradient. Then you
activate the Gradient to … function in the Extra menu or
the F9 key.
You can enter the settings for the defined gradient in the
following window:
- Rise of line:
- Gradient:
Gradient starting point
Gradient in K/min
(Heating or cooling is provided by entering the y coordinate
(e.g. temperature)).
Gradient = m =
General calculation:
Example with start
Next point
1.)
2.)
3.)
4.)
line: 2 (time 2 min and temperature 40 °C)
line: 3 (temperature 50 °C):
Gradient: 20 K/min
Gradient: 10 K/min
Gradient: 5 K/min
Gradient: 2.5 K/min
1.)
84
y Temperature
=
x
Time
Point 3:
Point 3:
Point 3:
Point 3:
2.)
time = 2 min
time = 4 min
time = 8 min
time = 16 min
3.)
( = 40 °C / 20 K/min)
( = 40 °C / 10 K/min)
( = 40 °C / 5 K/min)
( = 40 °C / 2.5 K/min)
4.)
CID-Pro 4.02
User Manual
Section 4
Take note:
Program parts and functions
The controller tries to execute the specified gradient while the program
runs.
Please check your given unit’s max. rate of change. If the gradient in the
program exceeds your test unit’s max. rate of change, it won’t be
achieved.
Only two value lines may be edited. If a line is not a value line, e.g. the
beginning of a loop, the function will be cancelled with an error message.
The values (e.g. temperature) between two points must not be equal to
zero. If you have programmed a horizontal straight, the function will be
cancelled with an error message.
This approach also applies to the retrospective editing of the test program. In other words, you have defined two points (e.g. temperature value
and time) which you now wish to adapt.
If you select the last line as the start line, you will also require additional
information about at which value (e.g. temperature) the ramp should end:
The value field (e.g. temperature)
takes the Y coordinate over into
the calculation.
The
temporal
distance
is
calculated with the help of the
gradient and the value (e.g.
temperature) entered, and this
point is then created in the editor.
User Manual
for CID-Pro
4.02
85
Section 4
Program parts and functions
4.4.4.15 Save file in data pool
The data pool denotes a virtual area in which globally valid test programs are saved. In other
words, you create a test program that you want to run on several identical test units. This
virtual area distinguishes itself from the normal program by its extension. Data pool programs
end with *.Pxx, for example, *P01. Normal programs end *.Zxx, for example, *Z01.
These data pool programs are manageable like normal programs. When opening the data
pool program, you must be sure to click on the data type: all files (*.*), then select and open
the right file.
The big advantage of these data pool programs consists of the fact that you can select not
just normal programs during automatic start-up, but also a data pool program that originated
from a different test unit. When loading a data pool program, the program’s configuration is
compared with that of the test unit on which the program is loaded. If the channels agree, the
data pool program can be loaded. If the configurations fail to agree on the most important
properties, transfer is prevented.
Please compare sec. 4.6 - Starting test programs (automatic), page 111 concerning the
exact procedure for the automatic operation of a data-pool program.
Take note:
It hardly pays to use this data pool program technique if you have many
different test units. This also applies to a few units with little in common
because it really must involve identical configurations.
If you have several identical test units, i.e. units with identical
configurations, then the data pool function makes sense because you
save time not having to repeatedly write a new, but identical test program
for a different unit.
Besides, the probability of error decreases when you only have to
maintain one program in contrast to five, ten, or more identical programs.
4.4.4.16 Save file as library
Libraries differ from templates (cf. sec. 4.4.4.12 - Templates, page 78) in the following
respects:
- Display:
- Storage:
libraries are displayed for all test units.
libraries can only be stored in the sample directory
CID-installation-path\zyklus\sample.
1. Create a test-cycle program
2. Save the library with the Extras/Save file as library.
The path and the file extension are not changeable here.
Path:
CID-installation-path\zyklus\sample
(You can change or adjust this path in the configuration,
general paths register).
Extension: .clib (CTS Library)
e.g.: C:\CID-PRO 4.00\zyklus\sample\IEC_68_2_30_Modul.clib
86
CID-Pro 4.02
User Manual
Section 4
Program parts and functions
3. The next time the editor is opened, thereby creating a new program, this program
appears as an entry in the “Templates” menu. The “.clib” is missing and is not shown
because this entry is unit independent and should consequently be shown for every
configuration and unit.
4. The test-cycle editor opens when you click on the entry. Confirmation prompts
concerning changes to an already edited, new program are displayed first. The
program is now opened as
C:\CID-PRO 4.00\zyklus\ IEC_68_2_30_Modul.Z01 (selected with test unit 1)
.
5. Modify this open program to meet your current requirements.
Take note:
If you store a program in a different unit’s library, the channels will be
adjusted following a confirmation prompt.
4.4.4.17 Editor comments
An input window opens in which a one to 250 character long commentary about the current
test-cycle program can be entered. You select OK to save the entries in the input window or
Cancel to close the window without accepting the changes.
Comments about a currently running program can be called up in the status overview in the
program automatic (cf. sec. 4.1.6 - Program automatic, page 26).
Moreover, the comments are also output when printing the test program - only in the list.
User Manual
for CID-Pro
4.02
87
Section 4
Program parts and functions
4.4.4.18 Editor zoom functions
The zoom function enables you to enlarge an area. You can repeat this procedure up to 19
times. In other words you can zoom 20 times. Proceed as follows to enlarge the desired
area:
1. Right click the desired area’s upper left corner and hold the mouse button
down.
2. Now drag the mouse with the depressed right button to the desired area’s
lower right corner.
3. The zoom function is applied after releasing the right mouse button and the
selected area is enlarged.
1.
2.
3.
Example for the above image:
1. Click and hold time = 6 min and temperature = 110 °C coordinate with the right mouse
button.
2. Drag the mouse with depressed right mouse button to the time = 10 min and
temperature = 40 °C coordinate.
3. Release the right mouse button.
88
CID-Pro 4.02
User Manual
Section 4
Take note:
Program parts and functions
The point connectors’ visible gradients can be displayed differently after
zooming if the relation of the x to the y-axis no longer agrees. Checking
the gradient by calculating the y segment length over x segment length
shows that the gradient is in fact unchanged.
You can repeat this zoom process up to 19 times:
These enlargements offer you the potential to
plot or translate points more precisely.
For example, translating the point by 2K from
80 °C to 82 °C can now be carried out without
problem.
The result in the complete overview then
appears as follows:
User Manual
for CID-Pro
4.02
89
Section 4
Program parts and functions
- Full screen:
Return from any arbitrary zoom level to the overall view / full
screen.
- Zoom out:
Zoom out a level (shrink)
- Zoom:
Zoom in a level (enlarge) assuming you’ve already defined this
level. If not, then the function or button is greyed out. That way,
you can always identify how far you have already zoomed.
Take note:
You can only zoom with precision on one object. That means, for
example, on 1 minute and 1 °C exactly.
The method of dragging the desired area with the mouse was explained in
this instruction manual based on the upper left to lower right corner.
You can carry out this function in an arbitrary direction.
The zoom area is depicted during zooming by a dashed rectangle. This
enables the area to be defined better.
90
CID-Pro 4.02
User Manual
Section 4
4.5
Program parts and functions
Graphical measurement-data analysis
4.5.1 Preface
In the graphical view, you have the option to graphically present and analyze acquired
measurements.
When starting graphical measurement data analysis, a pop-up window for loading a
measurement or the active record opens:
Take note:
At the first start of the graphical measurement-data analysis, default
settings are defined!
Failing to see a graph after loading a measurement may be caused by the
following:
- The selected file is empty or new (contains no data yet)
- No legend is shown, so most probably no channels were selected in
the measurement data record configuration or the settings were not
saved as default so that they were lost when the measurement file
was requested.
Sec. 4.5.3.9 - Options (Graphical measurement-data analysis) page
100 describes the exact approach to channel selection in more
detail!
User Manual
for CID-Pro
4.02
91
Section 4
Program parts and functions
4.5.2 Buttons
Menus
File
---
Zoom
View
Extra
Also in
toolbar
Key
combination
Open…
X
Ctrl+O
Delete
X
Ctrl+D
Print
X
Ctrl+P
Print as PDF
X
Ctrl+F
Symbol
Submenus
Exit
X
Ctrl+E
Complete Frame/Restore
X
Ctrl+R
Zoom Out
X
Ctrl+U
Zoom
X
Ctrl+Z
Zoom to cursor positions
X
Ctrl+S
Display
Ctrl+I
Analysis
Ctrl+A
Options
X
Convert to Excel - Program
Ctrl+T
Ctrl+X
completely
cursor position
Copy to Clipboard
Ctrl+C
Join Measurement Files
Ctrl+M
Cut current Measurement File (Cursor)
Settings
Open and load measurement
cf. sec 4.5.3.1, p. 93
Delete measurement
cf. sec 4.5.3.3, p. 95
Print measurement
cf. sec 4.5.3.4, p. 96
Print measurement as PDF
cf. sec 4.5.3.5, p. 96
Open and load measurement
(4.5.3.1)
Files last opened
Display Measurement Value
Reference
Setting 1
X
Setting 2
X
Setting 3
X
Setting 4
X
Setting 5
X
Setting 6
X
Setting 7
X
Setting 8
X
Setting 9
X
Setting 10
X
Exit the graphical
measurement-data analysis
Zoom functions (graphical
measurement-data analysis)
cf. sec 4.5.3.6, p. 97
Display
cf. sec 4.5.3.7, p. 99
Analysis
cf. sec 4.5.3.8, p. 99
Options (graphical
measurement-data analysis)
cf. sec 4.5.3.9, p. 100
Excel conversion program
cf. sec 4.5.3.10, p. 103
Display Measurement Values
cf. sec 4.5.3.11, p. 106
Copy to clipboard
cf. sec 4.5.3.12, p. 106
Merge measurement files
cf. sec 4.5.3.13, p. 107
Cut current Measurement File
(Cursor)
cf. sec 4.5.3.14, p. 107
Settings
cf. sec 4.5.3.15, p. 108
New Setting
Delete Setting
Help
Help
F1
Comment (graphical
measurement-data analysis)
cf. sec 4.5.3.16, p. 110
Comment!
92
CID-Pro 4.02
User Manual
Section 4
Program parts and functions
4.5.3 Graphical measurement-data analysis functions
4.5.3.1
Open and load measurement
This function opens a window with which any CID-Pro measurement can be loaded.
In the central area are data describing in detail the measurement currently selected in the
Filename field.
•
•
•
•
Start/end time
Number of analogue/digital channels
Number of lines, i.e. measurement values
Measurement data comments
Unit No: defined which unit measurements should be loaded. All displayed data relate to this
unit number. If this is changed, the files list in the Filename field switches to the
selected unit no.
Filename lists all files that were recorded with the selected test unit (here unit 1 - files:
*.m01).
If the cursor keys “up” / “down” (/) are used to switch to another file, the data in this
measurement file appear immediately along with the associated comments.
If the menu is clicked, a list of all the selected unit’s measurements in the given path
opens, here C:\CID-PRO 4.00\messung, in which the desired file can be selected.
: The current path from which the measurement files can be selected stands above the
Filename. This path can be changed to a directory selection with the
button. You
can change default setting of this entered path in the configuration, cf. sec. 4.2.5 Configuration: Generally, page 44. Click the button and you can select the desired file
User Manual
for CID-Pro
4.02
93
Section 4
Program parts and functions
in your network. Filename and measurement path are automatically set after “Load"
acknowledgement and the measurement information is displayed.
Load your desired measurement file into the graph window. The measurement is plotted on
the graph after the measurement file has been completely read (can vary widely
depending on size and data volume).
Active record is displayed (not greyed out), when one measurement record is running,
which you can display directly.
The difference between loading and active record is that the active record is updated.
: Searching for a measurement file?
The following window opens after clicking the search button:
You have the following options here:
- Path:
- File name:
- 7:
The search path is taken from the load window. If you want to
change a measurement file's search path, click the button and
select the desired path. Confirm with “Done”.
Enter the text you want to search for here. All measurement
files containing this text in there names are displayed as results.
You can only search in this directory for the selected path or
include all the subdirectories.
List containing all files found.
Number of files found.
-
Search is started.
- Load:
Read the measurement file and plot on the graph. Search and
Load windows are closed.
Search function cancellation.
- Text to Search:
- Subdirectory:
- Back:
94
CID-Pro 4.02
User Manual
Section 4
4.5.3.2
Program parts and functions
Working with graphical measurement-data analysis
Your analysis can begin when you have opened your measurement file:
- Zoom:
Display a characteristic region of your measurement.
cf. sec. 0 - Zoom functions (Graphical measurement-data analysis)
Analyze your curve progressions.
cf. sec. 4.5.3.8 - Analysis
Desired area can be either reached directly with the cursor or entered with
the keyboard at the lower image border. Both of the left number fields relate here to the left scale and both in the middle to the right scale. The colours match those of the cursor.
- Analysis:
- Cursor:
Cursor 1
Cursor 2
Channel temperature
in °C
4.5.3.3
Channel humidity
in %rH
Date
Time
Delete measurement
You can select more several files at once here to remove no longer needed measurements:
Confirm your selection with Remove (All).
You ultimately delete all the files you selected after clicking OK in the confirmation prompt.
Take note:
You can choose the measurement's data
connected/configured unit or from among all files (*.*).
type
from
the
Handle deletion with care!!!
Deleted files and data are irrevocably lost!!!
User Manual
for CID-Pro
4.02
95
Section 4
4.5.3.4
Program parts and functions
Print measurement
The printer function prints out currently displayed and loaded measurement. Print out options
can still be changed before spooling the measurement to the printer.
The printer can be selected in the upper area from among all installed windows printers.
Printer-specific settings like colour or grey scale printing, portrait or landscape, or intake and
exit paper tray can be made for the selected printer in the Properties… field.
Additional properties for the displayed measurement can be set in the lower part of the
window:
Width and Height
Hardcopy width and height - the default value, Entire paper, expands the plot to use the
entire width and height of the sheet. The printout’s width and height can be alternatively
given in 10ths of a millimeter.
Horizontal and Vertical offset
The plot is centered on the page by default. A value in 10ths of a mm can also be given
however to adjust for the binding margin, for example.
Force black & white
Useful setting when sending a fax, because shades of grey are very badly transmitted via
fax.
Bitmap printing
A finer, more optically appealing print image results without this selection. But bitmap
printout can make sense on ground of compatibility. Perhaps this selection must be made
when the printout doesn’t work right. Without bitmap printout, problems can show up in
connection with some printer drivers, especially when the PC has little memory.
4.5.3.5
Print measurement as PDF
The function Print PDF creates a PDF file of the measurement displayed and loaded at that
time. After you select this function a dialogue is opened in which the PDF file name and path
can be indicated. The storage path is the standard directory for the measurement record.
The standard name is the measurement displayed and loaded at present, e.g.:
Measurement record:
C_70_350.m01
PDF file:
C_70_350.pdf
96
CID-Pro 4.02
User Manual
Section 4
4.5.3.6
Program parts and functions
Zoom functions (graphical measurement-data analysis)
The zoom function enables you to enlarge an area. You can repeat this procedure up to 19
times. In other words you can zoom 20 times. Proceed as follows to enlarge the desired
area:
1. Right click the desired area’s upper left corner and hold the mouse button
down.
2. Now drag the mouse with the depressed right button to the desired area’s
lower right corner.
3. The zoom function is applied after releasing the right mouse button and the
selected area is enlarged.
1.
2.
3.
User Manual
for CID-Pro
4.02
97
Section 4
Program parts and functions
Take note:
The point connectors’ visible gradients can be displayed differently after
zooming if the relation of the x to the y-axis no longer agrees. Checking
the gradients by calculating the y segment length over x segment length
shows that the gradient is in fact unchanged.
You can repeat this zoom process up to 19 times; cf. sec. 4.4.4.18 - Editor
zoom functions, page 88 for a more detailed demonstration.
- Full screen:
Return from any arbitrary zoom level to the overall view / full
screen.
- Zoom out:
Zoom out a level (shrink)
- Zoom:
Zoom in a level (enlarge) assuming you’ve already defined this
level. If not, then the function or button is greyed out. That way,
you can always identify how far you have already zoomed.
- Zoom to
cursor positions:
Take note:
Place the cursor on the desired area and zoom exactly into it.
You can only zoom with precision on one unit.
The method of dragging the desired area with the mouse was explained in
this instruction manual based on the upper left to lower right corner.
You can carry out this function in an arbitrary direction.
The zoom area is depicted during zooming by a dashed rectangle. This
enables the area to be defined better.
98
CID-Pro 4.02
User Manual
Section 4
4.5.3.7
Program parts and functions
Display
The currently displayed curves, in the associated colours, can
be seen in the small display / legend on the graphic screen.
If you double click on of the analogue channels, the scaling
changes (depending on option setting (cf. Sec 4.5.3.9 - Options,
page 100)) left/right on the graph. The object as well as the
area it denotes, change to the preset colour.
The values in brackets (e.g. (-100°C / 200°C)) display the
current ranges of the scales. This is a very useful function
when zooming.
Min/max. values are the minimum and maximum values of the
individual channels of the current measurement. These are only
displayed when the Min/Max checkbox is activated in the option
"Display" (cf. Sec 4.5.3.9 - Options, page 100).
Activating the Display: Check mark View/Display in the menu, key combination Ctrl+I
or select Extra Options Display Show Small Display.
4.5.3.8
Analysis
Values occur in the analysis deriving directly from the two cursors. If these cursors are
placed at characteristic positions in the measurement, this position’s features can be read off
from the analysis.
The “down” and “up” values always relate to the left scale based on both cursors.
Depending on which cursor is above, changing this cursor changes the “up” field. It behaves
the same way for the “down” field.
The “left” and “right” values relate to relative time, based on the settings in the options.
Depending on which cursor is left, changing this cursor changes the “left” field. It behaves
the same way for the “right” field.
The left field, °C/min, represents the indicated curve’s calculated gradient and
consequently that of the two cursor crosshairs.
The difference and duration values of the area enclosed by the crosshair cursors serve to
realise the measurement record and show the difference between the two axes (here °C and
min).
Activating the Analysis: Check mark View/Evaluation in the menu, key combination Ctrl+A
or select Extra Options Display Show Evaluation.
User Manual
for CID-Pro
4.02
99
Section 4
4.5.3.9
Program parts and functions
Options (graphical measurement-data analysis)
- Preface
Various options can be set and changed in the following points for channel, display,
and evaluation. You have the following options when exiting the options:
- Back:
- temp…
- OK
The options window is closed without accepting the changes.
The changes are accepted, but not saved, for this measurement’s
setting. This means that the measurement will in fact be
displayed as desired, but these changes are no longer available
when reopened.
All changes are permanently saved via file and are
available to you when the measurement data analysis is reopened
or CID-Pro 4.02 is restarted.
- Channel
Click to select the analogue and/or
digital channels that you want to
see on the graph. By clicking, you
have additional selection options in
the window that appears for this
channel.
Digital channel:
This window appears by clicking a digital channel. The colour in which the channel,
“temperature” in this case, is to be represented can be selected here.
With Delete, you remove the check mark and the channel is not presented.
With Save, the colour is accepted and the channel is presented on the graph (check
mark appears).
100
CID-Pro 4.02
User Manual
Section 4
Program parts and functions
Analogue channel:
This window appears by clicking an analogue
channel. Here you can select this channel‘s set
and/or actual value, here the “humidity”, and the
respective colour.
A selection of all possible colours (dependent on
the windows system setting) opens by clicking on
the colour area. Right click to select your desired
colour. The channel is not shown if you have
selected neither set nor actual value.
By clicking the right scale, this channel’s scale is
presented on the graph’s right border (the left side
is the default).
This has the advantage that you have the correct scale for several curves on the right
or the left and the printout is clearer.
If you only want to look at a particular area of your curve, you can define this area with
Y-Max and Y-Min. The maximum values must be greater than the minimum, otherwise
the entry is ignored and the area not automatically adjusted to the curve.
With Delete, you remove the check mark and the channel is not presented.
With Save, the colour(s) is/are accepted and the channel is presented on the graph
(check mark appears).
Take note:
If your definition of the various channels must proceed quickly, you
can define the default values, which appear as follows:
Digital channel
Channel 1
(temperature)
Channel 2
(humidity)
Channel 3
Channel 4
Analogue channel
Channel 1
(temperature)
Channel 2
(humidity)
Channel 3
Channel 4
User Manual
for CID-Pro
4.02
Value
Colour
Yes
Red
Yes
Blue
Yes
Yes
Green
Black
Status
Set value
Actual value
Right scale
Y max
Y min
Set value
Actual value
Right scale
Y max
Y min
Set value
Actual value
Right scale
Y max
Y min
Set value
Actual value
Right scale
Y max
Y min
Value
Yes
Yes
No
200
-100
Yes
Yes
No
100
0
Yes
Yes
No
0
0
Yes
Yes
No
0
0
Colour
Dark red
Light red
Dark blue
Light blue
Dark green
Light green
Black
Dark grey
101
Section 4
Program parts and functions
Generally
- Display
You have additional options in the
display to adjust the graph to your
wishes:
You can make the cursor visible
here - this is recommended when
printing several curves.
You can show the Small Display
and the Min/Max values (cf. sec.
4.5.3.7 - Display, page 99) and
show the evaluation (analysis)
(cf. sec. 4.5.3.8 - Analysis, page
99).
You can present the entire
measurement value display in more
detail if you check the High detail
option. The measurement value are
presented in detail to a resolution of
0.1 units (reduces operation speed).
Real-Time
If you want to permanently define
the time scale, deactivate the
Show Real-Time display field.
Now set your desired X-Max and X-Min values. Due to automatic division, it is not
always possible to maintain the permanently set time axis. Small differences can arise.
If the graph should always adjust automatically, make sure when you exit Options with
OK or “Default” that identical values or 0s appear in both fields!
If you activate Show Real-Time, the time axis will be shown with exact time
information.
You can define the appearance of the time axis yourself. To do this, enter the desired
interval in the Start-date/time and Stop-date/time fields. Conform to the existing input
format or your entry will be ignored.
The actual start-stop date is displayed in the field below, which is entered in the
date/time field with Save.
The Time format can be varied using the Format and Display switches. If you change
the settings, you can determine the changes directly from the screen and define them
as defaults to best suit yourself.
- Evaluation
Hide
Humidity
actvalue,
if
Humidity is OFF is a function
controlling the 2nd channel’s actual
humidity value.
102
CID-Pro 4.02
User Manual
Section 4
Program parts and functions
4.5.3.10 Excel conversion program
Measurement files, which Microsoft ® Excel can read and display, can be converted into
ASCII formatted text files using the new conversion program CID Measurement file >>
Microsoft ® Excel - Ver. 2.2.
This program can be started in two ways:
1. In the graphical measurement-data analysis via the menu entry
Extra Convert to Excel - Program
2. By starting the CID-installation-path\convert.exe program
in the program manager (windows explorer)
The conversion program starts after carrying out one of the two actions:
A list of all measurements stored in the selected directory - here, C:\CID-PRO 4.00\messung
in the upper left - can be seen in the program’s left area. All measurement files (*.*) are
shown here and not just particular test units.
The files to be converted can be marked in the list. Multiple selections are possible.
The directory can be changed and a file directly selected with the
then taken and the list updated based on the path.
button. The new path is
In the program’s right area stand the data describing in more detail the measurement active
at the moment, selected in the Filename field, and marked in the list.
•
•
•
•
•
Start/end time
Number of lines, i.e. measurement values
Number of analogue/digital channels
Measurement data comments
Listing of all analogue and digital channels
User Manual
for CID-Pro
4.02
103
Section 4
Program parts and functions
The analogue and digital lists provide all the channels, which can be represented with the
measurement file. All channels are checked by default. In other words, all channels are
processed during the conversion.
If, however, only particular channels are needed, because some channels are unimportant or
there is just too much data, the important channels stay checked and the unneeded channels
are deactivated (unchecked). Now only the channels activated and selected with check
marks are converted.
The decimal places relate to the output from the analogue channels.
The Comments are purely for display and cannot be changed. It certainly won’t be included
in the conversion.
Back terminates the program.
Convert starts the program. Now all marked files are individually converted one after
another.
selected file
You must successively enter new file names for all selected files. It is not necessary to
append a file extension because the conversion program independently appends “.csv”, the
usual Microsoft ® Excel extension.
Conversion, which can last a few minutes depending on file size, begins after correct entry of
the respective new file names.
All existing data/lines, i.e. all currently selected analogue and digital channel measurement
values, are converted.
Now you can read the converted files generated into Microsoft ® Excel or even another
spreadsheet program. To this, when opening the file saved in text format, you can further
define:
- Open spreadsheet calculation
- Select and open the desired file with File/Open…
- Start the Text Import Wizard
Select data type Delimited
Semicolon as
delimiter
Possibly adjust
column data format
- Finish Text Import Wizard
Microsoft ® Excel Help further describes the importation of text formatted files and should be
able to help you with further problems.
104
CID-Pro 4.02
User Manual
Section 4
Take note:
Program parts and functions
The file created by the conversion program uses a comma as the decimal
symbol (e.g. 123,40°C). Microsoft ® Excel may choose the decimal
delimiter based on country (Menu: Extras Options International
delimiter resp File Options Advanced Editing options
delimiter). The delimiter must match here to import files to be converted
without problem.
Individual table cells are separated with semicolons (;).
System dependent value distortions could arise if the tables are compared with a different
system. If you activate Interpolation to fixed time period, all measured values are adapted
to the time pattern entered and required by you, in this case 60 seconds - 1 minute:
z.B.
°C/min
08:00:00
08:01:00
08:02:00
08:03:00
08:04:00
08:05:00
08:06:00
Zeit/min
08:01:20
Legend:
Original curve
Original points form the measurement file that are easily time-shifted
Interpolated/approximated curves from the measurement file
(with time-shifted points)
Calculated values, which now correspond to full minutes
Curve through calculated values, which now correspond to full minutes
Caution:
The measured values are adapted, in other words they are calculated
and not measured!
Take note:
The measurement value (y-axis, e.g. °C) is calculated proportionally
from the preceding and following point.
For minor changes in the curve, the measured and calculated values are
more or less equal.
For major changes in the curve, the calculated values are inaccurate
from the start.
User Manual
for CID-Pro
4.02
105
Section 4
Program parts and functions
4.5.3.11 Display Measurement Values
This function displays the data records of the loaded measurement file in a separate window.
In this display the data records are listed with the following information:
•
•
•
exact time information (date and time)
all analogue channels (set and actual value) down to 4 decimal places
all digital channels (actual value)
•
Number of listed data records/entries in the window's header, here 2842 entries!
In this display, the measured values can be compared and the ranges analysed exactly, such
as measured values between 1 p.m. and 2 p.m. of the same day.
Under
- completely
the data records of the complete file are displayed!
- cursor position
the data records for times between the two cursors are displayed.
This function is only executed if the cursors are active. In this
case, the start and end time of the cursors and/or the order are
not of importance.
Note:
The open measurement file is not changed by this display!
4.5.3.12 Copy to clipboard
To be able to insert the current graphical measurement-data analysis view into Microsoft ®
Word, the view must be copied to the clipboard.
This function saves the screen to the clipboard as a picture. You can ultimately insert the
view into all programs having access to the clipboard and consequently the ability to insert
images. Microsoft ® Word, Microsoft ® Paint, Microsoft Photo Editor or even Corel PhotoPaint for example, insert it as a new image.
The view described here describes the graphical measurement-data analysis screen without
symbol or command bar as saved to the clipboard. View/analysis arrangement (whether and
where the dialogs are located), zoom factor (is a section displayed enlarged), options setup
(which channels are presented) and the program size itself can be determined and are taken
into consideration when copying to the clipboard.
A comment will be displayed at the top of the copy stating the software version, copy date
and time and file name and path.
106
CID-Pro 4.02
User Manual
Section 4
Program parts and functions
4.5.3.13 Merge measurement files
Extras/Merge measurement files
Select and confirm first measurement file.
Select and confirm the measurement file to be
appended to the end of the first measurement file.
Select and confirm the measurement file to be
appended to the end of the resulting measurement file.
Terminate the append loop with “Cancel”.
Select the name of the new, or to be
overwritten measurement file and save it.
Take note:
as often as required
This function gives you the opportunity to merge measurement files. You have, for example,
split measurement files or you only want to merge part of a measurement into a file. The
function executes by means of selection dialogs and not via a separate window:
The measurement files’ structure will be investigated thereby insuring that
only identical measurement files are merged. A message will notify you of
a non-identical measurement file structure and this file will not be
considered. You can however select a measurement file.
4.5.3.14 Cut current Measurement File (Cursor)
If only a certain time range is necessary from a measurement file, the loaded measurement
file may be cut. The two cursors are used to define the range to be saved as a cut file.
Proceed as follows:
•
Open the measurement file to be cut
•
•
Mark the range with the two cursors
Execute the function 'cut current measurement file'
Now, the opened measurement file has been cut and
saved in a new file with the appendix '_Cut'!
•
Open the newly saved cut measurement file
Name convention:
Original file:
Cut file:
User Manual
C_70_350.m01
C_70_350_Cut.m01
for CID-Pro
4.02
107
Section 4
Program parts and functions
4.5.3.15 Settings
The complete settings of the graphic display are saved in one setting. That means, settings,
for example, in the options analogue and digital channels and their presentation are stored in
the setting. Different settings can be defined for various purposes, depending on what should
be displayed.
These settings can only be switched with a click of the mouse.
The procedure to create new settings is as follows:
• Setting 1 is the Start setting, which is present from the start and cannot be deleted.
• Define the presentation of the graph in Options e.g. number and presentation of the
analogue and digital channels or the real-time display etc.
• Select in the Settings menu the New Setting entry to create a new setting the
presentation of the graph window is reset to the standard settings.
• Now define the presentation of the graph for the 2nd setting in Options e.g. number
and presentation of the analogue and digital channels or real-time display etc.
• Now select other settings and options that are useful.
Various settings are briefly described as follows:
1. Setting: Temper-Humidity
Display:
Temperature (Set/Act)
Humidity (Set/Act)
Setting Name:
Temper-Humidity
2. Setting: Default Setting
Display:
Temperature (Set/Act)
Humidity (Set/Act)
Watertank (Set/Act)
TemperIn (Set/Act)
Setting Name:
Default Setting
(the first 4 analogue
and digital channels
were selected
default values)
108
CID-Pro 4.02
User Manual
Section 4
Program parts and functions
4. Setting: Test 1234
Display:
TemperOut (Set/Act)
HumidityInlet
(Set/Act)
HumidityOut (Set/Act)
4 other digital
channels as the
standard setting.
Setting Name:
Test 1234
Characteristics of the setting displays:
•
New Setting
•
Delete Setting
displayed.
•
By clicking on a setting number, e.g. 4 in the setting menu or in the toolbar
, this setting will is be loaded.
A defined setting is displayed in the menu in regular font and, where applicable,
the setting name is displayed. The symbol is displayed in the toolbar.
A non-defined settings is displayed in the menu, dimmed and cannot be
selected. This setting is not available in the toolbar (cf. the Setting 3 examples
shown here)
(in the Settings menu) is used to create a new setting.
(in the Settings menu) is used to delete the setting currently
The selected setting is ticked in the menu and displayed red in the toolbar
•
•
.
A new setting is always placed in the next available storage location.
Setting 3 is created.
The setting name can be freely selected in Options and will be reproduced when the
title bar is selected.
Take note:
User Manual
All settings directly relate to the selected/loaded file.
It is not possible to load another file for each setting.
for CID-Pro
4.02
109
Section 4
Program parts and functions
4.5.3.16 Comments (graphical measurement-data analysis)
Comments belonging to the measurement open that you can arbitrarily change here. All text
editor functions are possible here:
Take note:
110
Maximum comment length: 255 characters!
CID-Pro 4.02
User Manual
Section 4
4.6
Program parts and functions
Starting test programs (automatic)
Starting test programs produces automatic operation. In the process, the compiled test
programs are transmitted to the selected test unit.
4.6.1 Selection the test-cycle program
Choose the desired Unit No to which the test program should be sent.
The number under which the program is stored in the controller is defined under Unit Prog
No.
The program type selection, here Test Unit 1, indicates whether a unit program like unit 1
(*.z01) can be selected or a program from the data pool, meaning all *.P* programs. The
adjacent text on the right, here *.z01, shows which kind of program may be selected.
Program Name shows the desired program that was selected with the
selection window.
“Send” transmits test program data, but only if a program was selected.
User Manual
for CID-Pro
4.02
button in the file
111
Section 4
Program parts and functions
4.6.2 Recording the test-cycle program
You have the option of starting a test program recording.
Please proceed as follows to activate the recording:
1. Clicking on “Recorder” opens the following window:
2. You give the measurement file a name by selecting a file with save as in the following
file-save window, or creating a new file and confirming with save.
If you want to append a measurement to an already existing file…
- Select the existing file.
- Confirm that this is the file you want to replace or overwrite.
- Choose YES to append the new measurement to the already existing file or
NO to permanently overwrite the selected (existing) file.
112
CID-Pro 4.02
User Manual
Section 4
Program parts and functions
3. If possible, enter a distinguishing comment for this program and consequently for the
measurement. You can describe the progression in more detail with the comment or
insert special remarks.
4. The recording rate (Recording all … seconds) defines the time intervals at which
recording occurs and is consequently critical for the recording data set.
For a test program with few changes, it normally suffices to record every 5 minutes
300 seconds.
For programs with frequent changes, a one minute or 30 seconds default value is
quite sensible. The exact information varies for each test unit and test program and
can be set arbitrarily.
Please note:
The minimum value of the recording rate is dependent on the
scanning rate in the configuration!
This interval only applies to the currently selected unit. If you start
further recording with another unit, you can enter another
recording interval there.
The recording principally has a very easy, system-defined temporal error which you can calculate out using the Excel conversion
program (cf. sec. 4.5.3.10 - Excel conversion program, page 103).
5. The recording settings are accepted with “OK” and discarded with “Back”.
User Manual
for CID-Pro
4.02
113
Section 4
Program parts and functions
4.6.3 Start options
After program transmission it is possible to enter a Starting - time and date - and a Offset
for the program
Program Start:
Starting time and date are entered via the keyboard. In this connection, any arbitrary,
admissible date within a year can be entered. The time must conform to the hh:mm
(hour:minute) format. The entry is ignored if the prescribed formats are not adhered to.
If a time is entered prior to the current time, having thus already passed, the current
clock time is assumed so first change the date then the clock time.
The current date is assumed if an incorrect date is entered.
Take note:
Check the current system date!!!
Program Offset:
The Line No. field defines the start line and serves to skip over the beginning of the
program. The range within which the entry can lie is given to the right of the starting
line field and depends on the length of the selected program, in this case [0..66].
The information in the Offset field changes with the entry of a starting line. Here the
time to be skipped is calculated.
Loop iterations and wait functions are not taken into consideration during the
calculation. The lead time can be entered directly if you want to provide a lead time in a
loop. A “-1” is then shown in the start time field since a line assignment missing.
The current clock time and program start on the first line are defaulted to if program starttime or program lead time line are not entered Start: now and on the 1st line.
114
CID-Pro 4.02
User Manual
Section 4
Program parts and functions
4.6.4 Automatic mode
Automatic operation starts after confirmation with “Start” (all settings are accepted and
processed) and “Back” (Automatic window is closed).
Display for the recording:
If you have started an automatic recording, the selected test unit’s background
changes to pink in the unit overview display (cf. sec. 4.1.3 - Test Units, page 21):
Display for the starting time:
The test unit starts the program at the given time!
The unit status display changes depending on the kind of start time point - immediately
or later - you have chosen (cf. sec. 4.1.5 - Unit and error status, page 23):
Start immediately:
Automatic mode
Take note:
User Manual
Start later:
programmed starting time:
15:00 07.09.2010
Automatic recording shuts off automatically after the program terminates.
In contract, manual recording (cf. sec. 4.7 - Manual measurement
recording, page 117) continues running after program termination.
for CID-Pro
4.02
115
Section 4
116
Program parts and functions
CID-Pro 4.02
User Manual
Section 4
4.7
Program parts and functions
Manual measurement recording
Continuous saving of measured in data is activated in the manual measurement recording
menu (name of test unit currently selected in status overview is shown in the title).
4.7.1 Starting a manual measurement recording
Record options:
The recording rate (Recording all … seconds) defines the minimum time intervals,
which should separate measurement points, and is consequently critical for the
recording data set.
For a test program with few changes, it normally suffices to record every 5 minutes
300 seconds.
For programs with frequent changes, a one minute or 30 seconds default value is quite
sensible. The exact information varies for each test unit and test program and can be
set arbitrarily.
Take note:
Minimum recording rate depends on the scanning rate in the
configuration!
This interval applies only for this currently selected unit. You can
provide a different recording interval there if you start another
recording with a different test unit.
In principle, the recording has a very minor, system dependent,
temporal error, which you can compensate for with the Excel
conversion program (cf. sec. 4.5.3.10 - Excel conversion program,
page 103).
User Manual
for CID-Pro
4.02
117
Section 4
Program parts and functions
Enter a file in a file selection window with the save as button into which the
measurements should be stored. This selection is necessary so that the recording can
be started.
If you want to append a measurement to an already existing file…
- Select the existing file
- Confirm that this is the file you want to replace or overwrite.
- Choose YES to append the new measurement to the already existing file or
NO to permanently overwrite the selected (existing) file.
A comment window will appear in which you can describe a measurement in more
detail or enter special remarks if you have selected an already existing or new
measurement file.
118
CID-Pro 4.02
User Manual
Section 4
Program parts and functions
Start options / Start at…:
Besides the immediate recording start, the delayed start
can also be activated. Start time and date are entered via
the keyboard. In this connection, any arbitrary, admissible
date within a year can be entered. The time must conform
to the hh:mm (hour:minute) format. The entry is ignored if
the prescribed formats are not adhered to.
If a time is entered prior to the current time, having thus
already passed, the current clock time is assumed so
first change the date then the clock time.
The current date is assumed if an incorrect date is entered.
Take note:
Check the current system date!!!
Cyclic storage:
Cyclic storage make sense if you have extremely large
datasets or you want to have, for example, a measurement
file completed daily during a very long test cycle. A window
opens to specify the cycle interval if you activate this
function:
User Manual
for CID-Pro
4.02
119
Section 4
Program parts and functions
The following time intervals are available to you:
Time
interval
Storage options
minutes
5 by the minute
(00, 05, 10, 15, ..)
daily
no. of days +
hours/minutes
max. 60 days +
by the hour +
5 by the minute
(00, 05, 10, 15, ..)
weekly
Week day +
hours/minutes
Weekday (Sun-Sat) +
by the hour +
5 by the minute
(00, 05, 10, 15, ..)
Day of the month +
hours/minutes
01.-28 of the month +
by the hour +
5 by the minute
(00, 05, 10, 15, ..)
hourly
th
monthly
If you change the interval and the parameters associated with it, the next storage date
will be immediately updated.
Configure into the file format how automatically created measurement files should be
identified.
- Date in the format: yyyy.mm.dd-hh.mm.ss
year(4 place).month(2 place).day(2 place)-hour(2 place).minute(2 place).seconds(2 place)
- Text + Date in the format: yyyy.mm.dd-hh.mm.ss
stored measurement file:
automatic file 1:
automatic file 2:
…
C:\CID-PRO 4.00\messung\Test-SensorA.m01
C:\CID-PRO 4.00\messung\Test-SensorA_2010.08.26-14.30.00.m01
C:\CID-PRO 4.00\messung\Test-SensorA_2010.08.26-15.30.00.m01
In the process, the measurement values are always stored in the original-measurement
file, here Test-SensorA.m01. This is renamed with the storage time, here to TestSensorA_2010.08.26-14.30.00.m01, and re-saved so that recording can be continued
with the original-measurement file.
Activate the second file format variant and define a text substring if you still want to
append another text.
Example text substring:
stored measurement file:
automatic file 1:
automatic file 2:
…
120
A375
C:\CID-PRO 4.00\messung\Test-SensorA.m01
C:\CID-PRO 4.00\messung\Test-SensorA_A375_2010.08.26-14.30.00.m01
C:\CID-PRO 4.00\messung\Test-SensorA_A375_2010.08.26-15.30.00.m01
CID-Pro 4.02
User Manual
Section 4
Program parts and functions
The settings for the cyclic storage of the recording are accepted with “Activate” and
discarded with “Back”.
A green LED in the manual measurement recording window indicates the activated
cyclic storage after activating the recording.
The activated cyclic storage is also displayed in
the status overview’s top bar, again identified
by a green LED. Next to it, the days, hours,
minutes, and seconds remaining before the
next storage are shown.
User Manual
for CID-Pro
4.02
121
Section 4
Program parts and functions
The recording starts if these settings are accepted with “OK”.
Such a manual recording changes the selected test unit’s background in the unit overview
display (cp. sec. 4.1.3 - Test Units, page 21) to yellow or red:
manual started, active recording
with immediate start
with delayed start
Take note:
This started manual recording runs until the hand stops again (cf. sec.
4.7.2 - Stopping a manual measurement recording, page 122). It is to be
used mainly during manual operation or when automatic recording is not
possible.
4.7.2 Stopping a manual measurement recording
In contract to automatic recording, manual recording does not stop independently.
Click the
Take note:
122
icon if you want to stop manual recording of the selected test unit.
The Stop icon can also stop automatic recording.
CID-Pro 4.02
User Manual
Section 4
4.8
Program parts and functions
Operating hours and event counter
The counter menu presents two different lists:
The top list shows the operating hour’s counter - here the total operating hours in unit 1 and
further operating hours from the compressor and other components used.
In the bottom list, the event counter is shown e.g. from solenoid valves or overpressure
switch. These count, for example, the valve switching cycles.
All counters are shown with the instantaneous value (actual value), its unit, and the
maximum value (threshold), which the counter may assume.
If CID-Pro 4.02 receives a warning alert from the active test unit, the associated line
in the list is shown in red and a remark is appended.
If you are authorized to change the displayed counters, you can open this window by double
clicking, or pressing the “Enter” key on, the activated line:
The threshold and/or actual values appear, depending on which values you are able to
change. Confirm the modifications with OK and send the new values to the active unit. You
can ignore the changes with Back.
User Manual
for CID-Pro
4.02
123
Section 4
124
Program parts and functions
CID-Pro 4.02
User Manual
Section 4
4.9
Program parts and functions
Event logs (reports)
4.9.1 Preface
The report function runs constantly in the background with
records various user and test unit actions.
CID-Pro 4.02 software. It
When you open the report menu, the current report file is always automatically opened. You
will see all actions which have been recorded together with the settings which you made with
the options (cf. sec. 4.9.3.9 - Options (event log), page 135).
All actions are filed in a file which is issued new every month. The date of creation can be
seen from the filename.
In this example, the file was created on 01.09.2010.
(CID-installation-path\report\20100901.REP)
Please note:
From version 4 of CID-Pro software onwards, the report files are
saved in the following format
yyyymmdd.rep
Year(4-digit)Month(2-digit)Day(2-digit).rep
This allows them in the system to be considerably better filed, and
enables searches for particular dates.
User Manual
for CID-Pro
4.02
125
Section 4
Program parts and functions
It can happen that the entries in the list are so long that they are not completely readable.
Left click the desired line. You get a context menu if you now click the right mouse button.
Here you can select display line to pop up a window displaying the line's entire content.
or
You have the additional option of inserting comment lines into the report via this context
menu.
You can insert a free
text
explanatory
comment
in
the
comment
field
e.g.
power failure at the PC.
The list displays user-entered report lines are displayed in blue.
If the test unit number is given as 0 (zero), the entry is not assigned to any particular test
unit, but to the entire system:
With a unit number greater than 0 (zero), e.g. 1, the entry is assigned directly to this test unit:
In this way, lines inserted via the context menu can also be deleted again. No confirmation
prompt appears, however.
Take note:
126
Deleted comment entries are irrevocably lost!!!
CID-Pro 4.02
User Manual
Section 4
Program parts and functions
4.9.2 Buttons
Menus
Symbol
File
Submenus
Key
combination
New
Ctrl+N
Load
Ctrl+L
Delete
Print …
Export …
Ctrl+Del
List
completely
List
completely as PDF
List
filtered
List
filtered as PDF
List
completely
List
filtered
Exit
Reference
New report
cf. sec 4.9.3.1, p. 127
Load report
cf. sec 4.9.3.2, p. 127
Delete report
cf. sec 4.9.3.3, p. 127
Ctrl+C
Ctrl+F
Print report …
cf. sec 4.9.3.4, p. 128
Export report …
cf. sec 4.9.3.5, p. 128
Ctrl+E
Exit the event logs
Error list
cf. sec 4.9.3.6, p. 129
Power fail
cf. sec 4.9.3.7, p. 131
Error list!
Power fail!
E-Mail
message!
E-Mail message
cf. sec 4.9.3.8, p. 132
Extras
Options...
Help
Help
Ctrl+O
Options (event logs)
cf. sec 4.9.3.9, p. 135
F1
4.9.3 Event log functions
Here you can carry out the following report file actions:
4.9.3.1 New report
Generate a new report file. CID-Pro 4.02 sets up the file name and chooses the
current date. If a file already exists, it is chosen as active:
- all actions are appended or
- the file is regenerated - all previous entries are lost in the process.
4.9.3.2 Load report
Load a report file from the CID-installation-path\report subdirectory and display it with the
restrictions of the Extras Options submenu. (cf. sec. 4.9.3.9 - Options (event log), page
135).
4.9.3.3 Delete report
No longer needed report files can be deleted here. You must confirm the deletion with a
confirmation prompt.
Take note:
User Manual
Deleted entries are irrevocably lost!!!
for CID-Pro
4.02
127
Section 4
Program parts and functions
4.9.3.4 Print report …
Two options can be selected when printing a report / a report file:
All entries in the report file (complete list):
The function prints out the complete report file for you. It contains all messages and
comments.
The current list as displayed and filtered (filtered list):
The function prints the report file for you taking submenu Extras Options limitations
into account (cf. sec. 4.9.3.9 - Options (event log), page 135). All comments and
messages, which you have not filtered out, are printed.
The selected function then prints the report entries as text on the connected standard printer
and/or creates a PDF file with the desired content.
After you select the respective PDF function, a dialogue is opened in which you can indicate
the PDF file name and path. The storage path is the standard directory for report files. The
standard name is the addition 'Report' followed by the name of the loaded report file, e.g.:
Report file:
20130401.REP
PDF file:
Report_20130401.pdf
If the filtered report file is to be created as a PDF file, 'filtered' is added, e.g.:
Report file:
20130401.REP
PDF file:
Report_20130401_filtered.pdf
4.9.3.5 Export report …
There are two possible ways to export a report / a report file:
All entries in the report file (complete list):
This function exports the complete report file. It contains all messages and comments.
The current list as displayed and filtered (filtered list):
This function exports the report file taking into account the restrictions of the submenu
Extras Options (cf. sec. 4.9.3.9 - Options (event log), page 135). All comments and
messages which are not filtered out are exported.
The selected function then exports the report entries as a text file.
After you select the respective function, a dialogue is opened where you can indicate the
name and the path of the saved text file. The storage path is the standard directory for report
files. The standard name is the addition 'Report' followed by the name of the loaded report
file, e.g.:
Report file:
20130401.REP
Text file:
Report_20130401.txt
If the filtered report file is to be created as a TXT file, the addition 'filtered' is added, e.g.:
Report file:
20130401.REP
Text file:
Report_20130401_filtered.txt
128
CID-Pro 4.02
User Manual
Section 4
Program parts and functions
4.9.3.6 Error list
The Error list menu option shows a list of all errors currently at issue in the chosen test unit.
You can select individual errors to quit error them. This means that if the error is no longer
an issue in the unit, the software will delete it and the unit’s (sub)function is re-enabled. This
list is helpful for obtaining an overview of the error in the individual test unit’s controller. It is
needed under certain circumstances when it is not possible to fix all the errors in the unit, but
limited operation of the unit’s sub functions is necessary.
Back closes the error list window again.
User Manual
for CID-Pro
4.02
129
Section 4
Program parts and functions
Error history reads an error history from the test unit:
The occurrence, resolution, and acknowledgement (deletion) of individual errors and
warnings is listed chronologically here.
The function File Print as PDF file can be used to save the complete error history as a
PDF file.
After you select the respective PDF function, a dialogue is opened in which the name and the
path of the saved PDF file can be indicated. The storage path is the standard directory for
report files. The standard name is the addition 'Error history' followed by the test unit number,
e.g.:
PDF file:
Error-history Unit01.pdf
Back closes the error history window again.
Take note:
If the “No reply from this test unit!” message is displayed in this window,
this function is not yet implemented in your unit’s controller software.
The colour of the error (red) and warnings (orange) display can be
activated/deactivated in the Options (cf. sec. 4.9.3.9 - Options (event log),
page 135).
130
CID-Pro 4.02
User Manual
Section 4
Program parts and functions
4.9.3.7 Power fail
The power fail menu option shows a list of all power failures detected in the chosen test unit.
The list is displayed with a maximum of ten entries with the periods within which the test unit
was switched on or off. For the controller, the ON/OFF switching of the unit’s main switch is
considered as a power failure.
Back closes the power-failure list window again.
Take note:
User Manual
If the “No reply from this test unit!” message is displayed in this window,
this function is not yet implemented in your unit’s controller software.
for CID-Pro
4.02
131
Section 4
Program parts and functions
4.9.3.8 E-Mail message
The E-Mail message! menu option enables setting and activation of the e-mail messages,
which CID-Pro 4.02 software sends automatically.
You need internet or local network access and an SMTP server that supports message
dispatch to be able to use this function. The potential to send e-mail depends heavily on the
available network.
The E-Mail message! menu option opens a send list window using the existing send
configuration, here CID4-E-Mail-Test:
All stored send configurations are shown:
• Black entries are not activated.
• Green entries are activated and send e-mails for the appropriate events.
132
CID-Pro 4.02
User Manual
Section 4
Program parts and functions
New send configuration:
You use New to save a new send
configuration. The necessary information is
entered in this window and the events
established for which an e-mail will be sent:
- Send configuration name
(freely selectable)
- Receiver address
(receiver’s e-mail address)
- SMTP server name
(consultation with the network
administrator)
- Unit number / all units
(monitoring of a particular unit or of all
units)
- Conditions
(incidents triggering an e-mail dispatch)
- Cyclic current status
(Cyclic instants triggering the e-mail
dispatch and sending the current test unit’s
status:
- monthly
- weekly
- daily
- hourly
The currently running recording can be
optionally also sent along.)
Back ignores the adjustments.
OK accepts them
but they are not yet activated.
Changing a send configuration:
You can adjust the existing send configuration
by marking and change it.
Back ignores the adjustments.
OK accepts them
but they are not yet activated.
Please note:
A correct sender is precondition on some
systems (cf. sec. 4.2.5 - Configuration:
Generally - Options - Sender Address, page
44).
You can get the name of your SMTP server
from your network administrator!
User Manual
for CID-Pro
4.02
133
Section 4
Program parts and functions
Deleting a send configuration:
You can remove a selected send configuration by marking it and using Delete.
Take note:
Deleted send configurations are irrevocably lost!!!
Activating and deactivating a send configuration:
You can use Activate to activate the marked send configuration. The send configuration is
displayed in green script.
You can use Deactivate to deactivate the marked send configuration. The send
configuration is once again displayed in black script.
Several send configurations may be active.
Take note:
Selecting certain send configurations can cause a large number of e-mails
can be dispatched. This information flood can be unpleasant for the
receiver.
Example of an e-mail message for a test unit error:
Subject: CID Errormessage: CID4-E-Mail-Test
(Climate Cabinet(Test Unit 01) / C70350 / C-70/350)
Error: Float switch waterbath 07-B80
134
CID-Pro 4.02
User Manual
Section 4
Program parts and functions
4.9.3.9 Options (event logs)
The report file display is adjusted with the options. You can filter out the messages, which
you do not want to see, or check mark messages, which should be displayed:
By deactivating individual entries like analogue channels, they will be filtered out. The report
files display making the list clearer.
The option coloured, for error and warning messages, indicates the errors as red and
warnings as orange in the Report menu.
It can also be distinguished whether all units (All) or only a particular unit (here unit 1) should
be shown.
Furthermore, you can provide the time range in which messages should be shown. Observe
the specified date and time format. If you do not enter any values for stop time or date, then
all entries will be shown beginning with the start time and date up to the last entry.
Please note:
Depending on which messages have been commented on, it is sometimes possible that no messages will be displayed any more.
The information about the number of current entries / total entries in the
report window gives you a rapid overview of how many messages have
been commented on and how many messages are contained in the complete report file.
The new settings become active after confirmation with OK. These are saved and reused the
next time the report menu is opened.
You can ignore the changes with Back.
User Manual
for CID-Pro
4.02
135
Section 4
136
Program parts and functions
CID-Pro 4.02
User Manual
Section 4
4.10
Program parts and functions
Visualization
4.10.1 Preface
With the new menu, you have the potential to visually present your unit‘s surroundings using
background image and individual unit images. User defined settings determine the size,
position, and appearance of test units.
4.10.2 Buttons
Menus
Symbol
Submenus
Key
combination
Close!
Extra
Units
User Manual
Configuration
Ctrl+C
Load Settings
Ctrl+L
Save Settings
Ctrl+S
Reset Settings
Ctrl+R
Units
for CID-Pro
4.02
Reference
Exit visualization
Configure setting
cf. sec 4.10.4.1, p. 139
Load setting
cf. sec 4.10.4.3, p. 142
Save setting
cf. sec 4.10.4.2, p. 141
Reset setting
cf. sec 4.10.4.4, p. 142
Test unit display
cf. sec 4.10.4.5, p. 142
137
Section 4
Program parts and functions
4.10.3 Display the Visualization
Each unit possesses a unit designation
(here (U01) Climate Cabinet) and a
coloured frame indicating the test unit's
status.
Various unit types are presented on
the right side:
This status description is analogue to
the unit’s presentation in the status
overview, cf. sec. 4.1.3 - Test Units,
page 21.
Moving the mouse over the test unit displays the most
important information:
White frame:
Test unit
doesn’t answer
Gray frame:
Test unit
connected
not started
Green frame:
Test unit
connected
in operation
Orange frame:
Test unit
connected
in operation
Pause
Red frame:
Test unit
connected
error present
Unit number (Test Unit 01), unit name (Climate Cabinet),
commission number (C70350), unit type (C-70/350),
analogue channels and digital channels (Softkeys and
indicators).
The LED in the upper right turns red when there is an error
at this test unit. The entire window turns green when the test
unit is started. If a program is running in program mode, its
path is displayed.
138
Yellow frame:
Test unit
connected
warning present
No representation:
Test unit
not configured
CID-Pro 4.02
User Manual
Section 4
Program parts and functions
4.10.4 Visualization functions
4.10.4.1 Configure setting
You can make changes to the display in the visualization configuration:
Window Size (width x height):
You can select window sizes from the adjacent specifications.
For example, if you select a fixed size of 800 x 400 pixels, the
values appear, and are greyed out, in the width and height
fields.
Full screen maximizes the window and also sets and greys out
the values in the width and height fields.
The user-defined function clears the width and height fields into
which you can enter the desired values.
Take note:
Changes are accepted immediately!
Background Image:
You can select the background image as a bitmap or jpg file with the
successfully selected image is shown as a path name below the button.
button. The
You can use your work place’s, laboratory’s, or production hall’s layout chart as the
background as well as bitmap or jpg files you design and construct yourself. Since the
properties of the image in this file rarely agree with those of the screen, it makes sense
to adjust the background image’s window sizes (width x height).
User Manual
for CID-Pro
4.02
139
Section 4
Program parts and functions
Either you enter the dimensions yourself in to the width and height fields, or you give
your image file the dimension information via a name change. This change works as
follows:
• Create your image file in bitmap or jpg format,
e.g. FairplanElectronica.jpg
• This file is 1115 pixels wide and 681 pixels high.
• Name the file in the way to (Name_www_hhhh.jpg):
e.g. FairplanElectronica_1115_0681.jpg.
• If you now load this file, this width and height information is processed and you
will be asked whether you want to accept the values:
•
•
NO leaves all values unchanged.
YES accepts the new values and changes the window’s sizes.
Take note:
Width and height pixel values must be four-place. That means they
must be padded with 0s if necessary.
Dimension information must be completed in the format
_wwww_hhhh. The underscore signals the entry of dimensional
information to the system.
Consequently, no further underscores are permitted in the rest of
the name.
Test Units:
Here you can select your own unit image for each test unit. Go to the desired test unit
with the Unit No. As orientation, the section captions change when the unit designation
is entered, e.g. Climate Cabinet (Test Unit 01).
You can use the
button to select a bitmap or JPG file which can be used as an image for the selected test unit. The successfully selected image is displayed as a path
under the button.
The aspect ratio option is related to all the test units and enables you to show the
image in the saved dimensions or not when loading the image.
If the option is set, the aspect ratio between width and height remains the same if you
change the size of the image there is no distortion.
If the option is not set, you can change the size of the unit images as you wish the
images will distort.
140
CID-Pro 4.02
User Manual
Section 4
Program parts and functions
The option can also be set afterwards. The properties are corrected in this case only
during the next image change.
If you change an image, the smallest page is set the largest page recalculated when
the option is selected.
Original image:
Change:
Option:
Result:
4.10.4.2 Save setting
For different presentations, you have the option to store the adjusted configuration’s setting.
Go to the Extra Save Settings menu option and enter a characteristic name for the file
name. The file extension is *.vcg (visual configuration).
User Manual
for CID-Pro
4.02
141
Section 4
Program parts and functions
4.10.4.3 Load setting
You can reload the various saved configurations at any arbitrary time.
Go to the Extra Load Settings menu option and select the vcg file that you want to load.
The setting is accepted after confirmation and the visualization is completely reconstructed.
4.10.4.4 Reset setting
If you want to begin a configuration again from scratch, choose the Extra Reset Settings
menu option. The saved settings are reset, i.e. all image paths, dimensions, and positions
are set back to the default values.
4.10.4.5 Display Test Units
The displayed test units from the program configuration (cf. sec. 4.2.1 - Configuration:
Settings: Number of test units, page 35) are all listed with designation of the unit’s name and
number (e.g. (U01) Climate Cabinet):
All test units are checked on by default, i.e. shown, here.
Select a test unit in the menu if you want to hide it in the visualization. The unit will no longer
be displayed Check mark in front of entry is no longer set.
Test units that are not configured, are not checked on and there is no possibility to change
this state.
142
CID-Pro 4.02
User Manual
Section 4
4.11
Program parts and functions
Special menus for particular test unit types
4.11.1 Temperature Shock Test Cabinets
The shock test cabinet is a special test unit type in which very fast temperature changes can
be created. The temperature changes are not achieved by changing a zone’s temperature,
but by moving the test specimen from one temperature zone to another. Its own menu is
provided for this special function. With its help, test programs can be created for this test unit
type.
4.11.1.1 Overview menu
The unit is symbolically represented in the left area. The arrow icon shows the cradle
position, here on top. The cradle’s temperature is given below as long as your shock test
cabinet has a cradle sensor (external PT100).
If the shock test cabinet does not have a cradle sensor, the cradle temperature is shown as
the warm-chamber temperature when the cradle is located in the upper chamber and as the
cold-chamber temperature, when the cradle is located in the lower chamber. Cradle
temperature data then appears as follows:
Warm chamber / upper chamber
Cold chamber / lower chamber
W: 100.0 °C
C: -61.9 °C
The current actual values are shown to the right next to the unit:
• Remaining cradle delay time in the warm chamber above and its actual temperature
red fields
• Already completed cycles grey field
• Actual cold-chamber temperature below and remaining cradle delay time in this
zone blue fields
User Manual
for CID-Pro
4.02
143
Section 4
Program parts and functions
Program data are shown in the area to the right.
This is the program name and number (= program location in the controller) as well as a
graphical presentation of the test cycle with the programmed benchmark values:
•
Temperature warm chamber:
(left above)
Temperature set value in the warm chamber
•
Temperature cold chamber:
(left below)
Temperature set value in the cold chamber
•
Pre tempering warm chamber This temperature value is added to the warm
(difference):
chamber's set value. The warm chamber heated to
(above right)
this temperature sum when the cradle is not located
in this zone.
•
Pre tempering cold chamber
(difference):
(below right)
This temperature value is added to the cold
chamber’s set value. The cold chamber is heated to
this temperature sum when the cradle is not located
in this zone.
•
Time warm chamber:
(left lower center)
Time the cradle spends in the warm chamber
in minutes
•
Time cold chamber:
(left lower center)
Time the cradle spends in the cold chamber
in minutes
•
Cycles:
Number of warm chamber cold chamber
cycles
4.11.1.2 Pretempering
When the cradle moves into a chamber, the ambient temperature in that chamber is altered.
The size of this alteration depends on the chamber temperature, the cradle and the items to
be tested as they enter into the chamber. In order to return to the desired target value as
quickly as possible after the cradle change, the heating chamber is heated up to a certain
value above the target-value, prior to the change. Conversely, the cooling chamber is cooled
down to a certain value below the target-value, prior to the change.
These values are defined as pretempering. The value is positive for the heating chamber
(pretempering heating chamber - DiffTemHo) and for the cooling chamber it is negative
(pretempering cooling chamber - DiffTemCo).
144
CID-Pro 4.02
User Manual
Section 4
Program parts and functions
These variable pretemperings are analogue channels, so that they can be optimized for the
target-values entered and, particularly, for the mass of the item to be tested. (Changes in the
analogue channels: cf. sec. 4.1.10 - Analogues channels, page 31).
Heating chamber
Pretempering
Heating chamber
70
60
10 min
10 min
10 min
40
7x
Cooling chamber
20
10
0
10 min
-10
10 min
10 min
-20
1 Cycle = 20 min
20 min
140 min
20 min
10 x 20 min = 200 min
Pretempering
Cooling chamber
Comments regarding this diagram:
•
•
•
The thick reference line, which varies within the range of +60°C to -10°C, represents
the target-temperature for the cradle.
The thin reference line in the upper-half of the schematic illustration represents the
temperature-development in the heating chamber. It varies within a range from
approximately +45°C to approx. +72°C. The different values have the following
meanings:
- +60°C:
Target temperature (= current-temperature) of the heating chamber
with the cradle.
- +72°C:
+60°C + 12K (target-value + entered pretempering)
- +45°C
Temperature shortly after the cold cradle has entered into the heating
chamber. The temperature in the chamber sinks.
The thin reference line in the lower half of the schematic illustration represents the
temperature development of the cooling chamber. It varies within a range from
approx. -22°C to approx. -5°C. The different values have the following meanings:
- - 10°C:
Target temperature (= current temperature) of the cooling chamber
with the cradle.
- - 22°C:
-10°C + (-12K) (target-value + entered pretempering)
- - 5°C
Temperature shortly after the warm cradle has entered into the cooling
chamber. The temperature in the chamber rises.
Notice:
The pretempering should (if possible) be selected in such a way that the
alteration of temp (in this case, +45°C or -5°C) during the appearance of the
cradle into the respective chamber corresponds to the temperature targetvalue.
Additional screens are called up with the buttons
start, page 146) and
User Manual
(cf. sec. 4.11.1.3 - Program
(cf. sec. 4.11.1.4 - Test program creation, page 147).
for CID-Pro
4.02
145
Section 4
Program parts and functions
4.11.1.3 Program start
The
button opens a window for selecting program name and number.
The unit controller has available program locations 1 to 97. The test program is stored in the
controller at the program location chosen here.
Only the programs from the program cycles’ shock test default directory are selectable. This
subdirectory is named as follows:
CID-installation-path\zyklus\tss_cycl
e.g.: C:\CID-PRO 4.00\zyklus\tss_cycl
Clicking OK transmits the selected program to the desired program location in the controller
and started.
Clicking Back interrupts the operation.
Take note:
146
A test program possibly already stored there is overwritten.
CID-Pro 4.02
User Manual
Section 4
Program parts and functions
4.11.1.4 Test program creation
Clicking the
button opens a window for the simple entry and storage of shock
test cabinet test programs.
The shock test editor shows an image similar to the overview of the programmed shock test
program. For this form of input, a “normal” test program is created in the background, which
can be reworked with the editor (cf. sec. 4.4 - Test-cycle program editor, page 57) for special
requirements (e.g. switching digital outputs). This is not necessary in the default case.
The entry allows very quick and clear test program creation for the shock test cabinet.
•
•
•
•
Entries for temperatures, pretemperings, delay times, and cycle number are the set
values of the test program.
Wait for zone temperature after program-start is inserted by check marking a wait
function in the program. The program waits until the warm chamber has reached its set
temperature with a tolerance of 3K before beginning the first cycle.
Wait function activate upper PT100 inserts a wait function for each cold/warm cycle
when check marked. Delay time in the warm chamber only begins to elapse when the
tolerance range (here 3K) entered for the warm chamber’s temperature sensors is
entered. The temperature must approach the zone from below.
Wait function above free PT100 inserts a wait function for each cold/warm cycle
when check marked. Delay time in the warm chamber only begins to elapse when the
tolerance range (here 3K) entered for the free PT100 temperature sensors (option) is
entered. The temperature must approach the zone from below.
User Manual
for CID-Pro
4.02
147
Section 4
•
•
Program parts and functions
Wait function activate lower PT100 inserts a wait function for each warm/cold cycle
when check marked. Delay time in the cold chamber only begins to elapse when the
tolerance range (here 3K) entered for the cold chamber’s temperature sensor is
entered. The temperature must approach the zone from above.
Wait function below free PT100 inserts a wait function for each warm/cold cycle when
check marked. Delay time in the cold chamber only begins to elapse when the
tolerance range (here 3K) entered for the free PT100 temperature sensor (option) is
entered. The temperature must approach the zone from above.
Wait function use increases the test duration. The waiting time depends on the set tolerance
and the chamber’s load.
If wait functions are not activated, the test program’s run time begins to elapse independently
of the actual values in the chambers.
Save saves the set cycle under a freely selectable name.
Load can load, edit, modify, and, with resave an already created cycle or back it up under
another name.
When the selection "Start in cold zone" is made, the graphic display also changes:
4.11.1.5 Manual and program operation
For general standard temperature or climate test units, manual operation is started by
activating the start/stop button in the status overview (cf. sec. 4.1.5 - Unit and error status,
page 23).
If you start the shock test cabinet with this start/stop button, program operation, i.e. the
default shock test program, starts by default in storage location 99.
If you want to change this situation and start the shock test cabinet in true manual operation,
you must deactivate the “automatic” digital channel visible only in the CID-Pro 4.02
software, but not on the unit’s hand set.
This “automatic” channel has the following significance:
automatic = 1
automatic = 0
148
Start the software from the default shock test program.
Start the software manually
(Here the cradle can only be moved manually)
CID-Pro 4.02
User Manual
Section 5
5
Networking
Networking
The following are possibilities when networking the test units:
Several units are connected to a full CID-Pro
User Manual
for CID-Pro
4.02
4.02 version with a local printer.
149
Section 5
5.1
Networking
Serial interface (RS 232)
1:1
max. 15m length (cross over)
Test Unit
e.g.: COM1
Connect the unit to the user PC with a serial RS232 interface cable. The cable must be a
crossover.
• Set the unit address if required in the unit configuration on the seven-segment
operating panel using the key sequence E - P - P, or using the touch screen operating
panel you can set the unit address and the parameters for the serial interface under
Mainmenue 2/3 Settings Interfaces.
These must conform with:
• You should set the same parameters for the serial interface in the configuration of the
CID-Pro 4.02 software (cf. sec. 4.2.2 - Communication: Serial interface, page
37). In addition to this, note the COM port number of your PC.
This means you can only connect one test unit to each of your PC's COM ports.
Interface cable:
Test Unit
RX
2
TX
3
GND 5
SUB-D
9-pole
plug
150
2
3
5
Max. length 15 m
PC
RX
TX
GND
SUB-D
9-pole
jack
CID-Pro 4.02
User Manual
Section 5
5.2
Networking
Serial interface (RS 485)
max. 15m length
(no cross wired)
1:n
max. 500m length
(no cross wired)
RS232 RS485
Test Units
If you wish to operate several units in series to one serial COM port, or have longer cable
lengths, you will require the RS485 interface. To do this, you will need the RS232 to RS485
interface converter.
Connect the user PC and the interface converter (RS232 to RS485) with a serial RS232
interface cable (SUB-D adapter cable, 9-pole/25-pole, socket/plug). The cable must be a
non-crossover.
Then connect the interface converter (RS232 to RS485) and the first unit using a RS485
interface cable. The cable must be a non-crossover.
You can now connect the first and the next unit using a second non-crossover RS485
interface cable. Now continue to connect all the units.
• Set the unit address if required in the unit configuration on the seven-segment
operating panel using the key sequence E - P - P, or using the touch screen operating
panel you can set the unit address and the parameters for the serial interface under
Mainmenue 2/3 Settings Interfaces. The important thing is that all unit
addresses for each unit are different.
The settings must conform with:
• You should set the same parameters for the serial interface for all connected units in
the configuration of the CID-Pro 4.02 software (cf. sec. 4.2.2 - Communication:
Serial interface, page 37). In all connected units, the COM port in the configuration is
the same. The units are differentiated only of the unit address.
In addition to this, note the COM port number of your PC.
User Manual
for CID-Pro
4.02
151
Section 5
Networking
Interface cable:
Connecting cables are to be built as shielded, 4-conductor cables like LIYCY 4x0.25 mm².
Connecting cable: Test Unit - PC (RS485-RS232 converter)
1. Phoenix PSM V24/V11
Test Unit
RX +
RX TX TX +
GND
PC (Converter)
1
2
3
4
5
Phoenix
5-pole
plug
2
9
11
4
TX +
TX RX RX +
SUB-D
15-pole
plug
Max. length 500m from the
PC to the last device
2. W&T Nr.: 86000
Test Unit
RX +
RX TX TX +
GND
PC (Converter)
1
2
3
4
5
Phoenix
5-pole
plug
22
10
11
23
TX +
TX RX RX +
SUB-D
25-pole
jack
Max. length 500m from the
PC to the last device
Connecting cable: Test Unit - Test Unit
Test Unit
RX +
RX TX TX +
GND
Phoenix
5-pole
plug
152
1
2
3
4
5
1
2
3
4
5
Max. length 500m from the
PC to the last device
Test Unit
RX +
RX TX TX +
GND
Phoenix
5-pole
plug
CID-Pro 4.02
User Manual
Section 5
5.3
•
Networking
Network (TCP/IP)
Either:
1:1
cross over
e.g.: 192.168.1.90
•
Or:
Standard Gateway:
IP: 192.168.1.1
Net 1:
Net 2:
Address area: 192.168.1.xxx
Subnetmask: 255.255.255.0
m:n connection:
1:n (n Test Units with one PC) and
m:1 (from m PCs access to one Test Unit)
Address area: 192.168.2.xxx
Subnetmask: 255.255.255.0
no cross wired
e.g.:
IP Ad.:
192.168.1.90
Subnetm.: 255.255.255.0
no
cross wired
e.g.:
IP Address:
192.168.1.20
Subnetmask: 255.255.255.0
Std Gateway: 192.168.1.1
no
cross wired
e.g.:
IP Address:
192.168.2.90
Subnetmask: 255.255.255.0
Std Gateway: 192.168.1.1
CID-Pro 4.02 software offers the possibility of networking over an integrated
corporate network. A LAN (Local Area Network) with a correctly installed TCP/IP protocol is
prerequisite. CID-Pro 4.02 software establishes communication with a fixed IP
address. This can lead to problems in networks with dynamic address assignment DHCP
(Dynamic Host Configuration Protocol).
User Manual
for CID-Pro
4.02
153
Section 5
Networking
Connect the test unit to a free network outlet with an RJ45 patch cable.
Connect your PC to a free network outlet with an RJ45 patch cable.
Your network administrator must activate the network outlet and the cable must be a
straight-through patch cable.
• If required, go to Mainmenue 2/3 Settings Network on the touch screen operating panel in the units configuration to set the parameters for the Ethernet interfaces. (Units with 7-segment operating panels do not have an Ethernet interface).
These must conform with:
• You should set the same parameters for the Ethernet interface in the configuration of
the CID-Pro 4.02 software (cf. sec. 4.2.2 - Communication: Ethernet interface,
page 37).
You must request the required parameters (IP address, IP port, subnet mask, and default
gateway) from your network administrator. IP address information is unique within the
network, meaning that it may only be assigned once.
5.4
Network Version (Remote PC)
A second PC can be connected using the company-integrated LAN network (Local Area
Network). Here the CID-Pro 4.02 network version which can be used to observe
current conditions of all the units connected is running. This takes place using the standard
CID-Pro 4.02 software interface. Please cf. sec. 4.2.2 - Communication:
Client/Server Setting, page 37 for setting this type of operation in accordance with
client/server model
5.5
External devices
It is possible to integrate external devices with CID-Pro 4.02 software.
These external devices from other manufacturers are addressed by means of a protocol
converter (a so-called gateway (hardware)). Gateways convert different units’ interfaces in a
way so that the devices appear to be CTS devices.
Beyond this, there is a special version of CID-Pro 4.02 software that can integrate
the external devices using software.
You can determine which solution, hard or software, is right for you directly from CTS
GmbH’s technical department.
154
CID-Pro 4.02
User Manual
Section 6
6
Buttons of the CID-Pro 4.02 software
Buttons of the CID-Pro 4.02 software
6.1 Status overview
Symbol
Key
combination
Description + Link
Exit
Reference
Exit!
Visualization
(section 4.10, page 137)
Display your test units in a self-generated environment.
Ctrl+V
Functions
Overview of all test units
(section 4.3, page 55)
Display all your connected test units in overview.
Ctrl+O
Functions
Test-cycle program editor
(section 4.4, page 57)
Create, edit, change, and delete your test-cycle programs.
Ctrl+E
Functions
Graphical measurement-data analysis
(section 4.5, page 91)
Display your test data in a diagram and analyze them.
Ctrl+G
Functions
Starting test programs (automatic)
(section 4.6, page 111)
Start a test-cycle program from CID-Pro 4.02 in automatic mode.
Ctrl+A
Functions
Manual measurement recording
(section 4.7, page 117)
Document the progress of analogous and digital channels’ test units
with test value records.
Ctrl+M
Functions
Configuration (CID-Pro 4.02 - Settings)
(section 4.2, page 35)
Configure your software to meet your needs.
Ctrl+S
Functions
Operating hours and event counter
(section 4.8, page 123)
Display your operating hours and events.
Ctrl+C
Functions
Event logs (reports)
(section 4.9, page 125)
All changes, warnings, and errors can be displayed and provided with
comments.
Ctrl+R
Functions
F1
Help
Ctrl+I
Information
Help
Info
Software information (section 7.2, page 160)
User Manual
for CID-Pro
4.02
155
Section 6
Buttons of the CID-Pro 4.02 software
6.2 Editor
Menus
Symbol
File
---
Key
Also in
combina
tool bar
tion
Submenus
New …
X
Ctrl+N
Open...
X
Ctrl+O
Save
X
Ctrl+S
Save As
X
Ctrl+A
Printer/Page install
Print...
Print as PDF…
Reference
New test program
cf. sec 4.4.4.1, p. 69
Open test program
cf. sec 4.4.4.2, p. 69
Save (as) test program
cf. sec 4.4.4.3, p. 70
Ctrl+I
Print Graphic
Ctrl+G
Print List
Ctrl+L
Print Both
Ctrl+B
Print Screen
Ctrl+T
Printer/page setup and print …
cf. sec 4.4.4.5, p. 71
Print Graphic as PDF
Print as PDF...
cf. sec 4.4.4.6, p. 72
Print List as PDF
Print Screen as PDF
---
Edit
Files last opened
Open test program (4.4.4.2)
Exit
X
Ctrl+E
Insert Line
X
Ins
Delete Line
X
Del
Cut Line
X
Ctrl+X
Copy Line
X
Ctrl+C
Paste Line
X
Ctrl+V
Block copy/insert ...
Block delete ...
F6
F7
Insert Start of Loop
X
F2
Insert End of Loop
X
F3
Call Subprogram
X
F4
Insert Conditional Jump
X
F5
Insert Program
X
F10
Refresh
F11
Templates
Templates
Extras
Options
Ctrl+P
Delete Program
Ctrl+D
Gradient ...
...with (Valued Calculation)
F8
...to (Time Calculation)
F9
Save File in Data pool ...
Ctrl+F
Save File as Library ...
Delete Template(s) / Library(ies)
Comment!
Edit lines (insert, change,
delete, cut, and copy) with
keyboard/menu functions
cf. sec 4.4.3.1, p. 60
Block of lines
cf. sec 4.4.4.7, p. 72
Loop (loop beginning and end)
cf. sec 4.4.4.8, p. 74
Call Subprogram
cf. sec 4.4.4.9, p. 75
Conditional jump
cf. sec 4.4.4.10, p. 76
Insert Program
cf. sec 4.4.4.11, p. 77
Refresh the editor
Templates
cf. sec 4.4.4.12, p. 78
Options (editor)
cf. sec 4.4.4.13, p. 79
Delete test program
cf. sec 4.4.4.4, p. 70
Set Gradient
cf. sec 4.4.4.14, p. 82
Save file in data pool
cf. sec 4.4.4.15, p. 86
Save file as library
cf. sec 4.4.4.16, p. 86
Delete Templates and
Libraries
Comment (editor)
cf. sec 4.4.4.17, p. 87
Zoom functions (editor)
cf. sec 4.4.4.18, p. 88
Zoom functions
156
Exit the editor
CID-Pro 4.02
User Manual
Section 6
Buttons of the CID-Pro 4.02 software
6.3 Graphical measurement-data analysis
Menus
Also in
toolbar
Key
combination
Open…
X
Ctrl+O
Delete
X
Ctrl+D
Print
X
Ctrl+P
Print as PDF
X
Ctrl+F
Symbol
File
---
Zoom
View
Extra
Submenus
Exit
X
Ctrl+E
Complete Frame/Restore
X
Ctrl+R
Zoom Out
X
Ctrl+U
Zoom
X
Ctrl+Z
Zoom to cursor positions
X
Ctrl+S
Display
Ctrl+I
Analysis
Ctrl+A
Options
X
Convert to Excel - Program
Ctrl+T
Ctrl+X
completely
cursor position
Copy to Clipboard
Ctrl+C
Join Measurement Files
Ctrl+M
Cut current Measurement File (Cursor)
Settings
Open and load measurement
cf. sec 4.5.3.1, p. 93
Delete measurement
cf. sec 4.5.3.3, p. 95
Print measurement
cf. sec 4.5.3.4, p. 96
Print measurement as PDF
cf. sec 4.5.3.5, p. 96
Open and load measurement
(4.5.3.1)
Files last opened
Display Measurement Value
Reference
Setting 1
X
Setting 2
X
Setting 3
X
Setting 4
X
Setting 5
X
Setting 6
X
Setting 7
X
Setting 8
X
Setting 9
X
Setting 10
X
Exit the graphical
measurement-data analysis
Zoom functions (graphical
measurement-data analysis)
cf. sec 4.5.3.6, p. 97
Display
cf. sec 4.5.3.7, p. 99
Analysis
cf. sec 4.5.3.8, p. 99
Options (graphical
measurement-data analysis)
cf. sec 4.5.3.9, p. 100
Excel conversion program
cf. sec 4.5.3.10, p. 103
Display Measurement Values
cf. sec 4.5.3.11, p. 106
Copy to clipboard
cf. sec 4.5.3.12, p. 106
Merge measurement files
cf. sec 4.5.3.13, p. 107
Cut current Measurement File
(Cursor)
cf. sec 4.5.3.14, p. 107
Settings
cf. sec 4.5.3.15, p. 108
New Setting
Delete Setting
Help
Help
F1
Comment (graphical
measurement-data analysis)
cf. sec 4.5.3.16, p. 110
Comment!
User Manual
for CID-Pro
4.02
157
Section 6
Buttons of the CID-Pro 4.02 software
6.4 Event logs
Menus
Symbol
File
Key
combination
Submenus
New
Ctrl+N
Load
Ctrl+L
Delete
Print …
Export …
Ctrl+Del
List
completely
List
completely as PDF
List
filtered
List
filtered as PDF
List
completely
List
filtered
Exit
Reference
New report
cf. sec 4.9.3.1, p. 127
Load report
cf. sec 4.9.3.2, p. 127
Delete report
cf. sec 4.9.3.3, p. 127
Ctrl+C
Ctrl+F
Print report …
cf. sec 4.9.3.4, p. 128
Export report …
cf. sec 4.9.3.5, p. 128
Ctrl+E
Exit the event logs
Error list
cf. sec 4.9.3.6, p. 129
Power fail
cf. sec 4.9.3.7, p. 131
Error list!
Power fail!
E-Mail
message!
E-Mail message
cf. sec 4.9.3.8, p. 132
Extras
Options...
Help
Help
Ctrl+O
Options (event logs)
cf. sec 4.9.3.9, p. 135
F1
6.5 Visualization
Menus
Symbol
Submenus
Key
combination
Close!
Extra
Units
158
Configuration
Ctrl+C
Load Settings
Ctrl+L
Save Settings
Ctrl+S
Reset Settings
Ctrl+R
Units
Reference
Exit visualization
Configure setting
cf. sec 4.10.4.1, p. 139
Load setting
cf. sec 4.10.4.3, p. 142
Save setting
cf. sec 4.10.4.2, p. 141
Reset setting
cf. sec 4.10.4.4, p. 142
Test unit display
cf. sec 4.10.4.5, p. 142
CID-Pro 4.02
User Manual
Section 8
8
End user license agreement
End user license agreement
8.1 Copyright memo
CTS GmbH is not liable for technical or printing errors or defect in this manual, and also
accepts no liability for damages which are caused directly or indirectly by the supplier,
performance and usage of this material.
This document contains information protected by copyright which are subject to copyright
law. All rights are reserved. This document may neither be copied nor otherwise reproduced
either completely or in excerpts without the previous approval of CTS GmbH.
The software described in this document is subject to a license agreement. Usage and
reproduction is only permitted in the context of this agreement.
8.2 License agreement
The following licence conditions apply to a software product and their usage rights as a
supplement to our general terms and conditions, which can be downloaded from our home
page:
The licence conditions are acknowledged by the orderer on acceptance of the delivery or
service, at the latest when the software is installed.
CTS GmbH allows the orderer of the computer program and the associated documentation
and subsequent amendments (hereinafter referred to as software) non-exclusive and nontransferable usage rights for internal use. Copyright, ownership and all other rights to the
software including its copies remain with the manufacturer. The customer has no rights to
receive the source code program.
It is possible that the software is protected by copy protection. Any bypassing of copy
protection contained in the software is considered to be illegal.
Any reproduction of software, irrespective of which type or on which carrier, is illegal with the
exception of backup copies explicitly labelled as such. This also applies to internal use,
unless the reproduction is used for decompiling under the strict preconditions of the German
§ 69e UrhG laws. The orderer must ensure that the software is not accessible without
previous written authorisation from CTS GmbH.
User Manual
for CID-Pro
4.02
161
Section 8
End user license agreement
8.3 Warranty
The contractual parties agree that it is not possible to develop EDP programs which are free
of errors for all application conditions.
The manufacturer guarantees that the software is not defective during the statutory warranty
period. The software is considered defective if it does not fulfil the functions specified in the
specification.
If such defects are present, the manufacturer has the right to improve or redeliver on his own
decision. If, during a suitable time limitation, it is not possible for the manufacturer to rectify
or bypass defects through supplementary performance, the orderer (allowing for statutory
exceptional cases) can, on his choice, demand a reduction of the licence fee or cancel the
licence agreement if it is not possible for the orderer to use the software in accordance with
the contract.
If only insignificant details are present, the orderer only has the right to reduce the licence
fee.
The above paragraphs contain concluding regulations with regard to the software warranty
and exclude any other warranty claims.
CTS GmbH is only liable for damages which have not occurred to the article of sale itself
only:
a) in the case of intent
b) in the case of gross negligence from the statutory representative or management
c) in the case of culpable injuries to life, body or health
d) in the case of defects which CTS has maliciously concealed or whose absence has been
guaranteed by CTS
e) in the case of defects to the article of sale in so far as liability is present for personal or
material damage on privately used articles is covered by the German Product Liability Act.
Further claims are excluded.
8.4 Place of fulfilment, place of jurisdiction, applicable law
Place of fulfilment for all claims resulting from business relationships is 72379 Hechingen,
Germany.
Place of jurisdiction for all claims resulting from business relationships including those from
exchange and cheques is the court in whose district our head office is located. We are,
however, also entitled to claim against customers at their general place of jurisdiction.
The laws of the Federal Republic of Germany are exclusively applicable to all legal relationships between us and our customers. Application of the UN Purchasing Rights (CISG) and
those of international private law is excluded.
If one individual regulation is or becomes ineffective, the effectiveness of all other regulations
or agreements will not be affected. A suitable regulation will then apply instead of the
ineffective regulation which most closely approaches the ineffective clause in the context of
legally permissible possibilities.
162
CID-Pro 4.02
User Manual
Section 9
9
Index
Index
Authorizations ....................................... 7
Buttons Overview
Editor ............................................... 156
Event logs ........................................ 158
Graphical measurement................... 157
Status overview ............................... 155
Visualization .................................... 158
Configuration....................................... 35
Access Configuration - In operation ... 53
Access Configuration - Settings ......... 48
Adding Test Units .............................. 40
Administrator settings ........................ 49
Change password ........................ 47, 52
Change user ...................................... 51
Client/Server Setting .......................... 38
Communication .................................. 36
Configure all test units ....................... 39
Configure Unit x ................................. 39
Default Directories ............................. 44
Ethernet ............................................. 37
Generally ........................................... 44
Insert user.......................................... 50
Language........................................... 35
Length of trendgraph.......................... 37
Number of test units ........................... 35
Options .............................................. 44
PDF Settings ..................................... 54
Program mode ................................... 41
Scanning rate .................................... 36
Serial interface ................................... 37
Settings.............................................. 35
Simple Password ............................... 46
Test communication ........................... 39
Test specimen protection ................... 43
Unit designation ................................. 36
User logoff ......................................... 53
User logon ......................................... 53
Windows Size .................................... 45
End user license agreement
Copyright memo .............................. 161
License agreement .......................... 161
Place of fulfilment, place of jurisdiction,
applicable law............................... 162
Warranty .......................................... 162
Event logs (reports) .......................... 125
Activating a send configuration ........ 134
Buttons ............................................ 127
Changing a send configuration ........ 133
Comment lines ................................. 126
Delete report .................................... 127
Deleting a send configuration........... 134
User Manual
for CID-Pro
4.02
Display line .......................................126
E-Mail message................................132
Error history......................................130
Error list ............................................129
Load report .......................................127
New report........................................127
New send configuration ....................133
Options .............................................135
Power fail .........................................131
Preface .............................................125
Print report ... ...................................128
Send list ...........................................132
SMTP Server ....................................132
Graphical measurement-data analysis
.......................................................... 91
Active record ..................................... 94
Analogue channel.............................101
Analysis ............................................. 99
Buttons .............................................. 92
Channel ............................................100
Comments ........................................110
Copy to clipboard .............................106
Cursor ............................................... 95
Cursor visible ...................................102
Cut current Measurement File ..........107
Default ..............................................100
Default values ..................................101
Delete measurement ......................... 95
Digital channel ..................................100
Display .......................................99, 102
Display Measurement Values ...........106
Evaluation ........................................102
Excel conversion program ................103
High detail ........................................102
Merge measurement files .................107
Open and load measurement ............ 93
Options .............................................100
Preface .............................................. 91
Print measurement ............................ 96
Print measurement as PDF ............... 96
Right scale .......................................101
Searching for a measurement file ...... 94
Settings ............................................108
Show Real-Time ...............................102
Show the evaluation (analysis) .........102
Show the small Display ....................102
Working with graphical measurem. .... 95
Zoom functions .................................. 97
Installation ............................................. 8
ASCII protocol ................................... 13
Full, network and demo version ......... 10
163
Section 9
Index
Hardware key (dongle)....................... 12
Manuals (Adobe Acrobat Reader) ...... 14
Licensing notes ..................................... 7
Manual measurement recording
Append a measurement ................... 118
Cyclic storage .................................. 119
Record options................................. 117
Recording all ... seconds.................. 117
Start options / Start at... ................... 119
Starting a recording ......................... 117
Stopping a recording ........................ 122
Networking......................................... 149
External devices .............................. 154
Network (TCP/IP)............................. 153
Network Version (Remote PC) ......... 154
Serial interface (RS 232).................. 150
Serial interface (RS 485).................. 151
Operating hours and event counter . 123
Overview of all test units .................... 55
Program start-up
Software ............................................ 17
Units .................................................. 17
Software updates .............................. 159
Software information ........................ 160
Support section on the Internet ........ 159
Special menus for particular test unit
types ............................................... 143
Starting test programs (automatic) .. 111
Append a measurement................... 112
Automatic mode ............................... 115
Comment ......................................... 113
Display for the recording .................. 115
Display for the starting time.............. 115
Program Offset ................................ 114
Program Start .................................. 114
Recording all ... seconds.................. 113
Recording the test-cycle program .... 112
Selection the test-cycle program ...... 111
Start options .................................... 114
Status overview
Analogues channels .......................... 31
Automatic quick-start selection .......... 25
Changing a set value ......................... 31
Changing a Softkey ........................... 30
Digital channels ................................. 30
Disable control terminal ..................... 32
Error list ............................................. 33
Error status ........................................ 23
Indicators ........................................... 30
Messages .......................................... 29
Operational status.............................. 23
Preface .............................................. 19
Program automatic ............................ 26
Softkeys ............................................. 30
Symbol and menu bar ........................ 20
Test Units .......................................... 21
Trend graph....................................... 27
Unit and error status .......................... 23
Unit information ................................. 22
System requirements............................ 7
Table of Contents.................................. 3
Temperature Shock Test Cabinets ...143
Automatic .........................................148
Manual and program operation.........148
Overview menu ................................143
Pretempering ....................................144
Program start ...................................146
Test program creation ......................147
Test-cycle program editor
Buttons .............................................. 59
Call Subprogram ............................... 75
Change line ....................................... 60
Changing a value line ........................ 66
Comment........................................... 87
Conditional jump................................ 76
Convert program lines? ..................... 80
Copy lines ......................................... 61
Cursor Net ......................................... 81
Cut lines ............................................ 62
Delete lines ....................................... 61
Delete test program ........................... 70
Edit a block of lines ........................... 72
Edit lines............................................ 60
Edit multiple lines .............................. 61
Expand all loops ................................ 79
Generate a test cycle......................... 60
Insert line/change graph .................... 64
Insert Program................................... 77
Insert value line ............................60, 64
Loop (loop beginning and end) .......... 74
New test program .............................. 69
Open test program ............................ 69
Options .............................................. 79
Past copied lines ............................... 62
Preface .............................................. 57
Print as PDF ...................................... 72
Print both (graph and list) .................. 72
Print graph......................................... 71
Print list ............................................. 72
Print screen ....................................... 72
Printer page setup ............................. 71
Printer/page setup and print … .......... 71
Programs in unit ................................ 81
Read proglist of contr. ....................... 81
Retroactively insert a values line ..67, 68
Save (as) test program ...................... 70
Save file as library ............................. 86
Save file in data pool ......................... 86
Scaling .............................................. 80
Set Gradient ...................................... 82
Software limit ..................................... 63
Templates ......................................... 78
164
CID-Pro 4.02
User Manual
Section 9
Time Axis ........................................... 80
Zoom functions .................................. 88
Uninstall ............................................... 15
Visualization
Aspect ratio...................................... 140
Background Image........................... 139
Buttons ............................................ 137
Configure setting.............................. 139
Display Test Units ............................ 142
Display the visualization ................... 138
Load setting ..................................... 142
Moving the mouse ........................... 138
User Manual
for CID-Pro
4.02
Index
Preface .............................................137
Reset setting ....................................142
Save setting .....................................141
Test Units .........................................140
Visualization functions ......................139
Window Size (width x height)............139
Wait function ....................................... 62
Zoom
Full screen....................................90, 98
Zoom ............................................90, 98
Zoom out ......................................90, 98
165
Section 9
166
Index
CID-Pro 4.02
User Manual
Section 10
Technical support
10 Technical support
Please visit our website at www.cts-umweltsimulation.de for more information about CTS
GmbH and CID-Pro 4.02 software. It delivers the latest information on the continuing
development of the company and of CID-Pro 4.02 software.
Our distribution partners in over thirty countries stand ready in word and deed to answer
licensing and acquisition questions concerning our software. You can find our partner names
and addresses in website’s contact area. We are glad to refer you to a partner in your area.
CTS GmbH
Lotzenäcker 21
72379 Hechingen
Germany
Tel.:
Fax:
+49 (0) 74 71 / 98 50 0
+49 (0) 74 71 / 98 50 23
E-mail:
Web:
[email protected]
www.cts-umweltsimulation.de
User Manual
for CID-Pro
4.02
167
Section 10
168
Technical support
CID-Pro 4.02
User Manual