1
.
Introducing AQtime
2
Copyright Notice
AQtime, as described in this on-line help system, is licensed under the software license agreement
distributed with the product. The software may be used or copied only in accordance with the terms of its
license.
© 2010 AutomatedQA Corporation. All rights reserved.
No part of this help can be reproduced, stored in any retrieval system, copied or modified, transmitted in
any form or by any means electronic or mechanical, including photocopying and recording for purposes others
than the purchaser’s personal use.
All AutomatedQA product names are trademarks or registered trademarks of AutomatedQA Corporation.
All other trademarks, service marks and trade names mentioned in this Help system or elsewhere in the
AQtime software package are the property of their respective owners.
AQtime includes the UnzDll.dll library that is supplied by Info-Zip. This library is copyright © 1990-2005
Info-ZIP. This software is provided “as is”, without warranty of any kind, expressed or implied. In no event
shall Info-ZIP or its contributors be held liable for any direct, indirect, incidental, special or consequential
damages arising from the use of or inability to use this software.
Table of Contents
3
Table of Contents
INTRODUCTION......................................................................................................................................7
Introducing AQtime .................................................................................................................................7
Profiling vs. testing ..............................................................................................................................7
Manual vs. automation.........................................................................................................................7
What AQtime does................................................................................................................................7
Integration into IDEs ...........................................................................................................................9
Getting Started .....................................................................................................................................9
System Requirements.............................................................................................................................10
AQtime x86 and x64 Packages ..............................................................................................................13
Supported Development Tools...............................................................................................................13
Supported Processor Models..................................................................................................................14
What’s New in AQtime 7.......................................................................................................................16
Technical Support and Resources ..........................................................................................................17
AQtime Troubleshooter......................................................................................................................17
Licensing Questions ...........................................................................................................................17
Submitting a Question to the Support Team ......................................................................................18
More Support Resources ....................................................................................................................18
GETTING STARTED .............................................................................................................................20
General Information...............................................................................................................................21
User Interface Overview ....................................................................................................................21
AQtime Panels....................................................................................................................................29
AQtime Profilers ................................................................................................................................34
Doing One Profiler Run .........................................................................................................................39
1. Preparing an Application for Profiling..........................................................................................39
2. Creating a Profiling Project ..........................................................................................................39
3. Choosing What to Profile and When..............................................................................................44
4. Selecting a Profiler ........................................................................................................................45
5. Starting the Profiler Run................................................................................................................47
6. Analyzing Profiling Results............................................................................................................50
PROFILING APPLICATIONS WITH AQTIME ................................................................................55
Preparing an Application for Profiling...................................................................................................55
How AQtime Profilers Use Metadata and Debug Information..........................................................55
Compiler Settings for Native Applications.........................................................................................57
Compiler Settings for .NET Applications.........................................................................................119
Compiler Settings for Java Applications..........................................................................................145
Setting Up a Profiling Project ..............................................................................................................145
Creating and Saving AQtime Projects .............................................................................................145
Selecting Applications and Modules to Profile ................................................................................150
Specifying Path to Debug Info Files ................................................................................................151
About Profiling Modes .....................................................................................................................152
About Profiling Levels .....................................................................................................................153
© 2010 AutomatedQA Corp.
www.automatedqa.com/support
4
Table of Contents
Specifying Parameters for the Profiled Application ........................................................................153
Selecting the Profiler .......................................................................................................................154
Controlling What to Profile..................................................................................................................156
Using Profiling Areas ......................................................................................................................156
Using Triggers .................................................................................................................................161
Using Actions ...................................................................................................................................165
Excluding Code From Profiling.......................................................................................................168
Running a Profiling Session.................................................................................................................169
Optimizing the Profiling Process .....................................................................................................169
Starting and Stopping Profiling .......................................................................................................169
Attaching to Process ........................................................................................................................170
Pausing and Resuming Profiling .....................................................................................................173
Enabling and Disabling Profiling....................................................................................................173
Collecting Results During Profiling.................................................................................................174
Controlling Profiling From Application Code.................................................................................178
Profiling Various Applications and Code ............................................................................................181
Profiling .NET Applications.............................................................................................................181
Profiling Java Applications .............................................................................................................185
Profiling COM Applications ............................................................................................................192
Profiling Web Server Applications (IIS, ASP.NET, etc.) .................................................................202
Profiling Scripts ...............................................................................................................................224
Profiling Multithreaded Applications ..............................................................................................235
Profiling Under 64-bit Platforms.....................................................................................................238
Profiling Under Another User Account ...........................................................................................239
Profiling Dynamic Link Libraries....................................................................................................241
Profiling Services.............................................................................................................................242
Profiling SQL Server CLR Integration Assemblies..........................................................................244
Profiling WPF Browser (XBAP) Applications.................................................................................250
Profiling Multiple Processes............................................................................................................252
Profiling System Calls......................................................................................................................254
Profiling Recursive Routines ...........................................................................................................256
Profiling Template Functions ..........................................................................................................258
Profiling Duplicated Code ...............................................................................................................259
Profiling Small Functions ................................................................................................................260
Profiling Inline Functions................................................................................................................260
Profiling Child Routines Along With Parents..................................................................................263
Profiling Startup Code .....................................................................................................................264
Profiling Routines That Do Not Have the ret Instruction ................................................................267
Profiling Routines That Have Unsafe Code.....................................................................................269
Working With Profiler Results ............................................................................................................271
Adding Selected Routines and Classes to Profiling Areas...............................................................271
Comparing and Merging Results .....................................................................................................272
Sorting Results .................................................................................................................................276
Grouping Results..............................................................................................................................276
Searching Results.............................................................................................................................278
Filtering Results...............................................................................................................................279
Using Result Views...........................................................................................................................280
Printing Profiler Results ..................................................................................................................283
Exporting Results .............................................................................................................................283
Common Tasks ....................................................................................................................................285
Disabling inlining for the managed application to be profiled........................................................285
www.automatedqa.com
AQtime by AutomatedQA Corporation
Table of Contents
5
Finding memory block violations.....................................................................................................286
Finding routines exported and imported by a module .....................................................................286
Finding the routine where an exception occurred ...........................................................................286
Finding where a method or a class is defined in source code .........................................................287
Knowing average, maximum and minimum execution times for a method ......................................287
Knowing if a method raised exceptions ...........................................................................................288
Knowing on which platforms your application can run...................................................................288
Knowing parameters and result values of function calls .................................................................288
Knowing the number of clients that refer to an interface object......................................................288
Knowing the number of entries into a method .................................................................................288
Knowing the structure of potential interlinks between classes in your application.........................289
Knowing the structure of references between objects in your application ......................................289
Knowing the structure of routine calls in your application .............................................................289
Knowing the total time spent on a method (excluding child methods).............................................290
Knowing the total time spent executing a method (including child methods)..................................290
Knowing what binary or MSIL code a method has..........................................................................290
Knowing what libraries your application uses ................................................................................290
Knowing what methods are called the most or the least often.........................................................291
Knowing what methods take up the most or the least execution time ..............................................291
Knowing what methods use the most time for JIT compiling...........................................................292
Knowing what methods were executed ............................................................................................292
Knowing what source code lines were executed ..............................................................................293
Knowing what source code lines are called the most or the least often ..........................................293
Knowing what source code lines take up the most or the least execution time................................293
Searching for memory leaks.............................................................................................................294
Searching for resource leaks and errors in resource management functions..................................295
Tracing references between objects .................................................................................................296
AQTIME REFERENCE .......................................................................................................................297
Profilers................................................................................................................................................297
Performance Profiler .......................................................................................................................297
Allocation Profiler ...........................................................................................................................350
BDE SQL Profiler ............................................................................................................................382
Coverage Profiler ............................................................................................................................391
Exception Trace Profiler..................................................................................................................412
Function Trace Profiler ...................................................................................................................413
Light Coverage Profiler ...................................................................................................................427
Load Library Tracer ........................................................................................................................445
Platform Compliance Profiler .........................................................................................................456
Reference Count Profiler .................................................................................................................462
Resource Profiler .............................................................................................................................472
Sequence Diagram Link Profiler .....................................................................................................499
Static Analysis Profiler ....................................................................................................................503
Unused VCL Units Profiler..............................................................................................................561
Counters Overview...........................................................................................................................568
AQtime UI Reference ..........................................................................................................................574
Menus and Toolbars.........................................................................................................................574
Panels...............................................................................................................................................587
Working With Panels .......................................................................................................................644
Automating AQtime.............................................................................................................................649
AQtime Command Line....................................................................................................................649
© 2010 AutomatedQA Corp.
www.automatedqa.com/support
6
Working With AQtime via COM ......................................................................................................650
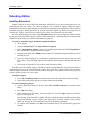
Extending AQtime ...............................................................................................................................667
Installing Extensions ........................................................................................................................667
Creating Custom Plug-Ins ...............................................................................................................668
Using AQtime on Non-English Locales ...........................................................................................668
Checking for Updates...........................................................................................................................671
AQtime Data Files ...............................................................................................................................671
Unsupported Code................................................................................................................................672
DEVELOPMENT TOOLS INTEGRATION......................................................................................673
Microsoft Visual Studio .......................................................................................................................673
Integration With Microsoft Visual Studio - Overview......................................................................673
Adding Code to Profiling Areas From Code Editor ........................................................................675
Using Quick Profiling Area .............................................................................................................676
Extending Microsoft Visual Studio Test Projects with AQtime Projects .........................................677
Team Build Integration ....................................................................................................................682
Toolbars and Menus.........................................................................................................................713
Embarcadero RAD Studio ...................................................................................................................720
Integration With Embarcadero RAD Studio - Overview..................................................................720
Toolbars and Menus.........................................................................................................................721
Adding the AQtime Menu Item to Borland Delphi and C++Builder IDE ...........................................727
Adding the AQtime Menu Item to Visual C++ 6.0 IDE ......................................................................727
Integartion With Source Control Systems............................................................................................728
INDEX.....................................................................................................................................................730
www.automatedqa.com
AQtime by AutomatedQA Corporation
Introducing AQtime
7
Introduction
Introducing AQtime
From specification to final delivery, professional developers constantly aim to build applications that are
robust, clean-running and clear of hidden bottlenecks, resource wastage and performance limitations. AQtime
is the tool that tells you at any moment during development how your application is doing. Using its
comprehensive suite of profilers, developers can measure the health of their applications with unrivaled
accuracy.
Profiling vs. testing
AQtime is an integrated profiling toolkit. You may be asking yourself what the difference is between a
profiler and a regression testing tool? A test tool records what each part of an application does for other parts,
and what the entire application does for the user. A profiler traces how the application does what it does. A test
tool takes output measurements. In essence, a profiler takes “health & vitality” measurements. Needless to
say, AutomatedQA makes an excellent test tool, TestComplete. But now that we have shown that profiling and
testing are two different things, the rest of this documentation will be concerned only with what AQtime does,
profiling.
Manual vs. automation
You can certainly profile an application manually, without AQtime. Manual profiling in its most
rudimentary form might be to use a stopwatch and system tools to check resources before and after application
usage. A more advanced method of manual profiling is to insert code within your application and check the
system timer at the start and at the end of a code section, check resources, output routine calls to a log, etc. In
fact, without a comprehensive automated profiler like AQtime, this is what you will be forced to do when you
are worried about the “health & vitality” of a section of code.
A profiler, on the other hand, tracks and accurately measures performance and memory use during
application execution automatically, then displays the results in comparative format. For instance, it might
time the start and end of any routine call, and display the results as a percent of total time used by each routine.
What AQtime does
AQtime removes the dangerous guesswork traditionally associated with performance and memory usage
optimization. It offers you an easy-to-use and structured way to hunt down and eliminate the cause of
bottlenecks as well as memory hogging unsafe code. With AQtime you can be on your way to building
applications that perform at their highest possible level - all the time!
AQtime was built with a single key objective - to help you completely understand how your programs
perform during execution. AQtime gathers crucial performance and memory allocation information at runtime
and delivers it to you in both summarized and detailed form, with all the tools you will need to begin the
optimization process - from customized filters and graphical call hierarchies to source code views.
© 2010 AutomatedQA Corp.
www.automatedqa.com/support
8
Introduction
Of course, taking only one kind of profile is not a way of keeping on top of the general health of the
application. This is like tracking your health with a balance. A good automatic profiling application will supply
several kinds of profilers, and allow you to use any number together or separately, and on varied parts of the
application. Better yet, it will let you interactively pin down the crucial information you are looking for, and
which may not be where you thought it would be at first.
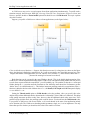
Not only can a profiler take many kinds of measurements (how often a function is called, time spent in a
given unit, events generated, memory leaks, etc.), it can also get these in different ways:
•
Some of it is totally non-intrusive: the profiler requests before-and-after information from the
operating system.
•
Some of it is practically non-intrusive: modern operating systems switch tasks many times per
second. On each task switch, which would equally occur without the profiler being present, the
profiler can gather some extremely simple information; what this changes to the task switch is
immeasurable; the profiler’s only practical intrusion is that it uses some memory and resources.
•
Some of it is minimally intrusive: profiling operations are inserted at many spots, but they are
inserted through binary instrumentation. That is, once the executable code is loaded into memory,
it is modified to add the needed operations. This is better than source-code instrumentation not
only for the reasons explained below, but because in binary the profiling points can be positioned
more precisely. For instance, a short (but often-called) function may spend most of its time in
setup and finalization, that is, before the first line of code and after the last. Instrumenting source
cannot profile those parts of it, so it yields highly misleading information.
•
Some of it is awkwardly intrusive. The processor allows a soft breakpoint operation, which in
principle would be the simplest way to call profiler services. So, one variation of binary
instrumentation or source code modification (see below) is to insert these “made to order”
soft-breakpoint instructions. Under Windows 2000, however, each soft breakpoint implies a
context switch, as the profiler is running as a separate process. The result is that most of the
runtime will be occupied by these context switches.
•
Some of it highly intrusive: the profiler requires modification of the source code, so that your
profiling source is never your normal-build source. Since this implies thousands of insertions, it
has to be done by an automated source-modification tool. The tool will tempt you into “avoiding”
the forking by letting it undo the modifications it did. This is worse still - you can never be sure the
“cleaned up” source is identical to what you had in the first place. Some people have sworn off
automated profilers because of these intrusions.
As you might expect by now, AQtime never, ever modifies source code. In fact, it always uses the least
intrusive method to achieve the requested results. However, since you normally expect results to refer to
functions or sections of code, most AQtime profiles require that the application be compiled with debugger
information, so that code points can be linked to function or unit names.
In addition, AQtime does not use soft breakpoints, with their context switches. The operations added by
binary instrumentation are minimal, and run in the same process as the application. It should be noted,
however, that binary instrumentation is still instrumentation. The operation may be very quick, but it leaves the
processor, with its pipelines and caches, in a somewhat different state than if there had been no
instrumentation.
A note about results: many profiles are measures of relative time. In the ordinary world, relative time is
time relative to total elapsed time, that is, real time. In profiling generally, it’s different. You cannot do
anything about the elapsed time spent waiting for user input, except to go without the input. You can somewhat
easier go without some system calls, but the fact remains that you cannot improve system code. Therefore, a
profiler by default compares profiled times - the times your own code takes to execute. Relative time is time
relative to the time taken by all profiled functions.
www.automatedqa.com
AQtime by AutomatedQA Corporation
Introducing AQtime
9
AQtime, of course, allows you to get profiles for each function taken alone, or including all the calls it
makes to other functions (“child calls”). It also allows you to include or exclude time spent calling the system
functions. And finally it allows you to profile functions not just relative to one another, as is the usual practice
for profilers, but relative to real time, the entire elapsed time of the profile run, that is, including input and
output calls.
A hidden but crucial aspect of AQtime is that its architecture is COM-based. This means it can be used as
a server by any application (the idl is supplied of course). In fact, it is used for some services (for example,
coverage) by AutomatedQA’s test automation software, TestComplete. More important is that all the parts of
AQtime are COM objects. They can be separately plugged in or out. In fact, some of the profilers we will list
below are supplied with your installation as separate plug-ins. More will be made available, or are already
available on AutomatedQA’s Web site, http://www.automatedqa.com/.
Therefore, each of these profilers is a standalone object; each is built and tuned to its one purpose. We are
not talking about surface “features” added to the same basic engine, we are talking about separate,
professional-grade profilers. The business of making them easy to understand and run, and of integrating their
results together in a flexible format, is left to the User Interface, discussed further down.
The current list of profilers is in a separate topic, AQtime Profilers. You should read that before proceeding
- it is the heart of AQtime.
The User Interface’s main tasks are to allow you to:
•
Specify the application to profile (project).
•
Choose profilers to run on it.
•
Filter the profiler results to center on your particular points of concern.
•
Display the results.
•
Format reports.
Results can be filtered by time, location, etc. They can also be filtered by the thread in which the event
occurred.
There are many display options. Most results can be shown in one or several graphical formats (e.g.
histogram), or in a selection of columns.
One display mode for the profiler results deserves special attention: the Call Graph. All
binary-instrumented profilers in AQtime can record the caller for each call of a function. The problem is what
to do with the resulting data. The Call Graph is a very easily understood, interactive display that shows each
profiled function with basic timings, and arrows from the functions that called it, and to those that it called.
Each arrow carries the count of calls recorded.
The most controllable form of result display is the report, which is a totally-configurable grid shown in the
Report panel. Besides this onscreen display, the Report panel can print its contents and export it to a text,
Excel, html or xml files.
Integration into IDEs
AQtime is tightly integrated into Microsoft Visual Studio and Embarcadero RAD Studio (and earlier
versions of RAD Studio by CodeGear and Borland). This feature provides you with the full AQtime
functionality without leaving the IDE. You can create and manage AQtime projects, profile your applications
and view profiling results directly from the IDE. See Integration into IDEs for more information.
Getting Started
To start using AQtime, see the Getting Started section of this document.
© 2010 AutomatedQA Corp.
www.automatedqa.com/support
10
Introduction
System Requirements
Hardware Requirements
•
Intel Pentium II 450 or higher (Pentium 4 1GHz recommended). AQtime also supports the
following processors:
Processors of the Intel Core family (Intel Core i7, Intel Core 2 Duo, Intel Core Duo and others)
Intel Xeon and Intel Xeon MP
Intel Pentium II, Intel Pentium III
Intel Pentium 4 (including Intel Pentium 4 supporting Hyper-threading Technology and Intel
Pentium 4 Extreme Edition supporting Hyper-Threading Technology)
Mobile Intel Pentium 4
Intel Pentium Extreme Edition, Intel Pentium D, Intel Pentium M
Intel Celeron, Intel Celeron D, Intel Celeron M
AMD Phenom
AMD Athlon 64 FX
AMD Athlon XP, AMD Athlon 64 X2 Dual-Core, AMD Athlon 64
AMD Sempron
AMD Opteron
AMD Turion 64 X2 Mobile Technology and AMD Turion 64 Mobile Technology
AMD Athlon 64 for DTR
Mobile AMD Athlon 64
Mobile AMD Sempron
To learn AQtime’s limitations that depend on the engaged processor model, see Supported
Processor Models.
•
256MB of RAM (1GB or more recommended).
•
250MB hard disk space for installation and 200MB for using the product.
•
SVGA (800 × 600) or higher resolution monitor.
•
Mouse or other pointing device.
Note: AQtime may consume a lot of memory to store profiler information. Therefore, when working
with large projects, it is recommended that you allocate as much physical RAM as possible so
that Windows does not use the swap file.
Operating System and Internet Explorer
•
Operating system:
Microsoft Windows 7 (either 32-, or 64-bit edition).
Microsoft Windows Server 2008 (either 32-, or 64-bit edition).
Microsoft Windows Server 2008 R2 is also supported.
Microsoft Windows Vista (either 32-, or 64-bit edition).
Microsoft Windows Server 2003 (either 32-, or 64-bit edition).
www.automatedqa.com
AQtime by AutomatedQA Corporation
System Requirements
•
11
Microsoft Windows XP (either 32-, or 64-bit edition).
Microsoft Windows 2000.
Microsoft Internet Explorer 5.0 or later.
Important notes:
•
If you use a computer that has several processors or a multiple-core processor (for example,
dual-core CPU) and has Windows XP Service Pack 2, then you must install the Windows update
#896256 in order for AQtime to be able to profile your application correctly. The update can be
obtained in the following ways:
•
Installed as part of Windows XP Service Pack 3.
•
Installed via Windows Update.
•
Downloaded from Microsoft’s web site:
http://support.microsoft.com/kb/896256
•
To use AQtime on Windows Server 2008 R2, the WoW64 component is required. The Server
Core installation option for Windows Server 2008 R2 does not install WoW64 by default, so,
you should install it yourself. This requirement concerns both AQtime x86 and x64 packages.
Profiling .NET Applications
To profile .NET applications, Microsoft .NET Framework 1.0, 1.1, 2.0, 3.0, 3.5 or 4.0 is required.
Profiling Java Code
To profile Java applications, you must have one of the following Java virtual machines installed on your
computer:
•
Sun Java Runtime Environment (JRE) v. 1.5 and 1.6.
Profiling Scripts
To profile VBScript and JScript functions, AQtime requires the Windows Script and Script Debugger
components. The Windows Script component is supplied with each Microsoft operating system (since
Windows 98), thus it is already present on your machine. The Script Debugger may also be installed on your
machine, as it is shipped along with Visual Studio (since version 2003) and Microsoft Office (version XP and
later).
If you have problems with script profiling, try reinstalling these components. You can find standalone
packages of these components at Microsoft Download Center (http://www.microsoft.com/downloads). Search
for the following items:
•
Windows Script (Windows Script 5.6 or later is required)
•
Script Debugger
The versions of Windows Script and Script Debugger may be different and incompatible with one another.
For information on possible problems and workarounds for them, see Profiling Under 64-bit Platforms.
To profile script routines, you also need to specify certain user permissions and prepare the host
application in a certain way. See Profiling Scripts - Prerequisites for more information.
User Account
© 2010 AutomatedQA Corp.
www.automatedqa.com/support
12
Introduction
To install and use AQtime, you must have administrator permissions on your computer. AQtime can be
installed and used under different user accounts, but all of them must have administrator permissions.
Running Under Windows Vista, Windows Server 2008 or Windows 7
To be used under Windows Vista, Windows Server 2008 or Windows 7, AQtime must be launched under
an account with administrator privileges.
Profiling Under Different User Accounts
AQtime can profile applications under a user account that differs from the current account (the one under
which AQtime is running). This can be done only if the current user account has certain user rights in addition
to administrator privileges. See Profiling Under Another User Account for details.
AQtime and Windows DDK
If you have Windows DDK installed, then after installing AQtime:
•
Launch Driver Verifier (a tool from the Windows DDK package) and
•
Disable verification of the aqIPD7.sys driver (the aqIPD7.sys driver is part of AQtime).
Driver Verifier blocks the AQtime driver, so you need to disable verification for the AQtime driver.
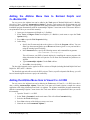
Integration into IDEs
AQtime can be integrated into Microsoft Visual Studio and Embarcadero RAD Studio (and into earlier
versions of RAD Studio by CodeGear and Borland):
•
Microsoft Visual Studio 2010,
Microsoft Visual Studio 2008,
Microsoft Visual Studio 2005,
Microsoft Visual Studio .NET 2003,
Microsoft Visual Studio .NET.
•
Embarcadero RAD Studio XE (including localized verions),
Embarcadero RAD Studio 2010 (including localized versions).
•
CodeGear RAD Studio 2009,
CodeGear RAD Studio 2007.
•
Borland Developer Studio 2006, Update 2.
Licensing
To activate an AQtime license, the computer must be connected to the Internet. After the license is
activated, an Internet connection is not required.
If you are going to use an AQtime Floating User license, your computer must have a network connection.
For more information about AQtime licensing and activation, see AQtime 7 Pro Licensing Guide.
www.automatedqa.com
AQtime by AutomatedQA Corporation
Supported Development Tools
13
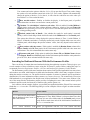
AQtime x86 and x64 Packages
AQtime includes two packages: AQtime x86 and AQtime x64. The difference is in the type of applications
they can profile and in supported operating systems.
The AQtime x86 package contains modules, files and componenets for profiling 32-bit Windows and
.NET applications. Use this package to profile 32-bit applications on 32-bit Windows operating systems. Note
that AQtime x86 can also run on 64-bit versions of Windows. However in this case, the Performance and
Function Trace profilers can use only the Elapsed Time counter. The other counters are not available.
The AQtime x64 package contains specific modules and components that are used to profile both 32- and
64-bit applications. Use this package to profile 32-bit and 64-bit Windows and .NET modules on a 64-bit
Windows operating system (this package can run only on a 64-bit OS). Note that the Performance and Function
Trace profilers can use only the Elapsed Time counter. The other counters are available if the operating system
is running in debug mode. For detailed information on peculiarities of running AQtime x64, see Profiling
Under 64-bit Platforms.
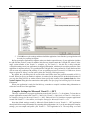
Supported Development Tools
AQtime can profile .NET (managed), native-code (non-.NET, unmanaged) and Java executables.
.NET (Managed) Applications
AQtime supports all existing compilers that generate MSIL code, for example:
Microsoft Visual Studio .NET 2002 and 2003, Outside Microsoft
Microsoft Visual Studio 2005, 2008 and 2010
Visual C# 2005, 2008, 2010
Embarcadero RAD Studio XE
Visual C# .NET
Embarcadero RAD Studio 2010
Visual Basic 2005, 2008, 2010
CodeGear RAD Studio 2007 and 2009
Visual Basic .NET
Borland Delphi 2006 for .NET
Visual C++ 2005, 2008, 2010
Borland Delphi 2005 for .NET
Visual C++ .NET
Borland Delphi 8 (Delphi for .NET)
Visual J# 2005
Borland C#Builder 2006
Visual J# .NET
Borland C#Builder
JScript .NET
APL
F#, Visual F#
Cobol
Component Pascal
Eiffel
Haskell
Mercury
Oberon
Perl
Python
Scheme
SmallTalk
© 2010 AutomatedQA Corp.
www.automatedqa.com/support
14
Introduction
Standard ML
This list is expanding constantly while new .NET-friendly languages appear.
To learn more about Microsoft .NET, visit http://www.microsoft.com/net/.
Native-Code (Unmanaged) Applications
AQtime can profile executables created with any of the following development tools:
•
Microsoft Visual C++ v. 4, 5, 6, 7, 8, 9 and 10
•
Microsoft Visual Basic v. 6.0
•
Embarcadero Delphi 2010 and XE,
CodeGear Delphi 2007 and 2009 for Win32,
Borland Delphi 2005 and 2006 for Win32,
Borland Delphi v. 2, 3, 4, 5, 6, 7
•
Embarcadero C++Builder 2010 and XE,
CodeGear C++Builder 2007 and 2009,
Borland C++Builder 2006,
Borland C++Builder v. 3, 4, 5, 6
•
Intel C++ v. 7.0
•
Borland C++ v. 4.5 and 5.x
•
GNU Compiler Collection v .2.95 and later
•
Compaq Visual Fortran v. 6.5
Besides support for compilers included in Microsoft Visual Studio and Embarcadero RAD Studio (and
earlier versions of RAD Studio by CodeGear and Borland), AQtime is tightly integrated into these IDEs. For
more information, see Development Tools Integration.
Java Applications
AQtime can profile any Java application that runs on Sun Java Runtime Environment (JRE) v. 1.5–1.6.
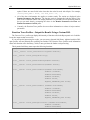
Supported Processor Models
As the System Requirements topic states, AQtime can operate on computers that include any of the
following processor models if the processor provides appropriate performance:
•
Intel Processors
Processors of the Intel Core family (Intel Core i7, Intel Core 2 Duo, Intel Core Duo and
others)
Intel Xeon and Intel Xeon MP
Some counters are not supported on the Intel Xeon multi-core processors with the
Hyper-Threading technology, for instance, on Intel Xeon Duo Core processors with hyper
threading. See below).
Intel Pentium II
Intel Pentium III
Intel Pentium 4 (including Intel Pentium 4 supporting Hyper-threading Technology and
Intel Pentium 4 Extreme Edition supporting Hyper-Threading Technology)
www.automatedqa.com
AQtime by AutomatedQA Corporation
Supported Processor Models
•
Mobile Intel Pentium 4
Intel Pentium Extreme Edition
Intel Pentium D
Intel Pentium M
Intel Celeron
Intel Celeron D
Intel Celeron M
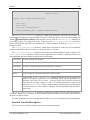
15
AMD Processors
AMD Phenom
AMD Athlon 64 FX
AMD Athlon 64 X2 Dual-Core
AMD Athlon 64
AMD Sempron
AMD Opteron
AMD Athlon XP
AMD Turion 64 X2 Mobile Technology
AMD Turion 64 Mobile Technology
AMD Athlon 64 for DTR
Mobile AMD Athlon 64
Mobile AMD Sempron
Using some of the processor models mentioned above imposes certain limitations on AQtime's
functionality. These limitations mean that particular profiler counters of the Performance profiler are not
available for these “exclusive” processor models. The Intel Pentium 4 and Intel Pentium D processors are free
of these limitations. They support all counters. The currently known limitations of other processors are as
follows:
•
The Intel Core i7, Intel Core 2 Duo, Intel Pentium II, Intel Pentium III, Intel Pentium M,
AMD Phenom, AMD Athlon XP and AMP Athlon 64 processors support the Elapsed Time,
User Time, User+Kernel Time, CPU Cache Misses, CPU Mispredicted Branches, Context
Switches, Hard Memory Page Faults, Soft Memory Page Faults and All Memory Page Faults
profiler counters but do not support the Split Load Replays, Split Store Replays, Blocked Store
Forwards Replays and 64K Aliasing Conflicts counters.
•
The Mobile Intel Pentium 4 processor and the AMD Opteron and AMD Turion processors only
support the Elapsed Time, Context Switches, Hard Memory Page Faults, Soft memory Page Faults
and All Memory Page Faults counters.
•
The Intel Xeon and Intel Xeon MP multi-core processors with the Hyper-Threading technology
only support the Elapsed Time, Context Switches, Hard Memory Page Faults, Soft Memory Page
Faults and All Memory Page Faults counters.
The single-core Intel Xeon and Intel Xeon MP processors support all the counters.
Note: If you run AQtime x86 on a 64-bit operating system, the only available counter is Elapsed Time.
The other counters are unavailable. AQtime x64 does not impose any limitations on counters. See
AQtime x86 and x64 Packages for more information.
© 2010 AutomatedQA Corp.
www.automatedqa.com/support
16
Introduction
What’s New in AQtime 7
AQtime 7 includes a lot of new features and exciting improvements that make the product even more
powerful and easy-to-use. Below, is the list of major changes.
Java Support
AQtime can now profile applications written in Java. They can be represented in the form of Java Archives
(.jar files) or machine-readable bytecodes (.class files). AQtime also supports profiling mixed code. For
example, you can use it to profile a Java application and a native dynamic link library that is used by this
application. See Profiling Java Applications for complete information.
Microsoft Visual Studio 2010 Support
Earlier versions of AQtime introduced support for Visual Studio 2010 applications and .NET Framework
4. In addition to these features, AQtime 7 provides complete integration into the Microsoft Visual Studio 2010
IDE. This means that:
•
AQtime integrates its panels, menus and toolbars into Visual Studio’s IDE.
•
You can add AQtime projects to Visual Studio solutions.
•
You can add AQtime tests to test projects created in Visual Studio 2010.
•
You can run AQtime tests during team builds to ensure that your modules have no memory leaks
and performance bottlenecks.
AQtime tests run on the computers where build or test agents are working. To run AQtime tests, there is no
need to have Visual Studio on these computers.
Embarcadero RAD Studio XE Support
AQtime 7 introduces complete support for Embarcadero RAD Studio XE:
•
AQtime can profile Delphi and C++Builder applications created in Embarcadero RAD Studio XE.
To learn how you can prepare such applications for AQtime, see Compiler Settings for
Embarcadero Delphi XE for Win32 and Compiler Settings for Embarcadero C++Builder XE.
•
AQtime integrates its panels, menus and toolbars into Embarcadero RAD Studio XE. This allows
you to optimize your applications without leaving this IDE. See Integration With Embarcadero
RAD Studio.
Profiling Under User Account
The Normal profiling mode includes new settings that let you specify the user account, under which the
profiled application will be started. This feature lets you check the application behavior under different user
accounts without having to log in to the operating system every time. See Profiling Under Another User
Account.
More Improvements
•
AQtime’s new Start Page allows you to quickly access recently used profiling projects or create
new ones. It also contains links to useful AQtime resources so that they are always available. You
can configure AQtime to display the Start Page each time it is launched, or access it any time by
selecting Help | Start Page from the main menu.
www.automatedqa.com
AQtime by AutomatedQA Corporation
Technical Support and Resources
•
17
Now AQtime automatically collects profiling results if the profiled application was shut down due
to the following reasons:
An unhandled exception occurred in the application.
The application terminated itself using the TerminateProcess function.
This makes it easier to profile unstable applications that may exit unexpectedly.
•
You can now customize the date and time format in the Event View panel by using the new Time
format setting.
•
AQtime’s COM interface has been extended:
The IntegrationManager object includes a new OpenConfiguration method that lets
you load data from the specified configuration file (*.acnfg) into the currently open AQtime
project.
A
new Results property of the IntegrationManager object returns the
IaqAQtimeResults object that lets you delete, merge, import and export profiling results
via COM.
The TakeSnapshot method of the IntegrationManager object has a new SnapshotName
parameter that specifies the name which AQtime will assign to the generated result set.
•
Undocked panels now have the Maximize and Minimize buttons. The ability to maximize separate
panels is helpful when organizing AQtime’s layout on multiple monitors.
•
The Files to Ignore, Routines to Ignore and Search Directory settings have been moved from
AQtime’s Options menu, Microsoft Visual Studio’s AQtime | Options menu and RAD Studio’s
AQtime menu to the General section of the Options dialog. This will help novice users to find
them faster.
Technical Support and Resources
If you have questions, problems or just need help with AQtime, contact our support team or try to search
for the needed information using the help resources located on AutomatedQA’s Web site (troubleshooter,
forums, blogs, technical papers).
AQtime Troubleshooter
We recommend that you start resolving your problem by using AQtime Troubleshooter. It resides on
AutomatedQA's Web site:
http://www.automatedqa.com/support/about-troubleshooter/
Go through the troubleshooter pages and if the information they contain does not help, at the end, you will
be able to send a message to our support team.
Licensing Questions
To get information on AQtime licenses and solutions to typical licensing problems, use the AQtime 7 Pro
Licensing Guide that is shipped along with AQtime Pro.
© 2010 AutomatedQA Corp.
www.automatedqa.com/support
18
Introduction
If you need assistance with license activation, deactivation or maintenance, please contact your Sales
Manager:
Phone: +1 (978) 236-7900
Web:
http://www.automatedqa.com/support/message/
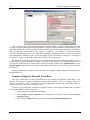
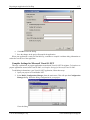
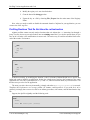
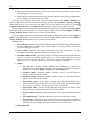
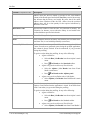
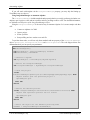
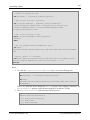
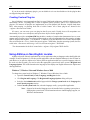
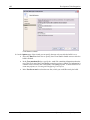
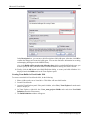
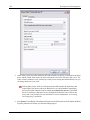
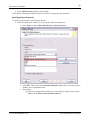
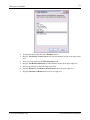
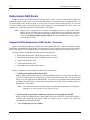
Submitting a Question to the Support Team
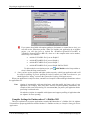
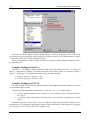
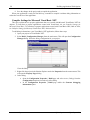
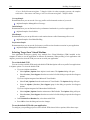
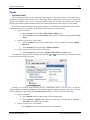
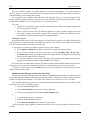
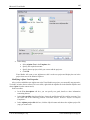
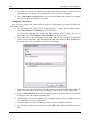
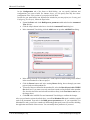
1. Select Help | Contact Support Team from AQtime’s main menu. This will invoke the Contact
Support Team dialog.
2. (Optional) In the dialog, select the Attach system information to my support request check box
if you want AQtime to collect some system information and attach it to your request. To preview
the collected system information and make a decision whether you want to send it to our support
team, click the View the system information file contents link at the bottom of the dialog. This
will invoke the System Information dialog, in which you can preview the information to be
attached to the request.
If you do not want to attach this information to your request, clear the check box. However, we
recommend that you attach this information since it can help our support team solve your problem
quicker.
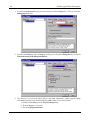
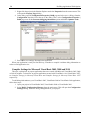
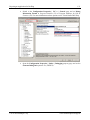
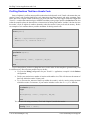
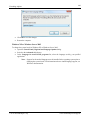
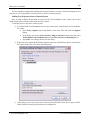
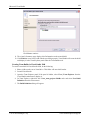
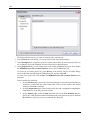
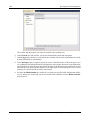
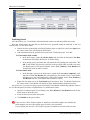
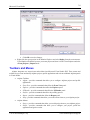
3. Click the Continue button in the Contact Support Team dialog. AQtime will load the web page
with the Contact Support Form from the AutomatedQA Web site to your web browser:
http://www.automatedqa.com/support/message
Fill in the required fields in this web form. Note that your contact information, the product name
and version are specified automatically in the appropriate fields when you proceed to this web
page from the Contact Support Team dialog. You only need to describe your problem in the
appropriate fields.
4. Click Submit in the Contact Support Form to submit the request.
The support team will answer you via e-mail and all further communication will be made via e-mail.
However, to start the conversation, please use the Contact Support Team dialog in AQtime and the Contact
Support Form on our web site.
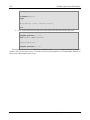
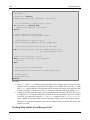
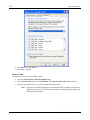
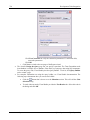
When sending a bug report, please specify the profiler you use and attach the Event View log. This
information will help the support team find a solution to your problem more efficiently. To create the
log:
•
Switch on the Exceptions | Active option of the Event View panel (To set the option,
right-click somewhere within the panel and select Options from the context menu).
•
Start profiling and perform the actions that generated the problem.
•
To save the log, choose Select All from the Event View context menu and then select
either Copy to Clipboard or Save to File.
For information on our support policies, please visit our web site http://www.automatedqa.com/support.
More Support Resources
You can also ask questions, search for answers, exchange comments and suggestions on our forums:
http://www.automatedqa.com/forums
www.automatedqa.com
AQtime by AutomatedQA Corporation
Technical Support and Resources
19
You can find answers to your question in the list of the frequently asked questions which is available at:
http://www.automatedqa.com/support/faq/?product=AQtime
Learn more about using AQtime from technical papers and blogs published at:
http://www.automatedqa.com/techpapers
http://www.automatedqa.com/blogs
Make sure you regularly visit the AutomatedQA Web site, http://www.automatedqa.com/, where you
will find:
•
News
•
More recent support options including frequently asked questions on our products
•
Downloads, such as plug-ins and free tools, from AutomatedQA
•
Hot Stuff contributed by experienced users and the AQA team (hands-on solutions, code, plug-ins,
etc.)
© 2010 AutomatedQA Corp.
www.automatedqa.com/support
20
Getting Started
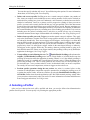
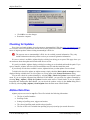
Getting Started
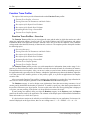
Throughout the AQtime Help system, we will use the generic term profiling describing the use of any of
AQtime profilers. Usually, but not always, a complete profiling operation involves the following steps:
•
Compiling your application with debug information
•
Opening your application in AQtime
•
Controlling what to profile and when to profile
•
Selecting the profiler to run
•
Running the selected profiler and analyzing the results
For more information on each step, read the Getting Started topics. Note that the Getting Started topics
describe general profiling approach. You may need to perform some additional operations depending on your
application type. For instance, if you profile an ASP.NET application, you may need to select the appropriate
profiling mode.
www.automatedqa.com
AQtime by AutomatedQA Corporation
General Information
21
General Information
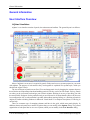
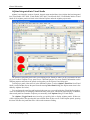
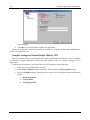
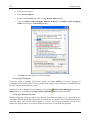
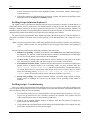
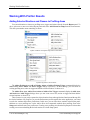
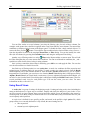
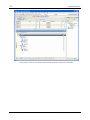
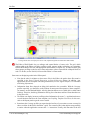
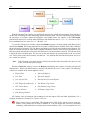
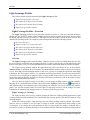
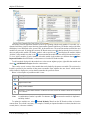
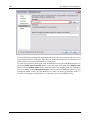
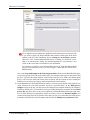
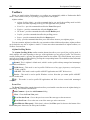
User Interface Overview
AQtime Standalone
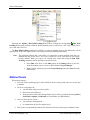
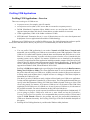
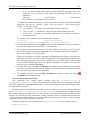
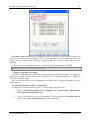
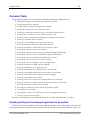
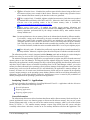
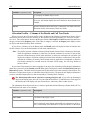
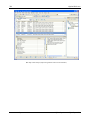
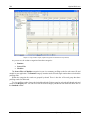
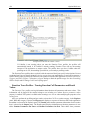
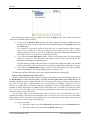
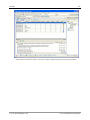
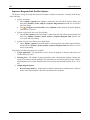
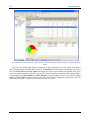
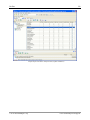
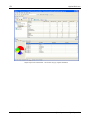
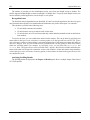
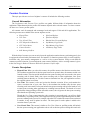
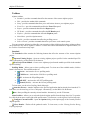
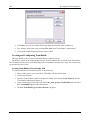
AQtime’s user interface consists of panels, the main menu and toolbars. The general layout is as follows:
Most of AQtime’s screen area is occupied by panels. Each panel serves a separate purpose in your work
with AQtime. The purpose of each and how they work together is explained in a separate topic, which you
should read: AQtime Panels.
The size and layout of panels are not fixed. You can change panel sizes by dragging the separator between
them. But the most important point about handling panels is how they can be moved around - docking. Panels
are where you do your actual work and get your results in AQtime. Docking is our way of providing you with
the most flexible workspace for the particular task you are interested in. It means that the entire work area can
be reconfigured at will, even beyond what is possible with toolbars (moving, hiding, etc.). Docking of panels in
AQtime is similar to docking windows in Microsoft Visual Studio. For complete description, see Docking in
on-line help.
There are common ways of arranging columns and lines in the grids, which most panels display. In
addition, almost each panel has a number of options that you can modify in the Options dialog. The general
organization of each panel has its own set of options, which you can modify in the User Interface dialog.
© 2010 AutomatedQA Corp.
www.automatedqa.com/support
22
Getting Started
To save the current panel layout to a file, select View | Desktop | Save Docking to File from AQtime’s
main menu (by default, these files have the .qtdock extension). To load the panel layout from a file, select View
| Desktop | Load Docking from File. To restore the default panel layout, select View | Desktop | Restore
Default Docking. The Save Desktop As and Load Desktop items of the View | Desktop submenu will save
and load the panel layout along with the toolbar settings.
The AQtime interface receives commands in four ways:
•
through menus
•
through popup menus (right-click, context-dependent)
•
through toolbars
•
through keyboard shortcuts
Keyboard shortcuts can be customized via the Customize Keyboard dialog. You can define your own
shortcuts or select one of the predefined key mapping schemes: MS Visual Studio IDE or Borland IDE.
As in Microsoft Word or Excel, menus are a type of toolbar, and both can be customized at will. You can
also create your own toolbars. By default, the Standard toolbar is docked to the top edge of the AQtime
window. Other toolbars are docked to panels with which that toolbar works. For instance, the Setup toolbar is
docked to the top edge of the Setup panel; the Report toolbar is docked to the top edge of the Report panel, etc.
You can easily dock toolbar to any other edge by dragging them to the left, right or bottom edge of the panel.
You can also dock the toolbars to any edge of the main window. See Toolbars Customization in on-line help
for more information.
To remove or add buttons from toolbars and menus, you can either call the Toolbar Customization window
or use the Quick Customization feature. For complete overview, see Toolbars Customization in on-line help.
To save or load the current layout of toolbars and toolbar items, use the View | Desktop | Save Toolbars to
File and View | Desktop | Load Toolbars from File menu items. To restore the default toolbar layout, select
View | Desktop | Restore Default Toolbars. To save and load the layout of panels, menus and toolbars, use
the View | Desktop | Save Desktop As and View | Desktop | Load Desktop menu items.
www.automatedqa.com
AQtime by AutomatedQA Corporation
General Information
23
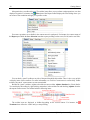
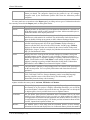
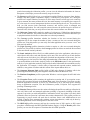
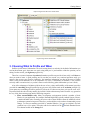
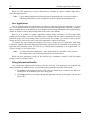
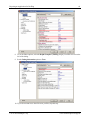
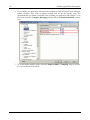
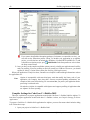
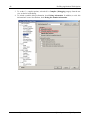
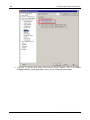
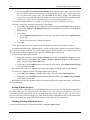
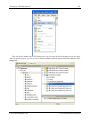
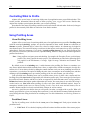
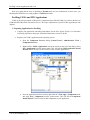
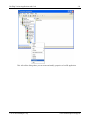
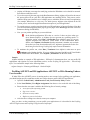
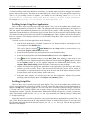
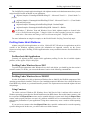
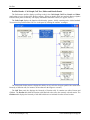
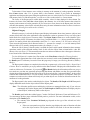
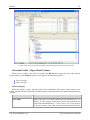
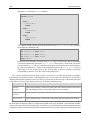
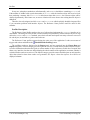
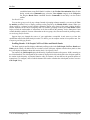
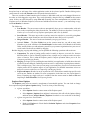
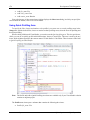
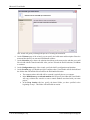
AQtime Integrated into Visual Studio
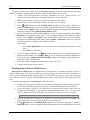
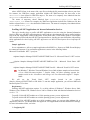
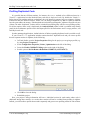
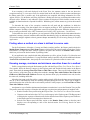
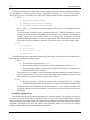
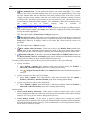
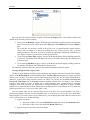
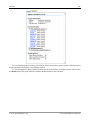
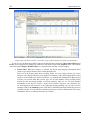
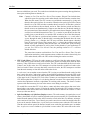
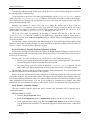
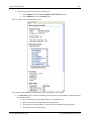
AQtime’s user interface consists of panels, the main menu and toolbars. Once AQtime has been integrated
into Visual Studio .NET 2002, Visual Studio .NET 2003, Visual Studio 2005, Visual Studio 2008 or Visual
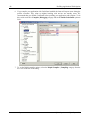
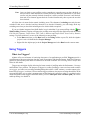
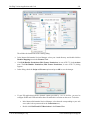
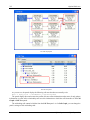
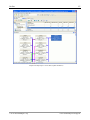
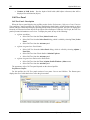
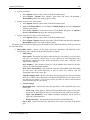
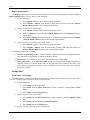
Studio 2010, AQtime panels are listed in the Solution Explorer under the AQtime project node:
The panels are grouped by their role in your AQtime project. Panels are where you do your actual work and
get your results in AQtime. Every panel serves a different purpose. For more detailed information on the
different purposes and on how the panels work together, see the AQtime Panels help topic.
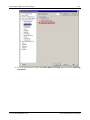
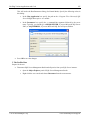
To bring up a panel, either select it in the Solution Explorer; or select AQtime | Panel List from Visual
Studio’s menu and then choose the panel from the ensuing Select Panel dialog (the AQtime menu item is also
added by AQtime. See below).
You can change the panel size and location in the same way you would with other Visual Studio windows.
There are common ways of arranging columns and lines in the grids, which most panels display. In addition,
almost each panel has a number of options you can modify in the Options dialog of Visual Studio.
The AQtime | Toggle Panels menu item lets you quickly hide or display AQtime panels. If there are
visible AQtime panels, then pressing this item will hide them. If there are no visible AQtime panels, pressing
this item will show the panels that were visible at the moment of hiding.
© 2010 AutomatedQA Corp.
www.automatedqa.com/support
24
Getting Started
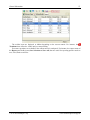
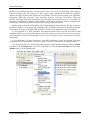
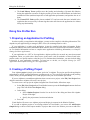
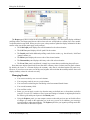
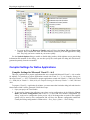
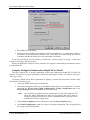
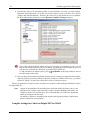
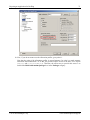
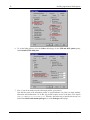
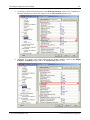
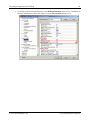
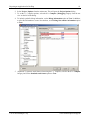
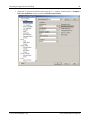
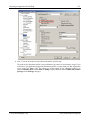
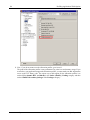
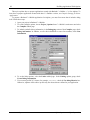
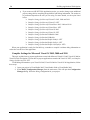
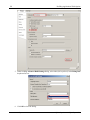
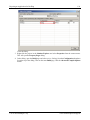
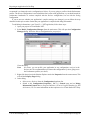
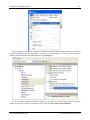
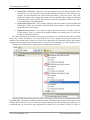
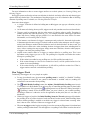
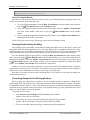
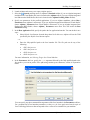
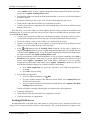
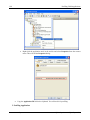
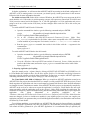
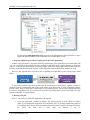
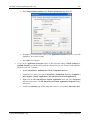
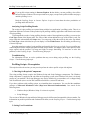
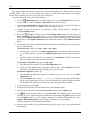
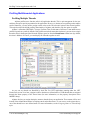
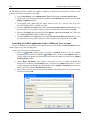
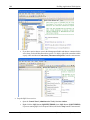
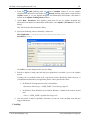
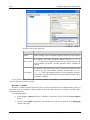
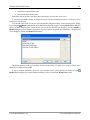
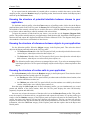
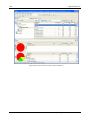
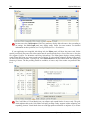
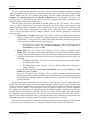
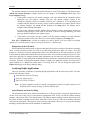
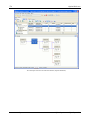
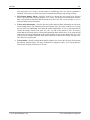
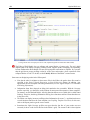
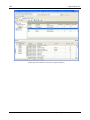
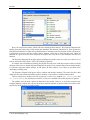
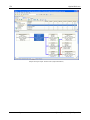
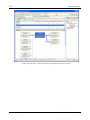
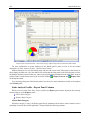
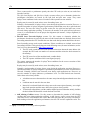
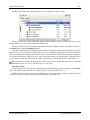
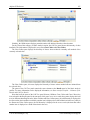
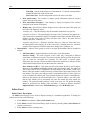
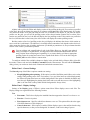
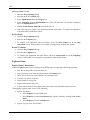
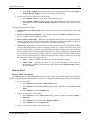
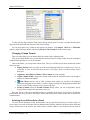
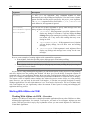
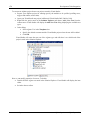
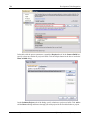
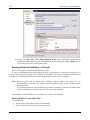
Most panels have a toolbar at the top. The toolbar items allow you to perform certain operations over data
Filter item of the Report toolbar displays the Filter dialog where you
displayed in panels. For instance, the
can create a filter condition and apply it to profiler results:
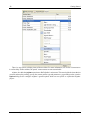
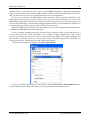
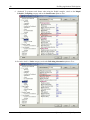
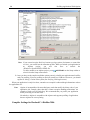
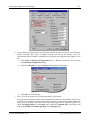
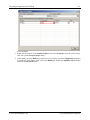
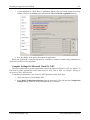
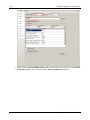
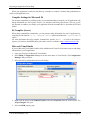
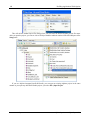
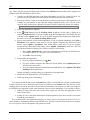
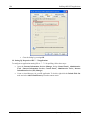
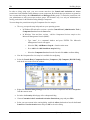
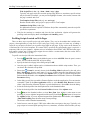
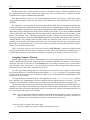
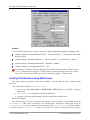
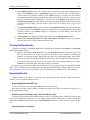
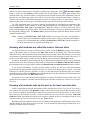
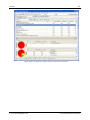
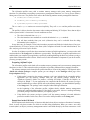
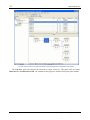
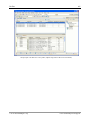
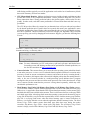
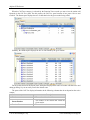
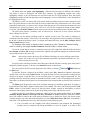
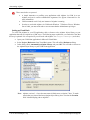
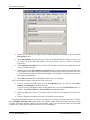
Even more operations are available in the context menu for each panel. For instance, the context menu of
the Report panel holds the Save Selection item that exports profiling results to text, Excel, html or xml files:
You can dock a “panel” toolbar to any side of the panel that holds this toolbar. There is also a way to hide
or display items of these toolbars. For more information, see Toolbar Customization in on-line help. Unlike
toolbars, the panels’ context menus are not customizable.
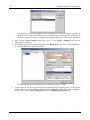
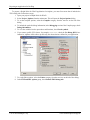
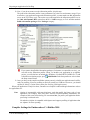
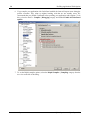
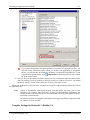
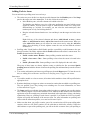
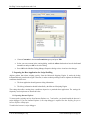
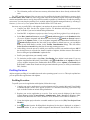
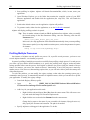
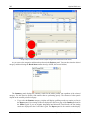
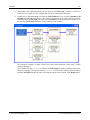
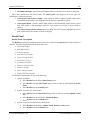
Besides the “panel” toolbars, AQtime also adds one more toolbar, AQtime Standard, to Visual Studio.
You can display this toolbar by right-clicking somewhere in the toolbar area and checking AQtime from the
subsequent context menu. The toolbar holds the following items:
The toolbar items are displayed or hidden depending on the current context. For instance, the
Terminate item will not be visible until you start profiling.
www.automatedqa.com
AQtime by AutomatedQA Corporation
General Information
25
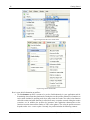
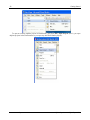
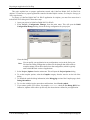
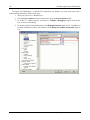
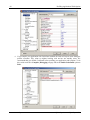
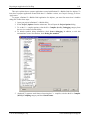
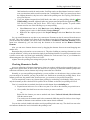
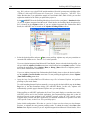
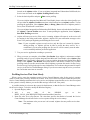
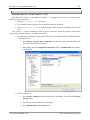
AQtime also adds the AQtime menu item to Visual Studio’s main menu. This menu holds the same items
as the AQtime Standard toolbar.
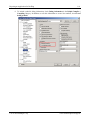
In addition to the AQtime menu, AQtime inserts several items to the Project menu:
You can manage the AQtime and Project menus and the AQtime Standard toolbar in the same manner as
you manage other Visual Studio menus and toolbars.
© 2010 AutomatedQA Corp.
www.automatedqa.com/support
26
Getting Started
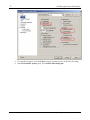
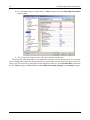
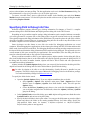
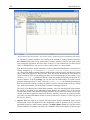
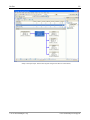
AQtime Integrated into RAD Studio
AQtime’s user interface consists of panels, the main menu and toolbars. Once AQtime has been integrated
into Embarcadero RAD Studio 2006 or later versions of this IDE (CodeGear RAD Studio 2007 and 2009,
Embarcadero RAD Studio 2010 and XE), all these elements of AQtime’s user interface are displayed within
the Embarcadero RAD Studio environment.
The panels are grouped by their role in your AQtime project. Panels are where you do your actual work and
get your results in AQtime. Every panel serves a different purpose. For more detailed information on the
different purposes and on how the panels work together, see AQtime Panels.
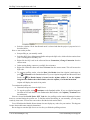
To bring up any of AQtime’s panels, select it in the AQtime Profile Windows submenu of RAD Studio’s
View menu.
You can change the panel size and location in the same way you would with other Embarcadero RAD
Studio windows. There are common ways of arranging columns and lines in the grids, which most panels
display. In addition, almost each panel has a number of options you can modify in the Options dialog.
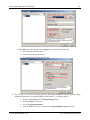
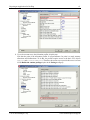
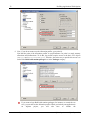
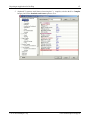
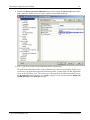
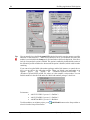
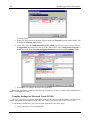
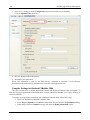
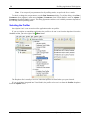
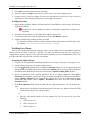
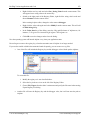
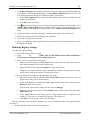
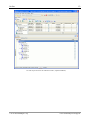
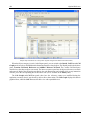
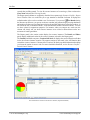
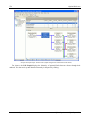
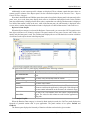
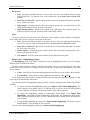
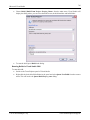
Most panels have a toolbar associated with them. These toolbars are displayed at the top of the
Embarcadero RAD Studio window. The toolbar items allow you to perform certain operations with data
Filter item of the Report toolbar displays the Filter dialog where you
displayed in panels. For instance, the
can create a filter condition and apply it to profiler results:
www.automatedqa.com
AQtime by AutomatedQA Corporation
General Information
27
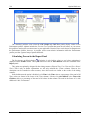
The toolbar items are displayed or hidden depending on the current context. For instance, the
Terminate item will not be visible until you start profiling.
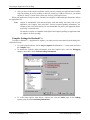
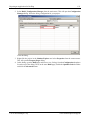
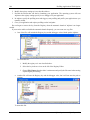
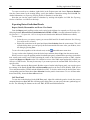
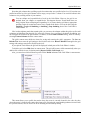
Even more operations are available in the context menu for each panel. For instance, the context menu of
the Report panel holds items (Save Selection and Save All) that are useful for exporting profiler results to
text, Excel, html or xml files:
© 2010 AutomatedQA Corp.
www.automatedqa.com/support
28
Getting Started
There is a way to hide or display items of these toolbars. For more information, see Toolbar Customization
in on-line help. Unlike toolbars, the panels’ context menus are not customizable.
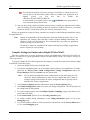
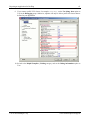
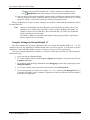
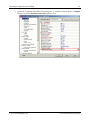
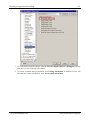
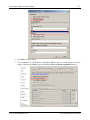
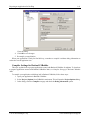
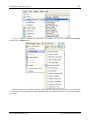
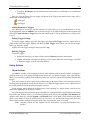
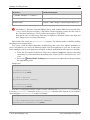
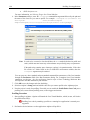
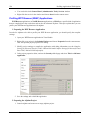
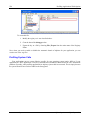
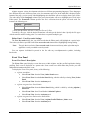
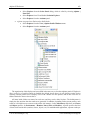
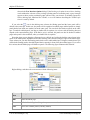
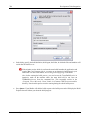
AQtime also adds the AQtime menu item to RAD Studio’s main menu. This menu holds the items that let
you start and stop the profiling, specify the current profiler type and parameters, get profiling results, open the
Options dialog used to configure AQtime’s general options which are not specific to a particular AQtime
project:
www.automatedqa.com
AQtime by AutomatedQA Corporation
General Information
29
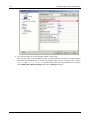
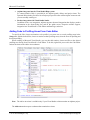
Selecting the AQtime | Run With Profiling menu item or clicking the corresponding
Run With
Profiling button starts profiling within the default profiling areas: Profile Entire .NET Code, Profile Entire
Java Code and Full Check.
The Run With Profiling command is available even when an AQtime project is not added to the current
project group, in this case AQtime creates a new project and starts profiling immediately.
Note: The described behavior has a side effect; if a project has custom profiling areas, they are
disabled and only Profile Entire .NET Code, Profile Entire Java Code and Full Check areas
become enabled. When you want to use custom areas, rather than using the Run With
Profiling command, start the profiling as described below:
•
Select Run menu item or click Run button on the Debug toolbar or press F9,
while the AQtime project is active in RAD Studio’s Project Manager.
•
Right-click the AQtime project in the Project Manager and select Start from the
context menu.
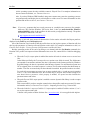
AQtime Panels
When using AQtime -•
First you define a profiling project, which will likely involve many profile runs over several days
or months.
•
Then, for each profile run --
•
•
you first define what you wish to profile, …
then execute the profile run, …
which generates results when the application exits or when you ask for this through Run |
Get Results (AQtime | Get Results in Visual Studio or in RAD Studio).
Once you have the new results -
you can browse through them …
or examine them in specific, targeted ways.
This result set is automatically added to the collected result sets for the project, and then or later --
© 2010 AutomatedQA Corp.
www.automatedqa.com/support
30
Getting Started
you can manage the collection, …
examine stored results with all the tools available for new results, …
and compare the result sets.
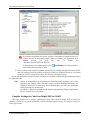
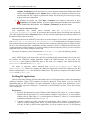
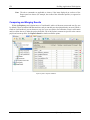
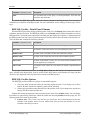
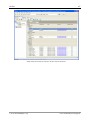
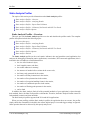
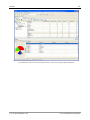
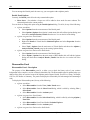
You will spend most of your time in AQtime working in its panels. The panels are organized to support the
task list above. Of all the tasks above, only the first, defining a project is done outside a panel.
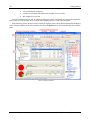
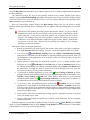
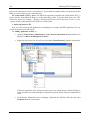
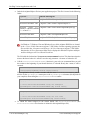
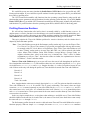
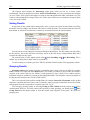
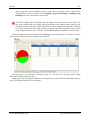
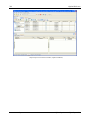
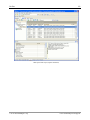
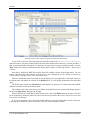
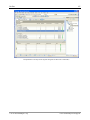
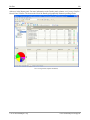
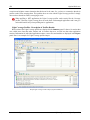
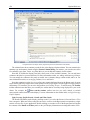
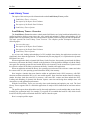
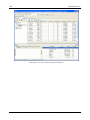
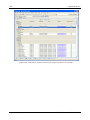
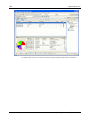
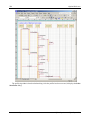
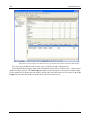
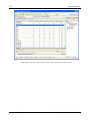
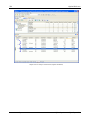
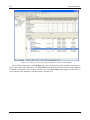
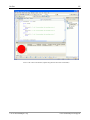
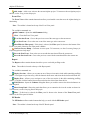
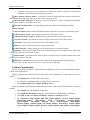
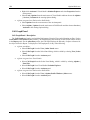
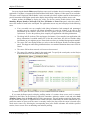
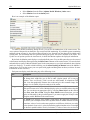
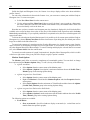
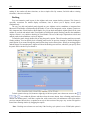
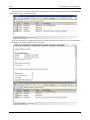
In the following picture, the latest result set from the Explorer panel is being browsed through in the Report
panel. Extensive details, for the line currently selected in the Report panel, are displayed below in the Details
panel.
Panels in AQtime standalone
www.automatedqa.com
AQtime by AutomatedQA Corporation
General Information
31
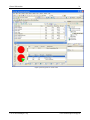
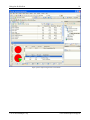
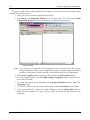
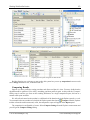
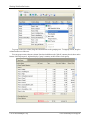
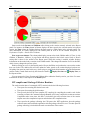
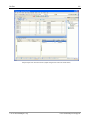
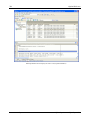
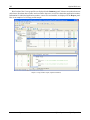
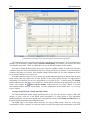
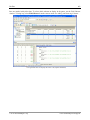
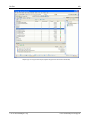
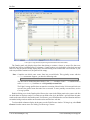
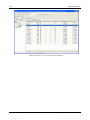
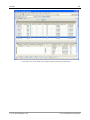
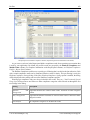
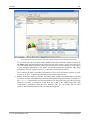
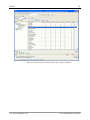
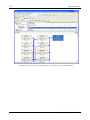
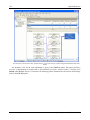
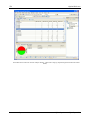
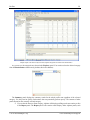
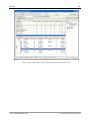
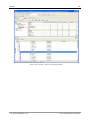
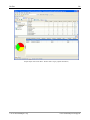
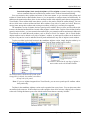
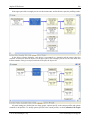
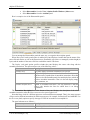
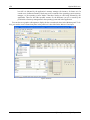
AQtime panels integrated into Visual Studio
© 2010 AutomatedQA Corp.
www.automatedqa.com/support
32
Getting Started
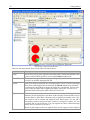
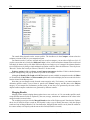
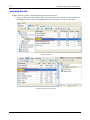
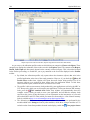
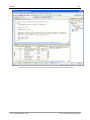
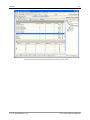
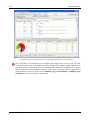
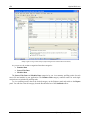
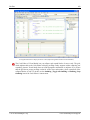
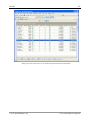
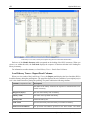
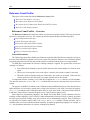
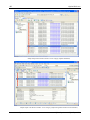
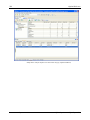
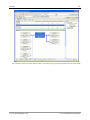
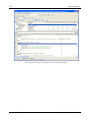
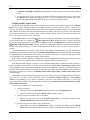
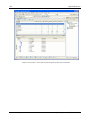
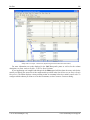
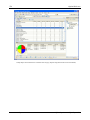
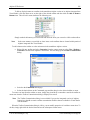
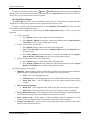
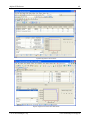
AQtime panels integrated into RAD Studio
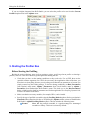
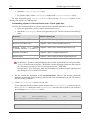
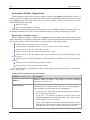
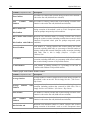
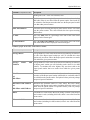
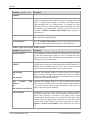
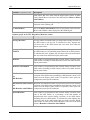
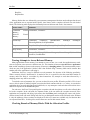
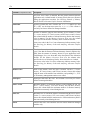
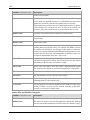
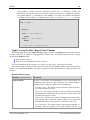
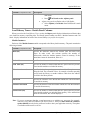
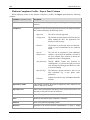
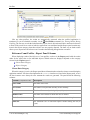
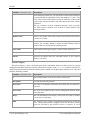
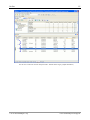
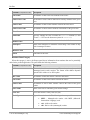
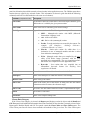
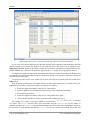
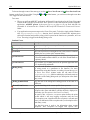
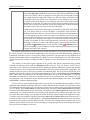
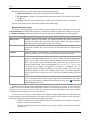
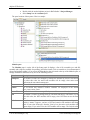
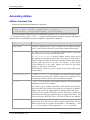
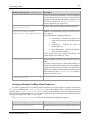
There are four major panels. They closely follow the task list above:
Panel
Description
Setup
This is where you go before a profile run to define what it will profile and when, once
you have selected which profiler to use from the Profiler dropdown list.
Event View
This reports messages and events during profiling as they occur. In other words, this
is where you track the ongoing profile run.
Report
After your results are generated, they are displayed here, and you can browse through
them. If the profiled application used threads, the Thread dropdown list will allow
you choose any single thread to display the results for, or all threads. There are also
ways to filter the results and to organize the display in the panel. You can save a
particular format for the panel and the filters as a result view.
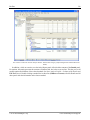
Explorer
This is where you manage result sets from the current project, including the latest.
Normally, the sets displayed are only those for the currently selected profiler, but you
can also choose to have all the collections (one per profiler) presented in a tree view.
Any result set can be selected and displayed in the Report panel. You can add a
description to each set, and you can store it, retrieve it, compare it to others, save it to
a separate file or read it from one. You can organize the entire collection through
folders, and you can delete sets from it.
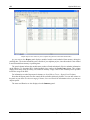
Results in each single result set are organized into several categories in the Explorer
www.automatedqa.com
AQtime by AutomatedQA Corporation
General Information
33
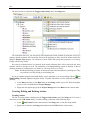
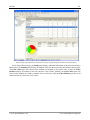
panel. For instance, on the picture above, results of the Performance profiler are
shown per thread. The categories depend on the profiler in use, for example,
categories used by the Performance profiler differ from the Allocation profiler
categories.
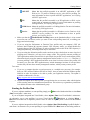
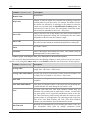
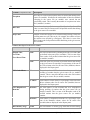
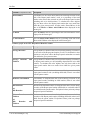
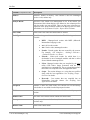
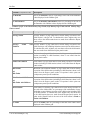
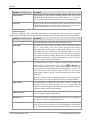
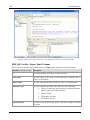
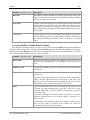
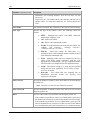
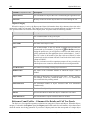
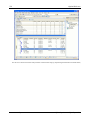
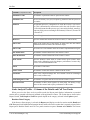
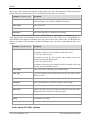
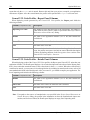
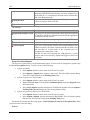
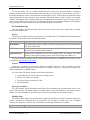
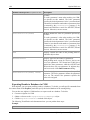
Six more panels act as extensions to the Report panel, providing various types of information about the
line currently selected in the Report panel, or about global results:
Panel
Description
Details
AQtime profilers use this panel to provide additional information for a selected row
in the Report panel, which would be impossible to show within reasonable space as
additional columns in the Report panel itself.
Call Graph
This panel shows the callers for the routine selected in Report, and which routines it
called in turn, with statistics for each link. The call hierarchy can be browsed up or
down by double-clicking on any parent or child, without returning to Report.
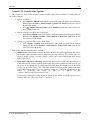
Call Tree
This panel includes two tabbed pages showing execution paths for the routine
selected in the Report panel. One of the pages, Parents, displays all stacks of
function calls that led to the call to the selected routine. Another page, Children,
displays all function calls that were initiated by the selected routine. Both panels
highlight the “longest” path (for example, the path that took most time to execute) to
help you find bottlenecks faster.
Editor
Displays the source code for the line selected in Report (if available), along with
optional summary results. This panel is only available if AQtime is running as a
standalone application. If AQtime is running as a package within Microsoft Visual
Studio, Visual Studio’s native Code Editor is used instead of AQtime’s Editor. If
AQtime is running as a package within Embarcadero RAD Studio, Embarcadero
RAD Studio’s native Editor is used instead of AQtime’s Editor.
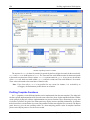
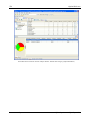
Summary
This panel holds a summary of the profiling results. The contents of the panel depend
on the current profiler. Use it to quickly find routines and classes that need to be
optimized.
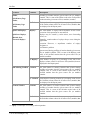
Disassembler
Displays the binary code for the routine that is selected in the Report, Details, Event
View, Call Graph, Call Tree, Setup or Summary panels, in assembly language,
showing either the source code with its line-by-line disassembly, or plain
disassembly from the binary code in memory.
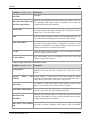
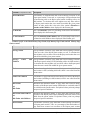
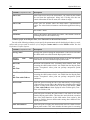
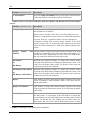
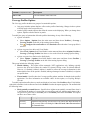
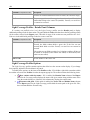
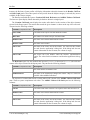
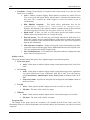
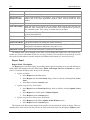
AQtime includes three more panels: Assistant, PE Reader and Monitor.
Assistant
This panel helps you get started using AQtime quickly. Depending on which step you
are currently at in your project, it displays information that helps you use all the
power that AQtime’s features can provide at this step. This panel can even be helpful
to AQtime-gurus, since it provides faster access to AQtime features.
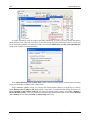
PE Reader
The PE Reader panel provides information about executables used by the main
module of your AQtime project. It lets you easily see which modules are linked to
your application at load-time and thus determine the modules that are necessary for
your application to function properly. PE Reader provides information about module
versions, imported and exported routines, etc.
Monitor
The Monitor panel is used along with the Allocation profiler. It traces memory
allocations in real time and displays the size of allocated memory blocks, the number
© 2010 AutomatedQA Corp.
www.automatedqa.com/support
34
Getting Started
of existing object instances, etc. during the application run. It is very easy to use and
quite instructive at times.
AQtime keeps information about your browsing in its panels, just as a Web browser would. There are the
Display Previous and
Display Next buttons on the Report toolbar, and you can use them to move back
and forth among a sequence of routines that you are focusing on.
Most AQtime panels hold tables of data. You can customize them as you wish: change the column size and
place, add and remove columns, sort and group records, etc. See Arranging Columns, Lines and Panels in
on-line help. Exactly what each panel displays is configurable through Options | Panel Options from the main
menu. There are separate options for each panel.
If you run AQtime as a standalone application, you can undock each panel and move it to any other
location. The View | Desktop | Docking Allowed menu item specifies if the docking is active or not. If this
option is on, you can undock any panel by dragging its header. You can then drag this panel to another location,
for example, you can put it on a tabbed page along with another panel. See Docking in on-line help for
complete description of the docking mechanism. If you ever need to bring up a panel quickly, the View menu
was made specifically for that reason - it’s your failsafe panel retriever.
If you use AQtime integrated into Visual Studio, you will see that AQtime panels are fully integrated into
Visual Studio’s IDE. You can dock, undock and move them around just as you would any other Visual Studio
window. To bring up a panel quickly, simply select it in the Solution Explorer. You can also bring up a panel
by selecting AQtime | Panel List from Visual Studio's menu and choosing the panel name in the ensuing
dialog.
If you use AQtime integrated into RAD Studio, you will see that AQtime panels are fully integrated into
RAD Studio’s IDE. To bring up a panel quickly, simply select it in the View | AQtime Profile Windows
menu.
Note that when you start profiling in Visual Studio, AQtime hides panels visible at design time and shows
panels visible at profile time. After the profiling is over, AQtime hides the profile-time panels and displays
design-time panels. Both profile-time and design-time collections of panels can be changed at your desire. If a
panel is visible when profiling starts, it is automatically added to the design-time panel collection. If you make
a panel visible at profile time and this panel is visible when profiling completes, it will be automatically added
to the profile-time panel collection. The AQtime | Toggle Panels menu item in Visual Studio lets you quickly
hide or display AQtime panels. If there are visible AQtime panels, then pressing this item will hide them. If
there are no visible AQtime panels, pressing this item will show the panels that were visible at the moment of
hiding.
Most panels of AQtime have toolbars associated with them. The toolbar items are used to perform certain
operations on data that are displayed in the panel. For instance, the
Field Chooser item on the Report
toolbar displays a list of available columns allowing you to add a column to the panel by dragging it from this
list to the panel. You can dock a toolbar to any side of the panel, to which this toolbar belongs. For more
information, see Toolbars Customization in on-line help.
AQtime Profilers
This topic is actually an extended section of the AQtime Overview, so it is we recommend you read that
first. It aims to supply a brief answer to the question: What do you use the profilers for?
AQtime includes fourteen profilers: Performance, BDE SQL, Reference Count, Allocation, Resource,
Coverage, Light Coverage, Exception Trace, Function Trace, Load Library Tracer, Static Analysis, Sequence
Diagram Link, Unused VCL Units and Platform Compliance. Four profilers - Static Analysis, Sequence
www.automatedqa.com
AQtime by AutomatedQA Corporation
General Information
35
Diagram Link, Platform Compliance and Unused VCL Units - do not run your application. Static Analysis,
Sequence Diagram Link and Unused VCL Units explore debug information and Platform Compliance
analyzes the import function table included in the executable. The other profilers launch your application.
Performance, BDE SQL, Reference Count, Allocation, Resource, Coverage, Load Library Tracer and
Function Trace gather data while the application runs and provide results when the run is over or when you
select Run | Get Results from AQtime's menu (AQtime | Get Results from the main menu of Visual Studio or
RAD Studio). Unlike these profilers, Exception Trace displays results in real time.
All the profilers can profile both managed (.NET) and unmanaged (native) modules. The only exception is
Platform Compliance - it can profile only unmanaged code. All profilers support 64-bit application profiling.
Also, AQtime is capable of profiling COM, ASP.NET, IIS and service applications under x64 platform.
If your application is a .NET application, then AQtime profilers do not need any more than normal
compilation, unless you wish to profile routines at line level or unless you wish to have direct access to source
code for methods or classes listed in profiler results (see How the AQtime Profilers Use Metadata and Debug
Information).
If your application is a native-code (that is, non-.NET) application, it must be compiled with debug
information. For more information, see How the AQtime Profilers Use Metadata and Debug Information.
You select the profiler to be used for application analysis from the Standard toolbar (or from the Profiler
dropdown list in the AQtime menu, if you use Visual Studio, or from the Current Profiler submenu of the
AQtime menu, if you use RAD Studio):
AQtime Standalone
© 2010 AutomatedQA Corp.
www.automatedqa.com/support
36
Getting Started
AQtime integrated into Microsoft Visual Studio
AQtime integrated into RAD Studio
Here is some brief information on profilers:
•
The Performance profiler is meant to be used to find bottlenecks in your application and for
determining what causes these bottlenecks. During the run, this profiler gathers lots of statistics on
each routine included in profiling tasks: how many times the routine was called, what function
called the routine and what functions it called, how many exception occurred during the routine
execution, etc. In addition, the profiler also measures such application characteristics as the
function execution time and the number of CPU cache updates. The value the profiler measures
depends on the Active counter option. Currently, the profiler includes the following counters:
www.automatedqa.com
AQtime by AutomatedQA Corporation
General Information
37
•
Elapsed Time
•
Split Load Replays
•
User Time
•
Split Store Replays
•
User+Kernel Time
•
Blocked Store Forwards Replays
•
CPU Mispredicted Branches
•
Soft Memory Page Faults
•
CPU Cache Misses
•
Hard Memory Page Faults
•
Context Switches
•
All Memory Page Faults
•
64K Aliasing Conflicts
The Elapsed Time, User Time and User+Kernel Time counters time application functions.
Depending on the counter in use, the resultant time may (or may not) include time spent on
executing the operating system code, time spent on switching between threads, etc. The CPU
Mispredicted Branches counter reports whether your code can be well predicted by the CPU’s
branch prediction unit. The CPU Cache Misses counter lets you determine whether hotspots in
your applications are caused by an excessive number of CPU cache updates. The Context Switches
counter calculates the number of context switches that occur during the function execution. Other
counters let you determine whether your application algorithms used to work with memory are
effective and do not cause performance bottlenecks. For a complete description of the counters
and counter limitations, see Counters Overview.
For .NET applications, the Performance profiler also lets you determine how much the .NET
runtime contributes to function results: the profiler measures the time spent for Just-in-Time
compilation and garbage collection and displays these times as <JIT compiler> and <Garbage
collector> routines in the profiler results.
These routines as well as counters and certain columns in profiler results help you determine
what caused a bottleneck during the application run. That is, you can use the Performance profiler
not just to establish the fact that a bottleneck exists, but to find the cause of the bottleneck as well.
For more information on this, see Searching for Bottleneck Reasons With the Performance
Profiler.
The Performance profiler can analyze your code at two levels of detail: routine and line. To
profile routines at line level, the application must be compiled with debug information. See How
AQtime Profilers Use Metadata and Debug Information.
The profiler collects separate results for each thread in a multithreaded application. It can
organize results by operating system threads as well as by .NET runtime threads. See Profiling
Multiple Threads for more information.
We would like to note once again that Performance profiler supports the profiling of both
managed and native (i.e. unmanaged) modules (see also Profiling Managed and Unmanaged
Code). This lets you profile, for example, unmanaged dynamic link libraries along with the .NET
modules that use these libraries.
•
The Allocation profiler traces the memory usage within your applications during the profiler run.
It reports how many objects of each class exist, how many memory blocks were allocated, how
much memory that objects and blocks occupy, etc. The profiler gathers lots of information: it
traces call stacks for objects and memory blocks, determines references between different
managed objects, etc. Using the Allocation profiler you can easily find memory leaks in your
unmanaged (i.e. non-.NET) applications. As for .NET applications, then though the common
language runtime reclaims all memory allocated for objects when the application is over, this
profiler is useful when trying to track the objects during the application run. Using the Monitor
© 2010 AutomatedQA Corp.
www.automatedqa.com/support
38
Getting Started
panel when running the Allocation profiler, you can view the allocation information in charts or
histograms, which helps you trace the memory usage in real time.
•
The Resource profiler follows how your application exploits Windows resources (fonts, brushes,
bitmaps, and other graphic components, registry, COM objects, print spooler, etc.) during the
profiler run. It reports what these resources are, how many resources of each type were created up
to given moment, how many of them still exist, how much memory is occupied by the resources in
use, what errors in resource management functions occurred during the run, etc. The profiler can
help you find resource leaks (unreleased resources) and resource errors in managed and
unmanaged applications. For each occupied resource instance, the profiler keeps its call stack of
functions calls, which lets you easily discover how this resource instance was allocated.
•
The Reference Count profiler tracks the number of references to COM objects that implement
one or several interfaces. The profiler traces the creation and deletion of references and allows you
to pinpoint unreleased references or those that were released prematurely.
•
The Coverage profiler determines whether the function or line was executed during the
application run. It also counts the number of times a routine (or line) was executed during the
profiler run. Using this profiler you can easily find what application areas your tests “cover” and
what was left untested.
•
The Light Coverage profiler determines whether a routine or a line was executed during the
profiler run. This profiler is similar to the Coverage profiler but it does not track the hit count and
it does not allocate results by threads.
•
The Static Analysis profiler will tell you which methods exist in the application, where they are
called from in the source code and what they call in turn. This does not tell you if and when the
calls will execute, but it does give a full report of method inter-dependence in the source. See it as
an intelligent overview browser of the debug information that is linked into the executable.
A powerful addition to the Static Analysis profiler is the PE Reader panel. It also performs the
analysis of your application statically and provides detailed information about modules used by
the application. For example, it shows tables of imported and exported routines, module base
addresses, entry points of routines and their offsets in the import address table, etc.
•
The Sequence Diagram Link profiler builds a UML-style diagram of function calls in the
profiled application and displays this diagram in Microsoft Word or Microsoft Visio.
•
The Platform Compliance profiler reports what Windows versions support the API calls in the
source.
•
The Exception Trace profiler monitors the application execution and, if an exception occurs,
displays the exception call stack in the Event View panel. Since Exception Trace does not slow
down the application execution, it can be very convenient to use if your main goal is tracking
down an application exception. Like the Performance profiler, Exception Trace supports the
profiling of unmanaged code.
•
The Function Trace profiler traces the routine calls during the profiler run and logs call stacks for
each call. Native-code and managed application profiling is supported (including 64-bit code
support). It provides you with comprehensive information on how any routine is invoked, which
parameter values are passed to it and some other routine characteristics. This profiler provides an
opportunity to process actual call stack data in real-time. Source code modifications are not
needed - Function Trace automatically performs actions, that otherwise, could only be done by
introducing hundreds of trace-message lines in the source code.
•
The BDE SQL profiler measures and logs the execution time of SQL queries or SQL stored
procedures called through the BDE (Borland Database Engine). Using the Details panel of the
profiler you can view the sequence of functions that call a BDE operation.
www.automatedqa.com
AQtime by AutomatedQA Corporation
Doing One Profiler Run
39
•
The Load Library Tracer profiler traces the loading and unloading of dynamic link libraries
during the application execution. Using the profiler you can detect which libraries are loaded and
unloaded too often (and thus impact the overall application performance) and optimize the use of
them.
•
The Unused VCL Units profiler detects standard VCL and user units that were included in the
application but are not used by it. Removing these units will decrease the application size without
losing any functionallity.
Doing One Profiler Run
1. Preparing an Application for Profiling
In order to profile your application with AQtime, you may need to compile it with debug information. This
depends on your application type: managed (.NET or Java) or unmanaged (native-code).
If your application is a native-code application, it must be compiled with debug information. Debug
information contains some useful information about routines: their size, location in the executable's memory,
etc. For detailed information on how to compile native application with debug information, see Compiler
Settings for Native Applications.
If your application is a .NET or Java application, AQtime profilers do not need any more than normal
compilation, unless you wish to have direct access to the source code for methods or classes listed in the
profiler results or to profile routines at the line level. To eliminate these limitations, you must include debug
information in your application executable. To learn how to do this, see Compiler Settings for .NET
Applications and Compiler Settings for .Java Applications.
2. Creating a Profiling Project
Your AQtime project is simply your current “work site” in AQtime. The project specifies the application
and modules to profile, profiling parameters, profiling mode, etc. The project file also holds recent profiling
results, which you can permanently save. So the project is also your set of available past results.
If you use AQtime as a standalone application, then to create a new project, select File | New Project from
AQtime's main menu. AQtime will create a new project.
To create create a new project in AQtime integrated into Visual Studio, follow these steps:
•
Select File | New | Project from Visual Studio's menu or press the New Project button on the Start
page. This will call the New Project dialog.
•
In the dialog:
•
Select AQtime Projects from the list on the left of the dialog and then click AQtime
Project on the right.
Specify the project name, location and solution.
Press OK.
Visual Studio will create a new AQtime project and display its contents in the Solution Explorer.
If you add an AQtime project to an existing solution in Visual Studio, you can use the Add Project
Output dialog to choose which output modules of projects that exist in the solution you want to add to the
© 2010 AutomatedQA Corp.
www.automatedqa.com/support
40
Getting Started
newly created AQtime project. To call this dialog, right-click your AQtime project in the Solution Explorer
and then select Add | Add Output from the context menu.
In AQtime integrated into RAD Studio, AQtime projects (.aqt files) are part of the AQtime project groups
(.bdsproj files), which are simply containers for several AQtime projects. So, before creating a new AQtime
project you must first create and open an AQtime project group to which this project will belong. To create a
new AQtime project group in RAD Studio:
•
Right-click somewhere in the Project Manager panel and select Add New Project from the
context menu, or select File | New | Other or Project | Add New Project from RAD Studio’s
menu. This will call the New Items dialog.
•
In the dialog, select Profiling from the list on the left of the dialog, click AQtime Project on the
right and click OK.
RAD Studio will create a new AQtime project group and display its contents in the Project Manager.
To create a new AQtime project in the opened AQtime project group:
•
Select File | New | Other from RAD Studio’s menu. This will call the New Items dialog.
•
In the dialog, select Profiling from the list on the left of the dialog, click AQtime Module on the
right and click OK.
RAD Studio will add a new AQtime project to the opened AQtime project group and display its contents in
the Project Manager.
Once you have created a new project, you can add the modules (EXE, DLL, OCX, etc.) you wish to profile
to the project. To add a new module, select Add Module from the context menu of the Setup panel or from the
Setup toolbar and select the desired file using the subsequent Open File dialog. This will work in both the
standalone and integrated versions of AQtime. In Visual Studio and RAD Studio you have one more way to
add modules to your project: right-click the project in the Solution Explorer or in the Project Manager
respectively and select Add Module from the context menu. To add a .NET assembly registered in the Global
Assembly Cache (GAC) to the AQtime project, select Add Assembly from the context menu of the Setup
panel or from the Setup toolbar; or right-click the project in Visual Studio's Solution Explorer or in RAD
Studio's Project Manager and select Add Assembly from the context menu. This will call the Add Assembly
dialog, where you can select the desired assemblies. To add the web page whose script you want to profile,
select Add URL from the context menu of the Setup panel or from the Setup toolbar and enter the page
address in the ensuing Add URL dialog.
An AQtime project can only contain 32-bit (x86) or 64-bit (x64) modules, but not both. The
project cannot contain modules with different “bitness”. This behavior is caused by a Windows
limitation that 32-bit modules can be loaded into a 32-bit process only and 64-bit modules can
be loaded into 64-process only (you cannot load a 32-bit module to a 64-bit process). So, if you
add a 64-bit module to your AQtime project, you can continue adding 64-bit modules only. If
you add a 32-bit module, you can only add 32-bit modules. To change the “bitness” of the
project, clear the modules list and then add the desired modules.
You can add as many modules, from as many folders, as you wish. The module that was added to the
AQtime project first, will be the main module. This means that AQtime will launch this module when you start
profiling. Other modules are not started by AQtime; they will be loaded by the main module. You can change
the main module at any time by right-clicking the desired module and selecting Set as Active Module from the
context menu. If the main module is a DLL or an OCX file, you have to specify a Host Application for your
project so that AQtime can start profiling. The host application can be set in the Run Parameters dialog.
An alternative way to create a new project is to select File | New Project From Module from AQtime’s
main menu. This will call the Open File dialog where you can select an executable (EXE, DLL, OCX) which
www.automatedqa.com
AQtime by AutomatedQA Corporation
Doing One Profiler Run
41
AQtime will use to create the new project. Once you press Open in this dialog, AQtime will automatically
create a new project that will contain the module you have selected. It will be the main module of the project.
After you have created a project, you can add modules to it as it is described above.
To save your new project, select File | Save from the main menu. This will open the standard Save File
dialog where you can specify the project file name. If you create a new project and do not save it, the results
and profiling configuration will be lost upon closing the project. However, once you have saved a project to a
file, the results and changes you make to the profiling configuration will be saved automatically (AQtime saves
them upon closing the project or after you select the File | Save menu item).
By default, AQtime project files have the .aqt extension. To save an existing project under another name or
extension, select File | Save As from the main menu.
If you use AQtime standalone, then after you have saved your project to a file, you can add this file to a
source control system like Visual SourceSafe or CVS. AQtime is tightly integrated with source control
systems, so you can add your project to a source control directly from AQtime. For complete information on
how to do this, see Working with Source Control Systems. If you use AQtime integrated in Visual Studio, you
can put your project in Visual SourceSafe using Visual Studio's means.
To open an existing project in AQtime, select File | Open Project:
To open an existing AQtime project in Visual Studio, just select File | Open | Project\Solution (that is,
you open AQtime projects in the same manner as you open any other Visual Studio project):
© 2010 AutomatedQA Corp.
www.automatedqa.com/support
42
Getting Started
To open an existing AQtime project in RAD Studio, just select File | Open Project (that is, you open
AQtime projects in the same manner as you open any other RAD Studio project):
www.automatedqa.com
AQtime by AutomatedQA Corporation
Doing One Profiler Run
43
Upon selecting the Open Project menu item, AQtime will display the standard Open File dialog where you
can select the desired project file name. Once your project is open in AQtime, you can see a list of all object
modules and their routines in the left-hand pane of the Setup panel:
AQtime Standalone
© 2010 AutomatedQA Corp.
www.automatedqa.com/support
44
Getting Started
AQtime integrated into Microsoft Visual Studio
AQtime integrated into RAD Studio
3. Choosing What to Profile and When
Profilers yield a mass of information. The trick in using them is to ask only for the kind of information you
need at the moment, get it, then start over again, using what you’ve just learned to refine the question you are
asking. In other words, you dig down progressively.
Therefore, even more important than what information a profiler can provide is how easily it will focus on
what you want to know. A good profiling tool is one that you can ask very restricted questions easily, get
answers, then re-tune your question. Otherwise, the important information gets lost in the mass of results
which, at the present moment, are of no importance or, worse, a distraction. (In addition, a few profilers
seriously add to execution time, so you don’t want to wait while they gather information you won’t need).
A lot of the advantages of AQtime reside in the ease of use, variety and flexibility of the means it provides
you with for controlling what gets profiled in any given run. All of them work on the exclusion principle: if a
given means says something will not be profiled, it will not be. If it does not say that, or it says the code “will”
be profiled, then the code will only actually be profiled if all the other means permit. From the very general to
the very local, these means group into the following categories:
•
Filter non-modifiable code. Many development environements include a number of their
libraries in your application. For example, Borland Delphi IDE typically embeds System, Classes,
Controls and other units. Generally, the source code of these libraries cannot be modified, so their
performance cannot be improved. Therefore, you should focus only on those elements that you can
change. To filter out modules provided by standard libraries, you can use AQtime's Exclude
Exclude Standard Source
standard source files option. The option can also be enabled via the
Files button located on the Setup panel.
www.automatedqa.com
AQtime by AutomatedQA Corporation
Doing One Profiler Run
45
You can also specify code that will “never” be profiled using other options. For more information
about them, see Excluding Code From Profiling.
•
Define code areas to profile. Profiling areas are a central concept in AQtime. Any number of
files, classes or routines can be included in an area, and any number of areas can be checked (or
unchecked) for profiling in a given run. Furthermore, each element in a checked area can also be
checked or unchecked. Areas are a primary tool for progressive refining of what you want to
profile. As noted, code correctly checked-in this way only gets profiled if all of the other means
permit it. But what is not checked does not get profiled on this run, period. Because sometimes you
may want to put an entire class or namespace in an area, except one or two elements, in addition to
the normal including areas there are excluding areas. Since nothing gets profiled if it is not in an
including area, the point of excluding areas is only this, to provide an easy way of removing
certain sub-elements from a larger element added to an including area. See Using Profiling Areas.
•
Define when to profile your code. Triggers are another central concept in AQtime. They apply
only to the Performance, Function Trace and Coverage profilers and they let you control profiling
on a thread by thread basis. There are on-triggers and off-triggers. An on-trigger is a routine that
turns profiling on when it begins and turns it off (unless another trigger is running) when it ends.
Code that is correctly checked in the area system, and not excluded as a “system file”, will be
profiled only when it is called from a trigger routine in the same thread, directly or indirectly.
Off-triggers are the opposite. While they are running, whatever profiling would be going on in
their thread is turned off. If there are no trigger routines, then profiling is always on by default (the
application is the trigger). See Using Triggers.
•
Enable/Disable Profiling toolbar button (the
Turn profiling on and off during the run. The
AQtime | Enable/Disable Profiling menu item in Visual Studio or in RAD Studio) can turn
profiling off at any time while the application is running. When it is “on” (the default), profiling is
enabled (of course, it is enabled only if no off-trigger or action is active). When this button is not
pressed, the profiling is off. This is a really quick, no-fuss, no-mess way to restrict profiling to a
given trouble spot -- once you know where it occurs. Its drawback is that you can never repeat the
run exactly; for run-to-run comparisons, actions or triggers are the tools to use.
•
Perform specific operations during the run: actions. An action is a routine, before or after
execution of which AQtime can perform a specific operation like switching the profiling on or off
or getting the profiler results. Actions are similar to pressing the Enable/Disable Profiling or the
Get Results toolbar items from the application code. But unlike manual pressing, actions allow
you to press these items exactly when you need it. For more information on actions and differences
between triggers and actions, see Using Actions.
4. Selecting a Profiler
After you have chosen what code will be profiled and when, you need to define what information the
profiler run will provide. You can specify it by selecting the appropriate profiler.
© 2010 AutomatedQA Corp.
www.automatedqa.com/support
46
Getting Started
If you use AQtime standalone, you can select the profiler to be run from the dropdown list on the Standard
toolbar, just to the right of the Run button:
The dropdown list is actually a treeview. Individual profilers are listed when you open a branch.
If you use AQtime integrated into Visual Studio, you can select the profiler to be run from the Profiler
dropdown list in the AQtime menu:
www.automatedqa.com
AQtime by AutomatedQA Corporation
Doing One Profiler Run
47
If you use AQtime integrated into RAD Studio, you can select the profiler to be run from the Current
Profiler dropdown list in the AQtime menu:
5. Starting the Profiler Run
Before Starting the Profiling
Besides the main preliminary steps (such as creating a project, specifying what to profile or selecting a
profiler), there are a few more checks to go through before starting the run:
•
Check that you have set the running conditions as they need to be. For an EXE, these are the
(possible) runtime arguments, for a DLL, the (necessary) host application. Most of the time, you
do not have to do anything, because you are testing an exe that takes no parameters, or because you
simply want to keep the existing settings. To check or change conditions, use Run | Parameters
from AQtime's main menu, AQtime | Parameters from Visual Studio's menu or AQtime |
Parameters from Embarcadero RAD Studio's menu. This leads you to the Run Parameters
dialog, which has a box both for parameters and for host application. See Profiling Dynamic Link
Libraries for details on the latter.
•
Make sure that the necessary modules (for example, DLLs) can be loaded.
•
Specify the type of profiled executable using the Profiling Mode dropdown list box on AQtime's
Standard toolbar (dropdown list box on Visual Studio's AQtime toolbar or items of Embarcadero
RAD Studio's AQtime Profiling Modes toolbar). This list includes the following items:
Normal
© 2010 AutomatedQA Corp.
Means that the profiled executable is a regular managed or unmanaged
executable or library. This item is selected by default.
www.automatedqa.com/support
48
Getting Started
ASP.NET
Means that the profiled executable is an ASP.NET application or .NET
Web service. To profile a Windows service, select Service profiling. For
more information on how to profile ASP.NET applications, see Profiling
ASP.NET Applications.
IIS
Means that the profiled executable is an IIS application or Web service
created with an unmanaged compiler. For more information on profiling
such applications, see Profiling IIS Applications.
COM Server Means the profiled executable is a COM application. For more information,
see Profiling COM Applications.
Service
Means that the profiled executable is a Windows service. Don't use it for
ASP.NET service profiling. For more information on how to profile
services, see Profiling Services.
•
Enable/Disable Profiling button on the Standard toolbar is in its normal
Make sure that the
pressed-in state (as shown), unless you want to start with profiling turned off, overriding your
trigger and action settings.
•
If you are using the Performance or Function Trace profiler and your computer's CPU (for
instance, Intel Pentium M) supports dynamic CPU frequency mode, you should disable the
dynamic change of the CPU frequency in order to obtain accurate results. If the CPU frequency is
changed dynamically, the timing results may be inaccurate.
•
If you are using the Allocation profiler, make sure that you have checked one or more class-level
profiling areas. Otherwise, you may receive empty results. This typically concerns profiling of
.NET applications and the reason for this is quite simple: the profiler always tracks memory-block
allocations done by non-class memory management routines such as new or alloc. Therefore, if
you start profiling a .NET application and there are no class-level areas selected, the profiler will
not notify you, since that .NET application may include unmanaged sections of code and these
sections may call non-class memory management routines, which you may want to profile.
Two notes:
•
If you use a computer that has several processors or a multiple-core processor (for example,
dual-core CPU) and has Windows XP Service Pack 2, then you must install the Windows update
#896256 in order for AQtime to be able to profile your application correctly. The update is
available on Microsoft’s web site:
http://support.microsoft.com/kb/896256
•
In order for AQtime to be able to profile your application, the user account, under which AQtime
will be running, must have administrator permissions. The easiest way to grant these permissions
is to add this account to the Administrators group.
Starting the Profiler Run
If you use AQtime standalone, to start profiling simply press
| Run from AQtime’s main menu.
Run on the Standard toolbar or select Run
If you use AQtime integrated into Visual Studio, select AQtime | Run from Visual Studio’s main menu.
Run button or selecting Debug |
An alternative way to start profiling is to press Visual Studio’s
Run menu item while one of AQtime’s panels is active or while an AQtime panel is selected in the Solution
Explorer.
If you use AQtime integrated into RAD Studio, select AQtime | Run With Profiling from RAD Studio’s
main menu. An alternative way to start profiling is to press RADStudio’s Run button on the Debug toolbar or
www.automatedqa.com
AQtime by AutomatedQA Corporation
Doing One Profiler Run
49
select the Run | Run menu item while one of AQtime’s panels is active or while an AQtime panel is selected in
the Project Manager.
The difference between the ways to start profiling consists in how custom profiling areas will be
handled. Using the Run With Profiling command resets custom areas (if any) and profiles with the default
Full Check, Profile Entire Java Code and Profile Entire .NET Code options. Whereas to start profiling via the
Run command preserves custom areas.
After you selected Run, AQtime displays the Run Settings dialog where you can check or modify
profiling options and conditions for the coming profiler run. AQtime will start profiling after you close the
dialog.
x64 editions of the Windows operating system require that the “bitness” of a process and the
module that is loaded into this process be the same (in other words, 32-bit modules can be
loaded only into a 32-bit process and 64-bit modules can be loaded only into a 64-bit
process). This limitation may exist when profiling a dynamic link library, an in-process
COM server or any other module that is loaded into a process. If the “bitness” of the module
and process is not the same, AQtime will stop profiling and display an error message
informing you about the problem.
Some points while executing the application:
•
Run the operations that you need to profile (for instance, those where you suspect a bottleneck).
You might plan your run before starting, to be sure you hit all the high (or rather, low) points.
•
You can use the
Enable/Disable Profiling button (the AQtime | Enable/Disable Profiling
menu item in Visual Studio or in RAD Studio) to suspend profiling, but not execution, while you
run through parts of the application you do not need to profile. See Choosing What to Profile and
When for the caveat.
•
AQtime generates results when the application execution is over. To obtain profiling results
Get Results from the Run menu or from the Standard toolbar (if you
during the run, select
use AQtime integrated into Visual Studio or into RAD Studio, select AQtime | Get Results from
the main menu). You may also need to use this item if the profiling process never ends. See
Getting Results During Testing for more information.
•
If you profile a managed application, you can click Force Garbage Collection to initiate
garbage collecting in the profiled process (if you use AQtime integrated into Visual Studio, select
AQtime | Force Garbage Collection from Visual Studio’s main menu; if you use AQtime
integrated in RAD Studio, click Force Garbage Collection). You may do this, for instance, to
see which objects will be removed and which will remain in memory.
•
If you want to force the application process to end, click
Terminate (if you use AQtime
integrated into Visual Studio or into RAD Studio, select the AQtime | Terminate menu item).
You may need to do this if the application cannot normally be ended without rebooting, logging
off or some other drastic intervention, or if it simply stopped responding. Pressing Terminate does
not generate profiling results.
•
Some profilers, with some over-enthusiastic settings, may slow application execution to the point
where you mistake it for a crash.
•
Once you have gone through the operations you wanted, exit the application. Do not accumulate
needless profile data.
If this has happened, you can flush all gathered results. To do this, select
Clear Results from the Run
menu, or from the Standard toolbar (or select AQtime | Clear Results from the main menu of Visual Studio
or RAD Studio). See Clearing Results During Profiling.
© 2010 AutomatedQA Corp.
www.automatedqa.com/support
50
Getting Started
Once you exit, the resultant profile will be displayed in AQtime’s Report panel.
6. Analyzing Profiling Results
After profiling your application, AQtime displays profiling results in its panels:
Report panel in AQtime standalone
www.automatedqa.com
AQtime by AutomatedQA Corporation
Doing One Profiler Run
51
Report panel in AQtime integrated into Visual Studio
© 2010 AutomatedQA Corp.
www.automatedqa.com/support
52
Getting Started
Report panel in AQtime integrated into RAD Studio
Organization
A summary of profiling results is shown in the Summary panel. It helps you quickly find routines with
poor performance and determine which code snippets of your application should be optimized.
Most profilers organize results into categories. For instance, the results of the Allocation profiler are
organized into the Classes and Objects categories. Within categories, AQtime stores profiling results for each
thread (AQtime also stores results for the entire application). You can select the desired category and thread in
the Explorer panel or from the Result Items toolbar item (by default, this item is hidden):
www.automatedqa.com
AQtime by AutomatedQA Corporation
Doing One Profiler Run
53
The Report panel shows results for the selected thread and category. The other panels display additional
profiling results. The Report panel shows a table where each row corresponds to a routine, line, class, module
or object that has been profiled. When you select a row, other panels are updated to display information for that
routine or line (not all the panels apply to all profilers):
•
The Call Graph panel displays the call information for the selected routine.
•
The Call Tree panel displays all call “paths”for the routine.
•
The Details panel holds additional profiling results for the routine, e.g. the call stack, “child”and
“parent”routines, etc.
•
The Editor panel displays the source code of the selected routine.
•
The Disassembler panel displays the binary code of the selected routine.
•
The Event View panel is unaffected; it simply logs events that occurred during the profile run.
Note that some AQtime panels hold footers that show summary values for data stored in panel columns.
By default, the footer of a column displays the summary value that is calculated against all panel rows.
However, if you select two or more rows in the panel, AQtime will recalculate the summary and the footer will
display summary values for selected rows only.
Managing Results
•
You can sort results by one or several columns.
•
You can group results by one or several columns.
•
You can search results using the Find dialog or the Incremental Search feature.
•
You can add summary fields.
•
You can filter results.
•
Better yet, you can apply a result view from the many pre-defined ones, or from those you define
yourself. A result view combines a filter, layout and settings of columns in AQtime panel and in
the Editor’s grid and layout of panes in the Details panel.
•
Using the Explorer panel, you can compare current results with previous ones to find the effects
of changes you made in the application (or in the way you ran it). In addition, you can merge
several results to collect mass statistics. The Explorer panel lets you organize profiling results like
files and folders in Windows Explorer.
© 2010 AutomatedQA Corp.
www.automatedqa.com/support
54
Getting Started
Transferring Results
Profiling results can be:
•
copied to the Clipboard,
•
printed using the Print Preview Form,
•
exported to text, Excel, html or xml formats (see Exporting Results).
More Usability Features
•
While you use the Report or the Details panels, AQtime records your movements from item to
item. You can come back to something you selected previously, and then return to where you
jumped back from, as with an Internet browser. Use the
Display Previous and
Display
Next buttons on the Report toolbar to do this. See AQtime Panels for more information.
•
AQtime’s visual means for arranging grids apply to the display of results, of course. You can:
change column width and ordering,
hide or show columns (not all columns are displayed by default).
www.automatedqa.com
AQtime by AutomatedQA Corporation
Preparing an Application for Profiling
55
Profiling Applications With AQtime
AQtime allows application developers to measure the performance, memory and resource allocations and
other characteristics of applications and helps identify and eliminate bottlenecks.
The profiling process includes several steps. You typically begin with creating an AQtime project and
defining the application modules, classes and functions you want to profile. You can choose from a variety of
profilers and select the level of details collected by the profiler. The profiling can be started in parallel with
your application, or you can attach the profiler to an already running process. After you stop the profiling,
AQtime displays the aggregated information in several views that help visualize performance and other issues.
Preparing an Application for Profiling
How AQtime Profilers Use Metadata and Debug Information
In order to profile your application with AQtime you may need to compile it with debug information. This
depends on your application type: unmanaged (or native-code, non-.NET) or managed (.NET or Java)
application.
Note:
AQtime is not compatible with applications that perform non-standard actions over
binary code or over a stack. For more information, see Unsupported Code in AQtime
help.
Native-code (unmanaged) applications
In order to profile native-code applications with AQtime, such applications must be compiled with
debug information. Debug info tells AQtime where the routines start and end in memory, what the routine
size is (in bytes), where is each routine located in the executable’s memory, etc. For complete information on
how to compile your application with debug info, see Compiler Settings for Native Applications.
When your application is ready for final delivery, remember to compile it without debug info to reduce the
application size.
.NET applications
Generally, .NET applications already have all the information necessary for profiling as represented by its
metadata. However, metadata holds no information about links between source files and an application’s
internals (types, classes, members etc.) This limits some AQtime features. For example, the Editor panel does
not display the source code for the routine selected in the Report panel. Another limitation is that you cannot
profile routines at the line level (see About Profiling Levels).
The above limitations are eliminated when you include debug information to your application executable
and AQtime will use the debug information as an addition to the existing .NET metadata information. To learn
how to add debug information to your .NET applications, see Compiler Settings for .NET Applications:
© 2010 AutomatedQA Corp.
www.automatedqa.com/support
56
Profiling Applications With AQtime
When your .NET application is ready for final delivery, remember to compile it without debug info to
reduce the application size.
Note:
If your managed application includes portions of unmanaged code, you should compile it
with debug information in order for AQtime to be able to profile the unmanaged code.
Java Applications
You can typically profile Java applications out-of-the-box, without preparing the application is a special
way. This is possible since the Java bytecode includes information about the application’s internals – packages,
classes, methods and so on. In addition, the Java compiler includes debug information in Java applications by
default, so AQtime is able to link profiling results to the source code elements.
However, it is possible to compile applications without debug information or with partial debug
information (for example, source file information may be included, but line number information will not be
generated). In this case, the profiling features will be limited. For example, you will not be able to profile
routines at line level and see the source code of the application’s routines in the Editor.
To eliminate the above-mentioned limitations, you need to compile your Java application with debug
information. AQtime will use this debug information along with the bytecode information when profiling your
application and generating results. To learn how to include debug information in Java applications, see
Compiler Settings for Java Applications.
Note:
To profile mixed Java applications, which include both Java and native code, you must
also compile native code with debug information as described above.
When your Java application is ready for the final delivery, remember to compile it with the original
settings you use for release modules.
Debug Information Benefits
Let's reiterate that AQtime profiles routines at the line level only if the application was compiled with
debug information. In addition to Line Level profiling, debug information provides other benefits:
•
The Editor panel displays the source code when you double-click a routine in the Report or
Details panels or the Modules pane of the Setup panel.
•
The Setup panel lets you navigate through the application not only by namespace and class but
also by file:
www.automatedqa.com
AQtime by AutomatedQA Corporation
Preparing an Application for Profiling
•
57
For some profilers, the Report and Details panels will show the Source File and Source Line
columns. These columns are filled with data obtained exclusively from the application’s debug
info. They help you locate a routine in your source quickly.
Use the Symbols Options dialog to enable or disable debug readers, which AQtime uses to parse debug
information and metadata. In the dialog, you can also specify the search paths for debug info files that are
generated separately from the executables.
Compiler Settings for Native Applications
Compiler Settings for Microsoft Visual C++ 6.0
This topic explains how to prepare applications that were created with Microsoft Visual C++ 6.0 or earlier
for AQtime. To learn how to prepare applications created with Visual C++ 7.x, see Compiler Settings for
Microsoft Visual C++ .NET. To learn how to prepare applications created with Visual C++ 2005 (8.0), Visual
C++ 2008 (9.0) or Visual C++ 2010 (10.0), see Compiler Settings for Microsoft Visual C++ 2005, 2008 and
2010.
To prepare a Visual C++ application for AQtime, you must ensure that it includes debug info and select the
format under which it will be generated. Follow these steps:
1. Open your project in Visual Studio.
2. To prevent the changes from affecting your release-version configuration, do the following: Choose
Build | Set Active Configuration from Visual C++’s menu and select another configuration, say
Debug, as the active configuration for the project. All of the changes that are made in the compiler
options will be stored to this configuration and will leave the Release configuration unaffected.
Usually the Debug configuration is similar to this: <Your_Project_Name> - Win32 Debug:
© 2010 AutomatedQA Corp.
www.automatedqa.com/support
58
Profiling Applications With AQtime
Note that the only reason to change the active configuration is to leave the Release configuration
unaffected. If you want to profile the Release configuration, you may skip this step. In this case, do
not forget to restore the compiler settings before compiling the release version of your application.
3. Now, open the Project Settings dialog (press Alt-F7 or use Project | Settings) and select the
configuration you have set.
4. In the dialog, open the C/C++ page and make sure that Debug Info is set either to “Program Database”
or “Program Database for Edit and Continue”:
For more information on these options review Microsoft Visual C++ Help.
5. You now have set your project to generate debug information when compiling. Next, you must ensure
that the linker saves it. From Project | Settings select the Link page. There, first set the Category to
General. Then check Generate debug info and clear the Enable profiling check box:
www.automatedqa.com
AQtime by AutomatedQA Corporation
Preparing an Application for Profiling
59
On the Link page, select Debug in the Category box and then do the following:
Select the Debug info check box.
Clear the Separate type check box.
Select the Microsoft format option button.
6. The last step is to set how the linker will save the debug information. AQtime supports debug
information generated as an external PDB file (PDB format). To set linker options:
Switch to the Link page of the Project Settings dialog:
Set the Category to Customize.
Check Use program database.
Enter the PDB file name you want into the Program database name edit field.
© 2010 AutomatedQA Corp.
www.automatedqa.com/support
60
Profiling Applications With AQtime
Once you have set the compiler and linker options as described above, rebuild your application and it will
be ready for profiling. Before opening the application in AQtime, make sure that the output directory of your
application includes the .pdb file you have created. In addition, this directory must contain the vcX0.pdb file,
where X is the major version number of the Visual C++ compiler, e.g. for Visual C++ 6.0 this file is called
vc60.pdb. vcX0.pdb holds part of your application’s debugging information, which is needed to profile the
entire application in AQtime correctly. If you are profiling an ActiveX control or a COM server, do not forget
to register its “debug” version in the system (See Profiling COM Applications).
By default, the .pdb debug info file resides in the same folder where the profiled executable or DLL is
located. When you open your module in AQtime, it searches for the debug info file in this default location. If
you copy the debug info file to another location, then specify this location in the Symbols Path list of the
Symbols Options dialog (this list contains the search paths). See Specifying Path to Debug Info Files for more
information.
When your application is ready for release, remember to recompile it without debug information to reduce
the application size.
Compiler Settings for Microsoft Visual Basic
This topic explains how to prepare applications that were created with Microsoft Visual Basic 6.0 for
AQtime. To learn how to prepare applications created with Visual Basic .NET, see Compiler Settings for
Microsoft Visual Basic .NET. To learn how to prepare applications created with Visual Basic 2005, see
Compiler Settings for Microsoft Visual Basic 2005.
To prepare your Visual Basic application for AQtime, compile it with debug information that is generated
as an external PDB file. Follow these steps:
1. Open your project in Microsoft Visual Basic.
2. Select Project | Project Properties from Visual Basic’s main menu. This will open the Project
Properties dialog.
3. Move to the Compile tabbed page and check the Create Symbolic Debug Info box:
www.automatedqa.com
AQtime by AutomatedQA Corporation
Preparing an Application for Profiling
61
4. Press OK to close the dialog.
5. Before you start compiling your application, make certain that the Link environment variable is
not defined. If this environment variable exists, Visual Basic will embed debug info into the
executable and thus the debug info will be unavailable for AQtime.
If you wish to profile an ActiveX control or a COM server, you must register its “debug” version in the
system (see Profiling COM Applications).
When your application is ready for release, remember to recompile it without debug information to reduce
the application size.
Compiler Settings for Embarcadero Delphi XE for Win32
This topic explains how to prepare applications created with Embarcadero Delphi XE for Win32 for
AQtime. To learn how to prepare applications created with other Delphi versions, see Compiler Settings for
Native Applications.
To prepare a Delphi XE for Win32 application for AQtime, you must first ensure that it includes debug
information. Follow these steps:
1. Open your Delphi Win32 project in Delphi XE.
2. Activate the configuration that you use to build the debug version of your application. To do this,
right-click the Project_Name | Build Configurations | Debug Configuration node in the
Project Manager and select Activate from the context menu.
Note:
You can build your application in any configuration, not just in the debug one. We
choose the debug configuration to make sure the changes that will be made to
compiler settings will not affect the release configuration that is typically used to
build the final version of applications.
3. Choose Project | Options from the main menu to open the Project Options dialog.
4. In the Build Configuration combo box, select your debug configuration. This will quickly load
the settings used for debug builds.
© 2010 AutomatedQA Corp.
www.automatedqa.com/support
62
Profiling Applications With AQtime
5. To set the compiler options, select the Delphi Compiler| Compiling category from the tree view
on the left of the dialog.
6. Set the Stack frames option to True in the Code generation group.
7. To include symbolic debug information, set the Debug information option to True in the
Debugging group.
8. To view the variables, which are local to procedures and functions, set the Local symbols option
to True in the Debugging group.
9. If you want to profile VCL classes, for example, TDataset, set the Use debug .dcus option to
True in the Debugging group. Otherwise, AQtime will only be able to profile the classes that are
defined in your application.
10. Switch to the Delphi Compiler | Linking category and set the Debug information option to
True:
www.automatedqa.com
AQtime by AutomatedQA Corporation
Preparing an Application for Profiling
63
11. If you do not want to use the Allocation profiler, skip this step.
Note that the point of the Allocation profiler is not performance. Its point is to track memory
allocations and deallocations. To do this, the profiler requires access to the basic VCL objects
(TObject and TInterfacedObject). Therefore, the easiest way to provide this access is to turn
off the Build with runtime packages option in the Packages category:
© 2010 AutomatedQA Corp.
www.automatedqa.com/support
64
Profiling Applications With AQtime
If you want to keep Build with runtime packages (for instance, to control the exe size),
you can still use the Allocation profiler. When you include your application in an
AQtime
project,
you
will
also
have
to
include
the
<Windows>\System32\RTL150.BPL file.
To add a module to an AQtime project, press
select it from the Setup context menu.
Add Module on the Setup toolbar or
12. Once you have set the compiler and linker options correctly, rebuild your application and it will be
ready for profiling. If you are profiling an ActiveX control or a COM server however, you should
register its “debug” version in the system (See Profiling COM Applications).
When your application is ready for release, remember to recompile it without debug information to reduce
the application size.
Note:
AQtime is incompatible with some third-party tools that modify the binary code of your
application (for example, those that add a custom exception handling mechanism). An
example of such a tool is EurekaLog. We recommend that you profile your application
before processing it with such tools.
Nevertheless, AQtime is compatible with AQtrace and supports profiling of applications
that use AQtrace for error reporting.
Compiler Settings for Embarcadero Delphi 2010 for Win32
This topic explains how to prepare applications created with Embarcadero Delphi 2010 for Win32 for
AQtime. To learn how to prepare applications created with other Delphi versions, see Compiler Settings for
Native Applications.
To prepare a Delphi 2010 for Win32 application for AQtime, you must first ensure that it includes debug
information. Follow these steps:
1. Open your Delphi Win32 project in Delphi 2010.
2. Activate the configuration that you use to build the debug version of your application. To do this,
right-click the Project_Name | Build Configurations | Debug Configuration node in the
Project Manager and select Activate from the context menu.
Note:
You can build your application in any configuration, not just in the debug one. We
choose the debug configuration to make sure the changes that will be made to
compiler settings will not affect the release configuration that is typically used to
build the final version of applications.
3. Choose Project | Options from the main menu to open the Project Options dialog.
4. In the Build Configuration combo box, select your debug configuration. This will quickly load
the settings used for debug builds.
5. To set the compiler options, select the Delphi Compiler| Compiling category from the tree view
on the left of the dialog.
6. Set the Stack frames option to True in the Code generation group.
7. To include symbolic debug information, set the Debug information option to True in the
Debugging group.
8. To view the variables, which are local to procedures and functions, set the Local symbols option
to True in the Debugging group.
www.automatedqa.com
AQtime by AutomatedQA Corporation
Preparing an Application for Profiling
65
9. If you want to profile VCL classes, for example, TDataset, set the Use debug .dcus option to
True in the Debugging group. Otherwise, AQtime will only be able to profile the classes that are
defined in your application.
10. Switch to the Delphi Compiler | Linking category and set the Debug information option to
True:
© 2010 AutomatedQA Corp.
www.automatedqa.com/support
66
Profiling Applications With AQtime
11. If you do not want to use the Allocation profiler, skip this step.
Note that the point of the Allocation profiler is not performance. Its point is to track memory
allocations and deallocations. To do this, the profiler requires access to the basic VCL objects
(TObject and TInterfacedObject). Therefore, the easiest way to provide this access is to turn
off the Build with runtime packages option in the Packages category:
www.automatedqa.com
AQtime by AutomatedQA Corporation
Preparing an Application for Profiling
67
If you want to keep Build with runtime packages (for instance, to control the exe size),
you can still use the Allocation profiler. When you include your application in an
AQtime
project,
you
will
also
have
to
include
the
<Windows>\System32\RTL140.BPL file.
To add a module to an AQtime project, press
select it from the Setup context menu.
Add Module on the Setup toolbar or
12. Once you have set the compiler and linker options correctly, rebuild your application and it will be
ready for profiling. If you are profiling an ActiveX control or a COM server however, you should
register its “debug” version in the system (See Profiling COM Applications).
When your application is ready for release, remember to recompile it without debug information to reduce
the application size.
Note:
AQtime is incompatible with some third-party tools that modify the binary code of your
application (for example, those that add a custom exception handling mechanism). An
example of such a tool is EurekaLog. We recommend that you profile your application
before processing it with such tools.
Nevertheless, AQtime is compatible with AQtrace and supports profiling of applications
that use AQtrace for error reporting.
Compiler Settings for CodeGear Delphi 2009 for Win32
This topic explains how to prepare applications created with CodeGear Delphi 2009 for Win32 for
AQtime. To learn how to prepare applications created with other Delphi versions, see Compiler Settings for
Native Applications.
© 2010 AutomatedQA Corp.
www.automatedqa.com/support
68
Profiling Applications With AQtime
To prepare a Delphi 2009 for Win32 application for AQtime, you must first ensure that it includes debug
information. Follow these steps:
1. Open your project in CodeGear Delphi 2009 for Win32.
2. Select Project | Configuration Manager from the main menu. This will open the Build
Configuration Manager dialog. Select the Debug configuration for your project:
Close the dialog.
Note: You can profile your application in any configuration, not just in the Debug one. We chose the
Debug configuration to make sure the changes that are made to compiler settings will not affect
the Release configuration, which is typically used to build the final version of applications.
3. Select Project | Options from the main menu. This will open the Project Options dialog.
4. To set the compiler options, select the Delphi Compiler| Compiling category from the treeview
on the left of the dialog.
5. To include the symbolic debug information, set the Debug information option to True in the
Debugging section.
6. To view the variables local to procedures and functions, set the Local symbols option to True.
7. If you want to profile VCL classes, for example, TDataset, set the Use Debug .DCUs option to
True. Otherwise, AQtime will only be able to profile the classes that are defined in your
application.
www.automatedqa.com
AQtime by AutomatedQA Corporation
Preparing an Application for Profiling
69
8. To set the linker options, select the Delphi Compiler | Linking category from the treeview on the
left of the dialog.
9. Set the Debug information option to True:
10. If you do not want to use the Allocation profiler, skip this step.
© 2010 AutomatedQA Corp.
www.automatedqa.com/support
70
Profiling Applications With AQtime
11. Note that the point of the Allocation profiler is not performance. Its point is to track memory
allocations and deallocations. To do this, the profiler requires access to the basic VCL objects
(TObject and TInterfacedObject). Therefore, the easiest way to provide this access is to uncheck
the Build with runtime packages box in the Resource Compiler | Packages category:
If you want to keep Build with runtime packages (for instance, to control the exe size), you can
still use the Allocation profiler. When you include your application in an AQtime project, you
will also have to include the <Windows>\System32\RTL120.BPL file.
To add a module to an AQtime project, press
Add Module on the Setup toolbar or select it
from the Setup context menu.
12. Once you have set the compiler and linker options correctly, rebuild your application and it will be
ready for profiling. If you are profiling an ActiveX control or a COM server however, you should
register its "debug" version in the system (See Profiling COM Applications).
When your application is ready for release, remember to recompile it without debug information to reduce
the application size.
Note:
AQtime is incompatible with some third-party tools that modify the binary code of your
application (for example, those that add a custom exception handling mechanism). An
example of such a tool is EurekaLog. We recommend that you profile your application
before processing it with such tools.
Nevertheless, AQtime is compatible with AQtrace and supports profiling of applications
that use AQtrace for error reporting.
Compiler Settings for CodeGear Delphi 2007 for Win32
www.automatedqa.com
AQtime by AutomatedQA Corporation
Preparing an Application for Profiling
71
This topic explains how to prepare applications created with CodeGear Delphi 2007 for Win32 for
AQtime. To learn how to prepare applications created with other Delphi versions, see Compiler Settings for
Native Applications.
To prepare a CodeGear Delphi 2007 for Win32 application for AQtime, you must first ensure that it
includes the TD32 debug info. Follow these steps:
1. Open your project in CodeGear Delphi 2007 for Win32.
2. Select Project | Configuration Manager from the main menu. This will open the Build
Configuration Manager dialog. Select the Debug configuration for your project:
Close the dialog.
Note: You can profile your application in any configuration, not just in the Debug one.
We chose the Debug configuration to make sure the changes that will be made to
compiler settings will not affect the Release that configuration, which is typically
used to build the final version of applications.
3. Select Project | Options from the main menu. This will open the Project Options dialog.
4. To set the compiler options, select the Compiler category from the treeview on the left of the
dialog.
5. To include the symbolic debug information, in the Debugging section of the Compiler page, check
Debug information.
6. To view the variables local to procedures and functions, check Local symbols.
7. If you want to profile VCL classes, for example, TDataset, check the Use Debug DCUs box.
Otherwise, AQtime will be able to profile only the classes that are defined in your application.
© 2010 AutomatedQA Corp.
www.automatedqa.com/support
72
Profiling Applications With AQtime
8. To set the linker options, select the Linker category from the treeview on the left of the dialog.
9. In the EXE and DLL options group, check Include TD32 debug info:
www.automatedqa.com
AQtime by AutomatedQA Corporation
Preparing an Application for Profiling
73
10. Now, if you do not want to use the Allocation profiler, go to point 11.
Note that the point of the Allocation profiler is not performance. Its point is to track memory
allocations and deallocations. To do this, the profiler requires access to the basic VCL objects
(TObject and TInterfacedObject). Therefore, the easiest way to provide this access is to
uncheck the Build with runtime packages box in the Packages category:
© 2010 AutomatedQA Corp.
www.automatedqa.com/support
74
Profiling Applications With AQtime
If you want to keep Build with runtime packages (for instance, to control the exe size), you can
still use the Allocation profiler. When you include your application in an AQtime project, you
will also have to include the <Windows>\System32\RTL110.BPL file.
To add a module to an AQtime project, press
Add Module on the Setup toolbar or select it
from the Setup context menu.
11. Once you have set the compiler and linker options correctly, rebuild your application and it will be
ready for profiling. If you are profiling an ActiveX control or a COM server however, you should
register its "debug" version in the system (See Profiling COM Applications).
When your application is ready for release, remember to recompile it without debug information to reduce
the application size.
Note:
AQtime is incompatible with some third-party tools that modify the binary code of your
application (for example, those that add a custom exception handling mechanism). An
example of such a tool is EurekaLog. We recommend that you profile your application
before processing it with such tools.
Nevertheless, AQtime is compatible with AQtrace and supports profiling of applications
that use AQtrace for error reporting.
Compiler Settings for Borland Delphi 2006 for Win32
This topic explains how to prepare applications created with Borland Delphi 2006 for Win32 for AQtime.
To learn how to prepare applications created with Delphi 2006 for .NET, see Compiler Settings for Borland
Delphi 2006 for .NET.
www.automatedqa.com
AQtime by AutomatedQA Corporation
Preparing an Application for Profiling
75
To prepare a Delphi 2006 for Win32 application for AQtime, you must first ensure that it includes the
TD32 debug info. Follow these steps:
1. Open your project in Delphi 2006 for Win32.
2. Select Project | Options from the main menu. This will open the Project Options dialog.
3. To set the compiler options, select the Compiler category from the treeview on the left of the
dialog.
4. To include the symbolic debug information, in the Debugging section of the Compiler page, check
Debug information.
5. To view the variables local to procedures and functions, check Local symbols.
6. If you want to profile VCL classes, for example, TDataset, check the Use Debug DCUs box.
Otherwise, AQtime will be able to profile only the classes that are defined in your application.
7. To set the linker options, select the Linker category from the treeview on the left of the dialog.
8. In the EXE and DLL options group, check Include TD32 debug info:
© 2010 AutomatedQA Corp.
www.automatedqa.com/support
76
Profiling Applications With AQtime
9. Now, if you do not want to use the Allocation profiler, go to point 10.
Note that the point of the Allocation profiler is not performance. Its point is to track memory
allocations and deallocations. To do this, the profiler requires access to the basic VCL objects
(TObject and TInterfacedObject). Therefore, the easiest way to provide this access is to
uncheck the Build with runtime packages box in the Packages category:
If you want to keep Build with runtime packages (for instance, to control the exe
size), you can still use the Allocation profiler. When you include your application in
an
AQtime
project,
you
will
also
have
to
include
the
www.automatedqa.com
AQtime by AutomatedQA Corporation
Preparing an Application for Profiling
77
<Windows>\System32\RTL100.BPL file. To add a module to an AQtime project,
Add Module on the Setup toolbar or select it from the Setup context menu.
press
10. Once you have set the compiler and linker options correctly, rebuild your application and it will be
ready for profiling. If you are profiling an ActiveX control or a COM server however, you should
register its “debug” version in the system (See Profiling COM Applications).
When your application is ready for release, remember to recompile it without debug information to reduce
the application size.
Note:
AQtime is incompatible with some third-party tools that modify the binary code of your
application (for example, those that add a custom exception handling mechanism). An
example of such a tool is EurekaLog. We recommend that you profile your application
before processing it with such tools.
Nevertheless, AQtime is compatible with AQtrace and supports profiling of applications
that use AQtrace for error reporting.
Compiler Settings for Borland Delphi 3-7
This topic explains how to prepare applications that were created with Borland Delphi 3.0 - 7.0. The
described steps are also applicable to Borland Delphi 2005 for Win32 projects. To learn how to prepare
applications created with other Delphi versions, see Compiler Settings for Native Applications.
To prepare a Delphi application for AQtime, you must first ensure that it includes the TD32 debug info.
Follow these steps:
1. Open your project in Borland Delphi.
2. To set the compiler options, choose Project | Options from Delphi’s main menu and select the
Compiler tabbed page.
3. To include the symbolic debug information, in the Debugging section of the Compiler page, check
Debug information.
4. To view the variables local to procedures and functions, check Local Symbols.
5. If you want to profile VCL classes, for example, TDataset, check the Use Debug DCUs box (it
is available in Delphi 5 or later). Otherwise, AQtime will be able to profile only the classes that are
defined in your application.
© 2010 AutomatedQA Corp.
www.automatedqa.com/support
78
Profiling Applications With AQtime
6. To set the linker options, select the Linker tabbed page. In the EXE and DLL options group,
check Include TD32 debug info:
7. Now, if you do not want to use the Allocation profiler, go to point 8.
Note that the point of the Allocation profiler is not performance. Its point is to track memory
allocations and deallocations. To do this, the profiler requires access to the basic VCL objects
(TObject and TInterfacedObject). Therefore, the easiest way to provide this access is to
uncheck the Build with runtime packages box on the Packages tabbed page:
www.automatedqa.com
AQtime by AutomatedQA Corporation
Preparing an Application for Profiling
79
If you want to keep Build with runtime packages (for instance, to control the exe size), you
can still use the Allocation profiler. When you include your application in an AQtime
project, you will also have to include the <Windows>\System32\VCLnn.BPL or
<Windows>\System32\RTLnn.BPL file, where nn is the compiler main version number,
followed by 0. For instance:
•
Add the VCL50.BPL file if you use Delphi 5.
•
Add the RTL60.BPL file if you use Delphi 6.
•
Add the RTL70.BPL file if you use Delphi 7.
•
Add the RTL90.BPL file if you use Delphi 2005 for Win32.
To add a module to an AQtime project, press
select it from the Setup context menu.
8.
Add Module on the Setup toolbar or
Once you have set the compiler and linker options correctly, rebuild your application and it will
be ready for profiling. If you are profiling an ActiveX control or a COM server however, you
should register its “debug” version in the system (See Profiling COM Applications).
When your application is ready for release, remember to recompile it without debug information to reduce
the application size.
Note:
AQtime is incompatible with some third-party tools that modify the binary code of your
application (for example, those that add a custom exception handling mechanism). An
example of such a tool is EurekaLog. We recommend that you profile your application before
processing it with such tools.
Nevertheless, AQtime is compatible with AQtrace and supports profiling of applications that
use AQtrace for error reporting.
Compiler Settings for Embarcadero C++Builder 2011
This topic explains how to prepare applications created with Embarcadero C++Builder 2011 for AQtime.
To learn how to prepare applications created with other C++Builder versions, see Compiler Settings for Native
Applications.
© 2010 AutomatedQA Corp.
www.automatedqa.com/support
80
Profiling Applications With AQtime
To prepare an Embarcadero C++Builder 2011 application for AQtime, you must first ensure that it
includes debug information. Follow these steps:
1. Open your project in C++Builder 2011.
2. Choose Project | Options from the main menu to open the Project Options dialog.
3. To set the C++ compiler options, select the C++ Compiler | Debugging category from the tree
view on the left of the dialog.
4. To include symbolic debug information, set the Debug information option to True. In addition, to
refer this information to source line numbers, set the Debug line number information option to
True.
www.automatedqa.com
AQtime by AutomatedQA Corporation
Preparing an Application for Profiling
81
5. (Optional) To generate stack frames when using the C++ compiler, switch to the C++ Compiler
category and set the Standard stack frames option to True.
© 2010 AutomatedQA Corp.
www.automatedqa.com/support
82
Profiling Applications With AQtime
6. If you compile your application with CodeGuard enabled, the latter will report errors during the
profiler execution. They relate to AQtime hooking code and are not actually errors. We
recommend that you disable CodeGuard before profiling your application with AQtime. To do
this, switch to the C++ Compiler | Debugging category and set the Enable CodeGuard option to
False.
7. To set the Delphi compiler options, select the Delphi Compiler | Compiling category from the
tree view on the left of the dialog.
www.automatedqa.com
AQtime by AutomatedQA Corporation
Preparing an Application for Profiling
83
8. To include symbolic debug information, set the Debug information option to True. In addition, to
refer this information to source line numbers, set the Local symbols option to True.
9. (Optional) To generate stack frames when using the Delphi compiler, switch to the Delphi
Compiler | Compiling category and set the Stack frames option to True.
© 2010 AutomatedQA Corp.
www.automatedqa.com/support
84
Profiling Applications With AQtime
10. Switch to the C++ Linker category and set the Full debug information option to True:
11. Switch to the Directories and Conditionals category and examine the Library path option. If the
path
contains
the
$(BDSLIB)\$(PLATFORM)\release
folder,
replace
it
with
$(BDSLIB)\$(PLATFORM)\debug:
www.automatedqa.com
AQtime by AutomatedQA Corporation
Preparing an Application for Profiling
85
12. Now, if you do not want to use the Allocation profiler, skip this step.
The point of the Allocation profiler is not performance. Its point is to track memory usage. If you
need to have your application support the Allocation profiler, you must make sure that AQtime has
access to the VCL binary code. The easiest way to add support for the Allocation profiler is to set
the Link with Dynamic RTL option from the C++ Linker category to False and then uncheck
Build with runtime packages in the Packages category:
If you want to keep Build with runtime packages (for instance, to control the exe size), you
can still use the Allocation profiler. When you include your application in an AQtime
project, you will also have to include the <Windows>\System32\RTL150.BPL file. To add
a module to an AQtime project, press
Add Module on the Setup toolbar or select it from
the Setup context menu.
13. Once you have set the compiler and linker options correctly, rebuild your application and it will be
ready for profiling. If you are profiling an ActiveX control or a COM server however, you should
register its “debug” version in the system (See Profiling COM Applications).
When your application is ready for release, remember to recompile it without debug information to reduce
the application size.
Note:
AQtime is incompatible with some third-party tools that modify the binary code of your
application (for example, those that add a custom exception handling mechanism). An
example of such a tool is EurekaLog. We recommend that you profile your application before
processing it with such tools.
Nevertheless, AQtime is compatible with AQtrace and supports profiling of applications that
use AQtrace for error reporting.
Compiler Settings for Embarcadero C++Builder 2010
© 2010 AutomatedQA Corp.
www.automatedqa.com/support
86
Profiling Applications With AQtime
This topic explains how to prepare applications created with Embarcadero C++Builder 2010 for AQtime.
To learn how to prepare applications created with other C++Builder versions, see Compiler Settings for Native
Applications.
To prepare an Embarcadero C++Builder 2010 application for AQtime, you must first ensure that it
includes debug information. Follow these steps:
1. Open your project in C++Builder 2010.
2. Choose Project | Options from the main menu to open the Project Options dialog.
3. To set the C++ compiler options, select the C++ Compiler | Debugging category from the tree
view on the left of the dialog.
4. To include symbolic debug information, set the Debug information option to True. In addition, to
refer this information to source line numbers, set the Debug line number information option to
True.
www.automatedqa.com
AQtime by AutomatedQA Corporation
Preparing an Application for Profiling
87
5. (Optional) To generate stack frames when using the C++ compiler, switch to the C++ Compiler
category and set the Standard stack frames option to True.
© 2010 AutomatedQA Corp.
www.automatedqa.com/support
88
Profiling Applications With AQtime
6. If you compile your application with CodeGuard enabled, the latter will report errors during the
profiler execution. They relate to AQtime hooking code and are not actually errors. We
recommend that you disable CodeGuard before profiling your application with AQtime. To do
this, switch to the C++ Compiler | Debugging category and set the Enable CodeGuard option to
False.
7. To set the Delphi compiler options, select the Delphi Compiler | Compiling category from the
tree view on the left of the dialog.
www.automatedqa.com
AQtime by AutomatedQA Corporation
Preparing an Application for Profiling
89
8. To include symbolic debug information, set the Debug information option to True. In addition, to
refer this information to source line numbers, set the Local symbols option to True.
© 2010 AutomatedQA Corp.
www.automatedqa.com/support
90
Profiling Applications With AQtime
9. (Optional) To generate stack frames when using the Delphi compiler, switch to the Delphi
Compiler | Compiling category and set the Stack frames option to True.
10. Switch to the C++ Linker category and set the Full debug information option to True:
www.automatedqa.com
AQtime by AutomatedQA Corporation
Preparing an Application for Profiling
91
11. Switch to the Directories and Conditionals category and examine the Library path option. If the
path contains the $(BDS)\lib\release folder, replace it with $(BDS)\lib\debug:
12. Now, if you do not want to use the Allocation profiler, skip this step.
The point of the Allocation profiler is not performance. Its point is to track memory usage. If you
need to have your application support the Allocation profiler, you must make sure that AQtime has
access to the VCL binary code. The easiest way to add support for the Allocation profiler is to set
the Dynamic RTL option from the C++ Linker category to False and then uncheck Build with
runtime packages in the Packages category:
© 2010 AutomatedQA Corp.
www.automatedqa.com/support
92
Profiling Applications With AQtime
If you want to keep Build with runtime packages (for instance, to control the exe size), you
can still use the Allocation profiler. When you include your application in an AQtime
project, you will also have to include the <Windows>\System32\RTL140.BPL file. To add
a module to an AQtime project, press
Add Module on the Setup toolbar or select it from
the Setup context menu.
13. Once you have set the compiler and linker options correctly, rebuild your application and it will be
ready for profiling. If you are profiling an ActiveX control or a COM server however, you should
register its “debug” version in the system (See Profiling COM Applications).
When your application is ready for release, remember to recompile it without debug information to reduce
the application size.
Note:
AQtime is incompatible with some third-party tools that modify the binary code of your
application (for example, those that add a custom exception handling mechanism). An
example of such a tool is EurekaLog. We recommend that you profile your application before
processing it with such tools.
Nevertheless, AQtime is compatible with AQtrace and supports profiling of applications that
use AQtrace for error reporting.
Compiler Settings for CodeGear C++Builder 2009
This topic explains how to prepare applications created with CodeGear C++Builder 2009 for AQtime. To
learn how to prepare applications created with other C++Builder versions, see Compiler Settings for Native
Applications.
To prepare a CodeGear C++Builder 2009 application for AQtime, you must first ensure that it includes debug
info. Follow these steps:
1. Open your project in CodeGear C++Builder 2009.
www.automatedqa.com
AQtime by AutomatedQA Corporation
Preparing an Application for Profiling
93
2. Select Project | Options from the main menu. This will open the Project Options dialog.
3. To set the C++ compiler options, select the C++ Compiler | Debugging category from the tree
view on the left of the dialog.
4. To include symbolic debug information, set the Debug information option to True. In addition,
to refer this information to source line numbers, set the Debug line number information option
to True.
5. (Optional) To generate stack frames when using the C++ compiler, switch to the C++ Compiler
category and set the Standard stack frames option to True.
© 2010 AutomatedQA Corp.
www.automatedqa.com/support
94
Profiling Applications With AQtime
6. If you compile your application with CodeGuard enabled, the latter will report errors during the
profiler execution. They relate to AQtime hooking code and are not actually errors. We
recommend that you disable CodeGuard before profiling your application with AQtime. To do
this, switch to the C++ Compiler | Debugging category and set the Enable CodeGuard option to
False.
www.automatedqa.com
AQtime by AutomatedQA Corporation
Preparing an Application for Profiling
95
7. To set the Delphi compiler options, select the Delphi Compiler | Compiling category from the
tree view on the left of the dialog.
8. To include symbolic debug information, set the Debug information option to True. In addition,
to refer this information to source line numbers, set the Local symbols option to True.
9. (Optional) To generate stack frames when using the Delphi compiler, switch to the Delphi
Compiler | Compiling category and set the Stack frames to True.
© 2010 AutomatedQA Corp.
www.automatedqa.com/support
96
Profiling Applications With AQtime
10. To set the linker options, switch to the C++ Linker category and set the Full debug information
option to True.
11. Now, if you do not want to use the {Allocation} profiler, skip this step.
The point of the Allocation profiler is not performance. Its point is to track memory usage. If you need to
have your application support the Allocation profiler, you must make sure that AQtime has access to the VCL
binary code. The easiest way to add support for the Allocation profiler is to set the Dynamic RTL option from
the C++ Linker category to False and then uncheck Build with runtime packages in the Packages category:
www.automatedqa.com
AQtime by AutomatedQA Corporation
Preparing an Application for Profiling
97
If you want to keep Build with runtime packages (for instance, to control the exe size), you
can still use the Allocation profiler. When you include your application in an AQtime
project, you will also have to include the <Windows>\System32\RTL120.BPL file. To add
a module to an AQtime project, press
Add Module on the Setup toolbar or select it from
the Setup context menu.
12. Once you have set the compiler and linker options correctly, rebuild your application and it will be
ready for profiling. If you are profiling an ActiveX control or a COM server however, you should
register its “debug” version in the system (See Profiling COM Applications).
When your application is ready for release, remember to recompile it without debug information to reduce
the application size.
Note:
AQtime is incompatible with some third-party tools that modify the binary code of your
application (for example, those that add a custom exception handling mechanism). An
example of such a tool is EurekaLog. We recommend that you profile your application before
processing it with such tools.
Nevertheless, AQtime is compatible with AQtrace and supports profiling of applications that
use AQtrace for error reporting.
Compiler Settings for CodeGear C++Builder 2007
This topic explains how to prepare applications created with CodeGear C++Builder 2007 for AQtime. To
learn how to prepare applications created with other C++Builder versions, see Compiler Settings for Native
Applications.
To prepare a CodeGear C++Builder 2007 application for AQtime, you must first ensure that it includes
debug info. Follow these steps:
1. Open your project in CodeGear C++Builder 2007.
2. Select Project | Options from the main menu. This will open the Project Options dialog.
© 2010 AutomatedQA Corp.
www.automatedqa.com/support
98
Profiling Applications With AQtime
3. To set the C++ compiler options, select the C++ Compiler | Debugging category from the tree
view on the left of the dialog.
4. To include symbolic debug information, check Debug information. In addition, to refer this
information to source line numbers, check Debug line number information.
www.automatedqa.com
AQtime by AutomatedQA Corporation
Preparing an Application for Profiling
99
5. (Optional) To generate stack frames when using the C++ compiler, switch to the C++ Compiler |
General Compilation category and check Standard stack frames:
© 2010 AutomatedQA Corp.
www.automatedqa.com/support
100
Profiling Applications With AQtime
6. If you compile your application with CodeGuard enabled, the latter will report errors during the
profiler execution. They relate to AQtime hooking code that are not actually errors. We
recommend that you disable CodeGuard before profiling your application with AQtime. To do
this, go back to the C++ Compiler | Debugging category and uncheck Enable all CodeGuard
options.
7. To set the Delphi compiler options, select the Delphi Compiler | Compiling category from the
tree view on the left of the dialog.
www.automatedqa.com
AQtime by AutomatedQA Corporation
Preparing an Application for Profiling
101
8. To include symbolic debug information, check Debug information in the Delphi Compiler |
Compiling category. In addition, to refer this information to source line numbers, check Local
debug symbols.
© 2010 AutomatedQA Corp.
www.automatedqa.com/support
102
Profiling Applications With AQtime
9. (Optional) To generate stack frames when using the Delphi compiler, switch to the Delphi
Compiler | Compiling category and check Generate stack frames.
10. To set the linker options, switch to the Linker | Linking category and check Full debug
information.
www.automatedqa.com
AQtime by AutomatedQA Corporation
Preparing an Application for Profiling
103
11. Now, if you do not want to use the Allocation profiler, skip this step.
The point of the Allocation profiler is not performance. Its point is to track memory usage. If you
need to have your application support the Allocation profiler, you must make sure that AQtime has
access to the VCL binary code. The easiest way to add support for the Allocation profiler is to
uncheck Dynamic RTL in the Linker | Linking category and then uncheck Build with runtime
packages in the Packages category:
© 2010 AutomatedQA Corp.
www.automatedqa.com/support
104
Profiling Applications With AQtime
Note: If you want to keep the Build with runtime packages option (for instance, to control the
exe size), you can still use the Allocation profiler. When you include your application in
an
AQtime
project,
you
will
also
have
to
include
the
<Windows>\System32\RTL110.BPL file.
To add a module to an AQtime project, press
select it from the Setup context menu.
Add Module on the Setup toolbar or
12. Once you have set the compiler and linker options correctly, rebuild your application and it will be
ready for profiling. If you are profiling an ActiveX control or a COM server however, you should
register its “debug” version in the system (See Profiling COM Applications).
When your application is ready for release, remember to recompile it without debug information to reduce
the application size.
Note:
AQtime is incompatible with some third-party tools that modify the binary code of your
application (for example, those that add a custom exception handling mechanism). An
example of such a tool is EurekaLog. We recommend that you profile your application
before processing it with such tools.
Nevertheless, AQtime is compatible with AQtrace and supports profiling of applications
that use AQtrace for error reporting.
Compiler Settings for Borland C++Builder 2006
www.automatedqa.com
AQtime by AutomatedQA Corporation
Preparing an Application for Profiling
105
This topic explains how to prepare applications created with Borland C++Builder 2006 for AQtime. To
learn how to prepare applications created with other C++Builder versions, see Compiler Settings for Native
Applications.
To prepare a Borland C++Builder 2006 application for AQtime, you must first ensure that it includes
debug info. Follow these steps:
1. Open your project in Borland C++Builder 2006.
2. Select Project | Options from the main menu. This will open the Project Options dialog.
3. To set the C++ compiler options, select the C++ Compiler (bcc32) | Debugging category from
the tree view on the left of the dialog.
4. To include symbolic debug information, check Source debugging. In addition, to refer this
information to source line numbers, check Debug line numbers.
5. (Optional) To generate stack frames when using the C++ compiler, switch to the C++ Compiler
(bcc32) | Compiling category and check Stack frames.
© 2010 AutomatedQA Corp.
www.automatedqa.com/support
106
Profiling Applications With AQtime
6. If you compile your application with CodeGuard enabled, the latter will report errors during the
profiler execution. They relate to AQtime hooking code and are not actually errors. We
recommend that you disable CodeGuard before profiling your application with AQtime. To do
this, switch to the C++ Compiler (bcc32) | CodeGuard compile support category and uncheck
All CodeGuard options on.
www.automatedqa.com
AQtime by AutomatedQA Corporation
Preparing an Application for Profiling
107
7. To set the Pascal compiler options, select the Pascal Compiler (DCC32) | Debugging category
from the tree view on the left of the dialog.
8. To include symbolic debug information, check Debug information. In addition, to refer this
information to source line numbers, check Local symbol information.
© 2010 AutomatedQA Corp.
www.automatedqa.com/support
108
Profiling Applications With AQtime
9. (Optional) To generate stack frames when using the Pascal compiler, switch to the Pascal
Compiler (DCC32) | Code generation category and check Generate stack frames.
www.automatedqa.com
AQtime by AutomatedQA Corporation
Preparing an Application for Profiling
109
10. To set the linker options, switch to the Linker (ilink32) | Linking category and check Full debug
information.
© 2010 AutomatedQA Corp.
www.automatedqa.com/support
110
Profiling Applications With AQtime
11. Now, if you do not want to use the Allocation profiler, go to item 12.
The point of the Allocation profiler is not performance. Its point is to track memory usage. If you
need to have your application support the Allocation profiler, you must make sure that AQtime has
access to the VCL binary code. The easiest way to add support for the Allocation profiler is to
uncheck Use dynamic RTL (cc3260.dll) in the Linker (ilink32) | Linking category and then
uncheck Build with runtime packages in the Packages category:
www.automatedqa.com
AQtime by AutomatedQA Corporation
Preparing an Application for Profiling
111
If you want to keep Build with runtime packages (for instance, to control the exe size), you
can still use the Allocation profiler. When you include your application in an AQtime
project, you will also have to include the <Windows>\System32\RTL100.BPL file. To add
a module to an AQtime project, press
Add Module on the Setup toolbar or select it from
the Setup context menu.
12. Once you have set the compiler and linker options correctly, rebuild your application and it will be
ready for profiling. If you are profiling an ActiveX control or a COM server however, you should
register its “debug” version in the system (See Profiling COM Applications).
When your application is ready for release, remember to recompile it without debug information to reduce
the application size.
Note:
AQtime is incompatible with some third-party tools that modify the binary code of your
application (for example, those that add a custom exception handling mechanism). An
example of such a tool is EurekaLog. We recommend that you profile your application before
processing it with such tools.
Nevertheless, AQtime is compatible with AQtrace and supports profiling of applications that
use AQtrace for error reporting.
Compiler Settings for Borland C++Builder 3-6
© 2010 AutomatedQA Corp.
www.automatedqa.com/support
112
Profiling Applications With AQtime
This topic explains how to prepare applications created with Borland C++Builder v. 3-6 for AQtime. To
learn how to prepare applications created with other C++Builder versions, see Compiler Settings for Native
Applications.
To prepare a Borland C++Builder application for AQtime, you must first ensure that it includes debug
info. Follow these steps:
1. Open your project in Borland C++Builder.
2. To set the compiler options, choose Project | Options from C++Builder’s main menu and select
the Compiler tabbed page.
3. To include symbolic debug information, in the Debugging section of the Compiler page, check
Debug information. In addition, to refer this information to source line numbers, check Line
Information.
4. To set the linker options, select the Linker tabbed page. In the Linking options group, check
Create Debug Information.
5. If you want to profile VCL classes, for example, TDataset, check the Use debug libraries box.
Otherwise, AQtime will be able to profile only the classes that are defined in your application.
www.automatedqa.com
AQtime by AutomatedQA Corporation
Preparing an Application for Profiling
113
6. If you compile your application with CodeGuard enabled, the latter will report errors during the
profiler execution. They relate to AQtime hooking code and are not actually errors. We
recommended that you disable CodeGuard before profiling your application with AQtime. To do
this:
Select Tools | CodeGuard Configuration from C++Builder’s main menu. This will open
the CodeGuard Configuration dialog.
Uncheck the Enable box on the Preferences tabbed page of this dialog:
Click OK to save the changes.
7. Now, if you do not want to use the Allocation profiler, go to point 8.
The point of the Allocation profiler is not performance. Its point is to track memory usage. If you
need to have your application support the Allocation profiler, you must make sure that AQtime has
access to the VCL binary code. The easiest way to add support for the Allocation profiler is to
check Use debug libraries on the Linker page, uncheck Use dynamic RTL on that page, and
then uncheck Build with runtime packages on the Packages page:
© 2010 AutomatedQA Corp.
www.automatedqa.com/support
114
Profiling Applications With AQtime
Tip:
You can actually leave the Use dynamic RTL checked, but in this case the memory would be
allocated via the Borland C++ Multi-thread Runtime Library (cc3260mt.dll) and since this
module is not included in the Setup panel, all found leaks would not be displayed, if the Show
leaks for Setup modules option is enabled. This option is enabled by default and the results of
the Allocation profiler would not be shown until the option is disabled, which could be rather
confusing.
If you want to keep the Build with runtime packages enabled (for instance, to control the exe
size), you can still use the Allocation profiler. When you include your application in an
AQtime
project,
also
include
the
<Windows>\System32\VCLnn.BPL
or
<Windows>\System32\RTLnn.BPL file, where nn is the compiler version number. You can
find this number in the edit field under the “Build with runtime packages” check box:
For instance:
Add VCL35.BPL if you use C++Builder 3.
Add VCL50.BPL if you use C++Builder 5.
Add RTL60.BPL if you use C++Builder 6.
To add a module to an AQtime project, press
select it from the Setup context menu.
www.automatedqa.com
Add Module button on the Setup toolbar or
AQtime by AutomatedQA Corporation
Preparing an Application for Profiling
115
8. Once you have set the compiler and linker options correctly, rebuild your application and it will be
ready for profiling. If you are profiling an ActiveX control or a COM server however, you should
register its “debug” version in the system (See Profiling COM Applications).
When your application is ready for release, remember to recompile it without debug information to reduce
the application size.
Note:
AQtime is incompatible with some third-party tools that modify the binary code of your
application (for example, those that add a custom exception handling mechanism). An
example of such a tool is EurekaLog. We recommend that you profile your application before
processing it with such tools.
Nevertheless, AQtime is compatible with AQtrace and supports profiling of applications that
use AQtrace for error reporting.
Compiler Settings for Borland C++
To prepare a Borland C++ application for AQtime, you simply need to ensure that it includes debug info.
Follow these steps:
•
To set the compiler options, choose Project | Options from Borland C++’s main menu and select
the Compiler topic.
•
To include the symbolic debug information, from the Compiler topic, select the Debugging
subtopic. Once there, check Generate Debug Information:
•
To set the linker options, from Project | Options now select the Linker topic. In the Linking
options group, check Create Debug Information:
© 2010 AutomatedQA Corp.
www.automatedqa.com/support
116
Profiling Applications With AQtime
Once you have set the compiler and linker options correctly, rebuild your application and it will be ready
for profiling. If you are profiling an ActiveX control or a COM server however, you should register its “debug”
version in the system (See Profiling COM Applications).
When your application is ready for release, remember to recompile it without debug information to reduce
the application size.
Compiler Settings for Intel C++
The Intel C++ 7.0 compiler is tightly integrated into Microsoft Visual Studio 6.0 and 7.0. To prepare an
Intel C++ application for AQtime, you should perform the same actions, which you perform to prepare a
Visual C++ application. For complete information, review the following topics:
¾ Compiler Settings for Visual C++ 6.0
¾ Compiler Settings for Visual C++ .NET
Compiler Settings for GNU CC
The current AQtime version must get debug information in the stab (symbol table) format, so you must
use the GDB extension for stab.
To generate debug information in stab format, use either the -g or -ggdb compiler option:
•
g means “debug information in the format native to the operating system”, and stab is OS-native
for Cygwin.
•
ggdb means “debug information in the format native to the compiler”, and again this is stab for
Cygwin.
Remember that future versions of GCC may use a different default debug information format. For more
information on GCC arguments controlling the creation of debug information, see the Options for Debugging
Your Program or GNU CC topic of the GCC Compiler Guide.
www.automatedqa.com
AQtime by AutomatedQA Corporation
Preparing an Application for Profiling
117
Compiler Settings for Compaq Visual Fortran
To prepare a Visual Fortran application for AQtime, you must ensure that it includes the debug info and
select the format under which it will be generated. Follow these steps:
1. Open your application in Visual Fortran’s IDE.
2. Select Build | Set Active Configuration from the main menu. This will open the following
dialog:
In the dialog, set the <Your project name> - Win32 Debug configuration as active and press
OK to save changes.
Note that the only reason to change the active configuration is to leave the Release
configuration unaffected. If you want to profile the Release configuration, you may skip this step.
In this case, do not forget to restore the compiler settings before compiling the release version of
your application.
3. Select Project | Settings from the main menu. The Project Settings dialog will appear. Select
Win32 Debug in the Settings for box.
© 2010 AutomatedQA Corp.
www.automatedqa.com/support
118
Profiling Applications With AQtime
4. Switch to the Fortran tabbed page and select Debug from the Category box. Then, set Full in the
Debugging Level field:
5. Switch to the Link page and set Category to Debug. Now check the Debug info box and select
Microsoft format of the debug information:
6. The last step is to set how the linker will save the debug information. AQtime supports debug
information generated as an external PDB file (PDB format). To set linker options:
Switch to the Link page of the Project Settings dialog.
Set the Category to Customize.
Check Use program database.
www.automatedqa.com
AQtime by AutomatedQA Corporation
Preparing an Application for Profiling
119
Enter the PDB file name you want into the Program database name edit field.
7. Press OK to close the Project Settings dialog. Recompile your application.
By default, the .pdb debug info file resides in the same folder where the profiled executable or DLL is
located. When you open your module in AQtime, it searches for the debug info file in this default location. If
you copy the debug info file to another location, then specify this location in the Symbols Path list of the
Symbols Options dialog (this list contains the search paths). See Specifying Path to Debug Info Files for more
information.
When your application is ready for release, remember to recompile it without debug information to reduce
the application size.
Compiler Settings for .NET Applications
Compiler Settings for ASP.NET
This topic explains how to prepare ASP.NET applications before profiling them in AQtime.
To add debug information to your ASP.NET application, follow these steps:
1. Create the Web.config file in your project folder (if it is not there yet) and set the debug attribute of
the compilation element to true in the file:
<compilation debug=”true”/>
2. Compile your ASP.NET application with debug information. The actions you should perform at
this step depend on the project type of your ASP.NET application and on the tool you are using to
create and compile your application.
If you create an ASP.NET Web Site project, you need just to build your project or publish
it to obtain the application modules with debug information. That is, you do not need to
change any additional project settings before compiling the project.
© 2010 AutomatedQA Corp.
www.automatedqa.com/support
120
Profiling Applications With AQtime
If you create an ASP.NET Web Application project, you need to change some additional
project settings before compiling the application with debug information. The actions to
be performed depend on the tool you are using. For more details, see the topics listed
below:
¾ Compiler Settings for Microsoft Visual C# 2005, 2008 and 2010
¾ Compiler Settings for Microsoft Visual C# .NET
¾ Compiler Settings for Microsoft Visual Basic 2005, 2008 and 2010
¾ Compiler Settings for Microsoft Visual Basic .NET
¾ Compiler Settings for Microsoft Visual J# 2005
¾ Compiler Settings for Microsoft Visual J# .NET
¾ Compiler Settings for Borland C#Builder 2006
¾ Compiler Settings for Borland C#Builder
¾ Compiler Settings for Borland Delphi 2006 for .NET
¾ Compiler Settings for Borland Delphi 2005 for .NET
¾ Compiler Settings for Borland Delphi 8 (Delphi for .NET)
When your application is ready for final delivery, remember to compile it without debug information to
reduce the overall size of the application.
Compiler Settings for Microsoft Visual C# 2005, 2008 and 2010
This topic explains how to prepare applications created with Microsoft Visual C# 2005, Visual C# 2008 or
Visual C# 2010 for AQtime. To learn how to prepare applications created with Visual C# .NET, see Compiler
Settings for Microsoft C# .NET.
To add debug information to your Visual C# 2005, Visual C# 2008 or Visual C# 2010 application, follow
these steps:
1. Open your project in Visual Studio 2005, Visual Studio 2008 or Visual Studio 2010.
2. Select Build | Configuration Manager from the main menu. This will open the Configuration
Manager dialog. Select the Debug configuration for your project:
www.automatedqa.com
AQtime by AutomatedQA Corporation
Preparing an Application for Profiling
121
Close the dialog.
3. Right-click the project in the Solution Explorer and select Properties from the context menu.
This will open the Property Pages dialog.
4. In this dialog, open the Build page and select Active (Debug) from the Configuration dropdown
list at the top of the dialog. Then, on the same Build page, disable the Optimize code checkbox
and click the Advanced button.
© 2010 AutomatedQA Corp.
www.automatedqa.com/support
122
Profiling Applications With AQtime
5. In the resulting Advanced Build Settings dialog, select either full or pdb-only in the Debug Info
dropdown list box.
6. Click OK to close the dialog.
www.automatedqa.com
AQtime by AutomatedQA Corporation
Preparing an Application for Profiling
123
7. If your application is a WPF Browser application (XBAP), then you should change the security
settings: switch to the Security page and enable the This is a full trust application setting:
8. Save the changes in the project. Recompile the application.
When your application is ready for final delivery, remember to compile it without debug information to
reduce the overall size of the application.
Compiler Settings for Microsoft Visual C# .NET
This topic explains how to prepare applications created with Microsoft Visual C# .NET for AQtime. To
learn how to prepare applications created with Visual C# 2005, 2008 or 2010, see Compiler Settings for
Microsoft C# 2005, 2008 and 2010.
To add debug information to your Visual C# .NET application, follow these steps:
1. Open your project in Visual Studio .NET.
2. Select Build | Configuration Manager from the main menu. This will open the Configuration
Manager dialog. Select the Debug configuration for your project:
© 2010 AutomatedQA Corp.
www.automatedqa.com/support
124
Profiling Applications With AQtime
Close the dialog.
3. Right-click the project in the Solution Explorer and select Properties from the context menu. This
will open the Property Pages dialog.
4. In the dialog, open the Configuration Properties | Build page and select Active (Debug) from the
Configuration dropdown list at the top of the dialog. Then, in the Configuration Properties |
Build page, turn on the Generate debugging information option and disable Optimize Code.
5. Press OK to save settings. Recompile the application.
When your application is ready for final delivery, remember to compile it without debug information to
reduce overall application size.
Compiler Settings for Microsoft Visual J# 2005
This topic explains how to prepare applications created with Visual J# 2005 for AQtime. To learn how to
prepare applications created with Visual J# .NET, see Compiler Settings for Microsoft Visual J# .NET.
To add debug information to your Visual J# 2005 application, follow these steps:
1. Open your project in Visual Studio 2005.
www.automatedqa.com
AQtime by AutomatedQA Corporation
Preparing an Application for Profiling
125
2. Select Build | Configuration Manager from the main menu. This will open the Configuration
Manager dialog. Select the Debug configuration for your project:
Close the dialog.
3. Right-click the project in the Solution Explorer and select Properties from the context menu.
This will open the Property Pages dialog.
4. In this dialog, open the Build page and select Active (Debug) from the Configuration dropdown
list at the top of the dialog. Then, on the same Build page, disable the Optimize Code checkbox
and click the Advanced button.
© 2010 AutomatedQA Corp.
www.automatedqa.com/support
126
Profiling Applications With AQtime
5. In the resulting Advanced Build Settings dialog, select either full or pdb-only in the Debug Info
dropdown list box.
www.automatedqa.com
AQtime by AutomatedQA Corporation
Preparing an Application for Profiling
127
6. Click OK to close the dialog.
7. Save the changes in the project. Recompile the application.
When your application is ready for final delivery, remember to compile it without debug information to
reduce the overall size of the application.
Compiler Settings for Microsoft Visual J# .NET
This topic explains how to prepare applications created with Visual J# .NET for AQtime. To learn how to
prepare applications created with Visual J# 2005, see Compiler Settings for Microsoft Visual J# 2005.
To add debug information to your Visual J# .NET application, follow these steps:
1. Open your project in Visual Studio .NET.
2. Select Build | Configuration Manager from the main menu. This will open the Configuration
Manager dialog. Select the Debug configuration for your project:
Close the dialog.
© 2010 AutomatedQA Corp.
www.automatedqa.com/support
128
Profiling Applications With AQtime
3. Right-click the project in the Solution Explorer and select Properties from the context menu. This
will open the Property Pages dialog.
4. In the dialog, open the Configuration Properties | Build page and select Active (Debug) from the
Configuration dropdown list at the top of the dialog. Then, in the Configuration Properties |
Build page, turn on the Generate debugging information option and disable Optimize Code.
5. Press OK to save settings. Recompile the application.
When your application is ready for final delivery, remember to compile it without debug information to
reduce overall application size.
Compiler Settings for Microsoft Visual Basic 2005, 2008 and 2010
This topic explains how to prepare applications that were created with Microsoft Visual Basic 2005, 2008
or 2010 for AQtime. To learn how to prepare applications created with Visual Basic 6.0 or Visual Basic .NET,
see Compiler Settings for Microsoft Visual Basic and Compiler Settings for Microsoft Visual Basic .NET
respectively.
To add debug information to your Visual Basic 2005, Visual Basic 2008 or Visual Basic 2010 application,
follow these steps:
1. Open your project in Visual Studio 2005, Visual Studio 2008 or Visual Studio 2010.
2. Select Build | Configuration Manager from the main menu. This will open the Configuration
Manager dialog. Select the Debug configuration for your project:
www.automatedqa.com
AQtime by AutomatedQA Corporation
Preparing an Application for Profiling
129
Close the dialog.
3. Right-click the project in the Solution Explorer and select Properties from the context menu.
This will open the Property Pages dialog.
4. In the dialog, open the Build page and select Active (Debug) from the Configuration dropdown
list at the top of the dialog. Then on the same Build page, click the Advanced Compile Options
button.
© 2010 AutomatedQA Corp.
www.automatedqa.com/support
130
Profiling Applications With AQtime
5. In the resulting Advanced Build Settings dialog, select either Full or pdb-only in the Generate
debug info dropdown list box and turn off the Enable optimizations checkbox.
www.automatedqa.com
AQtime by AutomatedQA Corporation
Preparing an Application for Profiling
131
6. Click OK to close the dialog.
7. If your application is a WPF Browser application (XBAP), then you should change the security
settings: switch to the Security page and enable the This is a full trust application setting:
© 2010 AutomatedQA Corp.
www.automatedqa.com/support
132
Profiling Applications With AQtime
8. Save the changes in the project and recompile the application.
When your application is ready for final delivery, remember to compile it without debug information to
reduce the overall size of the application.
Compiler Settings for Microsoft Visual Basic .NET
This topic explains how to prepare applications that were created with Microsoft Visual Basic .NET for
AQtime. To learn how to prepare applications created with Visual Basic 6.0, see Compiler Settings for
Microsoft Visual Basic. To learn how to prepare applications created with Visual Basic 2005, 2008 or 2010,
see Compiler Settings for Microsoft Visual Basic 2005, 2008 and 2010.
To add debug information to your Visual Basic .NET application, follow these steps:
1. Open your project in Visual Studio .NET.
2. Select Build | Configuration Manager from the main menu. This will open the Configuration
Manager dialog. Select the Debug configuration for your project:
Close the dialog.
3. Right-click the project in the Solution Explorer and select Properties from the context menu. This
will open the Property Pages dialog.
4. In the dialog,
Open the Configuration Properties | Build page and select Active (Debug) from the
Configuration dropdown list at the top of the dialog.
In the Configuration Properties | Build page enable the Generate debugging
information option.
www.automatedqa.com
AQtime by AutomatedQA Corporation
Preparing an Application for Profiling
133
Switch to the Configuration Properties | Optimizations page and turn off the Enable
Optimizations option.
5. Press OK to save settings and recompile the application.
When your application is ready for final delivery, remember to compile it without debug information to
reduce overall application size.
Compiler Settings for Microsoft Visual C++ 2005, 2008 and 2010
This topic explains how to prepare applications created with Visual C++ 2005, Visual C++ 2008 or Visual
C++ 2010 for AQtime. To learn how to prepare applications created with Visual C++ 7.x, see Compiler
© 2010 AutomatedQA Corp.
www.automatedqa.com/support
134
Profiling Applications With AQtime
Settings for Microsoft Visual C++ .NET. To learn how to prepare applications created with Visual C++ 6.0 or
earlier, see Compiler Settings for Microsoft Visual C++ 6.0.
Note that default settings created by Microsoft Visual Studio for a new Visual C++ 2005, 2008 or 2010
application already contain the necessary information for generating debug information. So, if you do not
change the compiler settings, you can compile and profile your Visual C++ 2005, 2008 or 2010 application as
is. However, we recommend that you change the active configuration to Release if you are going to profile
with the Performance profiler. The Release configuration is used to build the final version of the application,
so you should search for performance bottlenecks in versions compiled with the Release configuration, but not
with the Debug configuration.
If you are not sure whether your application’s compiler settings were changed, you can follow the steps
described in this topic to make sure that your application is compiled with debug information.
To add debug information to your Visual C++ 2005, Visual C++ 2008 or Visual C++ 2010 application,
follow these steps:
1. Open your project in Visual Studio 2005, Visual Studio 2008 or Visual Studio 2010.
2. Select Build | Configuration Manager from the main menu. This will open the Configuration
Manager dialog. Select the Release configuration for your project:
Close the dialog.
Note:
Of course, you can profile your application in any configuration, not just in the
Release one. We recommend that you choose this configuration if you are going to
use the Performance profiler (see above).
3. Right-click the project in the Solution Explorer and select Properties from the context menu. This
will call the Property Pages dialog.
4. In the dialog,
Select Active (Release) from the Configuration dropdown list.
www.automatedqa.com
AQtime by AutomatedQA Corporation
Preparing an Application for Profiling
135
Switch to the Configuration Properties | C/C++ | General page and set Debug
Information Format to Program Database (/Zi) or Program Database for Edit &
Continue (/ZI). For more information on these options review Visual Studio 2005 Help.
Open the Configuration Properties | Linker | Debugging property page and set the
Generate Debug Info option to Yes (/DEBUG).
© 2010 AutomatedQA Corp.
www.automatedqa.com/support
136
Profiling Applications With AQtime
5. Click OK to save the settings and then rebuild the application. Once finished, your application will
be ready for profiling in AQtime.
Before opening the application in AQtime, make sure that the output directory of your application includes
the .pdb file that you have created. In addition, this directory should contain the vcX0.pdb file, where X is the
major version number of the Visual C++ compiler, e.g. for Visual C++ 8.0 this file is called vc80.pdb.
vcX0.pdb contains part of your application’s debugging information, which may be needed to profile the entire
application in AQtime correctly. It is possible that the vc80.pdb file is not generated by Visual Studio and this
will not cause any problems with profiling. If you are profiling an ActiveX control or a COM server, do not
forget to register its “debug” version in the system (See Profiling COM Applications).
By default, the .pdb debug info file resides in the same folder where the profiled executable or DLL is
located. When you open your module in AQtime, it searches for the debug info file in this default location. If
you copy the debug info file to another location, then specify this location in the Symbols Path list of the
Symbols Options dialog (this list contains the search paths). See Specifying Path to Debug Info Files for more
information.
When your application is ready for final delivery, remember to compile it without debug information to
reduce the overall size of the application.
Compiler Settings for Microsoft Visual C++ .NET
This topic explains how to prepare applications created with Visual C++ 7.x for AQtime. To learn how to
prepare applications created with Visual C++ 2005 (8.0), Visual C++ 2008 (9.0) or Visual C++ 2010 (10.0),
see Compiler Settings for Microsoft Visual C++ 2005, 2008 and 2010. To learn how to prepare applications
created with Visual C++ 6.0 or earlier, see Compiler Settings for Microsoft Visual C++ 6.0.
Note that default settings created by Microsoft Visual Studio for a new Visual C++ .NET application
already hold all necessary information for generating debug information. So, if you do not change the compiler
settings, you can compile and profile your Visual C++ .NET application as is. The only thing we would
www.automatedqa.com
AQtime by AutomatedQA Corporation
Preparing an Application for Profiling
137
recommend is to change the active configuration to Release if you are going to profile with the Performance
profiler. The Release configuration is used to build the final version of the application, so you should search for
performance bottlenecks in versions compiled with the Release configuration, but not with the Debug
configuration.
If you are not sure whether your application’s compiler settings were changed, you can follow the steps
described in this topic to make certain that your application is compiled with debug information.
To add debug information to your Visual C++ .NET application, follow these steps:
1. Open your project in Visual Studio .NET.
2. Select Build | Configuration Manager from the main menu. This will open the Configuration
Manager dialog. Select the Release configuration for your project:
Close the dialog.
Note:
Of course, you can profile your application in any configuration, not just in the
Release one. We recommend that you choose this configuration if you are going to use
the Performance profiler (see above).
3. Right-click the project in the Solution Explorer and select Properties from the context menu. This
will call the Property Pages dialog.
4. In the dialog,
Select Active (Release) from the Configuration dropdown list.
Switch to the Configuration Properties | C\C++ | General page and set Debug
Information Format either to Program Database (/Zi) or to Program Database for Edit
& Continue (/ZI). For more information on these options review Visual Studio.NET Help.
© 2010 AutomatedQA Corp.
www.automatedqa.com/support
138
Profiling Applications With AQtime
Open the Configuration Properties | Linker | Debug property page and set the
Generate Debug Info option to Yes (/DEBUG).
5. Click OK to save settings and then rebuild the application. After that it will be ready for profiling
in AQtime.
Before opening the application in AQtime, make sure that the output directory of your application includes
the .pdb file you have created. In addition, this directory should contain the vcX0.pdb file, where X is the major
version number of the Visual C++ compiler, e.g. for Visual C++ 7.0 this file is called vc70.pdb. vcX0.pdb
holds part of your application’s debugging information, which may be needed to profile the entire application
in AQtime correctly. It is possible that the vc70.pdb file is not generated by Visual Studio and this will not
cause any problems with profiling. If you are profiling an ActiveX control or a COM server, do not forget to
register its “debug” version in the system (See Profiling COM Applications).
www.automatedqa.com
AQtime by AutomatedQA Corporation
Preparing an Application for Profiling
139
When your application is ready for final delivery, remember to compile it without debug information to
reduce overall application size.
Compiler Settings for Microsoft F#
For the most comprehensive profiling results, it is recommended that you compile your F# application with
debug information (see How AQtime Profilers Use Metadata and Debug Information). The way you do
this depends on whether you compile your application from the command line or from Microsoft Visual
Studio.
F# Compiler (fsc.exe)
When using command line compilation, you can generate debug information for your F# application by
compiling it with either the -g, -g+, --debug or --debug+ option and without the --optimize (or -O)
option.
For more information about F# compiler command line options, see fsc -? or refer to the Compiler
Options (F#) article in the MSDN library (the online version is available at http://msdn.microsoft.com).
Microsoft Visual Studio
If you use Microsoft Visual Studio 2008 or 2010 with Microsoft Visual F#, follow these steps to add debug
information to your F# application:
1. Open your F# project in Microsoft Visual Studio.
2. Select Build | Configuration Manager from the main menu of Visual Studio. The Configuration
Manager dialog will open.
3. Select the Debug configuration and close the dialog:
4. Right-click the project in the Solution Explorer and select Properties from the context menu. The
Project Designer will open.
5. Select the Build property page.
© 2010 AutomatedQA Corp.
www.automatedqa.com/support
140
Profiling Applications With AQtime
6. Select Active (Debug) from the Configuration drop-down list at the top of the dialog.
7. Clear the Optimize code check box.
8. Save the changes made to the project.
9. Recompile your application.
When your application is ready for the final delivery, remember to recompile it in the Release
configuration and without debug information to reduce the overall application size.
Compiler Settings for Borland C#Builder 2006
This topic explains how to prepare applications created with Borland C#Builder 2006 for AQtime. To
learn how to prepare applications created with earlier versions of Borland C#Builder, see Compiler Settings for
Borland C#Builder.
To compile your application with debug info in Borland C#Builder 2006, follow these steps:
1. Open your application in Borland C#Builder 2006.
2. Select Project | Options from C#Builder's main menu. This will open the Project Options dialog.
3. In the dialog, select the Compiler category and check the Debug information option:
www.automatedqa.com
AQtime by AutomatedQA Corporation
Preparing an Application for Profiling
141
Close the dialog.
4. Click OK to save changes.
5. Recompile your application.
When your application is ready for final delivery, remember to compile it without debug information to
reduce the overall application size.
Compiler Settings for Borland C#Builder
This topic explains how to prepare applications created with Borland C#Builder for AQtime. To learn how
to prepare applications created with Borland C#Builder 2006, see Compiler Settings for Borland C#Builder
2006.
To compile your application with debug info in Borland C#Builder, follow these steps:
1. Open your application in Borland C#Builder.
2. Select Project | Options from C#Builder's main menu. This will open the Project Options dialog.
3. In the dialog, select the Compiler category and check the Debug information option:
© 2010 AutomatedQA Corp.
www.automatedqa.com/support
142
Profiling Applications With AQtime
Close the dialog.
4. Click OK to save changes and recompile your application.
When your application is ready for final delivery, remember to compile it without debug information to
reduce overall application size.
Compiler Settings for Borland Delphi 2006 for .NET
This topic explains how to prepare applications created with Borland Delphi 2006 for .NET for AQtime.
To learn how to prepare applications created with other Delphi versions, see Compiler Settings for .NET
Applications.
To add debug information to your Delphi 2006 for .NET application, do the following:
1. Open your project in Delphi 2006 for .NET.
2. Select Project | Options from the main menu. This will open the Project Options dialog.
3. Select the Compiler category from the treeview on the left of the dialog and enable the following
options:
•
Debug information
•
Local Symbols
•
Use Debug DCUILs
www.automatedqa.com
AQtime by AutomatedQA Corporation
Preparing an Application for Profiling
143
4. Select the Linker category and enable the Generate .PDB debug info file option:
5. Click OK to close the dialog and recompile your application.
When your application is ready for final delivery, do not forget to compile it without debug information to
reduce the overall application size.
Compiler Settings for Borland Delphi 2005
The manner, in which you prepare your Borland Delphi 2005 application for AQtime, depends on the kind
of your application:
•
If you have a Borland Delphi for Win32 application, use the approach described in Compiler
Settings for Borland Delphi.
© 2010 AutomatedQA Corp.
www.automatedqa.com/support
144
Profiling Applications With AQtime
•
If you have a Borland Delphi for .NET application, use the approach described in Compiler
Settings for Borland Delphi 8 (Delphi for .NET).
Compiler Settings for Borland Delphi 8 (Delphi for .NET)
This topic explains how to prepare applications created with Borland Delphi 8 (Delphi for .NET) or
Borland Delphi 2005 for .NET for AQtime. To learn how to prepare applications created with Delphi 2005 for
Win32 and Delphi 7.0 or earlier, see Compiler Settings for Borland Delphi. To learn how to prepare
applications created with Delphi 2006 for .NET and Delphi 2006 for Win32, see Compiler Settings for Borland
Delphi 2006 for .NET and Compiler Settings for Borland Delphi 2006 for Win32 respectively.
To add debug information to your Delphi for .NET application, do the following:
1. Open your project in Delphi for .NET.
2. Select Project | Options from the main menu. This will open the Project Options dialog.
3. Select the Compiler category from the treeview on the left of the dialog and enable the following
options:
Debug information
Local Symbols
Use Debug DCUILs
4. Select the Linker category and enable the Generate .PDB debug info file option:
www.automatedqa.com
AQtime by AutomatedQA Corporation
TSetting Up a Profiling ProjectT
145
5. Click OK to close the dialog and recompile your application.
When your application is ready for final delivery, do not forget to compile it without debug information to
reduce the overall application size.
Compiler Settings for Java Applications
Compiler Settings for Java Compiler
The Java compiler (javac) compiles applications with all necessary debug information by default.
However, if the -g:none compiler setting is used, no debug information is generated. In this case, you need to
remove this setting from the compiler’s command line and use one of the following settings instead:
•
no -g setting Generate debug information for source files and line numbers.
•
-g – Generate all debug information (for source files, line numbers and local variables).
When your application is ready for release, remember to recompile it with the settings you use for release
builds.
Setting Up a Profiling Project
Creating and Saving AQtime Projects
Creating AQtime Projects
If you use AQtime standalone, you can create a new AQtime project in two ways:
•
By selecting File | New Project from AQtime’s main menu. AQtime will create a new project.
Once the project has been created, you can add modules to be profiled with it (EXE, DLL, OCX,
etc.).
© 2010 AutomatedQA Corp.
www.automatedqa.com/support
146
Profiling Applications With AQtime
•
By selecting File | New Project From Module from AQtime’s main menu. This will call the
Open File dialog, where you can select an executable file (EXE, DLL, OCX) which AQtime will
use to create the new project. Once you click Open in this dialog, AQtime will automatically
create a new project that will contain the module you have selected. This will be the main module
of the project. After you have created the project, you can add other modules to it.
To learn how to add modules to be profiled, see Selecting Applications and Modules to Profile.
To create a new project in AQtime integrated in Visual Studio:
•
Select File | New | Project from Visual Studio’s menu, press the New Project button on the Start
page or select AQtime | Add AQtime Project from Visual Studio's menu. This will call the New
Project dialog.
•
In the dialog:
•
Select AQtime Projects from the list on the left of the dialog and then click AQtime Project
on the right.
Specify the project name, location and solution.
Press OK.
Visual Studio will create a new AQtime project and display its contents in the Solution Explorer.
In Embarcadero RAD Studio, AQtime projects (.aqt files) are part of the AQtime project groups (.bdsproj
files), which are simply containers for several AQtime projects. Before creating a new AQtime project you
must first create and open an AQtime project group to which this project will belong.
To create a new AQtime project group:
•
Right-click somewhere in the Project Manager panel and select Add New Project from the
context menu, or select File | New | Other or Project | Add New Project from RAD Studio’s
menu. This will call the New Items dialog.
•
In the dialog, select Profiling from the list on the left of the dialog, click AQtime Project Group
on the right and click OK.
RAD Studio will create a new AQtime project group and display its contents in the Project Manager.
To create a new AQtime project in the opened AQtime project group:
•
Select File | New | Other from RAD Studio’s menu. This will call the New Items dialog.
•
In the dialog, select Profiling from the list on the left of the dialog, click AQtime Project Module
on the right and click OK.
RAD Studio will add a new AQtime project to the opened AQtime project group and display its contents in
the Project Manager.
Saving AQtime Projects
To save your new AQtime project, select File | Save from the main menu. This will open the standard Save
File dialog where you can specify the project file name. If you create a new project and do not save it, the
results and profiling configuration will be lost upon closing the project. However, after you have saved a
project to a file, the results and changes you make to the profiling configuration will be saved automatically
(AQtime saves them upon closing the project or after you select the File | Save menu item).
Opening Existing AQtime Projects
To open an existing project in AQtime standalone, select File | Open Project:
www.automatedqa.com
AQtime by AutomatedQA Corporation
TSetting Up a Profiling ProjectT
147
Upon selecting this menu item, AQtime will display the standard Open File dialog where you can select
the desired AQtime project file name. Once your project is open in AQtime, you can see a list of all object
modules and their routines in the left-hand pane of the Setup panel:
If you use AQtime integrated into Visual Studio, you can open an existing AQtime project in the same
manner as you open any other Visual Studio project: just select File | Open | Project\Solution:
© 2010 AutomatedQA Corp.
www.automatedqa.com/support
148
Profiling Applications With AQtime
This will call the standard Open File dialog where you can select the desired AQtime project file name.
After you open the project, you can see a list of all object modules and their routines in the left-hand pane of the
Setup panel:
If you use AQtime integrated into RAD Studio, you can open an existing AQtime project in the same
manner as you open any other RAD Studio project: just select File | Open Project:
www.automatedqa.com
AQtime by AutomatedQA Corporation
TSetting Up a Profiling ProjectT
149
This will call the standard Open File dialog where you can select the desired AQtime project file name.
After you open the project, you can see a list of all object modules and their routines in the left-hand pane of the
Setup panel:
© 2010 AutomatedQA Corp.
www.automatedqa.com/support
150
Profiling Applications With AQtime
Selecting Applications and Modules to Profile
Once you have created a new project, you can add modules (EXE, DLL, OCX, etc.) to profile the project
with. Once added, these modules are displayed in AQtime's Setup panel.
To add a new module to a project in AQtime standalone, select Add Module from the context menu of the
Setup panel or from the Setup toolbar, or from the Project menu and then select the desired file using the
subsequent Open File dialog. To add a .NET assembly registered in the Global Assembly Cache (GAC) to the
AQtime project, select Add Assembly from the context menu of the Setup panel or from the Setup toolbar, or
from the Project menu. This will call the Add Assembly dialog, where you can select the desired assemblies.
To add a web page whose script you want to profile, select Add URL from the context menu of the Setup
panel, from the Setup toolbar, or from the Project menu and enter the page address in the ensuing Add URL
dialog.
When creating an AQtime project by selecting the File | New Project From Module menu item, AQtime
automatically adds the specified executable module (EXE, DLL, OCX, etc.) to the project (see Creating and
Saving AQtime Projects).
If you use AQtime integrated into Visual Studio, then to add a new module to the project, select Add
Module from the context menu of the Setup panel or from the Setup toolbar; or right-click the project in the
Solution Explorer and select Add | Add Module from the context menu. To add a .NET assembly registered in
the Global Assembly Cache (GAC) to the AQtime project, select Add Assembly from the context menu of the
Setup panel or from the Setup toolbar; or right-click the project in the Solution Explorer and select Add | Add
Assembly from the context menu. This will call the Add Assembly dialog, where you can select the desired
assemblies. To add a web-page whose script you want to profile, select Add URL from the context menu of the
Setup panel, from the Setup toolbar, or from the context menu of the Solution Explorer and enter the page
address in the ensuing Add URL dialog.
If you use AQtime integrated into RAD Studio, then to add a new module to the project, select Add
Module from the context menu of the Setup panel or from the Setup toolbar; or right-click your AQtime
project in the Project Manager and select Add Module from the context menu. To add a .NET assembly
registered in the Global Assembly Cache (GAC) to the AQtime project, select Add Assembly from the context
menu of the Setup panel or from the Setup toolbar; or right-click your AQtime project in the Project Manager
and select Add Assembly from the context menu. This will call the Add Assembly dialog, where you can
select the desired assemblies. To add a web-page whose script you want to profile, select Add URL from the
context menu of the Setup panel, from the Setup toolbar, or from the context menu of the Project Manager and
enter the page address in the ensuing Add URL dialog.
Sometimes, AQtime profilers may need to use debug info files that are generated apart from the
executables. In this case, you need to add the paths to these modules to the project by using the Symbols
Options dialog. To learn how to do this, see Specifying Path to Debug Info Files.
An AQtime project can only contain 32-bit (x86) or 64-bit (x64) modules, but not both. The project
cannot contain modules with different “bitness”. This behavior is caused by a Windows limitation
that 32-bit modules can be loaded into a 32-bit process only and 64-bit modules can be loaded into
64-process only (you cannot load a 32-bit module to a 64-bit process). So, if you add a 64-bit module
to your AQtime project, you can continue adding 64-bit modules only. If you add a 32-bit module,
you can only add 32-bit modules. To change the “bitness” of the project, clear the modules list and
then add the desired modules.
You can add as many modules, from as many folders, as you wish. The module that was added to the
AQtime project first, will be the main module. This means that AQtime will launch this module when you start
profiling. Other modules are not started by AQtime; they will be loaded by the main module. You can change
the main module at any time by right-clicking the desired module and selecting
Set as Active Module from
the context menu. If the main module is a DLL or an OCX file, you have to specify a Host Application for your
www.automatedqa.com
AQtime by AutomatedQA Corporation
TSetting Up a Profiling ProjectT
151
project so that AQtime can start profiling. The host application can be set in the Run Parameters dialog. For
more information, see Specifying Parameters for the Profiled Application.
To remove a module from a project, right-click the module in the Modules pane and select Remove
Module from the context menu. You can also replace the module with a new one by right-clicking the module
and selecting Replace Module.
Specifying Path to Debug Info Files
Different compilers generate different types of debug information. For instance, a Visual C++ compiler
generates debug info in the PDB format and Delphi generates debug info in the TD32 format.
Depending on its type and the compiler settings, debug information can be compiled within an executable,
or it can be generated as a separate file (or files) that reside(s) at specific location relative to the executable.
This typically happens with debug information of the PDB format. The compiler places the .pdb file in a folder,
where the executable is located. However, in general, the debug info file can reside in any other folder or even
on another computer on a local network or on the Internet.
Some developers use this feature to save disk size needed for debugging applications on several
computers. When debugging these applications, the developers place debug info files in a folder and share this
folder on the local network or on the Web. The debugging tools that are running on other computers can access
this shared folder and obtain the debug information for the modules being debugged. This approach saves the
overall amount of disk space occupied by the application’s files and modules, since the debug info files are
stored in a shared location and are not copied to each workstation.
When you add an executable or DLL to your AQtime project, AQtime searches for the debug info file (or
files) in the default location, that is, in the folder where the compiler typically generates the debug info file. If
the debug info file resides in another location, AQtime will not be able to find it and will report that the
executable has no debug information.
AQtime includes the Symbols Options dialog where you can specify the location for the debug info files.
AQtime will search for the debug info files in the folders that are specified in the dialog.
In order for AQtime to be able to use this functionality, SymSrv.dll must be installed on your
computer. This DLL is deployed as part of Microsoft’s Debugging Tools for the Windows package.
You can download this package from Microsoft web site.
To specify the folder for the search:
●
Open the Symbols Options dialog. If you use AQtime standalone, then to do this:
Select Options | Options from AQtime’s main menu, Tools | Options from Visual
Studio’s menu or AQtime | Options from RAD Studio’s menu. This will open the
Options dialog.
Choose the Services | Symbols group in the tree view on the left of the Options dialog. If
you use AQtime integrated into Visual Studio, choose the AQtime | Services | Symbols
group in the dialog.
●
In the Symbols Path section of the dialog, press Add. AQtime will append a new blank line to the
Symbols Path list and activate an in-place editor.
●
Specify the desired folder in the in-place editor. You can type the folder name or press the ellipsis
button and choose the folder in the ensuing standard Browse for Folder dialog. Specify the
fully-qualified folder name, for instance, C:\MySources\Symbols or //MyServer/Symbols.
Project-relative paths are not supported.
© 2010 AutomatedQA Corp.
www.automatedqa.com/support
152
Profiling Applications With AQtime
You can also enter the URL (web folder) that holds the desired debug info file (for instance,
http://msdl.microsoft.com/download/symbols).
●
Make sure the check box for the added line is selected. AQtime will search for the files only in
those folders (or URLs), whose check box is selected in the dialog.
●
Press Move Up or Move Down to set the desired position of the line among other search paths
(AQtime will search for the files starting with the folders that are specified at the top of the list. If
the file is found, the other folders are not checked).
●
Press OK to save the changes.
If the debug info files are available via the Internet, then AQtime will download them to your computer and
save them to a temporary folder. The file will reside in this folder until you close AQtime. When you close it,
the files will be deleted. So, next time you launch AQtime, it will download the files again. To avoid this
repetitive downloading, you can specify the folder, in which the downloaded files will be stored, in the Cache
symbols directory edit box. If you specify a folder, AQtime will download the files to this folder and will use
these files during the next sessions. The files will remain in the folder until you remove them manually.
About Profiling Modes
AQtime can work in any of the following modes (the appropriate mode depends on the type of application
you are going to profile):
●
Normal - This is AQtime’s default mode, which is used to profile ordinary applications:
managed and unmanaged executables and libraries.
●
COM Server - This mode is used to profile COM servers of any type (in-process,
out-of-process, DCOM, COM+ or MTS). See Profiling COM Applications.
●
ASP.NET - This mode is used to profile ASP.NET applications and .NET Web services. See
Profiling ASP.NET Applications.
●
Service - This mode is used to profile Windows services. See Profiling Services. Note that this
mode is not intended for ASP.NET service profiling.
●
IIS - This mode is used to profile IIS applications and Web services created with unmanaged
compilers. See Profiling IIS Applications.
To select the desired mode, use the Profiling Mode list that is located on AQtime’s Standard toolbar (the
Profiling Mode list located on Visual Studio’s AQtime toolbar or the items of RAD Studio’s AQtime
Profiling Modes toolbar):
www.automatedqa.com
AQtime by AutomatedQA Corporation
TSetting Up a Profiling ProjectT
153
About Profiling Levels
AQtime profilers can analyze application code at three levels of detail: routine, line or class. The level of
profiling is specified by the Level property of the profiling area (see About Profiling Areas):
●
Routine and line level areas are supported by the Performance and Coverage profilers only:
If a routine was added to a routine level area, AQtime gathers information for the entire
routine. For example, the Performance profiler will trace how many times the routine was
called, how long it worked, etc.
If the routine was added to a line level area, AQtime gathers information for each line of
source code within it. For instance, for each source line, the Performance profiler will measure
execution time, Hit Count value, etc. If you add a class or module to the line level area, all
methods of this class or module will be profiled at line level.
Line profiling requires information about lines in source code. That is why to profile a .NET
application at the line level, you must compile it with debug information. Metadata is not
enough (See How AQtime Profilers Use Metadata and Debug Information for details).
●
The class level profiling areas are supported by the Allocation profiler only. The profiler tracks the
creation and deletion of objects whose class names were added to these areas. If you add a file or
module to a class level area, then AQtime will track all objects whose classes are declared in this file
or module.
Specifying Parameters for the Profiled Application
Once you have specified the profiling mode, you should set run parameters that correspond to the currently
chosen mode. Most of the time, you do not have to do this, because you are testing an EXE that takes no
parameters, or because you simply want to keep the existing settings. However, sometimes, you may need to
change the run settings. For example, to profile a dynamic link library, you need to specify the host application,
or you may need to specify the run-time arguments for an EXE.
© 2010 AutomatedQA Corp.
www.automatedqa.com/support
154
Profiling Applications With AQtime
Note: You can specify run parameters for all profiling modes, except for the Service mode.
To check or change the run parameters, use the Run Parameters dialog. To call the dialog, select Run |
Parameters from AQtime’s main menu (AQtime | Parameters form Visual Studio’s menu or AQtime |
Parameters from RAD Studio’s menu). The dialog appearance and the set of available parameters depends on
the currently selected profiling mode.
Selecting the Profiler
One AQtime "run" is one execution of the application under one profiler.
If you use AQtime as standalone application, the profiler to be run is set from the dropdown list on the
Standard toolbar, just to the right of the Run button:
The dropdown list is actually a treeview. Individual profilers are listed when you open a branch.
If you use AQtime integrated into Visual Studio, the profiler to be run is set from the Profiler dropdown
list in the AQtime menu:
www.automatedqa.com
AQtime by AutomatedQA Corporation
TSetting Up a Profiling ProjectT
155
If you use AQtime integrated into RAD Studio, the profiler to be run is set in the Current Profiler
submenu of the AQtime menu:
AQtime stores the current profiler selection in the project file (.aqt) when you close the project. Next time
you open your project in AQtime, the latter will automatically select the profiler, that was active when AQtime
was closed.
© 2010 AutomatedQA Corp.
www.automatedqa.com/support
156
Profiling Applications With AQtime
Controlling What to Profile
AQtime offers several ways of restricting which parts of an application must get profiled and when. This
section provides information about the main of them: profiling areas, triggers and actions. Besides that,
AQtime also includes special options that allow you to restrict profiling.
Note that all of the means of profiling restriction work in association with each other. In the end, what gets
profiled is what currently falls under no restriction of one kind or another.
Using Profiling Areas
About Profiling Areas
AQtime offers several ways of restricting which parts of an application must get profiled. Profiling areas
(with the associated checking), perhaps, are the most important of these means. Areas are collections of
elements to profile. Elements may be source files, classes or single routines. An element may be lodged in
more than one area. The reason for having several areas is that an area can be turned on or off by checking or
unchecking it. Each area represents, if you wish, a "typical profiling interest" for you. Each profile run can
take in one or several areas. (If it takes in none, it profiles nothing, unless it's using one of the entire-application
profilers listed above.)
Note: Some profilers can ignore areas and checking, for example, the Exception Tracer or a third-party
profiler. They always profile the entire project. The information provided in the following topics
only applies to the Performance, Coverage, Light Coverage, Allocation and Function Trace
profilers.
By default, an area is an including area - it adds elements to the profiling list. However, sometimes you
may want to include almost all the methods from a class, or might wish to include a namespace, but skip two
routines in it. You can always do this by adding the wanted elements one by one to an (including) area. But, for
convenience, you also have the option of adding the entire class or namespace to an Including area, and then
defining a special excluding area to prevent the profiling of the few sub-elements you wish to skip.
Code specified in the Including areas can be profiled at three levels of detail: class, routine and line.
Profiling areas of the class level are supported by the Allocation profiler only. These areas specify what classes
the profiler will track. Routine and line level areas are supported by the Performance and Coverage profilers.
Routine level means that AQtime gathers information per routine: how many times it was called, how long it
worked, and so on. Line level means profiling of source code lines within individual routines, classes or
namespaces included in the area (see About Profiling Levels). Class level areas can hold classes, files or
modules. Routine and line level areas can hold these elements as well as routines.
An area by itself does not define what you will profile, but what you might wish to profile. What will
actually get profiled in a given run, barring other restrictions, is only the checked elements within the checked
areas, barring their also being checked in an excluding area. For more information, see Checking Elements to
Profile.
Predefined Areas
The list of profiling areas is defined in the Areas pane of the Setup panel. Each project includes four
predefined areas:
•
Full Check - If it is checked, AQtime profiles all routines in all the modules of the current project.
www.automatedqa.com
AQtime by AutomatedQA Corporation
157
TControlling What to ProfileT
•
Profile Entire .NET Code - If this box is checked, AQtime profiles all managed modules in the
current project, as well as all other .NET assemblies that these modules use. This allows you, for
example, to profile functions from .NET Framework libraries. The Profile Entire .NET Code
check box overrides all the settings that exclude code from profiling (these settings are explained
in Excluding Code From Profiling). We would like to note once again that the Profile Entire .NET
Code setting affects only managed code.
•
Profile Entire Script Code - If it is checked, AQtime profiles all routines executed by Microsoft
Script Engine. That is, you can profile scripts launched by TestComplete, a web browser and other
applications that use this engine.
•
Profile Entire Java Code - If it is checked, AQtime profiles all routines executed by the Java
Virtual machine. That is, it profiles all the modules added to the current project, as well as the
modules of standard Java classes.
Like other profiling areas, predefined areas let you specify the level at which the code will be profiled:
routine, line or class. For instance, if you select Full Check by Lines, AQtime will profile all routines in all
modules of the current project at line level. Class level is supported by the Allocation profiler only. Routine
and line levels are supported by Performance and Coverage. For more information, see About Profiling Levels.
To disable the predefined area, simply uncheck the appropriate check boxes:
Though profiling all routines is quite convenient, you may not want to include all the application functions
in profiling tasks, for instance, to make the profiler run faster. Profiling a large amount of code at line level (for
example, when Full Check by Lines is selected) can significantly slow down the profiling speed. Therefore, we
recommend that you first profile large applications at routine level (for instance, using Full Check by
© 2010 AutomatedQA Corp.
www.automatedqa.com/support
158
Profiling Applications With AQtime
Routines). Once you have found problem classes and routines you can add them to a line-level profiling area.
That is, profiling areas let you narrow down the places of interest in the application.
Besides predefined areas, you can create custom profiling areas and add the needed elements to be profiled
to them. For more information about this, see Creating, Editing and Deleting Profiling Areas and Adding Code
to Areas.
Creating, Editing and Deleting Profiling Areas
Creating Profiling Areas
Profiling areas are defined in the Areas list of the Setup panel. By default, each project includes four
predefined areas. Besides that, you can create a new area and include some needed elements in it.
To create a new profiling area, use the Add Area dialog. To call the dialog, perform one of the following
actions:
•
Right-click somewhere within the Areas list and select Add area from the context menu.
•
Click
•
Select Add Selected to Setup | Add to New Area from the context menu of the Report panel.
•
If you use AQtime standalone, you can also call the dialog by selecting Project | Add Area from
AQtime's main menu.
Add Area on the Setup toolbar.
In the Add Area dialog, you can specify the following area properties:
•
In the Name field, specify the name of the area to be created.
•
In the Type section, choose the type of the area: Including or Excluding.
•
In the Level section, specify the profiling level: Class, Routine or Line.
Once you close the dialog, the new area will appear in the Areas list and it will be marked with the
appropriate icon:
- Including class level area
- Excluding class level area
- Including routine level area
- Excluding routine level area
- Including line level area
Areas that are not supported by the current profiler have grayed icons.
Once the area is created, you can add elements to it (see Adding Code to Areas). Note that you can add
elements even to those areas that are marked with grayed icons.
AQtime stores the profiling area settings in the project file (.aqt).
Editing Area Properties
To modify area properties, right-click the area and choose the Edit Area from the context menu or simply
double-click the area. AQtime will show the Edit Area dialog where you can edit the area name, type and
profiling level.
Deleting Profiling Areas
To delete an area from a project:
•
Right-click the area you want to delete and select Remove from the context menu.
•
AQtime will display a message box asking you if you want to delete the selected area. Click Yes to
delete the area, or No to cancel the deletion.
www.automatedqa.com
AQtime by AutomatedQA Corporation
159
TControlling What to ProfileT
Adding Code to Areas
You can add code to profiling areas in several ways:
•
The easiest way to to do this is to drag the needed elements from the Modules pane of the Setup
panel to the target area in the Areas pane. To do this, follow the steps below:
In the Modules pane, select the element to be added to the area.
The Modules pane displays a tree view of the entire application, any part of which you can
expand or contract. You can make a single or multi-selection in the view, using click,
Shift-and-drag or Ctrl-click. For example, you can select the entire namespace, then
unselect parts of it by Ctrl-clicking them off.
Drag the selected element from the tree view and drop it onto the target area in the Areas
pane.
--or-Right-click any of the selected elements and choose Add Selected to Area | <Area
name> or Add Selected to Area | Add to New Area from the context menu. When you
select Add to New Area, you are offered to create a new area by using the Add Area
dialog. Once the dialog is closed, AQtime creates the new area and adds the selected
elements to it.
•
Profiling under Visual Studio or RAD Studio provides a possibility to add elements to the area
directly from the Code Editor. AQtime adds the Profile submenu to the editor’s context menu. The
Profile submenu has the following items:
Profile <routine name> Routine - Starts profiling a routine under the cursor.
Profile <class name> Class - Starts profiling a class where the cursor is located in the
code.
Profile <file name> File - Starts profiling a source file displayed in the code editor.
When any of those items are chosen, AQtime creates or redefines the line area named Quick
profiling area and adds the chosen element to the profiling list and immediately runs the selected
profiler.
•
You can also add routines and classes to profiling areas from the Report panel. To learn how to do
this, see Adding Selected Routines and Classes to Profiling Areas, Triggers and Actions.
Some notes:
•
If you add a module or a class to an area, all routines in this module or class will be profiled at the
appropriate level.
•
Routines that belong to triggers or actions are treated as routines that are added to a profiling area.
They are profiled even if they belong to an excluding area. For more information, see About
Actions and About Triggers.
•
The Setup panel does not display classes that neither introduce new methods, not override existing
ones. This may happen even if a class introduces a new method, but this method is not called in the
application code: the compiler may not include the method in the application’s binary code during
optimization. However, profiling of such classes is possible if you enable the Full Check option.
AQtime will profile the methods of the ancestor class. For more information on profiling such
classes with the Allocation profiler, see a note in Allocation Profiler.
•
Make sure that when you profile a routine, part of its execution time will be spent calling other
routines, which we call “child” routines (it’s the calls that are child calls, actually). Unless the
child routines are part of the profiling area, you will not be able to narrow down your profiling to
© 2010 AutomatedQA Corp.
www.automatedqa.com/support
160
Profiling Applications With AQtime
find bottlenecks outside the main routine. Profiling results can discriminate between a routine’s
own execution time and its overall execution time, “with children”. But if you want to know about
the children themselves, they have to be added to the profiling area. See Profiling Child Routines
Along With Parents.
•
If you use AQtime integrated into RAD Studio, then when you start profiling with the
Run
With Profiling command, AQtime disables any custom areas and profiles the application with the
Full Check by Routines and Profile Entire .NET Code by Routines options. To profile within
custom areas use one of the following ways to start profiling:
Select Run menu item or click Run button on the Debug toolbar or press F9, while the
AQtime project is active in RAD Studio’s Project Manager.
Right-click the AQtime project in the Project Manager and select Run from the context
menu.
So, you can add elements at any time to any custom area. Elements can also be removed from the area at
any time. They can be dragged away from the area and dropped onto the left-hand pane. More conveniently,
you can uncheck the elements you wish to remove and then use the Remove Unchecked Elements context
menu item. Alternatively, you can check only the elements to be removed and use Remove Checked
Elements.
Also, you can move elements between areas by dragging the elements from one area and dropping onto
another area.
Remember that you do not have to use an area as-is. The point of adding or removing elements is to create
a “stored definition”, which you can later trim simply by unchecking elements. It is perfectly reasonable to run
a profiler on an entire area, then begin unchecking elements for each successive run, as you eliminate the
uninteresting parts. See Checking Elements to Profile.
AQtime stores the profiling area settings in the project file (.aqt).
Checking Elements to Profile
Areas are collections of elements (namespaces, classes or routines) which you keep together because you
might want to profile them. In other words, the Areas list is a repository of profileable elements grouped into
collections called areas, and an element may belong to more than one collection.
Normally, as you start profiling an application, you use profilers over broad areas. Once you know what
you want needs to be tracked, you may run profilers over smaller areas (to make the profiling faster). In an
ordinary profile test, the pattern is that, from run to run, you set areas so as to profile less and less.
You can temporarily remove any element from profiling by unchecking it individually. During any run,
only the elements you have checked will be profiled. If no elements are checked, no profiling will occur.
First, let’s consider how to uncheck (check) the needed element from an including area:
•
Expand an area in the tree view of the Areas pane. You will see the elements you put in this area.
•
Clear (enable) the check box next to the element you want to uncheck.
–or–
Right-click the element you want to uncheck and choose Uncheck Selected (Check Selected)
from the context menu.
You can also use the common multi-select commands (Shift-drag and Ctrl-click) to select a larger
number of elements at once and then use the context menu's command.
You can also exclude (include) the whole area from profiling in the same way. The check box next to the
area indicates whether the area is included in the profiling or not.
www.automatedqa.com
AQtime by AutomatedQA Corporation
TControlling What to ProfileT
161
Note: Once you begin a new profiling session, remember to open the areas you have checked, so
that you can see what elements are currently checked or unchecked within them. If you check
an area, only the currently checked elements in it will be profiled. If an area is not checked,
then none of its elements appear checked. Checked elements only show up once the area has
been checked.
All of the above is meant for the normal, including, areas. The elements of excluding areas only become
excluded if their area is checked, and they themselves are checked. Normally, you will simply check any
excluding area when you check the including area for which it holds exceptions.
If you use AQtime integrated into RAD Studio, keep in mind that if you start profiling with the
Run
With Profiling command, AQtime will ignore the profiling areas and profile the application with the default
Full Check by Routines, Profile Entire .NET Code by Routines and Profile Entire Java Code by Routines
settings. To profile with areas, use one of the following to start profiling:
•
Select Run menu item or click Run button on the Debug toolbar or press F9, while the AQtime
project is active in RAD Studio’s Project Manager.
•
Right-click the AQtime project in the Project Manager and select Run from the context menu.
Using Triggers
What Are Triggers?
AQtime offers several means of restricting what parts of an application get profiled. Triggers provide a
crucial means to fine-tune exclusions, but they work in association with the other means. In the end, what gets
profiled is what currently falls under no restriction of one kind or another. See Choosing What to Profile and
When for full details.
Triggers are an AQtime facility allowing for better control of profiling under the Performance, Coverage
and Function Trace profilers. The purpose of triggers is to allow profiling to come on when certain routines
(on-triggers, see below) are executing (including during their calls to “child” routines), or on the contrary to be
turned off (off-triggers, see below). Do not confuse triggers with areas, the purpose of using them differs. With
areas and checking, you set what you never want profiled during the current run (that is, everything but the
checked elements). With triggers and Initial Status, you set in what part of the execution path you want to
enable profiling, or to disable it.
© 2010 AutomatedQA Corp.
www.automatedqa.com/support
162
Profiling Applications With AQtime
The list of triggers are defined in the Triggers and Actions pane of the Setup panel and include three
linked settings: on-triggers, off-triggers and Initial profiling status for Threads.
Initial Profiling Status for Threads is one default trigger displayed at the top of the Triggers list. It sets the
profiling status at the beginning of threads, before any other triggers click it (after that, it has no effect). Initial
profiling status can be set on (profiling allowed until an off-trigger operates) or off (no profiling until an
on-trigger operates).
Other triggers in the list are collections of potential trigger routines of one type, either on- or off-.
Besides the trigger type, you can also specify additional options for triggers:
•
Except for the Initial Status trigger, each trigger can be tuned regarding after how many calls a
trigger will start operating, and then for how many calls (after which it will become inoperative).
These two options are themselves affected by another option - is the call count taken over all
threads, or over each thread individually? This yes-no option, which sets the meaning of the ones
explained below, is For All Threads. Remember that, whether or not calls are counted over all
threads, triggers only act on their own thread.
•
The Pass Count option allows the trigger routine or routines to be called a certain number of times
before they act as triggers. For instance, this lets you skip the startup phase of your application.
Pass Count 3 means “only act as trigger on the fourth call”. By default Pass Count is 0 and
operates from the first call.
•
The Work Count option then sets how many consecutive calls will act on the trigger (to allow
profiling or to disallow it), before the trigger stops acting again. This is a way to limit the amount
of data gathered at the point where it just repeats what’s known. 0 is again the default, but here it
does not mean “never activate”, it means “stay activated to end of run”.
•
Finally, the Cycling yes-no option (default no) sets whether the pass-count-work-count cycle will
repeat after work count + 1 is reached and the trigger is deactivated. A cycling trigger is a way to
sample application behavior through various phases without amassing data for every single call.
www.automatedqa.com
AQtime by AutomatedQA Corporation
163
TControlling What to ProfileT
For more information on how to create triggers and how to set their options, see Creating, Editing and
Deleting Triggers.
No triggers operate at all unless at least one collection is checked. And in the collection only those triggers
operate which are checked also. The mechanism of checking triggers on or off is identical to that of checking
elements of profiling areas. For details, see Checking Elements to Profile.
Some notes about triggers:
•
A “trigger” collection is defined as holding on- or off- triggers (one type per collection), not just
triggers.
•
Of all means of selecting what to profile, triggers are the only one that can select on a thread basis.
•
Triggers work in conjunction with the other means of selecting what to profile. Execution is
actually profiled only when all means say “yes”. For example, no matter what triggers and Initial
Status may decree, nothing will get profiled if it is not checked in the areas section. For more
information, see Controlling What to Profile.
•
If, for instance, one element of a trigger is a namespace and you check it, then each single routine
in that namespace becomes a trigger. Uncheck it and no routine in the namespace acts as a trigger,
unless it also belongs to another checked collection, and it is checked in there. In other words, you
should be more conservative when including elements in triggers than when including them in
areas. After a certain point, more triggers simply mean more confusion, when the whole purpose
of triggers is to clarify the profiling results.
•
AQtime treats routines added to a trigger as routines added to a profiling area. This is not
dependent on the trigger type (on or off). The profiling level depends on whether the routine
belongs to a profiling area:
If the routine is not added to any profiling area, it will be profiled at routine level.
If the routine belongs to a line-level or routine-level area, it will be profiled at line level or
routine level correspondingly.
If the routine belongs to an excluded area, it will still be profiled at routine level. That is,
trigger routines cannot be excluded from profiling.
How Triggers Work
Technically, what triggers do is very simple to explain:
•
For any given thread, at any given moment, profiling status is “enabled” or “disabled”. Profiling
actually operates in a thread if, one, status for that thread is “enabled” and, two, nothing else
excludes the current routine from profiling.
•
The
Enable/Disable Profiling button (the AQtime | Enable/Disable Profiling menu item in
Visual Studio or in RAD Studio) is an onscreen way of controlling profiling status by hand while
the application runs. If it is pressed-in ( ), profiling status is as set otherwise. When you unclick it
( ), profiling is turned off for all threads. When you press it back in, you re-enable profiling,
according to whatever is otherwise set for the application at that point (not as it was when you
disabled it).
•
If there are triggers of any kind, the Initial Profiling Status for Threads option specifies whether
the profiling on or off on the creation of each new thread. In other words, Initial Profiling Status
defines whether profiling is enabled or not before any trigger in a thread starts executing. After
that, it has no effect. Likewise if there are no triggers at all.
•
When an on-trigger routine begins executing, it saves the current profiling status for its thread and
enables profiling for that thread. This still applies to everything it calls. When it reaches the end of
© 2010 AutomatedQA Corp.
www.automatedqa.com/support
164
Profiling Applications With AQtime
its execution (after perhaps hundreds of calls, sub-calls and sub-sub-calls), it restores the thread’s
profiling status as it found it.
•
When an off-trigger routine begins executing, it saves the current profiling status for its thread
and turns profiling off for that thread. When it reaches the end of its execution, it restores the
thread’s profiling status as it found it.
Suppose, Proc_B is an off-trigger routine, profiling is currently enabled and either Full Check by
Routines, or Full Check by Lines is used:
Proc_A;
Proc_B // off-trigger routine
Proc_D; // Proc_D and Proc_E are child routines of Proc_B,
Proc_E; // that is, they are called within Proc_B.
// Proc_D and Proc_E are not profiled.
Proc_C;
As profiling is enabled and Full Check is on, AQtime profiles Proc_A. When the application enters
Proc_B, profiling is disabled for that thread. So Proc_D and Proc_E are not profiled. When Proc_B exits,
AQtime restores the profiling status as it was -- enabled -- so Proc_C is profiled.
Run
If you use AQtime integrated into RAD Studio, keep in mind that if you start profiling with the
With Profiling command, AQtime will ignore triggers and profile the application with the default settings. To
profile with triggers, use one of the following to start profiling:
•
Select Run menu item or click Run button on the Debug toolbar or press F9, while the AQtime
project is active in RAD Studio’s Project Manager.
•
Right-click the AQtime project in the Project Manager and select Run from the context menu.
Creating, Editing and Deleting Triggers
Creating Triggers
Triggers are defined and controlled in the Triggers and Actions pane of the Setup panel. By default, this
panel includes one predefined trigger, Initial Profiling Status for Threads. This trigger can be used to control
profiling by itself as well as in conjunction with other triggers.
You can create a new trigger by using the Add Trigger dialog. To call the dialog, perform one of the
following actions:
•
Select Add Trigger from the context menu of the Setup panel.
•
Click
•
If you use AQtime standalone, select Project | Add Trigger from AQtime’s main menu.
Add Trigger on the Setup toolbar.
In the Add Trigger dialog, you can specify the following trigger properties and options:
•
In the Name field, specify the name of the trigger to be created.
•
In the Type section, choose the type of the trigger: On or Off.
•
In the Pass Count field, specify how many times the trigger routines will be called before they act
as triggers.
•
In the Work Count field, specify how many consecutive calls will act on the trigger, before the
trigger stops acting again.
•
Select the Cycling check box to specify whether the pass-count-work-count cycle will be repeated
after the work count + 1 is reached and the trigger is deactivated.
www.automatedqa.com
AQtime by AutomatedQA Corporation
165
TControlling What to ProfileT
•
Using For All Threads, specify whether the call count is taken over all threads or over each thread
individually.
Once you close the dialog, the new trigger will appear in the Triggers and Actions pane, and it will be
marked with an appropriate icon:
- On-trigger
- Off-trigger
Adding Elements to Triggers
Once the trigger is created, you can add elements to it in the same way as you would add them to an area
(by dragging them from the Modules pane to the target trigger or by right-clicking the needed elements and
choosing the Add Selected to Trigger item from the context menu). For more information, see Adding Code
to Areas.
Editing Trigger Settings
To modify trigger settings, right-click the trigger and choose Edit Trigger from the context menu or
simply double-click the trigger. AQtime will show the Edit Trigger dialog where you can edit the trigger
name, type and other options.
AQtime stores the trigger settings in the project file (.aqt).
Deleting Triggers
To delete a trigger:
•
Right-click the trigger you want to delete and select Remove from the context menu.
•
AQtime will display a message box asking you if you want to delete the selected trigger. Click Yes
to delete the trigger, or No to cancel the deletion.
Using Actions
About Actions
An action is a routine, at the beginning or end of which AQtime performs specific actions: switching the
profiling status on or off or getting profiling results. Actions are very similar to triggers in the sense that they
allow you to switch the profiling status during the profiler run. However, actions function a bit differently than
triggers:
First of all, actions do not save and restore profiling status for the thread. That is, actions do not restore the
profiling status for the thread after the action routine is over. When the trigger routine is over, AQtime restores
the profiling status for the thread where the trigger executed.
Unlike triggers, which change the profiling status at the beginning of a trigger routine, actions can run
either at the beginning or at the end of a routine.
One of the features that make actions great is the ability to command AQtime to get profiling results during
the profiling run. Without actions, you can obtain profiling results only by selecting Run | Get Results from
AQtime's main menu (by selecting AQtime | Get Results from Visual Studio’s main menu or from RAD
Studio’s main menu) or when the profiled process is over. Since, two profiler runs always differ from each
other, actions provides automatic result generation at the exact moments when it is needed.
Note: Currently, actions are only supported by the Performance, Coverage and Function Trace
profilers.
© 2010 AutomatedQA Corp.
www.automatedqa.com/support
166
Profiling Applications With AQtime
The list of actions is defined in the Triggers and Actions pane of the Setup panel.
For each action in the list, you can specify what operation the action performs by using the Action Type
property and when AQtime will execute the action (at the beginning or at the end of the action routines) by
using the Execute Type property. To learn how to create actions and specify their properties, see Creating,
Editing and Deleting Actions.
No action is performed unless it is checked. In the action collection, there will be processed only those
elements which are checked as well. The mechanism of enabling/disabling actions is identical to that of
checking elements of profiling areas. For details, see Checking Elements to Profile.
Note: Routines that belong to actions are treated as routines that are added to a profiling area. They
are profiled even if they belong to an excluding area.
If you use AQtime integrated into RAD Studio, keep in mind that if you start profiling with the
Run
With Profiling command, AQtime will ignore actions. To profile with actions, use one of the following to start
profiling:
•
Select Run menu item or click Run button on the Debug toolbar or press F9, while the AQtime
project is active in RAD Studio’s Project Manager.
•
Right-click the AQtime project in the Project Manager and select Run from the context menu.
Creating, Editing and Deleting Actions
Creating Actions
The list of existing actions is displayed in the Triggers and Actions pane of the Setup panel. To create a
new action, use the Add Action dialog. To call the dialog, perform one of the following steps:
•
Select
•
Right-click an action in the Setup panel and then choose Edit from the context menu.
Add Action from the context menu of the Setup panel or from the Setup toolbar.
www.automatedqa.com
AQtime by AutomatedQA Corporation
167
TControlling What to ProfileT
•
If you use AQtime standalone, you can also call the dialog by selecting Project | Add Actions
from AQtime's main menu.
In the Add Action dialog, you can specify the following action properties:
•
In the Name field, specify the name of the action to be created.
•
In the Action Type section, specify an operation to be performed by the action: Enable Profiling,
Disable Profiling, Get Results or Clear Results.
•
In the Execute Type field, specify when the action will be performed: On Enter or On Exit.
Once you close the dialog, the newly created action will be displayed in the Triggers and Actions pane and
will be marked with an appropriate icon:
Actions executed upon entering the routine
Actions executed upon exiting the routine
- "Enable Profiling" action
- "Enable Profiling" action
- "Disable Profiling" action
- "Disable Profiling" action
- "Get Results" action
- "Get Results" action
- "Clear Results" action
- "Clear Results" action
Adding Elements to Actions
Once you have created an action, you can add routines, classes, a namespace and modules to it. You can do
this in the same manner as you add elements to profiling areas and triggers: by dragging the needed elements
from the tree view on the right of the Setup panel to the needed action. See also Adding Code to Areas and
Creating, Editing and Deleting Triggers. You can also select the needed element in the tree view (you can use
SHIFT and CTRL for multiselection) and then choose Add Selected to Action | <action_name> from the
context menu.
Some notes about adding elements to actions:
•
If you add a class, namespace or module to an action, every single routine in this class, namespace
or module will function as an action.
•
Adding a routine to an action is an analogue to adding a routine to a profiling area and profiling it
with trigger settings that correspond to the action type. Below, are two examples:
Suppose that you have added a routine to an action of the Enable Profiling type (an
analogue to an on-trigger), the action is performed upon entering the routine, and the
routine is added to a routine-level area. In this case, AQtime will profile the routine at the
routine level, and you will see the routine results in the Report panel.
If the routine was added to a line-level area, AQtime would profile it at the line level. If the
routine was not added to any area, AQtime would profile it at the routine level.
Furthermore, if the action has the described settings, AQtime will profile the routine even
if it is added to an excluding profiling area.
In the second scenerio, suppose that you have added a routine to the action of the Disable
Profiling type (an analogue to an off-trigger), and the action is performed upon entering
the routine. Regardless of whether the routine is added to any profiling area, the routine
will not be profiled as AQtime disables profiling when the routine starts being executed.
In other words, adding a routine to an action ignores the “area” settings for the routine, but does
not ignore the “trigger” settings.
Modifying Action Properties
© 2010 AutomatedQA Corp.
www.automatedqa.com/support
168
Profiling Applications With AQtime
To check or change properties of an existing action, right-click this action in the Setup panel and select
Edit from the context menu. This will call the Edit Action dialog where you can modify action properties.
The action settings are stored in the AQtime project file (.aqt).
Deleting Actions
To delete an action:
•
Right-click the action you want to delete and select Remove from the context menu.
•
AQtime will display a message box asking you if you want to delete the selected action. Click Yes
to delete the action, or No to cancel the deletion.
Excluding Code From Profiling
The object of this topic is the means of excluding files or functions that you will "never" want to profile,
either in any application, or in the current project. In other words, we are talking about exclusions that are
global AQtime settings, or entire-project settings. More-controlled exclusions are better defined through the
profiling areas facility.
Ignoring Standard Source Files
Many development environments include a number of their libraries in your application. For example,
Borland Delphi IDE typically embeds System, Classes, Controls and other units. Generally, the source
code of these libraries cannot be modified, so their performance cannot be improved. Therefore, you should
focus only on those elements that you can change. To filter out modules provided by standard libraries, you can
Exclude
use AQtime’s Exclude standard source files option. The option can also be enabled via the
Standard Source Files button located on the Setup panel.
Ignoring Specific Source Files
There are files you may wish to profile, but you also want to skip some of large functions which clog up
profiling results and which you do not normally want or need to profile. To specify the files to be excluded
from the profiling, use the Files to Ignore dialog. Files specified in this dialog will be ignored in all projects.
There are moments when you may want the settings made in the dialog not to be so restrictive. Instead of trying
to undo and redo them, you can use the Bypass ignore settings option, which is normally off, but can easily be
turned on -- and then back off to restore the normal behavior. If you choose Ignore for a serious project, make
sure that you enable other means of restricting what to profile. See Controlling What to Profile.
You can also define files to exclude from the current project only. This is done through the Files to Ignore
item of the Project menu (see Files to Ignore for Project Dialog).
Ignoring Specific Routines
Sometimes, you may need to exclude specific routines from the profiling. You can do this using the
Routines to Ignore dialog. Routines specified in this dialog will be ignored in all projects. There are moments
when you may want the settings made in the dialog not to be so restrictive. Instead of trying to undo and redo
them, you can use the Bypass ignore settings option, which is normally off, but can easily be turned on -- and
then back off to restore the normal behavior. If you choose Ignore for a serious project, make sure that you
enable other means of restricting what to profile. See Controlling What to Profile.
Ignoring Routines With no Source Info
www.automatedqa.com
AQtime by AutomatedQA Corporation
Running a Profiling Session
169
One more way to exclude files from profiling is to use the Exclude routines with no source info option. The
debug information may not hold information about source files for some routines. If this option is enabled,
these types of routines become “invisible” to AQtime services. They are excluded from profiling, they are not
shown in the Setup panel, and so on.
There are some cases when the excluding settings are ignored:
•
A routine that is added to an action or trigger is treated as a routine that is added to a profiling area.
These routines are not profiled if profiling is off during the routines’ execution. For more
information, see About Actions and About Triggers.
•
All your settings that exclude managed code from profiling are ignored, if the Profile Entire .NET
Code box is checked in the Setup panel. Therefore, if you add a managed routine to the Routines
to Ignore dialog and Profile Entire .NET Code is checked, the routine will still be available for
profiling. More information about the Profile Entire .NET Code box you will find at one of the
next steps.
Running a Profiling Session
Optimizing the Profiling Process
Below you will find some tips for getting the most out of a profile cycle in AQtime, with the least amount
of wasted effort:
•
Do not assume a function has “no problems”. The profilers are there to give you a health report;
use them. Known problems may have unexpected roots.
•
Even a small, quick function can impair performance if it is called extensively. Always check the
Hit Count for anomalies. Are there errant hit counts, for instance where a very common piece of
code makes a needless call? If they are not errant, can the very high hit counts be decreased by
tuning your algorithms?
•
Restrict you profiling areas when you can. The profilers need time to gather information about the
sections they are set to analyze (areas). They may take more time while profiling the actual
execution. The more precise your area specification, the faster the profiling. Remember that an
application includes a lot of code that will never need to be profiled. For instance, user interface
code normally does little but wait on the user. See the Controlling What to Profile help topic.
•
Long functions can be difficult to profile. One way around this is to break them down into several
sub-functions for profiling purposes (You will probably find that the code is also clearer once
broken down, and easier to analyze).
•
No real-world execution of an application is identical to another. For instance, it is impossible to
predict and control how many times the CPU updates its caches. So that from one run to the next,
you should expect some inconsistency in results. Where you need high-precision results, keep a
very detailed record of how the test was run.
•
To help achieve consistent test results, reduce the number of processes running on your machine
during profiling.
Starting and Stopping Profiling
© 2010 AutomatedQA Corp.
www.automatedqa.com/support
170
Profiling Applications With AQtime
Once you have set up an AQtime project, specified the application you want to profile and selected the
desired profiler, you can start a profiling session. During profiling, you run operations in your application (for
instance, those where you suspect a bottleneck) and AQtime captures profiling information for them. You can
end profiling by closing the application and then analyze the profiling results.
To start profiling
Before you start profiling, you should perform several checks. For more information, see Starting a
Profiler Run.
•
•
Do any of the following:
Press the
Select Run | Run from the main menu of AQtime.
Press F5 (the shortcut can be changed via the Customize Keyboard dialog).
Select AQtime | Run With Profiling from the main menu of Embarcadero RAD Studio.
Click the Run button on the Debug toolbar or select the Run | Run menu item while one of
AQtime’s panels is active or selected in the Project Manager.
Run button on the Standard toolbar.
If the Show <profiler name> settings option is selected, the Run Settings dialog will appear.
In the dialog, specify the profiling settings and click Run.
Your application is launched (if needed) and AQtime starts profiling.
To start profiling an already running application
If the application that you want to profile is already running, you can start profiling it by attaching to its
process. For more information, see the Attaching to Process help topic. Note that static profilers (that is,
profilers that analyze applications without running them) do not support the “attach-to-process” feature.
To stop profiling
AQtime automatically finishes the profiling session and generates results when you exit the application
being profiled. This is the preferred way of ending the profiling session.
You can also stop profiling by doing any of the following:
•
Click the
•
Select Run | Terminate from the main menu of AQtime.
•
Press Shift+F5 (the shortcut can be changed via the Customize Keyboard dialog).
•
Select AQtime | Terminate from RAD Studio’s main menu (if you use AQtime integrated to
Embarcadero RAD Studio).
Terminate button on the Standard toolbar.
AQtime will end the profiling session and close the profiled application (regardless of whether it was
launched from AQtime or you attached AQtime to it).
AQtime does not automatically generate profiling results when you use the Terminate command. To
collect results before terminating the profiling session, use the Get Results command. See the
Getting Results During Profiling help topic.
Attaching to Process
Once you press the Run button to start profiling, AQtime launches your application, instruments it
(prepares it for profiling) and then starts collecting statistics on the applications execution. Though almost all
applications can be started under AQtime, doing this can be a non-trivial task for some types of applications.
www.automatedqa.com
AQtime by AutomatedQA Corporation
Running a Profiling Session
171
AQtime offers the “Attach to Process” feature that makes things easier. Profiling with this feature means
that the profiled application is not started using AQtime: AQtime can connect to the application and instrument
it on the fly. This feature is supported by the following profilers:
•
Performance Profiler
•
Allocation Profiler
•
Resource Profiler
•
Coverage Profiler
•
Exception Trace Profiler
•
Function Trace Profiler
•
Load Library Tracer
Important notes:
•
AQtime cannot attach to a process that is running under another debugger, for instance, a process
which is running under Microsoft Visual Studio.
•
If you attach to a .NET or Java application, AQtime will not analyze managed code in this
application; only unmanaged code will be profiled. For example, by attaching a profiler to a
managed application, you can profile native-code DLLs used by that application.
Profiling with the “Attach to Process” feature does not differ much from ordinary profiling. Below is a
step-by-step explanation of how to profile an executable using this feature. Two notes before we proceed:
1. Compile the application with the debug information (see Preparing Applications for Profiling).
2. Open the application in AQtime.
3. Switch to the Setup panel and select areas and triggers for profiling (see the 3. Choosing What to
Profile and When help topic).
4. Select
Normal from the Profiling Mode dropdown list box on AQtime’s Standard toolbar. If
you use AQtime integrated into Microsoft Visual Studio, this item is located on Visual Studio’s
AQtime toolbar. If you use AQtime integrated into Embarcadero RAD Studio, this item is located
on RAD Studio’s AQtime Profiling Modes toolbar. This is necessary because the Attach to
Process feature only works in the Normal mode.
5. Select the desired profiler.
6. Run the application outside AQtime.
If you use AQtime standalone, select Run | Attach to Process from AQtime main menu or press
Attach to Process button on the Standard toolbar. (If the selected profiler does not support the “Attach to
Process” feature, this button is disabled).
If you use AQtime integrated into Microsoft Visual Studio: select AQtime | Attach from Visual Studio’s
main menu. (If the selected profiler does not support the “Attach to Process” feature, this item is disabled).
Attach to Process
If you use AQtime integrated into Embarcadero RAD Studio: click the
button. (If the selected profiler does not support the “Attach to Process” feature, this button is
disabled). Note that this button does not reside on any toolbar by default. However, you can add
the button to any RAD Studio’s toolbar via the Toolbar Customization dialog. In this dialog,
© 2010 AutomatedQA Corp.
www.automatedqa.com/support
172
Profiling Applications With AQtime
switch to the Commands page, select the Run.AQtime category in the Categories list, drag the
Attach to Process command from the Commands list and drop it on the needed toolbar.
Upon selecting the item, the following dialog will appear:
7. The dialog holds a list of all of the processes that exist in the operating system at the moment. By
default, system processes are hidden. To make them visible, check the Show system processes
box. For instance, if you are profiling an IIS application (IIS applications are DLLs), you should
check this box, because normally the IIS process is running under the system account.
Note once again that AQtime cannot attach to a process that is running under a debugger. Such
processes are grayed out in the dialog. The explanation why AQtime cannot attach to a process is
shown in the Information column of the dialog.
If you are profiling a dynamic link library, you should attach to the process that uses it. To attach
to the desired process, select it in the list and press OK.
If you attach to a managed process, AQtime will display a message informing you that managed
code will not be profiled (see the note about this above). The reason for attaching in this case is to
profile unmanaged DLL(s) loaded by that managed process.
If the desired process is not running, you should start it, then return to the dialog and press the
Refresh button or F5 on the keyboard to update the process list. When the process is displayed in
the list, you can attach to it. The Cancel button will cancel profiling.
8. Upon pressing OK, AQtime injects its DLL into the process address space and then starts
instrumenting the profiled module. If the profiler’s option Show uninstrumented routines | In the
dialog is on, then AQtime displays the Uninstrumented Routines dialog explaining why certain
routines cannot be profiled. To start profiling, press OK in the dialog.
Now you can profile the application as your needs dictate.
The profiling starts after the instrumentation finishes.
Important: all calls to functions (lines) that occurred before instrumentation will not be profiled
and will not be included in the profiling results. For instance, a trigger will not affect profiling, if it
www.automatedqa.com
AQtime by AutomatedQA Corporation
173
Running a Profiling Session
is started while this trigger is running. In addition, a routine that was called before or during the
profiling start will not be shown in the Parent and Children tables of the Details panel.
Note: In 64-bit versions of Windows, 32-bit modules can be loaded into 32-bit processes
only and 64-bit modules can be loaded into 64-bit processes only. So, if the “bitness”
of your module does not match the “bitness” of the process, to which the module is
loaded, AQtime will not start profiling.
To obtain the profiler results, select Run | Get Results menu item (if you use AQtime standalone) or
select AQtime | Get Results menu item (if you use AQtime integrated into Microsoft Visual Studio
or into Embarcadero RAD Studio). An alternative way to obtain profiling results is to create an action
for this. See the Getting Results During Profiling help topic for more information. Results are also
generated when the process, to which you attached, finishes.
Pausing and Resuming Profiling
While profiling applications with AQtime, you can temporarily pause the profiling process and resume it at
a later time.
Note: Static profilers (those that do not launch the profiled application) cannot be paused and resumed.
To pause profiling
To pause profiling, do any of the following:
•
Press the
•
Select Run | Pause from the main menu of AQtime.
Pause button on AQtime’s Standard toolbar.
To pause profiling, click the Pause button on the Debug toolbar.
AQtime will pause the profiling session. The application execution will be suspended as well.
If you want to pause profiling without suspending the application execution, use the Enable/Disable
Profiling feature. For more information, see the Enabling and Disabling Profiling help topic.
To resume profiling
To resume the suspended profiling session, do any of the following:
•
Press the
•
Select Run | Resume from the main menu of AQtime.
•
Press F5 (the shortcut can be changed via the Customize Keyboard dialog).
Resume button on AQtime’s Standard toolbar.
To resume the suspended profiling session, select AQtime | Resume from the main menu of Embarcadero
RAD Studio.
AQtime will resume the application execution and the profiling process.
Enabling and Disabling Profiling
AQtime allows you to control the process of collecting profiling information during profiling sessions.
You can temporarily disable collecting data at any point during the application run and enable it at a later time.
For example, you can start a profiling session with profiling disabled and enable profiling right before the
© 2010 AutomatedQA Corp.
www.automatedqa.com/support
174
Profiling Applications With AQtime
application’s potential hotspots. This way you can reduce the amount of profiling results collected and only
collect information on the application operations you are interested in. You can also disable profiling after
having captured the results in order to analyze them while your application continues running.
Note that when you disable profiling, your application continues running. If you want to suspend both the
profiling session and the application execution, you should pause the profiling session. See the Pausing and
Resuming Profiling help topic.
To start a profiling session with profiling disabled
•
Press the
•
Select AQtime | Disable Profiling from the main menu of Embarcadero RAD Studio.
•
Start a profiler run, as described in Starting and Stopping Profiling.
Enable/Disable Profiling button on the Standard toolbar, so that it turns into
.
Your application will be started with profiling turned off. You can turn profiling on by toggling the
Enable/Disable Profiling setting as described below.
To disable profiling
To temporarily disable collecting profiling data, do any of the following:
•
Press the
•
Select Run | Disable Profiling in AQtime’s main menu.
Enable/Disable Profiling button on the Standard toolbar, so that it turns into
.
To temporarily disable collecting profiling data, select AQtime | Disable Profiling from the main menu of
Embarcadero RAD Studio.
Your profiled application will continue running, but AQtime will not collect profiling information from it.
To enable profiling
To turn on profiling, do one of the following:
•
Press the
•
Select Run | Enable Profiling in AQtime’s main menu.
Enable/Disable Profiling button on the Standard toolbar.
To turn on profiling, select AQtime | Enable Profiling from the main menu of Embarcadero RAD Studio.
AQtime will resume collecting profiling information from the application. It will add it to the previously
collected results.
Enable/Disable Profiling button, you can set up triggers and actions to
In addition to using the
automatically pause and resume profiling when a specific function is called in your application. You can also
control profiling activities directly from your application’s code by using the AQtime profiling API. For more
information, see the Controlling Profiling From Application Code help topic.
Collecting Results During Profiling
AQtime automatically generates profiling results when you exit the application. It is also possible to
capture results at any time during the profiling session. For example, you can capture results before and after a
specific hotspot and then compare them to understand what might cause a bottleneck.
Getting Results During Profiling
www.automatedqa.com
AQtime by AutomatedQA Corporation
175
Running a Profiling Session
AQtime normally generates results once the profiled application has ended its run. When profiling a
dynamic link library, this means results are generated when the host application exits.
However, you might be profiling an application that does not stop until the system shuts down (for
example, a Windows service), or you may wish to obtain results without closing the running application (for
instance, the host for a dll).
You can command AQtime to generate results by using the Get Results menu item, by using specific
actions, or by controlling AQtime from your application. This topic describes all of these ways and also
provides a brief overview of the Clear Results feature.
Get Results Menu Item
To command AQtime to generate profiling results, follow the steps:
1. If you use AQtime standalone, select the Run | Get Results item from AQtime’s main menu or
press
Get Results on the Standard toolbar.
2. If you use AQtime integrated into Microsoft Visual Studio, select the AQtime | Get Results item
from Visual Studio’s main menu or press
Get Results on the AQtime toolbar.
3. If you use AQtime integrated into Embarcadero RAD Studio, select AQtime | Get Results from
RAD Studio’s main menu.
Results will be generated as if the profiled application had terminated.
Using Specific Actions
By using AQtime actions you can configure the profiler run so that AQtime will perform the following
specific operations upon entering or exiting a routine:
So, you can create an action of the Get results type and add the desired routine or routines to this action.
The routine(s) that you select for the action must be executed during the profiler run. Depending on the
Execution Type property of the action, AQtime will generate results upon entering or existing the routine(s)
added to the action.
For more information on actions, see the Using Actions help topic.
Commanding AQtime to Generate Results via COM
AQtime is a COM server. You may connect to it via COM and use the COM interfaces command to
command the profiling engine to generate results. The whole procedure includes the following steps:
1. Connect to AQtime via COM (you can use the AQtime.AQtime program identifier).
© 2010 AutomatedQA Corp.
www.automatedqa.com/support
176
Profiling Applications With AQtime
2. Obtain the IntegrationManager object.
3. To generate results, call the TakeSnapshot method of the IntegrationManager object.
For more information on the IntegrationManager object and the TakeSnapshot method, see the
Working With AQtime via COM help topic.
Commanding AQtime to Generate Results from a Tested Application
You may also command AQtime to generate results from your profiled application. To do this:
•
Open your application’s project in the development tool you use.
•
Include the AQtimeHelpers file into your application project. This file is located in the following
folder:
If you use...
Add the following file
Microsoft Visual C# .NET
<AQtime 7 SDK>\CS\AQtimeHelpers.cs
Microsoft Visual Basic .NET
<AQtime 7 SDK>\VBNET\AQtimeHelpers.vb
Microsoft Visual C++, Borland <AQtime 7 SDK>\CPP\Common\AQtimeHelpers.cpp
C++Builder, Borland C++ or Intel C++
Microsoft Visual Basic
<AQtime 7 SDK>\VB\AQtimeHelpers.bas
Borland Delphi
<AQtime 7 SDK>\Delphi\Common\AQtimeHelpers.pas
On Windows 7, Windows Vista and Windows Server 2008, AQtime SDK files are located in the
<Users>\Public\Documents\AQtime 7 SDK folder. On other operating systems, the files reside in
the <Documents and Settings>\All Users\Documents\AQtime 7 SDK folder.
Note that the All Users\Documents folder may be displayed in Windows Explorer and Open and
Save dialogs as All Users\Shared Documents.
•
The file contains the declaration of the GenerateResults function. This function commands
AQtime to generate and display profiling results that have been accumulated by the call. The function
does not use any parameters.
•
Call the GenerateResults function in your code.
If your application already contains a routine with the name GenerateResults, you may need to use
the AQtimeHelpers namespace or the AQtimeHelpers unit name (this depends on your compiler)
when calling the GenerateResults routine:
[Visual C++]
//
Call
GenerateResults
AQtimeHelpers::GenerateResults();
using
the
namespace
[Delphi]
www.automatedqa.com
AQtime by AutomatedQA Corporation
177
Running a Profiling Session
//
Call
GenerateResults
AQtimeHelpers.GenerateResults();
using
the
unit
name
About Clearing the Results
Note that if you do not want to keep the previous results, you can flush them before getting the most recent
results. You can do this in the following ways:
•
If you use AQtime standalone, select the Run | Clear Results item from AQtime’s main menu or
Clear Results button on the Standard toolbar.
press the
•
If you use AQtime integrated into Microsoft Visual Studio, select the AQtime | Clear Results
Clear Results button on the AQtime
item from Visual Studio’s main menu or press the
toolbar.
•
If you use AQtime integrated into Embarcadero RAD Studio, select AQtime | Clear Results from
Embarcadero RAD Studio’s main menu.
See the Clearing Results During Profiling help topic for more information on this.
Clearing Results During Profiling
The profiling engine accumulates results during profiling and displays them in the Report, Details and
other panels when the profiled application is over or when AQtime gets a command to generate the results.
AQtime provides a way to clear the accumulated results. This feature can be useful if you want AQtime to clear
results accumulated by some point in time and display only the results that we collected after this point.
You can command AQtime to clear results by selecting the Run | Clear Results item from AQtime’s main
Clear Results button on the Standard toolbar (if you use AQtime integrated into
menu or by pressing the
Microsoft Visual Studio, select the AQtime | Clear Results option from Visual Studio’s main menu or press
the
Clear Results button on the AQtime toolbar; if you use AQtime integrated into Embarcadero RAD
Studio, select AQtime | Clear Results from RAD Studio’s main menu).
Another way to clear results when profiling is to create an action that will command AQtime to flush the
gathered results (Action Type: Clear Results). The routine that you select for this must be executed during the
profiler run. For more information on actions, see the Using Actions help topic.
Note that if you run the Allocation profiler and the profiler’s Check memory bounds option is enabled, the
results cannot be cleared.
Generating Dumps for Profiled Applications
When profiling your application in AQtime, you may command AQtime to generate a dump for the
profiled application. The generated file will contain information about the application’s memory, call stacks,
loaded modules and CPU register’s values. This information may help you understand what happens within the
application at any given point in time. For instance, if your application hangs, you may generate the error report
and use its data to find the cause of the problem.
To generate an error report:
1. Click Generate Process Dump on the Event View panel’s toolbar.
AQtime invokes the save file dialog.
2. In the dialog, specify the location and name of the dump file and press Save.
AQtime will save the dump to the specified file and close the dialog.
3. Then you can either continue profiling or terminate the profiled application.
© 2010 AutomatedQA Corp.
www.automatedqa.com/support
178
Profiling Applications With AQtime
To analyze the data of the dump file, open the file in AutomatedQA AQtrace or in Microsoft Visual Studio
2005, 2008 or 2010. For more information on how to analyze dumps, see the AQtrace or Visual Studio
documentation (in AQtrace, dump files are called error reports).
Notes:
●
The format of the dump file generated by AQtime differs from the format of error report files
adopted in AQtrace. So, when opening the generated dump file in AQtrace the latter will display a
message box informing you that the file was generated by another tool, but not AQtrace.
●
Currently, the generated dump file contains the “native-code” call stack. If you generated a dump for
a .NET application, the dump will contain the native-code entries, but not the names of managed
routines.
You can also command AQtime to generate dumps automatically when an exception occurs in the
profiled process. To do this, enable the Generate dump on exception setting of the Event View panel and
specify the folder that the dumps will be saved in, in the Dump folder setting.
When an exception occurs in the profiled application, AQtime checks the value of the Generate dump on
exception setting. If the setting is enabled, AQtime automatically generates a dump for the exception, saves the
dump file to the folder, specified by the Dump folder setting and adds an informative message to the Event
View panel. Note that the folder must exist; AQtime does not create it automatically.
The name of the dump file has the format ProjectName_nn.dmp. ProjectName is the name of your
AQtime project and nn is a number (1, 2, 3 and so on).
Notes:
•
Dumps are not generated for those exceptions that are filtered out and not logged in the Event
View panel (see the Exceptions in the Event View Panel help topic).
•
When a .NET exception occurs, the CLR generates the appropriate system exception. The dump
file contain the call stack for this system exception. It does not contain the call stack for the .NET
exception.
Controlling Profiling From Application Code
AQtime lets your applications handle the profiling process. This has the same effect as using the
Enable/Disable Profiling toolbar and menu item. Note that these commands only work if there is only one
instance of AQtime running.
This is useful when areas plus triggers and actions do not give you the control you seek, or where they
would, but at the cost of some complications, or simply where you want to set triggers or actions from source
code rather than from the AQtime user interface.
All the functions that you need to do this are in a single file that you add to your source files. Once you
have it linked, turning profiling on and off is a matter of a few simple calls.
If you use...
Add the following file
Microsoft Visual C# .NET
<AQtime 7 SDK>\CS\AQtimeHelpers.cs
Microsoft Visual Basic .NET
<AQtime 7 SDK>\VBNET\AQtimeHelpers.vb
Microsoft
Visual
www.automatedqa.com
C++,
Borland <AQtime 7 SDK>\CPP\Common\AQtimeHelpers.cpp
AQtime by AutomatedQA Corporation
179
Running a Profiling Session
If you use...
Add the following file
C++Builder, Borland C++ or Intel C++
Microsoft Visual Basic
<AQtime 7 SDK>\VB\AQtimeHelpers.bas
Borland Delphi
<AQtime 7 SDK>\Delphi\Common\AQtimeHelpers.pas
On Windows 7, Windows Vista and Windows Server 2008, AQtime SDK files are located in the
<Users>\Public\Documents\AQtime 7 SDK folder. On other operating systems, the files reside in
the <Documents and Settings>\All Users\Documents\AQtime 7 SDK folder.
Note that the All Users\Documents folder may be displayed in Windows Explorer and Open and
Save dialogs as All Users\Shared Documents.
Each of these files include the EnableProfiling function. This function enables or disables profiling
according to its boolean parameter.
You can try it with the sample application, OnOffProfiling, that is part of the AQtime installation (in
source). Alternatively, you can try the following sample code in an application of your own. In either case,
before running the test set up the application in AQtime so that the application has full control over profiling:
•
Select Full Check and/or Profile Entire .NET Code in AQtime’s Setup panel. For more convenient
result analysis, you should uncheck all profiling areas, except Full Check and Profile Entire .NET
Code.
•
Be sure the
Enable/Disable Profiling button is not pressed so AQtime does not begin profiling
the application by itself.
Sample code:
[Visual C++]
. . .
// Enables profiling
EnableProfiling(true);
// Calls a function
My_Function(Param1, Param2);
// Disables profiling
EnableProfiling(false);
Note that if your application already contains a routine with the name EnableProfiling, you may need
to use the AQtimeHelpers namespace or the AQtimeHelpers unit name (this depends on your compiler)
when calling the EnableProfiling routine, for example:
[Visual C++]
. . .
// Calls EnableProfiling using the namespace
AQtimeHelpers::EnableProfiling(true);
© 2010 AutomatedQA Corp.
www.automatedqa.com/support
180
Profiling Applications With AQtime
[Delphi]
. . .
// Calls EnableProfiling using the unit name
AQtimeHelpers.EnableProfiling(True);
There is a tutorial in AQtime Help that explains how you can control profiling from your application:
Enable/Disable Profiling Tutorial. Be sure to read it to gain a better understanding of how it works.
www.automatedqa.com
AQtime by AutomatedQA Corporation
181
Profiling Various Applications and Code
Profiling Various Applications and Code
Profiling .NET Applications
AQtime enables you to profile 32-bit and 64-bit .NET applications that target Microsoft .NET Framework
1.0 - 4.0:
•
Standalone .NET applications,
•
.NET assemblies,
•
.NET Windows services,
•
ASP.NET applications,
•
Mixed-code applications,
•
And others.
Profiling .NET Applications - Overview
AQtime allows you to profile .NET applications that run .NET Framework 1.0 - 4.0. This topic describes
the general procedure of profiling .NET applications. For more information on application profiling, see the
Profiling Applications With AQtime help topic.
To profile a .NET applications, follow these steps:
●
Compile your .NET application with debug information (see Compiler Settings for .NET
Applications).
●
Create an AQtime project and add your application to the list of profiled modules in the Setup
panel. See the Setting Up a Profiling Project help topic.
●
(Optional) Specify parameters for your application, such as command-line parameters or a
working directory. See the Specifying Parameters for the Profiled Application help topic.
●
Select the profiler that you want to use from the drop-down list on AQtime’s Standard toolbar. If
you use AQtime integrated into Microsoft Visual Studio, select AQtime | Profiler from Visual
Studio’s main menu. If you use AQtime integrated into RAD Studio, select Current Profiler
submenu of RAD Studio’s AQtime main menu.
●
Select
Normal from the Profiling Mode drop-down list box displayed on AQtime’s Standard
toolbar. If you use AQtime integrated into Microsoft Visual Studio, this item is located on the
AQtime toolbar. If you use AQtime integrated into Embarcadero RAD Studio, this item is located
on the AQtime Profiling Modes toolbar.
●
Select Profile Entire .NET Code or Full Check to instruct AQtime to profile the entire
application, or create profiling areas to define specific classes and routines you want to profile.
●
(Optional) Set up triggers and actions to dynamically control the profiling process.
●
Launch your application and start profiling:
If you use AQtime standalone, click
If you use AQtime integrated into Microsoft Visual Studio, select AQtime | Run from
Visual Studio’s main menu.
If you use AQtime integrated into Embarcadero RAD Studio, select AQtime | Run With
Profiling from RAD Studio’s main menu.
© 2010 AutomatedQA Corp.
Run.
www.automatedqa.com/support
182
Profiling .NET Applications
●
Perform some operations in the application that you want to profile.
Tip:
●
When profiling the application’s memory usage, you can explicitly run garbage
collection in the profiled application by clicking Force Garbage Collection. This
will clean up the objects that are no longer used in your application. You can then
capture profiling results from the application to see which objects survived the garbage
collection for some reason and remained in memory. If you use AQtime integrated into
Microsoft Visual Studio, this button is located on the AQtime toolbar. If you use
AQtime integrated into Embarcadero RAD Studio, this button does not reside on any
toolbar by default. However, you can add the button to any RAD Studio’s toolbar via the
Toolbar Customization dialog. In this dialog, switch to the Commands page, select
the Run.AQtime category in the Categories list, drag the Force Garbage Collection
command from the Commands list and drop it on the needed toolbar.
Close your application to finish profiling and get the results.
AQtime will display the profiling results in its panels.
Note: Profiling results do not include information on methods that were inlined. To profile such
methods, you need to disable inlining. For more information, see the Disabling Inlining for the
Profiled .NET Application help topic.
Profiling .NET Applications - Specifics
Profiling of .NET applications with AQtime has the following specifics:
•
Profiling .NET applications via the network
Due to certain security reasons, AQtime cannot profile those .NET applications that reside on
another computer. Profiling of these applications causes an exception that occurs within the
application code due to .NET Framework security. To profile these applications, launch AQtime
on the computer where the application is located.
•
Profiling .NET applications running under another account
If you install AQtime for a single user account, you will not be able to profile .NET applications
that run under another user account.
Note:
•
Both specifics concern profilers that launch your application. They are not applied to
profilers that analyze your code statically.
Profiling console .NET applications
AQtime does not trace exceptions that occur in console applications created for .NET Framework
ver. 1.0 and 1.1.
•
Using the Resource profiler
In order for the Resource profiler to be able to track how your .NET application uses Windows
resources, add the mscorwks.dll assembly to your AQtime project. See Using Resource Profiler
With .NET Applications.
Profiling Mixed Code .NET Applications
Quite often .NET applications include mixed code, that is, certain parts of the application executable are in
MSIL code (managed code) and other parts are native code (unmanaged code). AQtime can analyze both
managed and unmanaged code. It does not require any special preparations for profiling of mixed code except
www.automatedqa.com
AQtime by AutomatedQA Corporation
183
Profiling Various Applications and Code
cases when modules, which include unmanaged sections, must be compiled with debug information. For
example, if the application itself includes both managed and unmanaged code, you have to compile it with
debug information in order to profile its unmanaged sections. See the How AQtime Profilers Use Metadata and
Debug Information help topic.
One of the typical examples of using mixed code is a .NET application that uses a COM object, which is
implemented in a native-code module. In this instance, you have to compile the native-code module with
debug information to profile its functions. The way in which you include debug information into the
executable depends upon the compiler. See the How AQtime Profilers Use Metadata and Debug Information
help topic.
We would like to note once again that AQtime can profile both managed and unmanaged code. For
example, with AQtime you can profile both managed and unmanaged modules at line level, you can define
triggers and actions using both managed and unmanaged functions, etc. The only exception from this rule is the
Profile Entire .NET Code setting in the Setup panel. It works for managed code only.
AQtime includes sample applications that illustrate the profiling of mixed code.
.NET applications
Microsoft Visual Studio .NET 7.x projects:
<AQtime Samples>\Managed\VS.NET\MixedProfiling\Managed\CS - Microsoft Visual C# .NET
<AQtime Samples>\Managed\VS.NET\MixedProfiling\Managed\VB - Microsoft Visual Basic
.NET
<AQtime Samples>\Managed\VS.NET\MixedProfiling\Managed\VC - Microsoft Visual C++ .NET
<AQtime Samples>\Managed\VS.NET\MixedProfiling\Managed\JS - Microsoft Visual J# .NET
Microsoft Visual Studio 2005, 2008 and 2010 projects:
<AQtime Samples>\Managed\VS.NET\MixedProfiling\Managed\CS - Microsoft Visual C# .NET
<AQtime Samples>\Managed\VS.NET\MixedProfiling\Managed\VB - Microsoft Visual Basic
.NET
<AQtime Samples>\Managed\VS.NET\MixedProfiling\Managed\VC - Microsoft Visual C++ .NET
<AQtime Samples>\Managed\VS.NET\MixedProfiling\Managed\JS - Microsoft Visual J# .NET
Native-code DLLs
<AQtime Samples>\Managed\VS.NET\MixedProfiling\Unmanaged\VC - Microsoft Visual C++
(Visual Studio 7.x project)
<AQtime Samples>\Managed\VS.NET\MixedProfiling\Unmanaged\Delphi - Borland Delphi
<AQtime Samples>\Managed\VS2005\MixedProfiling\Unmanaged\VC - Microsoft Visual C++
(Visual Studio 7.x project)
<AQtime Samples>\Managed\VS2005\MixedProfiling\Unmanaged\VC2005 - Microsoft Visual
C++ (Visual Studio 2005, 2008 and 2010 project)
<AQtime Samples>\Managed\VS2005\MixedProfiling\Unmanaged\Delphi - Borland Delphi
On Windows 7, Windows Vista and Windows Server 2008, AQtime samples are located in the
<Users>\Public\Documents\AQtime 7 Samples folder. On other operating systems, the samples
reside in the <Documents and Settings>\All Users\Documents\AQtime 7 Samples folder.
For more information on how to profile these samples, see the Profiling Mixed Code Tutorial help topic.
© 2010 AutomatedQA Corp.
www.automatedqa.com/support
184
Profiling .NET Applications
Disabling Inlining for the Profiled .NET Application
The .NET Framework JIT (just-in-time) compiler can inline some methods when their code is short
enough, that is, it can replace method calls with a copy of the method implementation. If this happens, AQtime
cannot collect profiling information for these methods, as there are no method entry and exit points to track.
To profile methods in your .NET applications that are JIT-compiled as inline, you need to disable inlining.
There are two ways to do this:
•
Select the Disable inlining option in the profiler settings. Note that this option is only provided by
the Performance and Coverage profilers.
•
Modify the application code and add the MethodImplOptions.NoInlining attribute to the
desired methods to indicate that they cannot be inlined. For more information and code examples,
see the Profiling Inline Functions help topic.
Note that disabling method inlining may affect the application performance (and thus performance
measurements), since inlining normally speeds up caller methods and also avoids certain JIT events for inlined
(called) methods.
www.automatedqa.com
AQtime by AutomatedQA Corporation
185
Profiling Various Applications and Code
Profiling Java Applications
Profiling Java Applications - Overview
AQtime can profile Java applications created with Sun Microsystems’ Java 1.5 and Java 1.6 platforms.
To profile Java applications, AQtime uses the features provided by the Java Virtual Machine Tool
Interface (JVM TI). The Tool Interface is loaded during initialization of the Java Virtual Machine (JVM) and
provides means for inspecting the application’s state and for controlling the execution flow. AQtime can trace
the moment when a Virtual Machine starts and overrides some hooks and event handles, thus AQtime becomes
able to retrieve application data without the necessity to prepare the Java application beforehand.
Supported Profilers
Currently, Java applications can be profiled with the following profilers:
•
Performance Profiler
•
Coverage Profiler
•
Light Coverage Profiler
•
Function Trace Profiler
•
Static Analysis Profiler
Profiling Instructions
Since Java applications are not executed directly by the operating system, you should launch the
JavaVirtual Machine and pass the application to it. Therefore, to profile a Java archive, you need to specify the
Java application launcher as the host application. For more information on how to do this, see Selecting Target
Java Virtual Machine.
Profiled Java applications may be represented in the form of Java archives (.jar) and machine-readable
class files (.class). The following sections contain detailed instructions on profiling different types of Java
applications:
Profiling Java Archives
Profiling Java Classes
Profiling Mixed-code Java Applications
Important notes:
•
For the best results, it is recommended that you compile your Java application with debug
information. The Java compiler (javac.exe) includes debug information in applications by default,
however, it can be excluded by using certain compiler settings. For information about compiler
settings needed to generate debug information, see Compiler Settings for Java Applications.
•
Currently, AQtime cannot profile Java code if you attach a profiler to a running Java application.
In this case, you will only be able to profile native code called from Java code.
To profile Java code, you need to start your application along with the profiler from within
AQtime. For more information, see Profiling Java Archives and Profiling Java Classes.
Sample Applications
AQtime includes a number of samples that you can use to get started profiling Java applications.
On Windows 7, Windows Vista and Windows Server 2008, AQtime samples are located in the
© 2010 AutomatedQA Corp.
www.automatedqa.com/support
186
Profiling Java Applications
<Users>\Public\Documents\AQtime 7 Samples folder. On other operating systems, the samples
reside in the <Documents and Settings>\All Users\Documents\AQtime 7 Samples folder.
CoverageSample
Demonstrates how you can use the Coverage profiler to find untested sections of your code.
<AQtime Samples>\Managed\Java\Coverage
JuliaSetSample
Demonstrates how you can find and resolve performance bottlenecks in your Java applications.
<AQtime Samples>\Java\JuliaSet
MixedSample
Demonstrates how you can profile native-code routines that are called from managed Java code.
<AQtime Samples>\Java\MixedProfiling
PerformanceSample
Demonstrates how you can use the Performance profiler to time function execution in your application.
<AQtime Samples>\Managed\Java\Performance
Selecting Target Java Virtual Machine
Java application developers typically have multiple Java Virtual Machines (JVM) installed on the
computer in order to test the application in different environments. When profiling a Java application with
AQtime, you need to select the JVM you want to use with your application.
To set the default JVM
You can view the available JVMs and set the default JVM that AQtime will use to profile Java applications
in AQtime options. To select the default JVM:
•
If you use AQtime standalone:
Select Options | Options from AQtime’s main menu. The Options dialog will open.
Select Services | Java Support from the tree on the left of the dialog to open the Java Support
options.
If you use AQtime integrated into Microsoft Visual Studio:
Select Tools | Options from the main menu of Visual Studio. The Options dialog will open.
Select the AQtime | Services | Java Support group in the dialog to open the Java Support
options.
If you use AQtime integrated in Embarcadero RAD Studio:
Select AQtime | Options from the main menu of RAD Studio. The Options dialog will open.
Select Services | Java Support from the tree on the left of the dialog to open the Java Support
options.
•
In the Default Java Runtime list, select the needed JVM.
•
Press OK to close the dialog and save the changes.
To use the default JVM with your application
To configure your profiling project to use the default JVM selected in Java options, follow these steps:
www.automatedqa.com
AQtime by AutomatedQA Corporation
187
Profiling Various Applications and Code
•
Open your profiling project in AQtime.
•
If you use AQtime standalone, select Run | Parameters from the main menu of AQtime. If you
use AQtime integrated into Microsoft Visual Studio, select AQtime | Parameters from Visual
Studio’s menu. If you use AQtime integrated into Embarcadero RAD Studio, select AQtime |
Parameters from RAD Studio’s main menu. The Run Parameters dialog will open.
•
Select Default Java Runtime from the Host Application edit box.
•
Click OK to close the dialog and save the changes.
•
Save the changes made to the project.
For more information about setting up Java profiling projects, see Profiling Java Archives and Profiling
Java Classes.
To use a specific JVM with your application
In certain cases, you may need to run and profile your Java application using a specific JVM. In this case,
you can explicitly specify this JVM in the run parameters for your application. To do this:
•
Open your profiling project in AQtime.
•
If you use AQtime standalone, select Run | Parameters from the main menu of AQtime. If you
use AQtime integrated into Microsoft Visual Studio, select AQtime | Parameters from Visual
Studio’s menu. If you use AQtime integrated into Embarcadero RAD Studio, select AQtime |
Parameters from RAD Studio’s main menu. The Run Parameters dialog will open.
•
Enter the fully-qualified name of the Java application launcher in the Host Application edit box.
The path can be any of the following:
<JRE>\bin\java.exe
<JRE>\bin\javaw.exe
<JDK>\bin\java.exe
<JDK>\bin\javaw.exe
Note: The java.exe and javaw.exe launchers are identical, except that javaw.exe has no
associated console window. Use javaw.exe when you don't want a command prompt
window to appear. The javaw.exe launcher will, however, display a dialog box with an
error if the launch fails for some reason.
•
Click OK to close the dialog and save the changes.
•
Save the changes made to the project.
For more information about setting up Java profiling projects, see Profiling Java Archives and Profiling
Java Classes.
Profiling Java Archives
AQtime can profile Java applications represented in the form of Java archives (.jar) and machine-readable
class files (.class). This topic explains how to profile Java archives.
A Java archive (.jar) includes multiple machine-readable Java files (.class), metadata files and resource
files. The ZIP compression algorithm is used to compress the files. Software developers generally use .jar files
to distribute their Java applications or libraries.
Preparing an AQtime Project
1. Compile your Java application with debug information (see Compiler Settings for Java Applications).
© 2010 AutomatedQA Corp.
www.automatedqa.com/support
188
Profiling Java Applications
2. Launch AQtime and create a new empty AQtime project.
3. Select the
Normal profiling mode on AQtime’s Standard toolbar (if you use AQtime integrated
into Microsoft Visual Studio, this item is located on the AQtime toolbar; if you use AQtime integrated
into Embarcadero RAD Studio, this item is located on the AQtime Profiling Modes toolbar).
4. Specify run parameters for the profiled applications. If you use AQtime standalone, choose Run |
Parameters from AQtime’s main menu. If you use AQtime integrated into Microsoft Visual Studio,
choose AQtime | Parameters from Visual Studio’s main menu. If you use AQtime integrated into
Embarcadero RAD Studio, choose AQtime | Parameters menu item. This will invoke the Run
Parameters dialog.
5. In the Host Application field, specify the path to the Jav application launcher. You can do this in two
ways:
Select Default Java Runtime from the drop-down list. In this case, AQtime will use the JVM
specified by the Default Java Runtime option.
– or –
Enter the fully-qualified path to the Java launcher file. The file path can be any of the
following:
•
<JRE>\bin\java.exe
•
<JRE>\bin\javaw.exe
•
<JDK>\bin\java.exe
•
<JDK>\bin\javaw.exe
For more information, see Selecting Target Java Virtual Machine.
6. In the Parameters edit box, specify the -jar argument followed by the fully-qualified path to the
Java archive you want to profile. If the path string contains space characters, enclose it in quotation
marks.
You can specify any other command-line arguments of the Java launcher in the Parameters edit box.
For a complete list of Java launcher parameters, see the java - the Java application launcher topic of
Java Technology Reference that corresponds to the version of Java installed on your machine.
www.automatedqa.com
AQtime by AutomatedQA Corporation
189
Profiling Various Applications and Code
7. Click OK to save the changes and close the dialog.
8. Switch to AQtime’s Setup panel and add your Java archive (.jar) to the AQtime project.
9. Now the project is ready for profiling. If needed, you can enable the Profile Entire Java Code preset
profiling area, create custom profiling areas, or tune triggers and actions.
Profiling Procedure
1. Start profiling in AQtime. AQtime will launch the Java Virtual Machine, which, in turn, will call your
application or library.
Profiling Java code by attaching a profiler to a running Java application is currently not
supported.
2. Perform the desired actions over the application. AQtime will profile it.
3. To generate results, either close the application, or use the Get Results command.
4. AQtime will display the profiling results in its panels.
To denote the profiling results for routines declared within nested classes, the dollar sign is used.
For instance: Collections$UnmodifiableList::indexOf.
Profiling Java Classes
Since Java is a platform-independent language, source code is compiled into an intermediate output file
known as bytecode, which is stored in a .class file. If a source file has more than one class, each class is
compiled into a separate .class file. These .class files can be loaded by any Java Virtual Machine (JVM). This
topic describes how to profile such .class files with AQtime.
Preparing an AQtime Project
1. Compile your Java application with debug information (see Compiler Settings for Java Applications).
2. Launch AQtime and create a new empty AQtime project.
Normal profiling mode on AQtime’s Standard toolbar (if you use AQtime integrated
3. Select the
into Microsoft Visual Studio, this item is located on the AQtime toolbar; if you use AQtime integrated
into Embarcadero RAD Studio, this item is located on the AQtime Profiling Modes toolbar).
4. Specify run parameters for the profiled application. If you use AQtime standalone, choose Run |
Parameters from AQtime’s main menu. If you use AQtime integrated into Microsoft Visual Studio,
choose AQtime | Parameters from Visual Studio’s main menu. If you use AQtime integrated into
Embarcadero RAD Studio, choose AQtime | Parameters menu item. This will invoke the Run
Parameters dialog.
5. In the Host Application field, specify the path to the Jav application launcher. You can do this in two
ways:
Select Default Java Runtime from the drop-down list. In this case, AQtime will use the JVM
specified by the Default Java Runtime option.
– or –
Enter the fully-qualified path to the Java launcher file. The file path can be any of the
following:
•
<JRE>\bin\java.exe
•
<JRE>\bin\javaw.exe
•
<JDK>\bin\java.exe
© 2010 AutomatedQA Corp.
www.automatedqa.com/support
190
Profiling Java Applications
•
<JDK>\bin\javaw.exe
For more information, see Selecting Target Java Virtual Machine.
6. In the Parameters edit box, enter the -classpath command-line argument followed by the path and
the name of the class file you want to profile. For example: -classpath "C:\Documents and
Settings\All
Users\Documents\AQtime
Samples\Managed\Java\Coverage\Bin\CoverageClasses" CoverageSample.
7
Note: In order to be executed, a class should have the main method (declared as public and
static), which must not return any value and must accept a String array as a parameter.
If the path string contains space characters, enclose it in quotation marks. If the class
file resides in a folder listed in the CLASSPATH environment variable, then the
classpath argument may be omitted.
You can pass any other standard and non-standard command-line parameters of the Java launcher
through the Parameters field of the Run Parameters dialog. For a complete list of Java launcher
parameters, see the java - the Java application launcher topic of Java Technology Reference that
corresponds to the JRE installed on your machine.
7. Click OK to save the changes and close the dialog.
8. Switch to AQtime’s Setup panel and add the class files you want to profile to the AQtime project.
9. Now the project is ready for profiling. If needed, you can enable the Profile Entire Java Code preset
profiling area, create custom profiling areas, or tune triggers and actions.
Profiling Procedure
1. Start profiling in AQtime. AQtime will launch the Java Virtual Machine, which, in turn, will invoke
the profiled class file(s).
Profiling Java code by attaching a profiler to a running Java application is currently not
supported.
2. Perform the desired actions over the application. AQtime will profile it.
www.automatedqa.com
AQtime by AutomatedQA Corporation
191
Profiling Various Applications and Code
3. To generate results, either close the application, or use the Get Results command.
4. AQtime will display profiling results in its panels.
5. To denote the profiling results for routines declared within nested classes, the dollar sign is used. For
instance: Collections$UnmodifiableList::indexOf.
Profiling Mixed-code Java Applications
AQtime can profile mixed code Java applications, that is, applications where certain parts are in Java
(managed code), while other parts are native code (unmanaged code). AQtime can analyze both managed and
unmanaged code. It does not require any special preparations for profiling of mixed code, except for cases
when modules, which include unmanaged sections, must be compiled with debug information. For example, if
the application itself includes both managed and unmanaged code, you have to compile it with debug
information to profile its unmanaged sections. See the How AQtime Profilers Use Metadata and Debug
Information help topic.
There can be two possible cases:
a. When a Java application calls some routines from the native code library.
b. When a native code application invokes the Java Virtual Machine and executes some Java code.
To achieve this, Java has a special API - Java native interface (JNI).
Profiling native routines called from Java application
To profile native-code DLL routines called from a Java application, you do not need any special
preparations. It is not obligatory to compile your DLL with debug information (although the latter would
provide more detailed results). Simply start profiling your Java application as described in the Profiling Java
Archives or Profiling Java Classes topic and call the native-code routines. AQtime will trace the moment when
non-managed code is called and switch to the appropriate engine.
Note: If you start profiling by attaching a profiler to a running Java application, AQtime will only profile
native code called from that application. Managed code will not be analyzed.
AQtime includes a sample that illustrates how you can profile native-code routines that are called from
managed Java code.
<AQtime Samples>\Java\MixedProfiling
On Windows 7, Windows Vista and Windows Server 2008, AQtime samples are located in the
<Users>\Public\Documents\AQtime 7 Samples folder. On other operating systems, the samples
reside in the <Documents and Settings>\All Users\Documents\AQtime 7 Samples folder.
Profiling native applications that invoke Java code
Compile such applications with debug information. See How AQtime Profilers Use Metadata and Debug
Information for a list of detailed instructions for the compiler you use. Perform the actions that invoke the Java
Virtual Machine, execute Java code.
© 2010 AutomatedQA Corp.
www.automatedqa.com/support
192
Profiling COM Applications
Profiling COM Applications
Profiling COM Applications - Overview
There are several types of COM servers:
•
in-process servers (for example, ActiveX controls).
•
out-of-process servers (that is, OLE servers that are executed as a separate process).
•
DCOM (Distributed Component Object Model) servers are out-of-process OLE servers that
support remote procedure calls, that is, clients that are on other machines in a network.
•
COM+ applications (COM+ is the further evolution of COM).
•
MTS (Microsoft Transaction Server) is a set of libraries that serve for easier development and
deployment of server applications built with the COM technology.
Different types of COM servers are profiled in different ways. For detailed instructions on how to profile
them, follow the links below. Before you proceed, we recommend that you read the notes below.
Notes:
•
You can profile COM applications in two modes: Normal and COM Server. Normal mode
means that you are profiling your COM server as an ordinary (non-COM) application. That is, the
COM server is started under AQtime so that the latter can instrument and profile the server code.
However, it is often necessary to profile code that executes when the server is launched by the
operating system, not by AQtime. For instance, DCOM servers are launched by the operating
system by a request from the client application installed on another computer. Since the servers are
started by the OS, AQtime cannot instrument and profile them in Normal mode. To profile COM
servers, which client process is not launched by AQtime, use COM Server mode. This mode is
supported on Windows 2000, XP and Windows Server 2003.
Profiling in COM Server mode requires specifying the client application in the Run Parameters
Dialog (for COM Server Mode). The client application name is used to determine the name of
the process that will load your COM server. AQtime traces the creation of this process and runs it
in debug mode under AQtime (that is, AQtime will act as a debugger). This allows AQtime to
instrument the COM server code.
Note that if you select COM Server mode, AQtime will not launch your COM server application.
It waits until this application is launched by a client request. The client application name that you
specify in the Run Parameters Dialog (for COM Server Mode) depends on the type of the COM
server being tested. For instance, for in-process COM servers it is the name of the COM client
application, for DCOM servers, it is dllhost.exe, for out-of-process COM servers, it is the name of
the profiled executable. For more information on this, follow the links above.
•
A COM server can process several requests from different client applications simultaneously. If
you are going to profile a COM server with two or more clients and use the Performance,
Coverage or Function Trace profiler, it is recommended that you set the profiler’s Thread model
option to COM Threads. Otherwise, the profilers may trace the parent-child relationship for
COM server functions incorrectly. See Profiling COM Logical Threads for detailed description of
this option.
•
Profiling 64-bit COM applications is possible under Windows 64bit platforms.
www.automatedqa.com
AQtime by AutomatedQA Corporation
193
Profiling Various Applications and Code
Profiling In-Process COM Servers
In-process COM servers are usually compiled as DLL or OCX files. They run in the address space of the
process that uses the COM server. That is why you should either specify a host application for this DLL (OCX)
or add it to the AQtime project that contains an EXE file. You can profile your in-process server either in
Normal or in COM server mode. Normal mode can be used if the client application (client process) that will
use your in-process COM server is launched by AQtime. If the client process is not launched by AQtime, use
COM Server mode. For instance, you can use the COM Server mode when -•
your in-process COM server is started by a DCOM request from another computer (in this case,
the client process for your COM server is dllhost.exe launched by the operating system). See also
Profiling DCOM Servers.
•
your server is launched by a request sent from a Web page (in this case, the Internet Information
Services process, inetinfo.exe, becomes the client process for your COM server).
•
etc.
To profile your in-process COM server in Normal mode, follow the steps below:
•
Compile your COM application with debug information. See the How AQtime Profilers Use
Metadata and Debug Information help topic for detailed instructions on how to do this.
•
Be sure the “debug” version of your COM server is registered in the system. If the server was
compiled on your machine, it was registered during compilation. In any case, you can use the
regsvr32 utility located in the <Windows>\System32 folder to register the control, for example:
regsvr32.exe <Path>\MyServer.DLL
•
Select
Normal from the Profiling Mode dropdown list box that is displayed on AQtime’s
Standard toolbar (if you use AQtime integrated into Microsoft Visual Studio, this item is located
on the AQtime toolbar; if you use AQtime integrated into Embarcadero RAD Studio, this item is
located on the AQtime Profiling Modes toolbar).
•
Open your COM application in AQtime. You can either
•
Open it as a separate AQtime project. In this case, you will have to specify a host application
for the DLL (OCX) in the Run Parameters dialog (for Normal Mode).
or --
Add your DLL (OCX) to the project that holds an EXE file, which will load this DLL (OCX):
To add your module to the project, click the
context menu of the Setup panel.
Set the EXE as the “main” module in the project. To do this, right-click EXE in the Setup
panel and select Set as Active Module from the context menu.
Add Module item on the toolbar or
In 64-bit versions of Windows, 32-bit modules can be loaded into 32-bit
processes only and 64-bit modules can be loaded into 64-bit processes only.
So, if the “bitness” of your COM server does not match the “bitness” of the
process, to which the server is loaded, AQtime will not start profiling.
•
Start profiling and perform it in the usual manner. Keep in mind that to profile a function (unit,
class) you must check it within a profiling area or select Profile Entire .NET Code or Full Check
to profile all the routines.
© 2010 AutomatedQA Corp.
www.automatedqa.com/support
194
Profiling COM Applications
To profile your in-process COM server in COM Server mode, perform the following steps (note that
COM Server mode is supported only on Windows 2000, XP and Windows Server 2003):
•
Compile your COM application with debug information. See How AQtime Profilers Use
Metadata and Debug Information for detailed instructions on how to do this.
•
Make sure the “debug” version of your control is registered in the system.
•
Open the DLL or OCX module that contains your COM server in AQtime.
•
Select
COM Server from the Profiling Mode dropdown list box that is displayed on
AQtime’s Standard toolbar (if you use AQtime integrated into Microsoft Visual Studio, this item
is located on the AQtime toolbar; if you use AQtime integrated into Embarcadero RAD Studio,
this item is located on the AQtime Profiling Modes toolbar).
•
Specify run parameters for the profiled application. If you use AQtime standalone, choose Run |
Parameters from AQtime’s main menu. If you use AQtime integrated into Microsoft Visual
Studio, choose AQtime | Parameters from Visual Studio’s main menu. If you use AQtime
integrated into Embarcadero RAD Studio, choose AQtime | Parameters menu item. This will
open the Run Parameters Dialog (for COM Server Mode).
In the dialog:
In the Client Application box, enter the name of the executable that will load your COM
server.
Press OK to close the dialog.
•
If you use AQtime standalone, press Run to start profiling. If you use AQtime integrated into
Microsoft Visual Studio, select AQtime | Run. If you use AQtime integrated into Embarcadero
RAD Studio, select AQtime | Run With Profiling. AQtime will display a dialog asking you to
launch the COM client application.
•
Launch the COM client application that will work with your server.
•
Continue profiling in the usual manner.
Profiling Out-of-Process COM Servers
Out-of-process COM servers are implemented in executable files (.exe modules) and they are run in a
separate address space. If you need to profile these types of programs, you need to load them in AQtime as a
project, not as an additional module in another project. You can profile out-of-process servers either in Normal
or in COM Server mode. To decide which profiling mode to choose, see the Profiling COM Applications help
topic.
To profile your application in Normal mode, follow these steps:
•
Compile your out-of-process COM server with debug information. See the How AQtime Profilers
Use Metadata and Debug Information help topic for detailed information on how to do this.
•
Be sure the “debug” version of your COM server is registered in the system. If the server was
compiled on your machine, it was registered during compilation. In any case, you can use the
regsvr32 utility located in the <Windows>\System folder to register the server, for example:
regsvr32.exe “C:\COM Servers\MyServer.exe”
•
Open the out-of-process COM server in AQtime as a project and specify the profiling areas,
triggers and actions (see the Controlling What to Profile help topic).
•
Normal from the Profiling Mode dropdown list box that is displayed on AQtime’s
Select
Standard toolbar. If you use AQtime integrated into Microsoft Visual Studio, this box is located
www.automatedqa.com
AQtime by AutomatedQA Corporation
195
Profiling Various Applications and Code
on the AQtime toolbar. If you use AQtime integrated into Embarcadero RAD Studio, this item is
located on the AQtime Profiling Modes toolbar.
•
Start profiling. Make sure that the profiled application (that is, the server) can find all additional
modules it requires.
•
Launch the COM client. This is your “user” for the profiled application (the server).
•
Work with the COM client and COM server application as needed.
•
Close the client and server applications. We recommended that you first close the COM client and
then the COM server.
Note that since you start the COM server from AQtime, the latter always profiles the initialization and
finalization code. If you need to profile this code when your COM server is launched by the operating system,
use the COM Server mode:
•
Compile your out-of-process COM server with debug information. See the How AQtime Profilers
Use Metadata and Debug Information help topic for detailed information on how to do this.
•
Be sure the “debug” version of your COM server is registered in the system.
•
Open the out-of-process COM server in AQtime as a project and specify the profiling areas and
triggers (see the Controlling What to Profile help topic).
•
COM Server from the Profiling Mode dropdown list box that is displayed on
Select
AQtime’s Standard toolbar. If you use AQtime integrated into Microsoft Visual Studio, this box
is located on the AQtime toolbar. If you use AQtime integrated into Embarcadero RAD Studio,
this item is located on the AQtime Profiling Modes toolbar.
•
Specify run parameters for the profiled application. If you use AQtime standalone, choose Run |
Parameters from AQtime’s main menu. If you use AQtime integrated into Microsoft Visual
Studio, choose AQtime | Parameters from Visual Studio’s main menu. If you use AQtime
integrated into Embarcadero RAD Studio, choose AQtime | Parameters menu item. This will
open the Run Parameters Dialog (for COM Server Mode). In the dialog:
•
In the Client Application box, specify the full path to your COM client application’s
executable.
Press OK to close the dialog.
Start profiling the application:
If you use AQtime standalone, press
If you use AQtime integrated into Microsoft Visual Studio, select AQtime| Run from
Visual Studio’s main menu
If you use AQtime integrated into Embarcadero RAD Studio, select AQtime | Run With
Profiling from the main menu.
Run
AQtime will display a message informing that you should run the client application.
•
Launch the COM client.
•
Work with the COM client and COM server application as needed.
•
Close the client and server applications.
Profiling DCOM Servers
DCOM applications are profiled in the same manner as out-of-process servers. Normally DCOM servers
simply wait for a remote procedure call from a client machine. They cannot be launched by AQtime in this
© 2010 AutomatedQA Corp.
www.automatedqa.com/support
196
Profiling COM Applications
way. That is why the preferred profiling mode for them is the COM Server mode (this mode is supported on
Windows 2000, XP and Windows Server 2003):
•
Compile your DCOM application with debug information. See the How AQtime Profilers Use
Metadata and Debug Information help topic for detailed instructions on how to do this.
•
Be sure the “debug” version of your application is registered in the system. If the application was
compiled on your machine, it was registered during compilation. In any case, you can use the
regsvr32 utility located in the <Windows>\System32 folder to register the control, for example:
regsvr32.exe <Path>\MyServer.DLL
•
Open your application in AQtime.
•
COM Server from the Profiling Mode dropdown list box that is displayed on
Select
AQtime’s Standard toolbar. If you use AQtime integrated into Microsoft Visual Studio, this box
is located on the AQtime toolbar. If you use AQtime integrated into Embarcadero RAD Studio,
this item is located on the AQtime Profiling Modes toolbar.
•
Specify run parameters for the profiled application. If you use AQtime standalone, choose Run |
Parameters from AQtime’s main menu. If you use AQtime integrated into Microsoft Visual
Studio, choose AQtime | Parameters from Visual Studio’s main menu. If you use AQtime
integrated into Embarcadero RAD Studio, choose AQtime | Parameters menu item. This will
open the Run Parameters Dialog (for COM Server Mode). In this dialog:
•
In the Client Application box, specify the application that will load your DCOM server.
For example, this can be <Windows>\System32\dllhost.exe.
Press OK to close the dialog.
Start profiling the application:
If you use AQtime standalone, press
If you use AQtime integrated into Microsoft Visual Studio, select AQtime| Run from
Visual Studio’s main menu.
If you use AQtime integrated into Embarcadero RAD Studio, select AQtime | Run With
Profiling from the main menu.
Run
AQtime will display a dialog asking you to launch the client application.
•
Launch the client application for your DCOM server.
•
Perform profiling in the usual manner.
You can also profile DCOM servers in Normal mode. There is one DCOM server feature you should keep
in mind: if these servers are launched as out-of-process COM servers in Normal mode, they will not execute
anything (there is no remote procedure call) and will exit immediately. The solution is to add a code snippet to
the DCOM server application so that, when launched, it does not close immediately. You can achieve this by:
•
Adding an empty form (the Close button on the caption bar will allow the application to close
when you are done).
•
Setting up code so that when launched the DCOM application opens the form (the exact means
depend on your compiler).
You can then profile your application using the rest of the recipe for out-of-process OLE servers. Use a
client machine to command operations on the DCOM server. When you close the form on the server machine,
the server process will exit and AQtime will generate its results.
www.automatedqa.com
AQtime by AutomatedQA Corporation
Profiling Various Applications and Code
197
Note once again that the ways of profiling in Normal mode are just workarounds. In most cases, you
should profile DCOM servers using AQtime’s COM Server mode.
Profiling COM+ and MTS Applications
COM+ is the next generation of Microsoft’s Component Object Model (COM). It is built on the basis of
COM and MTS (Microsoft Transaction Server). This topic explains how to profile COM+ applications with
AQtime.
1. Preparing Application for Profiling
•
Compile your application with debug information. See the How AQtime Profilers Use Metadata
and Debug Information help topic for detailed instructions on how to do this.
•
Register your COM+ application in the operating system:
Open the Component Services dialog (Control Panel | Administrative Tools |
Component Services).
Right-click the COM+ Applications item in the treelist on the left of the dialog. Select
New | Application from the context menu. This will call the COM Application Install
Wizard. Follow the steps of this wizard to create a COM+ application.
Once the application has been created, right-click the <Your app> | Components node
and select New | Component from the context menu. This will call the Component
Install Wizard. Use this wizard to add components to your application.
© 2010 AutomatedQA Corp.
www.automatedqa.com/support
198
Profiling COM Applications
•
Right-click the application node in the treelist and select Properties from the context
menu. This will call the Properties dialog:
Copy the Application ID field to the clipboard. You will need it for profiling.
2. Profiling Application
www.automatedqa.com
AQtime by AutomatedQA Corporation
199
Profiling Various Applications and Code
Once you have registered the application in the operating system, you can profile it. You can profile your
COM+ application like other COM applications in two modes: Normal and COM Server. For information on
difference between them, see the Profiling COM Applications – Overview help topic.
2.1. Profiling in Normal Mode
To profile your application in Normal mode, follow these steps:
•
Open your COM+ server in AQtime.
•
Specify the profiling areas, triggers and actions (see the Controlling What to Profile help topic).
•
Select the desired profiler.
•
Select
Normal from the Profiling Mode dropdown list box that is displayed on AQtime’s
Standard toolbar. If you use AQtime integrated into Microsoft Visual Studio, this box is located
on the AQtime toolbar. If you use AQtime integrated into Embarcadero RAD Studio, this item is
located on the AQtime Profiling Modes toolbar.
•
Specify run parameters for the profiled application. If you use AQtime standalone, choose Run |
Parameters from AQtime’s main menu. If you use AQtime integrated into Microsoft Visual
Studio, choose AQtime | Parameters from Visual Studio’s main menu. If you use AQtime
integrated into Embarcadero RAD Studio, choose AQtime | Parameters menu item. This will call
the Run Parameters dialog (for Normal Mode).
•
In the dialog:
•
•
Specify dllhost.exe as the Host Application. By default, this executable is located in the
<Windows>\System32 folder.
Paste the Application ID value to the Parameters edit box (You copied this value from
the Properties dialog of your COM+ application).
Press OK to close the dialog.
Start profiling the application:
If you use AQtime standalone, press
If you use AQtime integrated into Microsoft Visual Studio, select AQtime| Run from
Visual Studio’s main menu.
If you use AQtime integrated into Embarcadero RAD Studio, select AQtime | Run With
Profiling from the main menu.
The dllhost.exe application will create the COM+ server with the ID specified in its
command line.
Run
Run the client application and perform profiling in the usual manner.
To obtain profiling results, select Run | Get Results from AQtime’s menu (if you use
AQtime integrated into Microsoft Visual Studio, select AQtime | Get Results from Visual
Studio’s main menu; if you use AQtime integrated into Embarcadero RAD Studio, select
AQtime | Get Results from RAD Studio’s main menu).
© 2010 AutomatedQA Corp.
www.automatedqa.com/support
200
Profiling COM Applications
•
To stop your COM+ server, either select
Terminate from AQtime’s Standard toolbar (if you
use AQtime integrated into Microsoft Visual Studio or into Embarcadero RAD Studio, select
AQtime | Terminate from the main menu) or right-click the application node in Component
Services and select Shut Down from the context menu. Note that Terminate and Shut Down call
the Windows API TerminateProcess function. This function kills the process and does not
send any notifications to AQtime. So, AQtime does not generate any profiling results. That is why
you should select Get Results before terminating the server.
2.2. Profiling in COM Server Mode
To profile your application in COM Server mode, perform the following steps:
•
COM Server from the Profiling Mode dropdown list box that is displayed on
Select
AQtime’s Standard toolbar. If you use AQtime integrated into Microsoft Visual Studio, this item
is located on the AQtime toolbar. If you use AQtime integrated into Embarcadero RAD Studio,
this item is located on the AQtime Profiling Modes toolbar.
•
Specify run parameters for the profiled application. If you use AQtime standalone, choose Run |
Parameters from AQtime’s main menu. If you use AQtime integrated into Microsoft Visual
Studio, choose AQtime | Parameters from Visual Studio’s main menu. If you use AQtime
integrated into Embarcadero RAD Studio, choose AQtime | Parameters menu item. This will
open the Run Parameters dialog (for COM Server Mode). In the dialog:
•
In the Client Application box specify the name of the executable that will load COM+
server. This can be, for example, dllhost.exe located in the <Windows>\System32 folder.
Press OK to close the dialog.
Start profiling the application:
If you use AQtime standalone, press
If you use AQtime integrated into Microsoft Visual Studio, select AQtime| Run from
Visual Studio’s main menu.
If you use AQtime integrated into Embarcadero RAD Studio, select AQtime | Run With
Profiling from the main menu.
Run
AQtime will display a message box informing you that you should launch the client application.
•
Run the client application and profile the application as you normally would.
To obtain profiling results, select Run | Get Results from AQtime’s menu (if you use
AQtime integrated into Microsoft Visual Studio, select AQtime | Get Results from Visual
Studio’s main menu; if you use AQtime integrated into Embarcadero RAD Studio, select
AQtime | Get Results from RAD Studio’s main menu).
•
Terminate from AQtime’s Standard toolbar (if you
To stop your COM+ server, either select
use AQtime integrated into Microsoft Visual Studio or into Embarcadero RAD Studio, select
AQtime | Terminate from the main menu) or right-click the application node in Component
Services and select Shut Down from the context menu.
Profiling COM Logical Threads
www.automatedqa.com
AQtime by AutomatedQA Corporation
201
Profiling Various Applications and Code
A COM server may receive several requests from client applications simultaneously. To profile such a
situation correctly, the Allocation, BDE SQL, Coverage, Function Trace, Performance, Reference Count and
Resource profilers include a Thread model option that should be set to COM threads. This topic explains
why this is needed.
Suppose, you profile a COM server with two client applications (see the figure below):
Client A calls the server function F1. Suppose, this function executes for a long time (As shown on the figure
above, the function is displaying a message box. So, it will execute until a user closes this message box). Now
imagine that another client application, Client B, calls the server function F2, which finishes earlier than F1
(because the message box has not been closed).
Both functions can be executed in the same Windows thread. “This is the default implementation of the
COM servers with the Apartment threading model. COM servers with other threading models can also process
several client requests within the same thread.” you will probably say. The problem is that since F2 starts and
finishes during the F1 execution and both functions are run within the same thread, the Performance profiler
“thinks” that F2 is a child function of F1. This leads to inaccurate profiling results: the execution time of the F2
function is added to the time-with-children value of F1, the Details, Call Graph and Call Tree panels display
F2 as a child of F1, etc.
Setting the Thread model option to COM threads solves the problem. After you specify this value,
AQtime will perform additional check to determine the “relationship” of the COM server functions. This helps
avoid getting inaccurate profiler results. Note, however, that the additional check takes some time. If the
profilers always did this check, the profiling speed would be slower. You should use the COM threads value
if you profile a COM server with several clients, or if several threads in the same client application include
server function calls. The COM server threading model (apartment, single, etc.) is of no importance. The only
factor that specifies whether you should use this value is the number or clients.
© 2010 AutomatedQA Corp.
www.automatedqa.com/support
202
Profiling Web Server Applications (IIS, ASP.NET, etc.)
Profiling Web Server Applications (IIS, ASP.NET, etc.)
Web server applications are normally dynamic link libraries that are loaded and called by an HTTP server.
They are used to enhance the server capabilities. For instance, a Web server application can process user
requests and dynamically generate Web pages with the appropriate content. Web server applications can be
created with different compilers and can be meant for HTTP servers of different types (for Internet Information
Services, Apache, etc.) For instance, using Microsoft Visual Studio, you can create an IIS application that uses
the functionality provided by the .NET Framework and .NET assemblies.
The manner in which you profile your Web application with AQtime depends on the server type. For
profiling Web applications that work with Internet Information Services, AQtime offers special profiling
modes: IIS and ASP.NET.
A general recipe for profiling Web applications is rather simple: since a Web application is a DLL, you can
profile it in the same manner as you profile any other DLL. To do this, you can either run the HTTP server
process under AQtime or attach to that process at run time. The way you choose depends on the situation.
If you fully control the HTTP server, you can try to run it under AQtime:
•
Compile your Web application with debug information.
•
Load your application in AQtime.
•
Select the
•
Open the Run Parameters dialog and specify the fully qualified name of the HTTP server
executable in the Host Application edit box. Note that depending on their options, HTTP servers
can use different process names and different executables.
•
Start profiling the application:
Normal profiling mode.
If you use AQtime standalone, press
If you use AQtime integrated into Microsoft Visual Studio, select AQtime | Run from Visual
Studio’s main menu.
If you use AQtime integrated into Embarcadero RAD Studio, select AQtime | Run With
Profiling from the main menu.
In your Internet browser, open the Web page that loads your Web server application. Then
profile your application as you usually would.
Run.
Since the process that uses your DLL may never end by itself, you may need to use the Run | Get
Results menu item in order to obtain profiling results. Note that if you use AQtime integrated into
Microsoft Visual Studio, the
Get Results button is located on the AQtime toolbar. If you use
AQtime integrated into Embarcadero RAD Studio, use the AQtime | Get Results menu item.
Another way to obtain the results is to create an action that will “tell” AQtime to generate the results.
See the Getting Results During Profiling help topic for more information.
If for some reason the HTTP server process cannot be launched under AQtime, you can try attaching your
Web server DLL to it:
•
Compile your Web application with debug information.
•
Load your application in AQtime.
www.automatedqa.com
AQtime by AutomatedQA Corporation
203
Profiling Various Applications and Code
•
Select the
•
Attach to Process button on the
Select Run | Attach to Process from the main menu or press
Standard toolbar (if you use AQtime integrated into Microsoft Visual Studio, the
Attach to
Process button is located on the AQtime toolbar; if you use AQtime integrated into Embarcadero
RAD Studio, the
Attach to Process button does not reside on any toolbar by default, however,
you can add the button to any RAD Studio’s toolbar via the Toolbar Customization dialog). This
will call the Select Process to Attach dialog listing all the processes that are running at moment.
•
In the dialog, select the process of the HTTP server (to be more exact, you should select the
process that will load your DLL in memory) and press OK to attach to this process.
•
In your Internet browser, open the Web page that loads your Web server application. Then profile
your application as you usually would.
•
To obtain profiling results, use the Run | Get Results menu item (if you use AQtime integrated
into Microsoft Visual Studio, the
Get Results button is located on the AQtime toolbar; if you
use AQtime integrated into Embarcadero RAD Studio, select the AQtime | Get Results menu
item). Another way to obtain the results is to create an action that will "tell" AQtime to generate
the results. See the Getting Results During Profiling help topic for more information.
Normal profiling mode.
Profiling ASP.NET Applications
Profiling ASP.NET Applications - Overview
ASP.NET applications can be seen as Internet Information Services (IIS) applications that are built with
.NET compilers and that use functionality provided by the .NET Framework and .NET assemblies. Despite the
fact that ASP.NET applications are similar to IIS applications, they are profiled in a different manner. This
topic provides a brief overview of profiling ASP.NET applications and services with AQtime. For information
on how to profile ordinary (unmanaged) IIS applications, see the Profiling IIS Applications help topic.
Profiling ASP.NET applications requires 32- or 64-bit editions of Windows 7, Windows Server 2008,
Windows Vista, Windows XP, Windows Server 2003 or Windows 2000 with Internet Information Services
ver. 4.0 - 7.5.The manner in which you profile your application depends on the development tool that you use
to create the ASP.NET application. Any ASP.NET application created in any development tool can be profiled
using IIS. Additionally, Visual Studio 2005, Visual Studio 2008 and Visual Studio 2010 have their own server
- ASP.NET Development Server - that is generally used instead of IIS to develop and debug ASP.NET
applications. However, it is still possible to use IIS to profile your application outside of Visual Studio 2005,
2008 or 2010. The following topics provide instructions on different ways to profile ASP.NET applications.
Profiling ASP.NET Applications via ASP.NET Development Server
Describes how to profile ASP.NET applications or services using the ASP.NET Development Server.
Profiling ASP.NET Applications via Internet Information Services
Describes how to profile ASP.NET applications or services using the Internet Information Services
(IIS).
AQtime includes a number of samples that you can use to get started profiling ASP.NET applications.
XMLTrace
This sample parses an XML file and displays its contents and structure on screen.
You can find the application sources in the following folders:
Microsoft Visual Studio .NET 7.x projects:
© 2010 AutomatedQA Corp.
www.automatedqa.com/support
204
Profiling ASP.NET Applications
<AQtime Samples>\Managed\VS.NET\ASP.NET\XMLTrace\CS\ - Microsoft Visual C#
.NET
<AQtime Samples>\Managed\VS.NET\ASP.NET\XMLTrace\VB\ - Microsoft Visual Basic
.NET
<AQtime Samples>\Managed\VS.NET\ASP.NET\XMLTrace\JS\ - Microsoft Visual J#
.NET
Microsoft Visual Studio 2005, 2008 and 2010 projects:
<AQtime Samples>\Managed\VS2005\ASP.NET\XMLTrace\CS\ - Microsoft Visual C#
.NET
<AQtime Samples>\Managed\VS2005\ASP.NET\XMLTrace\VB\ - Microsoft Visual Basic
.NET
<AQtime Samples>\Managed\VS2005\ASP.NET\XMLTrace\JS\ - Microsoft Visual J#
.NET
MasterDetails
This sample demonstrates how to work with two linked tables. One table holds the IDs and names of
groups, another holds records kept for groups. The structure of the tables and the data are stored in XML
files (scheme.xml and datasets.xml accordingly). Initially, there is one group and a single record for it. The
application is an .aspx page that displays both tables and lets you edit their contents: add, rename and
remove groups, add records to groups, edit and delete them (singly or all at once).
You can find the sample projects in the following folders:
Microsoft Visual Studio .NET 7.x projects:
<AQtime Samples>\Managed\VS.NET\ASP.NET\MasterDetails\CS\ - Microsoft Visual C#
.NET
<AQtime Samples>\Managed\VS.NET\ASP.NET\MasterDetails\VB\ - Microsoft Visual
Basic .NET
<AQtime Samples>\Managed\VS.NET\ASP.NET\MasterDetails\JS\ - Microsoft Visual J#
.NET
Microsoft Visual Studio 2005, 2008 and 2010 projects:
<AQtime Samples>\Managed\VS2005\ASP.NET\MasterDetails\CS\ - Microsoft Visual C#
.NET
<AQtime Samples>\Managed\VS2005\ASP.NET\MasterDetails\VB\ - Microsoft Visual
Basic .NET
<AQtime Samples>\Managed\VS2005\ASP.NET\MasterDetails\JS\ - Microsoft Visual J#
.NET
On Windows 7, Windows Vista and Windows Server 2008, AQtime samples are located in the
<Users>\Public\Documents\AQtime 7 Samples folder. On other operating systems, the samples
reside in the <Documents and Settings>\All Users\Documents\AQtime 7 Samples folder.
Profiling ASP.NET Applications via ASP.NET Development Server
This topic describes how to profile ASP.NET applications or services using the ASP.NET Development
Server. The server is integrated into Microsoft Visual Studio 2005, Visual Studio 2008 and Visual Studio 2010
and can be easily applied while creating, debugging and profiling ASP.NET applications.
www.automatedqa.com
AQtime by AutomatedQA Corporation
205
Profiling Various Applications and Code
Currently, it is impossible to profile a 64-bit ASP.NET application via Visual Studio’s ASP.NET
Development Server because the server (WebDev.WebServer.exe) is an x86 process. You can run
and profile 64-bit ASP.NET applications with IIS. See the Profiling ASP.NET Applications via
Internet Information Services help topic for instructions on how to do this.
The topic contains the following sections:
Sample Application
In our description we will use a sample application called XMLTrace. It parses an XML file and displays
its contents and structure. You can find the application sources in the following folders:
<AQtime Samples>\Managed\VS2005\ASP.NET\XMLTrace\CS\ - Microsoft Visual C# 2005,
2008 and 2010 version
<AQtime Samples>\Managed\VS2005\ASP.NET\XMLTrace\VB\ - Microsoft Visual Basic 2005,
2008 and 2010 version
<AQtime Samples>\Managed\VS2005\ASP.NET\XMLTrace\JS\ - Microsoft Visual J# 2005
version
On Windows 7, Windows Vista and Windows Server 2008, AQtime samples are located in the
<Users>\Public\Documents\AQtime 7 Samples folder. On other operating systems, the samples
reside in the <Documents and Settings>\All Users\Documents\AQtime 7 Samples folder.
<AQtime
We
will
use
the
Visual
Basic
2005
sample
located
in
the
Samples>\Managed\VS2005\XMTrace\VB folder. To run this sample application, you will need Microsoft
Internet Explorer 5.5 or later.
Requirements
Profiling ASP.NET applications requires 32- or 64-bit editions of Windows 7, Windows Server 2008,
Windows Vista, Windows XP, Windows Server 2003 or Windows 2000 with Internet Information Services
ver. 4.0 - 7.5.
1. Compiling the Application
Open the sample project <AQtime Samples>\Managed\VS2005\ASP.NET\XMLTrace\VB\XMLTrace.sln
in Visual Studio and build or publish it. See How AQtime Profilers Use Metadata and Debug Information to
decide whether to include debug information. To learn how to compile ASP.NET applications with debug
information, see the Compiler Settings for ASP.NET help topic.
To build the project, select Build | Build Web Site from the Visual Studio menu.
To publish it, select the Build | Publish Web Site menu item and uncheck the “Allow this precompiled
site to be updatable” box in the ensuing Publish Web Site dialog. Select also the “Emit debug information”
check box in the dialog to generate debug information files.
When you build an ASP.NET application created as an ASP.NET Web Application project, Visual Studio
creates one common assembly for the application and puts it to the bin subfolder of the folder where the
application project resides.
When you compile an ASP.NET application created as an ASP.NET Web Site project (note that the
XMLTrace sample being considered is exactly an ASP.NET Web Site project), Visual Studio organizes the
application code into several temporary dynamic link libraries whose location and names are changed from one
compilation to another. Since ASP.NET Web Site projects are dynamically compiled by ASP.NET on the
server when users request the application’s web pages, Visual Studio does not create output assemblies with
the application code in the project’s folder when compiling the application. The assemblies are temporary and
© 2010 AutomatedQA Corp.
www.automatedqa.com/support
206
Profiling ASP.NET Applications
Visual Studio usually puts them along with debug information files (if you compile the application with debug
information) to the temporary subfolders of the <Windows>\Microsoft.NET\Framework\<Framework
Version>\Temporary ASP.NET Files folder. The library name includes the source file name and some hash
value and looks like App_Web_xmltrace.aspx.cdcab7d2.dll. Since the names are changed, you have to include
new modules in your AQtime project every time you compile your application, and there is no guarantee that
you will add all application modules, since their names and locations are defined by Visual Studio.
To avoid these problems, you can publish your ASP.NET Web Site project before profiling it (you should
publish your ASP.NET application every time you compile it). The folder that you will specify for publishing
will contain all DLLs generated for your ASP.NET application. It is recommended that you publish your
project to the folder that is used as a virtual directory. If you publish it to another folder, you should specify that
folder as a source folder for your virtual directory.
If you do not publish the project, you can still profile all application modules. To do this, add any module
to your AQtime project and check the Profile Entire .NET Code option in the Setup panel.
2. Profiling the Application
To profile your ASP.NET application with AQtime using the ASP.NET Development Server:
•
Open the application’s library modules from the folder that you published your application to in
AQtime’s Setup panel. If you did not publish your ASP.NET project, enable the Profile Entire
.NET Code option.
As it has been said above, when you build your ASP.NET project without
publishing it, the location of the resulting assemblies depends on the project’s type:
Note:
•
If you use an ASP.NET Web Application project, you can find the
resulting assemblies in the bin subfolder of the project’s folder.
•
If you use an ASP.NET Web Site project, you can find the resulting
assemblies
in
the
temporary
subfolders
of
the
<Windows>\Microsoft.NET\Framework\<Framework
Version>\Temporary ASP.NET Files folder.
•
Select
•
Select Run | Parameters from the main menu and specify an ASP.NET Development Server as a
host application and define command line parameters to it in the Run Parameters Dialog (for
Normal Mode). The name and location of the server’s executable depend on the Visual Studio
version you use and on .NET Framework’s version used by your ASP.NET application:
Normal from the Profiling Mode dropdown list box on AQtime’s Standard toolbar.
If you use Visual Studio 2005, the ASP.NET Development Server’s executable is the
following:
<Windows>\Microsoft.NET\Framework\<Framework
Version>\WebDev.WebServer.exe
If you use Visual Studio 2008, the ASP.NET Development Server’s executable is the
following:
<Program
Files>\Common
Shared\DevServer\9.0\WebDev.WebServer.exe
Files\Microsoft
If you use Visual Studio 2010 and the profiled ASP.NET application uses .NET
Framework 4.0, specify the following executable as the host application:
<Program
Files>\Common
Shared\DevServer\10.0\WebDev.WebServer40.exe
www.automatedqa.com
Files\Microsoft
AQtime by AutomatedQA Corporation
207
Profiling Various Applications and Code
If you use Visual Studio 2010 and the profiled ASP.NET application uses .NET
Framework 3.5 or an earlier version, specify the following executable as the host
application:
<Program
Files>\Common
Shared\DevServer\10.0\WebDev.WebServer20.exe
Files\Microsoft
A command line defines the port number, physical path and virtual path of the profiled ASP.NET
application and has the following syntax: /port:<port_number> /path:<physical_path>
[/vpath:<virtual_path>] where:
<port_number> - the number of an unused port, between 1 and 65535.
<physical_path> - a valid directory name where the ASP application is located.
<virtual_path> - [optional] a virtual path or application root in the form '/<app name>'.
The default value is '/'.
For instance, for the sample project the command line would be:
/port:1169
/path:"C:\Work\AQtime
Samples\Managed\VS2005\ASP.NET\XMLTrace" /vpath:"/XMLTrace"
7
•
Select the desired profiler and press Run to start profiling. AQtime may ask your permission to
restart the IIS Admin service. Answer “Yes” to this question.
•
Launch Internet Explorer and open the http://localhost/XMLTrace/VB/xmltrace.aspx file in it. Do
not open this page from the Internet Information Services window with the Browse command.
Perform the profiling as your needs dictate.
When you are profiling an ASP.NET application, the Event View panel displays events that occur
both in the ASP.NET process and in the profiled application. One important thing about this is that
all displayed general events occurred in the ASP.NET process, all .NET specific events occurred
in the profiled ASP.NET application. (For detailed information on general events and .NET
specific events, see Event View Panel).
•
To obtain the results, select Run | Get Results from AQtime’s menu. Another way to obtain the
results is to create an action that will “tell” AQtime to generate the results. See the Getting Results
During Profiling help topic for more information.
•
To terminate the profiler run, select Run | Terminate from AQtime’s main menu or press
Terminate on the Standard toolbar.
Notes on using the Allocation Profiler
Your application may contain classes inherited from the System.Web.UI.Page or
System.Web.HttpApplication class. If you include these inherited classes in profiling tasks and profile
your .NET application with the Allocation profiler, you may note that AQtime reports that no instances of the
inherited classes are created.
This happens because the ASP.NET process does not create instances of your classes, which are inherited
from System.Web.UI.Page or System.Web.HttpApplication. It creates instances of temporary classes
that are inherited from your classes. Since your classes are not created, the profiling results are empty for them.
However, the Allocation profiler automatically includes temporary classes in profiling tasks and traces the
creation and deletion of their instances. By viewing profiling results for temporary classes, you can see how the
application used your classes during the profiler run.
The names of temporary classes inherited from System.Web.UI.Page have the following format:
ASPXFileName_aspx,
© 2010 AutomatedQA Corp.
www.automatedqa.com/support
208
Profiling ASP.NET Applications
where ASPXFileName is the name of the .aspx file (excluding the file extension) that refers to your class.
For instance, the XMLTrace sample application includes the XMLTrace.aspx file that refers to the
XMLTraceForm class defined in XMLTrace.aspx.cs. The name of a temporary class inherited from the
XMLTraceForm class will be XMLTrace_aspx.
The names of temporary classes inherited from System.Web.HttpApplication have the
ASAXFileName_asax format. For example, the XMLTrace application includes the Global.asax file that
holds a reference to the Global class defined in Global.asax.cs. The name of a temporary class inherited from
Global will be Global_asax.
Profiling ASP.NET Applications via Internet Information Services
This topic describes how to profile ASP.NET applications or services using the Internet Information
Services (IIS). Any ASP.NET application that is created with any development tool can be profiled with the
help of the IIS. Applications created in Microsoft Visual Studio 2005, Visual Studio 2008 or Visual Studio
2010 can also be profiled with the ASP.NET Development Server, but there are some difficulties with profiling
64-bit applications. See the Profiling ASP.NET Applications via ASP.NET Development Server help topic for
details.
Sample Application
In our explanation we will use a sample application called XMLTrace. It parses an XML file and displays
its contents and structure. You can find the application’s sources in the following folders:
Microsoft Visual Studio .NET 7.x projects:
<AQtime Samples>\Managed\VS.NET\ASP.NET\XMLTrace\CS\ - Microsoft Visual C# .NET version
<AQtime Samples>\Managed\VS.NET\ASP.NET\XMLTrace\VB\ - Microsoft Visual Basic .NET
version
<AQtime Samples>\Managed\VS.NET\ASP.NET\XMLTrace\JS\ - Microsoft Visual J# .NET version
On Windows 7, Windows Vista and Windows Server 2008, AQtime samples are located in the
<Users>\Public\Documents\AQtime 7 Samples folder. On other operating systems, the
samples reside in the <Documents and Settings>\All Users\Documents\AQtime 7 Samples
folder.
We
will
use
the
Visual
Basic
.NET
sample
located
in
the
<AQtime
Samples>\Managed\VS.NET\XMTrace\VB folder. To run this sample application, you will need Microsoft
Internet Explorer 5.5 or later.
Requirements
Profiling ASP.NET applications requires 32- or 64-bit editions of Windows 7, Windows Server 2008,
Windows Vista, Windows XP, Windows Server 2003 or Windows 2000 with Internet Information Services
ver. 4.0 - 7.5.
To profile 32-bit ASP.NET modules on a 32-bit operating system, you use AQtime x86.
To profile 64-bit ASP.NET modules on a 64-bit operating system, you use AQtime x64.
To profile 32-bit ASP.NET modules on a 64-bit operating system, you can use either AQtime x86, or
AQtime x64. However, you should enable the support for 32-bit applications in the IIS and ASP.NET settings.
For more information on this, see below.
1. Configuring IIS
www.automatedqa.com
AQtime by AutomatedQA Corporation
209
Profiling Various Applications and Code
In further explanations, we will assume that ASP.NET and IIS are running in the default configuration. If
ASP.NET or IIS is running under a user account, you should specify certain permissions for this account.
Follow the link for more information about this.
For 64-bit versions of IIS: Under 64-bit versions of Windows, the ASP.NET process can operate in 64-bit
mode (default) or in 32-bit mode. On 64-bit operating systems, 64-bit processes cannot load 32-bit DLLs and
32-bit processes cannot load 64-bit libraries. So, if your IIS application is a 32-bit application and you are
going to run it on a 64-bit version of IIS, then you must configure IIS in order for it to be able to run your
application.
To switch ASP.NET and IIS to the 32-bit mode:
•
Open the command-line window, type the following command and press ENTER:
cscript
%SystemDrive%\inetpub\AdminScripts\adsutil.vbs
W3SVC/AppPools/Enable32BitAppOnWin64 1
SET
•
Go to the <Windows>\Microsoft.NET\Framework\<Framework_Version> folder. Here,
NET_VERSION is a placeholder for the folder, whose name corresponds to the .NET Framework
version installed on your computer. For instance, it can be v1.1.4322, v2.0.50727 and so on.
•
Run the aspnet_regiis.exe executable that resides in this folder with the -i argument in the
command line:
aspnet_regiis.exe -i
To switch ASP.NET and IIS back to the 64-bit mode:
•
Open the command-line window, type the following command and press ENTER:
cscript
%SystemDrive%\inetpub\AdminScripts\adsutil.vbs
W3SVC/AppPools/Enable32BitAppOnWin64 0
•
SET
Go to the <Windows>\Microsoft.NET\Framework64\<Framework_Version> folder (note the 64
postfix in the folder name) and run the aspnet_regiis.exe executable that resides in this folder:
aspnet_regiis.exe -i
2. Preparing Application for Profiling
Open the sample project <AQtime Samples>\Managed\VS.NET\ASP.NET\XMLTrace\VB\XMLTrace.sln
in Visual Studio and compile it there. See the How AQtime Profilers Use Metadata and Debug Information
help topic to decide whether to include debug information. To learn how to compile ASP.NET applications
with debug information, see the Compiler Settings for ASP.NET help topic.
For Visual Studio 2005, 2008 or 2010 users: When you compile an ASP.NET application created as an
ASP.NET Web Site project (note that the XMLTrace sample is exactly an ASP.NET Web Site project), Visual
Studio organizes the application code into several temporary dynamic link libraries whose location and names
are changed from one compilation to another. Since ASP.NET Web Site projects are dynamically compiled by
ASP.NET on the web server when users request the application’s web pages, Visual Studio does not create
output assemblies with the application code in the project’s folder when compiling the application. The
assemblies are temporary, and Visual Studio usually puts them and debug information files (if you compile the
application
with
debug
information)
to
temporary
subfolders
of
the
<Windows>\Microsoft.NET\Framework\<Framework Version>\Temporary ASP.NET Files folder. Since the
names are changed, you have to include new modules in your AQtime project every time you compile your
application, and there is no guarantee that you will add all application modules, since their names and locations
are defined by Visual Studio.
To avoid these problems, you can publish your ASP.NET Web Site project before profiling it (you should
publish your ASP.NET application every time you compile it). The folder that you will specify for publishing
will contain all DLLs generated for your ASP.NET application. It is recommended that you publish your
© 2010 AutomatedQA Corp.
www.automatedqa.com/support
210
Profiling ASP.NET Applications
project in the folder that is used as a virtual directory. If you publish it to another folder, you should specify that
folder as a source folder for your virtual directory.
For Visual Studio .NET 7.x users: The XMLTrace application compiled with Visual Studio .NET 7.x
requires that the System.Web.dll library be in the application’s folder. Copy this library from your .NET
Framework folder (for example, <Windows>\Microsoft.NET\Framework\<Framework_Version>) to the
<AQtime Samples>\Managed\ASP.NET\XMLTrace\VB\bin folder.
3. Adding Application to IIS
Next, we need to create an IIS application corresponding to our sample ASP.NET application. The way
you do this depends on the IIS version.
3.1. Adding Application to IIS 4 - 6
•
Open the Control Panel | Administrative Tools | Internet Information Services window (it is
displayed in Microsoft Management Console).
•
Right-click the Default Web Site node and select New | Virtual Directory from the context menu.
Follow the instructions of the ensuing wizard to create a new virtual directory. Specify XMLTrace
as the virtual directory alias and map this virtual directory to the folder, where the compiled DLLs
reside.
•
In the Internet Information Services Manager, right-click the XMLTrace\VB node and select
Properties from the context menu.
www.automatedqa.com
AQtime by AutomatedQA Corporation
211
Profiling Various Applications and Code
This will call the dialog where you can create and modify properties of our IIS application.
© 2010 AutomatedQA Corp.
www.automatedqa.com/support
212
Profiling ASP.NET Applications
•
In the dialog, press Create. This will create a new IIS application. Then press OK to close the
dialog.
3.2. Adding Application to IIS 7 - 7.5
•
Open the Control Panel | Administrative Tools | Internet Information Services (IIS)
Manager window.
•
Right-click the Default Web Site node and select Add Application from the context menu.
www.automatedqa.com
AQtime by AutomatedQA Corporation
213
Profiling Various Applications and Code
Use the ensuing Add Application dialog to create a new IIS application. Specify XMLTrace as the
application alias and map it to the folder where the compiled DLLs reside.
4. Preparing AQtime Projects When Profiling 64-bit ASP.NET Applications
AQtime can profile both 32- and 64-bit ASP.NET applications. These applications are opened either with
a 32- or a 64-bit IIS process. When you start profiling in ASP.NET mode, AQtime attempts to detect the
“bitness” of this process automatically. To do this, AQtime finds virtual folders that contain modules added to
the Setup panel and then detects the “bitness” of IIS application pools in which these modules are used.
However, this approach does not work if you are profiling a module that does not belong to any virtual
folder:
If your project contains only those modules that do not belong to a virtual folder, AQtime is unable to
detect the “bitness” automatically and always works with a 32-bit IIS process. To work around this problem,
include a DLL, which is located in a virtual folder, in your AQtime project. This will help AQtime determine
the “bitness” of the IIS process. There is no need to include it in profiling tasks if you do not need this. The only
purpose of this DLL is to help AQtime.
5. Running a Profiler
Now we can profile our ASP.NET application with AQtime:
•
Load your application’s module in AQtime. The xmltrace.dll file is in the XMLTrace\VB\bin
folder, if you compiled the application in Visual Studio .NET. If you have compiled the sample in
Visual Studio 2005, 2008 or 2010, the module name and location will differ: the name will include
the source file name and a hash
value, for instance, it can be
© 2010 AutomatedQA Corp.
www.automatedqa.com/support
214
Profiling ASP.NET Applications
App_Web_xmltrace.aspx.cdcad7d2.dll, and the module will reside in a temporary subfolder of the
<Windows>\Microsoft.NET\Framework\<Framework Version>\Temporary ASP.NET Files
folder. Besides that, if you publish the sample in Visual Studio 2005, 2008 or 2010, you can find
application modules in the folder you publish the project to.
ASP.NET from the Profiling Mode drop-down list box on AQtime’s Standard toolbar
Select
(if you use AQtime integrated into Microsoft Visual Studio, the Profiling Mode drop-down list
box is located on the AQtime toolbar; if you use AQtime integrated into Embarcadero RAD
Studio, the ASP.NET item is located on the AQtime Profiling Modes toolbar):
•
Select the desired profiler and press Run to start profiling. AQtime may ask your permission to
restart the IIS Admin service. Answer “Yes” to this question.
If you use AQtime integrated into Microsoft Visual Studio, then to select the desired profiler, you
can use either the AQtime | Profiler menu item or the Profilers box on AQtime's toolbar. To start
profiling the application, select AQtime | Run (or Debug | Run while one of AQtime panels is
active) from Visual Studio’s main menu.
If you use AQtime integrated into Embarcadero RAD Studio, then to select the desired profiler,
use the AQtime | Current Profiler menu item. To start profiling the application, choose AQtime
| Run With Profiling menu item.
•
Open the http://localhost/XMLTrace/VB/xmltrace.aspx file in Internet Explorer and perform
profiling as your needs dictate.
To avoid launching Internet Explorer manually, you can specify the desired Web page in the Start
Page box of the Run Parameters dialog (for ASP.NET Mode). In this case, AQtime will
automatically open this page in Internet Explorer once you start profiling.
When profiling an ASP.NET application, the Event View panel displays events that occur in the
ASP.NET process and in the profiled application. One important thing about this is that all
displayed general events occurred in the ASP.NET process, while all .NET specific events
occurred in the profiled ASP.NET application. (For detailed information on general events and
.NET specific events, see the Event View panel help topic).
In the default configuration, IIS works as a service. It does not close when you close Internet
Explorer, so AQtime does not generate profiling results. To obtain the results, select Run | Get
Results from AQtime’s menu (if you use AQtime integrated into Microsoft Visual Studio, select
www.automatedqa.com
AQtime by AutomatedQA Corporation
215
Profiling Various Applications and Code
AQtime | Get Results from the main menu; if you use AQtime integrated into Embarcadero RAD
Studio, select Get Results from the AQtime menu). Another way to obtain the results is to create
an action that will “tell” AQtime to generate the results. See the Getting Results During Profiling
help topic for more information.
•
To terminate the profiler run, select Run | Terminate from AQtime’s main menu or press
Terminate on the Standard toolbar. If you use AQtime integrated into Microsoft Visual Studio
or into Embarcadero RAD Studio, select AQtime | Terminate from the main menu.
Notes on Using the Allocation Profiler
Your application may contain classes inherited from the System.Web.UI.Page or
System.Web.HttpApplication class. If you include these inherited classes in profiling tasks and profile
your .NET application with the Allocation profiler, you may note that AQtime does not report any instances of
the inherited classes that are created.
This happens because the ASP.NET process does not create instances of your classes, which are inherited
from System.Web.UI.Page or System.Web.HttpApplication. It creates instances of temporary classes
that are inherited from your classes. Since your classes are not created, the profiling results are empty for them.
However, the Allocation profiler automatically includes temporary classes in profiling tasks and traces the
creation and deletion of their instances. By viewing profiling results for temporary classes, you can see how the
application used your classes during the profiler run.
The names of temporary classes inherited from System.Web.UI.Page have the following format:
ASPXFileName_aspx,
where ASPXFileName is the name of the .aspx file (excluding the file extension) that refers to your class.
For instance, the XMLTrace sample application includes the XMLTrace.aspx file that refers to the
XMLTraceForm class defined in XMLTrace.aspx.cs. The name of a temporary class inherited from the
XMLTraceForm class will be XMLTrace_aspx.
The names of temporary classes inherited from System.Web.HttpApplication have the
ASAXFileName_asax format. For example, the XMLTrace application includes the Global.asax file that
holds a reference to the Global class defined in Global.asax.cs. The name of a temporary class inherited from
Global will be Global_asax.
Profiling IIS Applications
This topic describes profiling of Internet Information Services (IIS) applications created with unmanaged
(ordinary) compilers. Using .NET compilers provided by Microsoft Visual Studio, you can create IIS
applications that use .NET assemblies. For more information on how to profile these applications, see the
Profiling ASP.NET Applications help topic. To learn how to profile Windows services, review the Profiling
Services help topic.
Requirements
•
Profiling IIS applications requires Windows 2000, Windows XP (either 32-, or 64-bit edition),
Windows Server 2003 (either 32-, or 64-bit edition), Windows Vista (either 32-, or 64-bit edition),
Windows Server 2008 (either 32-, or 64-bit edition) or Windows 7 (either 32-, or 64-bit edition)
and Internet Information Services ver. 4.0 - 7.5.
•
Currently, AQtime can profile only those IIS applications, whose “bitness” corresponds to the
“bitness” of the operating system. That is, if you run AQtime x64 on a 64-bit operating system, it
will only be able to profile 64-bit applications. If you run AQtime x86 on a 32-bit operating
© 2010 AutomatedQA Corp.
www.automatedqa.com/support
216
Profiling ASP.NET Applications
system, it will only be able to profile 32-bit applications. Currently, when AQtime x86 runs on a
64-operating system it cannot profile 32-bit IIS applications.
1. Configuring IIS
In our explanations, we assume that IIS is running in the default configuration. If it is running under a user
account, you should specify certain permissions for this account. Follow the link for more information about
this.
If you use IIS ver. 4 - 6, Disable the Cache ISAPI applications setting of IIS:
•
Open the Internet Information Services Manager dialog (Control Panel | Administrative
Tools | Internet Information Services).
•
Right-click the root node of your Web site and select Properties from the context menu. This will
open the Properties dialog for the root virtual directory.
•
In the dialog, switch to the Home Directory page and press Configuration there:
The Application Configuration dialog will appear.
•
Uncheck the Cache ISAPI applications box there and click OK to save changes:
www.automatedqa.com
AQtime by AutomatedQA Corporation
217
Profiling Various Applications and Code
For 64-bit versions of IIS: On 64-bit operating systems, 64-bit processes cannot load 32-bit DLLs and
32-bit processes cannot load 64-bit libraries. So, if your IIS application is a 32-bit application and you are
going to run it on a 64-bit version of IIS, then you must configure IIS in order for it to be able to run your
application.
To do this, open the command-line window, type the following command and press ENTER :
cscript
%SystemDrive%\inetpub\AdminScripts\adsutil.vbs
W3SVC/AppPools/Enable32BitAppOnWin64 1
SET
2. Preparing Application for Profiling
To profile your IIS application with AQtime, you must compile it with debug information. For information
on the required compiler settings, see the Compiler Settings for Native Applications and Compiler Settings for
.NET Applications help topics.
Also, you need to configure your IIS application as described below. The procedure depends on the IIS
version you use.
2.1. Setting Up Properties of IIS 4 - 6 Applications
To configure an application running IIS ver. 4 - 6 for profiling, follow these steps:
•
Open the Internet Information Services Manager dialog (Control Panel | Administrative
Tools | Internet Information Services).
•
Create a virtual directory for your IIS application. To do this, right-click the Default Web Site
node and select New | Virtual Directory from the context menu:
© 2010 AutomatedQA Corp.
www.automatedqa.com/support
218
Profiling ASP.NET Applications
Then follow the instructions of the ensuing dialog.
•
In the Internet Information Services Manager, right-click your virtual directory and select
Properties from the context menu.
•
The Properties dialog will appear. In the dialog:
Switch to the Directory tabbed page.
www.automatedqa.com
AQtime by AutomatedQA Corporation
219
Profiling Various Applications and Code
•
Select Scripts and Executables in the Execute permissions drop-down list.
Remember or write down the value of the Application Protection option of your IIS
application. We will need it later.
Press OK to save changes.
If you set the Application Protection option in the Properties dialog to High (Isolated) or
Medium (Pooled), you should modify properties that specify the user account, under which the
IIS process will run. To do this:
Open Control Panel | Administrative Tools | Component Services.
Expand the tree down to the node Console Root | Component Services | Computers |
My Computer | COM+ Applications | IIS Out-of-Process Pooled Applications.
Right-click the IIS Out-of-Process Pooled Applications node and select Properties
from the context menu. The IIS Out-of-Process Pooled Applications Properties dialog
will appear.
Switch to the Identity page of this dialog and set the Account option to Interactive user.
© 2010 AutomatedQA Corp.
www.automatedqa.com/support
220
Profiling ASP.NET Applications
Close the dialog by pressing OK.
2.2. Setting Up Properties of IIS 7 - 7.5 Applications
To configure an application running IIS ver. 7 - 7.5 for profiling, follow these steps:
•
Open the Internet Information Services Manager dialog (Control Panel | Administrative
Tools | Internet Information Services; Control Panel | Administrative Tools | Internet
Information Services (IIS) Manager).
•
Create a virtual directory for your IIS application. To do this, right-click the Default Web Site
node and select Add Virtual Directory from the context menu:
www.automatedqa.com
AQtime by AutomatedQA Corporation
221
Profiling Various Applications and Code
Then follow the instructions of the ensuing dialog.
•
In the Internet Information Services Manager, select your virtual directory and double-click the
Handler Mappings item in the Features View.
•
Click Edit Handler Permissions (Edit Feature Permissions, in case of IIS 7.5) in the Actions
pane. The Edit Handler Permissions (Edit Feature Permissions, in case of IIS 7.5) dialog
appears.
•
In the dialog, check the Script and Execute options and press OK to save the changes.
•
If your IIS application includes dynamic content provided by .exe or .dll files, you need to
configure ISAPI and CGI Restrictions that will enable their execution on the server. To do this:
In the Internet Information Services Manager, select the node corresponding to your web
server (this is the top-most node in the Connections tree).
Double-click ISAPI and CGI Restrictions in the Feature View.
© 2010 AutomatedQA Corp.
www.automatedqa.com/support
222
Profiling ASP.NET Applications
Click Add in the Actions pane. The Add ISAPI or CGI Restriction dialog appears.
In the dialog:
o
Specify the full path to the .dll or .exe file in the ISAPI or CGI Path box.
o
Enter any descriptive text for the ISAPI or CGI restriction in the Description box.
o
Check Allow the extension path to execute:
o
Press OK to close the dialog and add the specified restriction.
3. Running a Profiler
Now we can profile our IIS application with AQtime:
•
Load your application in AQtime.
•
Select
IIS from the Profiling Mode dropdown list box on AQtime’s Standard toolbar. If you
use AQtime integrated into Microsoft Visual Studio, this list box is located on the AQtime
toolbar. If you use AQtime integrated into Embarcadero RAD Studio, the IIS item is located on the
AQtime Profiling Modes toolbar.
•
Select Run | Parameters from AQtime’s main menu. If you use AQtime integrated into Microsoft
Visual Studio, select AQtime | Parameters from Visual Studio’s main menu. If you use AQtime
integrated into Embarcadero RAD Studio, select AQtime | Parameters from the main menu. This
will call the Run Parameters dialog (for IIS Mode).
•
In the dialog’s Start Page edit box, you can specify the Web page that loads your IIS application.
AQtime will automatically open this page in Internet Explorer once you start profiling. If you do
not specify the start page in this dialog, you will have to open the desired page in Internet Explorer
manually.
•
Select the desired profiler and click
Run to start profiling.
If you use AQtime integrated into Microsoft Visual Studio, then to select the desired profiler, you
can use either the AQtime | Profiler menu item or the Profilers box on AQtime's toolbar. To start
profiling the application, select AQtime | Run (or Debug | Run while one of AQtime panels is
active) from Visual Studio’s main menu.
If you use AQtime integrated into Embarcadero RAD Studio, then to select the desired profiler,
use the AQtime | Current Profiler menu item. To start profiling the application, choose AQtime
| Run With Profiling menu item.
www.automatedqa.com
AQtime by AutomatedQA Corporation
223
Profiling Various Applications and Code
•
AQtime will display a message box notifying you that the IISAdmin service should be restarted.
Press Yes to restart the service.
•
If you do not specify the start page in the Run Parameters dialog, AQtime will wait for the start of
the process that will use your DLL (IIS applications are normally DLLs). This process can be
either the IIS process (inetinfo.exe) or a helper process, which the IIS uses to load your application
(for example, dllhost.exe or w3wp.exe). For which process AQtime waits depends on the IIS
version you use and on the Application Protection option of your IIS application.
•
To start the process, open the page that loads your IIS application, in Internet Explorer. Note that
you can avoid manual opening of the page by specifying it in the Start Page edit field of the Run
Parameters dialog (for IIS Mode).
•
Now you can perform profiling as your needs dictate.
In the default configuration, IIS works as a service. It does not close when you
close Internet Explorer, so AQtime does not generate any profiling results. To
obtain the results, select Run | Get Results from AQtime’s menu (if you use
AQtime integrated into Microsoft Visual Studio or into Embarcadero RAD
Studio, select AQtime | Get Results from the main menu). Another way to obtain
the results is to create an action that will “tell” AQtime to generate the results. See
the Getting Results During Profiling help topic for more information.
•
To terminate the profiler run, select Run | Terminate from AQtime’s main menu or press
Terminate on the Standard toolbar. If you use AQtime integrated into Microsoft Visual Studio
or into Embarcadero RAD Studio, select AQtime | Terminate from the main menu.
Samples
AQtime includes an example of IIS applications - IISSample. It demonstrates how you can profile IIS
applications with AQtime. For more information on this, see the Profiling IIS Applications – Tutorial help
topic. You can find the sample in the following folder:
<AQtime Samples>\Unmanaged\IISSample - Borland Delphi
Profiling ASP.NET and IIS Applications: ASP.NET or IIS is Running Under a
User Account
If either IIS or the ASP.NET process is running under a user account, before profiling your application,
you should assign specific permissions to this user to allow them to profile ASP.NET applications:
•
Open the Control Panel | Administrative Tools | Local Security Policy window.
•
Select Local Policies | User Rights Assignment from the tree view on the left side of the dialog.
•
Ensure that the user name is added to the following lists of security settings:
•
Act as part of the operating system
Log on as a service
Generate security audits
Replace a process level token
After the above settings are selected, restart your computer.
Once you have set the permissions, you can profile your application as it is described in the Profiling
ASP.NET Applications and Profiling IIS Applications help topics.
© 2010 AutomatedQA Corp.
www.automatedqa.com/support
224
Profiling Scripts
Profiling Scripts
Profiling Scripts - Overview
Code written in a scripting language is similar to code written in a traditional programming language. So, it
may have performance issues too. This topic describes how you can profile script code with AQtime.
Supported Scripting Languages and Engines
You can use AQtime to profile scripts executed by the Microsoft Scripting Engine. For example, this
engine is used by Internet Explorer, TestComplete and Windows Script Host (this utility allows you to run
scripts directly from Microsoft Windows). The engine supports the VBScript and JScript scripting languages.
Thus, AQtime can profile web scripts, TestComplete projects and Windows Script Host tasks that are written
in these two languages.
You can also profile TestComplete projects created with C#Script and C++Script, as in TestComplete,
C#Script and C++Script are based on JScript.
Currently, AQtime cannot profile TestComplete’s DelphiScript projects and web scripts from pages
displayed in the Firefox and Opera browsers, because neither of these browsers, nor this language uses the
Microsoft Scripting Engine.
AQtime cannot profile server-side scripts of ASP pages. It can only profile client scripts of ASP pages that
are run by the browser.
AQtime supports profiling scripts that are run by 64-bit versions of Internet Explorer, but it cannot profile
scripts executed in other 64-bit processes. This happens because there are no script debugging libraries that can
be used in these processes.
Preparation
Script code is executed by an application that hosts the script engine. In order for AQtime to be able to
collect scripting data, you need to configure your computer and host application before profiling. For complete
information on the actions to be performed, see the Profiling Scripts – Prerequisites help topic.
Supported Profilers
Currently, scripts can be profiled with the following profilers:
•
Performance Profiler
•
Coverage Profiler
•
Light Coverage Profiler
•
Function Trace Profiler
Profiling Steps
To profile a script, you should launch the host application under AQtime and then execute the script in that
application. AQtime recognizes the script’s activity and reports its results along with the application results.
There are three ways to profile scripts, they vary in the module that is added to the project: a host application, a
script file or a URL -Profiling Scripts Using Host Applications
Profiling Script Files
Profiling Scripts Located on Web Pages
www.automatedqa.com
AQtime by AutomatedQA Corporation
225
Profiling Various Applications and Code
If you profile scripts running in Internet Explorer 8, then before you start profiling, close all the
Internet Explorer windows. Do not open windows or pages (except for the profiled window and page)
until the profiling is over.
Read the Profiling Scripts in Internet Explorer 8 topic to learn about the other peculiarities of
profiling under this browser.
Analyzing Script Profiling Results
The results of script profiling are reported along with the host application’s profiling results. There is no
significant difference between results produced upon profiling ordinary applications and libraries and results
of script profiling.
To distinguish the results of script profiling from the results of host application profiling, you can use the
Code Type column of the Report panel. The values of this column indicate the type of the routine’s code. For
script results this column holds the Script value. You can group or filter the results by this value. By default,
the Code Type column is hidden, but you can display it via the Field Chooser. See the Adding and Removing
Columns help topic.
Note that sometimes results of script profiling performed by the Coverage or Light Coverage profiler may
contain duplicated items in the Report panel for some script routines. This happens due to some specifics of the
script engine's and the profilers' (Coverage and Light Coverage) functioning. To learn how to solve this
problem, see the Profiling Scripts – Troubleshooting help topic.
Troubleshooting
For information on how to resolve problems that may occur during script profiling, see the Profiling
Scripts – Troubleshooting help topic.
Profiling Scripts - Prerequisites
This topic describes the actions you may need to perform in order to profile scripts with AQtime.
1. Checking for Required Components
The script profiling feature requires the Windows Script and Script Debugger components. The Windows
Script component is supplied with each Microsoft operating system (since Windows 98), thus it is already
present on your machine. The Script Debugger may also be installed on your machine, as it is shipped along
with Visual Studio (since version 2003) and Microsoft Office (version XP and later).
If you have problems with profiling scripts, try reinstalling these components. You can find the standalone
packages at Microsoft Download Center (http://www.microsoft.com/downloads). Just search for the
following items:
•
Windows Script (Windows Script 5.6 or later is required)
•
Script Debugger
The versions of Windows Script and Script Debugger may be different and incompatible with one another. For
information on possible problems and workaround for them, see the Profiling Scripts – Troubleshooting help
topic.
2. Setting User Permissions
© 2010 AutomatedQA Corp.
www.automatedqa.com/support
226
Profiling Scripts
In order to debug script code, your user account must have the Launch and Activation and Access
permissions for the Machine Debug Manager system component. By default, these permissions are granted to
user accounts that belong to the Administrators and Debugger Users groups. To obtain the permissions, ask
your administrator to add your account to these groups. An alternative way is to ask your administrator to
modify permissions for the Machine Debug Manager component.
You can change the permissions using the Component Services snap-in:
•
The way you open the snap-in depends on your operating system:
In Windows XP and earlier versions - open the Control Panel | Administrative Tools |
Component Services from the Start menu.
In Windows Vista and later versions - add the Component Services snap-in to the
Microsoft Management Console (MMC):
o
Type “mmc” in a command window and press ENTER. The Microsoft
Management Console will appear.
o
Select the File | Add/Remove Snap-in... from the main menu.
o
Press Add in the Add Standalone snap-in dialog.
o
Select the Component Services from the list and click Add to confirm adding.
•
Now the Component Services snap-in is available for configuring.
•
Select the Console Root | Component Services | Computers | My Computer | DCOM Config
node in the tree on the left of the window.
•
Right-click Machine Debug Manager in the list of available components and choose Properties
from the context menu.
•
Switch to the Security tabbed page of the subsequent dialog.
•
Choose Customize in the Launch and Activation Permissions group and press Edit.
•
Select your user account in the ensuing dialog, enable the Allow checkmark at least for the Local
Launch and Local Activation items and press OK to close the dialog.
www.automatedqa.com
AQtime by AutomatedQA Corporation
227
Profiling Various Applications and Code
•
Choose Customize in the Access Permissions group and press Edit.
•
Select your user account in the ensuing dialog, enable the Allow checkmark at least for the Local
Access item and press OK to close the dialog.
•
Press OK in the Machine Debug Manager Properties dialog to close it and save the changes.
3. Preparing the Host Application for Script Profiling
AQtime gathers data about scripting activity from the Microsoft Scripting Engine. It tracks the debug
information that is passed to the engine. Therefore, in order to obtain profiling results in AQtime, the following
conditions should be met:
a. The host application should generate debug information
b. The debug information should be handled by the Microsoft Scripting Engine
The settings that allow meeting these conditions depend on a particular host application. The settings for
frequently used script hosts are described below.
3.1 Preparing Internet Explorer
To intercept the scripting activity from Internet Explorer ver. 7 and earlier, you should enable the browser’s
script debugger. If you use Internet Explorer 8, no script debugger is required. See the Profiling Scripts in
Internet Explorer 8 help topic.
To enable the browser’s script debugger:
© 2010 AutomatedQA Corp.
www.automatedqa.com/support
228
Profiling Scripts
•
Open the Control panel.
•
Select Internet Options.
•
Switch to the Advanced page of the ensuing Internet Options dialog.
•
Clear the Disable Script Debugging (Internet Explorer) and Disable Script Debugging
(Other) check boxes in the Browsing category.
•
Click OK to save the changes and close the dialog.
3.2 Preparing TestComplete
To get the results of profiling TestComplete scripts, you should disable the in-process debugger of
TestComplete. This should be done because by default, TestComplete’s native debugger is set to handle scripts
by itself, without passing data to the system.
This behavior can be changed in TestComplete by releasing the
Enable Script Debugging button on the
Debug toolbar, or by disabling the Script | Enable Script Debugging item of the main menu.
3.3 Preparing Windows Script Host
Windows Script Host allows you to run scripts directly from Microsoft Windows. It is represented by two
executables: WScript and CScript. They operate in a similar way, the only difference is that WScript generates
windowed output, while CScript sends its output to a console. The scripts to be launched, as well as host
options and script parameters, are passed to Windows Script Host via command-line arguments.
www.automatedqa.com
AQtime by AutomatedQA Corporation
229
Profiling Various Applications and Code
To obtain profiling results from Windows Script Host, you should enable its built-in debugger and send the
script’s output to the console. This behavior is controlled by the //D and //H:CScript host options respectively.
That is, to get profiling results in AQtime, you should use the following syntax: WScript.exe or
CScript.exe//D //H:CScript Other_Host_Options "Path_To_Script" Script_Parameters.
For example, WScript.exe //D //H:CScript "C:\Work\MyScript.js".
Profiling Scripts Using Host Applications
There are three ways to profile script code with AQtime. They vary in the module that is added to the
project: a host application, a script file or a URL. The technique that uses host applications is the simplest. It
does not require that additional parameters be specified for the profiler. When profiling starts, the host
application is launched and you can load any script you want. However, the weak point of this technique is that
you cannot select the script routines to be profiled via the Setup panel. That is, AQtime will profile all routines
that were executed. This technique cannot be used for Windows Script Host, since it has no user interface to
open script files.
To profile a script via its host application, do the following:
•
Add the host application’s executable (iexplore.exe for Internet Explorer; testcomplete.exe for
TestComplete) to the Modules pane.
Add Module from the Setup toolbar or context menu, or by
This can be done by selecting
choosing the Project | Add module menu item.
•
Select the desired profiler from the dropdown list on the Standard toolbar.
•
Select the desired profiler from the Current Profiler submenu of the AQtime menu.
•
Press Run on the Standard toolbar or select Run | Run from AQtime’s main menu to start
profiling (if you use AQtime integrated into Microsoft Visual Studio, the Run button is located
on the AQtime toolbar; if you use AQtime integrated into Embarcadero RAD Studio, select
AQtime | Run With Profiling from RAD Studio’s main menu to start profiling).
•
AQtime will launch the chosen host application. In the application, open the script and call the
routines you want to profile. That is, open and run the desired suite, project, unit or routine in
TestComplete, or open the desired web page in the browser and do the actions needed to run the
desired routine (click on links, buttons, menus and so on).
•
Wait until these routines are executed and close the host application. AQtime will generate
profiling results and display them in the Report and Summary panels.
Profiling Script Files
There are three ways to profile script code with AQtime. They vary in the module that is added to the
project: a host application, a script file or a URL. To profile a script file, add it to the list of profiled modules in
AQtime’s Setup panel. AQtime considers a file as a script file if it contains VBScript, JScript, C#Script or
C++Script code, or if it contains HTML code in which <script> tags are used. Both the ASCII and Unicode
encodings are possible. Typically, files that contain VBScript and JScript code have the .vbs and .js extensions,
while TestComplete scripts have the .svb, .sj, .scs and .scpp extensions (for VBScript, JScript, C#Script and
C++Script respectively).
Script files cannot be executed by themselves, they require that the host application be specified. For .vbs
and .js files, the host application can be either Internet Explorer or Windows Script Host; for .htm and .html
files the host application should be Internet Explorer; for .svb, .sj, .scs and .scpp files the host application
should be TestComplete.
© 2010 AutomatedQA Corp.
www.automatedqa.com/support
230
Profiling Scripts
This approach has another benefit: when a file is added to the Modules pane, AQtime retrieves data on
available routines. Thus, you can select which script routines to profile in the same manner as for ordinary
libraries and executables. See the Using Profiling Areas help topic.
To profile a script file, follow the instructions below:
•
Add Module button on the Modules pane, or select Add Module from the pane’s
Press the
context menu, or choose the Project | Add module item of the main menu.
•
In the ensuing Add Module To Project dialog, select the All Files or Script Files file mask and
locate the desired script file. Press OK to add it to the AQtime project.
•
Optional. Choose the elements to be profiled by adding scripting routines to including or
excluding profiling areas.
•
Normal is currently chosen in the Profiling Mode dropdown list box and select
Ensure that
Run | Parameters from the main menu. If you use AQtime integrated into Microsoft Visual
Studio, select AQtime |Parameters menu item. If you use AQtime integrated into Embarcadero
RAD Studio, select AQtime | Parameters from RAD Studio’s menu to call the Run Parameters
dialog.
•
In the dialog, specify the host application and parameters for it. Depending on the script file type,
do one of the following:
Web Script Files (*.vbs, *.js, *.htm, *.html, *.asp, *.php)
Enter the path to iexplore.exe in the Host Application field. Alternatively, if Internet Explorer
is your default browser, you can select Default Web Browser from the editor’s drop-down
list.
Specify the URL or the path to the web script file in the Parameters field. This will make the
browser navigate to the specified page upon starting.
TestComplete Script Files (.svb, .sj, .scs and .scpp)
Enter the path to testcomplete.exe in the Host Application field.
Specify the fully qualified path to the project or project suite in the Parameters field. This
will make TestComplete open the specified project or project suite.
Standalone Script Files (*.vbs, *.js)
Enter the path to any Windows Script Host executable, wscript.exe or cscript.exe, in the Host
Application field.
In the Parameters field, specify //D //H:CScript followed by the fully qualified path to
the file and script parameters (if any). This will enable the host’s built-in debugger and make
the host application launch the specified script upon starting profiling in AQtime.
•
Close the dialog by pressing OK.
•
Select the desired profiler from the dropdown list on the Standard toolbar.
•
Select the desired profiler from the Current Profiler submenu of the AQtime menu.
•
Press Run on the Standard toolbar or select Run | Run from AQtime’s main menu to start
profiling (if you use AQtime integrated into Microsoft Visual Studio, the Run button is located
on the AQtime toolbar; if you use AQtime integrated into Embarcadero RAD Studio, select
AQtime | Run With Profiling from RAD Studio’s main menu to start profiling).
The host application will be launched automatically.
•
Start the script routine(s) to be profiled. Depending on the script file type, various actions should
be performed:
www.automatedqa.com
AQtime by AutomatedQA Corporation
231
Profiling Various Applications and Code
Web Script Files (*.vbs, *.js, *.htm, *.html, *.asp, *.php)
Typically, web page scripts are executed upon opening. However, sometimes, specific actions
may be needed, for example, you may need to highlight elements, select menus, interact with
the page’s controls and so on.
TestComplete Script Files (.svb, .sj, .scs and .scpp)
Run the desired routine, unit, project or project suite in TestComplete.
Standalone Script Files (*.vbs, *.js)
No additional actions are required as Windows Script Host automatically starts the script file
specified as a parameter.
•
Wait for the routine(s) to complete and close the host application. AQtime will generate the
profiling results and display them in the Report and Summary panels.
Profiling Scripts Located on Web Pages
There are three ways to profile script code with AQtime. They vary in the module that is added to the
project: a host application, a script file or a URL (web page). Using a web page is a better way of adding a
script file to your project. It allows you to profile scripts right on web pages. A page can be on the Internet, on
a local network or on a local computer. If a remote URL is specified, the corresponding page is copied to a
temporary folder on your computer. AQtime retrieves information from HTML, ASP, PHP and other pages
that contain <script> tags. If some script snippet does not define a routine name, then the results will be
reported as <Global Scope of [URL]>.
To profile a web script, follow the instructions below:
•
Press the
Add URL button on the Modules pane or select Add URL from the pane’s context
menu. This will call the Add URL to Project dialog.
•
Specify the desired web page in the dialog and press OK.
•
Once the page is added, AQtime retrieves information about available script routines. Thus, you
can choose the elements to be profiled.
•
Normal is currently chosen in the Profiling Mode dropdown list box and select
Ensure that
Run | Parameters from the main menu. If you use AQtime integrated into Microsoft Visual
Studio, the Parameters item is located in the AQtime menu. If you use AQtime integrated into
Embarcadero RAD Studio, select AQtime | Parameters from RAD Studio’s menu to call the Run
Parameters dialog.
•
In the dialog, specify the executable of Internet Explorer as the host application. You can enter the
executable’s path in the Host Application editor or select Default Web Browser from the
editor’s drop-down list (if Internet Explorer is your default browser). Press OK to close the dialog.
•
Select the desired profiler from the dropdown list on the Standard toolbar.
•
Select the desired profiler from the Current Profiler submenu of the AQtime menu.
•
Press Run on the Standard toolbar or select Run | Run from AQtime’s main menu to start
profiling (if you use AQtime integrated into Microsoft Visual Studio, Run button is located on
the AQtime toolbar; if you use AQtime integrated into Embarcadero RAD Studio, select AQtime
| Run With Profiling from the main menu to start profiling).
The browser will be launched automatically.
•
In the browser, enter the page’s URL in the address bar to navigate to the page. Typically, web
page scripts are executed upon opening. However, sometimes, to call the desired routine you may
© 2010 AutomatedQA Corp.
www.automatedqa.com/support
232
Profiling Scripts
need to perform some specific actions: highlight elements, select menus, interact with the page’s
controls and so on.
•
Wait for the routine(s) to finish and close the browser. AQtime will generate the profiling results
and display them in the Report and Summary panels.
Profiling Scripts in Internet Explorer 8
The eighth version of the Microsoft Internet Explorer browser introduced a number of enhancements. It
significantly differs from its predecessors. The internal structure of the browser has also been modified (for
example, a separate iexplore.exe process is created for each new tab). To reflect these changes, AQtime 6.30
introduces a special mode of script profiling that is optimized for Internet Explorer 8. This mode allows you to
obtain profiling results faster and does not require the script debugger to be enabled.
The mode activates automatically when AQtime determines that the host process is Internet Explorer 8.
This mode is available for all three ways of script profiling (via the host application, via a script file or via a
URL).
Note: In order to obtain the correct results when profiling in Internet Explorer 8 mode, close all Internet
Explorer windows before you start profiling. Do not open pages and windows until profiling is
over.
Internet Explorer 8 mode has the following peculiarities and restrictions:
•
Routine level profiling - Profiling is performed at the routine level only, line level profiling is
not supported. Yet, since the version of the host process cannot be determined prior to launching it,
the Line Level radio button is still enabled in the Areas pane.
•
Verbose results - Profiling results include data for routines contained on web pages or in module
files, data for object method calls, and data for helper service routines of the browser.
•
Extended data structure names - Routines and other data structures are named according to the
internal notation of Internet Explorer. So, in profiling results, you may encounter items like
"Main, JScript - window script block", and other items that have extended descriptions.
If a routine does not have a custom name (many helper routines have no name), then it is entitled
using the following pattern: "Routine Id: rID; Script Id: sID; Routine name:
Unknown", where rID and sID stand for routine and script identifiers, respectively.
•
JScript only profiling - The engine of Internet Explorer can profile scripts written in JScript.
Scripts written in VBScript are executed by the engine, but the profiling results cannot be
obtained.
Profiling Scripts - Troubleshooting
There are a number of requirements when profiling scripts. If you get empty results when profiling scripts
or if you cannot start profiling, most likely your computer or actions do not meet these requirements. Below are
some tips that may help you solve the problem:
•
First, check the profiler you use. Script profiling is only supported by the Performance, Coverage,
Light Coverage and Function Trace profilers (currently, the Function Trace profiler does not
collect information on values of script routines’ parameters).
•
Check if you are running multiple instances of AQtime. Only the first instance of AQtime can
profile scripts and obtain results.
•
Check whether the tested application uses the Microsoft Scripting Engine, since AQtime can only
profile those scripts that are executed by this engine.
www.automatedqa.com
AQtime by AutomatedQA Corporation
233
Profiling Various Applications and Code
Note that AQtime cannot profile server-side scripts of ASP pages. It can profile only client scripts
of ASP pages that are run by the browser.
Also, AQtime cannot profile scripts executed in 64-bit processes. This happens because there are
no script debugging libraries that can be used in these processes. However, there is an exception:
AQtime can profile scripts that are run by 64-bit versions of Internet Explorer.
•
If you profile with the “Attach-to-Process” feature, change the approach and try launching the
host application from AQtime (you can specify the host application for your script units in the Run
Parameters dialog).
•
Make sure that the Microsoft Script Debugger is installed on your computer. Note that there are
several versions of the debugger and AQtime may not support some of them. For instance, there is
a known problem with the script debugger installed by Microsoft Visual Studio 2008 and
Microsoft Visual Studio 2010. Currently, AQtime cannot use this one for script profiling since the
Visual Studio installation program replaces some debugger modules and AQtime stops working
with the debugger properly. To avoid the problem, re-install Microsoft Script Debugger after
installing Visual Studio 2008 or 2010.
To be sure you have the correct version of the debugger, follow these steps:
Download and install all the updates available for the operating system and Internet
Explorer.
There is one exception: While updating, you may be suggested to install Internet Explorer
version 8. This update is not required, and you may skip it if you want to use another
version of the browser.
Download
and
install
Microsoft
Script
Debugger
from
this
site:
http://www.microsoft.com/downloads/details.aspx?FamilyId=2F465BE0-94FD-456
9-B3C4-DFFDF19CCD99&displaylang=en
Download
the
PDM.dll
from
this
page:
http://www.dll-files.com/dllindex/dll-files.shtml?pdm. This DLL implements some
debugger’s functionality.
Replace the PDM.dll file in the <Windows>\System32 folder with the downloaded
module.
Open the Command Prompt window.
Note that on Windows Vista and later operating systems, you need to launch Command
Prompt with administrator privileges. You can do this in the following manner:
•
Open the Start menu.
•
Type cmd.exe in the Search box and press Enter.
•
Right-click cmd.exe in the search results and select Run as administrator from the context
menu.
Register the downloaded module with the following command typed in the Command
Prompt window:
regsvr32.exe C:\Windows\System32\pdm.dll
Restart your computer, if the changes do not immediately take effect.
•
If you use Internet Explorer 8, then close all Internet Explorer windows before you start profiling.
Do not open pages and windows until the profiling is over.
•
If you profile your scripts with the Coverage or Light Coverage profiler, the Report panel may
sometimes contain duplicated results for some script routines (this problem is caused by some
© 2010 AutomatedQA Corp.
www.automatedqa.com/support
234
Profiling Scripts
specifics of the script engine's and the profilers' functioning). In this case, you can use one of the
following two approaches to resolve the problem:
Remove all script files from the Modules pane of the Setup panel.
Check the Profile Entire Script Code area in the Areas pane of the Setup panel.
or -Create a new including area in the Areas pane of the Setup panel.
•
Add all script routines from the Modules pane of the Setup panel to that area.
Check the area with the script routines.
Uncheck the Profile Entire Script Code area.
If these tips do not help, send a message to AutomatedQA Support Team. To learn more, see the
Technical Support and Resources help topic.
www.automatedqa.com
AQtime by AutomatedQA Corporation
Profiling Various Applications and Code
235
Profiling Multithreaded Applications
Profiling Multiple Threads
AQtime profilers trace function calls in all application threads. This is quite transparent for the user
and does not require special preparation for the application. However, to obtain correct profiling results and the
stack of functions, you may need to assign certain values to the Thread model option of the selected profiler.
This topic describes the thread profiling functionality of AQtime and describes why the option is needed.
AQtime’s Allocation, BDE SQL, Coverage, Function Trace, Performance, Reference Count and Resource
profilers log and save results by threads. If the profile run includes more than one thread, you can select a single
thread to show in the Report panel from the Explorer panel or from the Result Items toolbar item (by default,
this item is hidden). Of course, you can display all of threads together as well:
As you can see, threads are identified by their IDs. For .NET applications running under the .NET
Framework version 2.0 or later, AQtime is able to obtain user-defined names of CLR threads that are assigned
through the Name property of the Thread class (for more information, see the property description in the
MSDN Library).
AQtime also lets you assign descriptive names to threads from your application. These names will be used
instead of the default thread names in AQtime panels and toolbar items. As you can see on the picture above,
one of the threads has a user-defined name. For more information, see the Assigning Names to Threads help
topic.
© 2010 AutomatedQA Corp.
www.automatedqa.com/support
236
Profiling Applications With AQtime
The Performance and Coverage profilers can also be controlled by triggers, which turn profiling on or off
for a particular thread in which a function (the trigger) runs. This is an essential tool to winnow out profile
information from complex multithreaded applications.
Note that a thread is not a process. If a profiled application launches a new process, it will simply escape
being profiled by AQtime, which can only watch over the child process it has launched itself (or to which it
attached).
We would like to point out that the operating system threads differ from the managed threads that may
exist in .NET applications. Managed threads are controlled by the common language runtime. It can create one
or several operating system threads to run a single managed thread. AQtime profilers include the Thread model
option that specifies what thread model the profiler should log the results. If you select the Win32 Threads
value for this option, the Performance and Coverage profilers will group results by the operating system
threads. The Function Trace, Allocation and Resource profilers will trace the stack of function calls by
operating system threads. If you select CLR Threads, the profilers will gather results and trace the call stack by
managed threads. The profiling results for these threads are displayed in the same way as results of the
operating system threads: the Explorer panel holds a list of the threads (but these are not operating system
threads, these are managed threads). You can view results for a thread by selecting this thread in the Explorer
panel or in the Threads drop-down list.
There is one more value for the Thread model option: COM Threads. It means that AQtime should
analyze logical threads that occur when a COM server works with several COM clients simultaneously. To
keep this topic in bounds, we described these threads in a separate topic, Profiling COM Logical Threads.
Assigning Names to Threads
AQtime gathers profiling results per application thread (see the Profiling Multiple Threads help topic). To
identify a thread in profiling results, AQtime typically uses the thread identifier. For instance, you may see the
names like Thread #256, Thread #541 in the Explorer panel. The analysis would be easier if a thread had a
more descriptive name. For instance, if you are looking for results of the main application thread, then the
name Main Thread is much more useful than Thread #256.
For .NET applications running under the .NET Framework version 2.0 or later, AQtime is able to obtain
the user-defined name of a CLR thread assigned through the Thread.Name property. So, using this property
you may assign desired names to the CLR threads created in your .NET applications running under the .NET
Framework ver. 2.0 (or later).
To assign descriptive names to threads in other applications, use the SetCurrentThreadName function
that is defined in the AQtimeHelpers file that is included into the AQtime package (see below). The name
assigned to a thread with this function will be used instead of the default thread name in profiling results.
The use of descriptive names for threads will not only simplify the result analysis, but will also improve the
merging of results: AQtime will automatically merge the results for those threads that have the same name.
Other threads will be included into the merged result set as separate items. For more information about this, see
the Comparing and Merging Results help topic.
Note: If you assign custom names to threads for comparison and merging purposes, do not use the names
that start with Win32 Thread, CLR Thread or COM Thread. AQtime considers such names as
default ones and it will not detect a thread as renamed when they are used.
To assign a name to a thread, follow these steps:
•
Open your application’s project in the development tool you use.
www.automatedqa.com
AQtime by AutomatedQA Corporation
Profiling Various Applications and Code
•
237
Include the AQtimeHelpers file into your application project. This file is located in the following
folder:
If you use...
Add the following file
Microsoft Visual C# .NET
<AQtime 7 SDK>\CS\AQtimeHelpers.cs
Microsoft Visual Basic .NET <AQtime 7 SDK>\VBNET\AQtimeHelpers.vb
Microsoft
Visual
C++, <AQtime 7 SDK>\CPP\Common\AQtimeHelpers.cpp
Borland C++Builder, Borland
C++ or Intel C++
Microsoft Visual Basic
<AQtime 7 SDK>\VB\AQtimeHelpers.bas
Borland Delphi
<AQtime 7 SDK>\Delphi\Common\AQtimeHelpers.pas
On Windows 7, Windows Vista and Windows Server 2008, AQtime SDK files are located
in the <Users>\Public\Documents\AQtime 7 SDK folder. On other operating systems, the
files reside in the <Documents and Settings>\All Users\Documents\AQtime 7 SDK folder.
Note that the All Users\Documents folder may be displayed in Windows Explorer and Open
and Save dialogs as All Users\Shared Documents.
The file holds the declaration of the SetCurrentThreadName function. This function assigns the
name to the thread where it is called. It uses the only parameter - the name of a thread to set.
•
Call the SetCurrentThreadName(Name) function in your code (we recommend that you call
this routine at the beginning of your thread function). If a thread already has a name, it will be
renamed.
[Visual C++]
SetCurrentThreadName("Custom thread name");
If your application already contains a routine with the name SetCurrentThreadName, you may
need to use the AQtimeHelpers namespace or the AQtimeHelpers unit name (this depends on
your compiler) when calling the SetCurrentThreadName routine:
[Visual C++]
. . .
// Calls SetCurrentThreadName using the namespace
AQtimeHelpers::SetCurrentThreadName("My thread name");
[Delphi]
. .
// Calls SetCurrentThreadName using the unit name
AQtimeHelpers.SetCurrentThreadName("My thread name");
•
To obtain the name assigned to the current thread, call GetCurrentThreadName (like
SetCurrentThreadName this function is declared in the AQtimeHelpers file).
© 2010 AutomatedQA Corp.
www.automatedqa.com/support
238
Profiling Applications With AQtime
The OnOffPofiling sample application shipped with AQtime contains code that demonstrates how you can
assign descriptive names to threads in your application:
<AQtime Samples>\Unmanaged\OnOffProfiling\VC - Microsoft Visual C++ (Visual Studio 7.x
project)
<AQtime Samples>\Unmanaged\OnOffProfiling\VC2005 - Microsoft Visual C++ (Visual Studio
2005, 2008 and 2010 project)
<AQtime Samples>\Unmanaged\OnOffProfiling\Delphi - Borland Delphi
<AQtime Samples>\Unmanaged\OnOffProfiling\BCB - Borland C++Builder
On Windows 7, Windows Vista and Windows Server 2008, AQtime samples are located in the
<Users>\Public\Documents\AQtime 7 Samples folder. On other operating systems, the samples
reside in the <Documents and Settings>\All Users\Documents\AQtime 7 Samples folder.
For more information on using this example, see the Enable/Disable Profiling Tutorial help topic.
Profiling Under 64-bit Platforms
AQtime can profile 64-bit applications, as well as COM, ASP.NET, IIS and service applications on 64-bit
versions of the Windows operating systems (for information on supported versions, see the System
Requirements help topic). Profiling of 64-bit applications has some peculiarities that are described further in
this topic.
Profilers for 64-bit Applications
Currently, all AQtime profilers support 64-bit application profiling. For the list of available AQtime
profilers, see the AQtime Profilers help topic.
Profiling Under Windows Server 2003
To profile 64-bit applications under Windows Server 2003 x64 edition, you should log into the session 0
(console session). To do this, you can run the Remote Console via the following command line:
mstsc.exe /console
Profiling Under Windows Server 2008 R2
In order for AQtime to be able to function on Windows Server 2008 R2, the WoW64 component of this
operating system must be installed. The Server Core installation option for Windows Server 2008 R2 does not
install WoW64 by default, so, you should install it yourself. This requirement concerns both AQtime x86 and
x64 packages.
Using Counters
The 64-bit versions of Windows XP, Windows Server 2003 Service Pack 1 and later 64-bit versions of
Windows operating systems have the Kernel Patch Protection (KPP) feature. Due to this feature counters, with
the exception of the Elapsed Time counter, may be unstable and cause a system crash. Only the Elapsed Time
counter works properly and does not cause any problems with KPP and we recommend that you use it for
analyzing the performance of your applications. Using other counters may cause a crash on 64-bit operating
systems.
If you need to use counters other than Elapsed Time, then a possible workaround is to run the operating
system in debug mode. In this case, you will be able to use all the counters.
www.automatedqa.com
AQtime by AutomatedQA Corporation
Profiling Various Applications and Code
239
Note however that this approach will disable .NET debugging: the debugger of Microsoft Visual Studio
will be disabled (that is, Visual Studio will not debug managed code) and AQtime’s Event View panel will not
trace and report .NET-specific events. Though the profiling of managed code will work.
The way you enable debug mode depends on your operating system:
Running Windows 7 and Windows Vista in debug mode
To activate debug mode in Windows 7 or Windows Vista:
•
Open the Command Prompt window and type the following commands in it:
Bcdedit /debug ON
Bcdedit /dbgsettings SERIAL DEBUGPORT:1 BAUDRATE:115200 /start
AUTOENABLE
•
Restart the operating system.
To turn off the debug mode:
•
Open the Command Prompt window and execute the follow command:
Bcdedit /debug OFF
•
Restart the operating system.
Running Windows XP in debug mode
To enable debug mode in Windows XP, modify the boot.ini file. It resides in the root of the operating
system’s disk. For instance, if you have Window XP installed on drive C:, the file name is C:\boot.ini.
•
Open boot.ini in Notepad.
•
Find the [operating systems] section. Items of this section correspond to the items of the boot
menu.
•
Find the desired item and add the /debug=autoenable parameter to it, for instance:
multi(0)disk(0)rdisk(0)partition(1)\WINDOWS="Microsoft Windows XP
Professional"
/noexecute=optin /fastdetect /debug=autoenable
•
Save the changes.
•
Restart the operating system.
To disable the debug mode, remove the /debug=autoenable parameter from boot.ini.
Profiling Under Another User Account
AQtime allows you to profile your application under different user accounts. This can be useful, because
different accounts have different permissions, so you may need to check the application’s behavior under a
specific account, for instance, under a user with limited permissions, or, on the contrary, under a user having
administrator permissions.
Profiling under another user account has some specifics that are described in this topic.
Specifying User Permissions for AQtime
To be able to profile an application under a different user account, the current account (the one used to
launch
AQtime)
must
have
the
SE_ASSIGNPRIMARYTOKEN_NAME
and
© 2010 AutomatedQA Corp.
www.automatedqa.com/support
240
Profiling Applications With AQtime
SE_INCREASE_QUOTA_NAME user rights (in addition to administrator permissions). Below are the
instructions on how to assign these user rights:
•
Open Control Panel, select Administrative Tools, and then choose Local Security Policy.
•
In the Local Security Settings dialog box, expand the Local Policies node and then select the User
Rights Assignment subnode.
•
In the details pane, double-click the Adjust memory quotas for a process item. This is the
SE_INCREASE_QUOTA_NAME user right.
•
Click the Add User or Group button, and, in the Enter the object names to select edit box, type
the name of the user or group to which you want to assign the user right and then click OK.
•
Return to the details pane and double-click the Replace a process level token item. This is the
SE_ASSIGNPRIMARYTOKEN_NAME user right.
•
Click the Add User or Group button, and, in the Enter the object names to select edit box, type
the name of the user or group to which you want to assign the user right and then click OK.
Launching a Profiled Application Under A Different User Account
The user credentials used to start the profiled application are passed through the Run Parameters dialog
and are applied every time profiling starts.
To set a user account for a profiled process:
•
Normal profiling mode on AQtime’s Standard toolbar. If you use AQtime
Select the
integrated into Microsoft Visual Studio,
Normal button is located on the AQtime toolbar. If
you use AQtime integrated into Embarcadero RAD Studio, this button is located on the AQtime
Profiling Modes toolbar.
•
Choose Run | Parameters from AQtime’s main menu (if you use AQtime integrated into
Microsoft Visual Studio, the Parameters item is located in the AQtime main menu; if you use
AQtime integrated into Embarcadero RAD Studio, choose AQtime | Parameters from the main
menu). This will invoke the Run Parameters dialog.
•
In the dialog, enter the user account name, the domain name and password in the corresponding
edit boxes and click OK.
www.automatedqa.com
AQtime by AutomatedQA Corporation
Profiling Various Applications and Code
241
Profiling Dynamic Link Libraries
Using AQtime you can profile dynamic link libraries that are linked to your executable both at startup time
(so called statically linked DLLs) and at run time (dynamically linked DLLs). Profiling a DLL is similar to
profiling of any other standard application. In some cases it is even simpler, because the DLL may be compiled
without debug information. This topic explains how you can profile dynamic link libraries with AQtime.
In further explanations we will call the executable that loads the profiled DLL in memory a host
application. The manner in which you profile your DLL depends on whether you will start the DLL’s host
application from AQtime or you will attach to it at run time.
If you can start the host application from AQtime, then you can profile your DLL in the following manner:
•
Compile your DLL. See the How AQtime Profilers Use Metadata and Debug Information help
topic to decide if you need to include debug information.
•
Load the DLL in AQtime as a project (see the Creating and Saving AQtime Projects help topic).
•
Open the Run Parameters dialog and specify the host application for a dynamic link library. When
you start profiling, AQtime launches the specified host application. The host application then calls
the functions defined in the profiled dynamic link library. Note that AQtime does not profile the
host application, so it can be compiled without the debug info.
•
Continue profiling as you normally would. AQtime profiles DLL functions only when they are
included in one of profiling areas or when Full Check is active.
Note: In 64-bit versions of Windows, 32-bit modules can be loaded into 32-bit processes only and 64-bit
modules can be loaded into 64-bit processes only. So, if the “bitness” of your dynamic link library
does not match the “bitness” of the process, to which the library is loaded, AQtime will not start
profiling.
AQtime normally generates results once the profiled application has ended its run. When profiling a
dynamic link library, this means results are generated when the host application exits. If you need to obtain
results without closing the host application, you can do this by using the Run | Get Results option from
AQtime’s main menu (if you use AQtime integrated into Microsoft Visual Studio, you obtain the results by
clicking
Get Results on Visual Studio’s AQtime toolbar; if you use AQtime integrated into Embarcadero
RAD Studio, select the AQtime | Get Results menu item). Alternatively, you can obtain profiling results by
creating an action that will command AQtime to generate results. For more information, see the Getting
Results During Profiling help topic.
If the host application is already loaded into AQtime as a project, you can include your DLL into profiling
Add Module from the Setup toolbar or from
tasks by adding it to that AQtime project. To do this, choose
the context menu of the Setup panel and select the desired DLL in the subsequent Open File dialog. Now, when
you start profiling in AQtime, it will launch the host application, which, in turn, will load the DLL in memory
and call its functions.
Note that if you add a DLL to the host application’s project, AQtime can use both DLL’s debug
information and table of exported functions to determine the routine’s location in code. That is, the added DLL
may be compiled without debug information and may still be profiled by AQtime. This makes it possible to
profile dynamic link libraries, which are used by your application and which do not have debug info (for
example, system libraries, see the Profiling System Calls help topic). However, the absence of debug
information imposes some limits on the profiling:
•
You can profile only those functions that are exported by the DLL. You cannot profile “internal”
DLL functions and procedures.
•
You can profile DLL functions at routine level only.
© 2010 AutomatedQA Corp.
www.automatedqa.com/support
242
Profiling Applications With AQtime
•
The Allocation profiler will not trace memory allocations that are done directly within the DLL
code.
For .NET modules AQtime offers one more way for profiling the dynamic link libraries: you may check
the Profile Entire .NET Code box in the Setup panel. If this box is checked, AQtime will profile all managed
routines and modules that are used by the profiled executable regardless of whether they are added to profiling
areas or not. You can select the profiling level, at which AQtime will profile managed routines, by selecting by
Routines, by Lines or by Class options under the Profile Entire .NET Code node.
One more way to profile DLLs with AQtime is to attach to the process that uses this DLL:
•
Compile your DLL. See the How AQtime Profilers Use Metadata and Debug Information help
topic to decide if you need to include debug information.
•
Load the DLL in AQtime as a project (see the Creating and Saving AQtime Projects help topic).
•
Select Run | Attach to Process or press the
Attach to Process button on the Standard toolbar
Attach to Process button is
(if you use AQtime integrated into Microsoft Visual Studio, the
located on the AQtime toolbar; if you use AQtime integrated into Embarcadero RAD Studio, the
Attach to Process button does not reside on any toolbar by default, however, you can add the
button to any RAD Studio’s toolbar via the Toolbar Customization dialog). This will call the
Select Process to Attach dialog that lists all currently running processes.
•
In the dialog, select the process to which you would like to attach your module and press OK. If
the desired process is not in the list, launch it outside of AQtime, and then return to the Attach to
Process dialog and press Refresh to update the list.
•
Profile your applications you normally would.
•
To obtain the profiler results, select Run | Get Results from AQtime’s main menu. If you use
Get Results on the AQtime toolbar. If
AQtime integrated into Microsoft Visual Studio, click
you use AQtime integrated into Embarcadero RAD Studio, select AQtime | Get Results from
RAD Studio’s main menu. Results are also generated when the process, to which you attached the
DLL, finishes.
Profiling Services
AQtime supports profiling of executables that work as the operating system’s services. This topic explains how
you can profile these applications with AQtime.
Profiling Procedure
To profile your service application with AQtime, follow these steps:
1. Compile your service application in your development tool, for example, Microsoft Visual Studio
or Borland Delphi. See the How AQtime Profilers Use Metadata and Debug Information help
topic to decide whether to include debug information.
2. Register your service application as a service. Your service must be displayed in the Service
Control Manager dialog (Control Panel | Administrative Tools | Services in Windows 2000,
Windows XP, Windows Server 2003, Windows Vista, Windows Server 2008 or Windows 7).
3. Create the AQtime project from the executable module of your service (File | New Project From
Module).
Service from the Profiling Mode drop-down list box that is displayed on AQtime’s
4. Select
Standard toolbar. If you use AQtime integrated into Microsoft Visual Studio, this list box is
www.automatedqa.com
AQtime by AutomatedQA Corporation
Profiling Various Applications and Code
243
located on the AQtime toolbar. If you use AQtime integrated into Embarcadero RAD Studio, the
Service item is located on the AQtime Profiling Modes toolbar.
5. Select the desired profiler and press
Run to start profiling.
If you use AQtime integrated into Microsoft Visual Studio, then to select the desired profiler you
can use either the AQtime | Profiler menu item or the Profilers box on AQtime's toolbar. To start
profiling the application, select AQtime | Run (or Debug | Run while one of AQtime panels is
active) from Visual Studio’s main menu.
If you use AQtime integrated into Embarcadero RAD Studio, then to select the desired profiler use
the AQtime | Current Profiler menu item. To start profiling the application, choose AQtime |
Run With Profiling menu item.
6. AQtime will start your service (if the service is running, AQtime will restart it, so the service will
be running in the debug mode under AQtime). AQtime will post notification messages to the
Event View panel upon beginning and finishing the service start.
Note: If your executable registers several services, only the first one is started by AQtime
during profiling, so, AQtime will not be able to profile the other services. As a
workaround, you can start profiling (the first service will be started), start the other
services manually and then profile the application.
7. Test your service application according to your needs.
8. When your tests are complete, select Run | Get Results from AQtime’s main menu to obtain
profiling results (if you use AQtime integrated into Microsoft Visual Studio, select AQtime | Get
Results from Visual Studio’s main menu; if you use AQtime integrated into Embarcadero RAD
Studio, select AQtime | Get Results from RAD Studio’s main menu). Another way to obtain
profiling results is to create an action that will tell AQtime to generate the results. See the Getting
Results During Profiling help topic for more information. The results are also generated if stop the
service via the Service Control Manager dialog. If you do not want to stop the service you can use
the Get Results menu item or an action.
Profiling Services That Start Slowly
When a service starts, the operating system’s Service Control Manager waits for the service's response
within a certain time period (by default, 30 seconds). If the service does not respond within this period, the
Service Control Manager terminates the service process, and AQtime reports that the service does not respond
to the system in a timely fashion (you can find this message in the Event View panel).
A possible solution is to increase the system’s default timeout, so that the Service Control Manager waits
for the service longer. To do this, modify the Windows Registry:
1. Open the Registry editor.
2. Add
a
new
value
of
the
DWORD
HKEY_LOCAL_MACHINE\SYSTEM\CurrentControlSet\Control key.
type
to
the
3. Name the value ServicePipeTimeout. The value data specifies the number of seconds the Service
Control Manager should wait for the service response during the service startup.
Note: The maximum value you can use is 60 seconds. AQtime does not profile services that
start longer.
© 2010 AutomatedQA Corp.
www.automatedqa.com/support
244
Profiling Applications With AQtime
Profiling SQL Server CLR Integration Assemblies
Microsoft SQL Server 2005 hosts .NET Framework and provides developers with the possibility to create
stored procedures, triggers and functions in C# .NET, Visual Basic .NET and Visual C++ .NET. The created
assemblies are uploaded to SQL Server and stored in system catalogs. You can then create special database
objects such as functions, procedures, triggers, types and aggregates, that will connect to the assemblies and
call the CLR routines. For instance, you can create a Transact-SQL query that will call a routine from a CLR
integration assembly the same way it calls other Transact-SQL functions.
For detailed information on creating CLR integration assemblies for Microsoft SQL Server, see the
Database Engine .NET Framework Programming section of the MSDN Library (the on-line version is
available at http://msdn.microsoft.com).
Key Points
Profiling of CLR integration assemblies with AQtime has the following specifics:
•
First of all, you should launch SQL Server from AQtime. The CLR integration assemblies are
loaded in memory by the SQL Server process, and you cannot use the “attach to process” feature to
connect the profiler to this process, because this feature does not support profiling of managed
code. So, you have to start SQL Server from AQtime.
•
To launch SQL Server, you should use certain run parameters in your AQtime project.
•
Another important point is to select the Profile Entire .NET Code area in the Setup panel.
The problem is that AQtime is unable to determine the module name of your integration assembly
when this assembly is loaded by SQL Server. This happens due to certain peculiarities of SQL
Server. Since the module name cannot be determined, the profiling area settings will not function.
So, if you do not check the Profile Entire .NET Code box, AQtime will be unable to find the
routines for profiling and you will get empty results.
Since the module name cannot be determined, the triggers and actions that contain classes and
routines defined in your assembly will also be ineffective. So, do not forget to set the Initial
Profiling Status setting to ON in the Setup panel. If it is off, the triggers and actions will not be
active during the run.
•
In order for AQtime to be able to trace the execution of your assembly’s functions, you should
change the security settings of your database. To do this, you should execute specific SQL code
(see below).
•
Finally, to obtain profiling results, you should use the Get Results command (see the Getting
Results During Profiling help topic).
Below is a step-by-step description of how to profile SQL Server CLR integration assemblies.
Requirements
The CLR integration assemblies operate on the SQL Server computer. So, to profile them, you should
install AQtime on this computer.
Upload your assembly to the server and register it in system catalogs. For more information on how to
perform these actions, see the MSDN Library.
Before profiling your CLR integration assembly, test it in SQL Server Management Studio and ensure that
the assembly functions as expected when it is not being profiled by AQtime.
1. Changing Database Security Settings
To modify the security settings, we will create and use a temporary query:
www.automatedqa.com
AQtime by AutomatedQA Corporation
Profiling Various Applications and Code
245
•
Open SQL Server Management Studio and connect to the SQL Server instance that controls
your database.
•
Create a new empty query. To do this, choose File | New | Query with Current Connection from
the Management Studio’s main menu.
•
Type the following code into the query editor:
[Transact-SQL]
sp_configure 'show advanced options', 1;
GO
RECONFIGURE;
GO
sp_configure 'clr enabled', 1;
GO
RECONFIGURE;
GO
•
Execute the query. You can do this by right-clicking somewhere within the query editor and
selecting Execute from the context menu.
•
Clear the query code and type the following lines:
[Transact-SQL]
ALTER DATABASE Database_Name SET TRUSTWORTHY ON;
GO
Here, Database_Name stands for the name of your database. For instance,
[Transact-SQL]
ALTER DATABASE AdventureWorks SET TRUSTWORTHY ON;
© 2010 AutomatedQA Corp.
www.automatedqa.com/support
246
Profiling Applications With AQtime
GO
•
Choose Execute from the context menu to execute this query.
•
Clear the query code once again and type the following text:
[Transact-SQL]
USE Database_Name
ALTER ASSEMBLY Assembly_Name WITH permission_set = UnSafe
GO
Here, Database_Name stands for the name of your database and Assembly_Name is the file name
of your assembly that implements the stored procedure functionality. You should specify the file
name without the path and extension:
[Transact-SQL]
USE AdventureWorks
ALTER ASSEMBLY HelloWorld WITH permission_set = UnSafe
GO
•
Execute this code.
•
Close the query editor. Answer No when the SQL Server Management Studio asks you to save the
changes to the query.
2. Setting AQtime Project
•
Launch AQtime and add the desired assembly to your AQtime project.
•
Select the Profile Entire .NET Code check box in the Setup panel.
It is important that you select Profile Entire .NET Code. Due to certain peculiarities of
SQL Server, AQtime is unable to determine the module name of your SQL Server
extension and the profiling area settings will not work. If you do not check the Profile
Entire .NET Code box, you will get empty results.
•
In the Triggers and Actions section of the Setup panel, set the Initial Profiling Status for All
Threads option to ON.
Note: The requirement to enable the initial profiling status is caused by the fact that it is unable
to determine the module name. When the module name cannot be determined, AQtime is
unable to recognize the executed routines properly. So, the triggers and actions that
contain the routines defined in your integration assembly, will not work. They will not
turn the profiling on, if the initial profiling status is off.
Now we have to specify the run mode and run parameters:
•
We will run the profiler in
Normal mode. Select this mode from AQtime’s Standard toolbar
(if you use AQtime integrated into Microsoft Visual Studio, the
button is located on the
AQtime toolbar; if you use AQtime integrated into Embarcadero RAD Studio, this button is
located on the AQtime Profiling Modes toolbar).
•
Choose Run | Parameters from AQtime’s main menu. If you use AQtime integrated into
Microsoft Visual Studio, choose AQtime | Parameters from Visual Studio’s main menu. If you
use AQtime integrated into Embarcadero RAD Studio, choose AQtime | Parameters from the
main menu.
www.automatedqa.com
AQtime by AutomatedQA Corporation
Profiling Various Applications and Code
247
This will invoke the Run Parameters dialog (for Normal Mode). Specify the following values in
this dialog:
•
In the Host Application box specify the path to the <Program Files>/Microsoft SQL
Server/MSSQL/Binn/sqlservr.exe module.
In the Parameters box specify the -s command-line argument followed by the server
name. Typically, you should type -sMSSQLSERVER, if you use Microsoft SQL Server
2005, or -sSQLEXPRESS, if you use Microsoft SQL Server Express Edition.
Press OK to save the changes.
3. The Profiler Run
Prepare for the run:
•
Disconnect SQL Server Management Studio and all queries from your SQL Server instance:
Open the Object Explorer panel of SQL Server Management Studio.
Right-click the server node and choose Disconnect from the context menu.
© 2010 AutomatedQA Corp.
www.automatedqa.com/support
248
Profiling Applications With AQtime
•
If you have queries that are open in the Management Studio and that are connected to the
server, then you should disconnect these queries. To do this, right-click somewhere within
a query editor and choose Connections | Disconnect All Queries from the context menu.
Stop the SQL Server service:
Open the Control Panel | Administrative Tools | Services window.
Right-click the SQL Server (SQLSERVER2005) item (SQL Server (SQLEXPRESS)
if your are running SQL Server Express Edition) and choose Stop from the context menu.
www.automatedqa.com
AQtime by AutomatedQA Corporation
Profiling Various Applications and Code
•
249
Switch to AQtime. Check that Normal mode is selected and that the project is prepared as it is
described above.
Now we can run the profiler:
•
Start profiling as you normally would.
•
Switch to SQL Server Management Studio and open the SQL code, which calls the routines from
your CLR integration assembly, in it.
•
Right-click the SQL code in the editor and choose Connection | Change Connection from the
context menu.
•
In the ensuing dialog, connect to your SQL Server instance.
•
Right-click within the editor and choose Execute from the context menu. This will execute the
SQL code.
•
To generate profiling results, select the Run | Get Results item from AQtime’s main menu or
press
Get Results on the Standard toolbar. If you use AQtime integrated into Microsoft Visual
Get Results button is located on the AQtime toolbar. If you use AQtime
Studio, the
integrated into Embarcadero RAD Studio, select the AQtime | Get Results menu item.
AQtime will display the results in its panels.
To terminate the profiler run:
•
Disconnect all queries from the SQL Server.
•
To stop the profiler, click
Terminate on the Standard toolbar. If you use AQtime integrated
into Microsoft Visual Studio or into Embarcadero RAD Studio, select AQtime | Terminate from
the main menu.
Since we selected the Profile Entire .NET Code box, the profiling results contain all managed routines
that were executed during the profiler run. To find the routines that belong to your assembly, you can group
results by class name. You can also sort results to find the desired routines faster.
You will find that the Module Name column does not display any values for your routines. This happens
because the module name cannot be determined.
Do not forget to start the SQL Server service after you finish the profiling sessions:
© 2010 AutomatedQA Corp.
www.automatedqa.com/support
250
Profiling Applications With AQtime
•
You can do this in the Control Panel | Administrative Tools | Services window.
•
Right-click the service in the window and choose Start from the context menu.
Profiling WPF Browser (XBAP) Applications
WPF Browser applications (or XAML Browser applications, or XBAP) are a specific kind of application
that are compiled into .xbap extensions and can be run in Internet Explorer. This topic explains how you can
profile your WPF Browser applications with AQtime.
1. Preparing the WPF Browser Application
In order for AQtime to be able to profile your WPF Browser application, you should specify the compiler
settings:
1. Open your WPF Browser application in Visual Studio.
2. Right-click your project in the Solution Explorer and choose Properties from the context menu.
This will open the project properties for editing.
3. Modify project settings to compile the application with debug information (see the Compiler
Settings for Microsoft Visual C# 2005, 2008 and 2010 and Compiler Settings for Microsoft Visual
Basic 2005, 2008 and 2010 help topics).
4. In the project properties editor, activate the Security tabbed page and select This is a full trust
application:
5. Save the settings and re-build the application.
2. Preparing the AQtime Project
1. Launch AQtime and create a new empty AQtime project.
www.automatedqa.com
AQtime by AutomatedQA Corporation
Profiling Various Applications and Code
251
2. Select the
Normal profiling mode on AQtime’s Standard toolbar (if you use AQtime
integrated into Microsoft Visual Studio, the
Normal profiling mode button is located on the
AQtime toolbar; if you use AQtime integrated into Embarcadero RAD Studio, this button is
located on the AQtime Profiling Modes toolbar).
3. Choose Run | Parameters from AQtime’s main menu (if you use AQtime integrated into
Microsoft Visual Studio or Embarcadero RAD Studio, select AQtime | Parameters to call this
dialog).
This will invoke the Run Parameters dialog.
4. Specify the following values in the dialog’s edit boxes:
Host Application: C:\Windows\System32\PresentationHost.exe
Parameters: -debug
Click OK to save the changes and to close the dialog.
5. Switch to AQtime’s Setup panel and add your application’s executable (.exe) to the AQtime
project.
Typically, the .exe module resides in the <Application Folder>\Bin\Debug folder. However, if
you published and launched your application, then it will be placed in the cache.
•
On Windows XP computers the cache is located here:
<Documents and Settings>\<USER_NAME>\Local Settings\Apps\2.0
•
On Windows Vista, Windows Server 2008 or Windows 7 machines, the cache is located
here:
<Users>\<USER_NAME>\AppData\Local\Apps\2.0\
6. Now the project is ready for profiling. If needed, you can now create profiling areas and tune
triggers and actions.
3. Profiling
© 2010 AutomatedQA Corp.
www.automatedqa.com/support
252
Profiling Applications With AQtime
1. Start profiling in AQtime. AQtime will launch PresentationHost, which, in turn, starts your
application.
2. Open Windows Explorer, go to the folder that contains the compiled version of your WPF
Browser application and double-click the application (the .xbap file). This will launch the
application.
3. Perform the desired actions over the application. AQtime will profile it.
4. To generate results, either close the application, or use the Get Results command.
AQtime will display profiling results in its panels.
Tip: There is another variant to launch an XBAP application from AQtime: when you modify
the launch settings in the Run Parameters dialog, enter the following value into the
Parameters box:
-debug <Your_XBAP_Module_Name_and_Path>
In this case, the .xbap application will be launched automatically when you start profiling.
If the name or path of your .xbap module contains spaces, enclose the parameter in quotes,
for instance:
-debug "C:\My Downloads\MyXBAPApp.xbap"
Profiling Multiple Processes
One instance of AQtime can only profile one process. So, to profile several processes, you have to run
several AQtime instances - one instance per process.
In general, profiling of multiple processes does not differ from profiling a single process. For each process
you create a project, add the desired module(s) to it, specify the profiling areas, triggers, actions and other
settings and then either start the process from AQtime or attach to the process using the Attach to Process
feature. For instance, you can use the “Attach to Process” functionality, if one of the processes is started by
another process. Note, however, that attaching requires time, so you will not be able to profile the startup code
of the started process.
To solve this problem, you can modify the registry settings so that when the operating system gets a
command to start a process, it automatically launches an AQtime instance, which you can then use to profile
your application. To modify the registry settings:
•
Launch the Registry Editor (regedit).
•
Open
the
HKEY_LOCAL_MACHINE\Software\Microsoft\Windows
NT\CurrentVersion\Image File Execution Options node.
•
Add a key for your application to this node:
Right-click the node and choose New | Key from the context menu. This will create a new
key node under the Image File Execution Options node.
Right-click the new node and select Rename from the context menu.
Change the key name to the name of your executable (for instance, MyApplication.exe).
Only specify the file name and extension. The path is not needed.
•
Specify AQtime as a debugger for the application. To do this:
www.automatedqa.com
AQtime by AutomatedQA Corporation
Profiling Various Applications and Code
253
Right-click the new key node and select New | String Value from the context menu. This
will append a new string value to the created key.
Switch to the right panel of the Registry Editor, right-click the string value’s node and
choose Rename from the context menu.
In the ensuing in-place editor, change the value name to debugger.
Right-click the value node again and select Modify from the context menu. This will call
the Edit String dialog.
In the Value data box of the dialog, enter the fully qualified name of AQtime.exe, for
instance, C:\Program Files\Automated QA\AQtime 7\Bin\AQtime.exe.
Click OK to save the changes and to close the dialog.
Now the operating system will launch AQtime every time your application starts.
Do not forget to remove the registry key, when the automatic start of AQtime is no longer needed.
If you need to enable or disable the automatic launch frequently, you can create two .reg files:
•
One of the files will include the Registry key and the debugger value with the path to AQtime:
To create this file:
1. Modify the registry as it was described above.
2. Select the key in the tree view on the left of the Registry Editor.
3. Choose File | Export from the editor’s main menu and specify the file name in the ensuing
Export Registry File dialog.
•
Another file will store the Registry key and the debugger value, but it will not store the path to
AQtime:
© 2010 AutomatedQA Corp.
www.automatedqa.com/support
254
Profiling Applications With AQtime
To create this file:
1. Modify the registry as it was described above.
2. Clear the data of the debugger value.
3. Export the key to a file by choosing File | Export from the main menu of the Registry
Editor.
Now, when you need to enable or disable the automatic launch of AQtime for your application, you can
execute one of the .reg files.
Profiling System Calls
Your applications can use system libraries specific for your operating system (native API) or, if your
application is a .NET application, it can use system libraries (assemblies) shared across the .NET Framework
platform. Generally, when profiling applications in AQtime, system calls are not traced. This is simply because
the system libraries have not been added to the Setup panel.
www.automatedqa.com
AQtime by AutomatedQA Corporation
Profiling Various Applications and Code
255
To profile routines from a system dynamic link library or assembly, simply add this library (assembly) to
your AQtime project by using
Add Module ( Add Assembly) in the context menu or the toolbar of the
Setup panel. Run the desired profiler then and you will see functions from these libraries in the profiling
results. Note that AQtime profilers will report on the system functions just as they report on application
functions. You will be able to examine them with the full range of AQtime panels:
In fact, the described method lets you profile routines from any dynamic link libraries, not just from system
ones. The dynamic link libraries may be compiled without debug information, because when profiling calls to
library routines, AQtime will use information from the tables of imported and exported functions that are
included in each Windows executable. If the dynamic link libraries have no debug info, you can profile them at
routine level only.
If your application is a .NET application, you can profile functions contained in .NET Framework
assemblies in another manner: you can check the Profile Entire .NET Code box in the Setup panel. If this
box is checked, AQtime will profile all assemblies whose routines are called during the profiler run. It will
profile even those assemblies and routines that are not added to the profiling areas. This is especially useful, if
you do not know exactly what libraries your application depends on. However, using AQtime you can easily
determine which libraries it uses and then include them in the profiling tasks. See the Knowing What Libraries
Your Application Uses help topic.
© 2010 AutomatedQA Corp.
www.automatedqa.com/support
256
Profiling Applications With AQtime
We would like to note one more time that the Profile Entire .NET Code box lets you profile only .NET
Framework assemblies. If you would like to profile routines from the operating system DLLs, you should add
these DLLs to profiling areas.
The .NET Framework assemblies call functions from the operating system libraries using special stub
functions that prepare parameters and call functions from the operating system libraries. If you check Profile
Entire .NET Code or if you add the .NET Framework assemblies to the Setup panel, AQtime will profile these
stub functions. To profile functions from the operating system DLLs, add these DLLs to the Setup panel.
Profiling Recursive Routines
We will call any function that calls itself or that is eventually called by a child function recursive. In
AQtime terms, a recursive function is one that belongs to its own descendants (children, grandchildren, etc.).
For the Performance profiler, this poses an unavoidable problem regarding what AQtime should call Time
with Children and what it should call Time (that is, without children) for this type of a function.
This topic explains the Time with Children problem for recursive functions, and the solution that is
adopted by the Performance profiler.
Note: Time with Children present in the Performance profiler results only if you use the Elapsed Time,
User Time or User+Kernel Time counters. If you profile your application with any other counter,
for example, with CPU Cache Misses or Hard Memory Page Faults, Time with Children as well
as other “Timing” results (such as Average Time, Min Time, etc.) will be replaced with similar
values: Misses With Children, Faults with Children, Average Misses, Average Faults, etc.
AQtime calculates these values in the same way it calculates the “Time” values. In further
explanations we will use “Time”, but since the results are similar, the explanations are also true
for “Misses”, “Faults” and other results.
Time and Time with Children apply not to one call, but to the sum of calls throughout the profile run.
Now, imagine that one function, FuncA, calls itself three times in a row, so that the original call, FuncA1, gives
rise to three more, FuncA2, FuncA3 and FuncA4. Imagine also that FuncA takes 2 seconds to execute its own
code. If these are the only calls during the profile run, Time should be 8 seconds. But Time with Children?
FuncA4 = 2
FuncA3 = 4
FuncA2 = 6
FuncA1 = 8
Total = 20 seconds
Now, imagine that the entire run was simply the original FuncA1 call. The entire run lasted 8 seconds, but
Time with Children for FuncA is 20 seconds. This is grossly misleading. The reason is that one single
execution, FuncA4, is counted separately as part of the child time for FunA3, FuncA2 and FuncA1, and it is
also counted once as its “own” time - it is counted four times in all. Likewise, FuncA3 is counted three times
and FuncA2 is counted twice. These repeat counts for the same actual execution bloat up Time with Children
as soon as there is recursion.
In the very simple example above, we also know what solution we would like to see; Time with Children
should be identical to the run time, 8 seconds. That is, the same as Time itself, since both values count exactly
the same calls (FuncA1 through FuncA4).
The Performance profiler detects the recursive calls and counts Time and Time with Children for recursive
functions properly. With our simple FuncA example, this means FuncA2, FuncA3 and FuncA4 contribute
www.automatedqa.com
AQtime by AutomatedQA Corporation
Profiling Various Applications and Code
257
nothing to Time with Children, so it remains what it was for FuncA1 alone, 8 seconds, the same as the run time.
This is what we wanted.
Just to make sure everything is clear; here is a somewhat more complex example:
The timings are time spent executing the function itself.
The Performance profiler will report the following results:
© 2010 AutomatedQA Corp.
www.automatedqa.com/support
258
Profiling Applications With AQtime
Results of profiling recursive routines
The net time of FuncA is about 18 seconds (10 seconds for the first call plus 8 seconds for the second call).
FuncD and FuncB are child routines of FuncA. The Time and Time with Children results for them corresponds
to the actual execution time of these routines. FuncC is a parent routine for FuncA. As we can see, the net time
of the FuncA call, which was made within FuncC, is about 8 seconds and Time with Children is 10 seconds.
These values also match to the actual time of function calls.
Note: If the first call to FuncA is not profiled for any reason (for instance, it is excluded by an
off-trigger), the Performance profiler detects no recursion.
Profiling Template Functions
In C++ programs several different functions can be implemented from the same template. The debug info
for these separate implementations will refer to the same source lines, those for the template definition. In other
words, going by debug info, all these implementations are just one function. Thus, when using Coverage and
Performance profilers, the grid of the Editor panel may display incorrect profiling information, for instance
that a function was executed when it was not (only another from the same template was executed). The Report
panel, however, gives the true profiling results. So, when analyzing profiler results for template functions
please use the Report panel to view the correct results.
www.automatedqa.com
AQtime by AutomatedQA Corporation
Profiling Various Applications and Code
259
Profiling Duplicated Code
It is possible that two different routines, for instance, the AddRef methods of two different classes in a
Visual C++ application, have the identical binary code (this is duplicated code). By default, the Visual C++
linker detects such routines and does not duplicate the code. Instead, it generates only one sequence of binary
instructions that suits both occurrences. In this case, the debug information says that two different methods
have the same address in memory. If both methods are included in profiling tasks, AQtime will profile only one
of them. The other “duplicated” routines will be excluded from profiling (they will have zero profiling results).
For all the routines whose code is duplicated, the Analysis Result column, which is available in the Details
panel for the Performance profiler and in the Report panel for the Performance and Coverage profilers, will
hold Duplicated code.
In other unmanaged applications, similar behavior of linkers regarding duplicated code is possible as well.
If your Visual C++ 7.x application includes routines that have duplicated code and you want to profile
them as separate routines in AQtime, do the following:
•
In Visual Studio, open the Project Properties dialog for the project you are going to profile (e.g.
by using Project | Properties).
•
Select Configuration Properties | Linker | Optimization on the left of the dialog.
•
Locate the Enable COMDAT Folding option on the right of the dialog.
•
Set this option to Do Not Remove Redundant COMDATs (/OPT:NOICF).
•
Click OK to close the dialog.
•
Rebuild the project.
Now your project’s debug information will have a individual section for each routine whose code is
duplicated among other routines. As a result, these routines will not be excluded from profiling in AQtime.
Instead, you will be able to profile these routines separately and get non-zero profiling results for each of them.
© 2010 AutomatedQA Corp.
www.automatedqa.com/support
260
Profiling Applications With AQtime
Profiling Small Functions
The Performance and Coverage profilers cannot profile functions that occupy less than five bytes in binary
code. It concerns both managed and unmanaged code. This is a rare case. One single parameter (if used), or one
single call to another function, will make the binary code larger than five bytes.
There is no override for this limit. The only workaround is to make the small functions larger, if you must
absolutely profile them. You may turn off compiler optimizations that may be making your binary code
smaller. Or you may simply add data to the function source to make it larger:
void LittleFunction()
{
#ifdef profile
int tmp[5];
tmp[0] = 1; // prevents the compiler from discarding the declaration
#endif
...
}
If you choose this path, use conditional directives, as shown above, or remember to remove the added code
after profiling.
Profiling Inline Functions
AQtime’s profilers track entry and exit points of a function. When a function is set as inline, the compiler
may insert a copy of the function body in each spot it is called (or it may disregard the directive). Obviously,
with a true inlined function, there are no entry and exit points to track, so AQtime will include profiling results
of that function into results of its parent function (or functions).
If you want an inline function to be profiled, you must set your compiler not to inline it. How you do this,
depends on the compiler you use. Below is information for Microsoft Visual C++, Borland C++Builder and
.NET compilers.
Microsoft Visual C# .NET, Visual Basic .NET and Other .NET Compilers
The JIT compiler compiles and optimizes the code of a managed application during the application run.
The compiler uses specific algorithms to decide whether to inline a function or not. The easiest way to disable
inlining for applications created with .NET compilers is to enable the Disable inlining option of the
Performance or Coverage profiler before the profiler starts. When this option is on, routines in the profiled
application are not inlined.
An alternative way to using the option is to specify the NoInlining method attribute in source code. For
instance:
[C#]
using System.Runtime.CompilerServices;
...
[MethodImpl(MethodImplOptions.NoInlining)]
public void foo()
{
// function code
...
www.automatedqa.com
AQtime by AutomatedQA Corporation
Profiling Various Applications and Code
261
}
Microsoft Visual C++ 6.0 and Visual C++ .NET
Both Microsoft Visual C++ 6 and Microsoft Visual C++ 7 distinguish several ways, in which an inline
function is specified as inline:
•
Using the inline or __inline keywords.
•
For a member function, having its body declared in the class definition.
•
Using #pragma auto_inline to tell the compiler to inline functions according to criteria of its
own.
The Visual C++ compiler includes the Inline Function Expansion option that specifies which inline
functions the compiler will inline. To modify this option:
•
•
In Visual Studio .NET 2002, Visual Studio .NET 2003, Visual Studio 2005, Visual Studio 2008 or
Visual Studio 2010:
Select Project | <project name> Properties from the main menu of Visual Studio. This
will call the Project Properties dialog.
In the dialog, select the Configuration Properties | C\C++ | Optimization node from the
tree on the left.
In Visual Studio 6.0:
Select Project | Settings from the main menu of Visual Studio. This will call the Project
Settings dialog.
In the dialog, switch to the C\C++ tabbed page.
Select Optimizations in the Category box.
© 2010 AutomatedQA Corp.
www.automatedqa.com/support
262
Profiling Applications With AQtime
Possible values for the option are –
Value
Description
Default
Disables inlining. This is the simplest suitable solution for using AQtime.
The compiler will inline functions marked with the inline or
__inline directive or member functions of a class. These functions will
Only __inline
not be available for AQtime. All other functions will be available for
profiling.
Any suitable
The compiler will produce inline code for all functions marked as inline
as well as for any other suitable functions defined under #pragma
auto_line. This is the setting most likely to cause problems, because it
is not possible to predict which functions will be inlined and thus will be
unavailable to AQtime.
So, in order to make all the inline functions available for profiling, we recommend to set the Inline
Function Expansion option to Default.
Borland C++Builder
Borland C++Builder includes the Disable inline expansions option that lets you disable inlining. That is, if
this option is on, the compiler produces standard code for all inline functions, so AQtime can profile inline
functions of any kind.
To modify this option:
•
Select Project | Options from the C++Builder’s main menu. This will call the Project Options
dialog.
•
Switch to the Compiler tabbed page. The Disable inline expansions option is in the Debugging
section of this page.
www.automatedqa.com
AQtime by AutomatedQA Corporation
Profiling Various Applications and Code
263
Samples
To see how inline functions are profiled, you can use a sample application supplied with AQtime, Inline:
<AQtime Samples>\Unmanaged\Inline\VC2005 - Microsoft Visual C++ (Visual Studio 2005, 2008
and 2010 project)
<AQtime Samples>\Unmanaged\Inline\VC - Microsoft Visual C++ (Visual Studio 7.x project)
<AQtime Samples>\Unmanaged\Inline\BCB - Borland C++Builder
<AQtime Samples>\Unmanaged\Inline\GCC - GCC
On Windows 7, Windows Vista and Windows Server 2008, AQtime samples are located in the
<Users>\Public\Documents\AQtime 7 Samples folder. On other operating systems, the samples
reside in the <Documents and Settings>\All Users\Documents\AQtime 7 Samples folder.
Profiling Child Routines Along With Parents
This topic explains precautions to take when profiling a function that calls other functions (child
functions).
Let’s call the caller function ParentFunction. If –
•
you are not using Full Check or Profile Entire .NET Code (if you profile a managed
application),
•
ParentFunction is included in a checked profiling area,
•
but some or all of the child functions it calls are included in no checked area,
then this will happen:
The child functions will not be profiled, and therefore will not appear in the Details panel for
ParentFunction. Their results (for instance, the execution time), will still be counted, but as part of
ParentFunction’s results (for example, the execution time of the ParentFunction’s own code). AQtime
is correctly noting ParentFunction’s entry and exit times, but “knows” nothing about the time spent
© 2010 AutomatedQA Corp.
www.automatedqa.com/support
264
Profiling Applications With AQtime
“outside” on calls to unprofiled child functions. This is can easily lead you to assume the slow code is in
ParentFunction, when actually it is in some unprofiled child function.
So, when you are worried about a function’s execution time (or other results), make sure that its children
are profiled along with it. You may identify the child calls by looking up the parent function in the Editor panel.
This is also a good occasion to think of triggers.
Profiling Startup Code
The actions you need to perform to profile the startup code of an application depends on whether the
process is started by AQtime or by some other process or the operating system.
Regardless of the way your application starts, keep the following in mind:
•
Make sure the startup code is included in profiling areas in the Setup panel.
•
The startup code may not contain the ret instruction (this happens, for instance, with code of
Delphi’s .DPR files), so to profile this code you may need to place it to the routine specially
created for this. For more information, see the Profiling Routines That Do Not Have the ret
Instruction help topic.
If the process is started under AQtime, the profiling engine traces the execution of all the application’s
functions added to profiling tasks, so profiling the startup code is not a problem. You just need to add it to an
including profiling area (or areas).
If your process is not started by AQtime, but started by another process or by the operating system, then to
profile it, you could attach AQtime to it (see the Attaching to Process help topic). However, attaching requires
time, so most likely you will not be able to profile the startup code of your process.
Specifying the host process as a Host Application for the desired process in the Run Parameters dialog will
not solve the problem as well. If you do so, AQtime will only profile the code that is executed within the
address space of the host process, not the desired process. In other words, this approach works for dynamic link
libraries or in-process COM servers, but does not work for applications.
To solve the problem, you can do any of the following:
•
Profile your application in COM Server profiling mode (you can do this even if the process to be
profiled is not a COM server).
•
Modify the registry settings so that when the operating system gets a command to start a process, it
automatically launches AQtime, which you can then use to profile your application.
Using COM Server Mode
When you select the COM Server profiling mode for the application, then AQtime automatically waits
until the application’s executable is loaded in memory and then starts profiling the application code. COM
Server mode was designed for profiling startup code of COM servers that are launched by the operating
system. However, you can use this mode for profiling other applications, even if they are not COM servers:
•
Open your project in AQtime and add the startup code routines into profiling areas (see the Setting
Up a Profiling Project help project).
•
COM Server from the Profiling Mode dropdown list box that is displayed on AQtime’s
Select
Standard toolbar. If you use AQtime integrated into Microsoft Visual Studio, this list box is
located on the AQtime toolbar. If you use AQtime integrated into Embarcadero RAD Studio, this
item is located on the AQtime Profiling Modes toolbar.
www.automatedqa.com
AQtime by AutomatedQA Corporation
Profiling Various Applications and Code
•
265
Select Run | Parameters from AQtime’s main menu. If you use AQtime integrated into Microsoft
Visual Studio or Embarcadero RAD Studio, select the AQtime | Parameters menu item. This will
open the Run Parameters dialog (for COM Server Mode). In the dialog:
In the Client Application box, specify the fully qualified name of the executable that will
launch your application.
Press OK to close the dialog.
•
Press Run to start profiling. If you use AQtime integrated into Microsoft Visual Studio, select
AQtime | Run (or Debug | Run while one of AQtime panels is active) to start profiling. If you use
AQtime integrated into Embarcadero RAD Studio, select AQtime | Run With Profiling menu
item.
•
AQtime will display a message informing you that the client application should be run.
•
Perform actions that will lead to launching your application.
•
Work with your application as needed.
•
Close your application and the application that was specified in the Client Application box of the
Run Parameters dialog.
Modifying Registry Settings
To modify the registry settings:
•
Launch the Registry Editor (regedit).
•
HKEY_LOCAL_MACHINE\Software\Microsoft\Windows
Open
the
NT\CurrentVersion\Image File Execution Options node.
•
Add a key for your application to this node:
Right-click the node and choose New | Key from the context menu. This will create a new key
node under the Image File Execution Options node.
Right-click the new node and select Rename from the context menu.
Change the key name to the name of your executable (for instance, MyApplication.exe). Only
specify the file name and extension. The path is not needed.
•
Specify AQtime as a debugger for the application. To do this:
Right-click the new key node and select New | String Value from the context menu. This will
append a new string value to the created key.
Switch to the right panel of the Registry Editor, right-click the string value’s node and choose
Rename from the context menu.
In the ensuing in-place editor, change the value name to debugger.
Right-click the value node again and select Modify from the context menu. This will call the
Edit String dialog.
In the Value data box of the dialog, enter the fully qualified name of AQtime.exe, for
instance, C:\Program Files\Automated QA\AQtime 7\Bin\AQtime.exe.
Click OK to save the changes and to close the dialog.
Now the operating system will launch AQtime every time your application starts. The general profiling
procedure is:
1. Run the application that will launch your application.
© 2010 AutomatedQA Corp.
www.automatedqa.com/support
266
Profiling Applications With AQtime
2. Modify the registry settings as it was described above.
3. Perform the actions that will lead to launching your application. The operating system will start
AQtime as the registry settings specify it as a debugger for your application.
4. In AQtime, specify the profiling areas and triggers, start profiling and profile your application as you
normally would.
5. Close your application and explore profiling results in AQtime.
Do not forget to remove the key from the Registry when the automatic launch of AQtime is no longer
needed.
If you need to enable or disable the automatic launch frequently, you can create two .reg files:
•
One of the files will include the Registry key and the debugger value with the path to AQtime:
To create this file:
1. Modify the registry as it was described above.
2. Select the key in the tree view on the left of the Registry Editor.
3. Choose File | Export from the editor’s main menu and specify the file name in the ensuing
Export Registry File dialog.
•
Another file will store the Registry key and the debugger value, but it will not store the path to
AQtime:
To create this file:
www.automatedqa.com
AQtime by AutomatedQA Corporation
Profiling Various Applications and Code
267
4. Modify the registry as it was described above.
5. Clear the data of the debugger value.
6. Export the key to a file by choosing File | Export from the main menu of the Registry
Editor.
Now, when you need to enable or disable the automatic launch of AQtime for your application, you can
execute one of the .reg files.
Profiling Routines That Do Not Have the ret Instruction
AQtime profilers cannot correctly analyze functions that exit without the ret instruction, but through a
jump. You may choose to put such routines into an excluding area. But if you wish to profile them, all you
have to do is to make a few modifications in source code. The easiest way is to add an assembler block to the
end of the routine. For instance:
[Visual C++]
...
__asm{
jmp tmp
ret
tmp:
}
[Delphi]
...
asm
jmp tmp
ret
tmp:
end;
If this does not help, try modifying the function’s code. For instance, Borland Delphi uses a .dpr file that
holds code used to initialize an application, display the splash screen, load any data common to the entire
application etc. This code is placed between begin and end, without a function name, as per Pascal rules. Call
this the main procedure for the application.
The main procedure does not exit normally; it simply ends when Application.Terminate is executed.
Therefore, the Performance or Coverage profiler, for instance, cannot profile it. If you wish for it to be
profiled, you simply have to move its code to an ordinary procedure, with a name, and call that from the .dpr
file.
Suppose, the dpr file originally used the following code:
[Delphi]
uses
Forms,
Unit1 in 'Unit1.pas' {Form1};
© 2010 AutomatedQA Corp.
www.automatedqa.com/support
268
Profiling Applications With AQtime
{$R *.RES}
begin
{ a custom procedure that loads data common for
the entire application }
LoadCommonData;
Application.Initialize;
Application.CreateForm(TForm1, Form1);
Application.Run;
end;
The trick will be to add the DoMain procedure to Unit1.pas (including an interface part declaration), cut
and paste the code of the main procedure and replace it with the call to DoMain, leaving the dpr code as below:
[Delphi]
uses
Forms,
Unit1 in 'Unit1.pas' {Form1};
{$R *.RES}
begin
DoMain;
end;
Unit1.pas is changed on this model:
[Delphi]
interface
...
procedure DoMain;
implementation
procedure DoMain;
begin
{ a custom procedure that loads data common for
the entire application }
LoadCommonData;
Application.Initialize;
Application.CreateForm(TForm1, Form1);
Application.Run;
end;
The Performance and Coverage profilers will now be able to profile DoMain.
www.automatedqa.com
AQtime by AutomatedQA Corporation
Profiling Various Applications and Code
269
Profiling Routines That Have Unsafe Code
Some of AQtime’s profilers cannot profile routines that include unsafe code. Unsafe code means that your
routine’s binary code contains both binary code instructions and data (numeric and string constants, jump
tables and so on). AQtime cannot isolate these two from each other. This may happen with some Delphi and
Visual C++ routines that contain strings or ASSERTs and that you are going to profile at the line level. The fact
is that the compiler places the data after the ret instruction, but debug information “includes” the data size into
the routine’s code, so AQtime is unable to determine where the routine’s binary code ends in memory. Below
are examples of two routines that are possible candidates for having unsafe code:
[Visual C++]
void MyFunc()
...
int cnt = objCollection->getCount();
ASSERT(cnt < 0, "Invalid value.");
...
}
[Delphi]
procedure MyFunc()
begin
...
MessageBox(0, 'Text', 'Caption', MB_OK);
...
end;
To solve the problem, you have to change the source code in order for the compiler to generate binary code
in a different way. Here are some possible ways to do this:
●
If you use the Debug configuration for your Visual C++ application, recompile it in the Release
configuration.
●
Divide your routine into a number of routines with smaller sizes. This will decrease the amount of
data kept within the routine’s binary code.
●
Try to decrease the amount of data kept within the routine’s code by moving string constants
outside the routine. For instance, if your routine includes a call to the MessageBox function:
[Delphi]
procedure MyFunc()
begin
...
MessageBox(0, 'Text', 'Caption', MB_OK);
...
end;
You can move the string constants (“Text” and “Caption”) outside the routine:
[Delphi]
string cText = 'Text';
© 2010 AutomatedQA Corp.
www.automatedqa.com/support
270
Profiling Applications With AQtime
string cCaption = 'Caption';
procedure MyFunc()
begin
...
MessageBox(0, cText, cCaption, MB_OK);
...
end;
●
Create a stub routine that will call your routine and profile this stub routine at line level:
[Visual C++]
#pragma optimize("", off)
void StubFunc(int someValue)
{
MyFunc(someValue);
}
#pragma optimize("", on)
We used the #pragma optimize directives to make sure that StubFunc occupies more than five bytes in
memory. This is a rare case, however. If a routine uses at least one parameter, or if it calls another function, its
binary code will be larger than five bytes.
www.automatedqa.com
AQtime by AutomatedQA Corporation
Working With Profiler Results
271
Working With Profiler Results
Adding Selected Routines and Classes to Profiling Areas
You can add routines or classes to profiling areas, triggers and actions directly from the Report panel. To
do so, select one or more rows in the Report panel and select Add Selected to Setup from the context menu.
This will open another menu containing six items:
AQtime standalone and AQtime integrated into RAD Studio
AQtime integrated into Visual Studio
The Add to Existing Area, Add to Existing Action and Add to Existing Trigger commands display the
Select Area, Select Action and Select Trigger dialogs respectively. In these dialogs, you can select an
existing profiling area, action or trigger and add the selected routines or classes to it.
The Add to New Area, Add to New Action and Add to New Trigger commands display the Add Area,
Add Action and Add Trigger dialogs where you can create a new area, action or trigger and then add the
selected routines or classes to it.
These features let you easily separate the desired routines from other application functions and then profile
the desired routines only. Suppose you run the Performance profiler against the entire application; you found
several slow routines and want to profile them. In this case, you can select these routines in the Report panel,
add them to a new profiling area via the Add to New Area command, uncheck other profiling areas in the
Setup panel and then start a new profiler run. Creating a new profiling area from the Report panel is faster than
creating a new area and adding the desired routines to it in the Setup panel.
© 2010 AutomatedQA Corp.
www.automatedqa.com/support
272
Profiling Applications With AQtime
Note: The above commands are applicable to classes, if the items displayed on each row of the
Report panel are classes (for example, the results of the Allocation profiler), as opposed to
routines.
Comparing and Merging Results
Within the Explorer panel, AQtime stores a "Last Results" archive of the most recent result sets (five sets
by default). These are labeled with date and time, and you can add your description directly on screen. While a
result set is still archived, you can choose to copy it to your own archive, Saved Results, where it will remain
until you delete the set or delete the project from disk. All of the Explorer contents are specific to the current
project and current profiler. See Explorer Panel for details on all these points.
Explorer panel in AQtime standalone
www.automatedqa.com
AQtime by AutomatedQA Corporation
Working With Profiler Results
273
Explorer panel in AQtime integrated into Visual Studio
Explorer panel in AQtime integrated into RAD Studio
Besides allowing easy reference to past results, this system lets you set up comparisons between result
sets or merge them into a new, combined result set.
Comparing Results
Suppose you have profiled a sorting procedure and discovered that it is slow. You may decide that the
algorithm must be optimized. You will try something, and then profile it again. At this point the "Compare"
facility steps in and lets you focus on the resulting differences in a single comparison report, laid out as a
normal result report would be.
We will call each stored result set (that is, a child node of the dated nodes in the Explorer panel) a record.
Compare from the Explorer
You can multi-select any number of records in the Explorer panel then choose
toolbar or from the context menu and, voila!, the comparative report will appear in the Report panel.
The comparison is configurable, of course. Select Compare Settings from the Explorer context menu and
you will get the Compare Settings dialog:
© 2010 AutomatedQA Corp.
www.automatedqa.com/support
274
Profiling Applications With AQtime
The actual dialog depends on the current profiler. The checkboxes in the Compare column select the
columns you want to show in your comparison report.
For numeric results, if you have selected only two records to compare, you can select a Difference Style. If
you have more than two records, the Difference Style is None, which means that columns from each record
will simply be shown side by side. Other Difference Styles are simply ways to "compact" the columns from the
two records into one by doing a simple arithmetic operation on them to show the difference. These Styles use
"Record 1" for the first record you selected, "Record 2" for the second.
Explorer options include an Always set up Compare parameters checkbox. If this is checked, then the
Compare Settings dialog will pop up whenever you ask for a Compare.
Although the Details, Call Graph and Call Tree panels are not available in comparison mode, the Editor
(in Visual Studio, Code Editor) and Disassembler panels still work and display the most recent code for the
routine selected in the Report panel.
Note that you can compare results from the same categories only. For instance, you cannot compare the
Allocation profiler results, if one of them is stored to the Classes category and the other to the Objects
category. If you compare the Performance profiler results, be sure they were generated by the same counter.
AQtime cannot compare results that were generated by different counters.
Merging Results
Merging results means bringing them together into a new result set, as if it was another profiler result,
except that the numeric fields are replaced by the sum, average, maximum or minimum of the values in the
merged records (see more below).
The resulting record goes into the Merged Results section of the Explorer panel. Note that the Explorer
shows it as if it held its source records as well, but this is only a way to identify the source. Only the merged
results are kept in Merged Results. Like Current Results, Merged Results must be saved (from the toolbar or
the context menu) to be kept beyond the auto-archive limit (default five records).
www.automatedqa.com
AQtime by AutomatedQA Corporation
Working With Profiler Results
275
The advantage of merges is that they focus on important statistics for the collection of records selected,
such as average results over several runs. The limitation is that the application must not have changed in ways
important to profiler results. If function names have changed, for instance, then merging becomes pointless.
The merging also becomes useless if a profiled function has been changed a great deal (for instance, if its
algorithm was optimized).
To merge two or more results, simply multi-select their top-level node in the Explorer panel (use Ctrl or
Shift keys for multi-selection) and then choose
Merge from the Explorer toolbar or from the context menu.
You may include records from the Merged Results section in a later merge, since AQtime considers merged
results just like other results.
Note that the Merge item of the context menu is enabled only when you select the top-level node of a result
set. If you select a category or a thread node, the item will be disabled.
AQtime merges column values according to the column meaning. We will illustrate this using an example.
Suppose, you profiled the fooA function two times with the Coverage profiler and then merged the results of
these two runs. The resultant Hit Count value of the fooA function will be the sum of Hit Count values in these
two results. If you profiled fooA at line level, the lines' Hit Count results will also be summarized. The
routine's Lines Covered and Lines Uncovered results will not be summarized. They will be recalculated
according to the line's Hit Count values in the merged result. The % Covered result of a routine will be
recalculated according to these Lines Covered and Lines Uncovered results. Therefore, it will show what
portion of the fooA function has been executed after that two runs of the Coverage profiler.
Results of the Performance profiler include columns that indicate the minimum and maximum results for a
function, for example, Min Time and Max Time. When merging these columns, AQtime will include the
minimum of Min Time and maximum of Max Time values into the merged result set. Columns holding such
results as Time or Hit Count will be summarized. Columns holding average values, for example, Average
Time, will be recalculated according to the summarized Time and Hit Count values. Percent columns (for
example, % Time) will also be recalculated according to the summarized values.
Note: If you merge results of the Performance profiler, be sure they were generated by the same
counter. AQtime cannot merge results that were generated by different counters.
Some AQtime profilers, for instance, Performance, Coverage or Function Trace, organize results by
threads. The result sets produced by these profilers contain the All threads item and the items for each profiled
thread. When you merge results of these profilers, AQtime merges the data of the All threads items and copies
the data of individual thread items. This happens because it's impossible to determine which thread of one set
of results corresponds to a thread of another set of results. So, by default, the individual thread items are not
merged. They are just copied to the merged result set.
To work around this limitation, you can assign a custom name to the threads in your application. In this
case, to identify the thread AQtime will use this custom name rather than the thread id. It will be possible to
determine the correspondence between threads in different result sets and AQtime is able to merge them. In
other words, AQtime can merge named threads. For information on how to specify custom names for threads,
see Assigning Names to Threads.
Similarly, to work with ordinary results, you can use both the Summary and Report panels. The Summary
panel displays brief profiling results for all merged result sets. For merged results the panel displays session
information, profiler-dependent data and profiler options; it does not show run settings and system information
sections that are available for ordinary result sets. For the profilers that organize results by threads, the panel
shows summary results for all threads and for each individual thread. The Report panel displays detailed
information about every profiled routine, object, class and so on. The panel contents is the same as for ordinary
result sets, the difference is that individual values are calculated as described above: the actual measurements
are summarized, derived characteristics are comparison and so on. Additional information on merged results
can also be displayed in the Editor, Call Graph, Call Tree, Details and Disassembler panels.
© 2010 AutomatedQA Corp.
www.automatedqa.com/support
276
Profiling Applications With AQtime
The Explorer panel includes the Auto-merge option group which you can use to merge results
automatically. The group includes two options: Active and Folder name. Active lets you turn the auto-merging
on or off. Folder name specifies the name of a result set in the Merged Results folder with which every new
result set with automatically be merged. That is, the Folder name result serves as a cumulative storage to which
every new result is added.
Sorting Results
In any panel, on any column where sorting makes sense, you can sort records on that column by clicking
the header, once for sorting in one direction, once more to switch directions. The fact that records are sorted on
that column, as well as the sort direction, is shown by an arrowhead next to the column caption.
You can sort on several columns in succession. Hold down the Shift key. The first column you click will be
the first sort key, the second will be the second key, and so on. Re-click on any column without Shift, and it
becomes the single sort key again.
Sort Ascending and
The context menu of some AQtime panels offers
another way of doing what a simple click or two would do.
Sort Descending. This is
To cancel sorting on a column, press the CTRL key and then click the header of the appropriate column.
Grouping Results
Grouping results means getting all results (records) that share a single value for one field (for example,
Class), to show on a single line in the Report panel. The column you choose to group results on becomes a
synopsis of the entire result set (for instance, results grouped by class), shown in tree fashion, and the
individual records are available by opening up the appropriate branch. This simplifies onscreen navigation of
the Report panel when there are several records to show.
This is one reason all of the profilers include fields (for example, Source file, Class name, and so on) that
help locate a profiled function in source code. For instance, when you group results on the Source file column,
each grouped tree node corresponds to a separate source file. Try it!
You can apply grouping simply by choosing Group by This Column from the context menu for the
column header. However, for better control, and especially to undo grouping, you should choose
Show
Group Panel from the Report toolbar or from the context menu anywhere in the panel. This opens the
grouping area:
www.automatedqa.com
AQtime by AutomatedQA Corporation
Working With Profiler Results
277
To group results on a column, drag the column header to the grouping area. To ungroup results, drag the
column header out of this area.
You can group on more than one column. Note that in addition to the "global" summary that is shown at the
bottom of the Report panel, AQtime displays "group" summary at the bottom of each group:
© 2010 AutomatedQA Corp.
www.automatedqa.com/support
278
Profiling Applications With AQtime
Searching Results
AQtime offers two means of searching through the records in a panel.
•
You can click on a column header and begin to type the word to search for. Incrementally, the
highlight will move to the corresponding record as you add letters. This is case-insensitive.
AQtime standalone
AQtime integrated into Visual Studio
www.automatedqa.com
AQtime by AutomatedQA Corporation
Working With Profiler Results
279
AQtime integrated into RAD Studio
The incremental search also works in panels that do not hold columns. For example, it works in the
Modules list of the Setup panel.
•
In the Report, Event View, Setup or Disassembler panel, choosing
Find from the context
menu will display the ensuing Find dialog, where you can specify the desired search parameters.
If you use AQtime standalone, you can also open the Find dialog by choosing
Edit menu.
Find from the
Filtering Results
The output of AQtime’s profilers can be displayed in a pre-selected form by defining filters. A filter
defines conditions that records (report lines) must meet in order to be displayed in the Report panel.
The easiest way to filter results is to press the dropdown button in the header of a column in the Report
panel. Pressing the button opens a list that holds all values displayed in this column. Select the desired value
from this list and the Report panel will only display those records which hold the selected value in the column
(see the image below). This is also called auto-filtering. This is the easiest and fastest way to display results
for all of the routines a class, unit or module contains.
© 2010 AutomatedQA Corp.
www.automatedqa.com/support
280
Profiling Applications With AQtime
You can filter results on several columns: just select the filtering value for each of these columns. For
example, on the picture above the filter is applied on the Class Name and Hit Count columns. The current filter
conditions are displayed at the bottom of the Report panel. To disable the filter, simply uncheck it there. To
remove the filter, press the
button. To modify the filter conditions for the chosen column, select (Custom...)
from the dropdown list and use the ensuing Custom Filter or Filter dialog. You can also modify the entire
filter (for all columns) by pressing the Customize button and using the subsequent Filter dialog.
Another way of filtering results is to select
Filter on the Report toolbar or context menu. This will call
the Filter dialog that lets you create custom filter conditions. You can use wildcards in conditions (the _ and %
symbols) to search for the desired values in string columns.
Once you have created the desired filter in the dialog, press OK to save and apply the filter. You can also
save the current filter to or load it from a file.
One final way of filtering results is to use result views. A result view combines the filter expression and
column layouts in AQtime panels, for one profiler. To apply a result view, simply select it from the Result
Views dropdown list on the Standard toolbar or from the View | Result Views menu (if you use AQtime
integrated into Visual Studio, you can select a view from the Result Views dialog that is called upon selecting
AQtime | Result Views from Visual Studio’s main menu; if you use AQtime integrated into RAD Studio, you
can select a view from the Result Views dialog that is called upon clicking the Result Views button). There are
several predefined result views for each profiler type. You can also create your own views. For more
information on this, see Result Views.
Using Result Views
A result view is a group of settings for displaying results. Creating and using result views (including the
many pre-defined ones) is a great way to accelerate, simplify and clarify the analysis of your results. A view
can serve not only as a preset format, but as a preset question to which you get an immediate, clear answer by
switching to the view. Many of the pre-defined result views are of that nature, and you can define more for your
own frequently asked questions.
A result view is defined for one specific profiler, and stored in the profiler's single .qtview file, which
groups all the views currently defined for it. By default, the stored settings are for:
•
filter expression
•
column layout in AQtime panels
www.automatedqa.com
AQtime by AutomatedQA Corporation
Working With Profiler Results
•
column layout in the Editor's grid
•
panel layout in the Details panel
281
Some later plug-in profilers may add to the items that are stored in their result views.
A view does not include settings for the panels layout. For more information on how to load and save the
panel layout, see Docking.
You can add a new result view to store your current filter and panel settings, for the current profiler, simply
Result Views button on the Standard toolbar and using the ensuing Result Views dialog (if
by pressing the
you use AQtime integrated into Visual Studio, you can call the Result Views dialog by selecting AQtime |
Result Views from Visual Studio’s main menu; if you use AQtime integrated into RAD Studio, call the Result
Views dialog by clicking the Result Views button).
This dialog displays result views available for the current profiler. To apply a view, simply select it in the
Result Views dialog and click OK.
If you use AQtime standalone, the result views available for the current profiler are displayed in the
Result Views dropdown list on the Standard toolbar as well as in the View | Result Views menu:
© 2010 AutomatedQA Corp.
www.automatedqa.com/support
282
Profiling Applications With AQtime
Until you add your own views, the Result Views list displays the views that are included with AQtime, and
which are defined for all applicable profilers. The rest of this topic is devoted to capsule explanations of these
standard views.
The Default view is what AQtime uses when executing AQtime for the first time. If you change a series of
parameters for the Report panel and then select the Default view, AQtime automatically restores its standard
settings.
Current View is simply the name for whatever settings are currently active. It is not a stored view, but you
Result Views button, to the left of the list. You
can make it so by saving it and defining a name using the
will then be able to retrieve it for re-use. Note that it applies only to the current profiler.
The More than 3% (body only) and More than 3% (with children) views are available for the
Performance profiler only. You can use them for profiling results that were obtained for any counter the
profiler supports.
•
For time counters, More than 3% (body only) displays the routines that execute the slowest in
their own code, independent of the routines they call (% <Counter-Dependent-Value> , for
example:% Time, is greater than 3).
•
For time counters, More than 3% (with children) displays the slowest routines, counting all time
spent between entry and exit, including "child"calls (% with Children is greater than 3).
The Performance profiler supports one more result view - Default with '%' columns. This view is similar
to the Default view. It shows percent columns (for example, % Time,% with Children, % Branches, % Misses,
and so on) and hides the corresponding non-percent columns (Time, Time with Children, Branches, Branches
with Children, and so on).
The Coverage profiler supports the following result views:
•
Routines covered less than 50% - This view lets you quickly isolate routines in which only 50%
or less source lines were executed during the profiling run. The Coverage profiler also supports
two more similar views: Routines covered less than 90% and Routine covered less than 100%.
•
Unexecuted routines only - If you select this view, AQtime will display only those routines that
were not executed during the profiler run.
The Static Analysis profiler provides the following result views:
www.automatedqa.com
AQtime by AutomatedQA Corporation
Working With Profiler Results
283
•
Leaf routines (classes) view. The result of this view depends on the results category that is
selected in the Explorer panel. If the Routines category is selected, the view will display those
routines that do not call other routines. If the Classes category is selected, the view displays
classes that do not call methods of other classes. After such routines or classes are found, you can
quickly exclude them from profiling tasks: select all rows in the Report panel and then use the
Add Selected to Setup item of the Report context menu to add the selected routines (classes) to an
excluding area (see Adding Selected Routines and Classes to Profiling Areas, Triggers and
Actions).
•
The Non-leaf routines (classes) view is similar to Leaf routines (classes), but it selects elements
by another attribute. If the Routines category is selected, this view will display those routines that
call other routines. If the Classes category is selected, the view will display classes that call
methods of other classes.
•
The By module view displays profiling results grouped by the Module Name column.
•
Native code routines and classes and .NET code routines and classes let you view profiling
results of native code or .NET routines and classes only.
Printing Profiler Results
If AQtime is running as a standalone application, profiling results displayed in the Report or Call Graph
panels can be printed directly:
•
Begin by checking the Print Preview form, using Print Preview from the context menu. This
does not just preview how results will print out, but allows you to completely configure the
printing: color and font settings, printer properties, paper size, background images, and so forth.
Once you are satisfied with the configuration and preview, you can print directly from the form.
•
If you already know how the report will print and do not wish to change anything, you can use
Print directly from the Report panel context menu as a shortcut.
If you prefer, you can of course print reports indirectly by first exporting results to an external file (XLS,
XML, TXT or HTML) and then printing using the appropriate application (for instance, Microsoft Excel or
Internet Explorer). This is convenient because your exact printing source remains on file, fully formatted.
Exporting Results
AQtime includes several ways to export data: you can export data that is shown in individual AQtime
panels or you can export the entire result sets.
Exporting Entire Result Sets
To export result sets, use items of the Explorer panel’s context menu.
Note that you can also export results by working with AQtime via COM. See Methods and Properties of
the IaqAQtimeResults Object.
Exporting Data to and Importing Them From Binary Files
Using items of the Explorer panel context menu, you can save profiling results to a binary file with the .aqr
extension and load them from this file. To save results, right-click the desired result set in the panel and then
choose Save to File from the context menu. Load From File will retrieve results saved to a binary file this
way.
Exporting Data to a Database
© 2010 AutomatedQA Corp.
www.automatedqa.com/support
284
Profiling Applications With AQtime
To export a result set to a database, right-click it in the Explorer pane and choose Export to Database
from the context menu. In the ensuing dialog, specify the database connection settings and click OK. For
detailed information, see Exporting Profiling Results to Database in on-line help.
Note that you can also export results to a database by working with AQtime via COM. See Exporting
Results to Database via COM in on-line help.
Exporting Data of Individual Panels
Report, Details, Disassembler and Event View Panels
From the Report panel profiling results can be copied to the clipboard or exported to a file in any of the
following formats: Microsoft Excel, tab-delimited text, HTML or XML (viewable in Internet Explorer 5.0 8.0, Firefox 1.5 - 3.5, Opera 9.0 - 10.51 or in any browser based on the Microsoft WebBrowser control).
To save results:
•
Select the rows you want to export (you can use Shift and Ctrl for multi-selection. See Selecting
Several Records in a Panel).
•
Right-click somewhere in the panel and choose Save Selection from the context menu. This will
open the dialog where you can specify the file format and the file name. After you did these, close
the dialog by pressing Save.
To save all results (regardless of the selected rows) use the
Save All context menu item.
To copy results to the clipboard, select the desired rows and then choose Copy from the context menu.
When you save or copy the profiling results from the Report panel, column headers are always included in
their current order on the panel. When exporting the results of the Performance profiler to XML, AQtime
exports both Report and Details results. For a detailed overview of the XML output produced by AQtime, see
Structure of XML Results. This may be necessary if you want to process the resultant XML files to meet your
specific needs.
This is what concerns the Report panel. Besides export of results in the Report panel, you can also export
the contents of the Details, Event View and Disassembler panels to the Excel's XLS (Details), XML (Event
View and Disassembler), HTML and tab-delimited text files. To do this, multi-select the desired lines in the
corresponding panel and then choose Save Selection from the panel's context menu. To save all lines rather
than selected only, choose the Save All menu item.
Call Tree Panel
To store the results displayed in the Call Tree panel, right-click within the panel to invoke the context
menu and then choose Save All. This will bring up the dialog where you can specify the name, path and type of
the file. The following file formats can be used: XML, HTML and tab-delimited text.
www.automatedqa.com
AQtime by AutomatedQA Corporation
Common Tasks
285
Common Tasks
Using AQtime's profilers, you can perform the following tasks that you might need to do:
¾ Disabling inlining for the managed application to be profiled
¾ Finding memory block violations
¾ Finding routines exported and imported by a module
¾ Finding the routine where an exception occurred
¾ Finding the routine that created an object or allocated a memory block
¾ Finding where a method or a class is defined in source code
¾ Knowing average, maximum and minimum execution times for a method
¾ Knowing if a method raised exceptions
¾ Knowing on which platforms your application can run
¾ Knowing paramaters and result values of function calls
¾ Knowing the number of clients that refer to an interface object
¾ Knowing the number of entries into a method
¾ Knowing the total time spent executing a method (including child methods)
¾ Knowing the total time spent on a method (excluding child methods)
¾ Knowing the structure of potential interlinks between classes
¾ Knowing the structure of references between objects
¾ Knowing the structure of routine calls in your application
¾ Knowing what binary or MSIL code a method has
¾ Knowing what libraries your application uses
¾ Knowing what methods are called the most or the least often
¾ Knowing what methods take up the most or the least execution time
¾ Knowing what methods use the most time for JIT compiling
¾ Knowing what methods were executed
¾ Knowing what source code lines are called the most or the least often
¾ Knowing what source code lines take up the most or the least execution time
¾ Knowing what source code lines were executed
¾ Searching for bottleneck reasons with the Performance profiler
¾ Searching for memory leaks
¾ Searching for resource leaks and errors in resource management functions
¾ Tracing references between objects
If you have not found the task you need in the list above, see other parts of the How To section.
Disabling inlining for the managed application to be profiled
The JIT (Just-In-Time) compiler can inline some methods when their code is short enough. The result will
be that profilers can not record calls to these methods, since the calls have been replaced with code copies. The
© 2010 AutomatedQA Corp.
www.automatedqa.com/support
286
Profiling Applications With AQtime
Performance and Coverage profilers includes the Disable inlining option that lets you avoid the problem.
Checking this option will disable inlining in .NET modules profiled with the Performance or Coverage
profilers. Note that enabling this option will affect performance (and thus performance measurements),
because inlining normally speeds up the caller methods and also avoids certain JITting events for the inlined
(called) methods.
Finding memory block violations
When an application is running under AQtime, it traces the attempts to write data beyond the allocated
memory blocks. To enable the tracing, activate the Check Memory Bounds of the Allocation profiler. See
Checking Bounds of Memory Blocks to learn more about this feature.
If a memory violation occurs, the Event View panel posts the following message: “AQtime detected
unexpected data written before (or after) a memory block”, followed by the block address and it’s size.
Further investigation can be made using the Objects category of the Report panel.
1. Select a memory violation row in the Report panel. This row holds the “Memory Overwrite Error”
value in the class name column. For more detailed information on columns values, see the Allocation
Profiler - Report Panel Columns.
2. Switch to the Details panel.
3. Choose the Creation Call Stack pane. It will display the function call's sequence for the selected
violation. Since errors with the memory block bounds are only found when the corresponding memory
block is deleted or reallocated the call stack displays routine calls that led to the error detection, but not
to the error appearance.
Analyzing the call stack column values will help you find the exact code line where the “defective”
memory block was allocated.
Finding routines exported and imported by a module
To find routines that are exported and imported by your module, use the PE Reader panel (this panel scans
modules included in your AQtime project and displays information stored in those modules).
•
Add your module to your AQtime project.
•
Open the PE Reader panel and activate the Routine Information tabbed page. This page displays a
list of imported and exported routines.
•
The list of imported routines shows which functions the “parent” module imports from the
selected “child” module. So, to find which functions your module imports from any other module,
say ModuleA, select ModuleA in the module tree and then view the Imported Routines table on
the Routine Information tabbed page.
•
To view the function exported by your module, simply select your module in the module tree and
then view the Exported Routine table on the Routine Information page.
Finding the routine where an exception occurred
When your application is being run by AQtime, the Event View panel traces all exceptions that occur in the
application. To enable the tracing, activate the Common | Exceptions | Active panel option. If an exception
occurs, the Event View panel will report about it by logging the exception code and description. The panel will
also display the stack of function call that led to the exception as child nodes of the exception node (note that
the call stack is traced if the panel’s Show call stack option is enabled).
www.automatedqa.com
AQtime by AutomatedQA Corporation
Common Tasks
287
In an exception’s call stack displayed in the Event View, the topmost routine is the one where the
exception occurred. To view source code of a routine listed on the call stack, click this routine and then open
the Editor panel (This is possible only if the application was compiled with debug information. See How
AQtime Profilers Use Metadata and Debug Information). Debug info also lets you distinguish routines on the
call stack easier. Without it, only addresses of these routines are displayed. In this instance, names are only
available for functions that are exported from DLLs. With debug info, routine names are given in their natural
format.
To determine the cause of the exception, examine the call stack and the conditions, in which the
application was running. Note that AQtime does not support profiling of .NET applications that reside on
another computer. Profiling of these applications causes an exception that occurs within the application code
due to security peculiarities of the .NET Framework (see Profiling .NET Applications - Peculiarities).
To determine the cause of the problem, you can generate a dump file that includes information about the
application’s memory, threads, loaded modules and other data that may help you understand what went wrong.
You can also configure AQtime so that it generates dumps automatically. See Generating Dumps for Profiled
Applications.
Finding where a method or a class is defined in source code
For the Performance, Allocation, Coverage and Static Analysis profilers, the Report panel includes the
Module Name, Namespace and Class Name columns, which specify the source location of each class. For the
Performance, Coverage and Static Analysis profilers, the panel also includes the Routine Name column,
which lets you locate the desired routine in profiling results.
If your application was compiled with debug information (see How AQtime Profilers Use Metadata and
Debug Information), the Performance, Coverage and Static Analysis profilers will provide additional columns
- Source File and Source Line - that specify the exact location of a particular routine in source code.
Knowing average, maximum and minimum execution times for a method
Profile your application using the Performance profiler with the Elapsed Time, User Time or User+Kernel
Time counter. Select the Routines category in the Explorer panel and find the desired routine in the Report
panel. Then check the Average Time, Max Time and Min Time columns. These are all for the method’s own
code, exclusive of the time spent on calling other methods. Average Time with Children, Max Time with
Children and Min Time with Children count not only the time taken up by the method's own code, but also
the entire call, including child calls.
Often the time spent on the first call to a routine might seriously differ from the time spent on subsequent
calls to it, due to initializations which are normally performed during the first call. That is why it might be
useful to know the time of the first call to each routine profiled. For this purpose, use the First Time and First
Time with Children columns.
An alternative way to find the minimum and maximum execution time is to use the Function Trace profiler.
This profiler traces the sequence of function calls and logs execution time and parameters of methods calls:
•
Run the Function Trace profiler using the Elapsed Time, User Time or User+Kernel Time counter.
•
Generate results and select the Call Trace result category in the Explorer panel. The Report panel
will display the sequence of function calls for the thread selected in the Explorer panel. Each row
in the Report panel will correspond to a function call.
•
Switch to the Report panel and filter results on the Routine Name column so that the panel
displays rows corresponding to calls of the desired routine. See Filtering Results for more
information.
© 2010 AutomatedQA Corp.
www.automatedqa.com/support
288
Profiling Applications With AQtime
•
Sort rows on the Time or Time With Children column to find the maximum and minimum
execution time for the rotuine (see Sorting Results).
Despite the fact that the search for minimum and maximum execution time in Function Trace results
requires more operations, it still gives you one benefit: if you double-click a row in the Report panel, the
Details panel will show parameter values used for the function call. That is, by analyzing the Function Trace
profiler results you can find parameters passed to and received from the routine when its execution takes a
maximum or minimum amount of time.
Knowing if a method raised exceptions
Use the Performance profiler. Select the Routines category in the Explorer panel. In the Report panel, the
Exceptions (#) column will tell you how many exceptions were raised by each method.
Knowing on which platforms your application can run
Use the Platform Compliance profiler. Before running it, in the Platform Compliance Settings dialog,
specify the platforms on which you wish to check compatibility of your application. In addition, select Full
Analysis as the compliance level. This will perform the full analysis of all the functions that are called from
statically linked libraries by your application. Once profiling is over, switch to the Summary panel. For each
platform, this panel will give you information on functions that are not fully supported on the given platform.
Therefore, you can judge whether your application can run on this or that platform.
Knowing parameters and result values of function calls
Add the desired routine to an including profiling area whose Retrieve parameter values property is
enabled. Start the Function Trace profiler. Get results. Select the Call Trace category in the Explorer panel.
When the Call Trace category is selected, the Report panel displays the sequence of function calls for each
application thread. Each row in the Report panel corresponds to a function call. Select the desired thread in the
Explorer panel and then choose the desired function call in the Report panel. Double-click the function call row
and switch to the Details panel. This panel contains two tables - Routine Parameters On Enter and Routine
Parameters On Exit - that display parameter values on entering and exiting the routine. The last row of the
Routine Parameters On Exit table holds information on the function result value. For more information on table
columns, see Function Trace Profiler - Details Panel Columns (Call Trace Category).
Knowing the number of clients that refer to an interface object
AQtime includes the Reference Count profiler that tracks references to objects that implement the
IUnknown interface or its descendants. Profile your application with this profiler. In the profiling results,
select the Objects category in the Explorer panel. Then select the desired object in the Report panel and check
the values of the Total References, Live References and Peak References columns. These values indicate the
total number of references, the current number of references, and the maximum number of references that
existed simultaneously.
You can trace how references to the chosen interface object were created in the References pane of the
Details panel.
Knowing the number of entries into a method
Use the Performance or Coverage profiler. Select the Routines category in the Explorer panel. In the
Report panel, find the line for the method and look up the Hit Count column.
www.automatedqa.com
AQtime by AutomatedQA Corporation
Common Tasks
289
If you want to learn the total number of potential calls to a routine as coded in the source, use the Static
Analysis profiler, select the Routines category of profiling results, then locate the routine in the Report panel
and look up the Call Count column.
Knowing the structure of potential interlinks between classes in your
application
Use the Static Analysis profiler, select the Classes category of profiling results, click a class in the Report
panel and then switch to the Call Tree panel. Its Parents pane will display the tree of classes whose methods
call methods of the currently selected class as coded in the source, while the Children pane will display the
tree of classes whose methods are called by methods of the selected class.
To know the structure of links between your classes, you can also use the Sequence Diagram Link
profiler. This profiler statically analyzes your application to track function calls, then builds a UML diagram of
function calls and outputs the diagram into Microsoft Word or Microsoft Visio. The diagram clearly shows
what methods of what classes call methods of other classes.
Knowing the structure of references between objects in your application
Use the Allocation profiler. Select the Objects category in the Explorer panel. Then select the desired
object in the Report panel and switch to the Call Tree panel:
•
The References From table of the Call Tree panel will tell you what objects held references to the
selected object, what objects referred to those objects, etc.
•
The References To table of the Call Tree panel will tell you to what objects the selected object
held references, what objects were referred to by those objects, etc.
The Allocation profiler traces references to managed objects only. If you select an unmanaged object
in the Report panel, the Call Tree panel will display only the selected object, without any links to other
objects.
Knowing the structure of routine calls in your application
Use the Performance profiler. Select the Routines category in the Explorer panel. Then select the desired
routine in the Report panel and switch to the Call Tree panel:
•
the Parents pane of the Call Tree panel will tell you what routines called the selected routine, what
routines called those routines, etc.
•
the Children pane of the Call Tree panel will tell you what routines were called by the selected
routine, what routines were called by those routines, etc.
Note that using the Call Graph panel for the Performance profiler, you can simultaneously see several
parents and children of the chosen routine, while the Call Tree panel displays the entire call hierarchy
(separately for parent and child calls).
One more way to know the structure of function calls is to run the Function Trace profiler. This profiler
traces the sequence of function calls in your application and reports the call routes. So, run the profiler, get
results, select the Routines category in the Explorer panel and explore all routes in the Details panel. The
profiler also times each function call and logs function call parameters. This lets you learn not only the
sequence of function calls, but the time taken by each call and parameters used for the call. To view all of this
information, select the Call Trace category in the Explorer panel and then explore data in the Report and
Details panels.
© 2010 AutomatedQA Corp.
www.automatedqa.com/support
290
Profiling Applications With AQtime
To learn the structure of potential (rather than actual) routine calls in your application, use the technique
described above for the Performance profiler with the Static Analysis profiler. One more AQtime profiler,
Sequence Diagram Link, also tracks potential calls in your application and creates a UML-style diagram
showing these calls. The profiler can create diagrams in Microsoft Word or Visio, so you can select the tool
that is most convenient to you.
Knowing the total time spent on a method (excluding child methods)
Profile your application using the Performance profiler with the Elapsed Time, User Time or User+Kernel
Time counter. Select the Routines category in the Explorer panel. Then find the desired routine in the Report
panel and check the Time column. To see this as a percentage of the time spent on executing all the profiled
routines, check % Time.
To get more statistics on the methods that called the one selected in the Report panel as well as on the
methods that were called by this one, refer to the Details panel.
Knowing the total time spent executing a method (including child
methods)
Use the Performance profiler. Select the Routines category in the Explorer panel, then find the desired
function in the Report panel and check the Time with Children column. To see this as a percentage relative to
other methods, check % with Children. (The total against which the percentage is figured is in the footer of
Time with Children. It is normally much larger than the actual runtime, since child calls are counted both for
the caller and for the callee).
To get more statistics on the methods that called the one selected in the Report panel as well as on the
methods that were called by this one, refer to the Details panel.
Knowing what binary or MSIL code a method has
To view the binary (or MSIL) code of a method, double-click (click) this method in the Report, Setup,
Details, Call Graph, Call Tree or Summary panel and switch to the Disassembler panel. The panel can
display the assembler instructions of the chosen routine along with its source code lines.
Knowing what libraries your application uses
Dynamic link libraries can be linked in your application both at load time and at run time.
To find libraries linked at load time, you can use the PEReader panel:
•
Add your application to the AQtime project.
•
PEReader will determine which modules the project’s main module uses, which modules those
modules use, etc. and build a list of used modules. To view this list, open the PE Reader panel and
switch to the Modules tabbed page.
To find libraries linked in your application both at load time and at run time, profile your application with
the Load Library Tracer profiler. Generate the results. The Report panel will list libraries that were loaded in
memory during the application run. The panel will also report the number of loads and unloads for each library,
size of the library size, preferred address and other characteristics. The Details panel will provide information
on each load: the load address and the call stack.
One more way to find libraries that are linked in your application both at load time and at run time, is to
profile your application with the Performance profiler. Whenever you run this profiler, AQtime collects
information on all of the modules (managed and unmanaged) whose routines your applications calls. AQtime
www.automatedqa.com
AQtime by AutomatedQA Corporation
Common Tasks
291
profiles only those routines that are selected for profiling in the Setup panel. If the
Show non-hit routines
button is released on the Profilers toolbar (default state for this button), the Report panel displays these
profiled routines only. For other routines your application calls, AQtime does not gather information except for
data that lets you identify the routine you need, as well as the class, namespace and module it belongs to.
Therefore, there will be no information about time, hit count, etc for these routines. To display these routines in
addition to those that are already given in the Report panel, press the Show non-hit routines button.
For .NET applications there is one more variant to learn functions of what libraries the application calls:
you can make AQtime profile routines of all the managed modules that your application calls. To do this,
enable Profile Entire .NET Code in the Setup panel. When this setting is on, all profiling areas will be
ignored, though triggers will still have effect. Then use the Performance, Coverage or Allocation profiler to get
the appropriate profiling results. The Module Name column of the Report panel will display names of all the
managed modules called.
Note: Profiling with Profile Entire .NET Code enabled can seriously slow down your application
because of the mass of information AQtime needs to collect. Once you find out which modules
you need, it is recommended that you disable Profile Entire .NET Code, add these modules to
the Setup panel and specify appropriate profiling areas.
Knowing what methods are called the most or the least often
Use the Performance, Coverage or Function Trace profiler. Select the Routines category in the Explorer
panel. In the Report panel, sort results on the Hit Count column in descending order. Then check which
methods are at top (most frequently called) and bottom (least frequently called). Alternatively, you can learn
what routines are potentially (rather than actually) called the most or the least often as coded in the source. To
do this, use the Static Analysis profiler and sort the Report panel results by the Call Count column.
In addition, the Summary panel displays the top 10 routines that were actually called or can be potentially
called the most often. These routines are listed when you expand the node Routines with max Hit Count for
the Performance and Coverage profilers and the node Routines that are called most often for Static Analysis.
If you used the Performance, Coverage or Static Analysis profiler, you can trace parent-child relations
between methods and learn what methods called the one chosen in the Report panel (“parents”), and what
methods were called by this one (“children”). For this, use the data shown in the Details panel. For example,
for the Performance profiler the Children pane of the Details panel says how often the given child method was
called from the selected one (the Hit Count column).
An alernative way to trace parent-child relationships is to analyze the Function Trace profiler results. This
profiler traces the sequence of function calls and displays the call routes in results (see Function Trace Profiler
Overview).
Knowing what methods take up the most or the least execution time
Profile your application using the Performance profiler with the Elapsed Time, User Time or User+Kernel
Time counter. Get results. Select the Routines category in the Explorer panel. From the Report panel you then
have a choice of methods, depending on whether you are interested in total call time (entry to exit) or in the
time taken up by the method's own code, exclusive of child calls. For total call time, sort on the Time with
Children column. Descending will put the most expensive methods at the top, ascending will put the least
expensive at the top. For own-code time, sort on the Time column.
Both these questions regard the total time cost of a method in the application, which depends more on how
often the method is called, then on how slow it runs. You can optimize by improving the method code, or by
checking if all those calls are necessary.
© 2010 AutomatedQA Corp.
www.automatedqa.com/support
292
Profiling Applications With AQtime
If you are interested in the individual time cost of each call, use the Average Time with Children or
Average Time columns. But remember that optimizing a slow but seldom-called method will have negligible
effect on application runtime. It may affect the user-perceived reaction time, however.
In addition, the Summary panel displays the top 10 routines whose execution time was maximal during the
profiler run. These routines are listed when you expand the Worst performance (body only) or Worst
performance (with children) nodes.
Often the time spent on the first call to a routine might seriously differ from the time spent on subsequent
calls to it, due to initializations which are normally performed during the first call. That is why it might be
useful to know the time of the first call to each routine profiled. To do this, sort profiling results on the First
Time or First Time with Children column.
To avoid sorting the results of the Performance profiler, use the More than 3% (body only) or More than
3% (with children) result views. They filter the results to display only those functions that take the most time
to execute their own code or their own code along with the code of all other functions they call. You can select
any of these views from the Result Views dropdown list on the Standard toolbar or from the View | Result
Views menu (if you use AQtime integrated into Visual Studio, you can select a view from the Result Views
dialog that is called upon selecting the AQtime | Result Views item of Visual Studio’s main menu; if you use
AQtime integrated into Embarcadero RAD Studio, you can select a view from the Result Views dialog that is
called upon clicking Result Views on Embarcadero RAD Studio’s View toolbar). See Result Views.
Knowing what methods use the most time for JIT compiling
Use the Performance profiler with the Elapsed Time, User Time or User+Kernel Time counter. Before
profiling, enable the Profile .NET runtime option. Get results and then in the Report panel, locate a record for
the <JIT Compiler> fictitious routine. Switch to the Details panel and sort the records of the Parents pane on
the desired timing column, Time or Time with Children. (The Children pane for <JIT Compiler> will
display the methods that were called while the JIT compiler worked.) The top of the list in the Parents pane
holds the most time consuming methods. You might think of preJITing them to save on run time.
In addition, you can figure out the number of times a method was JITted during the run. To do this, select
the method in the Report panel, switch to Details and count how many times <JIT Compiler> is reported in the
Children pane.
Knowing what methods were executed
Use the Performance profiler. If the
Show non-hit routines button is released on the Profiler toolbar
(default), then among all of the routines included in profiling, the Report panel displays only those that were
executed during the run (Hit Count > 0). If this button is pressed, the Report panel will display all functions that
have been executed (i.e. JIT-compiled). Note that it will even show those functions that were not included in
profiling tasks. However, there will not be any information about Time or Hit Count regarding these functions.
Another way is to use the Coverage profiler: In its results all the executed methods are marked with green
dots in the Mark column, while unexecuted ones go with red dots. (If a routine was profiled at Line Level then
green dots indicate that all the method lines were executed, red dots - no line was executed and yellow dots
means that some lines were executed and some were not.) The Hit Count column says the same about
methods: 1 - executed, 0 - non-executed.
One more way to know which methods were executed is to use the Function Trace profiler. This profiler
traces the sequence of function calls and reports call routes. To view the call routes:
•
Run the profiler, get results.
•
Select the Routines category in the Explorer panel.
www.automatedqa.com
AQtime by AutomatedQA Corporation
Common Tasks
•
293
Find the desired routine in the Report panel. The Details panel will show the call routes data.
Note, the Function Trace profiler also can trace and report the actual sequence of function calls for a thread,
execution time of each function call and the call parameters. To view this information, select the Call Trace
category in the Explorer panel and examine the data shown in the Report and Details panels.
Knowing what source code lines were executed
Make sure your application was compiled with debug information. (See How AQtime Profilers Use
Metadata and Debug Information). Add the routines whose source code lines you want to profile to a line-level
area and check this area to include it in profiling tasks. Use the Performance or Coverage profiler. Get results.
Select the Routines category in the Explorer panel. For the Coverage profiler, the Lines Covered, Lines
Uncovered and %Covered columns of the Report panel display the number of executed lines, the number of
non-executed lines and the percentage of lines executed in each profiled routine. Click the desired routine in
the Report panel and switch to the Lines pane of the Details panel. The Hit Count (for Performance and
Coverage) and Mark (for Coverage) columns on this pane let you know if this or that line was executed ( green
dots, Hit Count > 1 ) or not ( red dots, Hit Count = 0 ).
It may be more convenient to explore line profiling results directly in the source code: switch to the Editor
panel and in the gutter you will see the hit count value or the same green and red dots next to each line of source
code (Note that the Hit Count column may be not visible in the Editor's grid. To display it there, right-click
within the grid, select Field Chooser from the context menu and then drag the column to the grid from the
ensuing Field Chooser window).
Knowing what source code lines are called the most or the least often
Make sure your application was compiled with debug information. (See How AQtime Profilers Use
Metadata and Debug Information). Add the routines whose source code lines you want to profile to line-level
areas and check these areas to include them in profiling. Use the Performance or Coverage profiler. Get the
appropriate results. Select the Routines category in the Explorer panel. Click the desired routine in the Report
panel and switch to the Lines pane of the Details panel. The Hit Count column on this pane tells you how
many times each source line was executed. You can sort the results on this pane by the Hit Count column in
descending order. The most frequently executed lines will be at the top of the pane, the least frequently
executed lines - at the bottom.
It may be more convenient to browse the profiling results together with source code: Move to the Editor
panel and in the Editor’s grid you will see the hit count value for each source line. (Note that the Hit Count
column may be not visible in the Editor’s grid. To display it there, right-click within the grid, select Field
Chooser from the context menu and then drag the column to the grid from the ensuing Field Chooser window).
Knowing what source code lines take up the most or the least execution
time
Make sure your application was compiled with debug information. (See How AQtime Profilers Use
Metadata and Debug Information). Add the routines whose source code lines you want to profile to a line-level
area and check this area to include it in profiling. Use the Performance profiler with the Elapsed Time, User
Time or User+Kernel Time counter. Get results. Select the Routines category in the Explorer panel. Click the
desired routine in the Report panel and switch to the Lines pane of the Details panel. If you are interested in the
total time of line execution, sort results on this pane by the Time column. If you are interested in the total time
spent on executing the line and all the routines it called, sort the results by the Time with Children column. If
you sort in descending order, the slowest lines will be at the top of the pane, the fastest - at the bottom.
© 2010 AutomatedQA Corp.
www.automatedqa.com/support
294
Profiling Applications With AQtime
It may be more convenient to browse line profiling results together with source code: Switch to the Editor
panel and in the Editor’s grid you will see the profiling results next to each source line. (Note that by default not
all columns are visible in the Editor’s grid. To display a column there, right-click within the grid, select Field
Chooser from the context menu and then drag the column to the grid from the ensuing Field Chooser window).
Searching for memory leaks
To trace the memory usage in your application, run AQtime’s Allocation profiler. This profiler monitors
the application execution and tracks the allocations and deallocations of memory blocks as well as the
creations and deletions of objects in both managed and unmanaged code. For more information about the
memory management allocations that the profiler traces, see the Allocation profiler description and Checking
Bounds of Memory Blocks.
Note that the Allocation profiler will trace the creation and deletion of those objects, which class names are
added to profiling areas of the class type in the Setup panel. Therefore, before you run the profiler, please add
the desired classes to class profiling areas (see Defining Areas to Profile). Tracing the allocations of memory
blocks does not require any preparations to be made in the Setup panel.
When you run the Allocation profiler, AQtime can generate results both during the profiler run and after
the application terminates. Results that were obtained during the run allow you see what objects currently exist
in memory. Results that were obtained after the application termination help you find memory leaks.
Profiling results are organized into two categories: Classes and Routines. You can select the desired
category in the Explorer panel.
When the Classes category is selected, the Report panel lists all classes whose instances were created
during the application run. In addition, the panel displays information about calls to memory management
routines that allocated memory blocks during the run. The class name is displayed in the Class Name column
(for memory blocks this column holds either C++ native memory, VCL native memory, or VB native
memory value depending on what functions allocated memory blocks). The Live Count column shows the
number of object instances and memory blocks that currently exist in memory. That is, the value of this column
is greater than zero, if the given class has instances that were not destroyed by the moment of results
generation. You can filter or sort results on the Live Count column to quickly find classes, which instances
were not destroyed. The Live Size column informs you about the amount of memory occupied by these class
instances and memory blocks.
To view the Live Count and Live Size information in real-time, during the profiling process, use the
Monitor panel. See Using the Monitor Panel With the Allocation Profiler.
When the Objects category of profiling results is selected, the Report panel lists memory blocks and class
instances (i.e. objects) that were allocated (created) and not destroyed during the application run. Identifiers of
objects and memory blocks are displayed in the Object Name column. They have the form class_name.nn.
For instance, the name String.5 means the fifth String object created after profiling started. For memory
blocks this column holds values like C++ native memory.4 or VCL native memory.10. These mean the 4th
memory block allocated with a C++ operator (e.g. new) or 10th memory block allocated with a VCL memory
management routine (e.g. GetMem).
To find which routine allocated a memory block or created an object instance:
•
Select the Objects category in the Explorer panel.
•
Click the desired block or object in the Report panel and then switch to the Details panel.
•
Switch to the Creation Call Stack pane of the Details panel (note that this page is empty if the
Allocation profiler’s Collect stack information option is set to None).
www.automatedqa.com
AQtime by AutomatedQA Corporation
Common Tasks
295
•
The Creation Call Stack pane displays the stack of function calls that led to the object creation
(memory block allocation). The routine that created the object (allocated the memory block)
occupies the topmost row.
•
To view the source code of a routine, double-click the routine in the call stack. AQtime will bring
up the Editor panel and position the cursor on the first line of the routine’s source code (if you
profile a .NET application, then you need to compile it with debug information in order the Editor
can show the application source code. See How AQtime Profilers Use Metadata and Debug
Information).
Searching for resource leaks and errors in resource management
functions
To trace the resource usage in your application, run AQtime’s Resource profiler. This profiler monitors
the application's execution and tracks how the entire application (rather than any part of it) allocates and
deallocates Windows resources (menus, bitmaps, pens, etc.). The profiler also lets you locate errors in
resource-related functions. The profiler supports both managed and unmanaged applications.
When you run the Resource profiler, AQtime can generate results both during the profiler run and after the
application terminates. Results that were obtained during the run allow you see what resource instances
currently exist. Results that were obtained after the application termination help you find resource leaks.
Profiling results are organized into three categories: Classes, Objects and Errors. You can select the
desired category in the Explorer panel.
When the Classes category is selected, the Report panel lists all resource types whose instances were
created during the application run. The resource type name is displayed in the Class Name column. The Live
Count column shows the number of resource instances that currently exist. That is, the value of this column is
greater than zero, if the given resource type has instances that were not deallocated by the moment of results
generation. You can filter or sort results on the Live Count column to quickly find resource types whose
instances were not deallocated. The Live Size column informs you about the amount of memory occupied by
these resource instances.
When the Objects category of profiling results is selected, the Report panel lists resource instances that
were allocated and not deallocated during the application run. Resource instance identifiers are displayed in the
Object Name column. They have the form resource_type_name.nn. For instance, the name Icon.5 means the
fifth instance of the Icon category created after the profiling started.
To find out which routine allocated a resource instance:
•
Select the Objects category in the Explorer panel.
•
Click the desired resource instance in the Report panel and then switch to the Details panel (note
that the Creation Call Stack pane of this panel is empty if the Resource profiler’s Collect stack
information option is set to None).
•
The Creation Call Stack pane displays the stack of function calls that led to the resource instance
creation. The routine that created the resource instance occupies the topmost row.
•
To view the source code of a routine, double-click the routine in the call stack. AQtime will bring
up the Editor panel and position the cursor on the first line of the routine’s source code (if you
profile a .NET application, then you need to compile it with debug information in order the Editor
can show the application source code. See How AQtime Profilers Use Metadata and Debug
Information).
When the Errors category of profiling results is selected in the Explorer panel, the Report panel lists all
errors that occurred in the resource management functions which the Resource profiler traces (See Resource
Profiler - List of Checked Functions). To learn in which routine the given error occurred, have a look at the
© 2010 AutomatedQA Corp.
www.automatedqa.com/support
296
Profiling Applications With AQtime
Routine Name column. You can view the MSDN topic about this routine. To do this, click the link in the
Reference column. A description of the error is shown in the Description column.
Tracing references between objects
The method described below is possible for managed applications only. Use the Allocation profiler to get
appropriate results. When the Classes category of profiling results is selected, the Report panel lists all classes
whose instances were created during the application run. If the given class has instances that were not
destroyed, the value of the Live Size column is greater than zero. When the Objects category of profiling
results is selected, the Report panel lists class instances (i.e. objects) that were created and not destroyed during
the application run. Object identifiers are displayed in the Object Name column. For instance, the name
String.5 means the fifth String object created after profiling started. The References To and Referenced By
columns specify the number of objects to which the selected object refers and the number of objects that refer
to the object itself.
Click an object and switch to the Details panel. Each of the References To and References From panes
holds a list of objects. The first list is for objects that are referred by the selected object. The second list is for
objects that refer to the selected object. You can also switch to the Call Graph or Call Tree panel to explore
references between objects.
www.automatedqa.com
AQtime by AutomatedQA Corporation
Profilers
297
AQtime Reference
Profilers
Performance Profiler
The Performance profiler is the next generation of AQtime’s Timing profiler. It is your primary tool for
investigating the performance of your 32-bit and 64-bit applications. It monitors the application execution and
gathers considerable information about each application function, for instance, the number of function calls,
the hierarchy of function calls, time spent executing the function, and so on. It also provides information on
pure .NET characteristics, such as time spent on JIT compilation and garbage collection.
The following topics provide detailed information about the Performance profiler:
Performance Profiler - Overview
Analyzing Performance Profiler Results
JIT Compiler and Garbage Collector Routines
Root Routine
Tracing Call References - Specifics
Calculating Percent in the Report Panel
Performance Profiler - Report Panel
Performance Profiler - Details Panel
Performance Profiler Options
Searching for Bottleneck Reasons With the Performance Profiler
Performance Profiler - Overview
The Performance profiler is the next generation of AQtime’s Timing profiler. It is your primary tool for
investigating the performance of your 32-bit and 64-bit applications. It monitors the application execution and
gathers considerable information about each application function, for instance, the number of function calls,
the hierarchy of function calls, time spent executing the function, etc. It also provides information on pure
.NET characteristics, such as time spent on JIT compilation and garbage collection (more below).
According to its name, the Performance profiler serves for analyzing the application’s performance. This
profiler monitors all function calls in your application and measures different characteristics of the application.
For instance:
•
The time spent for executing a routine,
•
The number of routine calls,
•
The hierarchy of function calls,
•
The number of CPU cache updates that occurred during the routine execution,
•
And others.
© 2010 AutomatedQA Corp.
www.automatedqa.com/support
298
AQtime Reference
What characteristic the profiler measures depends on the Active Counter profiler option (which you can
change in the Performance Profiler Settings dialog that appears once this profiler starts). The following
counters are available in the current AQtime version:
•
Elapsed Time
•
Split Load Replays
•
User Time
•
Split Store Replays
•
User+Kernel Time
•
Blocked Store Forwards Replays
•
CPU Mispredicted Branches
•
Soft Memory Page Faults
•
CPU Cache Misses
•
Hard Memory Page Faults
•
Context Switches
•
All Memory Page Faults
•
64K Aliasing Conflicts
All counters work for managed and unmanaged code and support 32bit and 64bit applications. For a
complete description of counters, see Counters Overview.
Some counters may be unavailable. This depends on the CPU model and the software used. For
instance, some counters do not work on Pentium II or do not support the processor’s SpeedStep
technology, while others do not function under virtual machines. Also, if you run AQtime x86 on a
64-bit operating system, the only available counter is Elapsed Time. For complete information on
known counter restrictions, see Counters Overview.
Also, if you have Windows DDK installed, using some counters may cause the operating system to
stop unexpectedly and display the error description on a blue screen. For more information on this
problem and on how to solve it, see Counters Overview.
Why do you need several counters? Because they help you not only find poorly performing functions, but
determine why these functions are performing poorly during the profiler run. Suppose, you analyzed your
application with the Elapsed Time counter and found that the FuncA routine runs too slow. This bottleneck can
occur for several reasons:
•
FuncA was called too many times;
•
FuncA worked fast itself, but it called a slow child routine;
•
FuncA called a routine from a system library or a .NET assembly that, in turn, took to much time
to execute;
•
If FuncA works with data in memory, the algorithm of its functioning might not be optimal so the
CPU had to update its cache too many times during the function execution or too many hard page
faults occurred.
•
etc.
To determine the exact cause of poor application performance, you can profile FuncA and other slow
routines with another counter and try to eliminate the bottleneck cause, if possible. For more information, see
Searching for Bottleneck Reasons With the Performance Profiler.
Note: If you use a computer that has several processors or a multiple-core processor (for example,
dual-core CPU) and has Windows XP Service Pack 2, then you must install the Windows
update #896256 in order for the profiler to be able to time your application correctly. The update
is available on Microsoft’s web site:
http://support.microsoft.com/kb/896256
www.automatedqa.com
AQtime by AutomatedQA Corporation
Profilers
299
No matter what counter you use, the Performance profiler lets you get static and runtime information
concerning Just-In-Time (JIT) compilation of all methods in your .NET application. This includes, for
example, the time spent for «JITting» (JIT compilation) or the number of CPU cache updates that occurred
during JITting. The profiler works by logging special notification events generated by the JITting and of each
method. One use of the profiler is to find the compiling-time (JITting-time) cost for your methods. You can
then work to simplify those that waste the most time.
The profiler also collects such .NET-specific information as the garbage-collection time for each profiled
routine. The garbage collector pauses the .NET application and the time spent for the garbage collection is
included in the function execution time. The Performance profiler lets you determine the portion of garbage
collection time in the total function execution time. For more information about the JIT compilation and
garbage collection times, see <JIT compiler> and <Garbage collector> Routines.
The Performance profiler analyzes the application code at two levels of detail: routine and line. To profile
the lines of a routine, you should simply add this routine to a line-level area (see About Profiling Levels). Note
that to profile routines at line level, you have to compile the application with debug information. See How
AQtime Profilers Use Metadata and Debug Information.
The profiler also supports triggers and actions. They allow you to turn the profiling on or off exactly when
it is needed during the application run. For more information, see Using Triggers and Using Actions.
The results of the Performance profiler runs are displayed in the Report, Details, Call Graph, Call Tree
and Editor panels. For more information, we refer you to Analyzing Performance Profiler Results.
Analyzing Performance Profiler Results
The Performance profiler monitors all of the method calls in your application, counting the calls, tracing
the call hierarchy (what called what), etc. thread by thread. The profiling results are organized into three
categories: Routines, Source Files and Modules. Source Files and Modules let you view summary profiling
results for each source file and module in your application. The Routines category contains results for each
single routine that was included in profiling tasks.
Within the categories the results are grouped by thread. There is also All threads group that shows
profiling results for all threads.
Here is a sample output of the Performance profiler:
© 2010 AutomatedQA Corp.
www.automatedqa.com/support
300
AQtime Reference
Sample Output of the Performance Profiler (AQtime Standalone)
www.automatedqa.com
AQtime by AutomatedQA Corporation
Profilers
301
Sample Output of the Performance Profiler (AQtime Integrated into Visual Studio)
© 2010 AutomatedQA Corp.
www.automatedqa.com/support
302
AQtime Reference
Sample Output of the Performance Profiler (AQtime Integrated into Embarcadero RAD Studio)
As you can see, the categories and threads are shown in the Explorer panel. You can also select the desired
category and thread using the Result Items toolbar item (by default, this item is hidden):
The Summary panel displays the summary results for the whole profiler run regardless of the selected
category. Use this panel to quickly find routines that are performing poorly. The contents of other panels
depend on the currently selected category:
•
If you select the Routines category, AQtime will display profiling results one routine per line in
the Report panel. Line timing results are displayed in the Lines page of the Details panel and in
the Editor’s grid. If you use AQtime integration into Microsoft Visual Studio, the line timing
results are displayed in the Code Editor’s grid. The Report panel is the «main» results display.
www.automatedqa.com
AQtime by AutomatedQA Corporation
Profilers
303
Other AQtime panels, such as Details, Call Graph or Call Tree, hold additional results for the
routine selected in the Report panel.
•
If you select the Modules or Source Files category, AQtime will display profiling results one
module (or source file) per line in the Report panel. The other panels that provide additional
information on profiling results (Details, Call Graph, etc.) are not used.
Results displayed in AQtime panels depend on the counter that was in use during the profiling run. For
instance, if you profiled your application with the Elapsed Time, User Time or User+Kernel Time counters,
AQtime panels will hold timing results. In further explanations we will mention results of the time counters
only. Results of the other counters can be interpreted similar to the timing results and you can work with them
in the same manner as you work with the timing results.
Profiling Results - Report Panel
The Report panel displays results for the category and thread that is selected in the Explorer panel or in the
Result Items box on the Standard toolbar.
As we mentioned above, the names and values of the Report panel columns depend on the counter you
used to profile your application. For more information about the available columns, see Performance Profiler Report Panel Columns. Note that by default the Report panel shows only a shred of available columns. You
can easily add more columns to the panel. For more information on this, see Adding and Removing Columns.
You can arrange the columns in the panel as you desire: move columns, change column width, etc. For more
information on this, see Arranging Columns, Lines and Panels.
The footer of the Report panel column holds summary values for data displayed in that column. For
instance, the footer of the Hit Count column displays the total number of calls of all profiled methods. If you
select two or more routines in the Report panel, the footer will show the summary values for the selected
routine only (for more information on how to select several rows in a panel, see Selecting Several Records in a
Panel).
The Profiler toolbar contains items that allow you to modify the results that are currently being displayed
as your needs dictate. For example, if you use the Elapsed Time, User Time or User+Kernel Time counter, the
Counter unit box lets you select the unit of time measurement for «time» columns. Another toolbar item,
Show non-hit routines, lets you easily include or exclude non-executed routines from the result display. For
more information on the toolbar items, see Performance Profiler - Options.
The column footer shows summary results for the values displayed in that column. You can customize the
summary type and summary format using the Format Columns Dialog. For instance, you can select one of the
five summary types (Sum, Count, Avg, Min, Max) or you can hide the summary for the column.
To find the slowest routines, select the Routines category and then sort results by the Time (Time with
Children) or % Time (% with Children) column. There are two predefined result views for the Performance
profiler: More than 3% (body only) and More than 3% (with children). They filter results to display only
those routines that take the most time to execute their own code (for example, % Time is greater than 3) or
their own code along with the code of all other routines they call (% with Children is greater than 3). To hide
the Time and Time with Children columns and to display the columns % Time and % with Children
instead, use another predefined result view of the Performance profiler: Default with '%' fields. (This view
touches not only Time columns, but also other similar columns, for example, Faults and % Faults, Branches
and % Branches, etc.)
To select these result views, do any of the following:
•
AQtime standalone:
Select views from the Result Views drop-down list on the Standard toolbar.
Select views from the Views | Result Views menu.
© 2010 AutomatedQA Corp.
www.automatedqa.com/support
304
AQtime Reference
•
AQtime integrated into Microsoft Visual Studio:
•
Select views from the Result Views dialog. To display the dialog, choose AQtime |
Views from the Visual Studio’s menu.
AQtime integrated into Embarcadero RAD Studio:
Select views from the Result Views dialog. To display the dialog, click the Result Views
button. Note that this button does not reside on any toolbar by default. However, you can
add the button to any RAD Studio’s toolbar via the Toolbar Customization dialog. In
this dialog, switch to the Commands page, select the View.AQtime category in the
Categories list, drag the Result Views command from the Commands list and drop it on
the needed toolbar.
You can also group results by any column. When you group results by a column, besides «global»
summaries shown at the footer of the panel, AQtime displays «local» summaries at the end of each group node.
For instance, grouping results by the Class column helps you find the total time spent executing all class
methods (the summary for the Time column should be enabled). For more information on how to group, sort,
filter and search profiling results, see Analyzing Profiler Results.
Make sure that you compare the columns in the Report panel. Most of the methods within the profiled
application call other ones. A fast method can call a slow one, making the caller appear slow too. If there is a
big difference between Time and Time with Children columns (or % Time and % with Children columns),
then the child methods slow down the method analyzed on that line.
The usefulness of the % with Children column is that it tells you which calls are the expensive calls. A
function may cost time due to its own code, due to the child calls it makes, or due to the time spent on the JIT
compiling or on the garbage collecting - but in any case it costs time. Often, an optimization will consist simply
of making more efficient child calls - for instance, in moving a child call out of a loop. % Time reports the cost
of the function’s own code. % Time with Children reports the actual cost of running the function, no matter if
the cost is incurred in the function's code or in the calls it makes.
The
% with children relative to real values option does not change the relationship between the
values in this column; the longest remains the longest and what is half as long remains half as long. If the
option is enabled, the figures are all simply made larger (and the column total is above 100%). With % with
children relative to real time enabled, 25% means that calls to the current function (and child calls) consumed a
quarter of the entire profiled time. With the option disabled, the 25% would be much smaller, say 7.9%, and it
would mean that calls to the current function (and child calls) consumed nearly 8% of the total time spent on
any call during profiling, child calls being counted once for themselves, and again for their caller, and again for
their caller’s caller, etc. The column total would be 100%. See Calculating Percent in the Report Panel for
more information.
Calls to child functions are timed (and deducted from the Time total) only if the child functions are part of
the profiling areas. Otherwise, they count in the execution time of the parent function («own code»). You may
misidentify bottlenecks unless you make sure that the child functions are profiled along with their parents
(callers). Triggers may help you do this without profiling everything during the run. See also Profiling Child
Routines Along With Parents.
The Performance profiler results may include the <Root>, <JIT compiler> and <Garbage collector>
pseudo-routines. These are fictitious routines, they do not exist in your application. <Root> is used as a parent
routine of the topmost level; <JIT compiler> and <Garbage collector> help you figure out the time spent on the
JIT compilation and garbage collection. See <Root> Routine and <JIT compiler> and <Garbage collector>
Routines for more information about these functions.
For more information on how to compare and merge results of several profiler runs, see Comparing and
Merging Results.
www.automatedqa.com
AQtime by AutomatedQA Corporation
Profilers
305
Profiler Results - Call Graph, Call Tree, Editor and Details Panels
The Performance profiler displays profiling results in the Call Graph, Call Tree, Details and Editor
panels when you view results of the Routines category. When you double-click on a routine in Report, AQtime
refreshes these panels so that they will display information about this routine (see AQtime Panels.)
The Call Graph displays the function calls hierarchy (parent - child), centering on the clicked method.
You can travel up and down the Call Tree in the panel by clicking the routines’ rectangles.
The critical path for the routine is displayed in bold (critical path is the «longest» path for the routine in the
hierarchy of function calls, for instance, the one that took the longest to execute).
The Call Tree panel also displays the hierarchy of function calls. It contains two tables: Parents and
Children. The Parents table holds all function calls that lead to the call to the currently selected routine. The
Children table displays the hierarchy of old child calls that were initiated from the selected routine.
© 2010 AutomatedQA Corp.
www.automatedqa.com/support
306
AQtime Reference
In some cases, the Call Graph and Call Tree panel may display fake call routes. Also, according to
its settings, the Call Graph panel may display empty results for some routines. For detailed
information on these problems, see Tracing Call References - Peculiarities.
If your application was compiled with debug info, the Editor panel will show the source code for the
routine you clicked (The source file of the routine must be specified in the Project Search Directories. See also
How AQtime Profilers Use Metadata and Debug Information). The Editor gutter displays various profiling
results (Time, Hit Count, etc.) next to each source code line. To select which columns to display in the gutter,
use the Field Chooser window. To bring it up, select Field Chooser from the context menu. See Adding and
Removing Columns. The line profiling results are available, of course, only if the routine was profiled at line
level:
The Code Editor of Visual Studio lets you collapse and expand blocks of source code. The grid,
which AQtime adds to the Code Editor to display profiling results, supports neither collapsing, nor
expanding, because Visual Studio does not send appropriate notifications to AQtime. So, to ensure
www.automatedqa.com
AQtime by AutomatedQA Corporation
Profilers
307
that the grid shows proper profiling results for source lines and routines, please expand all the
collapsed blocks of code. To do this, use the Outlining | Toggle All Outlining or Outlining | Stop
Outlining item of the Code Editor’s context menu.
The Editor of Embarcadero RAD Studio lets you collapse and expand blocks of source code. The
grid, which AQtime adds to the Editor to display profiling results, supports neither collapsing, nor
expanding, because Embarcadero RAD Studio does not send appropriate notifications to AQtime.
So, to ensure that the grid shows proper profiling results for source lines and routines, please expand
all the collapsed blocks of code. To do this, use theUnfold | All item of the Editor’s context menu.
The line profiling results are also displayed in the Lines page of the Details panel. To view them, select the
desired routine in the Report panel and then switch to Details:
The Lines page is very similar to the Report panel. To view the line in the Editor panel, simply
double-click that line in the Lines table.
Another page of the Details panel, Calls, acts as a «magnifier» for parent-child call relationships related to
one row in the Report panel. Here is an example:
© 2010 AutomatedQA Corp.
www.automatedqa.com/support
308
AQtime Reference
Some results in the Parents and Children tables belong to the routine currently selected in the Report
panel. For instance, the Time column in Parents displays the time spent by the selected routine in its parent
routine; the Time column in Children displays the time spent by a child routine in the selected routine. For
more information on results displayed in the Details panel as well as for the column description, see
Performance Profiler - Details Panel Columns.
Note on percent columns: The columns that display percent values in the Children table (% Time, % with
Children, % Branches, %Misses, % page Faults and others) depend on the Include routine body in Details
setting that is shown in the toolbar of the Report panel. When this setting is enabled, AQtime displays
information on the routine body execution in the Children table. This changes the number of rows in the table,
which, in turn, changes the percent values.
Double-clicking on a row in the Details panel will open the Editor and position the cursor on the routine
that was clicked. The double-click will also update the other panels to the routine displayed on that row.
Switching from panel to panel in this way, when trying to get the desired information out of the Performance
Display Previous and
Display Next, on
profiler results, is made much easier by the «browser» buttons,
the Report toolbar.
You can arrange the Lines, Parents and Children tables within the Details panel as you desire. For more
information on this, see description of the Details panel.
JIT compiler and Garbage Collector Routines
The total execution time of a managed (.NET) routine includes the following four times:
•
Time spent for executing the routine's own code.
•
Time spent for running the child routines.
•
Time spent by the Just-In-Time compiler (JIT compiler) for compiling the routine's code: before
executing a routine, the Common Language Runtime (CLR) may compile this routine at run time.
Compilation takes some time, this time is included in the total execution time of the routine.
AQtime traces the compilation requests and calculates JIT compilation time.
•
Time spent for the garbage collecting: the CLR pauses the .NET application, when the garbage
collector starts, and resumes the application after the garbage collection is over. The time spent for
garbage collecting is included in the total execution time of the routine.
www.automatedqa.com
AQtime by AutomatedQA Corporation
Profilers
309
To help you find out how much time was spent on the Just-In-Time compiling and garbage collecting
during the application run, the Performance profiler includes the Profile .NET runtime option. If this option is
enabled, AQtime times the JIT compilation and garbage collection routines and display them as <JIT
compiler> and <Garbage collector> in the Report and Details panels. Note that both <JIT compiler> and
<Garbage collector> are fictitious routines. They do not exist in your application. Below is a description of the
profiling results in the Report and Details panels.
One note before we proceed: information the profiler gathers for the <JIT compiler> and <Garbage
collector> routines depends on the active counter. Most likely you will use «time» counters, therefore, any
further explanations will only mention the «Time» columns. However, this does not mean you cannot use other
counters. The results other counters produce are similar to the results of the «time» counters. Replacing
«Time» with the appropriate term (for example, «Misses») in the following paragraphs will keep the
description valid:
•
Report panel. The Time column for the <JIT compiler> routine in the Report panel displays the
total time spent by the JIT compiler for compiling application routines during the run. The Time
column for the <Garbage collector> routine in the Report panel shows the total time spent by the
CLR for garbage collecting during the application run.
•
Since both <JIT compiler> and <Garbage collector> are fictitious routines, they do not
have child routines. That is why, the Time with Children result is equal to Time, and %
with Children is equal to % Time.
Details panel. The <JIT compiler> and <Garbage collector> routines are displayed in the
Children table of the Details panel. This means that they were called from the routine, which is
currently selected in the Report panel. They let you determine what portion of time was included
in the total execution time of the routine, but was not spent executing the routine's own code or for
child calls:
The Time column of the <JIT compiler> routine shows the time spent by the JIT compiler
for compiling the routine.
The Time column of the <Garbage collector> function indicates the time spent on
garbage collecting.
Like in the Report panel, the Details' Time with Children value is equal to Time and % with
Children is equal to % Time.
To see the <JIT compiler> and <Garbage collector> results for a routine, click this routine in the
Report panel and then switch to the Children pane of the Details panel. The chart on the left side of
the Children pane graphically displays what portion of time was taken by the JIT compilation and
garbage collection.
Results in the Details panel includes the <JIT compiler> and <Garbage collector> routines only if the
Just-In-Time compiler or garbage collector was called during the routine execution. If the CLR did not run
garbage collector during the routine execution, the routine's results in the Details panel will not contain the
<Garbage collector> function. The same applies to the <JIT compiler> routine. The CLR will not launch a
JIT compiler, if a child function was compiled when the JIT compiler compiles a parent function. Therefore,
the child function's results will not contain the <JIT compiler>routine. The time taken by the child function's
JIT-compilation will be included in the <JIT compiler> result of the parent function. The <JIT compiler>
function is also absent in the Details results, if the analyzed routine was pre-compiled (pre-JITted) before the
application start and the CLR did not run the JIT compiler during the routine's execution.
Since the CLR may perform JIT compilation or garbage collection while executing native-code functions,
<JIT compiler> and <Garbage collector> may appear in detailed results of native-code functions.
© 2010 AutomatedQA Corp.
www.automatedqa.com/support
310
AQtime Reference
Root Routine
If the Profile <Root> routine option is enabled, the results of the Performance profiler include the <Root>
routine. This is a hypothetic routine. It does not exist in your application. AQtime treats it as a parent routine of
the topmost level. The <Root> body includes different initialization statements and function calls. All other
routines are called from the <Root> one: the main routine, event handlers (for example, OnClick) that
respond to user actions, etc.
Each application thread has its own <Root> routine. Even the thread function is «called» from <Root> (of
course, this differs from what actually happens, because the first «parent» function in each thread is its thread
function).
To view functions that are called from <Root>, click <Root> in the Report panel and switch to Details.
The Hit Count column always displays 1 for the <Root> routine. As the <Root> body includes mostly
initialization statements, the Time column for this routine displays the time needed for application
initialization. Time with Children displays the overall time of the application run. Note that this time is less
than the one you can see in the Event View panel. This happens because Event View displays the total time of
the application run, which includes time taken by AQtime for operation profiling. The Report panel displays
the «net» application time (without AQtime time).
Tracing Call References - Specifics
The Performance profiler traces the caller-callee relationships between functions and measures how much
time the application spent executing a routine that was called from another routine. For example, if the fooA
function calls the fooB function, the profiler will trace the call relationships and will report the execution time
of the fooB function when this function was called from fooA. This functionality lets you explore the
execution time of the parent and child functions in the Details panel.
The profiler uses the same collected data to build the call hierarchies in the Call Graph and Call Tree
panels. However, to speed up the profiling and to save the amount of consumed memory, the profiler traces
only the parent-child references. It does not collect information on grandparent or grandchild calls, that is, it
does not save information on the call routes. This obstacle may cause the Call Graph and Call Tree panel to
display «strange» results. For instance, the panels may display the call sequences that do not exist, or they may
report that a function was called several times while it was called only once. Suppose that our tested
application contains the two following call routes:
www.automatedqa.com
AQtime by AutomatedQA Corporation
Profilers
311
Both Btn1_Click and Btn2_Click functions are called from the Main routine. Both routines call the
TestMethod function. The behavior of this function depends on the route. When TestMethod is called from
Btn1_Click, it calls the MyInternalFunc function. When TestMethod is called from Btn2_Click, it
does not call MyInternalFunc.
The Performance profiler traces the references between the Main, Btn1_Click, Btn2_Click,
TestMethod and MyInternalFunc functions, but it does not collect the information for the call routes. So,
when viewing results for the Main routine, in the Call Graph and Call Tree panels, you may note that the
panels display calls that were not performed:
© 2010 AutomatedQA Corp.
www.automatedqa.com/support
312
AQtime Reference
The Call Graph panel
The Call Tree panel
As you can see, the panels display the following call route that does not actually exist:
Main -> Btn2_Click -> TestMethod -> MyInternalFunc
The panels display this route because the profiler does not collect information on the routes. It only gathers
information on caller-callee relationships and uses this information to build the call hierarchies in the Call
Graph or Call Tree panels.
The misleading calls cannot be hidden from the Call Tree panel. As for Call Graph, you can change the
panel’s settings to hide misleading calls:
www.automatedqa.com
AQtime by AutomatedQA Corporation
Profilers
313
•
One possible way to hide misleading calls is to decrease the Call Graph’s Number of child levels
option to 2 or 1. In this case, the «grandchild» calls are not displayed in the panel.
•
Another way to hide misleading calls from the Call Graph panel is to open the Customize Call
Graph dialog and enable the Show cycling connections option in it (to call the dialog, right-click
somewhere in the Call Graph panel and select Customize from the context menu). However, in
this case the Call Graph will display empty results for some routines:
The function’s rectangle is empty, because the panel cannot determine which route’s results
should be displayed.
If you double-click the TestMethod function, the Call Graph will display profiling results in the
function’s rectangle. This happens because TestMethod becomes the currently selected routines
and the Call Graph displays the same values that are shown for this routine in the Report panel:
© 2010 AutomatedQA Corp.
www.automatedqa.com/support
314
AQtime Reference
The described problem exists when the Call Graph and Call Tree panels display results of the
Performance profiler. AQtime includes the Function Trace profiler that traces the call routes, so you can use
this profiler to analyze the execution routes in your application. Function Trace works slower in comparison to
the Performance profiler, however, it provides correct route-relative information while the Performance
profiler provides a general map of parent-child calls.
Calculating Percent in the Report Panel
The Performance profiler includes a
Calculate % with children relative to real values option that is
displayed on the Profiler toolbar. This option affects how the % with children values are calculated in the
Report panel.
This option was primarily designed for the timing counters (Elapsed Time, User Time and User+Kernel
Time). That is why in further explanations we will only mention the «Time» columns. However, the
description can be extended on other counters, since their results are similar to the results of the timing
counters.
In the default state the option is disabled, so % Time is the Time value as a percentage of the total of all
Time values (as shown in the footer of the Time column). Likewise % with children is the Time with
Children value as a percentage of the total of all values in that column. The total in the footer of % with
children is 100%. For instance:
www.automatedqa.com
AQtime by AutomatedQA Corporation
Profilers
315
box is pressed), % with children is the Time with Children value as
When the option is enabled (the
a percentage of the total of all values in the Time (not Time with children) column. Normally, this will yield
a total in the footer of the % with children column much greater than 100%, as child time is being added in
more than once (see the image below). The advantage of the setting is that % with children tells you what any
profiled function costs, child calls included, as a proportion of the total profiled time. That is, for timing
counters, «% with children relative to real values» is shorthand for «% relative to total time spent profiling».
When results are stored, they are stored with the current column contents. % with children will not change
when you retrieve the results, no matter what the current setting for % with children relative to real values.
You can easily see under what setting the results were generated by checking the footer for % with children. If
it is 100%, then the option was off. If it is greater, the option was on.
© 2010 AutomatedQA Corp.
www.automatedqa.com/support
316
AQtime Reference
Performance Profiler - Report Panel
When displaying results of the Performance profiler, each row in the Report panel holds the results for a
routine, source file or module in your application. Which values are displayed depends on the category selected
in the Explorer panel and on the counter that was used for profiling. Click the links below to see what
information the Report panel holds.
Routines Category
Source Files and Modules Categories
Note that by default the Performance profiler shows a few of available columns in the Report panel. You
can add more columns to the panel. For more information on this, see Adding and Removing Columns.
Report Panel - Routines Category
When the Routines category is selected in the Explorer panel, the Report panel holds results for each
single routine that was included in profiling tasks. Which values are displayed also depends on the counter that
was used for profiling. Click the links below to see the description of the desired column.
Columns that do not depend on the active counter
Columns specific to the Elapsed Time, User Time and User+Kernel Time counters
Columns specific to the CPU Cache Misses counter
Columns specific to the CPU Mispredicted Branches counter
Columns specific to the Hard Memory Page Faults, Soft Memory Page Faults and All Memory Page
Faults counters
Columns specific to the Split Load Replays, Split Store Replays and Blocked Store Forwards Replays
counters
Columns specific to the 64K Aliasing Conflicts counter
Columns specific to the Context Switches counter
For more information on Performance profiler results displayed in the Report panel, see Performance
Profiler - Report Panel.
Columns that do not depend on the active counter
Columns (in alphabetical order)
Description
Address
Routine’s address in memory. This column is used for unmanaged
(native-code) routines only.
Analysis Result
Specifies if the routine was instrumented or not. If the routine was
instrumented, this column is empty. Otherwise, the column displays a
short description why the routine was not instrumented:
Less than 5 bytes - The routine occupies less than 5 bytes in memory.
See Profiling Small Functions.
No line info - The routine was added to a line-level area, but the
debug information holds no info about routine lines. These routines
can be profiled at routine level only.
Unsafe code - AQtime was not able to instrument the routine safely.
This typically occurs when the routine’s binary code is intermixed
with data areas. See Profiling Routines That Hold Unsafe Code.
www.automatedqa.com
AQtime by AutomatedQA Corporation
Profilers
Columns (in alphabetical order)
317
Description
No ret instruction - The routine’s binary code does not contain the
ret instruction (this may happen if the routine finishes with the jmp
instruction). See Profiling Routines That Do Not Have the ret
Instruction.
Duplicated code - The routine whose code coincides with code of
another routine. To learn more about this, see Profiling Duplicated
Code.
Class Name
Name of the class where the method is defined.
Code Type
Specifies the type of the routine’s code. The following values are
possible:
•
MSIL - Managed-code routine with MSIL (Microsoft
Intermediate Language)code.
•
x64 - 64-bit code routine.
•
x86 - Native-code (unmanaged) routine.
•
Pseudo - Pseudo routine that was created by the context.
For example, <JIT Compiler>, <Garbage Collector>,
<Unknown PInvoke> or <Root>.
•
PInvoke - Native-code routine for which there is a
declaration in one of managed modules and that is called
from within the unmanaged code.
•
NGen - Managed routine that was compiled by the ngen
utility (CLR Native Image Generator) with the /prof
argument in its command line. The ngen compilation means
the routine was compiled before the application starts.
•
Script - The routine belongs to a script that was profiled
along with the host application. See Profiling Scripts Overview for details.
Exceptions
Number of times the method was entered but not successfully exited.
This is usually a count of exception exits.
Hit Count
The number of routine calls that were profiled. See also Skip Count. The
total number of times the routine was executed is determined as Hit
Count + Skip Count.
Max Recursion Depth
The maximum number of nested (recursive) calls to the function reached
during the run.
Module Name
The name of the module which contains the profiled routine.
Namespace
Namespace of the method’s class (this column is used for managed
routines only).
© 2010 AutomatedQA Corp.
www.automatedqa.com/support
318
AQtime Reference
Columns (in alphabetical order)
Description
Routine Name
Method name.
Skip Count
Number of times the routine was excluded from profiling, because the
profiling status was off (this can be, for example, the number of times
the routine was affected by an off-trigger or the number of times the
routine was executed when the Enable/Disable Profiling button was
not pressed). See also Hit Count. The total number of times the routine
was executed is determined as Hit Count + Skip Count.
Source File
Name of the source file for the method. The values for this column are
read from the application’s debug info. If debug info does not contain
information on the file name, the column is empty.
Source Line
Source file’s line number where the method’s implementation begins.
The values for this column are read from the application’s debug info.
Token
The routine’s token.
Unit Name
Name of the linkage unit that holds the routine. This column is used for
unmanaged (native-code) routines only.
Columns specific to the Elapsed Time, User Time and User+Kernel Time counters
You can specify the measurement unit for the following columns (seconds, milliseconds, microseconds or
machine cycles) using the Counter unit box on the Profiler toolbar. See also Performance Profiler Options.
Columns (in alphabetical order)
Description
Average Time
Average time spent executing the routine’s code on one call. This is
simply Time / (Hit Count + Skip Count).
Average Time with Children Average time spent on each call to the routine, child calls included. This
is simply Time with Children / (Hit Count + Skip Count).
First Time
Time spent executing the routine’s code on the first call (child calls are
excluded).
First Time With Children
Time spent executing the routine’s code on the first call (including time
of child calls that were made during the first routine’s call).
Note:
The First Time and First Time With Children columns help you
determine why a routine took too much time to execute: a routine itself
can work quickly, but it can perform initialization actions on the first
call. These actions may perform slowly and make the routine one of the
slowest routines in your application. By comparing results in the First
Time (First Time With Children) and Time (Time With Children)
columns, you can determine where the bottleneck occurred.
Max Time and
Maximum and minimum time spent executing the routine’s code on a
call. Exceptional values point out perhaps unexpected special
www.automatedqa.com
AQtime by AutomatedQA Corporation
Profilers
319
Columns (in alphabetical order)
Description
conditions.
Min Time
Max Time with Children and Maximum and minimum time spent executing the routine’s code on a
call (including child function calls). Exceptional values point out
perhaps unexpected special conditions.
Min Time with Children
Shared Time
Total time spent executing the routine’s code, as a percentage of the total
time spent on calls to the routine including calls to child routines.This is
simply (Time / Time with Children)*100.
Time
Total time spent executing the routine’s code excluding child calls. The
sum of all profiled methods appears in the footer of this column.
Time with Children
Total time spent on calls to the routine including calls to child routines.
The sum for all profiled routines is displayed in the footer of this
column. It will normally be an important multiple of actual profile-run
duration, as child calls are counted several times.
% Time
Total time spent executing the routine’s code, as a percentage of the time
spent executing all profiled routines.
% with Children
Time with Children value as a percentage of the sum of Time with
Children for all profiled routines.
Columns specific to the CPU Cache Misses counter
Columns (in alphabetical order)
Description
Average Misses
Average number of cache misses that occurred during execution of the
method’s code on one call. This is simply Misses / (Hit Count + Skip
Count).
Average
Children
Misses
with Average number of cache misses that occurred during the routine
execution (including cache misses that occurred in child calls). This is
simply Misses with Children / (Hit Count + Skip Count).
First Misses
The number of cache misses that occurred during execution of the
function’s code on the first call (child calls are excluded).
First Misses With Children
The number of cache misses that occurred during execution of the
function’s code on the first call (including child calls).
Max Misses and
Maximum and minimum number of cache misses that occurred during
execution of the method’s code on a call. Exceptional values point out
perhaps unexpected special conditions.
Min Misses
Max Misses with Children Maximum and minimum number of cache misses that occurred during
the routine execution (including child function calls). Exceptional
and
© 2010 AutomatedQA Corp.
www.automatedqa.com/support
320
AQtime Reference
Columns (in alphabetical order)
Min Misses with Children
Description
values point out perhaps unexpected special conditions.
Misses
Total number of cache misses that occurred during execution of the
routine’s code excluding child calls. The sum for all profiled routines
appears in the footer of this column.
Misses with Children
Total number of cache misses that occurred during execution of the
routine (including its calls to child methods). The sum for all profiled
routines is displayed in the footer of this column.
Shared Misses
Total number of cache misses that occurred during the routine execution
(excluding child calls), as a percentage of the total number of cache
misses that occurred during the routine execution (including child calls).
That is, this is simply (Misses / Misses with Children)*100.
% Misses
Total number of cache misses that occurred during the routine execution
(excluding child calls), as a percentage of the sum of cache misses that
occurred during execution of all profiled routines.
% with Children
Total number of cache misses as a percentage of the sum of Misses with
Children for all profiled routines.
Columns specific to the CPU Mispredicted Branches counter
Columns (in alphabetical order)
Description
Average Branches
Average number of branches that mispredicted during execution of the
method’s code on one call. This is simply Branches / (Hit Count + Skip
Count).
Average
Children
with Average number of branches that were mispredicted during the routine
execution (including branches mispredicted in child calls). This is
simply Branches with Children / (Hit Count + Skip Count).
Branches
Branches
Total number of branches that were mispredicted during execution of the
routine’s code excluding child calls. The sum for all profiled routines
appears in the footer of this column.
Branches with Children
Total number of branches that were mispredicted during execution of the
routine (including mispredictions in child methods). The sum for all
profiled routines is displayed in the footer of this column.
First Branches
The number of mispredictions that occurred during execution of the
function’s code on the first call (child calls are excluded).
First
Branches
Children
www.automatedqa.com
With The number of mispredictions that occurred during execution of the
function’s code on the first call (including child calls).
AQtime by AutomatedQA Corporation
Profilers
321
Columns (in alphabetical order)
Description
Max Branches and
Maximum and minimum number of mispredictions that occurred during
execution of the method’s code on a call. Exceptional values point out
perhaps unexpected special conditions.
Min Branches
Max Branches with Children Maximum and minimum number of mispredictions that occurred during
the routine execution (including mispredictions in child functions).
and
Exceptional values point out perhaps unexpected special conditions.
Min Branches with Children
Shared Branches
Total number of mispredicted branches that occurred during the routine
execution (excluding child calls), as a percentage of the total number of
mispredictions that occurred during the routine execution (including
child calls). That is, this is simply (Branches / Branches with
Children)*100.
% Branches
Total number of branches that were mispredicted during the routine
execution (excluding child calls), as a percentage of the sum of
mispredictions occurred during execution of all profiled routines.
% with Children
Total number of mispredicted branches as a percentage of the sum of
Branches with Children for all profiled routines.
Columns specific to the Hard Memory Page Faults, Soft Memory Page Faults and All Memory Page
Faults counters
Columns (in alphabetical order)
Description
Average Faults
Average number of page faults that occurred during execution of the
method’s code on one call. This is simply Faults / (Hit Count + Skip
Count).
Average
Children
Faults
with Average number of page faults that occurred during the routine
execution (including page faults that occurred in child calls). This is
simply Faults with Children / (Hit Count + Skip Count).
Faults
Total number of page faults that occurred during execution of the
routine’s code (child calls are excluded). The sum for all profiled
routines appears in the footer of this column.
Faults with Children
Total number of page faults that occurred during execution of the routine
(including page faults that occurred in child methods). The sum for all
profiled routines is displayed in the footer of this column.
First Faults
The number of page faults that occurred during execution of the
function’s code on the first call (child calls are excluded).
First Faults With Children
The number of page faults that occurred during execution of the
function’s code on the first call (child calls are included).
© 2010 AutomatedQA Corp.
www.automatedqa.com/support
322
AQtime Reference
Columns (in alphabetical order)
Description
Max Faults and
Maximum and minimum number of page faults that occurred during
execution of the method’s code on a call. Exceptional values point out
perhaps unexpected special conditions.
Min Faults
Max Faults with Children Maximum and minimum number of page faults that occurred during the
routine execution (including page faults that occurred in child
and
functions). Exceptional values point out perhaps unexpected special
conditions.
Min Faults with Children
Shared Faults
Total number of page faults that occurred during the routine execution
(excluding child calls), as a percentage of the total number of page faults
that occurred during the routine execution (including child calls). That
is, this is simply (Faults / Faults with Children)*100.
% Faults
Total number of page faults that occurred during the routine execution
(excluding child calls), as a percentage of the sum of page faults that
occurred during execution of all profiled routines.
% with Children
Total number of page faults as a percentage of the sum of Faults with
Children for all profiled routines.
Columns specific to the Split Load Replays, Split Store Replays and Blocked Store Forwards Replays
counters
Columns (in alphabetical order)
Description
Average Replays
Average number of replays1when conditions for the correct execution of
this operation are not satisfied.
Replays may be caused by cache misses, store forwarding issues, etc.
Normally, certain number of replays always occur during the application
execution. However, a superfluous number of replays designates a
performance problem.
that occurred during execution of the method’s code on one call. This is
simply Replays / (Hit Count + Skip Count).
Average
Children
Replays
First Replays
with Average number of replays that occurred during the routine execution
(including replays that occurred in child calls). This is simply Replays
with Children / (Hit Count + Skip Count).
The number of replays that occurred during execution of the function’s
code on the first call (child calls are excluded).
First Replays With Children The number of replays that occurred during execution of the function’s
code on the first call (child calls are included).
1
A replay is an attempt of executing a micro-operation
www.automatedqa.com
AQtime by AutomatedQA Corporation
Profilers
323
Columns (in alphabetical order)
Description
Max Replays and
Maximum and minimum number of replays that occurred during
execution of the method’s code on a call. Exceptional values point out
perhaps unexpected special conditions.
Min Replays
Max Replays with Children Maximum and minimum number of replays that occurred during the
routine execution (including replays that occurred in child functions).
and
Exceptional values point out perhaps unexpected special conditions.
Min Replays with Children
Replays
Total number of replays that occurred during execution of the routine’s
code (child calls are excluded). The sum for all profiled routines appears
in the footer of this column.
Replays with Children
Total number of replays that occurred during execution of the routine
(including replays that occurred in child methods). The sum for all
profiled routines is displayed in the footer of this column.
Shared Replays
Total number of replays that occurred during the routine execution
(excluding child calls), as a percentage of the total number of replays
that occurred during the routine execution (including child calls). That
is, this is simply (Replays / Replays with Children)*100.
% Replays
Total number of replays that occurred during the routine execution
(excluding child calls), as a percentage of the sum of replays that
occurred during execution of all profiled routines.
% with Children
Total number of replays as a percentage of the sum of Replays with
Children for all profiled routines.
Columns specific to the 64K Aliasing Conflicts counter
Columns (in alphabetical order)
Description
Average Conflicts
Average number of aliasing conflicts that occurred during execution of
the method’s code on one call. This is simply Conflicts / (Hit Count +
Skip Count).
Average
Children
Conflicts
with Average number of aliasing conflicts that occurred during the routine
execution (including conflicts that occurred in child calls). This is
simply Conflicts with Children / (Hit Count + Skip Count).
Conflicts
Total number of aliasing conflicts that occurred during execution of the
routine’s code (child calls are excluded). The sum for all profiled
routines appears in the footer of this column.
Conflicts with Children
Total number of aliasing conflicts that occurred during execution of the
routine (including conflicts that occurred in child methods). The sum for
all profiled routines is displayed in the footer of this column.
© 2010 AutomatedQA Corp.
www.automatedqa.com/support
324
AQtime Reference
Columns (in alphabetical order)
Description
First Conflicts
The number of conflicts that occurred during execution of the function’s
code on the first call (child calls are excluded).
First
Conflicts
Children
With The number of aliasing conflicts that occurred during execution of the
function’s code on the first call (child calls are included).
Max Conflicts and
Maximum and minimum number of aliasing conflicts that occurred
during execution of the method’s code on a call. Exceptional values
point out perhaps unexpected special conditions.
Min Conflicts
Max Conflicts with Children Maximum and minimum number of aliasing conflicts that occurred
during the routine execution (including conflicts that occurred in child
and
functions). Exceptional values point out perhaps unexpected special
Min Conflicts with Children conditions.
Shared Conflicts
Total number of aliasing conflicts that occurred during the routine
execution (excluding child calls), as a percentage of the total number of
aliasing conflicts that occurred during the routine execution (including
child calls). That is, this is simply (Conflicts / Conflicts with
Children)*100.
% Conflicts
Total number of aliasing conflicts that occurred during the routine
execution (excluding child calls), as a percentage of the sum of conflicts
that occurred during execution of all profiled routines.
% with Children
Total number of aliasing conflicts as a percentage of the sum of
Conflicts with Children for all profiled routines.
Columns specific to the Context Switches counter
Columns (in alphabetical order)
Description
Average Switches
Average number of context switches that occurred during execution of
the method’s code on one call. This is simply Switches / (Hit Count +
Skip Count).
Average
Children
Switches
First Switches
with Average number of context switches that occurred during the routine
execution (including switches that occurred in child calls). This is
simply Switches with Children / (Hit Count + Skip Count).
The number of context switches that occurred during execution of the
function’s code on the first call (child calls are excluded).
First
Switches
Children
With The number of context switches that occurred during execution of the
function’s code on the first call (child calls are included).
Max Switches and
Maximum and minimum number of context switches that occurred
during execution of the method’s code on a call. Exceptional values
www.automatedqa.com
AQtime by AutomatedQA Corporation
Profilers
325
Columns (in alphabetical order)
Min Switches
Description
point out perhaps unexpected special conditions.
Max Switches with Children Maximum and minimum number of context switches that occurred
during the routine execution (including switches that occurred in child
functions). Exceptional values point out perhaps unexpected special
and
conditions.
Min Switches with Children
Shared Switches
Total number of context switches that occurred during the routine
execution (excluding child calls), as a percentage of the total number of
context switches that occurred during the routine execution (including
child calls). That is, this is simply (Switches / Switches with
Children)*100.
Switches
Total number of context switches that occurred during execution of the
routine’s code (child calls are excluded). The sum for all profiled
routines appears in the footer of this column.
Switches with Children
Total number of context switches that occurred during execution of the
routine (including switches that occurred in child methods). The sum for
all profiled routines is displayed in the footer of this column.
% Switches
Total number of context switches that occurred during the routine
execution (excluding child calls), as a percentage of the sum of switches
that occurred during execution of all profiled routines.
% with Children
Total number of context switches as a percentage of the sum of Switches
with Children for all profiled routines.
Report Panel - Source Files and Modules Categories
When one of the Source Files of Modules categories is selected in the Explorer panel, the Report panel
holds profiling results for each source file and module in your application. Which values are displayed also
depends on the counter that was used for profiling. Click the links below to see the description of the desired
column.
Columns that do not depend on the active counter
Columns that depend on the active counter
For more information on Performance profiler results displayed in the Report panel, see Performance
Profiler - Report Panel.
Columns that do not depend on the active counter
Columns (in alphabetical order)
Description
File Name or
Name of the source file (or module).
Module Name
© 2010 AutomatedQA Corp.
www.automatedqa.com/support
326
AQtime Reference
Columns (in alphabetical order)
Description
Exceptions
This value is a sum of all Exception values of routines that belong to the
source file (module). It indicates the total number of times the methods
belonging to the source file (or module) were entered but not
successfully exited. This is usually the number of exception exits in the
file’s (module’s) routines.
Hit Count
The number of routine calls that were profiled. See also Skip Count. This
value is a sum of the Hit Count result of all profiled routines that belong
to the given source file or module.
Skip Count
Number of times the routines were excluded from profiling, because the
profiling status was off (This can be, for example, the number of times
the routines were affected by off-triggers). This value is a sum of the
Skip Count result of all profiled routines that belong to the given source
file or module.
Columns that depend on the active counter
Counters
Columns
Description
Elapsed Time,
Time
The total execution time (excluding child calls) of routines that
are defined in the source file (or module). This is a sum of the
Time results of all profiled routines that the given source file
(or module) contains.
Time
Total time spent for execution of profiled routines that belong
to the given source file (module) as a percentage of the sum of
the Time column values for all source files (modules) that are
displayed in the Report panel.
Misses
The total number of CPU cache misses that occurred during
profiling of routines that the given source file (or module)
contains. This is a sum of the Misses result value of all routines
that the given source file (or module) contains.
% Misses
Total number of cache misses as a percentage of the sum of the
Misses column values for all source files (modules) that are
displayed in the Report panel.
Branches
The total number of code branches that were mispredicted
during profiling of routines that the given source file (or
module) contains. This is a sum of the Branches result of all
profiled routines that the given source file (or module)
contains.
Branches
Total number of mispredicted branches as a percentage of the
sum of the Branches column values for all source files
(modules) that are displayed in the Report panel.
Faults
The total number of memory page faults that occurred during
User Time,
User+Kernel Time
CPU Cache Misses
CPU Mispredicted
Branches
Hard Memory Page
www.automatedqa.com
AQtime by AutomatedQA Corporation
Profilers
Counters
327
Columns
profiling of routines that the given source file (or module)
contains. This is a sum of the Faults result value of all profiled
routines that the given source file (or module) contains.
Faults,
Soft Memory Page
Faults,
All Memory Page
Faults
Split Load Replays,
Description
% Faults
Total number of memory page faults as a percentage of the sum
of the Faults column values for all source files (modules) that
are displayed in the Report panel.
Replays
The total number of replays2when conditions for the correct
execution of this operation are not satisfied.
Split Store Replays,
Replays may be caused by cache misses, store forwarding
issues, etc.
Blocked Store
Forwards Replays
Normally, certain number of replays always occur during the
application
execution. However, a superfluous number of replays
designates a
performance problem.
that occurred during profiling of routines that the given source
file (or module) contains. This is a sum of the Replays result
value of all profiled routines that the given source file (or
module) contains.
64K Aliasing Conflicts
Context Switches
2
% Replays
Total number of replays as a percentage of the sum of the
Replays column values for all source files (modules) that are
displayed in the Report panel.
Conflicts
The total number of aliasing conflicts that occurred during
profiling of routines that the given source file (or module)
contains. This is a sum of the Conflicts result value of all
profiled routines that the given source file (or module)
contains.
% Conflicts
Total number of aliasing conflicts as a percentage of the sum of
the Conflicts column values for all source files (modules) that
are displayed in the Report panel.
Switches
The total number of context switches that occurred during
profiling of routines that the given source file (or module)
contains. This is a sum of the Switches result value of all
profiled routines that the given source file (or module)
contains.
% Switches
Total number of context switches as a percentage of the sum of
the Switches column values for all source files (modules) that
A replay is an attempt of executing a micro-operation
© 2010 AutomatedQA Corp.
www.automatedqa.com/support
328
AQtime Reference
Counters
Columns
Description
are displayed in the Report panel.
www.automatedqa.com
AQtime by AutomatedQA Corporation
Profilers
329
Performance Profiler - Details Panel
When you view the Performance profiler results for your routines, the Details panel holds three tables:
Lines, Parents and Children. The Lines table displays the line profiling results for the routine selected in the
Report panel. This table is empty if the routine was not profiled at line level.
The two other tables are visible regardless of the profiling level. The Parents table lists functions and
procedures that called the routine selected in the Report panel during the last profiler run. The Children table
holds routines that the selected routine called. Though the columns in these tables have the same names that the
Report columns have, the meaning of these values differ from the meaning of the Report panel values. Click
the links below to see what information columns of these tables hold.
Parents Table
Children Table
The Parents and Children tables may contain the <JIT compiler> and <Garbage collector> routines. For
more information on them, see <JIT compiler> and <Garbage collector> Routines.
The columns that display percent values in the Children table (% Time, % with Children, % Misses, %
Branches and others) depend on the Include routine body in Details item of the Report panel's toolbar. When
this item is pressed, AQtime displays a row with the routine body results in the Children table. This changes the
number of rows in the table, which, in turn, changes the percent columns’ values.
The Details panel displays a chart next to each of the tables. The chart graphically displays information
from the table on the left. For instance, it illustrates what child routine or line took more time to execute. To
change the value displayed in the chart, right-click it and select the desired result from the context menu. To
customize the chart properties, select Customize Charts from the context menu.
You can arrange the Lines, Parents and Children tables in the Details panel as you wish. To do this, select
Allow docking in Details from the context menu and then dock or undock the pages as you would dock or
undock other AQtime panels. See Docking.
Note that the Details panel does not display all available columns. You can easily add columns to the panel
or remove them from it as it is described in Adding and Removing Columns.
Details Panel - Parents Table
The Parents table is displayed in the Details panel, where you can see the Performance profiler results of
your routines. This table lists functions and procedures that called the routine selected in the Report panel
during the last profiler run. Though the columns in this table have the same names that the Report columns
have, the meaning of these values differ from the meaning of the Report panel values.
Columns of the Parents table are divided into dependent and independent on the active counter. Click the
links below to find the description of the desired column.
Note: Some columns of the Parents table display results of the routine selected in the Report panel. In
our explanation we will call this routine the Report panel routine.
Columns that do not depend on the active counter
Columns specific to the Elapsed Time, User Time and User+Kernel Time counters
Columns specific to the CPU Cache Misses counter
Columns specific to the CPU Mispredicted Branches counter
Columns specific to the Hard Memory Page Faults, Soft Memory Page Faults and All Memory Page
Faults counters
Columns specific to the Split Load Replays, Split Store Replays and Blocked Store Forwards Replays
© 2010 AutomatedQA Corp.
www.automatedqa.com/support
330
AQtime Reference
counters
Columns specific to the 64K Aliasing Conflicts counter
Columns specific to the Context Switches counter
For more information on Performance profiler results, see Performance Profiler - Details Panel.
Columns that do not depend on the active counter
Columns (in alphabetical order)
Description
Address
Routine’s address in memory. This column is only used for unmanaged
(native-code) routines.
Analysis Result
Specifies if the routine was instrumented or not. If the routine was
instrumented, this column is empty. Otherwise, the column specifies
why the routine was not profiled. These are the same values as the values
displayed in the Analysis Result column of the Report panel. For more
information, see Performance Profiler - Report Panel Columns.
Class Name
Name of the class where the parent routine is defined.
Code Type
Specifies the type of the routine’s code. The following values are
possible:
•
MSIL - Managed-code routine with MSIL (Microsoft
Intermediate Language) code.
•
x64 - 64-bit code routine.
•
x86 - Native-code (unmanaged) routine.
•
Pseudo - Pseudo routine that was created by the context.
For example, <JIT Compiler>, <Garbage Collector>,
<Unknown PInvoke> or <Root>.
•
PInvoke - Native-code routine for which there is a
declaration in one of managed modules and that is called
from within the unmanaged code.
•
NGen - Managed routine that was compiled by the ngen
utility (CLR Native Image Generator) with the /prof
argument in its command line. The ngen compilation means
the routine was compiled before the application starts.
•
Script - The routine belongs to a script that was profiled
along with the host application. See Profiling Scripts Overview for details.
•
Byte-code - Java routine that was compiled into an
intermediate byte-code format. See Profiling Java
Applications for details.
Exceptions
Number of times the parent routine was entered but not successfully
exited when calling the Report panel routine. This is usually a count of
exceptions that occurred when calling the Report panel routine.
Hit Count
Number of times the parent routine called the Report panel routine.
www.automatedqa.com
AQtime by AutomatedQA Corporation
Profilers
331
Columns (in alphabetical order)
Description
Module Name
The name of the module which contains the parent routine.
Namespace
Namespace of the method’s class (this column is used for managed
routines only).
Routine Name
Name of the parent routine.
Source File
Name of the source file for the parent routine. The values for this column
are read from the application’s debug info. If debug info does not
contain information on the file name, the column is empty.
Source Line
Source files line number where the parent routine’s implementation
begins. The values for this column are read from the application’s debug
info.
Token
The routine’s token.
Unit Name
Name of the linkage unit that holds the routine. This column is used for
unmanaged (native-code) routines only.
Columns specific to the Elapsed Time, User Time and User+Kernel Time counters
For each of the following columns you can specify the measurement unit for the displayed values (seconds,
milliseconds, microseconds or machine cycles) using the Counter unit box on the Profiler toolbar. See also
Performance Profiler Options.
Columns (in alphabetical order)
Description
Average Time
Average time spent executing the code of the Report panel routine per
call. To calculate this value AQtime only uses those calls to the Report
panel routine that where made from within the given parent routine.
Average
Children
Time
with Average time spent executing the Report panel routine per call
(including calls to its child routines). To calculate this value AQtime
only uses those calls to the Report panel routine that were made from
within the given parent routine.
Max Time
and
Min Time
Max Time with Children
and
Min Time with Children
Shared Time
© 2010 AutomatedQA Corp.
Maximum and minimum time (excluding child function calls) spent
executing the Report panel routine when it was called from the parent
routine. Exceptional values point out perhaps unexpected special
conditions.
Maximum and minimum time (including child function calls) spent
executing the Report panel routine when it was called from the parent
routine. Exceptional values point out perhaps unexpected special
conditions.
Total time spent executing the code of the Report panel routine, as a
percentage of the total time spent on calls to the Report panel routine
including calls to child routines. In other words, Shared Time is the ratio
of the routine’s Time to Time with Children values displayed in the
www.automatedqa.com/support
332
AQtime Reference
Columns (in alphabetical order)
Description
Parents grid: (Time / Time with Children)*100.
Time
Total time spent executing the Report panel routine’s code (excluding
child calls) when it was called from the parent routine. Sort results by
this column to find the parent routine that uses the Report panel routine
more than other parent routines.
Time with Children
Total time spent executing the Report panel routine when it was called
from the parent routine. This value includes the time spent executing
child routines.
% Time
This is the Time value as a percentage of the sum of the Time values
displayed in the Parents grid.
% with Children
This is the Time with Children value as a percentage of the sum of the
Time with Children values displayed in the Parents grid.
Columns specific to the CPU Cache Misses counter
Columns (in alphabetical order)
Description
Average Misses
Average number of CPU cache misses that occurred during execution of
the code of the Report panel routine per call. To calculate this value
AQtime only uses those calls to the Report panel routine that were made
from within the given parent routine.
Average
Children
Misses
with Average number of CPU cache misses that occurred during execution of
the Report panel routine per call (including cache misses in its child
routines). To calculate this value AQtime only uses those calls to the
Report panel routine that were made from within the given parent
routine.
Max Misses
and
Min Misses
Max Misses with Children
and
Min Misses with Children
Maximum and minimum number of cache misses that occur during
execution of the Report panel routine (child calls are excluded) when it
was called from the parent routine. Exceptional values point out perhaps
unexpected special conditions.
Maximum and minimum number of cache misses that occur during
execution of the Report panel routine (including child calls) when it was
called from the parent routine. Exceptional values point out perhaps
unexpected special conditions.
Misses
Total number of cache misses that occur during execution of the Report
panel routine’s code (excluding child calls) when it was called from the
parent routine.
Misses with Children
Total number of cache misses that occur during execution of the Report
panel routine (including its child routines) when it was called from the
parent routine.
www.automatedqa.com
AQtime by AutomatedQA Corporation
Profilers
333
Columns (in alphabetical order)
Description
Shared Misses
Total number of CPU cache misses that occurred during execution of the
code of the Report panel routine’s code, as a percentage of the total
number cache misses that occurred on calls to the Report panel routine
(including calls to its child routines). To calculate this value AQtime
only uses those calls to the Report panel routine that were made from
within the given parent routine. In other words, Shared Misses is the
ratio of the Misses to Misses with Children values displayed in the
Parents grid.
% Misses
This is the Misses value as a percentage of the sum of the Misses values
displayed in the Parents grid.
% with Children
This is the Misses with Children value as a percentage of the sum of the
Misses with Children values displayed in the Parents grid.
Columns specific to the CPU Mispredicted Branches counter
Columns (in alphabetical order)
Description
Average Branches
Average number of branches that were mispredicted during execution of
the own code of the Report panel routine per call. To calculate this value
AQtime uses only those calls to the Report panel routine that were made
from within the given parent routine.
Average Branches
Children
with Average number of branches that were mispredicted during execution of
the Report panel routine per call (including mispredictions in its child
routines). To calculate this value AQtime uses only those calls to the
Report panel routine that were made from within the given parent
routine.
Branches
Total number of mispredictions that occurred during execution of the
Report panel routine?s code (excluding child calls) when it was called
from the parent routine.
Branches with Children
Total number of mispredictions that occurred during execution of the
Report panel routine (including its child routines) when it was called
from the parent routine.
Max Branches
Maximum and minimum number of mispredictions that occurred during
execution of the Report panel routine (child calls are excluded) when it
was called from the parent routine. Exceptional values point out perhaps
unexpected special conditions.
and
Min Branches
Max
Branches
Children
and
Min
Branches
Children
© 2010 AutomatedQA Corp.
with Maximum and minimum number of mispredictions that occurred during
execution of the Report panel routine (including child calls) when it was
called from the parent routine. Exceptional values point out perhaps
unexpected special conditions.
with
www.automatedqa.com/support
334
AQtime Reference
Columns (in alphabetical order)
Description
Shared Branches
Total number of mispredictions that occurred during execution of the
Report panel routine’s own code, as a percentage of mispredictions that
occurred during calls to the Report panel routine including calls to its
child routines. To calculate this value AQtime uses only those calls to
the Report panel routine that were made from within the given parent
routine. In other words, this is the ratio of the routine’s Branches to
Branches with Children values displayed in the Parents grid.
% Branches
This is the Branches value as a percentage of the sum of the Branches
values displayed in the Parents grid.
% with Children
This is the Branches with Children value as a percentage of the sum of
the Branches with Children values displayed in the Parents grid.
Columns specific to the Hard Memory Page Faults, Soft Memory Page Faults and All Memory Page
Faults counters
Columns (in alphabetical order)
Description
Average Faults
Average number of memory page faults that occurred during execution
of the own code of the Report panel routine per call. To calculate this
value AQtime only uses those calls to the Report panel routine that were
made from within the given parent routine.
Average
Children
Faults
with Average number of memory page faults that occurred during execution
of the Report panel routine per call (including calls to its child routines).
To calculate this value AQtime only uses those calls to the Report panel
routine that were made from within the given parent routine.
Faults
Total number of page faults that occurred during execution of the Report
panel routine’s code (excluding child calls) when it was called from the
parent routine.
Faults with Children
Total number of page faults that occurred during execution of the Report
panel routine (including its child routines) when it was called from the
parent routine.
Max Faults
Maximum and minimum number of page faults that occurred during
execution of the Report panel routine (child calls are excluded) when it
was called from the parent routine. Exceptional values point out perhaps
unexpected special conditions.
and
Min Faults
Max Faults with Children
and
Min Faults with Children
Shared Faults
www.automatedqa.com
Maximum and minimum number of page faults that occurred during
execution of the Report panel routine (including child calls) when it was
called from the parent routine. Exceptional values point out perhaps
unexpected special conditions.
Total number of memory page faults that occurred during execution of
the Report panel routine’s code, as a percentage of the total number of
page faults that occurred on execution of the Report panel routine
AQtime by AutomatedQA Corporation
Profilers
335
Columns (in alphabetical order)
Description
including calls to its child routines. To calculate this value AQtime only
uses those calls to the Report panel routine that were made from within
the given parent routine. In other words, this is the ratio of the routine’s
Faults to Faults with Children values displayed in the Parents grid.
% Faults
This is the Faults value as a percentage of the sum of the Faults values
displayed in the Parents grid.
% with Children
This is the Faults with Children value as a percentage of the sum of the
Faults with Children values displayed in the Parents grid.
Columns specific to the Split Load Replays, Split Store Replays and Blocked StoreForwards Replays
counters
Columns (in alphabetical order)
Description
Average Replays
Average number of replays3when conditions for the correct execution of
this operation are not satisfied.
Replays may be caused by cache misses, store forwarding issues, etc.
Normally, certain number of replays always occur during the application
execution. However, a superfluous number of replays designates a
performance problem.
that occurred during execution of the code of the Report panel routine
per call. To calculate this value AQtime only uses those calls to the
Report panel routine that were made from within the given parent
routine.
Average
Children
Replays
Max Replays
and
Min Replays
with Average number of replays that occurred during execution of the Report
panel routine per call (including calls to its child routines). To calculate
this value AQtime only uses those calls to the Report panel routine that
were made from within the given parent routine.
Maximum and minimum number of replays that occurred during
execution of the Report panel routine (child calls are excluded) when it
was called from the parent routine. Exceptional values point out perhaps
unexpected special conditions.
Max Replays with Children Maximum and minimum number of replays that occurred during
execution of the Report panel routine (including child calls) when it was
and
called from the parent routine. Exceptional values point out perhaps
Min Replays with Children unexpected special conditions.
Replays
3
Total number of replays that occurred during execution of the Report
panel routine’s code (excluding child calls) when it was called from the
parent routine.
A replay is an attempt of executing a micro-operation
© 2010 AutomatedQA Corp.
www.automatedqa.com/support
336
AQtime Reference
Columns (in alphabetical order)
Description
Replays with Children
Total number of replays that occurred during execution of the Report
panel routine (including its child routines) when it was called from the
parent routine.
Shared Replays
Total number of replays that occurred during execution of the Report
panel routine’s code, as a percentage of the total number of replays that
occurred on execution of the Report panel routine including calls to its
child routines. To calculate this value AQtime only uses those calls to
the Report panel routine that were made from within the given parent
routine. In other words, this is the ratio of the routine’s Replays to
Replays with Children values displayed in the Parents grid.
% Replays
This is the Replays value as a percentage of the sum of the Replays
values displayed in the Parents grid.
% with Children
This is the Replays with Children value as a percentage of the sum of
the Replays with Children values displayed in the Parents grid.
Columns specific to the 64K Aliasing Conflicts counter
Columns (in alphabetical order)
Description
Average Conflicts
Average number of aliasing conflicts that occurred during execution of
the code of the Report panel routine per call. To calculate this value
AQtime only uses those calls to the Report panel routine that were made
from within the given parent routine.
Average
Children
Conflicts
with Average number of aliasing conflicts that occurred during execution of
the Report panel routine per call (including calls to its child routines). To
calculate this value AQtime only uses those calls to the Report panel
routine that were made from within the given parent routine.
Conflicts
Total number of aliasing conflicts that occurred during execution of the
Report panel routine’s code (excluding child calls) when it was called
from the parent routine.
Conflicts with Children
Total number of aliasing conflicts that occurred during execution of the
Report panel routine (including its child routines) when it was called
from the parent routine.
Max Conflicts
Maximum and minimum number of aliasing conflicts that occurred
during execution of the Report panel routine (child calls are excluded)
when it was called from the parent routine. Exceptional values point out
perhaps unexpected special conditions.
and
Min Conflicts
Max
Conflicts
Children
and
Min
Conflicts
www.automatedqa.com
with Maximum and minimum number of aliasing conflicts that occurred
during execution of the Report panel routine (including child calls) when
it was called from the parent routine. Exceptional values point out
perhaps unexpected special conditions.
with
AQtime by AutomatedQA Corporation
Profilers
337
Columns (in alphabetical order)
Description
Children
Shared Conflicts
Total number of memory aliasing conflicts that occurred during
execution of the Report panel routine’s code, as a percentage of the total
number of conflicts that occurred on execution of the Report panel
routine including calls to its child routines. To calculate this value
AQtime only uses those calls to the Report panel routine that were made
from within the given parent routine. In other words, this is the ratio of
the routine’s Conflicts to Conflicts with Children values displayed in
the Parents grid.
% Conflicts
This is the Conflicts value as a percentage of the sum of the Conflicts
values displayed in the Parents grid.
% with Children
This is the Conflicts with Children value as a percentage of the sum of
the Conflicts with Children values displayed in the Parents grid.
Columns specific to the Context Switches counter
Columns (in alphabetical order)
Description
Average Switches
Average number of context switches that occurred during execution of
the code of the Report panel routine per call. To calculate this value
AQtime only uses those calls to the Report panel routine that were made
from within the given parent routine.
Average
Children
Switches
Max Switches
and
Min Switches
with Average number of context switches that occurred during execution of
the Report panel routine per call (including calls to its child routines). To
calculate this value AQtime only uses those calls to the Report panel
routine that were made from within the given parent routine.
Maximum and minimum number of context switches that occurred
during execution of the Report panel routine (child calls are excluded)
when it was called from the parent routine. Exceptional values point out
perhaps unexpected special conditions.
with Maximum and minimum number of context switches that occurred
during execution of the Report panel routine (including child calls) when
it was called from the parent routine. Exceptional values point out
and
perhaps unexpected special conditions.
Min Switches with Children
Max
Switches
Children
Shared Switches
© 2010 AutomatedQA Corp.
Total number of context switches faults that occurred during execution
of the Report panel routine’s code, as a percentage of the total number of
switches that occurred on execution of the Report panel routine
including calls to its child routines. To calculate this value AQtime only
uses those calls to the Report panel routine that were made from within
the given parent routine. In other words, this is the ratio of the routine’s
Switches to Switches with Children values displayed in the Parents
grid.
www.automatedqa.com/support
338
AQtime Reference
Columns (in alphabetical order)
Description
Switches
Total number of context switches that occurred during execution of the
Report panel routine’s code (excluding child calls) when it was called
from the parent routine.
Switches with Children
Total number of context switches that occurred during execution of the
Report panel routine (including its child routines) when it was called
from the parent routine.
% Switches
This is the Switches value as a percentage of the sum of the Switches
values displayed in the Parents grid.
% with Children
This is the Switches with Children value as a percentage of the sum of
the Switches with Children values displayed in the Parents grid.
Details Panel - Children Table
The Children table is displayed in the Details panel, where you can see the Performance profiler results of
your routines. This table lists routines called by the routine selected in the Report panel. Though the columns in
this table have the same names that the Report columns have, the meaning of these values differ from the
meaning of the Report panel values.
Columns of the Children table are divided into dependent and independent on the active counter. Click the
links below to find the description of the desired column.
Note: Some columns in the Children table display results of the routine selected in the Report panel. In
our explanation we will call this routine the Report panel routine.
Columns that do not depend on the active counter
Columns specific to the Elapsed Time, User Time and User+Kernel Time counters
Columns specific to the CPU Cache Misses counter
Columns specific to the CPU Mispredicted Branches counter
Columns specific to the Hard Memory Page Faults, Soft Memory Page Faults and All Memory Page
Faults counters
Columns specific to the Split Load Replays, Split Store Replays and Blocked Store Forwards Replays
counters
Columns specific to the 64K Aliasing Conflicts counter
Columns specific to the Context Switches counter
For more information on Performance profiler results, see Performance Profiler - Details Panel.
Note on percent columns: The columns that display percent values in the Children table (% Time, %
with Children, % Branches, %Misses, % page Faults and others) depend on the Include routine body
in Details setting that is shown in the toolbar of the Report panel. When this setting is enabled,
AQtime displays information on the routine body execution in the Children table (the number of rows
in the table changes, which, in turn, changes the percent values).
Columns that do not depend on the active counter
Columns (in alphabetical order)
www.automatedqa.com
Description
AQtime by AutomatedQA Corporation
Profilers
339
Columns (in alphabetical order)
Description
Address
Routine’s address in memory. This column is used for unmanaged
(native-code) routines only.
Analysis Result
Specifies if the routine was instrumented or not. If the routine was
instrumented, this column displays OK. Otherwise, the column specifies
why the routine was not profiled. These are the same values that are
displayed in the Analysis Result column of the Report panel. For more
information, see Performance Profiler - Report Panel Columns.
Class Name
Name of the class where the child routine is defined.
Code Type
Specifies the type of the routine’s code. The following values are
possible:
•
MSIL - Managed-code routine with MSIL (Microsoft
Intermediate Language) code.
•
x64 - 64-bit code routine.
•
x86 - Native-code (unmanaged) routine.
•
Pseudo - Pseudo routine that was created by the context.
For example, <JIT Compiler>, <Garbage Collector>,
<Unknown PInvoke> or <Root>.
•
PInvoke - Native-code routine for which there is a
declaration in one of managed modules and that is called
from within the unmanaged code.
•
NGen - Managed routine that was compiled by the ngen
utility (CLR Native Image Generator) with the /prof
argument in its command line. The ngen compilation means
the routine was compiled before the application starts.
•
Script - The routine belongs to a script that was profiled
along with the host application. See Profiling Scripts Overview for details.
•
Byte-code - Java routine that was compiled into an
intermediate byte-code format. See Profiling Java
Applications for details.
Exceptions
Number of times the child routine was entered but not successfully
exited when it was called from the Report panel routine.
Hit Count
Number of times the child routine was called from the Report panel
routine.
Module Name
The name of the module which contains the child routine.
Namespace
Namespace of the method’s class (this column is used for managed
routines only).
Routine Name
Name of the child routine.
© 2010 AutomatedQA Corp.
www.automatedqa.com/support
340
AQtime Reference
Columns (in alphabetical order)
Description
Source File
Name of the source file for the child routine. The values for this column
are read from the application’s debug info. If debug info does not
contain information on the file name, the column is empty.
Source Line
Source files line number where the child routine’s implementation
begins. The values for this column are read from the application’s debug
info.
Token
The routine’s token.
Unit Name
Name of the linkage unit that holds the routine. This column is used for
unmanaged (native-code) routines only.
Columns specific to the Elapsed Time, User Time and User+Kernel Time counters
For each of the following columns you can specify the measurement unit for the displayed values (seconds,
milliseconds, microseconds or machine cycles) using the Counter unit box on the Profiler toolbar. See also
Performance Profiler Options.
Columns (in alphabetical order)
Description
Average Time
Average time spent executing the child routine’s code on one call when
the child routine was called from the Report panel routine.
Average
Children
Time
With Average time spent executing the child routine per on one call when the
child routine was called from the Report panel routine.
Max Time
and
Min Time
Max Time with Children
and
Min Time with Children
Maximum and minimum time (excluding child function calls) spent
executing the child routine when it was called from the Report panel
routine. Exceptional values point out perhaps unexpected special
conditions.
Maximum and minimum time (including child function calls) spent
executing the child routine when it was called from the Report panel
routine. Exceptional values point out perhaps unexpected special
conditions.
Shared Time
Total time spent executing the code of the child routine, as a percentage
of the total time spent on calls to the child routine including calls to child
routines. In other words, Shared Time is the ratio of the routine’s Time
to Time with Children values displayed in the Children grid: (Time /
Time with Children)*100.
Time
Total time spent executing the child routine’s code when it was called
from the Report panel routine. This time does not include the execution
time of the child functions of this child routine. Sort results by this
column to find the slowest child routine among other children of the
Report panel routine.
Time with Children
Total time spent executing the child function that was called from the
Report panel routine. This value includes the time spent for executing
www.automatedqa.com
AQtime by AutomatedQA Corporation
Profilers
341
Columns (in alphabetical order)
Description
child functions of this child routine.
% Time
This is the Time value as a percentage of the sum of the Time values
displayed in the Children grid.
% with Children
This is the Time with Children value as a percentage of the sum of the
Time with Children values displayed in the Children grid.
Note: The % Time and % with Children values depend on the Include routine body in Details setting
that is shown in the toolbar of the Report panel. When this setting is enabled, AQtime displays
information on the routine body execution in the Children table. The table contains one more row,
and this changes the percent values.
Columns specific to the CPU Cache Misses counter
Columns (in alphabetical order)
Description
Average Misses
Average number of CPU cache misses that occurred during execution of
the child routine’s code per call. To calculate this value, AQtime only
uses those calls to the child routine that were made from within the
Report panel routine.
Average
Children
Misses
With Average number of CPU cache misses that occurred during execution of
the child routine per call (including cache misses in its child routines).
To calculate this value, AQtime only uses those calls to the child routine
that were made from within the Report panel routine.
Max Misses
and
Min Misses
Max Misses with Children
and
Min Misses with Children
Maximum and minimum number of cache misses that occurred during
execution of the child routine (excluding its child functions) when it was
called from the Report panel routine. Exceptional values point out
perhaps unexpected special conditions.
Maximum and minimum number of cache misses that occurred during
execution of the child routine (including its child functions) when it was
called from the Report panel routine. Exceptional values point out
perhaps unexpected special conditions.
Misses
Total number of cache misses that occur during execution of the child
routine (excluding its child functions) when it was called from the
Report panel routine.
Misses with Children
Total number of cache misses that occur during execution of the child
routine (including its child routines) when it was called from the Report
panel routine.
Shared Misses
Total number of cache misses that occurred during execution of the code
of the child routine, as a percentage of the total number of cache misses
that occurred during calls to the child routine including calls to its child
routines. To calculate this value AQtime only uses those calls to the
© 2010 AutomatedQA Corp.
www.automatedqa.com/support
342
AQtime Reference
Columns (in alphabetical order)
Description
child routine that were made from the Report panel routine. In other
words, Shared Misses is the ratio of the child routine’s Misses to Misses
with Children.
% Misses
This is the Misses value as a percentage of the sum of the Misses values
displayed in the Children grid.
% with Children
This is the Misses with Children value as a percentage of the sum of the
Misses with Children values displayed in the Children grid.
Columns specific to the CPU Mispredicted Branches counter
Columns (in alphabetical order)
Description
Average Branches
Average number of branches that were mispredicted during execution of
the child routine’s code per call. To calculate this value, AQtime only
uses those calls to the child routine that were made from within the
Report panel routine.
Average
Children
Branches
with Average number of branches that were mispredicted during execution of
the child routine per call (including mispredictions in its child routines).
To calculate this value, AQtime only uses those calls to the child routine
that were made from within the Report panel routine.
Branches
Total number of mispredictions that occurred during execution of the
child routine (excluding its child functions) when it was called from the
Report panel routine.
Branches with Children
Total number of mispredictions that occurred during execution of the
child routine (including its child routines) when it was called from the
Report panel routine.
Max Branches
Maximum and minimum number of mispredictions that occurred during
execution of the child routine (excluding its child functions) when it was
called from the Report panel routine. Exceptional values point out
perhaps unexpected special conditions.
and
Min Branches
Max Branches with Children Maximum and minimum number of mispredictions that occurred during
execution of the child routine (including its child functions) when it was
and
called from the Report panel routine. Exceptional values point out
Min Branches with Children perhaps unexpected special conditions.
Shared Branches
Total number of mispredictions that occurred during execution of the
code of the child routine, as a percentage of the total number of
mispredictions that occurred during execution of the child routine
including calls to its child routines. To calculate this value AQtime only
uses those calls to the child routine that were made from the Report
panel routine. In other words, Shared Branches is the ratio of the child
routine’s Branches to Branches with Children.
www.automatedqa.com
AQtime by AutomatedQA Corporation
Profilers
343
Columns (in alphabetical order)
Description
% Branches
This is the Branches value as a percentage of the sum of the Branches
values displayed in the Children grid.
% with Children
This is the Branches with Children value as a percentage of the sum of
the Branches with Children values displayed in the Children grid.
Columns specific to the Hard Memory Page Faults, Soft Memory Page Faults and All Memory Page
Faults counters
Columns (in alphabetical order)
Description
Average Faults
Average number of page faults that occurred during execution of the
child routine’s code per call. To calculate this value, AQtime only uses
those calls to the child routine that were made from within the Report
panel routine.
Average
Children
Faults
with Average number of page faults that occurred during execution of the
child routine per call (including faults that occurred in its child routines).
To calculate this value, AQtime only uses those calls to the child routine
that were made from within the Report panel routine.
Faults
Total number of page faults that occurred during execution of the child
routine (excluding its child functions) when it was called from the
Report panel routine.
Faults with Children
Total number of page faults that occurred during execution of the child
routine (including its child routines) when it was called from the Report
panel routine.
Max Faults
Maximum and minimum number of page faults that occurred during
execution of the child routine (excluding its child functions) when it was
called from the Report panel routine. Exceptional values point out
perhaps unexpected special conditions.
and
Min Faults
Max Faults with Children
and
Min Faults with Children
Maximum and minimum number of page faults that occurred during
execution of the child routine (including its child functions) when it was
called from the Report panel routine. Exceptional values point out
perhaps unexpected special conditions.
Shared Faults
Total number of memory page faults that occurred during execution of
the code of the child routine, as a percentage of the total number of page
faults that occurred during execution of the child routine including calls
to its child routines. To calculate this value AQtime only uses those calls
to the child routine that were made from the Report panel routine. In
other words, Shared Faults is the ratio of the child routine’s Faults to
Faults with Children.
% Faults
This is the Faults value as a percentage of the sum of the Faults values
displayed in the Children grid.
© 2010 AutomatedQA Corp.
www.automatedqa.com/support
344
AQtime Reference
Columns (in alphabetical order)
Description
% with Children
This is the Faults with Children value as a percentage of the sum of the
Faults with Children values displayed in the Children grid.
Columns specific to the Split Load Replays, Split Store Replays and Blocked StoreForwards Replays
counters
Columns (in alphabetical order)
Description
Average Replays
Average number of replays4when conditions for the correct execution of
this operation are not satisfied.
Replays may be caused by cache misses, store forwarding issues, etc.
Normally, certain number of replays always occur during the application
execution. However, a superfluous number of replays designates a
performance problem, that occurred during execution of the child
routine’s code per call. To calculate this value, AQtime only uses those
calls to the child routine that were made from within the Report panel
routine.
Average
Children
Replays
with Average number of replays that occurred during execution of the child
routine per call (including replays that occurred in its child routines). To
calculate this value, AQtime only uses those calls to the child routine
that were made from within the Report panel routine.
Max Replays
and
Min Replays
Max Replays with Children
and
Min Replays with Children
4
Maximum and minimum number of replays that occurred during
execution of the child routine (excluding its child functions) when it was
called from the Report panel routine. Exceptional values point out
perhaps unexpected special conditions.
Maximum and minimum number of replays that occurred during
execution of the child routine (including its child functions) when it was
called from the Report panel routine. Exceptional values point out
perhaps unexpected special conditions.
Replays
Total number of replays that occurred during execution of the child
routine (excluding its child functions) when it was called from the
Report panel routine.
Replays with Children
Total number of replays that occurred during execution of the child
routine (including its child routines) when it was called from the Report
panel routine.
Shared Replays
Total number of replays that occurred during execution of the code of
the child routine, as a percentage of the total number of replays that
occurred during execution of the child routine including calls to its child
routines. To calculate this value AQtime only uses those calls to the
child routine that were made from the Report panel routine. In other
A replay is an attempt of executing a micro-operation
www.automatedqa.com
AQtime by AutomatedQA Corporation
Profilers
345
Columns (in alphabetical order)
Description
words, Shared Replays is the ratio of the child routine’s Replays to
Replays with Children.
% Replays
This is the Replays value as a percentage of the sum of the Replays
values displayed in the Children grid.
% with Children
This is the Replays with Children value as a percentage of the sum of
the Replays with Children values displayed in the Children grid.
Columns specific to the 64K Aliasing Conflicts counter
Columns (in alphabetical order)
Description
Average Conflicts
Average number of aliasing conflicts that occurred during execution of
the child routine’s code per call. To calculate this value, AQtime only
uses those calls to the child routine that were made from within the
Report panel routine.
Average
Children
Conflicts
with Average number of aliasing conflicts that occurred during execution of
the child routine per call (including conflicts that occurred in its child
routines). To calculate this value, AQtime only uses those calls to the
child routine that were made from within the Report panel routine.
Conflicts
Total number of aliasing conflicts that occurred during execution of the
child routine (excluding its child functions) when it was called from the
Report panel routine.
Conflicts with Children
Total number of aliasing conflicts that occurred during execution of the
child routine (including its child routines) when it was called from the
Report panel routine.
Max Conflicts
Maximum and minimum number of aliasing conflicts that occurred
during execution of the child routine (excluding its child functions)
when it was called from the Report panel routine. Exceptional values
point out perhaps unexpected special conditions.
and
Min Conflicts
Max Conflicts with Children Maximum and minimum number of aliasing conflicts that occurred
during execution of the child routine (including its child functions) when
and
it was called from the Report panel routine. Exceptional values point out
Min Conflicts with Children perhaps unexpected special conditions.
Shared Conflicts
Total number of aliasing conflicts that occurred during execution of the
code of the child routine, as a percentage of the total number of conflicts
that occurred during execution of the child routine including calls to its
child routines. To calculate this value AQtime only uses those calls to
the child routine that were made from the Report panel routine. In other
words, Shared Conflicts is the ratio of the child routine’s Conflicts to
Conflicts with Children.
% Conflicts
This is the Conflicts value as a percentage of the sum of the Conflicts
© 2010 AutomatedQA Corp.
www.automatedqa.com/support
346
AQtime Reference
Columns (in alphabetical order)
Description
values displayed in the Children grid.
This is the Conflicts with Children value as a percentage of the sum of
the Conflicts with Children values displayed in the Children grid.
% with Children
Columns specific to the Context Switches counter
Columns (in alphabetical order)
Description
Average Switches
Average number of context switches that occurred during execution of
the child routine’s code per call. To calculate this value, AQtime only
uses those calls to the child routine that were made from within the
Report panel routine.
Average
Children
Switches
Max Switches
and
Min Switches
with Average number of context switches that occurred during execution of
the child routine per call (including switches that occurred in its child
routines). To calculate this value, AQtime only uses those calls to the
child routine that were made from within the Report panel routine.
Maximum and minimum number of context switches that occurred
during execution of the child routine (excluding its child functions)
when it was called from the Report panel routine. Exceptional values
point out perhaps unexpected special conditions.
Max Switches with Children Maximum and minimum number of context switches that occurred
during execution of the child routine (including its child functions) when
and
it was called from the Report panel routine. Exceptional values point out
Min Switches with Children perhaps unexpected special conditions.
Shared Switches
Total number of context switches that occurred during execution of the
code of the child routine, as a percentage of the total number of switches
that occurred during execution of the child routine including calls to its
child routines. To calculate this value AQtime only uses those calls to
the child routine that were made from the Report panel routine. In other
words, Shared Switches is the ratio of the child routine’s Switches to
Switches with Children.
Switches
Total number of context switches that occurred during execution of the
child routine (excluding its child functions) when it was called from the
Report panel routine.
Switches with Children
Total number of context switches that occurred during execution of the
child routine (including its child routines) when it was called from the
Report panel routine.
% Switches
This is the Switches value as a percentage of the sum of the Switches
values displayed in the Children grid.
% with Children
This is the Switches with Children value as a percentage of the sum of
the Switches with Children values displayed in the Children grid.
www.automatedqa.com
AQtime by AutomatedQA Corporation
Profilers
347
Performance Profiler Options
The Performance profiler includes two groups of customizable options:
•
One group includes options that have effect on the profiler functioning. Changes in these options
will only apply to the next profiler run.
•
Another group contains options that affect the current result displaying. When you change these
options, AQtime refreshes data in its panels.
To modify options that affect the profiler functioning, do any of the following:
•
•
AQtime standalone:
Select Options | Options from AQtime’s main menu and then choose Profilers |
Performance | Performance Profiler from the tree view on the left of the Options
dialog.
Press Configure Current Profiler on the Standard toolbar when the Performance
profiler is selected.
AQtime integrated into Microsoft Visual Studio:
•
Select Tools | Options from Visual Studio main menu and then choose AQtime |
Profilers | Performance Profiler from the tree view on the left on the ensuing Options
dialog.
AQtime integrated into Embarcadero RAD Studio:
Select AQtime | Options from Develper Studio’s main menu and then choose Profilers |
Performance | Performance Profiler from the tree view on the left of the Options dialog.
Options that affect the profiler functioning include:
•
Disable inlining - This option has effect for managed applications only. Inlining typically
increases the speed and reduces the number of separate JITting events for inlined methods.
However, if a method is inlined, AQtime cannot time it. If the option is enabled, inlining of
managed routines is disabled, so AQtime can profile them.
•
Profile <Root> routine- Specifies if the profiler results include the <Root> pseudo-routine. For
more information about it, see <Root> Routine.
•
Profile .NET runtime - If this option is enabled, the profiler will analyze the JIT compilation and
garbage collection and profiling results will include the <JIT compiler> and <Garbage collector>
pseudo-routines. For more information on them, see <JIT compiler> and <Garbage collector>
Routines. If this option is disabled, the profiler does not monitor calls to the JIT compilation and
garbage collection routines.
•
Active counter - Specifies what application characteristic the profiler will measure. For more
information on available values for this option, see Counters Overview.
•
Thread model - Specifies how the Performance profiler gathers statistics for threads in the
profiled application. For more information on available values for this option, see Profiling
Multiple Threads.
To modify options that affect the way results are displayed, use items of the Profiler toolbar. If it is hidden,
right-click somewhere in the toolbar area and select Profiler from the subsequent popup list. The toolbar holds
the following items:
•
Counter unit - This item is enabled only if the Active Counter option is either Elapsed Time, User
Time or User+Kernel Time. The Counter unit item lets you specify the measurement unit for the
time columns in AQtime panels. Possible values are Seconds, Milliseconds, Microseconds and
Machine Cycles. Note that this option is counter-specific: suppose you browse results of the User
© 2010 AutomatedQA Corp.
www.automatedqa.com/support
348
AQtime Reference
Time counter and set the option to Machine Cycles. If you open the Elapsed Time results, change
the option to Seconds and then return back to the User Time results, AQtime will automatically
change the option to Machine Cycles (that is, it will select the value that was active when you
browsed the User Time results last time).
•
Show non-hit routines - Enables or disables the display, in the Report panel, of profiled
methods that have not been executed in the current profile run.
•
Calculate "% with children" relative to real values - If this is enabled, % with Children is
figured relative to the total Time (without children). Otherwise, relative to the total Time with
Children. See Calculating Percent in the Report Panel. Note that this option does not influence
the existing profiling results.
•
Include routine body in Details - Sets whether the results for each routine’s own-code
(«body») will be listed along with the child-call results in the Children table of the Details panel.
This option also affects the values displayed in percent columns (% Time, % with Children, %
Misses, % Branches and others). To display routine body results, AQtime adds a new row to the
Children panel, which changes the percent columns’ values, since they depend on the number of
rows.
•
Show routines with class names - If this option is enabled, the Routine Name column of the
Report, Details and Call Tree panels for the Performance profiler holds both class name and
routine name. Else, this column holds the routine name only.
•
File names with path - If this option is enabled, the Source File and Module Name columns
of the Report, Details and Call Tree panels for the Performance profiler hold the entire path to the
given file. Else, these columns hold the file name only.
Searching for Bottleneck Reasons With the Performance Profiler
There can be lots of reasons that cause bottlenecks during the application execution. This topic gives you
several examples of how to find these causes using the Performance profiler. Before reading this topic we
recommend you review Performance Profiler - Overview and Analyzing Performance Profiler Results.
The Performance profiler yields mass statistics about routines in the profiled application: how many times
each routines was called, what functions it called and what functions called it, how many exceptions occurred
during the routines execution, etc. The profiler includes a number of counters to measure specific application
characteristics. For more information on these counters, see Counters Overview. The counters help you not just
find bottlenecks in your application, but find the cause of these bottlenecks. To be more exact, counters is just
one of the means that the Performance profiler provides for finding this cause. Other means include special
columns in profiler results, the hierarchy of function calls, profiler options, etc.
Let's continue with an example. Suppose, you profiled your application with the Elapsed Time counter and
found that FuncA is too slow. The following table gives some examples of how to figure out what caused the
bottleneck:
Reason
How to Check
FuncA called several child routines Compare values of the Time and Time with Children columns in the
and the bottleneck exists in one of Report panel. If Time With Children is a lot more than Time, then
the cause is in one of the child routines. In the Details panel you can
these child routines.
easily find how much time each of the child routines contributed to
the FuncA execution time.
FuncA
called
functions
www.automatedqa.com
from Profile you application with the User Time counter and then
AQtime by AutomatedQA Corporation
Profilers
349
Reason
How to Check
system libraries and the bottleneck compare results of two runs.
exists in one of these functions.
worked
inefficiently.
FuncA
with
memory Profile your application with the CPU Cache Misses, Soft Memory
Page Faults or Blocked Store Forwards Replays counters. High
values in profiler results will give evidence that the algorithm for
working with memory can be improved.
Most of FuncA’s execution time The Performance profiler can time the JIT compilation and garbage
was spent for JIT compilation or collection. To check the time spent for these, view results of the
<JIT compiler> and <Garbage collector> pseudo-routines in the
garbage collection.
Details panel (The Performance profiler includes these routines in
results, if the Profiler .NET runtime option is enabled).
contains
delayed-initialization code, so most
of the time was spent executing the
first call to FuncA.
FuncA
© 2010 AutomatedQA Corp.
The Performance profiler displays profiling results for the first
function call separately from the other routine results. To find the
cause of the bottleneck, check the First Time and First Time With
Children columns in Report panel (These columns are available if
you used the Elapsed Time, User Time or User+Kernel Time
counters).
www.automatedqa.com/support
350
AQtime Reference
Allocation Profiler
This section contains topics that describe the Allocation profiler:
Allocation Profiler - Overview
Allocation Profiler - Analyzing Visual C++ Applications
Allocation Profiler - Analyzing Visual Basic 6.0 Applications
Allocation Profiler - Analyzing Delphi Applications
Allocation Profiler - Analyzing C++Builder Applications
Allocation Profiler - Analyzing Intel C++, Borland C++ and GNU CC Applications
Tracing System Memory Management Functions
Tracing Attempts to Access Released Memory
Checking Bounds of Memory Blocks With the Allocation Profiler
Analyzing Allocation Profiler Results
Description of the Report Panel Columns
Description of the Columns of the Details and Call Tree Panels
Using the Monitor Panel With the Allocation Profiler
Allocation Profiler Options
Allocation Profiler - Overview
The Allocation profiler traces the memory use in 32-bit and 64-bit applications during the application run.
It also helps you determine whether allocated memory blocks or objects remain in memory after the
application execution is over. This topic provides the Allocation profiler overview. The complete profiler
description includes the following topics:
Overview (this topic)
Allocation Profiler - Analyzing Visual C++ Applications
Allocation Profiler - Analyzing Visual Basic 6.0 Applications
Allocation Profiler - Analyzing Delphi Applications
Allocation Profiler - Analyzing C++Builder Applications
Allocation Profiler - Analyzing Intel C++, Borland C++ and GNU CC Applications
Tracing System Memory Management Functions
Tracing Attempts to Access Released Memory
Checking Bounds of Memory Blocks With the Allocation Profiler
Analyzing Allocation Profiler Results
Description of the Report Panel Columns
Description of the Columns of the Details and Call Tree Panels
Using the Monitor Panel With the Allocation Profiler
Allocation Profiler Options
Allocation Profiler Tutorial
The Allocation profiler tracks the application execution monitoring object allocations and deallocations
and calls to the memory management routines. It collects mass statistics, for example:
www.automatedqa.com
AQtime by AutomatedQA Corporation
Profilers
351
•
The number of objects created in the application
•
The size of these objects in memory
•
The creation point of an object and the stack of function that calls for it
•
References between managed objects
•
The usage of allocated memory blocks
•
And so forth...
The Allocation profiler traces the memory in both managed and unmanaged (native-code) applications.
•
Unmanaged (Native-Code) Applications
The Allocation profiler monitors calls to the memory management functions and help determine
whether objects and memory blocks remain in memory after the application is over or whether the
application writes to memory that does not belong to the allocated block. The profiler traces calls
to memory management functions provided by the programming language and calls to Windows
memory management functions (the latter is performed if the Check system memory allocations
option is enabled). The following topics contain detailed information on profiling applications:
Analyzing Visual C++ Applications
Analyzing Delphi Applications
Analyzing C++Builder Applications
Analyzing Visual Basic 6.0 Applications
Analyzing Intel C++, Borland C++ and GNU CC Applications
Tracing System Memory Management Functions
If the Check Memory Bounds option is enabled, the profiler traces whether the application wrote to
addresses above the upper or below the lower bound of an allocated memory block. For more
information, see Checking Bounds of Memory Blocks.
By using the profiler you can track memory blocks that are referred to after they have been
released. Generally, when a block is released, it is marked as free, but its data may still be available
and further instructions may successfully read data from it. If the Fill released memory blocks
option is enabled, AQtime overwrites the actual data of the block upon its release. So, if there is an
attempt to read data from a released block, an invalid value will be returned, which will allow you
to find invalid references. See the Tracing Attempts to Access Released Memory topic for details.
●
Managed Applications
When you profile your managed application with the Allocation profiler, AQtime traces all the
memory allocated by the application. When the application run is over, the common language
runtime reclaims all memory allocated for the application objects. Therefore, after the application
has been closed, the memory allocated for it is released. However, Allocation will report that some
objects still exist. This happens because the profiler collects final statistics before the run-time
calls the garbage collector to free the memory. As the run-time releases memory when the
application is being closed, the final statistics may not be very interesting. That is why the
Allocation profiler is used mainly to monitor the existing application objects during the run. To
obtain the results, do the following:
AQtime standalone:
o
Select Run | Get Results from AQtime’s main menu.
AQtime integrated into Microsoft Visual Studio:
o
Select
© 2010 AutomatedQA Corp.
Get Results on the Visual Studio’s AQtime toolbar.
www.automatedqa.com/support
352
AQtime Reference
AQtime integrated into Embarcadero RAD Studio:
o
Select AQtime | Get Results from RAD Studio’s main menu.
Another reason why the Allocation profiler can report about unreleased objects after the
application termination is that .NET applications can still have actual memory leaks although the
Garbage Collector significantly reduces the chance of these leaks. The nature of .NET leaks is
different from that of leaks in unmanaged applications. Leaks in unmanaged applications appear if
an object or some resource has been allocated but is not released when it is not needed anymore.
Leaks in managed applications can appear if root objects (such as global variables) have direct or
indirect references to some objects. These objects are not destroyed by the Garbage Collector, and
thus their lifetime can equal the application’s run-time. Moreover, if objects are not deleted at
some points of application execution, you may get memory overflow.
Our Web site holds an article (http://www.automatedqa.com/techpapers/net-allocation-profiler/)
that gives examples of potential memory leaks in .NET applications and describes how you can
find them using the Allocation profiler of AQtime.
The Allocation profiler traces the use of those objects, which classes are included into profiling areas of the
class level (if a class-level area includes a source file, namespace or a module, the profiler analyzes all classes
included in that source file, namespace or module). As for memory blocks, the profiler always tracks their
allocations and deallocations regardless of any profiling areas.
The Allocation profiler operates during the entire run of the application. It takes no account of triggers and
Enable/Disable Profiling button.
actions and disables the
If you are going to track classes, make sure that you have checked one or more class-level profiling areas
before starting profiling. Otherwise, you may get empty results. The reason is quite simple: the profiler always
tracks memory-block allocations done by non-class memory management routines such as new or alloc.
Therefore, if you start profiling your application and there are no class-level areas selected, the profiler will not
notify you, since that application may include calls to non-class memory management routines, which you may
want to profile (even .NET applications may include unmanaged sections which hold calls to these routines).
An application may include classes, in which all the methods (including constructors) are inherited,
but not overridden (for instance, a class may introduce some new properties or fields, but it may not
define new methods or override existing ones). These classes are not listed in the Setup panel, but
AQtime will profile them if you enable the Full Check option. The Allocation profiler traces
instantiation of such classes as allocations of memory blocks, but not as allocations of objects. So,
you may notice that the Allocation profiler does not report about leaked objects, but about memory
leaks.
To solve the problem, create a new or override an existing method of the class (for instance, the
object’s constructor).
Note that if a method is not called in your application, the compiler may not include it in the
application’s binary code. So, even the classes that introduce new methods may become a class
described above. To solve the problem in this case, disable optimization in compiler settings.
The Allocation profiler generates a huge amount of results, and sometimes it is difficult to locate the items
that are of interest. Therefore AQtime provides a number of built-in filters that hide the results matching
certain conditions. Several filters can be applied simultaneously. The buttons that toggle result filtering reside
on AQtime’s Profiler toolbar.
The following filters are available:
www.automatedqa.com
AQtime by AutomatedQA Corporation
Profilers
353
•
Show all loaded classes - If enabled, the profiler reports all of the classes being profiled even if
no instances (objects) were created for these classes. Otherwise, AQtime only reports the classes
whose instances had been created by the time the results were generated.
•
Filter standard leaks - If enabled, AQtime excludes known memory leaks that were produced
by standard IDEs and libraries (like MFC and VCL). Otherwise, these leaks are reported along
with the rest of the profiling results. A list of known memory leaks is available at
http://www.automatedqa.com/products/aqtime/leaks/
•
View project classes only - If enabled, the profiler reports memory allocations and
de-allocations that were made only by modules added to the Setup panel. Otherwise it lists the
memory operations performed both by the «Setup» modules and by other modules that the
«Setup» modules use.
Note: In some applications a class or memory block can be allocated and released by different modules.
For instance, a string can be allocated by the main executable and released by a dynamic link
library that is used by this executable. If the DLL is not included in your AQtime project, the
Allocation profiler will not be able to detect the release of the string and will report a memory
leak. This may cause you to think that the main executable has a memory leak, while it does not.
To avoid the confusion, include the main executable and the DLLs it uses in your AQtime project.
•
Filter objects by stack - If enabled, the profiler only reports the objects created immediately by
the Setup modules. Otherwise, AQtime reports all created objects for whichever module created it.
The Allocation profiler is closely integrated with the Monitor panel and can display its results during the
profiler run, as they are received. See Using the Monitor Panel With the Allocation Profiler.
The amount of allocated memory displayed for your application by AQtime may differ from the amount of
memory shown in the Task Manager. This happens because AQtime displays the memory that is currently
allocated by the application’s memory manager for all live objects being profiled (the Allocation profiler traces
only those objects whose classes are included in profiling areas). In the Task Manager window, you see the
memory size that is allocated by the operating system’s memory manager for the application. Some part of this
memory may not be used at the moment, but it is still allocated by the application’s memory manager (for
instance, for future use). In certain cases, deallocated memory blocks may not be returned to the operating
system’s memory manager, so the operating system «thinks» that these blocks are still being allocated by the
application. There are also other possible reasons. So, the difference you see is caused by the peculiarities of
memory management in the operating system and in the application.
Analyzing Visual C++ Applications
This topic describes the peculiarities of profiling Microsoft Visual C++ applications with the Allocation
profiler. The topic includes the following sections:
General Information
Preparing Application
Preparing AQtime project
General Information
The Allocation profiler traces calls to functions that allocate and de-allocate memory blocks and objects. In
general, applications can use two function groups to allocate and de-allocate memory: they can use system
memory management calls, or they can call on the runtime memory manager, which is part of the runtime
library of Visual C++. The runtime memory manager requests large blocks from the system, and then
eventually releases them. After that, it works on its own memory-allocation calls from the application. This
© 2010 AutomatedQA Corp.
www.automatedqa.com/support
354
AQtime Reference
improves the speed and, most importantly, allows you to avoid system memory thrashing (frequent allocation
and de-allocation of small blocks).
The Allocation profiler traces calls to runtime memory manager and system memory management
functions. For information on profiling system memory management functions, see Tracing System Memory
Management Functions. As for runtime memory management functions, the profiler traces the following:
•
new, delete
•
new[], delete[]
•
malloc, calloc, realloc
•
expand, free
The profiler can show the class names when creating and deleting C++ objects. This functionality is
supported for 32-bit and 64-bit Visual C++ applications. The profiler traces the objects created dynamically
(that is, the object created by the new operator). Objects allocated on a stack are not traced (but they do not
cause leaks as well).
A C++ object will be reported with it’s class name if the following condition is met:
•
The class must have a constructor written in code or generated by the C++ compiler
(compilers typically generate the constructors, if a class is a descendant of another class).
Classes that do not have a constructor are reported under the C++ native memory class name (with a
complete call stack for each leaked instance). See Analyzing Allocation Profiler Results for more
information.
Preparing Application
AQtime can track memory usage of Visual C++ applications compiled either in the Release or Debug
configuration. However, applications compiled in the Release configuration have certain limitations. Namely:
•
If several classes have similar constructors, the linker can exclude the implementation of
«redundant» constructors leaving only one of them. As a result, the calls to constructors of
different classes will be interpreted as calls to a single constructor, thus the objects of different
classes will be treated as the objects of the same class.
•
If a class has an empty constructor, the linker excludes the constructor’s implementation from
compilation and the class is reported under the C++ native memory class name in the profiling
results.
•
The Release configuration produces more static allocations of memory. When the application
starts, it allocates a block of memory of a predefined size, uses it during the runtime and releases it
upon exit. The issue is that the memory is freed after AQtime retrieves the profiling results, so
these blocks are reported as leaked.
Therefore, we recommend that you compile your application in the Debug configuration. You can do this
by specifying the Debug compilation mode or by performing the following steps:
•
Specify the #define Debug directive in your source code.
•
Select Project | Settings from the main menu in Visual C++. This will open the Project Settings
dialog.
•
Move to the C/C++ page.
•
Select General from the Category list and then add _Debug to the preprocessor definitions.
•
Select the Code Generation category. Choose Debug Single-Threaded, Debug Multithreaded or
Debug Multithreaded DLL from the Use run-time library dropdown list.
www.automatedqa.com
AQtime by AutomatedQA Corporation
Profilers
355
•
Press OK to close the Project Settings dialog.
•
Recompile your application.
Preparing AQtime Project
In order for AQtime to profile the above-mentioned routines in Visual C++ applications, you may need to
add certain libraries to the Setup panel in addition to your modules. This depends on the compiler options that
were enabled when you compiled your application.
Add Module button on the Setup toolbar, or select Add
To add a library to the Setup panel, press the
Module from the panel’s context menu. If the required library is not listed in the Modules pane, AQtime will
suggest to add it when you start profiling.
To monitor the runtime memory manager, you should add the Microsoft Visual C++ Run Time Library
(MSVCRT) to the Modules pane. Depending on whether the application was compiled in the Release or
Debug configuration, either the MSVCRT.DLL or MSVCRTD.DLL (debugging version) file should be
added.
By depending on the compiler options, your application can use dynamically linked MFC libraries or
statically linked MFC libraries. AQtime can track memory manager functions regardless of which MFC
version you use - dynamic or static. However, when AQtime tracks the call stack of memory management
functions, it will track only those routines that are shown in the Modules pane. So, if you want to see a more
detailed call stack, you need to add MFC libraries to the Setup panel.
Let’s continue with a simple example. Suppose, your application contains the fooA function that calls
MFC’s function CDC::GetPen, which, in turn, calls the malloc routine located in the MSVCRTD dynamic
link library. The malloc routine, in its turn, can call debug_malloc or some other functions. The hierarchy
of function calls looks like this:
fooA (your exe) -> CDC::GetPen
debug_malloc (msvcrtd.dll)
(mfc71d.dll)
->
malloc
(msvcrtd.dll)
->
If you do not add MFC71 and MSVCRTD libraries to the Setup panel, the call stack will hold only the
fooA function. If you add these libraries to the Setup panel, you will get a more detailed call stack.
Analyzing C++Builder Applications
This topic describes peculiarities of profiling C++Builder applications with the Allocation profiler. The
topic includes the following sections:
About Routine and Class Profiling
Preparing AQtime project
Empty lines in the Call Stack
Note: In order for AQtime to be able to profile your application, please set compiler options as it is
described in the Compiler Settings for Borland C++Builder topic.
About Routine and Class Profiling
The Allocation profiler tracks functions that allocate or de-allocate memory. In general, applications can
do this in two ways: they can use system memory management calls, or they can call the runtime memory
manager, which is part of the VCL runtime library. The runtime memory manager requests large blocks from
the system, and then eventually releases them. After that, it works on its own with a lot of memory-allocation
calls from the application. This improves the speed, and more importantly, allows you to avoid system memory
thrashing (frequent allocation and de-allocation of small blocks).
© 2010 AutomatedQA Corp.
www.automatedqa.com/support
356
AQtime Reference
The Allocation profiler traces calls runtime memory manager and system memory management functions.
For information on profiling system memory management functions, see Tracing System Memory
Management Functions. The profiler traces calls to the following runtime memory management functions:
•
VCL
GetMem, ReallocMem, FreeMem
GetMemory, ReallocMemory, FreeMemory
SysGetMem, SysReallocMem, SysFreeMem
The New and Dispose routines are not traced explicitly. They call GetMem and the profiler traces
these calls.
To enable AQtime to profile the above-mentioned routines in C++Builder applications, you may
need to add certain modules to the Setup panel in addition to your modules. This depends on
compiler options that were enabled when you compiled your application, specifically
enabling/disabling the Build with runtime packages option. More information on this is below.
Please read it, as this information is important. If you do not read it, you may get empty results.
•
C++
new, delete
new[], delete[]
malloc, calloc, realloc
expand, free
The profiler can also show class names reporting object leaks. Note, that an object will be reported with it’s
class name if the following conditions are met:
•
VCL
The class must be inherited from TObject.
The class must introduce new methods or override methods derived from TObject.
The class methods should be called in your code (otherwise they can be excluded from the
debug information by the compiler.)
In any other case, for example, if class only introduces properties and fields, the leaked classes (if
any) are reported under the VCL native memory class name (with a complete call stack for each
leaked instance). See also Analyzing Allocation Profiler Results.
•
C++
The class must have a constructor written in code or generated by the C++ compiler
(compilers typically generate the constructors, if a class is a descendant of another class).
Classes that do not have a constructor are reported under the C++ native memory class name (with
a complete call stack for each leaked instance). See Analyzing Allocation Profiler Results for more
information.
Preparing AQtime project
The Allocation profiler tracks functions that allocate or de-allocate memory. The functions can do this in
two ways: they can use system memory management calls, or they can call on the runtime memory manager,
which is part of the VCL runtime library. The runtime memory manager requests large blocks from the system,
and then eventually releases them. After that, it works on its own with a lot of memory-allocation calls from the
application. This improves the speed and, which is more important, allows you to avoid system memory
thrashing (frequent allocation and de-allocation of small blocks).
www.automatedqa.com
AQtime by AutomatedQA Corporation
Profilers
357
The memory manager can be located in the profiled module or in one of the packages. This depends on the
«Build with runtime packages» compiler option (you can change it on the Packages tabbed page of the
Project Options dialog):
•
If this option is turned on, the memory manager code is not included in the executable and the
application uses the memory manager from the .bpl runtime package located in the
<Windows>\System32 folder, for instance, rtl60.bpl for C++Builder 6. If your application was
compiled with the «Build with runtime packages» option enabled and you want to profile calls to
the memory manager, you should add this package to the Setup panel. The package can be
compiled without debug information.
At start of the Allocation profiler AQtime checks whether memory management routines are
contained within packages. If the check is successful, it shows a message informing you which
packages should be added to your AQtime project.
•
If the «Build with runtime packages» option is off, the memory manager is located within the
profiled executable. In this case, there is no need to add bpl modules to the Setup panel.
Note for C++Builder users: in order for AQtime to be able to profile VCL code, please set compiler
options as it is described in the Compiler Settings for Borland C++Builder topic.
Empty lines in the Call Stack
When AQtime tracks the hierarchy of function calls that led to an object creation or allocation of a memory
block, it traces only those routines for which it can find debug information. When you create a new class
instance (i.e. an object), a memory management routine is not called directly by the class constructor. A call to
it can be made by other routines which the class constructor calls. These routines typically locate in VCL units.
Since these units may be compiled without debug information, the call stack may not hold all the routines,
which were called, or it may hold partial information for them (for instance, information about source lines can
be absent). Therefore, to obtain more detailed call stack, compile your application with the Use Debug DCUs
option enabled (in C++Builder the option name is Use debug libraries). You can change the option on the
Linker tabbed page of the Project Options dialog.
Analyzing Delphi Applications
This topic describes peculiarities of profiling Delphi applications with the Allocation profiler. The topic
includes the following sections:
About Routine and Class Profiling
Preparing AQtime project
Empty lines in the Call Stack
Note: In order for AQtime to be able to profile your application, please set compiler options as it is
described in the Compiler Settings for Borland Delphi topic.
About Routine and Class Profiling
The Allocation profiler tracks functions that allocate or de-allocate memory. In general, applications can
do this in two ways: they can use system memory management calls, or they can call the runtime memory
manager, which is part of the VCL runtime library. The runtime memory manager requests large blocks from
the system, and then eventually releases them. After that, it works on its own with a lot of memory-allocation
calls from the application. This improves speed, and more importantly, allows you to avoid system memory
thrashing (frequent allocation and de-allocation of small blocks).
© 2010 AutomatedQA Corp.
www.automatedqa.com/support
358
AQtime Reference
The Allocation profiler traces calls to runtime memory manager and system memory management
functions. For information on profiling system memory management functions, see Tracing System Memory
Management Functions. The profiler traces calls to the following runtime memory management functions:
•
GetMem, ReallocMem, FreeMem
•
GetMemory, ReallocMemory, FreeMemory
•
SysGetMem, SysReallocMem, SysFreeMem
The New and Dispose routines are not traced explicitly. They call GetMem and the profiler traces these
calls.
The profiler is able to show the class names when creating and deleting VCL objects. Note, that an object
will be reported with it’s class name if several conditions are met:
•
The class is inherited from TObject.
•
The class introduces new methods or override the inherited TObject methods.
•
You call those methods from your code. (Otherwise they can be excluded from the debug
information by the compiler.)
In any other case, for example, if class only introduces properties and fields, the leaked classes (if any) are
reported under the VCL native memory class name (with a complete call stack for each leaked instance). See
also Analyzing Allocation Profiler Results.
In order for AQtime to profile the above-mentioned routines in Delphi applications, you may need to add
certain modules to the Setup panel in addition to your modules. This depends on compiler options that were
enabled when you compiled your application, specifically enabling/disabling the Build with runtime packages
option. More information on this is below. Please read it, as this information is important. If you do not read it,
you may get empty results.
Preparing AQtime Project
The Allocation profiler tracks both calls to runtime memory manager and system memory management
functions (see above). This section describes peculiarities of profiling runtime memory manager functions.
The memory manager can be located in the profiled module or in one of the packages. This depends on the
«Build with runtime packages» compiler option (you can change it on the Packages tabbed page of the
Project Options dialog):
•
If this option is turned on, the memory manager code is not included in the executable and the
application uses the memory manager from the .bpl runtime package located in the
<Windows>\System32 folder. For instance, vcl50.bpl for Delphi 5, rtl60.bpl for Delphi 6 or
rtl70.bpl for Delphi 7. If your application was compiled with the Build with runtime packages
option enabled and you want to profile calls to the memory manager, you should add this package
to the Setup panel. The package can be compiled without debug information.
At the beginning of the Allocation profiler, AQtime checks whether memory management
routines are contained within packages. If the check is successful, it shows a message informing
you which packages should be added to your AQtime project.
•
If the «Build with runtime packages» option is off, the memory manager is located within the
profiled executable. In this case, there is no need to add bpl modules to the Setup panel.
Empty lines in the Call Stack
When AQtime tracks the hierarchy of function calls that led to an object creation or allocation of a memory
block, it traces only those routines for which it can find debug information. When you create a new class
instance (that is, an object), a memory management routine is not called directly by the class constructor. A call
www.automatedqa.com
AQtime by AutomatedQA Corporation
Profilers
359
to it can be made by other routines which the class constructor calls. These routines typically locate in VCL
units. Since these units may be compiled without debug information, the call stack may not hold all the
routines, which were called, or it may hold partial information for them (for instance, information about source
lines can be absent). Therefore, to obtain more detailed call stack, compile your application with the Use
Debug DCUs option enabled. You can change the option on the Linker tabbed page of the Project Options
dialog.
Analyzing Visual Basic Applications
This topic describes peculiarities of analyzing Visual Basic 6.0 applications with the Allocation profiler.
Profiling of Visual Basic .NET applications does not differ from profiling of other .NET applications. For more
information on this, see the description of the Allocation profiler.
The Allocation profiler tracks functions that allocate or de-allocate memory. In general, applications can
do this in two ways: they can use system memory management calls, or they can call the runtime memory
manager that is part of Visual Basic’s runtime library. The runtime memory manager requests large blocks
from the system, and then releases them when it is needed. It then deals on its own with the application’s
memory-allocation calls. This improves functioning speed, and most importantly, allows you to avoid system
memory thrashing (frequent allocations and de-allocations of small blocks).
The Allocation profiler traces calls both to VB memory manager’s functions and memory management
functions provided by Windows API. For information on profiling system memory management functions, see
Tracing System Memory Management Functions. As for runtime memory management functions, the profiler
traces calls to the following:
•
__vbaRedim, __vbaFreeObj, __vbaStrCopy, __vbaAryDestruct
•
__vbaFreeStr, __vbaNew, __vbaStrMove
These functions are called upon creation and reallocation of arrays, upon creation of classes that refer to
COM objects, upon creation of classes with string fields, and so forth.
Creation and deletion of VB classes is traced as creation and deletion of memory blocks. That is, the
profiler results do not include the names of leaked VB classes; the leaked classes (if any) are reported under the
VB native memory class name (with a complete call stack for each leaked instance). See also Analyzing
Allocation Profiler Results.
To profile Visual Basic 6.0 applications with the Allocation profiler, add the MSVBVM60.DLL
library to your AQtime project (see Creating and Saving AQtime Projects to learn how to do this). By
default, the DLL is in the <Windows>\System32 folder. If the DLL is not added to the project,
AQtime will not start profiling.
The Visual Basic memory manager allocates memory when a new object is created in your application.
When the application is closed, the memory manager automatically releases all memory blocks it allocated
during the application run. Thus, the Allocation profiler will not report any memory leaks in your Visual Basic
application. However, this profiler, along with the Monitor panel, can be helpful if you want to explore how
your application uses memory in real time. The profiler reports a call stack for each call to memory manager
routines, so you can easily see calls to which functions and procedures increase the amount of memory used by
your application. The call stack does not include rows for memory manager’s routines (these routines are
internal routines of Visual Basic’s memory manager, so there is no need to know them, since they do not
contain useful information).
Note that since the memory manager allocates large memory blocks and then distributes them according to
memory allocation calls from the application, memory allocations made through the memory manager
functions may not increase the total amount of memory allocated for the application.
© 2010 AutomatedQA Corp.
www.automatedqa.com/support
360
AQtime Reference
Analyzing Intel C++, Borland C++ and GNU CC Applications
The Allocation profiler traces calls to functions that allocate and de-allocate memory blocks and objects. In
general, applications can use two function groups to allocate and de-allocate memory: they can use system
memory management calls, or they can call on the runtime memory manager, which is part of the runtime
library of Intel C++, Borland C++ and GNU CC. The runtime memory manager requests large blocks from the
system, and then eventually releases them. After that, it works on its own with a lot of memory-allocation calls
from the application. This improves speed, and most importantly, allows you to avoid system memory
thrashing (frequent allocation and de-allocation of small blocks).
The Allocation profiler traces calls to the C++ memory manager’s functions and memory management
functions provided by Windows API. For information on profiling system memory management functions, see
Tracing System Memory Management Functions. The profiler traces calls to the following runtime memory
management functions:
•
new, delete
•
new[], delete[]
•
malloc, calloc, realloc
•
expand, free
To enable AQtime to profile the above-mentioned routines in your Intel C++, Borland C++ or GNU CC
application, you may need to add certain modules to the Setup panel in addition to your modules. This depends
on the compiler options that were enabled when you compiled your application, specifically enabling the
Debug configuration.
Creation and deletion of C++ classes located in Intel C++, Borland C++ and GNU CC applications are
traced as creation and deletion of memory blocks. That is, the profiler results do not include the names of
leaked C++ classes; the leaked classes (if any) are reported under the C++ native memory class name (with a
complete call stack for each leaked instance). See also Analyzing Allocation Profiler Results.
Tracing System Memory Management Functions
The Allocation profiler tracks functions that allocate or de-allocate memory. Applications work with
memory using functions of two types: system memory management functions (Windows API functions) or
functions of the runtime memory manager, which is part of the VCL runtime library. For information on
profiling runtime memory manager functions, see the topics listed in the See Also section.
The profiler always traces calls to functions of the runtime memory manager. As for calls to system
memory management functions, they are traced only if the profiler’s Check system memory allocations option
is enabled. By default, this option is disabled. If you enable it, the profiler will trace calls to the following
Windows API functions that allocate and de-allocate memory:
CommandLineToArgvW LocalAlloc
FormatMessageA
LocalFree
FormatMessageW
LocalReAlloc
GlobalAlloc
PrintDlgA
GlobalFree
PrintDlgW
GlobalReAlloc
ReleaseStgMedium
HeapAlloc
SetClipboardData
HeapCreate
VirtualAlloc
HeapDestroy
VirtualFree
www.automatedqa.com
AQtime by AutomatedQA Corporation
Profilers
361
HeapFree
HeapReAlloc
Memory blocks that were allocated by system memory management functions and not disposed at the end
of the application run are reported under specific class names (with a complete call stack for each leaked
block). The following table displays the relationship between functions and «leaks’ class names»:
«Class Name»
Functions
Committed
Memory,
Virtual VirtualAlloc, VirtualFree
Reserved
Memory
Virtual
Global heap
GlobalAlloc,
GlobalFree,
GlobalReAlloc,
ReleaseStgMedium, SetClipboardData
PrintDlgA,
PrintDlgW,
Heap
HeapAlloc, HeapCreate, HeapDestroy, HeapFree, HeapReAlloc
Heap memory
VirtualAlloc, VirtualFree
Local heap
CommandLineToArgvW, FormatMessageA, FormatMessageW, LocalAlloc,
LocalFree, LocalReAlloc
Tracing Attempts to Access Released Memory
Many applications release memory, but attempt to access it later. As a result, the application may crash,
raise an exception, cause an access violation error, etc. This situation is known as use after free or premature
free, and the remaining reference to the memory is known as a dangling pointer. The situation usually occurs
when one part of the application "decides" that it has finished using a memory block and is unaware that
another part of the application is still using it.
Sometimes, however, it may be difficult to reveal premature free because of the following peculiarity:
When a memory block is deallocated, it is marked as free in a special list, but the actual data remains in
memory unless the block is overwritten by other instructions. So, attempts to read data referenced by a
dangling pointer may still be successful.
To track the cases of premature free, you can use the Allocation profiler. When the profiler’s Fill released
memory blocks option is enabled, AQtime overwrites the block contents with the 0xDD values. As a result, the
application does not read valid data from freed blocks, so, any attempts to read such data will result in errors
and will be reported in the Event View panel.
For each error, the Event View panel logs the exception code and description, as well as the call stack that
led to the exception. In the call stack, the topmost routine is the one where the exception occurred. If the
application was compiled with debug information, then the Editor panel can display the source code for the
routine selected in the call stack. Debug info also lets you distinguish routines of the call stack easier. Without
it, only the addresses of these routines are displayed. In this case, names are available only for functions that
are exported from DLLs. In debug info, routine names are used in their natural format.
Checking Bounds of Memory Blocks With the Allocation Profiler
© 2010 AutomatedQA Corp.
www.automatedqa.com/support
362
AQtime Reference
The Allocation Profiler includes an option, Check Memory Bounds, which specifies whether the profiler
reports an error when the profiled application writes to addresses above the upper or below the lower bound of
an allocated memory block.
To implement this check, the profiler hooks functions that allocate memory blocks. It returns a block
allocated for 8 bytes more than requested, but the application is only informed of owning the size it requested.
4 bytes are reserved before the requested block, and 4 are reserved after --
Important notes:
•
The profiler leaves its own signatures in each 4-byte buffer. If the application overwrites the
memory outside of these 4-byte buffers, AQtime will not report an error.
•
AQtime determines that the bounds were exceeded when it finds a 4-byte signature that was
overwritten. It checks for it in the following situations:
1. When the block is re-allocated.
2. When the block is released.
3. When the application is terminated.
4. When the results are generated via the Get Results command (see Getting Results During
Profiling).
•
The application may be coded on assumptions concerning memory, which should not be made, but
«generally work». Therefore it may work well outside of AQtime and misbehave under AQtime
with the Check memory bounds option enabled. For instance, it might allocate two consecutive
blocks of memory, then attempt to fill them in one call to ZeroMemory():
www.automatedqa.com
AQtime by AutomatedQA Corporation
Profilers
363
This ruins the memory-bounds checking, but it also constitutes unexpected conditions for the
application itself. In general, applications should not be coded on the assumption that they control
the order of allocations from the memory manager. The workaround is to disable Check Memory
Bounds. If the problem goes away, then this was probably the cause.
•
Due to certain peculiarities of AQtime, the Clear Results command does not work if the Check
memory bounds setting is enabled.
•
Since the bounds-checking control causes additional memory spaces to be allocated, some tools
that trace the memory usage (for example, Task Manager) will slightly exaggerate the memory
used by your application.
•
The Check memory bounds feature only operates with native-code applications. It does not work
with managed code applications.
•
AQtime does not track allocations done on the stack, therefore you cannot track violations in the
stack memory blocks.
The Allocation profiler displays the bounds check results along with information about existing classes
and instances. The Classes category of the Report panel contains the Memory Overwrite Error row. The
presence of this row indicates that the profiler detected a violation of memory block bounds.
The Objects category contains a row for every memory violation, which the profiler detected. The row
contains the text Memory Overwrite Error.nn (where nn specifies the number of the detected violations).
The Details panel displays the stack of function calls corresponding to the row that is selected in the Report
panel. Note that the profiler detects the memory corruption in one of the following situations: when a memory
block is released, when the block is reallocated, when the application is terminated or when the Get Results
command is executed (see above). The call stack that is shown in the Details panel corresponds to the situation
and if it is impossible to trace the call stack, it will be empty:
•
If the profiler detects a memory corruption when a block is deleted of reallocated, the call stack
will display the sequence of function calls that led to the block deletion or reallocation. The call
stack will not point to the routine that includes the code statements that violated memory block
bounds.
•
If a corrupted block is detected when the application terminates, the profiler is unable to trace the
call stack so the call stack appears empty.
The same happens if the memory corruption is detected when the Get Results command is
working since in this case there is no routine for which the call stack information can be gathered.
Analyzing Allocation Profiler Results
The Allocation profiler traces the use of classes that are added to class-level profiling areas. Like other
AQtime profilers, Allocation generates results after application terminates or upon selecting Run | Get
Results from AQtime’s main menu (if you use AQtime integrated into Micrsoft Visual Studio, you can
generate results by clicking Get Results on Visual Studio’s AQtime toolbar; if you use AQtime integrated
into Embarcadero RAD Studio, you can generate results by selecting AQtime | Get Results from RAD
Studio’s main menu).
The Summary panel displays brief profiling results. It reports about classes with maximum number of
existing instances, classes with maximum number of created instances and so on. Information about about all
the classes and their instances that are used by the application is shown in the Report panel. Here is a sample
output of the Allocation profiler:
© 2010 AutomatedQA Corp.
www.automatedqa.com/support
364
AQtime Reference
Sample Output of the Allocation Profiler (AQtime Standalone)
www.automatedqa.com
AQtime by AutomatedQA Corporation
Profilers
365
Sample Output of the Allocation Profiler (AQtime Integrated into Microsoft Visual Studio)
© 2010 AutomatedQA Corp.
www.automatedqa.com/support
366
AQtime Reference
Sample Output of the Allocation Profiler (AQtime Integrated into Embarcadero RAD Studio)
As you can see, the Allocation profiler results are divided into two categories: Classes and Objects. These
categories are displayed as subnodes of the result set node in the Explorer panel. The contents of the Report,
Details, Call Graph and other panels depend on the currently selected category. This is described in detail
below. Before proceeding, we would like you to pay attention to the four items displayed on the Profiler
toolbar:
•
By default, the Allocation profiler only reports about class instances (objects) that exist in the
Show all
profiled application at the time of the result generation. However, if you check the
loaded classes toolbar item, AQtime will report about all classes being profiled even if no
instances (objects) were created for these classes since the application started. To hide these
classes from the report, uncheck the Show all loaded classes item.
•
The profiler is able to trace memory leaks produced by your application as well as by the MFC or
VCL library code, which you use to compile your application. To filter out «known» IDE memory
leaks, press the
Filter standard leaks toolbar item. AQtime will automatically detect the
compiler version, which you used to create your application, and will hide the memory leaks
specific to this version. Using this feature you can concentrate on the inaccuracies of your code
and exclude MFC and VCL leaks (which you cannot fix) from analysis. A list of known memory
leaks is available at http://www.automatedqa.com/products/aqtime/leaks/.
•
The Allocation profiler traces memory allocation and de-allocation that were performed by the
modules added to the Setup panel and by other modules, which these «Setup» modules use. To
exclude results of non-Setup modules from the result display, enable the
View project classes
www.automatedqa.com
AQtime by AutomatedQA Corporation
Profilers
367
only toolbar button. To view results of all the modules, uncheck this button. Note that the button
only effects the Objects category (see below) and is ignored when the Classes category is selected.
Note that in some applications a class or memory block can be allocated and released by different
modules. For instance, a string can be allocated by the main executable and released by a dynamic
link library that is used by this executable. If the DLL is not included in the AQtime project, the
Allocation profiler will not be able to detect the release of the string and will report a memory leak.
This may cause you to think that the main executable has a memory leak, while it does not. To
avoid the confusion, include the main executable and the DLLs it uses into your AQtime project.
•
Besides, the Allocation profiler traces the object creation process and lists the existing objects
under the Objects objects category. An object can be created by any executable module: no matter
whether it is added to the Setup panel or not. By default all of the existing objects are displayed.
Filter objects by stack button to hide those objects that were
However, you can press the
created in non-Setup modules. Once this button is pressed, AQtime scans the first lines of the
creation call stack of each object and excludes it if the corresponding instruction does not belong
to any of the Setup modules.
Classes Category
When this category is selected, the Report panel displays information about classes whose instances were
created during the run. For memory blocks that are not object instances (for example, for memory blocks
allocated with the C++ malloc or Delphi GetMem function, or the VB ReDim statement) the Report panel
displays either C++ native memory, VCL native memory or VB native memory class name.
Other possible category names include -•
Memory Overwrite Error - This indicates that some memory-write operations violated memory
block bounds. For more information on this see Checking Bounds of Memory Blocks.
•
Committed Virtual Memory, Reserved Virtual Memory, Global heap, Heap, Heap memory, Local
heap - These categories contain leaks produced by calls to Windows API memory management
functions. See Tracing System Memory Management Functions.
Note that AQtime does not report the names of classes in Visual Basic 6.0 applications. These classes are
traced as memory objects, and leaked classes (if any) are included in the VB native memory class (see
Analyzing Visual Basic 6.0 Applications). Similarly, the Allocation does not report the names of classes in Intel
C++, Borland C++ and GNU CC applications. The classes in these applications are traced as memory objects
and the leaks are included into the C++ native memory class (see Analyzing Intel C++, Borland C++ and
GNU CC Applications).
As for classes that reside in Visual C++, Delphi and C++Builder applications, AQtime may or may not
trace them as memory blocks. In order for AQtime to be able to trace a class, as a class, not as a memory block,
the class must meet certain requirements. For more information, see the following topics:
Analyzing Visual C++ Applications
Analyzing Delphi Applications
Analyzing C++Builder Applications
Each row in the Report panel shows profiling results for every single class: the total and current number of
class instances, their size, etc. (For more detailed information, review Allocation Profiler - Report Panel
Columns). This gives you a summary view on what happened in the application during profiling (you can also
view the summary results in the Summary panel). Note that by default the Report panel holds only some of
available columns. You can add more columns to the panel or remove columns from it. For more information
on this, see Adding and Removing Columns.
© 2010 AutomatedQA Corp.
www.automatedqa.com/support
368
AQtime Reference
To determine if class instances were existing in memory at the moment of results generation, check the
Live Count column value. If it is greater than 0, class instances existed. If you profile an unmanaged
application and obtain results upon closing the application, non-zero values in the Live Count column help you
find memory leaks. To find them quicker, you can sort or filter results on the Live Count column.
The footer of the Report panel column holds summary values for data displayed in that column. For
instance, the footer of the Live Size column displays the summary size of all class instances that existed in
memory at the moment of results generation. If you select two or more classes in the Report panel, the footer
will show the summary values for the selected classes only (for more information on how to select several rows
in a panel, see Selecting Several Records in a Panel).
Objects Category
When this category is selected, the Report panel displays information about class instances (objects) and
memory blocks that exist in the application at the moment the results are generated. Every row in the panel
holds results for a single object or a memory block. The Object Name column serves as the identifier of the
object or memory block. For instance, the name String.5 means the fifth String object created after profiling
started. For memory blocks this column holds values like C++ native memory.4 or VCL native memory.10.
These mean the 4th memory block allocated with a C++ operator (for example, new) or 10th memory block
allocated with a VCL memory management routine (for example, GetMem).
When the Check Memory Bounds option is enabled the panel could contain information about memory
operations outside of the allocated memory block. In this case the Object Name column holds a value like
Memory Overwrite Error.15. This means that some data was written to addresses above the upper or below the
lower bound of the 15th allocated memory block.
To view all objects of a certain class, filter results on the Class Name column (See Filtering Results).
To locate the approximate line of code where the error occurred, switch to the Creation Call Stack page in
the Details panel. For Memory Overwrite Errors this page may be empty (see Checking Bounds of Memory
Blocks).
The Report panel columns are completely described in a separate topic, Allocation Profiler - Report Panel
Columns. Here we would like you to pay attention to the Get # column. It displays the ordinal number of the
Get Results during the Allocation profiler run, you get
result set within a run. For instance, if you pressed
two result sets: one that was generated upon pressing that button and another one that were generated upon
closing the profiled application. In the first result set, in all records the Get # column will hold 1; in the second
result set this column will hold 2. You can use these values for comparison purposes. For instance, when you
compare two result sets, the column will clearly tell you what objects were created or deleted between the two
moments of results generation.
The Report panel is the «main» results display for objects. The Details, Call Graph and Call Tree panels
display additional results for the object selected in the Report panel.
Note: The Allocation profiler traces and displays references to managed objects only. If you select an
unmanaged object in the Report panel, the Call Graph and Call Tree panels will display only the
selected object, without any links to other objects.
The Details panel holds three tabbed pages: Creation Call Stack, References From and References To.
You can arrange all three pages within the Details panel as you desire. For more information on this, see the
description of the Details panel.
•
The contents of the Creation Call Stack page depends on the type of the selected row in the
Report panel:
If the row corresponds to an object, then the page displays the stack of function calls that
led to the object creation. The topmost routine in this stack is the one that created the
www.automatedqa.com
AQtime by AutomatedQA Corporation
Profilers
369
object. Columns of the Creation Call Stack page hold information that helps you locate the
routine in source code. To view the source code of a routine, simply double-click it in the
call stack - AQtime will bring up the Editor panel and position the cursor on the routine’s
code in it. The source file of the routine must be specified in the Project Search
Directories. In addition, to view sources of your managed applications in the Editor, you
should compile the application with debug information. See How AQtime Profilers Use
Metadata and Debug Information.
If the row corresponds to the Memory Overwrite Error, then the call stack shows the
sequence of function calls that led to the error detection. Errors with the memory block
bounds are found only when the corresponding memory block is released or reallocated,
when the application terminates or when the Get Results command is executed. The
contents of the call stack depends on the situation when the error was detected. If the error
was detected when a corrupted block was deleted or reallocated, the call stack for the
Memory Overwrite Error will hold function calls that led to the error detection, but not to
the error appearance. If the error was detected when the application terminates or when the
Get Results command is executed, the call stack will be empty. See Checking Bounds of
Memory Blocks.
The Creation Call Stack is available, if the profiler’s Collect stack information option is set to By
routines or By lines. To disable the call stack tracing, set this option to None.
Note that sometimes the call stack may not display some information for Visual C++, Delphi or
C++Builder modules. For instance, there may be no information about source files. This happens
because AQtime cannot find this information in debug info. To get a more detailed call stack, you
may need to recompile your application or add certain dynamic link libraries to the Setup panel.
For more information on this, see Allocation Profiler - Analyzing Visual C++ Applications,
Allocation Profiler - Analyzing Delphi Applications and Allocation Profiler - Analyzing
C++Builder Applications.
•
The References To page shows the list of objects to which the object selected in the Report panel
refers. The References From page lists objects that refer to the object selected in the Report panel.
The columns on these pages are the same as the ones in the Report panel. To view detailed
information on an object, double-click it on the page. AQtime will update its panels so that they
will display information relative to the new selected object.
Note: The References To and References From pages are used for analysis of managed
objects only. If you selected an unmanaged object in the Report panel, these pages will
display no references.
The Call Graph panel displays the hierarchy of object references. You can travel up and down this
hierarchy by clicking the desired object.
© 2010 AutomatedQA Corp.
www.automatedqa.com/support
370
AQtime Reference
The Call Graph Contents for the Allocation Profiler (AQtime Standalone)
www.automatedqa.com
AQtime by AutomatedQA Corporation
Profilers
371
The Call Graph Contents for the Allocation Profiler (AQtime Integrated into Microsoft Visual Studio)
© 2010 AutomatedQA Corp.
www.automatedqa.com/support
372
AQtime Reference
The Call Graph Contents for the Allocation Profiler (AQtime Integrated into Embarcadero RAD Studio)
The Call Tree panel also displays the hierarchy of object references. This panel holds two pages:
References To and References From. The columns in these pages are similar to the Report panel columns:
www.automatedqa.com
AQtime by AutomatedQA Corporation
Profilers
373
The Call Graph Contents for the Allocation Profiler (AQtime Standalone)
© 2010 AutomatedQA Corp.
www.automatedqa.com/support
374
AQtime Reference
The Call Graph Contents for the Allocation Profiler (AQtime Integrated into Microsoft Visual Studio)
www.automatedqa.com
AQtime by AutomatedQA Corporation
Profilers
375
The Call Graph Contents for the Allocation Profiler (AQtime Integrated into Embarcadero RAD Studio)
Allocation Profiler - Report Panel Columns
When you view results of the Allocation profiler, the Report panel contents depend on the currently
selected category in the Explorer panel (see description of the Allocation profiler) -Classes Category
Objects Category
Classes Category
When this category is active, the Report panel shows information about classes, whose instances were
created, and about memory blocks that were allocated after the profiling started. The panel holds the following
columns:
Columns (in alphabetical order)
Class Name
© 2010 AutomatedQA Corp.
Description
Name of the class. For memory blocks that were allocated via C++’s,
Delphi’s or VB’s memory management routines and statements, the
Class Name column holds the C++ native memory, VCL native memory
or VB native memory value. This column may also contain the Memory
www.automatedqa.com/support
376
AQtime Reference
Columns (in alphabetical order)
Description
Overwrite Error value. It indicates that the profiler detected that the
application code violated bounds of memory blocks that were allocated
during the application execution. See Checking Bounds of Memory
Blocks With the Allocation Profiler for more information.
Finalizable
Specifies whether the class overrides the Finalize method (C# and
VC++.NET use the destructor syntax for Finalize). This column is
used only for classes defined in managed modules.
Live Count
Number of instances (objects) that currently exist in memory. For the
C++ native memory, VCL native memory and VB native memory classes
this column holds the number of allocated memory blocks that currently
exist in memory. For the Memory Overwrite Error row, the column
value specifies the number of memory block violations detected.
A non-zero value in the Live Count column may indicate memory leaks.
See Searching for Memory Leaks and Analyzing Allocation Profiler
Results.
Live Size
The size of currently existing class instances or memory blocks (in
bytes). Note that the amount of allocated memory shown in AQtime may
differ from the amount of memory shown for your application in the
Task Manager. See a note about this in the description of the Allocation
Profiler. For the Memory Overwrite Error row, the column value
specifies the size of all memory blocks, whose bounds were violated.
A non-zero value in the Live Size column may indicate memory leaks.
See Searching for Memory Leaks and Analyzing Allocation Profiler
Results.
Module Name
Name of the module, where the class is defined. For the C++ native
memory, VCL native memory and VB native memory classes, this column
holds the name of the module from which the corresponding C++, VCL
or VB memory management routines were called.
Namespace
Namespace that holds the class. This column is used only for classes
defined in managed modules.
Peak Created
Maximum number of concurrent instances reached during the run. For
the C++ native memory, VCL native memory and VB native memory
classes this column holds the maximum number of allocated memory
blocks that concurrently existed during the run.
Peak Size
Maximum size of concurrent instances reached during the run (in bytes).
For the C++ native memory, VCL native memory and VB native memory
classes this column holds the maximum size of allocated memory blocks
that concurrently existed during the run.
Token
Token of the class. This column is used for classes defined in managed
modules only.
www.automatedqa.com
AQtime by AutomatedQA Corporation
Profilers
Columns (in alphabetical order)
377
Description
Total Created
Total number of class instances (memory blocks) that were created
(allocated) during the application run. For the Memory Overwrite Error
row, the column value coincides with the Live Count column value.
Total Size
Memory needed for all the instances (memory blocks) that were created
(allocated) during the run. For the Memory Overwrite Error row, the
column value coincides with the Live Size column value.
Objects Category
When this category is active, the Report panel displays information about objects that were created and
about memory blocks that were allocated after the profiling started. The panel holds the following columns:
Columns (in alphabetical order)
Description
#
The creation number of the given object or memory block.
Class Name
The name of the object’s class. For memory blocks, this column contains
the C++ native memory, VCL native memory or the VB native memory
value depending on what memory management routines were used to
allocate the block. This column may also contain the Memory Overwrite
Error value. It indicates that the profiler detected that the application
code violated bounds of memory blocks that were allocated during the
application execution. See Checking Bounds of Memory Blocks With the
Allocation Profiler for more information.
Get #
The ordinal number of the Get Results command that generated the
Get Results two
current results set. For instance, if you pressed
times during the profiler run, you will get three result sets (the third will
be generated after the application closes) with numbers 1, 2 and 3. The
Get # value in all records of the first result set will hold 1; in the second
result set this column will hold 2 and in the third result set the column
will hold 3.
The Get # column is used for comparison purposes. It lets you easily see
which objects were created or deleted between two result generations.
Object Name
The object name. It is formed as Class Name + period + number. For
example, TestClass.3 means the third TestClass object that was
created after the profiling started. Memory blocks and memory violation
results are named using the same principle.
References From
The number of objects that refer to the given object. This column is used
only for objects in managed applications.
References To
The number of objects to which the given object refers. This column is
used only for objects in managed applications.
Root
This column is used for objects of managed applications only. If Root is
checked, the object is referred to by an existing global or local variable
or by a function parameter. If Root is unchecked, the object is referred to
© 2010 AutomatedQA Corp.
www.automatedqa.com/support
378
AQtime Reference
Columns (in alphabetical order)
Description
by a property of another object’s field.
Size
Size of the object or memory block in bytes. For the Memory Overwrite
Error row, the column displays the size of the block, whose bounds were
violated.
Thread
Specifies the thread where the object’s constructor was called (where the
allocation routine of the memory block was called).
Allocation Profiler - Columns of the Details and Call Tree Panels
When you review the Allocation profiler results, the Report panel displays information on classes, objects
and memory blocks that existed in memory at the moment of results generation (see Allocation Profiler Overview). The results that are shown in the Report, Details, Call Graph and Call Tree panels depend on the
category selected in the Explorer panel. If the Objects category is selected, the Report panel displays results
for objects and detected memory block violations.
If you select a violation row in the Report panel, the Details panel will display the stack of function calls
for this violation. You can find information on call stack columns below.
Note: The profiler detected violations of memory block bounds when the block is deleted or reallocated,
when the application terminates or when the Get Results command is executed. If the profiler
detected corrupted memory blocks when this block is deleted or reallocated, the call stack will
display the sequence of function calls that led to the block deletion or reallocation. If the profiler
detected the violations of memory block bounds when the application is terminated or when the
Get Results command is executed, then the call stack will be empty. See Checking Bounds of
Memory Blocks.
If you select a Report panel row that corresponds to an object, the Allocation profiler displays information
about object references in the Details and Call Tree panels. Both panels contain the References From and
References To panes. The References From pane lists all objects that refer to the currently selected object. The
References To pane shows objects, to which the selected object refers. (The panes do not display information if
you have selected a Report panel row that corresponds to a memory block violation).
The Allocation profiler traces references to managed objects only. If you select an unmanaged
object in the Report panel, the Call Tree panel and the References To and References From pages of
the Details panel will display only the selected object, without any links to other objects.
The information about object references is shown in grids that hold the following columns (both Call Tree
and Details have the same set of columns):
Columns (in alphabetical order)
Description
#
The creation number of the object.
Class Name
The name of the object’s class.
Count
The number of references to/from the object (for instance, if object A
that is displayed in the Report panel holds two references to object B,
the Count column of the References To table will hold 2 for the object
www.automatedqa.com
AQtime by AutomatedQA Corporation
Profilers
379
Columns (in alphabetical order)
Description
B).
Object Name
The object name. It is formed as Class Name + period + number. For
example, TestClass.3 means the third TestClass object that was
created after the profiling started.
Root
If Root is checked, the object is referred to by an existing global or local
variable or by a function parameter. If Root is unchecked, the object is
referred to by a property of another object’s field.
Size
The object’s size in bytes.
Thread
Specifies the thread where the object’s constructor was called.
If the Objects category is selected in the Explorer panel, the Details panel also includes the Creation Call
Stack pane. It displays the stack of function calls that led to creation of the object selected in the Report panel.
The routine that created the object is at the top of the call stack. This information is shown in the grid that has
the following columns:
Columns (in alphabetical order)
Description
Class Name
Name of the object class that holds the routine.
Module Name
Name of the module that holds the routine.
Routine Name
Name of the routine.
Source File
Name of the source file for the routine. The values for this column are
read from the application’s debug info. If debug info does not contain
information on the file name, the column is empty.
Source Line
Source file’s line number where the routine’s implementation begins.
The values for this column are read from the application’s debug info.
Allocation Profiler Options
The Allocation profiler includes two groups of customizable options:
•
One group contains options that affect the current result display. When you change these options,
AQtime refreshes the data in its panels.
•
Another group includes options that have effect on the profiler functioning. Changes in these
options will only apply to future profiler runs.
To modify options that affect the result display, use items of the Profiler toolbar. On the toolbar, the
following items are available:
•
Show all loaded classes - If this item is pressed, profiling results include all the classes being
profiled. Otherwise, the results include only the classes whose instances had been created by the
moment the results were generated. This option also affects the class results that are displayed in
the Monitor panel for the Allocation profiler. See Using the Monitor Panel With the Allocation
Profiler.
© 2010 AutomatedQA Corp.
www.automatedqa.com/support
380
AQtime Reference
•
Filter standard leaks - If your application includes code written using MFC, VCL or other
libraries, there will be inevitable memory leaks due to errors in the imported library code. Using
the Filter standard leaks item can hide these leaks from profiling results. If the item is pressed,
AQtime excludes known memory leaks that were produced by third-party software from the
profiling results. This helps you concentrate on the inaccuracies of your code and don't take in
account memory problems of IDE compilers, VCL components, Microsoft Foundation Classes
and
others.
A
list
of
known
memory
leaks
is
available
at
http://www.automatedqa.com/products/aqtime/leaks/.
•
View project classes only - If this item is pressed, AQtime only displays profiling results for
those modules that are added to the Setup panel. Otherwise, it displays the results for all modules
used by the profiled application.
This filter applies both to Classes Data and Objects categories.
•
Filter objects by stack - If this item is pressed, AQtime only anylizes the object’s creation call
stack and displays results for objects that were created directly by any of the modules listed in the
Setup panel. Otherwise it displays results for all objects that existed when the results were
generated.
This filter applies only to Objects category.
•
Show routines with class names - If this item is pressed, the Routine Name column of the
Details panel for the Allocation profiler displays the name of the given routine along with the
name of the class the routine belongs to. Otherwise, this column displays only the routine name.
•
File names with path - If this item is pressed, the Source File and Module Name columns of
the Report, Details, Call Tree and Monitor panels for the Allocation profiler hold the entire path
of the given file. Otherwise, these columns hold the file name only.
To modify options that have effect on the way the profiler functions, do any of the following:
•
•
AQtime standalone:
Select Options | Options from AQtime’s main menu and then choose the Profilers |
Allocation | Allocation Profiler group in the ensuing Options dialog.
Press Configure Current Profiler on the Standard toolbar when the Allocation profiler is
selected.
AQtime integrated into Microsoft Visual Studio:
•
Select Tools | Options from Visual Studio’s main menu and then select the AQtime |
Profilers | Allocation | Allocation Profiler group in the ensuing Options dialog.
AQtime integrated into Embarcadero RAD Studio:
Select AQtime | Options from RAD Studio’s main menu and then choose the Profilers |
Allocation | Allocation Profiler group in the ensuing Options dialog.
Options include:
•
Check system memory allocations - If this option is selected, AQtime traces calls to system
memory management functions. Otherwise, it only traces calls to functions of the runtime memory
manager. See Tracing System Memory Management Functions.
•
Check memory bounds - If this option is checked, AQtime traces whether the profiled
application writes to memory below or above the allocated bounds of a memory block and whether
it releases the allocated memory correctly. For more information, see Checking Bounds of Memory
Blocks With the Allocation Profiler.
www.automatedqa.com
AQtime by AutomatedQA Corporation
Profilers
381
Note that if the Check memory bounds option is enabled then the Clear Results command is
disabled. This means you cannot remove the accumulated profiling results during profiling.
•
Fill released memory blocks - Specifies whether to overwrite the data stored in the released
blocks. The actual data is replaced with the 0xDD values. This helps to reveal situations when the
data is still read from the block that has already been freed. See the Tracing Attempts to Access
Released Memory topic for details.
•
Collect stack information - Specifies how the profiler should collect information on call stacks
when creating objects. The following values are available: None, By routines and By lines. Tracing
the call stack can significantly slow down the profiled application. If you are only interested in
objects (how many of them exist, their size, etc.), you can set this option to None. By routines
means that the call stack entries will include information about routines only. If you want the call
stack entries to include information on source line numbers as well, set the option to By lines. This
will let you, for example, determine from which source line a function was called. Tracing source
lines, however, requires time.
•
Thread model - Specifies which thread model AQtime uses to trace the call stack for functions
that allocate memory blocks. For more information on supported values, see Profiling Multiple
Threads and Profiling COM Logical Threads.
© 2010 AutomatedQA Corp.
www.automatedqa.com/support
382
AQtime Reference
BDE SQL Profiler
The topics of this section provide information about the BDE SQL profiler:
BDE SQL Profiler - Overview
Description of the Report Panel Columns
Description of the Details Panel Columns
BDE SQL Profiler Options
Also, you can find additional information on the BDE SQL profiler in the following tutorial:
BDE SQL Profiler Tutorial
BDE SQL Profiler - Overview
The BDE SQL profiler lets you measure and log the execution time of SQL queries or SQL stored
procedures called through the Borland Database Engine (BDE). This topic provides the BDE SQL profiler
overview and describes the profiler results. The profiler description contains the following topics:
Overview (this topic)
Description of Profiler Results (this topic)
Description of the Report Panel Columns
Description of the Details Panel Columns
BDE SQL Profiler Options
BDE SQL Profiler Tutorial
BDE SQL Profiler - Overview
The execution speed of an SQL database application depends directly on the speed of SQL queries. The
BDE SQL profiler times the execution of SQL queries and SQL stored procedures when commanded through
the Borland Database Engine.
The BDE SQL profiler works with applications compiled with Borland Delphi v. 3 - 7, 2005 - 2007 and
C++Builder v. 3 - 6, 2006. It tracks calls to the CreateCursor and Prepare methods of the TQuery object
and calls to the ExecProc and Prepare methods of the TStoredProc object (CreateCursor is called from
the Open and ExecSQL methods).
The profiler does not support BDE.NET components. It ignores queries that are performed through
BDE.NET and does not display information about them in the profiling results.
Note: If you use a computer that has several processors or a multiple-core processor (for example,
dual-core CPU) and has Windows XP Service Pack 2, then you must install the Windows
update #896256 in order for the profiler to be able to time your application correctly. The update
is available on Microsoft’s web site:
http://support.microsoft.com/kb/896256
BDE SQL Profiler - Description of Profiler Results
Brief results of the BDE SQL profiler are displayed in the Summary panel. It shows the total number of
executed SQL queries and the worst performing queries. Information on individual SQL queries is displayed in
the Report panel.
Here is an example of the BDE SQL profiler output:
www.automatedqa.com
AQtime by AutomatedQA Corporation
Profilers
383
BDE SQL Profiler Output (AQtime Standalone)
© 2010 AutomatedQA Corp.
www.automatedqa.com/support
384
AQtime Reference
BDE SQL Profiler Output (AQtime Integrated into Microsoft Visual Studio)
www.automatedqa.com
AQtime by AutomatedQA Corporation
Profilers
385
BDE SQL Profiler Output (AQtime Integrated into Embarcadero RAD Studio)
As you can see, each row of the Report panel contains the results of the ExecSQL, ExecProc or Prepare
method execution. The panel columns indicate the class name and the name of the query or stored procedure, a
SQL expression and other information. To obtain the execution time of a query or stored procedure, view the
Time column. For complete information on the Report panel columns, see BDE SQL Profiler - Report Panel
Columns.
Note that by default, the BDE SQL profiler shows all available columns of the Report panel. You can
remove, add and arrange the columns in the panel. For more information, see the Adding and Removing
Columns and Arranging Columns, Lines and Panels topics.
Each row in the Report panel corresponds to a single SQL query in your application. Clicking on a query in
the Report panel will update the contents of the Details panel, so it will display information concerning that
query.
The Detail panel contains the Call Stack pane that displays the sequence of functions that call the BDE
operation currently selected in the Report panel.
The complete code of the selected query (in addition to the SQL Expression column of the Report panel) is
shown in the SQL Query Text pane on the right.
Double-clicking a row in the Details table will move the cursor in the Editor panel to the source code line
for the compliance routine (the path to the source files must be specified in the Project Search Directories and
Search Directory dialogs).
If you use an integrated version of AQtime, double-clicking a row in the Details table will move the cursor
in the page that contains the source code, to the source line of the compliance routine.
© 2010 AutomatedQA Corp.
www.automatedqa.com/support
386
AQtime Reference
BDE SQL Results That Accompany the Source Code (AQtime Standalone)
www.automatedqa.com
AQtime by AutomatedQA Corporation
Profilers
387
BDE SQL Results That Accompany the Source Code (AQtime Integrated into Microsoft Visual Studio)
© 2010 AutomatedQA Corp.
www.automatedqa.com/support
388
AQtime Reference
BDE SQL Results That Accompany the Source Code (AQtime Integrated into Embarcadero RAD Studio)
BDE SQL Profiler - Report Panel Columns
When you review the BDE SQL profiler results, the Report panel contains the following columns:
Columns (in alphabetical order)
Description
#
The ordinal number of the query or stored procedure.
Class Name
The class name of the query or stored procedure. Normally, this is
TQuery or TStoredProc.
Object Name
The name of the object that represents the query or stored procedure.
Operation Type
The type of database operation. This can be one of the following:
SQL Expression
www.automatedqa.com
•
TQuery.CreateCursor (this operation is performed within the
TQuery Open or ExecSQL methods)
•
TQuery.Prepare
•
TStoredProc.ExecProc
•
TStoredProc.Prepare
The code of the executed SQL query. This field is empty for stored
procedures.
AQtime by AutomatedQA Corporation
Profilers
389
Columns (in alphabetical order)
Description
Time
The execution time of the query or stored procedure. This does not
include the data fetch time.
By default, the BDE SQL profiler shows all of these columns in the Report panel. You can remove
columns from or add them to the Report panel. For more information, see the Adding and Removing Columns
topic.
BDE SQL Profiler - Details Panel Columns
When the BDE SQL profiler displays profiling results, each row of the Report panel contains the results of
a database operation execution. The BDE SQL profiler uses the Details panel to display information on calls to
BDE operations. The Detail panel contains the Call Stack pane that displays the sequence of functions that call
the BDE operation currently selected in the Report panel. Each line below shows the caller of the line above it.
The Call Stack table contains the following columns:
Columns (in alphabetical order)
Description
Class Name
The name of the class to which the routine belongs.
Hit Count
The number of times the routine was called during the profiler run.
Module Name
The name of the executable module that contains the routine.
Routine Name
The name of the routine that lead to the selected BDE operation.
Source File
The name of the routine’s source file. The values for this column are read
from the application’s debug info.
Source Line
The number of the source file’s line where the routine’s implementation
begins.
On the right of the Details panel there is an SQL Query Text pane that displays the complete code of the
query, selected in the Report panel. It can be useful because SQL queries can sometimes have long code that
can not be fully displayed in the SQL Expression column of the Report panel.
BDE SQL Profiler Options
The BDE SQL profiler includes two groups of customizable options:
•
One group holds options that affect the currently displayed results. If you change any of these
options, the data contained in AQtime’s panels will be refreshed.
•
Another group contains options that affect how the profiler works. If you change these options, the
changes will affect future profiler runs.
Options that modify the displayed results correspond to the items of the Profiler toolbar. You can display
this toolbar by right-clicking somewhere within the toolbar and selecting Profiler from the popup list. The
following items are located on the toolbar:
•
Counter unit - The Counter unit item lets you specify the unit of measurement for the time
columns in the AQtime panel. Seconds, Milliseconds, Microseconds and Machine Cycles are
available values that you can set.
© 2010 AutomatedQA Corp.
www.automatedqa.com/support
390
AQtime Reference
•
Show routines with class names - If this option is enabled, the Routine Name column of the
BDE SQL profiler's Details panel holds both the class name and the routine name. Otherwise, this
column only holds the routine name.
•
File names with path - If this option is enabled, the Module Name column of the BDE SQL
profiler’s Details panel holds the entire path to the given file. Otherwise, this column only holds
the file name.
To modify options that affect the profiler functioning, do any of the following:
•
•
AQtime standalone:
Select Options | Options from AQtime’s main menu and then choose Profilers |
Performance | BDE SQL Profiler from the tree view on the left of the Options dialog.
Configure Current Profiler on the Standard toolbar when the BDE SQL
Press
profiler is selected.
AQtime integrated into Microsoft Visual Studio:
•
Select Tools | Options from Visual Studio’s main menu and then choose AQtime |
Profilers | Performance | BDE SQL Profiler from the tree view on the left of the
ensuing Options dialog.
AQtime integrated into Embarcadero RAD Studio:
Select AQtime | Options from RAD Studio’s main menu and then choose Profilers |
Performance | BDE SQL Profiler from the tree view on the left of the Options dialog.
There is only one option in this group:
●
Thread model - Specifies how the BDE SQL profiler gathers data for threads in the profiled
application. For more information on the available values for this option, see Profiling Multiple
Threads.
www.automatedqa.com
AQtime by AutomatedQA Corporation
Profilers
391
Coverage Profiler
The topics of this section provide information about the Coverage profiler:
Coverage Profiler - Overview
Description of the Report Panel Columns
Description of the Details Panel Columns
Coverage Profiler Options
Coverage Profiler - Overview
The Coverage profiler lets you determine whether a routine or a line was executed during the profiler run
and how many times it was executed. This topic provides the Coverage profiler overview and describes the
profiling results. The complete profiler description includes the following sections:
Overview (this topic)
Description of Profiler Results (this topic)
Description of the Report Panel Columns
Description of the Details Panel Columns
Coverage Profiler Options
Coverage Profiler Tutorial
Overview
The Coverage profiler tracks one thing: whether a routine or a line was called during the run. This lets you
keep track of untested code as testing progresses over time. It may also let you find unnecessary code that you
can remove, once you see that the method or line remains unexecuted under all possible conditions.
The Coverage profiler analyzes the application code (32-bit and 64-bit) at two levels of detail: routine and
line. To profile the lines of a routine, you should simply add this routine to a line-level area (see Profiling
Levels). Note that to profile managed routines at line level, you have to compile the application with debug
information. See How AQtime Profilers Use Metadata and Debug Information. If you need to track all lines
covered or not covered, begin by using the Coverage profiler on the Full Check area. This will let you focus on
the problem files first, and then you can narrow the analysis to these files and use the Coverage profiler with
them to drill down further.
The Coverage profiler also supports triggers and actions. They allow you to turn the profiling on or off
exactly when it is needed during the application run. For more information, see Using Triggers and Using
Actions.
After you have run Coverage several times, you can merge profiling results to get mass statistics. Merging
Merge item) or done
can be executed directly from the context menu of the Explorer panel (using the
automatically in the background after each profiling run (using the Auto-merge option of the Explorer panel).
You can also compare results of several Coverage runs in order to see the changes. For more information on
comparison and merge of results, see Comparing and Merging Results.
The Coverage profiler can collect results for Windows, CLR or COM threads. The profiler includes the
Thread model option that specifies how the profiler gathers statistics for threads in the profiled application. For
more information on this, see Profiling Multiple Threads. You can change the option by using Coverage
Profiler Options dialog or by using the Run Settings dialog that is shown upon starting the profiler run.
Coverage Profiler - Description of Profiler Results
© 2010 AutomatedQA Corp.
www.automatedqa.com/support
392
AQtime Reference
Brief results of the Coverage profiler are displayed in the Summary panel. It shows ten routines that were
called most often than other routines and ten routines that were covered less than other application routines.
Information for individual application routines, source files and modules are displayed in the Report panel.
Here is an example of a Coverage profiler output:
Sample Coverage Profiler Output (AQtime Standalone)
www.automatedqa.com
AQtime by AutomatedQA Corporation
Profilers
393
Sample Coverage Profiler Output (AQtime Integrated into Microsoft Visual Studio)
© 2010 AutomatedQA Corp.
www.automatedqa.com/support
394
AQtime Reference
Sample Coverage Profiler Output (AQtime Integrated into Borland Develoepr Studio)
As you can see, the results are organized into three categories:
•
Routines
•
Source Files
•
Modules
The Source Files and Modules categories let you view summary profiling results for each source file and
module in your application. The Routines category contains results for each single routine that was included in
profiling tasks.
Within the categories the results are grouped by thread. There is also the All threads group that show
profiling results for all threads.
To view profiling results, choose the desired thread in the Explorer panel or select the All threads node and
switch to the Report panel. You can also select the desired category and thread from the Result Items box on
the Standard toolbar:
www.automatedqa.com
AQtime by AutomatedQA Corporation
Profilers
395
After you chose the desired category, AQtime will update the Report panel. The contents of this panel
depend on the currently selected category:
•
If you select the Routines category, the Report panel will display profiling results one routine per
line. Line coverage results will be shown in the Lines page of the Details panel and in the Editor’s
grid.
We would like to note that to profile code at line level, you should add the desired routines,
classes, files or modules to a line-level profiling area (see Profiling Levels). Also, to profile
managed routines at line level, you have to compile the application with debug information (see
How AQtime Profilers Use Metadata and Debug Information).
•
If you select the Source Files category, each row in the Report panel will show profiling results for
a source file. The Editor panel will display the source code of the selected file. The Details panel
will not be used.
•
If you select the Modules category, each row in the Report panel will display profiling results for
one module. The Details and Editor panels will not be used.
The following sections of this topic provides more detailed information about the panels.
Coverage Profiler Results - Report Panel
The Report panel displays profiling results according to the category and thread selected in the Explorer
panel or in the Result Items box on the Standard toolbar. The Hit Count column helps you quickly see which
routines were executed. If a routine was not called during the profiler run, the Hit Count column holds 0.
Otherwise, it shows how many times the routine was called. You can also use the Lines Covered, Lines
Uncovered, Total Lines and % Covered columns to identify untested code. For instance, if the function
includes a large number of lines, of which only a small percentage were executed during a seemingly
«complete» test for the function, you might want to examine the function’s algorithm. Of course, AQtime
gathers line coverage statistics for those routines that were added to line-level profiling areas. If a routine was
profiled at routine level, % Covered is either 100%, or 0%.
You can quickly filter out the routines whose source code lines were covered partially (less than a
particular percentage). To do this, use the predefined result views Routines covered less than %nn. On the other
hand, using the Unexecuted routines only predefined view, you can display the routines that were not executed
at all. To select these views, do the following:
•
•
AQtime standalone:
Select any of these views from the Result Views dropdown list on the Standard toolbar.
Select any of these views from the View | Result View menu.
AQtime integrated into Microsoft Visual Studio:
© 2010 AutomatedQA Corp.
www.automatedqa.com/support
396
AQtime Reference
•
Select the views from the Result Views dialog. To display the dialog, select AQtime |
Result Views from the Visual Studio’s menu.
AQtime integrated into Embarcadero RAD Studio:
Select the views from the Result Views dialog. To display the dialog, click Result Views
on RAD Studio’s View toolbar.
See Result Views.
The Mark column graphically represents the Coverage result. It holds green dots for those routines that
were executed during the profiler run and red dots for those routines that were not executed. If a routine was
partially executed, the Mark column shows a yellow dot. For complete information on columns, see Coverage
Profiler - Report Panel Columns.
The summary value of the Lines Covered and % Covered columns display the total number of covered
lines and coverage percentage. To find the percent of covered lines in a class, unit or source file, simply group
results in the Report panel by the Class Name, Unit Name or Source File columns. The group summary will
display the coverage results for each class, unit or source file:
Grouped Results in the Report Panel (AQtime Standalone)
www.automatedqa.com
AQtime by AutomatedQA Corporation
Profilers
397
Grouped Results in the Report Panel (AQtime Integrated into Microsoft Visual Studio)
© 2010 AutomatedQA Corp.
www.automatedqa.com/support
398
AQtime Reference
Grouped Results in the Report Panel (AQtime Integrated into Embarcadero RAD Studio)
The column footer shows summary results for the values displayed in that column. You can customize the
summary type and summary format using the Format Columns Dialog. For instance, you can select one of the
five summary types (Sum, Count, Avg, Min, Max) or you can hide the summary for the column.
Note that by default the Report panel shows only a shred of available columns. You can easily add more
columns to the panel. For more information on this, see Adding and Removing Columns. You can arrange the
columns in the panel as you desire: move columns, change column width, etc. For more information on this,
see Arranging Columns, Lines and Panels.
Note that sometimes results of script profiling may contain duplicated items in the Report panel for some
script routines (this may happen due to some specifics of the script engine's and the Coverage profiler's
functioning). To learn how you can solve this problem, see Profiling Scripts - Troubleshooting.The Profiler
toolbar contains items that allow you to modify the results that are currently being displayed as your needs
dictate. For example, the
Show non-hit routines toolbar item lets you easily include or exclude
non-executed routines from the result display. For more information on the toolbar items, see Coverage
Profiler Options.
Coverage Profiler Results - Details and Editor Panels
The Details and Editor panels display profiling results if you select the Routines category. When this
category is active, each row in the Report panel corresponds to a single routine in your application.
Double-clicking on a routine in the Report panel will update the contents of the Details and Editor panels so
they will display information concerning that routine.
The Lines page of the Details panel holds line coverage profiling results. Each row in this page
corresponds to a source code line. You can work with rows on the Lines page in the same manner as you work
www.automatedqa.com
AQtime by AutomatedQA Corporation
Profilers
399
with rows in the Report panel. For more information on the Details panel columns, see Coverage Profiler Details Panel Columns. The chart on the left of the Details grid graphically illustrates profiling results:
Line Coverage Details (AQtime Standalone)
© 2010 AutomatedQA Corp.
www.automatedqa.com/support
400
AQtime Reference
Line Coverage Details (AQtime Integrated into Microsoft Visual Studio)
www.automatedqa.com
AQtime by AutomatedQA Corporation
Profilers
401
Line Coverage Details (AQtime Integrated into Embarcadero RAD Studio)
Note: Some source code lines are compiled into several blocks of binary code; typical examples are
branch statements like if...then or switch...case. You can see the total number of blocks
that constitute a source code line in the Block Count column of the Details panel. Since the code
coverage is performed on the compiled code, these lines are considered completely executed only
if all of the corresponding compiled code blocks were executed. If not all of the blocks were
covered during profiling, these lines are reported as partially executed.
For example, consider the following Delphi code:
if (a < b) or (c > d) then DoSomething;
This line can be split into three blocks: 1) the a < b condition, 2) the c > d condition and 3) call
to DoSomething. Now suppose that the a < b expression evaluates to True and thus triggers the
DoSomething routine call. The resulting coverage for the source code line depends on whether
the code uses short-circuit or long-circuit expression evaluation. By default, the Delphi compiler
generates code for short-circuit expression evaluation, so the c > d expression is not evaluated
and that is why the line will be reported as partially executed. But if the code is generated with
long-circuit (complete) evaluation, the c > d expression is forced to be evaluated, and in this case
the line is fully covered.
Another example of an operation that is split by the compiler into several blocks, and which is
rather frequent, is Delphi’s div operation that performs integer division. The Delphi compiler
breaks this instruction into several blocks when the divisor is a power of 2.
Note that for lines that constiture several blocks in the compiled code, the Hit Count value
indicates the total hit count for all blocks corresponding to the line. For example, consider the
© 2010 AutomatedQA Corp.
www.automatedqa.com/support
402
AQtime Reference
following C++ code with a switch statement:
[C++]
switch (Param)
{
case 1:
DoActionA();
break;
case 2:
DoActionB();
break;
case 3:
DoActionC();
break;
}
The compiler would typically generate four blocks for the switch (Param) line, which are
equivalent to the following code:
[C++]
if (Param == 1) goto label1;
if (Param == 2) goto label2;
if (Param == 3) goto label3;
goto label4;
Suppose this code is initially executed with the Param value of 1. In this case, only the first branch
is executed so that the hit count for the switch (Param) line becomes 1. If the same code is then
executed with the Param value of 3, the three branch blocks are touched in order, and therefore the
hit count is incremented by 3. This way, the resulting hit count for the switch (Param) line is 4
(rather than 2 as one would expect) as this is the number of hits for compiled code blocks
corresponding to that line. You can see this on the image below.
The Coverage profiler includes the Mark partially executed lines as option that specifies how AQtime
treats partially executed lines when it’s calculating the Lines Covered, Lines Uncovered and % Covered values
and how AQtime marks such lines (with a red, green or a yellow dot) in the Lines page of the Details panel and
in the Editor (see below). This option can have one of the three following values:
Value
Description
Partially
executed
AQtime marks partially executed lines with yellow dots and treats them as unexecuted
when calculating the Lines Covered and Lines Uncovered columns.
Completely
executed
AQtime marks partially executed lines with green dots and treats them as executed.
Non-executed
AQtime marks partially executed lines with red dots and treats them as unexecuted.
Double-clicking a row in the Details grid will move the cursor in the Editor panel to the source code line
for which that row displays results. If a routine was profiled at line level, the Editor’s grid will show the same
results as the ones shown in the Details panel. For instance, you will find that the executed function and lines
are marked with green dots and the unexecuted routines and line have red dots. Partially executed routines and
www.automatedqa.com
AQtime by AutomatedQA Corporation
Profilers
403
lines are marked with yellow dots. To select which columns to display in the gutter, use the Field Chooser
window. To bring it up, select Field Chooser from the context menu. See Adding and Removing Columns.
Coverage Results That Accompany the Source Code (AQtime Standalone)
© 2010 AutomatedQA Corp.
www.automatedqa.com/support
404
AQtime Reference
Coverage Results That Accompany the Source Code (AQtime Integrated into Microsoft Visual Studio)
The Code Editor of Visual Studio lets you collapse and expand blocks of source code. The grid,
which AQtime adds to the Code Editor to display profiling results, supports neither collapsing, nor
expanding, because Visual Studio does not send appropriate notifications to AQtime. So, to ensure
that the grid shows proper profiling results for source lines and routines, please expand all the
collapsed blocks of code. To do this, use the Outlining | Toggle All Outlining or Outlining | Stop
Outlining item of the Code Editor’s context menu.
www.automatedqa.com
AQtime by AutomatedQA Corporation
Profilers
405
Coverage Results That Accompany the Source Code (AQtime Integrated into Embarcadero RAD Studio)
The Editor of RAD Studio lets you collapse and expand blocks of source code. The grid, which
AQtime adds to the Editor to display profiling results, supports neither collapsing, nor expanding,
because RAD Studio does not send appropriate notifications to AQtime. So, to ensure that the grid
shows proper profiling results for source lines and routines, please expand all the collapsed blocks of
code. To do this, use the Unfold | All item of the Editor’s context menu.
Some notes on displaying results in the Editor panel:
•
Note that in order for AQtime to show source files in the Editor, the path to these files must be
specified in the Project Search Directories or Search Directory dialogs. In addition, your
applications must be compiled with debug information (see How AQtime Profilers Use Metadata
and Debug Information).
•
Information about lines depends on debug info attached to the executable. With the Coverage
profiler especially, you should be on the lookout for unexpected discrepancies. Some compilers,
for instance, such as Borland Delphi, will skip functions that are never called (this is called Smart
Linking). Therefore, the debug information will log fewer functions and fewer lines than there are
in the source file.
•
The Editor can display incorrect profiling-related information for some C++ applications that use
several functions based on the same template (see Profiling Template Functions). In this case,
refer to the Report panel to get the correct results.
•
Sometimes the Coverage profiler can report that the last line of your routine was not executed (it
shows a red dot for this line in the Editor’s grid). The reason for this is that AQtime stops profiling
a routine when the application executes the ret instruction. Usually, this instruction is the last
© 2010 AutomatedQA Corp.
www.automatedqa.com/support
406
AQtime Reference
instruction in the routine’s binary code. However, compilers can produce code which includes ret
instructions in «the middle» of a routine. For example, the following C++Builder code will insert
ret instructions after each case line of a switch...case block.
[C++]
void foo(int i)
{
. . .
switch(i)
{
case 1: //do something
break;
case 2: // do something
break;
}
} // This line is never executed
Coverage Profiler - Report Panel Columns
When displaying results of the Coverage profiler, each row in the Report panel holds the results for a
routine, source file or module in your application. Which values are displayed depends on the category selected
in the Explorer panel:
Routines Category
Source Files and Modules Category
For more information on the categories, see Coverage Profiler - Description of Results.
Note that by default the Coverage profiler shows a few of available columns in the Report panel. You can
add more columns to the panel. For more information, see Adding and Removing Columns.
Routines Category
Columns (in alphabetical order)
Description
Address
Routine’s address in memory. This column is used for unmanaged
(native-code) routines only.
Analysis Result
Specifies if the routine was instrumented or not. If the routine was
instrumented, this column is empty. Otherwise, the column displays a
short description why the routine was not instrumented:
Less than 5 bytes - The routine occupies less than 5 bytes in memory.
See Profiling Small Functions.
No line info - The routine was added to a line-level area, but the debug
information holds no info about routine lines. These routines can be
profiled at routine level only.
Unsafe code - AQtime was not able to instrument the routine safely. This
typically occurs when the routine's binary code is intermixed with data
areas. See Profiling Routines That Hold Unsafe Code.
No ret instruction - The routine’s binary code does not contain the ret
www.automatedqa.com
AQtime by AutomatedQA Corporation
Profilers
Columns (in alphabetical order)
407
Description
instruction (this may happen if the routine finishes with the jmp
instruction). See Profiling Routines That Do Not Have the ret
Instruction.
Duplicated code - The routine whose code coincides with code of
another routine. To learn more about this, see Profiling Duplicated
Code.
Class Name
If the routine is a method, name of the class it belongs to.
Code Type
Specifies the type of the routine's code. The following values are
possible:
•
MSIL - Managed-code routine with MSIL (Microsoft
Intermediate Language) code.
•
x64 - 64-bit code routine.
•
x86 - Native-code (unmanaged) routine.
•
Pseudo - Pseudo routine that was created by the context.
For example, <JIT Compiler>, <Garbage Collector>,
<Unknown PInvoke> or <Root>.
•
PInvoke - Native-code routine for which there is a
declaration in one of managed modules and that is called
from within the unmanaged code.
•
NGen - Managed routine that was compiled by the ngen
utility (CLR Native Image Generator) with the /prof
argument in its command line. The ngen compilation means
the routine was compiled before the application starts.
•
Script - The routine belongs to a script that was profiled
along with the host application. See Profiling Scripts Overview for details.
•
Byte-code - Java routine that was compiled into an
intermediate byte-code format. See Profiling Java
Applications for details.
Hit Count
The number of routine calls that were profiled. See also Skip Count. The
total number of times the routine was executed is determined as Hit
Count + Skip Count.
Lines Covered
Specifies the number of routine’s source lines that were executed during
the profiler run.
Lines Uncovered
Specifies the number of routine’s source lines that were not executed
during the profiler run.
Note:
According to the Mark partially executed lines as option, partially
executed lines can be treated either as executed or as non-executed. If the
routine was profiled at routine level, AQtime considers all the lines of
this routine as executed (if the routine was called) or unexecuted (if the
© 2010 AutomatedQA Corp.
www.automatedqa.com/support
408
AQtime Reference
Columns (in alphabetical order)
Description
routine was not called).
Mark
Specifies if the routine was executed or not during the profiler run.
If the routine was profiled at routine level, Mark holds green dot if the
method was executed or red dot if the method was not executed.
If the method was profiled at line level, Mark holds green dot if all lines
of the method were executed, red dot if no line of the method was
executed, yellow dot if some lines were executed and some were not.
Module Name
The name of the module which contains the profiled routine.
Namespace
Namespace of the method’s class (this column is used for managed
routines only).
Routine Name
Name of the routine.
Skip Count
Number of times the routine was excluded from profiling, because the
profiling status was off (this can be, for example, the number of times
the routine was affected by an off-trigger or the number of times the
routine was executed when the Enable/Disable Profiling button was not
pressed). See also Hit Count. The total number of times the routine was
executed is determined as Hit Count + Skip Count.
Source File
Name of the source file for the method. The values for this column are
read from the application’s debug info. If debug info does not contain
information on the file name, the column is empty.
Source Line
Source file’s line number where the routine’s implementation begins.
The values for this column are read from the application’s debug info.
Token
The routine’s token. This column is used for managed routines only.
Total Lines
The total number of source code lines in the routine.
Unit Name
Name of the linkage unit that holds the routine. This column is used for
unmanaged (native-code) routines only.
% Covered
The percentage of covered lines against the total number of lines in the
routine. Partially executed lines are counted according to the Mark
partially executed lines as option value.
Source Files and Modules Categories
Columns (in alphabetical order)
Description
File Name or
Name of the source file (or module).
Module Name
The source file name is read from the application’s debug info. If debug
info does not contain information on the file name, the column is empty.
www.automatedqa.com
AQtime by AutomatedQA Corporation
Profilers
409
Columns (in alphabetical order)
Description
Hit Count
The number of routine calls that were profiled. See also Skip Count. This
value is a sum of the Hit Count result of all profiled routines that belong
to the given source file or module.
Skip Count
Number of times the routines were excluded from profiling, because the
profiling status was off (This can be, for example, the number of times
the routines were affected by off-triggers). This value is a sum of the
Skip Count result of all profiled routines that belong to the given source
file or module.
% Covered
The percentage of covered lines against the total number of lines in the
routines that belong to the source file (module). Partially executed lines
are counted according to the Mark partially executed lines as option
value.
Coverage Profiler - Details Panel Columns
If a routine was profiled at routine level, the Coverage profiler uses the Details panel to display additional
profiling results for that routine. The panel holds the Lines table that shows the line profiling results for the
routine selected in the Report panel. This table is populated only if the routine was profiled at line level. Each
row in the table holds profiling results for a source code line:
Columns (in alphabetical order)
Description
Block Count
Specifies the number of blocks into which the source code line is
divided. For more information, see description of partially executed
lines.
Hit Block Count
Specifies the number of the line’s blocks that were called during the
profiler run.
Hit Count
Specifies how many times the source line was executed during the
profiler run.
Note that for lines that constitute several blocks in the compiled code
(that is, for lines whose Block Count is more than 1), this value is the
total hit count for all the blocks corresponding to the line. For more
information, see the description of partially executed lines.
Mark
Specifies whether the source line was executed or not. If the line was
executed, the Mark column holds a green dot. If the line was not
executed, Mark holds a red dot. Partially executed lines are marked
with yellow dots.
Note that according to the Mark partially executed lines as option,
partially executed lines can be treated either as executed or as
non-executed.
If the routine was profiled at routine level, AQtime considers all the
lines of this routine as executed (if the routine was called) or
unexecuted (if the routine was not called).
© 2010 AutomatedQA Corp.
www.automatedqa.com/support
410
AQtime Reference
Columns (in alphabetical order)
Source Line
Description
The line number in the source file.
Coverage Profiler Options
The Coverage profiler includes two groups of customizable options:
•
One group includes options that have effect on the profiler functioning. Changes in these options
will only apply to the next profiler run.
•
Another group contains options that affect the current result displaying. When you change these
options, AQtime refreshes data in its panels.
To modify the group of options that affect the profiler functioning, do any of the following:
•
•
AQtime standalone:
Select Options | Options from the main menu and then choose Profilers | Coverage |
Coverage Profiler on the left of the ensuing Options dialog.
Press Configure Current Profiler on the Standard toolbar when the Coverage profiler is
selected.
AQtime integrated into Microsoft Visual Studio:
•
Select Tools | Options from Visual Studio’s main menu and then choose AQtime | Profilers |
Coverage | Coverage Profiler from the tree view on the left of the ensuing Options dialog.
AQtime integrated into Embarcadero RAD Studio:
Select AQtime | Options from RAD Studio’s main menu and then choose Profilers |
Coverage | Coverage Profiler on the left of the ensuing Options dialog.
This group includes the following options:
•
Disable inlining - This option effects managed (.NET) applications only. Inlining typically
increases the speed and reduces the number of separate JITting events for inlined methods.
However, if a method is inlined, AQtime is unable to collect the coverage information for this
method and its lines. If the option is enabled, inlining of managed routines is disabled, so AQtime
can profile them.
•
Thread model - Specifies how the Coverage profiler gathers statistics for threads in the profiled
application. For more information on available values for this option, see Profiling Multiple
Threads.
To modify options that affect the way results are displayed, use items of the Profiler toolbar. If it is hidden,
right-click somewhere in the toolbar area and select Profiler from the subsequent popup list. The toolbar holds
the following items:
•
Mark partially executed lines as - Specifies how AQtime treats partially executed lines when it
is calculating the number of covered and un-covered lines and how AQtime marks them (with a
red, green or a yellow dot) in the Lines pane of the Details panel and in the Editor. This option
can have one of three values:
Value
Description
Partially
executed
AQtime marks partially executed lines with yellow dots and treats them as
non-executed when calculating the Lines Covered, Lines Uncovered and
% Covered values.
www.automatedqa.com
AQtime by AutomatedQA Corporation
Profilers
411
Value
Description
Completely
executed
AQtime marks partially executed lines with green dots and treats them as
executed when calculating the Lines Covered, Lines Uncovered and %
Covered values.
Non-executed
AQtime marks partially executed lines with red dots and treats them as
non-executed.
•
Show routines with class names - If it is enabled, the Routine Name column of the Report
panel for the Coverage profiler displays the name of the given routine along with the name of the
class the routine belongs to. Otherwise, this column only displays the routine name.
•
File names with path - If this option is enabled, the Source File and Module Name columns of
the Report panel for the Coverage profiler hold the entire path to the given file. Else, these
columns hold the file name only.
© 2010 AutomatedQA Corp.
www.automatedqa.com/support
412
AQtime Reference
Exception Trace Profiler
The Exception Trace profiler monitors the application execution and if an exception occurs it outputs
exception information (exception type, address, call stack, and so forth) on the Event View panel. If you want
the call stack to be reported to a file, enable the panel's Text file | Active or XML file | Active option. You can
also use panel settings to filter logged exceptions (see Exceptions in the Event View Panel).
The Exception Tracer supports both Win32 and Win64 applications, works faster in comparison with other
profilers and does not slow down the tested application. Use it if you only need to explore exceptions that occur
during the application execution.
You can view the source code of a routine in the call stack: simply double-click the routine in the Event
View panel and then switch to the Editor (Note that the path to the source files must be specified in the Project
Search Directories or Search Directory dialogs).
Since the Exception Tracer uses the Event View panel, the Exceptions | Active option of this panel must be
turned on. Otherwise, the Exception Tracer displays an error message and does not start profiling. The other
Event View options specify what information will be displayed when the exceptions occur.
www.automatedqa.com
AQtime by AutomatedQA Corporation
Profilers
413
Function Trace Profiler
The topics of this section provide information about the Function Trace profiler:
Function Trace Profiler - Overview
Tracing Function Call Parameters and Result Values
Description of the Report Panel Columns
Description of the Details Panel Columns
Outputting Results Using a Custom DLL
Function Trace Profiler Options
Function Trace Profiler - Overview
The Function Trace profiler lets you investigate the route and the order in which the routines are called
during the application runtime. It traces both 32- and 64-bit Windows and .NET applications and gathers
information about each application function: different routes used to invoke the function, exact parameter
values passed to the function, hierarchy of function calls, and so on. The complete profiler description includes
the following topics:
Overview (this topic)
Tracing Function Call Parameters and Result Values
Description of the Report Panel Columns
Description of the Details Panel Columns
Outputting Results Using a Custom DLL
Function Trace Profiler Options
Function Trace Profiler Tutorial
The Function Trace profiler provides you with comprehensive information about routine usage. It is a
good way to find out how the routine can be called or to know the actual call stack for a function (for instance,
a function that raises an exception). Also, you can use it when you need to know whether something occurs in
the application at the expected point, for instance, whether the application posts data to the database right after
a user has pressed OK. Another good use of the profiler, again, is to profile an application with complex
recursive calls.
After you start the Function Trace profiler, it monitors the application’s execution flow, logs call stacks for
each call of a routine and places gathered results into Routines and Call Trace categories.
The Routines category is used to display route information. Note that route tracing consumes a lot of
memory and by default this functionality is turned off. To enable it, specify any value that is greater than 0 for
the profiler’s Maximum route depth option. You can set this value in the Run Settings dialog that is displayed
every time you start profiling. If the option is 0, the profiler does not trace the routes.
If route tracing was enabled, when you select the Routines category in the Explorer panel, the Report
panel lists all routines used by the application. The columns of the Report panel contain detailed information
about each routine (see column descriptions).
It is obvious that a routine can be called by several different routines in your application. For instance, for
routine B displayed on the figure below, there are two calling routes: C -> A -> B and E -> D -> A -> B.
© 2010 AutomatedQA Corp.
www.automatedqa.com/support
414
AQtime Reference
With the Function Trace profiler you can find all routes used to call the selected routine. Note that this is
not the same as building the calls relationship (parents-children) graph. The calls relationships graph includes
all «ancestors» of a routine without specifying the exact calling routes. For instance, in the Call Graph,
generated for routine B, it would be rather difficult to find whether the route E -> D -> A -> B exists or if it is
just a combination of two routes: D -> A -> B and E -> D.
To view the call routes for a routine, choose the Routines category, select the routine in the Report panel
and switch to Details. The Details panel includes two panes: Call Routes and Call Stack. Each call to a function
has its call stack (or call route). The Call Routes pane holds a list of all call routes for the selected function. The
Route No column specifies the route number (AQtime enumerates routes in order of their «appearance»), the
HitCount column specifies how many times the function was executed with this call route. The call route itself
is displayed in the Call Stack pane. The first row in this pane displays the selected routine itself, the second
row - direct parent of the selected routine, the third row - the function that called the direct parent, and so on
(see column descriptions).
Note:
If the Maximum route depth option is 0 before the profiler starts, the profiler does not trace call
routes, so the Details panel is empty.
When the Call Trace category is active the Report panel displays the sequence of routine calls and call
characteristics. Which call characteristics to measure is defined by the Active counter option. The following
counters are available in the current AQtime version:
•
Elapsed Time
•
Split Load Replays
•
User Time
•
Split Store Replays
•
User+Kernel Time
•
Blocked Store Forwards Replays
•
CPU Mispredicted Branches •
•
CPU Cache Misses
•
Hard Memory Page Faults
•
Context Switches
•
All Memory Page Faults
•
64K Aliasing Conflicts
Soft Memory Page Faults
All counters work for managed and unmanaged code and support 32bit and 64bit applications. For a
complete description of counters, see Counters Overview.
Some counters may be unavailable. This depends on the CPU model and the software used. For
instance, some counters do not work on Pentium II or do not support the processor’s SpeedStep
technology, while others do not function under virtual machines. Also, if you run AQtime x86 on a
www.automatedqa.com
AQtime by AutomatedQA Corporation
Profilers
415
64-bit operating system, the only available counter is Elapsed Time. For complete information on
known counter restrictions, see Counters Overview.
Also, if you have Windows DDK installed, using some counters may cause the operating system to
stop unexpectedly and display the error description on a blue screen. For more information on this
problem and on how to solve it, see Counters - Overview.
Note:
If you use a computer that has several processors or a multiple-core processor (for example,
dual-core CPU) and has Windows XP Service Pack 2, then you must install the Windows
update #896256 in order for the profiler to be able to time your application correctly. The update
is available on Microsoft’s web site:
http://support.microsoft.com/kb/896256
The hierarchy of calls and some measured characteristics for the routine selected in the Report panel are
displayed in the Call Tree and Call Graph panels.
One of the Function Trace benefits is that the profiler does not just log the sequence of function calls, but
also logs the parameters of function calls and function result values. For complete information on this, see
Function Trace Profiler - Tracing Function Call Parameters and Result Values.
Besides generating results at the end of profiling or on demand (with the Get Results command), the
Function Trace profiler can output real-time information into a text file, custom DLL or CodeSite debugging
tool:
•
When the Text file output option is enabled the routine call order is written to one or several text
files.
In the folder specified by the Text output directory option a new folder is created. The folder name
corresponds to current date and time (the date is represented in the format specified by Windows
Regional Settings, the time is represented in the hh:mm:ss format). For each thread a separate text
file is assigned where its routine sequence is written. The file name matches the thread name or
number. Text files are created only for those threads from which the profiled routines are called.
For each call, two messages are posted, one on entry (marked with «->«) and one on exit (marked
with «<-»). If a lot of child calls occur, the two lines may be far apart. If the routine belongs to an
area whose Retrieve parameter values property is enabled, the posted text also includes the
parameter names and values.
•
When the External DLL output option is enabled a custom dynamic link library is used to output
profiler results.
With a custom DLL you have complete control on how the profiler results are processed. For more
information on this, see Function Trace Profiler - Outputting Results Using a Custom DLL.
•
When the CodeSite 1 output or CodeSite 2/3 output option is enabled CodeSite versions 1, 2 or 3
are used to output routine calls.
CodeSite is the product of Raize Software Inc. (www.raize.com), it is not supplied with AQtime.
© 2010 AutomatedQA Corp.
www.automatedqa.com/support
416
AQtime Reference
Tracing function calls with the CodeSite 3 Viewer
If CodeSite is not running when you start the Function Trace profiler, the profiler will
automatically launch it. If CodeSite is already running, Function Trace will use the running
instance of the application to output results. The profiler does not close CodeSite when the
profiling run is over, thus making it possible for you to analyze profiling results.
The Function Trace profiler shows each call, with the amount of detail you specify in the Options. It is not
a statistical tool, but very detail-oriented. It is very easy to slow your application to a crawl and to generate a
flood of detail, simply by letting the Function Trace profile too much of the application in one run. Use Areas,
Triggers, and Files to Ignore or Routines to Ignore dialogs to limit the profiler usage. See also Controlling
What to Profile and Excluding Code From Profiling topics.
Function Trace Profiler - Tracing Function Call Parameters and Result
Values
The Function Trace profiler can log information about function call parameters and return values. This
information will be logged if the routine belongs to an including area whose Retrieve parameter values
property is enabled. This option is available when creating a new area or when modifying the properties of an
existing area.
After you perform the profiling and get results, activate the Call Trace results category in the Explorer
panel. When this category is chosen, the Report panel displays a sequence of function calls for the application
thread that is selected in the Explorer panel. The Details panel contains parameter information for the routine
that is selected in the Report panel. The Details panel displays information on function parameters in two
tables: Routine Parameters On Enter and Routine Parameters On Exit. These tables show parameter
www.automatedqa.com
AQtime by AutomatedQA Corporation
Profilers
417
values for entering and exiting the routine. The last row in the Routine Parameters On Exit table holds
information about the routine results. For more information on panel columns, see Function Trace Profiler Details Panel Columns (Call Trace Category). The type of information displayed depends on several
conditions:
•
For some Borland VCL constructors and destructors an additional parameter can be displayed. It
does not exist in the source code but is added by the compiler.
•
If the application was compiled with Optimization enabled, parameter values may be incorrect.
We recommend that you turn Optimization off if you want to trace parameter values on calls.
•
For parameters passed by reference, the pointer address is analyzed. If AQtime managed to trace
the parameter value then the pointer address (or several addresses in a pointer-to-pointer case) is
shown together with the result value, otherwise only the pointer address. The analysis result value
depends on the data type. For native applications the following information is displayed:
Data type
Displayed value
Character
The ordinal number of the character.
Pointer to character
The character trailed with ellipses.
Boolean
True or False values.
Other simple data types: integer, The actual parameter value.
floating point and so on
String
Either the whole string text or the first character of the
string trailed with ellipses.
Array
The first element of the array (for unmanaged routines) or
the array’s type (for managed routines).
Other complex data types
Only the memory address.
For parameters of .NET applications the string value returned by the ToString() function will be
shown. For example, the following string value corresponds to an array type: System.Int32[].
•
For the function passed as routine parameter the following information is displayed:
Column
Value
Example
Param Type
Function result type and types of function Integer (Integer, Boolean)
parameters: Result (Param1, Param2, ...)
Param Value Function address and possibly a pointer analysis 0x0045C8F0
result.
•
Depending on the compiler and user settings, Variant type parameters can be displayed in three
ways: as address, structure or variant. In Visual Studio applications, variants are interpreted as
address or structure. In Delphi applications - as address or variant. In C++Builder applications, all
three interpretations are possible.
•
For class instance passed by reference, only the address is shown. If the object is passed by value,
it is parsed into class fields and field-values are displayed in braces. For each class field the
following information is shown: type, name and value. Fields are delimited with commas. The
maximum number of class fields to be displayed is specified by the Maximum number of fields
© 2010 AutomatedQA Corp.
www.automatedqa.com/support
418
AQtime Reference
option. If there are more fields in the class then the value list ends with ellipsis. For example,
{string Font_Name = Arial, int Font_Size = 14, ...}.
•
All of the above information also applies to routine results. The results are displayed in the
Routine Parameters On Exit pane. The function result is distinguished with the Return Value
mark in the Comments column. The output parameters of a procedure are not specifically marked,
but you can track them by comparing the values in the Routine Parameters On Enter and
Routine Parameters On Exit panes.
•
Currently, the Function Trace profiler does not collect information on values of script routines’
parameters.
Function Trace Profiler - Output the Results Using a Custom DLL
The Function Trace profiler can display the hierarchy of function calls in the Report panel or in CodeSite.
It can also output results to a text file.
If you need special processing for results, you can create a dynamic link library. AQtime loads this DLL
upon profiler start and unloads after profiling has finished. The Function Trace profiler sends information
about each function call to the library, which, in turn, performs the further result processing.
This dynamic link library must export the following functions:
[C++]
void __stdcall Tracer_OnStartProfiling(BOOL Enabled);
void __stdcall Tracer_OnStopProfiling();
void __stdcall Tracer_OnEnabledChanged(BOOL Enabled);
void __stdcall Tracer_OnThreadCreate(LPCWSTR Thread);
void __stdcall Tracer_OnRoutineEnter(LPCWSTR RoutineName,
LPCWSTR ClassName,
LPCWSTR ModuleName,
LPCWSTR UnitName,
LPCWSTR Thread,
PAQPROF_PARAMETER_DATA Param);
void __stdcall Tracer_OnRoutineExit (LPCWSTR RoutineName,
LPCWSTR ClassName,
LPCWSTR ModuleName,
LPCWSTR UnitName,
LPCWSTR Thread,
PAQPROF_PARAMETER_DATA Param);
void __stdcall Tracer_OnExceptionThrown (LPCWSTR RoutineName,
LPCWSTR ClassName,
LPCWSTR ModuleName,
www.automatedqa.com
AQtime by AutomatedQA Corporation
Profilers
419
LPCWSTR UnitName,
LPCWSTR Thread);
typedef struct AQPROF_PARAMETER_DATA
{
BSTR Type;
BSTR Value;
CVOID_PTR
pNextParameter;
} AQPROF_PARAMETER_DATA, *PAQPROF_PARAMETER_DATA;
The Tracer_OnStartProfiling function is called upon starting the Function Trace profiler. The
Enabled parameter indicates whether profiling is turned on. Remember that you can switch the profiling state
Enable/Disable Profiling toolbar and menu item or with the EnableProfiling function (see
with the
Controlling Profiling From Application Code). If this occurs the Tracer_OnEnabledChanged function is
called with Enabled to specify the new profiling state. When profiling is finished the OnStopProfiling
function is called.
The Tracer_OnThreadCreate function is called when a new thread is created, the Thread parameter
contains the thread ID or the thread name (see Assigning Names to Threads).
The Tracer_OnRoutineEnter function is called when the profiled application enters a function. The
Tracer_OnRoutineExit function is called when the application exits a function. Both functions have the
same parameters that allow AQtime to identify the profiled routine:
RoutineName The name of the profiled routine.
ClassName
The name of a class where the profiled routine is declared.
ModuleName The name of a module where the profiled routine is declared.
UnitName
The name of a linkage unit that holds the routine.
Thread
The ID or name of a thread that called the profiled routine.
Param
A pointer to the AQPROF_PARAMETER_DATA structure that holds a linked list of parameters
passed to the current routine call. For information about how the parameters are
interpreted, see Function Trace Profiler - Tracing Function Call Parameters and Result
Values topic. The structure’s fields Type and Value contain the parameter’s data type and
value, the pNextParameter field is a pointer to the next parameter passed to this routine.
In case the parameter’s value cannot be displayed, the corresponding fields will hold an
empty string.
The Tracer_OnExceptionThrown function is called upon exception. The values of the RoutineName,
ClassName, ModuleName, UnitName, Thread parameters specify the routine, class, module, unit and thread
where the exception occured.
For more information on how to create dynamic link libraries, see your development tool's documentation.
Function Trace Profiler Options
The Function Trace profiler includes two groups of customizable options:
© 2010 AutomatedQA Corp.
www.automatedqa.com/support
420
AQtime Reference
•
One group includes options that have effect on the profiler functioning. Changes in these options
will only apply to the next profiler run.
•
Another group contains options that affect the currently displayed results. When you change these
options, AQtime refreshes the data in its panels.
To modify options that have effect on the way the profiler functions, select Options | Options from
AQtime’s main menu (this will call the Options dialog), and then choose Profilers | Tracing | Function
Tracer from the tree view on the left of the dialog. You can also modify these options by pressing
Configure Current Profiler on the Standard toolbar when the Function Trace profiler is selected.
If you use AQtime integrated into Microsoft Visual Studio, to modify these options, select Tools | Options
from Visual Studio’s main menu (this will call the Options dialog), and then choose AQtime | Profilers |
Tracing | Function Tracer from the tree view on the left of the dialog.
If you use AQtime integrated into Embarcadero RAD Studio, to modify these options, select AQtime |
Options from RAD Studio’s main menu (this will call the Options dialog), and then choose Profilers |
Tracing | Function Tracer from the tree view on the left of the dialog.
Options include:
•
Thread model - Specifies how the profiler gathers statistics for threads in the profiled application.
For more information on available values for this option, see Profiling Multiple Threads and
Profiling COM Logical Threads.
•
Active counter - Specifies what routine characteristic the profiler will measure. For more
information on available values for this option, see Counters Overview.
•
Maximum number of fields - Specifies how many class fields should be displayed when the class
instance is passed as a parameter. Default value is 10. If some fields remain that were not
displayed, the value list ends with ellipsis. This option is ignored if the Maximum route depth
option is set to 0 or if the area’s Retrieve parameter values property is disabled.
•
Output
•
Get trace info - Specifies whether additional trace information is collected. The
information type is determined by the Active counter option. This makes it possible to
display trace results in the Details, Call Tree and Call Graph panels.
CodeSite 1 output - Determines whether CodeSite version 1 is used to display the
sequence of function calls in real time.
CodeSite 2/3 output - Determines whether CodeSite version 2 or 3 is used to display the
sequence of function calls in real time.
External DLL output - If this option is selected, the profiler outputs results using a
dynamic link library specified by the External DLL name option. For more information,
see Function Trace Profiler - Outputting Results Using a Custom DLL.
External DLL name - Specifies the full-path name of the dynamic link library, which
AQtime will use to output results of the Function Trace profiler.
Text file output - Determines whether the Function Trace profiler will output data to text
files.
Text output directory - The path to the folder where the text files will be created.
Text separator - When writing data to the text file, each function name is preceded by a
separator symbol to indicate the depth of nesting. This option specifies this symbol. The
following values are available: None, Space, Double space and Tabulation.
Resut generation
www.automatedqa.com
AQtime by AutomatedQA Corporation
Profilers
421
Maximum route depth - Limits the number of function calls to be traced for each route.
Default value is 0 and means that the profiler will not trace the routes. Specifying too
large value may significantly slow down the profiling.
Show multiple functions - If this option is enabled, there may be multiple function calls
in the summary window. This option is ignored if the Maximum route depth option is set
to 0.
To modify options that affect the result display, use items of the Profiler toolbar. If this toolbar is hidden,
right-click somewhere in the toolbar area and select Profiler from the subsequent popup list.
On the toolbar, the following items are available:
•
Counter unit - This item is enabled only if the Active Counter option is either Elapsed Time, User
Time or User+Kernel Time. The Counter unit item lets you specify the measurement unit for the
time columns in AQtime panels. Possible values are Seconds, Milliseconds, Microseconds and
Machine Cycles. Note that this option is counter-specific: suppose you browse results of the User
Time counter and set the option to Machine Cycles. If you open the Elapsed Time results, change
the option to Seconds and then return back to the User Time results, AQtime will automatically
change the option to Machine Cycles (that is, it will select the value that was active when you
browsed the User Time results last time).
•
Show routines with class names - If this option is enabled, the Routine Name column of the
Report, Details and Call Tree panels for the Function Trace profiler holds both class name and
routine name. Else, this column holds the routine name only.
•
File names with path - If this option is enabled, the Source File and Module Name columns
of the Report, Details and Call Tree panels for the Function Trace profiler hold the entire path to
the given file. Else, these columns hold the file name only.
Function Trace Profiler - Report Panel Columns
When displaying results of the Function Trace profiler, each row in the Report panel holds gathered
routine results. Which values are displayed depends on the category selected in the Explorer panel and on the
counter that was used for profiling.
Note that by default the Function Trace profiler shows available columns in the Report panel. You can add
more columns to the panel. For more information on this, see Adding and Removing Columns.
Call Trace Category
When the Call Trace category is active, the Report panel holds results for each routine call. Which values
are displayed also depends on the counter that was used for profiling.
Columns that do not depend on the active counter
Columns (in alphabetical order) Description
Analysis Result
Specifies if the routine was instrumented or not. If the routine was
instrumented, this column is empty. Otherwise, the column displays a short
description why the routine was not instrumented:
Less than 5 bytes - The routine occupies less than 5 bytes in
memory. See Profiling Small Functions.
No line info - The routine was added to a line-level area, but the
debug information does not hold info about routine lines. These
routines can be profiled at routine level only.
Unsafe code - AQtime was not able to instrument the routine
© 2010 AutomatedQA Corp.
www.automatedqa.com/support
422
AQtime Reference
safely. This typically occurs when the routine's binary code is
intermixed with data areas. See Profiling Routines That Hold
Unsafe Code.
No ret instruction - The routine’s binary code does not contain the
ret instruction (this may happen if the routine finishes with the
jmp instruction). See Profiling Routines That Do Not Have the ret
Instruction.
Duplicated code - The routine whose code coincides with code of
another routine. To learn more about this, see Profiling Duplicated
Code.
Call No
The number of a single routine call.
Class Name
If the routine is a method, name of the class it belongs to.
Code Type
Specifies the routine's code type. The following values are possible:
•
MSIL - Managed-code routine with MSIL (Microsoft
Intermediate Language) code.
•
x64 - 64-bit code routine.
•
x86 - Native-code (unmanaged) routine.
•
Pseudo - Pseudo routine that was created by the context. For
example, <JIT Compiler>, <Garbage Collector>,
<Unknown PInvoke> or <Root>.
•
PInvoke - Native-code routine for which there is a declaration
in one of the managed modules and that is called from within
unmanaged code.
•
NGen - Managed routine that was compiled by the ngen utility
(CLR Native Image Generator) with the /prof argument in its
command line. The ngen compilation means the routine was
compiled before the application starts.
•
Script - The routine belongs to a script that was profiled along
with the host application. See Profiling Scripts for details.
•
Byte-code - Java routine that was compiled into an
intermediate byte-code format. See Profiling Java
Applications for details.
Module Name
The name of the module which contains the profiled routine.
Parent Name
Name of the routine that called the given routine.
Routine Name
Name of the routine.
Source File
Name of the source file for the method. The values for this column are read
from the application’s debug info.
Source Line
Source file’s line number where the routine’s implementation begins. The
values for this column are read from the application’s debug info.
Unit Name
Name of the linkage unit that holds the routine. This column is used for
unmanaged (native-code) routines only.
Columns specific to the Elapsed Time, User Time and User+Kernel Time counters
www.automatedqa.com
AQtime by AutomatedQA Corporation
Profilers
423
You can specify the measurement unit for the following columns (seconds, milliseconds, microseconds or
machine cycles) using the Counter unit box on the Profiler toolbar. See also Function Trace Profiler Options.
Columns (in alphabetical order) Description
Time
Total time spent executing the routine’s code excluding child calls. The
sum of all profiled methods appears in the footer of this column.
Time with Children
Total time spent on calls to the routine including calls to child routines.
The sum for all profiled routines is displayed in the footer of this column.
Columns specific to the CPU Cache Misses counter
Columns (in alphabetical order) Description
Misses
Total number of cache misses that occurred during execution of the
routine’s code excluding child calls. The sum for all profiled routines
appears in the footer of this column.
Misses with Children
Total number of cache misses that occurred during execution of the routine
(including its calls to child methods). The sum for all profiled routines is
displayed in the footer of this column.
Columns specific to the CPU Mispredicted Branches counter
Columns (in alphabetical order) Description
Branches
Total number of branches that were mispredicted during execution of the
routine’s code excluding child calls. The sum for all profiled routines
appears in the footer of this column.
Branches with Children
Total number of branches that were mispredicted during execution of the
routine (including mispredictions in child methods). The sum for all
profiled routines is displayed in the footer of this column.
Columns specific to the Hard Memory Page Faults, Soft Memory Page Faults and All Memory Page
Faults counters
Columns (in alphabetical order) Description
Faults
Total number of page faults that occurred during execution of the routine’s
code (child calls are excluded). The sum for all profiled routines appears in
the footer of this column.
Faults with Children
Total number of page faults that occurred during execution of the routine
(including page faults that occurred in child methods). The sum for all
profiled routines is displayed in the footer of this column.
Columns specific to the Split Load Replays, Split Store Replays and Blocked Store Forwards Replays
counters
Columns (in alphabetical order) Description
Replays
Total number of replays that occurred during execution of the routine’s
code (child calls are excluded). The sum for all profiled routines appears in
the footer of this column.
Replays with Children
Total number of replays that occurred during execution of the routine
(including replays that occurred in child methods). The sum for all profiled
routines is displayed in the footer of this column.
Columns specific to the 64K Aliasing Conflicts counter
© 2010 AutomatedQA Corp.
www.automatedqa.com/support
424
AQtime Reference
Columns (in alphabetical order) Description
Conflicts
Total number of aliasing conflicts that occurred during execution of the
routine’s code (child calls are excluded). The sum for all profiled routines
appears in the footer of this column.
Conflicts with Children
Total number of aliasing conflicts that occurred during execution of the
routine (including conflicts that occurred in child methods). The sum for
all profiled routines is displayed in the footer of this column.
Columns specific to the Context Switches counter
Columns (in alphabetical order) Description
Switches
Total number of context switches that occurred during execution of the
routine’s code (child calls are excluded). The sum for all profiled routines
appears in the footer of this column.
Switches with Children
Total number of context switches that occurred during execution of the
routine (including switches that occurred in child methods). The sum for
all profiled routines is displayed in the footer of this column.
Additional information about routines chosen in the Report panel is shown in the Details, Call Tree and
Call Graph panels. Information displayed in the Call Tree and Call Graph panels help you trace the routine
call hierarchy, whereas the Detail panel displays exact parameters passed to the selected routine. See column
descriptions in the Function Trace Profiler - Details Panel Columns topic.
Routines Category
When the Routines category is active, the Report panel holds descriptions for each routine that was called
during profiling. The panel contains the following columns:
Columns (in alphabetical order) Description
Address
Routine’s address in memory. This column is used for unmanaged
(native-code) routines only.
Analysis Result
Specifies if the routine was instrumented or not. If the routine was
instrumented, this column is empty. Otherwise, the column displays a short
description why the routine was not instrumented:
Less than 5 bytes - The routine occupies less than 5 bytes in
memory. See Profiling Small Functions.
No line info - The routine was added to a line-level area, but the
debug information does not hold info about routine lines. These
routines can be profiled at routine level only.
Unsafe code - AQtime was not able to instrument the routine
safely. This typically occurs when the routine's binary code is
intermixed with data areas. See Profiling Routines That Hold
Unsafe Code.
No ret instruction - The routine’s binary code does not contain the
ret instruction (this may happen if the routine finishes with the
jmp instruction). See Profiling Routines That Do Not Have the ret
Instruction.
Duplicated code - The routine whose code coincides with code of
another routine. To learn more about this, see Profiling Duplicated
www.automatedqa.com
AQtime by AutomatedQA Corporation
Profilers
425
Code.
Class Name
If the routine is a method, name of the class it belongs to.
Code Type
Specifies the routine's code type. The following values are possible:
•
MSIL - Managed-code routine with MSIL (Microsoft
Intermediate Language) code.
•
x64 - 64-bit code routine.
•
x86 - Native-code (unmanaged) routine.
•
Pseudo - Pseudo routine that was created by the context. For
example, <JIT Compiler>, <Garbage Collector>,
<Unknown PInvoke> or <Root>.
•
PInvoke - Native-code routine for which there is a declaration
in one of the managed modules and that is called from within
unmanaged code.
•
NGen - Managed routine that was compiled by the ngen utility
(CLR Native Image Generator) with the /prof argument in its
command line. The ngen compilation means the routine was
compiled before the application starts.
•
Script - The routine belongs to a script that was profiled along
with the host application. See Profiling Scripts for details.
•
Byte-code - Java routine that was compiled into an
intermediate byte-code format. See Profiling Java
Applications for details.
Hit Count
The number of routine calls that were profiled.
Module Name
The name of the module which contains the profiled routine.
Namespace
Namespace of the method’s class (this column is used for managed
routines only).
Routine Name
Name of the routine.
Source File
Name of the source file for the method. The values for this column are read
from the application’s debug info.
Source Line
Source file’s line number where the routine’s implementation begins. The
values for this column are read from the application’s debug info.
Token
The routine’s token. This column is used for managed routines only.
Unit Name
Name of the linkage unit that holds the routine. This column is used for
unmanaged (native-code) routines only.
Information for all routes that were used to invoke a selected routine is shown in the Details panel. See
Function Trace Profiler - Details Panel - Routines Category for more information.
Function Trace Profiler - Details Panel Columns
When you view the Function Trace profiler results for your routines, the contents of the Details panel
depends on the category selected in the Explorer panel.
Note that the Details panel does not display all available columns. You can add columns to the panel or
remove them from it as it is described in Adding and Removing Columns.
© 2010 AutomatedQA Corp.
www.automatedqa.com/support
426
AQtime Reference
Call Trace Category
When the Call Trace category is selected in the Explorer panel, the Report panel holds results for each
routine call. If you select a Report panel row that corresponds to a single routine call, the Function Trace
profiler displays information about this call in the Details, Call Tree and Call Graph panels. The Details panel
holds two panes: Routine Parameters On Enter and Routine Parameters On Exit, that show information
about parameters used for the routine call. The first one displays parameters that were passed to a routine; the
second one displays parameters that were returned by a routine. By comparing the rows of those two panes you
can find out what parameters were modified during the routine execution and what are the values of the
returned parameters.
Both panes have the same columns (except for the Comment column):
Columns (in alphabetical order) Description
Comment
Extra information about the given parameter. For instance, this column
contains a Return Value string if the parameter is a result that is returned by
the function.
This column is displayed for the Routine Parameters On Exit pane only.
Param No
The number of the parameter in the parameter list.
Param Type
The parameter’s data type.
Param Value
The exact parameter value passed to the selected routine. See Function
Trace Profiler - Tracing Function Call Parameters and Result Values.
Routines Category
When the Routines category is active the Report panel contains a list of all profiled routines. The Details
panel displays all routes that were used to call a selected routine. It consists of two panes: Call Routes and Call
Stack. The Call Routes pane serves to select a distinct routine and Call Stack shows a sequence of routines that
invoke the chosen routine.
Note: The Function Trace profiler only traces function call routes if the Maximum route depth option is
greater than 0. If this option was 0 before the profiler started, the Details panel contains no data.
The Call Routes pane contains the following columns:
Columns (in alphabetical order) Description
Hit Count
The number of routine calls per selected route.
Route No
The number of call route.
The Call Stack pane contains the following columns:
Columns (in alphabetical order) Description
Call No
The precedence number. The routine chosen in the Report panel has
number 0, its parent has number 1 and so on.
Module Name
Name of the module that holds the routine.
Routine Name
Name of the routine.
Source File
Name of the source file for the routine. The values for this column are read
from the application’s debug info.
Source Line
Source file’s line number where the routine’s implementation begins. The
values for this column are read from the application’s debug info.
www.automatedqa.com
AQtime by AutomatedQA Corporation
Profilers
427
Light Coverage Profiler
This section contains topics that describe the Light Coverage profiler:
Light Coverage Profiler - Overview
Description of the Report Panel Columns
Description of the Details Panel Columns
Light Coverage Profiler Options
Light Coverage Profiler - Overview
The Light Coverage profiler lets you determine whether a routine or a line was executed during the
profiler run. This profiler is similar to the Coverage profiler but it does not track the hit count, allocate results
by threads and trace partially executed lines. This topic provides the Light Coverage profiler overview and
describes the profiling results. The complete profiler description includes the following sections:
Overview (this topic)
Light Coverage vs. Coverage (this topic)
Description of Profiler Results (this topic)
Description of the Report Panel Columns
Description of the Details Panel Columns
Light Coverage Profiler Options
Overview
The Light Coverage profiler tracks one thing: whether a routine or a line was called during the run. This
lets you keep track of untested code as testing progresses over time. It may also let you find unnecessary code
that you can remove, once you see that the method or line remains unexecuted under all possible conditions.
The Light Coverage profiler analyzes the application code (32-bit and 64-bit) at two levels of detail:
routine and line. To profile the lines of a routine, you should add this routine to a line-level area (see Profiling
Levels). Note that to profile managed routines at line level, you have to compile the application with debug
information. See How AQtime Profilers Use Metadata and Debug Information. If you need to track all lines
covered or not covered, begin by using the Light Coverage profiler on the Full Check area. This will let you
focus on the problem files first, and then you can narrow the analysis to these files and use the Light Coverage
profiler with them to drill down further.
After you have run Light Coverage several times, you can merge profiling results to get mass statistics.
Merging can be executed directly from the context menu of the Explorer panel (using the
Merge item) or
done automatically in the background after each profiling run (using the Auto-merge option of the Explorer
panel). You can also compare results of several Light Coverage runs in order to see the changes. For more
information on comparing and merging results, see Comparing and Merging Results.
Light Coverage vs. Coverage
The Light Coverage and Coverage profilers perform the same task. When profiling applications, Light
Coverage works faster and contributes less resources than the Coverage profiler (This does not work for script
profiling though).
Unlike the Coverage profiler, Light Coverage does not collect profiling results by threads. This feature,
however, may be a benefit if you use Light Coverage to profile your application when testing it with
TestComplete. If you merge the results generated by the Coverage profiler, the number of threads will be
increased every time you perform the merge, because each thread has a different name during each application
© 2010 AutomatedQA Corp.
www.automatedqa.com/support
428
AQtime Reference
execution and AQtime cannot determine that this thread is the same. So, you have to rename the threads in
profiler results before merging them. This problem does not exist with the Light Coverage profiler. It simply
does not have threads in results, so merging is easier.
When profiling a .NET application, the Light Coverage profiler works exactly like the Coverage
profiler. Therefore, Light Coverage does not work faster with managed applications and it can give
noticeable benefits only when profiling native applications.
Light Coverage Profiler - Description of Profiler Results
Brief results of the Light Coverage profiler are displayed in the Summary panel. It shows 10 routines that
were called most often than other routines and 10 routines that were covered less than other application
routines. Information for individual application routines, source files and modules are displayed in the Report
panel. Here is an example of a Light Coverage profiler output:
Sample Light Coverage Profiler Output (AQtime Standalone)
www.automatedqa.com
AQtime by AutomatedQA Corporation
Profilers
429
Sample Light Coverage Profiler Output (AQtime Integrated into Microsoft Visual Studio)
© 2010 AutomatedQA Corp.
www.automatedqa.com/support
430
AQtime Reference
Sample Light Coverage Profiler Output (AQtime Integrated into Embarcadero RAD Studio)
As you can see, the results are organized into three categories:
•
Routines Data
•
Source Files Data
•
Modules Data
The Source Files Data and Modules Data categories let you view summary profiling results for each
source file and module in your application. The Routines Data category contains results for each single
routine that were included in profiling tasks.
To view profiling results, choose the desired category on the Explorer panel and switch to the Report
panel. You can also select the category from the Result Items box of the Standard toolbar:
www.automatedqa.com
AQtime by AutomatedQA Corporation
Profilers
431
After choosing the desired category, AQtime will update the Report panel. The contents of this panel
depend on the currently selected category:
•
If you select the Routines Data category, the Report panel will display profiling results one
routine per line. Line coverage results will be shown in the Lines page of the Details panel and in
the Editor’s grid.
We would like to note that to profile code at line level, you should add the desired routines,
classes, files or modules to a line-level profiling area (see Profiling Levels). Also, to profile
managed routines at line level, you have to compile the application with debug information (see
How AQtime Profilers Use Metadata and Debug Information).
•
If you select the Source Files Data category, each row in the Report panel will show profiling
results for a source file. The Editor panel will display the source code of the selected file. The
Details panel will display line profiling results.
The panel displays results for those lines that were included in profiling tasks (that is, for lines that
belong to the routines, classes or files that were included in a profiling area of the line-level type).
•
If you select the Modules Data category, each row in the Report panel will display profiling
results for one module. The Details and Editor panels will not be used.
The following sections of this topic provide more detailed information about the panels.
Light Coverage Profiler Results - Report Panel
The Report panel displays profiling results according to the category selected in the Explorer panel or in
the Result Items box on the Standard toolbar. The Lines Covered, Lines Uncovered, Total Lines and %
Covered columns are used to identify untested code. For instance, if the function includes a large number of
lines, most of which only a small percentage were executed during a seemingly «complete» test for the
function, you might want to examine the function’s algorithm. Of course, AQtime gathers line coverage
statistics for those routines that were added to line-level profiling areas. If a routine was profiled at routine
level, % Covered is either 100%, or 0%. If the Total Lines and the Lines Uncovered values are identical for a
routine the routine was not called at all.
You can quickly filter out the routines whose source code lines were covered partially (less than a
particular percentage). To do this, use the predefined result views Routines covered less than %nn. On the other
hand, using the Unexecuted routines only predefined view, you can display the routines that were not executed
at all. To select these views, do any of the following:
•
AQtime standalone:
Select any of these views from the Result Views dropdown list on the Standard toolbar.
Select any of these views from the View | Result View menu.
© 2010 AutomatedQA Corp.
www.automatedqa.com/support
432
AQtime Reference
•
AQtime integrated into Microsoft Visual Studio:
•
Select any of these views from the Result Views dialog. To display the dialog, choose
AQtime | Result Views from Visual Studio’s menu.
AQtime integrated into Embarcadero RAD Studio:
Select any of these views from the Result Views dialog. To display the dialog, click
Result Views on RAD Studio’s View toolbar.
The Mark column graphically represents the Light Coverage result. It holds green dots for those routines
that were executed during the profiler run and red dots for those routines that were not executed. If a routine
was partially executed, the Mark column shows a yellow dot. For complete information on columns, see Light
Coverage Profiler - Report Panel Columns.
The summary values of the Lines Covered and % Covered columns display the total number of covered
lines and the coverage percentage. To find the percent of covered lines in a class, unit or source file, group
results in the Report panel by the Class Name, Unit Name or Source File columns. The group summary will
display the coverage results for each class, unit or source file:
Grouped Results in the Report Panel (AQtime Standalone)
www.automatedqa.com
AQtime by AutomatedQA Corporation
Profilers
433
Grouped Results in the Report Panel (AQtime Integrated into Microsoft Visual Studio)
© 2010 AutomatedQA Corp.
www.automatedqa.com/support
434
AQtime Reference
Grouped Results in the Report Panel (AQtime Integrated into Embarcadero RAD Studio)
The column footer shows summary results for the values displayed in that column. You can customize the
summary type and summary format using the Format Columns Dialog. For instance, you can select one of the
five summary types (Sum, Count, Avg, Min, Max) or you can hide the summary for the column.
Note that by default the Report panel only shows some of the available columns. You can add more
columns to the panel as your needs dictate. For more information on this, see Adding and Removing Columns.
You can arrange the columns in the panel as needed: move columns, change column width, and so on. For
more information on this, see Arranging Columns, Lines and Panels.
Note that sometimes results of script profiling may contain duplicated items in the Report panel for some
script routines (this may happen due to some specifics of the script engine's and the Light Coverage profiler's
functioning). To learn how you can solve this problem, see Profiling Scripts - Troubleshooting.The Profiler
toolbar contains items that allow you to modify the results that are currently being displayed as your needs
Show non-hit routines toolbar item lets you easily include or exclude
dictate. For example, the
non-executed routines from the result display. For more information on the toolbar items, see Light Coverage
Profiler Options.
Light Coverage Profiler Results - Details and Editor Panels
The Details and Editor panels display profiling results if you select the Routines Data and Source Files
Data categories. When one of these categories are active, each row in the Report panel corresponds to a single
routine or source file of your application. Double-clicking on a routine or file in the Report panel will update
the contents of the Details and Editor panels so they will display information concerning that routine or file.
www.automatedqa.com
AQtime by AutomatedQA Corporation
Profilers
435
The Details panel holds line coverage profiling results. Each row in this page corresponds to a source code
line. You can work with rows on the Lines page the same way you work with rows in the Report panel. For
more information on the Details panel columns, see Light Coverage Profiler - Details Panel Columns:
Line Coverage Details (AQtime Standalone)
© 2010 AutomatedQA Corp.
www.automatedqa.com/support
436
AQtime Reference
Line Coverage Details (AQtime Integrated into Microsoft Visual Studio)
www.automatedqa.com
AQtime by AutomatedQA Corporation
Profilers
437
Line Light Coverage Details (AQtime Integrated into Embarcadero RAD Studio)
The Details panel only displays those lines that belong to routines, classes or source files that were
included into line-level profiling areas. For instance, if some routines were included in a line-level area and
some were not, the panel will only display those lines that belong to the routines that were included. If your
code was profiled at routine level, the panel will be empty.
Note: Compilers can divide some source lines into several blocks. This typically occurs with the
if¦then statements. Suppose, you have the following code:
if a < b or c > d then DoSomething;
This line can be divided into three blocks: 1) the a < b condition, 2) the c > d condition and 3)
call to DoSomething. Such lines are called partially executed lines.
The Light Coverage profiler does not trace the execution of these blocks. If at least one block was
executed, the profiler treats the entire line as executed. To trace partially executed lines, use the
Coverage profiler.
Double-clicking a row in the Details grid will move the cursor in the Editor panel to the source code line
for which that row displays results. If a routine was profiled at line level, the Editor’s grid will show the same
results as the ones shown in the Details panel. For instance, you will find that the executed function and lines
are marked with green dots and the unexecuted routines and line have red dots.
To select which columns to display in the gutter, use the Field Chooser window. To bring it up, select Field
Chooser from the context menu. See Adding and Removing Columns.
© 2010 AutomatedQA Corp.
www.automatedqa.com/support
438
AQtime Reference
Coverage Results That Accompany the Source Code (AQtime Standalone)
www.automatedqa.com
AQtime by AutomatedQA Corporation
Profilers
439
Coverage Results That Accompany the Source Code (AQtime Integrated into Microsoft Visual Studio)
The Code Editor of Visual Studio lets you collapse and expand blocks of source code. The grid,
which AQtime adds to the Code Editor to display profiling results, supports neither collapsing, nor
expanding, because Visual Studio does not send appropriate notifications to AQtime. So, to ensure
that the grid shows proper profiling results for source lines and routines, please expand all of the
collapsed blocks of code. To do this, use the Outlining | Toggle All Outlining or Outlining | Stop
Outlining item of the Code Editor’s context menu.
© 2010 AutomatedQA Corp.
www.automatedqa.com/support
440
AQtime Reference
Coverage Results That Accompany the Source Code (AQtime Integrated into Embarcadero RAD Studio)
The Editor of RAD Studio lets you collapse and expand blocks of source code. The grid, which
AQtime adds to the Editor to display profiling results, supports neither collapsing, nor expanding,
because Embarcadero RAD Studio does not send appropriate notifications to AQtime. So, to ensure
that the grid shows proper profiling results for source lines and routines, please expand all of the
collapsed blocks of code. To do this, use the Unfold | All item of the Editor’s context menu.
Some notes on displaying results in the Editor panel:
•
Note that in order for AQtime to show source files in the Editor, the path to these files must be
specified in the Project Search Directories or Search Directory dialogs. In addition, your
applications must be compiled with debug information (see How AQtime Profilers Use Metadata
and Debug Information).
•
Information about lines depends on debug info attached to the executable. With the Coverage
profiler especially, you should be on the lookout for unexpected discrepancies. Some compilers,
for instance, such as Borland Delphi, will skip functions that are never called (this is called Smart
Linking). Therefore, the debug information will log fewer functions and fewer lines than there are
in the source file.
•
The Editor can display incorrect profiling-related information for some C++ applications that use
several functions based on the same template (see Profiling Template Functions). In this case,
refer to the Report panel to get the correct results.
•
Sometimes the Light Coverage profiler can report that the last line of your routine was not
executed (it shows a red dot for this line in the Editor’s grid). The reason for this is that AQtime
www.automatedqa.com
AQtime by AutomatedQA Corporation
Profilers
441
stops profiling a routine when the application executes the ret instruction. Usually, this
instruction is the last instruction in the routine’s binary code. However, compilers can produce
code which includes ret instructions in «the middle» of a routine. For example, the following
C++Builder code will insert ret instructions after each case line of a switch...case block.
[C++]
void foo(int i)
{
. . .
switch(i)
{
case 1: //do something
break;
case 2: // do something
break;
}
} // This line is never executed
Light Coverage Profiler - Report Panel Columns
When displaying results of the Light Coverage profiler, each row in the Report panel holds the results for
a routine, source file or module in your application. Which values are displayed depends on the category
selected in the Explorer panel:
Routines Data Category
Source Files Data and Modules Data Categories
For more information on the categories, see Light Coverage Profiler - Description of Results.
Note that the Light Coverage profiler only shows some of the available columns in the Report panel by
default. You can add more columns to the panel as needed. For more information, see Adding and Removing
Columns.
Routines Data Category
Columns (in alphabetical order)
Description
Analysis Result
Specifies if the routine was instrumented or not. If the routine was
instrumented, this column is empty. Otherwise, the column displays a
short description of why the routine was not instrumented:
Less than 5 bytes - The routine occupies less than 5 bytes in memory.
See Profiling Small Functions.
No line info - The routine was added to a line-level area, but the debug
information does not hold info about routine lines. These routines can
be profiled at routine level only.
Unsafe code - AQtime was not able to instrument the routine safely.
This typically occurs when the routine’s binary code is intermixed
with data areas. See Profiling Routines That Hold Unsafe Code.
No ret instruction - The routine’s binary code does not contain the ret
instruction (this may happen if the routine finishes with the jmp
© 2010 AutomatedQA Corp.
www.automatedqa.com/support
442
AQtime Reference
Columns (in alphabetical order)
Description
instruction). See Profiling Routines That Do Not Have the Ret
Instruction.
Duplicated code - The routine whose code coincides with the code of
another routine. To learn more about this, see Profiling Duplicated
Code.
Class Name
If the routine is a method, this is the name of the class to which it belongs.
Code Type
Specifies the type of the routine’s code. The following values are
possible:
Lines Covered
•
MSIL - Managed-code routine with MSIL (Microsoft
Intermediate Language) code.
•
x64 - 64-bit code routine.
•
x86 - Native-code (unmanaged) routine.
•
Pseudo - Pseudo routine that was created by the context. For
example, <JIT Compiler>, <Garbage Collector>,
<Unknown PInvoke> or <Root>.
•
PInvoke - Native-code routine for which there is a
declaration in one of the managed modules and that is called
from within the unmanaged code.
•
NGen - Managed routine that was compiled by the ngen
utility (CLR Native Image Generator) with the /prof
argument in its command line. The ngen compilation means
that the routine was compiled before the application starts.
•
Script - The routine belongs to a script that was profiled
along with the host application. See Profiling Scripts Overview for details.
•
Byte-code - Java routine that was compiled into an
intermediate byte-code format. See Profiling Java
Applications for details.
Specifies the number of routine’s source lines that were executed during
the profiler run.
Note: Partially executed lines are counted as executed.
Lines Uncovered
Specifies the number of routine’s source lines that were not executed
during the profiler run.
Mark
Specifies if the routine was executed or not during the profiler run.
If the routine was profiled at routine level, Mark holds a green dot if
the method was executed or a red dot if the method was not executed.
If the method was profiled at line level, Mark holds a green dot if all
lines of the method were executed, a red dot if no lines of the method
was executed and a yellow dot if some lines were executed and some
www.automatedqa.com
AQtime by AutomatedQA Corporation
Profilers
Columns (in alphabetical order)
443
Description
were not.
Method Signature
Applies to the results of Java application profiling. Describes the types of
input parameters and the return value of a Java method. The general form
of a method signature argument is: (argument-types)return-type,
and may contain signatures for the following data types:
Signature
Java Type
Z
boolean
B
byte
C
char
S
short
I
int
J
long
F
float
D
double
L fully-qualified-classname; object of the specified class
[ type
array of the specified type
Module Name
The name of the module which contains the profiled routine.
Routine Name
Name of the routine.
Source File
The name of the source file for the method. The values for this column are
read from the application’s debug info. If debug info does not contain
information on the file name, the column is empty.
Source Line
The source file’s line number where the routine’s implementation begins.
The values for this column are read from the application’s debug info.
Total Lines
The total number of source code lines in the routine.
% Covered
The percentage of covered lines against the total number of lines in the
routine. Partially executed lines are counted as executed.
Source Files Data and Modules Data Categories
Columns (in alphabetical order)
Description
File Name or
Name of the source file (or module).
Module Name
The source file name is read from the application’s debug info. If debug
© 2010 AutomatedQA Corp.
www.automatedqa.com/support
444
AQtime Reference
Columns (in alphabetical order)
Description
info does not contain information on the file name, the column is empty.
% Covered
The percentage of covered lines against the total number of lines in the
routines that belong to the source file (module). Partially executed lines
are counted as executed.
Light Coverage Profiler - Details Panel Columns
If a routine was profiled at line level, the Light Coverage profiler uses the Details panel to display
additional profiling results for that routine. The panel holds the Lines table that shows the line profiling results
for the routine selected in the Report panel. This table is empty if the routine was not profiled at line level.
Each row in the table holds profiling results for a source code line:
Columns (in alphabetical order)
Description
Mark
Specifies whether the source line was executed or not. If the line was
executed, the Mark column holds a green dot. If the line was not
executed, Mark holds a red dot. Partially executed lines are counted as
executed.
If the routine was profiled at routine level, AQtime considers all lines of
this routine as executed (if the routine was called) or unexecuted (if the
routine was not called).
Source Line
The line number in the source file.
Light Coverage Profiler Options
The Light Coverage profiler contains options that affect how the current results display. If you change
these options, AQtime will refresh data in its panels.
To modify these options, use the items of the Profiler toolbar. If it is hidden, right-click somewhere within
the toolbar area and select Profiler from the subsequent popup list. The toolbar contains the following items:
•
Show routines with class names - If it is enabled, the Routine Name column of the Report
panel for the Coverage profiler displays the name of the given routine along with the name of the
class the routine belongs to. Otherwise, this column only displays the routine name.
•
File names with path - If this option is enabled, the Source File and Module Name columns
of the Report panel for the Light Coverage profiler hold the entire path to the given file. Else,
these columns hold the file name only.
www.automatedqa.com
AQtime by AutomatedQA Corporation
Profilers
445
Load Library Tracer
The topics of this section provide information about the Load Library Tracer profiler:
Load Library Tracer - Overview
Description of the Report Panel Columns
Description of the Details Panel Columns
Load Library Tracer Options
Load Library Tracer - Overview
The Load Library Tracer determines what dynamic link libraries are being loaded and unloaded by the
profiled application and how many times they were loaded and unloaded. Loading and unloading of a dll
multiple times can significantly slow down the application, and this profiler can help you find such problems.
This topic provides the Load Library Tracer overview. The complete profiler description includes the
following topics:
Overview (this topic)
Description of the Report Panel Columns
Description of the Details Panel Columns
Load Library Tracer Options
As we have said, loading and unloading of a DLL multiple times during the application execution can
significantly slow down the application. To understand why this may happen, let’s explain how the dynamic
link libraries are used.
When an application loads a dynamic link library for the first time, the operating system loads the library
into memory and returns the library’s handle to the application. If the application attempts to load the library
once again, the operating system does not load the library code in memory for the second time. It just increases
the reference counter for the library and returns the library’s handle to the application.
When an application unloads the library, the operating system decreases the reference counter and when
the counter value is 0, the operating system unloads the library from memory.
Now imagine a situation that some function within an application loads a DLL in memory, calls DLL
functions and then unloads the DLL as it is not needed anymore. Some time later another function written by
another developer loads the same DLL in memory, calls some DLL routines and then unloads the DLL.
Loading and unloading of dynamic link libraries requires some time and doing these multiple times will
decrease the overall application performance.
With the Load Library Tracer you can easily detect such situations and optimize your code. The Load
Library Tracer supports both 32- and 64-bit applications. It analyzes DLLs loaded both at load time and run
time.
The profiler reports about all modules used by the tested application, even the modules that are not directly
loaded by the application itself. For example, if you profile an executable that loads Lib1.dll, which in turn
loads Lib2.dll, the profiler will include both Lib1 and Lib2 into the report.
Here is a sample profiler output:
© 2010 AutomatedQA Corp.
www.automatedqa.com/support
446
AQtime Reference
Sample output of the Load Library Tracer (AQtime Standalone)
www.automatedqa.com
AQtime by AutomatedQA Corporation
Profilers
447
Sample output of the Load Library Tracer (AQtime Integrated into Microsoft Visual Studio)
© 2010 AutomatedQA Corp.
www.automatedqa.com/support
448
AQtime Reference
Sample output of the Load Library Tracer (AQtime Integrated into Embarcadero RAD Studio)
As you can see, the Report panel displays modules loaded to and unloaded from memory during the
profiling time. The results include the active module of your AQtime project, since this module is also loaded
to and unloaded from memory at profiling time.
The panel columns indicate the module name, number of loads and unloads, file size and other information
on the libraries. To determine DLLs loaded multiple times, analyze the Load Count column. This column
displays how many times the library was loaded in memory. Large values in this column point to possible
ineffective usage of the DLL.
For information on other Report panel columns, see Load Library Tracer - Report Panel Columns.
Note that the Report panel does not contain all the available columns by default. You can add columns to
the panel at your desire. See also Arranging Columns, Lines and Panels for information on how you can tune
AQtime panels.
The most used libraries are also displayed on the Summary panel:
www.automatedqa.com
AQtime by AutomatedQA Corporation
Profilers
449
To view detailed results for a library, just click its name in the Summary panel. AQtime will bring to front
the Report panel and select the corresponding row in it.
To view information on library loading, double-click the desired library in the Report panel and switch to
the Details panel. This panel contains two tables: Module Instances and Call Stack:
© 2010 AutomatedQA Corp.
www.automatedqa.com/support
450
AQtime Reference
Load Library Tracer results, Details panel (AQtime Standalone)
www.automatedqa.com
AQtime by AutomatedQA Corporation
Profilers
451
Load Library Tracer results, Details panel (AQtime Integrated into Microsoft Visual Studio)
© 2010 AutomatedQA Corp.
www.automatedqa.com/support
452
AQtime Reference
Load Library Tracer results, Details panel (AQtime Integrated into Embarcadero RAD Studio)
Each row of the Module Instances table corresponds to the loading of the DLL in memory. When you
select a row within this table, the Call Stack displays the sequence of function calls that led to loading the
library in memory.
For information on table columns, see Load Library Tracer - Details Panel Columns.
Load Library Tracer - Report Panel Columns
When you view results of the Load Library Tracer, the Report panel displays the list of modules (DLLs)
loaded in memory during the profiling time. The panel also displays the active module of your AQtime project
as it is also loaded in memory during the profiling. The panel contains the following columns:
Columns (in alphabetical order)
Description
#
The index of the library. Indicates the sequence in which libraries were
loaded in memory.
Image Size (bytes)
The size of the library code in memory.
Library Name
The name of the dynamic link library.
Library Path
Path to the library file.
Load Count
Specifies how many times the library was loaded in memory.
Preferred Load Address
The preferred load address specified in the DLL header. The actual
www.automatedqa.com
AQtime by AutomatedQA Corporation
Profilers
Columns (in alphabetical order)
453
Description
address where the dll was loaded is specified in the Load Address
column of the Details panel and in the Event View panel of the message
that informs that the library was loaded. Be aware that if the actual
address where Windows loads the DLL differs from the preferred
address, there will be a time penalty for the required relocations by
Windows at run time.
Relocation Count
Specifies the number of time the DLL was relocated in memory. The
relocation, for instance, occurs when the library is not loaded at the
preferred address specified in its header.
Size (bytes)
Size of the library file in bytes.
Static
If this column is checked, the library was loaded by the executable at the
load time. Else, it was loaded dynamically (at run time).
Successfully Unloaded
Additional indicator that specifies if Load Count is equal to Unload
Count. If results were generated upon closing the profiled application,
this column is always checked. It can be unchecked, if you get results
during the profiling.
To get the results during the profiling, do any of the following:
•
•
•
AQtime standalone:
Select the Run | Get Results item from AQtime’s main
menu.
Press
AQtime integrated into Microsoft Visual Studio:
Select the AQtime | Get Results item from Visual
Studio’s main menu.
Press
Get Results on the AQtime panel.
AQtime integrated into Embarcadero RAD Studio:
Unload Count
Get Results on the Standard toolbar.
Select AQtime | Get Results from RAD Studio’s main
menu.
Specifies how many times the library was unloaded. Usually, this value
equals to Load Count when the application is closed. It can differ from
Load Count when you get results during the profiling.
To get the results during the profiling, do any of the following:
•
•
AQtime standalone:
Select the Run | Get Results item from AQtime’s main
menu.
Press
AQtime integrated into Microsoft Visual Studio:
© 2010 AutomatedQA Corp.
Get Results on the Standard toolbar.
Select AQtime | Get Results item from Visual Studio’s
www.automatedqa.com/support
454
AQtime Reference
Columns (in alphabetical order)
Description
main menu.
•
Press
Get Results on the AQtime panel.
AQtime integrated into Embarcadero RAD Studio:
Select AQtime | Get Results from RAD Studio’s main
menu.
Load Library Tracer - Details Panel Columns
When you review the Load Library Tracer results, the Report panel displays information on libraries that
were loaded in memory at profiling time. The Details panel contains two tables - Module Instances and Call
Stack - display information on loads of the selected library (see profiler description).
Module Instances
Each row of the Module Instances table corresponds to the library load in memory. The panel contains the
following columns:
Columns (in alphabetical order)
Description
Delta (ms)
Specifies the difference between the Unload Time and Load Time
values. In other words, this column specifies the number of
milliseconds, which the module instance existed in memory. If the
unload time cannot be determined, Delta is 0.
Load Address
Specifies the address, at which the library was loaded.
Load Time (ms)
Specifies the number of milliseconds that have passed since the profiler
started and the module was loaded in memory.
Relocation Occurred
Specifies whether the operating system relocated the library in memory
during the load. The relocation occurs, for example, when the operating
system loads the library to another address rather than the address
specified in the library header.
Thread ID
Specifies the identifier of the thread that contains the code that loaded
the module in memory.
Unloaded Thread ID
Specifies the identifier of the thread that contains the code that unloaded
the module from memory.
Unload Time (ms)
Specifies the number of milliseconds that have passed since the profiler
started and the module was unloaded from memory. If the unload time
cannot be determined, this column displays 0.
Note: If you use a computer that has several processors or a multiple-core processor (for example,
dual-core CPU) and has Windows XP Service Pack 2, then you must install the Windows
update #896256 in order for the profiler to be able to time your application correctly. The update
is available on Microsoft’s web site:
www.automatedqa.com
AQtime by AutomatedQA Corporation
Profilers
455
http://support.microsoft.com/kb/896256
Call Stack
The Call Stack panel displays the sequence of function calls that led to loading the library in memory.
Each row in the panel corresponds to a routine. The panel contains the following columns:
Columns (in alphabetical order)
Description
#
Index of routine in the call stack. The function with index 0 contains
calls to API functions that loaded the library in memory.
Class Name
The name of the class to which the routine belongs.
Line No
Number of the source line holding the call to the next routine (the routine
having lower index) in the stack.
Module Name
The name of the module that contains the routine’s code.
Namespace
The name of the namespace, to which the routine’s source code belong.
Routine Name
The name of the routine.
Source File
Name of the source file that contains the routine’s source code. This
name is loaded from debug information. If debug info does not contain
information on the file name, the column is empty.
Source Line
The source line number in the source file, at which the routine’s code
begins.
Token
The routine’s token.
Unit Name
Name of the unit holding the routine’s source code.
Note that AQtime retrieves some part of information displayed in the Call Stack from the module’s debug
information. So, if the module does not have debug information or the debug information does not contain
needed data, some of the Call Stack columns can be empty.
Load Library Tracer Options
The Load Library Tracer includes one option only:
•
Stack depth - Specified the maximum number of traced routines in the stack. Default value is 80.
To modify the profiler options, select Options | Options from AQtime’s main menu (this will call the
Options dialog) and then choose Profilers | Tracing | Load Library Tracer from the tree view on the left of
the dialog. You can also modify these options by pressing Configure Current Profiler on the Standard
toolbar when the Load Library Tracer profiler is selected.
If you use AQtime integrated into Microsoft Visual Studio, then to modify the profilers options, select
Tools | Options from Visual Studio’s main menu (this will call the Options dialog) and then choose AQtime |
Profilers | Tracing | Load Library Tracer from the tree view on the left of the dialog.
If you use Aqtime integrated into Embarcadero RAD Studio, select AQtime | Options from RAD Studio’s
main menu (this will call the Options dialog) and then choose Profilers | Tracing | Load Library Tracer
from the tree view on the left of the dialog.
© 2010 AutomatedQA Corp.
www.automatedqa.com/support
456
AQtime Reference
Platform Compliance Profiler
The topics of this section provide information about the Platform Compliance profiler:
Platform Compliance Profiler - Overview
Description of the Report Panel Columns
Platform Compliance Profiler Options
Platform Compliance Profiler - Overview
This topic provides the Platform Compliance profiler overview and describes the profiler results. The
complete profiler description includes the following topics:
Overview (this topic)
Description of the Report Panel Columns
Platform Compliance Profiler Options
The Platform Compliance profiler helps determine whether the profiled application can work on a
specific operating system. It is a static profiler. Running it means running the profiler on the application, but
not running the application itself.
The Platform Compliance profiler analyzes unmanaged modules only. It is so remarkably informative,
complete and easy to run (a matter of seconds) that you will likely run it on all your applications. Unlike other
profilers it does not require the application to be compiled with the debugger information. Its one limitation is
that it depends on static information. All platform calls under Windows are DLL calls. DLL's can be statically
linked, that is, be called using addresses defined at compile time, or dynamically linked, that is, be called using
addresses found at runtime only, and especially from DLL's that are likely to change. The Platform
Compliance cannot check dynamically defined calls.
This limitation especially affects the profiling of Visual Basic applications. In Visual Basic, statically
linked calls are those defined through the DECLARE statement. If your VB application uses only the
MSVBVM50 (Visual Basic 5.0) or MSVBVM60 (Visual Basic 6.0) libraries and uses no DECLARE of its own,
the Platform Compliance profiler will yield no information at all in the Report panel.
Statically linked calls are said to be exported, and their target functions to be imported at runtime from
system libraries which export them (make them available to external calls). The Platform Compliance profiler
analyzes all of the exported calls that address system libraries (that is, DLLs), and checks which of the
platform’s libraries will support the call and how. This analysis is done against a database of compliance
information that is part of the AQtime installation.
Here is an example output of the Platform Compliance profiler:
www.automatedqa.com
AQtime by AutomatedQA Corporation
Profilers
457
Sample Output of the Platform Compliance Profiler (AQtime Standalone)
© 2010 AutomatedQA Corp.
www.automatedqa.com/support
458
AQtime Reference
Sample Output of the Platform Compliance Profiler (AQtime Integrated into Microsoft Visual Studio)
www.automatedqa.com
AQtime by AutomatedQA Corporation
Profilers
459
Sample Output of the Platform Compliance Profiler (AQtime Integrated into Embarcadero RAD Studio)
As you can see, each row in the Report panel holds a compliance result for an operating system routine that
is used by your application. By default, the profiler results are grouped by the Platform, Compliance and
Module Name columns. For complete information on the Report panel columns, see Platform Compliance
Profiler - Report Panel Columns.
The Platform Compliance profiler uses a special type of filtering that is set before the data collection. Calls
with a certain compliance status can be eliminated from the results for clarity. This pre-filtering is set by the
Platform Compliance Settings dialog. If the Show Platform Compliance Settings option is enabled, the dialog
will be displayed before starting each run of the Platform Compliance profiler.
Warning-type compliance values are always included in the results. They are -- Non-Functional, Special
Usage, Special Requirements and Unknown. Other compliance categories can be filtered out through the first
two settings in the dialog:
Setting
Obsolete
Unsupported
Description
and Supported functions are removed from results. Functions of other categories
remain.
Only Unsupported
Supported and Obsolete functions are removed from results. Functions of other
categories remain.
Full Analysis
All compliance categories are included in results.
© 2010 AutomatedQA Corp.
www.automatedqa.com/support
460
AQtime Reference
Platform Compliance Profiler - Report Panel Columns
When displaying results of the Platform Compliance profiler, the Report panel holds the following
columns:
Columns (in alphabetical order)
Description
API Name
Function name according to the system API (Application Programming
Interface).
Compliance
Compliance of the call for the platform specified by the Platform column.
This column can display the following values:
Supported
The call is correctly supported.
Unsupported
The function is absent from the DLL for this OS.
When loading the DLL, the application will
display an error message.
Obsolete
The function is present and active, but obsolete.
Using it is not recommended by the platform
maker.
Special
Requirements
The call will be supported if some additional
software is present on the machine, as listed in
the Notes column. If the software is absent, the
compliance status is Unsupported.
Non-functional
Though MSDN reports this function as
«unsupported», it is present and will prevent an
error message from being posted. However, calls
to it will do nothing.
Special Usage
The function is present and active, but it is not
fully functional. E.g. it may ignore some
parameters.
Unknown
AQtime does not have any information about the
function.
Imported By Name
If this column is checked, the routine is imported by name. Otherwise, the
routine is imported by ordinal.
Imported From
Name of the system dynamic link library which exports the function. This
name may or may not have the dll extension.
Module Name
Name of the application module (.exe, .dll, etc.) which calls the function.
Notes
Additional information about compliance conditions.
Platform
Name of the platform (operating system).
Reference
Hyperlink to the on-line function documentation. To open it, simply
www.automatedqa.com
AQtime by AutomatedQA Corporation
Profilers
461
Columns (in alphabetical order)
Description
double-click on the cell.
Platform Compliance Profiler Options
The Platform Compliance profiler offers the only customizable option - Compliance level. It specifies
what type of API calls to check for. It can be one of the following values:
Value
Description
Obsolete
Unsupported
and Supported functions are removed from results. Functions of other categories
(special requirements, obsolete, non-functional, etc.) remain.
Only Unsupported
Supported and Obsolete functions are removed from results. Functions of other
categories remain.
Full Analysis
All compliance categories are included in results.
To change the option, do any of the following:
•
•
AQtime standalone:
Select Options | Options from AQtime’s main menu and then choose Profilers | Static
Analysis | Platform Compliance in the ensuing Options dialog.
Configure Current Profiler on the Standard toolbar when the Platform
Press
Compliance profiler is selected.
AQtime integrated into Microsoft Visual Studio:
•
Select Tools | Options from Visual Studio’s main menu and then choose the AQtime |
Profilers | Static Analysis | Platform Compliance group in the ensuing Options dialog.
AQtime integrated into Embarcadero RAD Studio:
Select AQtime | Options from RAD Studio’s main menu and then choose Profilers |
Static Analysis | Platform Compliance in the ensuing Options dialog.
© 2010 AutomatedQA Corp.
www.automatedqa.com/support
462
AQtime Reference
Reference Count Profiler
This topics of this section describe the Reference Count profiler:
Reference Count Profiler - Overview
Description of the Report Panel Columns
Description of the Columns of the Details and Call Tree Panels
Reference Count Profiler Options
Reference Count Profiler – Overview
The Reference Count profiler tracks the number of references to interface objects. This topic provides the
Reference Count profiler overview. The complete profiler description includes the following topics:
General Information (this topic)
Profiler Description (this topic)
Description of the Report Panel Columns
Description of the Details Panel Columns
Reference Count Profiler Options
Reference Count Profiler Tutorial
General Information
The COM (Component Object Model) specifications require that individual objects remain alive as long as
there are clients which have acquired access to one or more of its interfaces. Moreover, the COM object should
be properly disposed when all code that used the object have finished and the object is no longer utilized.
To fulfill these requirements the reference counting technique is applied. The general idea of reference
counting is as follows:
•
Each COM object maintains a special variable that stores the current number of references to the
object.
•
When a new client acquires access to the object’s interface, the reference counter is increased.
•
When the client has finished using the COM object, the counter is decreased. If the reference
counter equals zero, then the object is no longer required and can be released.
To implement reference counting, every COM object supports the IUnknown interface or its descendants.
The interface declares the AddRef and Release methods that increment or decrement the object reference
counter.
The purpose of AddRef is to indicate to the COM object that an additional reference to the object has been
added, and hence it is necessary to remain alive as long as this reference is still valid. Conversely, the purpose
of Release is to indicate to the COM object that a client (or a part of the client’s code) has no further need for
it and hence if this reference count has dropped to zero, it may be time to destroy itself.
Some high-level programming languages, like Delphi and Visual Basic, provide automatic reference
counting. In these languages, a new reference is added automatically when a new object is created. And when
the object goes beyond its visibility scope, the references to it are automatically removed. Thus, COM objects
are typically used without explicit calls to the AddRef and Release methods. Though still there can be
situations when you need to call these methods manually. In another programming languages, for example, in
C++, the programmer should care of reference counting all by himself.
www.automatedqa.com
AQtime by AutomatedQA Corporation
Profilers
463
In any case, when these methods are called manually, each AddRef should have a matching Release call.
If the number of AddRef calls exceeds the number of Release calls, the interface object will never be freed,
thus producing a memory leak. If Release is called more times than AddRef, the reference object will be
destroyed prematurely. In the latter case, an access violation will occur when a non-existing interface object is
addressed.
Therefore, the code snippets in which AddRef and Release are called explicitly should be inspected first
if you encounter problems with interface objects. The Reference Count profiler would be useful in this
situation.
Profiler Description
The Reference Count Profiler analyzes the use of objects that implement the IUnknown interface or its
descendants. The main goal of the profiler is locate unreleased or prematurely released interface objects. It logs
calls to the AddRef and Release methods, traces their call stack and reports how many references were used
for each object, in total and as a peak count for the run.
The Reference Count profiler operates during the entire run of the application. It takes no account of
Enable/Disable Profiling button.
triggers and actions and disables the
The profiling results are displayed in the Report panel and are organized into the Classes Data and
Objects categories. The first category provides a general overview of which classes produce interface objects,
as well as information about the total, peak or current number of object references to this class. It reports data
about every interface class that was utilized during the whole runtime of the application, no matter whether it
existed when the results were retrieved. The Objects category provides a more detailed report on each interface
object that existed at time when results were generated. See Report column descriptions for a full list of
displayed columns.
© 2010 AutomatedQA Corp.
www.automatedqa.com/support
464
AQtime Reference
Sample output of the Reference Count profiler (AQtime Standalone)
www.automatedqa.com
AQtime by AutomatedQA Corporation
Profilers
465
Sample output of the Reference Count profiler (AQtime Integrated into Microsoft Visual Studio)
© 2010 AutomatedQA Corp.
www.automatedqa.com/support
466
AQtime Reference
Sample output of the Reference Count profiler (AQtime Integrated into Embarcadero RAD Studio)
When the Objects category is active in the Report panel, you can switch to the Details, Call Tree and Call
Graph panels in order to find additional information about the selected object. The Details panel includes three
panes, Creation Call Stack, References and AddRef / Release Call Stack. The Creation Call Stack pane
describes how the chosen object was created. The latter two panes report how the object references were made
and removed. Both of the call stack panes display the code instructions, and a double-click on any instruction
will take you to the corresponding line in the source code (if it is available to the Editor panel).
The Call Graph and Call Tree panels show how the reference counter was modified during the
application execution, how it was altered by calls to this or that routine. The Call Graph displays this data in
graphical form, while the Call Tree uses the table view with expandable rows.
www.automatedqa.com
AQtime by AutomatedQA Corporation
Profilers
467
Like any other profilers, the results are automatically generated when the profiled application is
Get Results command. See, Getting Results During
terminated, or can be obtained at runtime via the
Profiling. The first way reveals the leaked interface objects, that is objects that still have unreleased references
to them. If the results were retrieved after the application was terminated and the Report panel contains any
items in the Objects category, then these objects were not properly disposed. The latter way to obtain results
allows you to inspect how the references are created/released during the application execution.
Reference Count Profiler - Report Panel Columns
When displaying results of the Reference Count profiler, each row in the Report panel holds the results
either for the entire class or for individual objects. Which values are displayed depends on the category
selected in the Explorer panel -Classes Data Category
Objects Category
Classes Data Category
When this category is active, the Report panel shows information about interface classes created during the
application runtime. All classes that implement the IUnknown interface are listed in the Report panel, even if
all class instances were destroyed at the moment the results are generated. The panel holds the following
columns:
Columns (in alphabetical order)
Description
Class Name
The name of the class.
Live Count
The number of objects that currently exist in memory.
Live Size
The size of the currently existing objects (in bytes).
Module Name
The name of the module in which the class is defined.
Peak Created
The maximum number of concurrent objects reached during the run.
Peak Size
The maximum size of concurrent objects reached during the run (in
bytes).
© 2010 AutomatedQA Corp.
www.automatedqa.com/support
468
AQtime Reference
Columns (in alphabetical order)
Description
Total Created
The total number of objects that were created during the application run.
Total Size
Memory needed for all the objects that were created during the run.
Objects Category
When this category is active, the Report panel shows information about object instances that exist at the
moment the results are generated. This means, that if an object was created and destroyed before the results
were generated then it is not shown in the Report panel. The panel holds the following columns:
Columns (in alphabetical order)
Description
#
The creation number of the given object.
Address
The memory address where the object was allocated.
Class Name
The name of the object’s class.
Get #
The ordinal number of the Get Results command that generated the
current result set. For instance, if you pressed
Get Results two times
during the profiler run, you will get three result sets (the third result set
will be generated after the application closes) with numbers 1, 2 and 3.
The Get # value in all records of the first result set will hold 1; in the
second result set this column will hold 2 and in the third result set the
column will hold 3.
The Get # column is used for comparison purposes. It lets you easily see
which objects were created or deleted between two result generations.
Live References
The number of currently existing object references.
Module Name
The name of the executable module in which the object’s class is
defined.
Object Name
The name of the object. It is formed as Class Name + period + number.
For example, TTestClass.3 means the third TTestClass instance that
was created after the profiling started.
Peak References
The maximum number of object references that were maintained
simultaneously.
Size
The size of the object in bytes.
Thread
Specifies the thread in which the object’s constructor was called.
Total References
The total number of object references that were created.
Reference Count Profiler - Columns of the Details and Call Tree Panels
The Reference Count profiler organizes results into two categories: Classes and Objects. When the Objects
category is selected in the Explorer panel, the Report panel holds results for each interface object that existed
when the results were being generated. If you select a Report panel row that corresponds to a single object
www.automatedqa.com
AQtime by AutomatedQA Corporation
Profilers
469
instance, the Reference Count profiler will display information about this instance in the Details, Call Tree
and Call Graph panels. These three panels are only useful when the Objects category is selected, they are not
available for the Classes category.
The Details panel holds three panes: Creation Call Stack, References and AddRef / Release Call Stack.
The latter two panes display linked data and by default are shown in a single layout.
The Creation Call Stack pane displays the routine calls that led to the creation of the object instance
selected in the Report panel. The routine that created the given instance is shown at the top of the call stack.
The pane has the following columns:
Columns (in alphabetical order)
Description
Class Name
The name of the object class that holds the routine.
Hit Count
The number of routine calls per selected routine.
Module Name
The name of the module that holds the routine.
Routine Name
The name of the routine.
Source File
The name of the source file for the routine. The values for this column
are read from the application’s debug info. If the debug info does not
contain information on the file name, the column is empty.
Source Line
The source file’s line number where the routine’s implementation
begins. The values for this column are read from the application’s debug
info.
The References pane lists the methods that increased (AddRef) or decreased (Release) the reference
counter of the object selected in the Report panel. The pane has the following columns:
Columns (in alphabetical order)
Description
#
The order number of method’s call.
AddRef/Release
The name of the methon that changed the counter. Only two values are
possible: either AddRef or Release.
The sequence of routines that caused a certain method call is shown in the AddRef / Release Call Stack
pane. These two panes complement each other. The AddRef / Release Call Stack pane has the following
columns:
Columns (in alphabetical order)
Description
Call No
The caller rank in the call stack. The topmost caller has an index of 0.
Module Name
The name of the module that holds the routine.
Routine Name
The name of the routine.
Source File
The name of the source file for the routine. The values for this column
are read from the application’s debug info. If the debug info does not
contain information on the file name, the column is empty.
© 2010 AutomatedQA Corp.
www.automatedqa.com/support
470
AQtime Reference
Columns (in alphabetical order)
Description
Source Line
The source file’s line number where the routine’s implementation
begins. The values for this column are read from the application’s debug
info.
You can double-click any routine in the Creation Call Stack pane or in the AddRef / Release Call Stack
table to open (if the source file is available) the corresponding code line in the Editor panel.
The Call Tree and Call Graph panels show changes made to the reference counter during the application
run. They both represent the hierarchy of the routines used to create or delete references: the Call Graph
provides a graphical scheme, whereas the Call Tree panel provides information in tables. The Call Tree panel
contains the following columns:
Columns (in alphabetical order)
Description
Hit Count on Enter
The routines’ call number that signifies when it was placed in the stack.
Module Name
The name of the module that holds the routine.
RefCount Change
The number by which the reference counter was modified.
Routine
The name of the routine.
Source File
The name of the source file for the routine. The values for this column
are read from the application’s debug info. If the debug info does not
contain information on the file name, the column is empty.
Source Line
The source file’s line number where the routine’s implementation
begins. The values for this column are read from the application’s debug
info.
Reference Count Profiler Options
The Reference Count profiler includes a number of options that can be customized. To modify them, do
any of the following:
•
•
AQtime standalone:
Select Options | Options from AQtime’s main menu (this will call the Options dialog),
and then choose Profilers | Allocation | Reference Count Profiler from the tree view on
the left of the dialog.
Press
Configure Current Profiler on the Standard toolbar when the Reference
Count profiler is selected.
AQtime integrated into Microsoft Visual Studio:
•
Select Tools | Options from Visual Studio’s main menu (this will call the Options dialog)
and then select AQtime | Profilers | Allocation | Reference Count Profiler from the tree
view on the left of the dialog.
AQtime integrated into Embarcadero RAD Studio:
Select AQtime | Options from RAD Studio’s main menu (this will call the Options
dialog), and then choose Profilers | Allocation | Reference Count Profiler from the tree
view on the left of the dialog.
www.automatedqa.com
AQtime by AutomatedQA Corporation
Profilers
471
In the dialog, the following options are available:
•
Collect stack information - Specifies how the profiler should collect information on call stacks
when creating objects. The following values are available: None, By routines and By lines. Tracing
the call stack can significantly slow down the profiled application. If you do not need information
on call stacks, you can set this option to None. By routines means that call stack entries will only
include information about routines. If you want the call stack entries to include information on
source line numbers as well, set the option to By lines. This will let you, for example, determine
from which source line a function was called. Tracing source lines, however, requires time.
•
Thread model - Specifies how the Reference Count profiler gathers statistics for threads in the
profiled application. For more information on available values for this option, see Profiling
Multiple Threads and Profiling COM Logical Threads.
© 2010 AutomatedQA Corp.
www.automatedqa.com/support
472
AQtime Reference
Resource Profiler
The topics of this section provide information about the Resource profiler:
Resource Profiler - Overview
Analyzing Resource Profiler Results
Using Resource Profiler With .NET Applications
Resource Profiler - List of Checked Functions
Description of the Report Panel Columns
Description of the Details Panel Columns
Resource Profiler Options
Resource Profiler - Overview
The Resource profiler checks to see if the application being profiled creates Windows resources correctly
and releases all of the allocated resources. (Both 32-bit and 64-bit applications are supported.) This topic
provides the Resource profiler overview. The complete profiler description includes the following topics:
Overview (this topic)
Analyzing Resource Profiler Results
Description of the Report Panel Columns
Description of the Details Panel Columns
Resource Profiler Options
Resource Profiler Tutorial
The Resource profiler keeps tabs on the Windows resource usage monitoring resource allocations and
deallocations and calls to the resource management routines. For instance, if the application attempts to delete
a pen currently selected in the device context, the profiler will add the «Attempt to delete the object selected in
DC» error message to the Report panel. For the full list of the checked resource management functions, see
Resource Profiler - List of Checked Functions.
Note: AQtime may report that there was an attempt to free a non-allocated resource, while this resource
actually is allocated. AQtime may also report about non-existent resources if you profile your
application using the «Attaching to Process» feature. For more information, see Non-Existent
Resources in the Report Panel.
The Resource profiler tracks calls to Windows API functions that deal with resources. It is meant to be
used for unmanaged (native-code) applications. In managed (.NET-connected) applications, the work with
resources is implemented with objects that support the IDisposable interface. The Resource profiler does
not track allocations and deallocations of these resources.
Nevertheless, you can use the Resource profiler to see how your managed code works with Windows
resources. This may be helpful for information purposes. In order for AQtime to be able to do this, you need to
add the mscorwks.dll assembly to your AQtime project. See Using Resource Profiler With .NET Applications.
The Resource profiler always traces the entire application to be profiled; it ignores profiling areas and the
Profile Entire .NET Code option. The Resource profiler operates during the entire run of the application. It
Enable/Disable Profiling button.
takes no account of triggers and actions and disables the
By default, the Resource profiler reports only the resource types whose instances had been allocated
before the results were generated. However, the profiler includes the Show all resources option that lets you
www.automatedqa.com
AQtime by AutomatedQA Corporation
Profilers
473
extend the report. This option is displayed on the Profiler toolbar ( ). If this option is enabled, the profiler
reports about all the resource types the profiler traces even if no instances were allocated for these resource
types. If you do not want to see these resource types in the report, uncheck the Show all resources option.
The second option on the same toolbar,
View project classes only, controls for which modules AQtime
displays resource-profiling results. If this option is disabled (this is its default state), AQtime displays profiling
results for all the modules used by the application being profiled. Often, this setting substantially extends the
report. If the option is enabled, AQtime displays profiling results only for those modules that are added to the
Setup panel.
The third toolbar option,
Filter objects by stack, operates on a similar principle. If this option is
enabled, AQtime only displays those objects that were created in one of the «Setup» modules. If the option is
disabled (default state) all traced objects are displayed.
The last filtering option is
Filter standard leaks, it hides information about resource leaks that occurred
in standard third-party classes and libraries (VCL, MFC and others).
Using these options, you can get rid of profiling results you do not need at the moment.
Analyzing Resource Profiler Results
The Resource profiler traces how the profiled application uses Windows resources. Like other AQtime
profilers, the Resource profiler generates results upon selecting Run | Get Results from AQtime’s main menu
or after the application terminates. If you use AQtime integrated into Micrsoft Visual Studio, then to generate
Get Results on Visual Studio’s AQtime toolbar. If you use AQtime integrated into
the results, click
Embarcadero RAD Studio, then to generate the results, select AQtime | Get Results from RAD Studio’s
menu.
The Summary panel displays brief profiling results. It reports about resources with maximum number of
existing instances, resources with maximum number of created instances, etc. Information about all the
resources that are used by the application is shown in the Report panel. Here is a sample output of the
Resource profiler:
© 2010 AutomatedQA Corp.
www.automatedqa.com/support
474
AQtime Reference
Sample Output of the Resource Profiler - Classes Data Category (AQtime Standalone)
www.automatedqa.com
AQtime by AutomatedQA Corporation
Profilers
475
Sample Output of the Resource Profiler - Classes Data Category (AQtime Integrated into Microsoft Visual Studio)
© 2010 AutomatedQA Corp.
www.automatedqa.com/support
476
AQtime Reference
Sample Output of the Resource Profiler - Classes Data Category (AQtime Integrated into Embarcadero RAD Studio)
As you can see, the Resource profiler results are divided into three categories: Classes Data, Objects and
Errors. These categories are displayed as subnodes of the result set node in the Explorer panel. The contents
of the other panels (Report, Details, Editor, etc.) depend on the currently selected category.
•
Classes Data. When this category is selected, the Report panel displays information about
resource types whose instances were created during the run.
Each row in the Report panel shows profiling results for every single resource type whose
instances were allocated from the given module (for instance, if the profiled application created
resources of the Handle type from two modules, e.g. msctf.dll and winmm.dll, the Report panel
will have two records about this resource type, one for each module). These profiling results
include the total and current number of resource instances, their size, etc. For more detailed
information, review Resource Profiler - Report Panel Columns. This gives you a summary view
on what happened with resources in the application during profiling (you can also view the
summary results in the Summary panel). Note that by default the Report panel holds only some of
available columns. You can add more columns to the panel or remove columns from it. For more
information on this, see Adding and Removing Columns.
www.automatedqa.com
AQtime by AutomatedQA Corporation
Profilers
477
Sample Output of the Resource Profiler - Classes Data Category (AQtime Standalone)
Sample Output of the Resource Profiler - Classes Data Category (AQtime Integrated into Microsoft Visual Studio)
© 2010 AutomatedQA Corp.
www.automatedqa.com/support
478
AQtime Reference
Sample Output of the Resource Profiler - Classes Data Category (AQtime Integrated into Embarcadero RAD Studio)
To determine if resource instances were existing at the moment of results generation, check the
Live Count column value. If it is greater than 0, resource instances existed. If you obtain results
upon closing the application, non-zero values in the Live Count column help you find resource
leaks. To find them faster, you can sort or filter results on the Live Count column.
Note that if the Resource profiler encounters a call to a function that reallocates a resource that is
already allocated (e.g. CoTaskMemRealloc, SysReAllocString, SysReAllocStringLen,
etc.), the profiler «thinks» that this function deallocates the existing resource and allocates it anew
(this is what really happens to this resource). Thus, the profiler increments the total number of
resource instances of the corresponding type that were created during the run. For instance, if you
call the SysAllocString function to allocate a string, the profiler will inform you about one live
resource instance of the Sys strings type. In this case, the total number of created resource
instances of that type will be 1. Then, if you call SysReAllocString to reallocate that string, the
Resource profiler will inform you that you still have one live resource instance of the Sys strings
type, but the total number of created resource instances of that type will be 2.
The footer of the Report panel column holds summary values for data displayed in that column.
For instance, the footer of the Live Size column displays the summary size of all resource
instances that existed at the moment of results generation. If you select two or more resource type
records in the Report panel, the footer will show the summary values for the selected resource
types only (for more information on how to select several rows in a panel, see Selecting Several
Records in a Panel).
•
Objects. When this category is selected, the Report panel displays information about resource
instances that exist in the application at the moment the results are generated. Every row in the
panel holds results for a single resource instance. The Object Name column serves as the resource
instance identifier. For instance, the name Icon.5 means the fifth resource instance of the Icon type
www.automatedqa.com
AQtime by AutomatedQA Corporation
Profilers
479
created after profiling started. To view all resource instances of a certain type, filter results on the
Class Name column (See Filtering Results).
The Report panel columns are completely described in a separate topic, Resource Profiler - Report
Panel Columns. Here we would like you to pay attention to the Get # column. It displays the
ordinal number of the result set within a run. For instance, if you pressed
Get Results during
the Resource profiler run, you get two result sets: one that was generated upon pressing that button
and another one that were generated upon closing the profiled application. In the first result set, in
all records the Get # column will hold 1; in the second result set this column will hold 2. You can
use these values for comparison purposes. For instance, when you compare two result sets, the
column will clearly tell you what resource instances were created or deleted between the two
moments of results generation.
The Report panel is the «main» results display for resource instances. The Details and Editor
panels display additional results for the resource instance selected in the Report panel.
The Details panel holds one pane: Creation Call Stack. It displays the stack of function calls that
led to the resource instance creation. The topmost routine in this stack is the API function that
created the resource instance. Columns of the Creation Call Stack page hold information that helps
you locate the routine in source code. For more detailed information, review Resource Profiler Details Panel Columns.
The Details Panel Contents for the Resource Profiler (AQtime Standalone)
© 2010 AutomatedQA Corp.
www.automatedqa.com/support
480
AQtime Reference
The Details Panel Contents for the Resource Profiler (AQtime Integrated into Microsoft Visual Studio)
www.automatedqa.com
AQtime by AutomatedQA Corporation
Profilers
481
The Details Panel Contents for the Resource Profiler (AQtime Integrated into Embarcadero RAD Studio)
To view the source code of a routine, simply double-click it in the call stack - AQtime will bring up
the Editor panel and position the cursor on the first line of the routine’s source code (the source
file of the routine must be specified in the Project Search Directories. In addition, to view sources
of your managed applications in the Editor, you should compile the application with debug
information. See How AQtime Profilers Use Metadata and Debug Information).
The Creation Call Stack is available if the profiler’s Collect stack information option is set to By
routines or By lines. To disable the call stack tracing, set this option to None.
•
Errors. When this category is selected, the Report panel displays information about errors that
occurred in resource-related Windows functions called during the application run. For instance, if
the CreateIcon function fails, it will be reported here. For each error listed, you can see in which
function it occurred, a description of the error and a link to the MSDN topic that holds
comprehensive information about the given function. Thus, you can quickly find out what
resource-related functions failed (if any) and why this happened.
© 2010 AutomatedQA Corp.
www.automatedqa.com/support
482
AQtime Reference
Sample Output of the Resource Profiler - Errors Category (AQtime Standalone)
Sample Output of the Resource Profiler - Errors Category (AQtime Integrated into Microsoft Visual Studio)
www.automatedqa.com
AQtime by AutomatedQA Corporation
Profilers
483
Sample Output of the Resource Profiler - Errors Category (AQtime Integrated into Embarcadero RAD Studio)
Like for the Objects category of profiling results (see above), the Details panel displays call stack
information. In this panel, this is the stack of function calls that led to the error selected in the
Report panel. If your application was compiled with debug information, you can view the source
code of the routine selected in the call stack. For this purpose, just double-click the routine in the
call stack.
Using Resource Profiler With .NET Applications
The Resource profiler does not trace resource allocations and deallocations done with .NET objects. The
profiler traces only the use of Windows resources. You can use it to see how your managed (.NET-connected)
application uses Windows resources. This will help you decide whether you need to optimize your application
or not. For instance, if your application allocates too many GDI handles at some point of time, you may
consider using other components or reducing the number of controls on forms.
In .NET, the code that operates Windows resources resides in the mscorwks.dll assembly (that is, this
assembly contains functions that allocate and release resources). You need to add this assembly to your
AQtime project to make the profiler able to track the use of Windows resources in your application.
The assembly is part of Microsoft .NET Framework. You can find it in the
<Windows>\Microsoft.NET\Framework\<framework_version> folder. If several versions of the .NET
Framework are installed on your computer, add the assembly that is used by the Framework version that is
appropriate for your application. For detailed instructions on adding modules to AQtime projects, see Selecting
Applications and Modules to Profile.
© 2010 AutomatedQA Corp.
www.automatedqa.com/support
484
AQtime Reference
After you add the assembly, you can start the profiling. To get information on Windows resources that are
used at certain point of the run, use the Get Results command. The profiler will generate results and display
them in AQtime’s Report panel. Note that as mscorwks.dll does not have debug information, AQtime cannot
trace the call stacks for allocated resources.
Resource Profiler - List of Checked Functions
All the functions calls to which the Resource profiler traces are divided into five groups in accordance with
the DLL a function is exported from:
COM Resources (ole32.dll and oleaout32.dll)
GDI and User Resources (gdi32.dll, user32.dll and shell32.dll)
GDI+ Resources (gdiplus.dll)
Kernel Resources (kernel32.dll, uxtheme.dll, wininet.dll and odbc32.dll)
Print Spooler Resources (printspool.drv)
Registry Resources (advapi32.dll and shlwapi.dll)
Using the Resource categories to check option of the Resource profiler, you can specify whether the
profiler should track all the functions of this or that category.
"COM Resources" Function Category (ole32.dll and oleaout32.dll)
CoInitialize
CoInitializeEx
CoTaskMemAlloc
CoTaskMemFree
CoTaskMemRealloc
CoUninitialize
OleInitialize
OleUninitialize
SafeArrayAllocDescriptor
SafeArrayAllocDescriptorEx
SafeArrayCopy
SafeArrayCreate
SafeArrayCreateEx
SafeArrayCreateVector
SafeArrayCreateVectorEx
www.automatedqa.com
AQtime by AutomatedQA Corporation
Profilers
485
SafeArrayDestroy
SafeArrayDestroyData
SafeArrayDestroyDescriptor
SafeArrayGetElement
StringFromCLSID
StringFromIID
SysAllocString
SysAllocStringByteLen
SysAllocStringLen
SysFreeString
SysReAllocString
SysReAllocStringLen
VariantClear
VariantCopy
VariantCopyInd "GDI and User Resources" Function Category (gdi32.dll, user32.dll and
shell32.dll)
CallWindowProcA
CallWindowProcW
CloseEnhMetaFile
CloseMetaFile
CloseWindowStation
CopyCursor
CopyEnhMetaFileA
CopyEnhMetaFileW
CopyIcon
CopyImage
CopyMetaFileA
CopyMetaFileW
CreateAcceleratorTableA
CreateAcceleratorTableW
CreateBitmap
CreateBitmapIndirect
CreateBrushIndirect
CreateColorSpaceA
CreateColorSpaceW
CreateCompatibleBitmap
CreateCompatibleDC
CreateCursor
© 2010 AutomatedQA Corp.
www.automatedqa.com/support
486
AQtime Reference
CreateDCA
CreateDCW
CreateDialogIndirectParamA
CreateDialogIndirectParamW
CreateDialogParamA
CreateDialogParamW
CreateDIBitmap
CreateDIBPatternBrush
CreateDIBPatternBrushPt
CreateDIBSection
CreateDiscardableBitmap
CreateEllipticRgn
CreateEllipticRgnIndirect
CreateEnhMetaFileA
CreateEnhMetaFileW
CreateFontA
CreateFontW
CreateFontIndirectA
CreateFontIndirectW
CreateFontIndirectExA
CreateFontIndirectExW
CreateHalftonePalette
CreateHatchBrush
CreateICA
CreateICW
CreateIcon
CreateIconFromResourceEx
CreateIconIndirect
CreateMDIWindowA
CreateMDIWindowW
CreateMenu
CreateMetaFileA
CreateMetaFileW
CreatePalette
CreatePatternBrush
CreatePen
CreatePenIndirect
CreatePolygonRgn
CreatePolyPolygonRgn
www.automatedqa.com
AQtime by AutomatedQA Corporation
Profilers
487
CreatePopupMenu
CreateRectRgn
CreateRectRgnIndirect
CreateRoundRectRgn
CreateSolidBrush
CreateWindowA
CreateWindowW
CreateWindowExA
CreateWindowExW
CreateWindowStationA
CreateWindowStationW
DefFrameProcA
DefFrameProcW
DefMDIChildProcA
DefMDIChildProcW
DefWindowProcA
DefWindowProcW
DeleteColorSpace
DeleteDC
DeleteEnhMetaFile
DeleteMetaFile
DeleteObject
DestroyAcceleratorTable
DestroyCursor
DestroyIcon
DestroyMenu
DestroyWindow
DuplicateIcon
ExtCreatePen
ExtCreateRegion
ExtractAssociatedIconA
ExtractAssociatedIconW
ExtractAssociatedIconExA
ExtractAssociatedIconExW
ExtractIconA
ExtractIconW
ExtractIconExA
ExtractIconExW
GdipGetDC
© 2010 AutomatedQA Corp.
www.automatedqa.com/support
488
AQtime Reference
GdipReleaseDC
GetClassInfoA
GetClassInfoW
GetClassInfoEx A
GetClassInfoExW
GetDC
GetDCEx
GetEnhMetaFileA
GetEnhMetaFileW
GetIconInfo
GetMetaFileA
GetMetaFileW
GetProcAddress
GetWindowDC
InsertMenuA
InsertMenuW
InsertMenuItemA
InsertMenuItemW
LoadBitmapA
LoadBitmapW
LoadCursorFromFileA
LoadCursorFromFileW
LoadImageA
LoadImageW
LoadKeyboardLayoutA
LoadKeyboardLayoutW
LoadMenuA
LoadMenuW
LoadMenuIndirectA
LoadMenuIndirectW
OpenWindowStationA
OpenWindowStationW
RegisterClassA
RegisterClassW
RegisterClassExA
RegisterClassExW
ReleaseDC
ReleaseStgMedium
SetClipboardData
www.automatedqa.com
AQtime by AutomatedQA Corporation
Profilers
489
SetEnhMetaFileBits
SetMetaFileBitsEx
SetWindowRgn
SetWinMetaFileBits
SHFileOperation
SHFileOperationA
SHFileOperationW
SHFreeNameMappings
SHGetFileInfo
SHGetFileInfoA
SHGetFileInfoW
UnloadKeyboardLayout
"GDI+ Resources" Function Category (gdiplus.dll)
GdipCloneCustomLineCap
GdipCloneFont
GdipCloneFontFamily
GdipCloneImage
GdipCloneMatrix
GdipClonePath
GdipClonePen
GdipCloneRegion
GdipCloneStringFormat
GdipCreateCustomLineCap
GdipCreateFont
GdipCreateFontFamilyFromName
GdipCreateFontFromDC
GdipCreateFontFromLogfontA
GdipCreateFontFromLogfontW
GdipCreateFromHDC
GdipCreateFromHDC2
GdipCreateFromHWND
GdipCreateFromHWNDICM
GdipCreateMatrix
GdipCreateMatrix2
GdipCreateMatrix3
GdipCreateMatrix3I
GdipCreatePath
GdipCreatePath2
© 2010 AutomatedQA Corp.
www.automatedqa.com/support
490
AQtime Reference
GdipCreatePath2l
GdipCreatePen1
GdipCreatePen2
GdipCreateRegion
GdipCreateRegionHrgn
GdipCreateRegionPath
GdipCreateRegionRect
GdipCreateRegionRectl
GdipCreateRegionRgnData
GdipCreateStringFormat
GdipDeleteCustomLineCap
GdipDeleteFont
GdipDeleteFontFamily
GdipDeleteGraphics
GdipDeleteMatrix
GdipDeletePath
GdipDeletePen
GdipDeleteRegion
GdipDeleteStringFormat
GdipDisposeImage
GdipLoadImageFromFile
GdipLoadImageFromFileICM
GdipLoadImageFromStream
GdipLoadImageFromStreamICM
"Kernel Resources" Function Category (kernel32.dll, uxtheme.dll, wininet.dll and
odbc32.dll)
_lclose
_lcreat
_lopen
BeginUpdateResourceA
BeginUpdateResourceW
CloseEventLog
CloseHandle
CloseThemeData
CreateConsoleScreenBuffer
CreateEventA
CreateEventW
CreateFiber
www.automatedqa.com
AQtime by AutomatedQA Corporation
Profilers
491
CreateFiberEx
CreateFileA
CreateFileW
CreateFileMappingA
CreateFileMappingW
CreateMailslotA
CreateMailslotW
CreateMutexA
CreateMutexW
CreateNamedPipeA
CreateNamedPipeW
CreatePipe
CreateProcessA
CreateProcessW
CreateProcessAsUserA
CreateProcessAsUserW
CreateProcessWithLogonW
CreateProcessWithTokenW
CreateRemoteThread
CreateSemaphoreA
CreateSemaphoreW
CreateThread
CreateTransaction
DeleteCriticalSection
DeleteFiber
DeregisterEventSource
DuplicateHandle
EndUpdateResourceA
EndUpdateResourceW
FindClose
FindCloseChangeNotification
FindFirstChangeNotificationA
FindFirstChangeNotificationW
FindFirstFileA
FindFirstFileW
FindFirstFileExA
FindFirstFileExW
FtpFindFirstFileA
FtpFindFirstFileW
© 2010 AutomatedQA Corp.
www.automatedqa.com/support
492
AQtime Reference
FtpOpenFileA
FtpOpenFileW
GetThemeSysColorBrush
GopherFindFirstFileA
GopherFindFirstFileW
GopherOpenFileA
GopherOpenFileW
HttpOpenRequestA
HttpOpenRequestW
InitializeCriticalSection
InternetConnectA
InternetConnectW
InternetOpenA
InternetOpenW
MapViewOfFile
MapViewOfFileEx
OpenBackupEventLogA
OpenBackupEventLogW
OpenEventA
OpenEventW
OpenEventLog A
OpenEventLogW
OpenFile
OpenFileMappingA
OpenFileMappingW
OpenMutexA
OpenMutexW
OpenProcess
OpenSemaphoreA
OpenSemaphoreW
OpenThemeData
OpenTransaction
RegisterEventSourceA
RegisterEventSourceW
ReleaseMutex
ReleaseSemaphore
RetrieveUrlCacheEntryStreamA
RetrieveUrlCacheEntryStreamW
SQLAllocConnect
www.automatedqa.com
AQtime by AutomatedQA Corporation
Profilers
493
SQLAllocEnv
SQLAllocHandle
SQLAllocStmt
SQLFreeConnect
SQLFreeEnv
SQLFreeHandle
SQLFreeStmt
TerminateThread
TlsAlloc
TlsFree
UnlockUrlCacheEntryStream
UnmapViewOfFile
"Print Spooler Resources" Function Category (printspool.drv)
AddPrinterA
AddPrinterW
ClosePrinter
OpenPrinterA
OpenPrinterW
"Registry Resources" Function Category (advapi32.dll and shlwapi.dll)
RegCloseKey
RegConnectRegistryA
RegConnectRegistryW
RegCreateKeyA
RegCreateKeyW
RegCreateKeyExA
RegCreateKeyExW
RegCreateKeyTransacted
RegOpenKeyA
RegOpenKeyW
RegOpenKeyExA
RegOpenKeyExW
RegOpenKeyTransacted
SHRegCloseUSKey
SHRegCreateUSKeyA
SHRegCreateUSKeyW
SHRegOpenUSKeyA
SHRegOpenUSKeyW
© 2010 AutomatedQA Corp.
www.automatedqa.com/support
494
AQtime Reference
Resource Profiler - Report Panel Columns
When you view results of the Resource profiler, the Report panel contents depend on the currently
selected category in the Explorer panel (see description of the Resource profiler) -Classes Category
Objects Category
Errors Category
Classes Category
When this category is active, the Report panel shows information about resources types, whose instances
exist at the moment the results are generated. This means, that if a resource instance was created and destroyed
before the results were generated then it is not shown in the Report panel. The panel holds the following
columns:
Columns (in alphabetical order)
Description
Image
The icon that indicates the category of resources of the given type.
Live Count
Number of resource instances that currently exist in memory.
Live Size
The size of currently existing resource instances (in bytes).
Module Name
Name of the module from which a Win32 API function that allocates
resources was called.
Peak Created
Maximum number of concurrent resource instances reached during the
run.
Peak Size
Maximum size of concurrent resource instances reached during the run
(in bytes).
Class Name
Name of the resource type (Registry, Menu, Handle, Bitmap, and so
on).
Total Created
Total number of resource instances that were created during the
application run.
Total Size
Memory needed for all the resource instances that were created during
the run.
Objects Category
When this category is active, the Report panel shows information about resource instances that exist at the
moment that the results are generated. The panel holds the following columns:
Columns (in alphabetical order)
Description
#
The creation number of the given resource instance.
Address
Memory address at which the resource instance was allocated.
Get #
The ordinal number of the Get Results command that generated the
current result set. For instance, if you pressed
Get Results two
www.automatedqa.com
AQtime by AutomatedQA Corporation
Profilers
Columns (in alphabetical order)
495
Description
times during the profiler run, you will get three result sets (the third will
be generated after the application closes) with numbers 1, 2 and 3. The
Get # value in all records of the first result set will hold 1; in the second
result set this column will hold 2 and in the third result set the column
will hold 3.
The Get # column is used for comparison purposes. It lets you easily
see which resource instances were created or deleted between two
result generations.
Image
The icon that indicates the category of the given resource instance.
Module Name
Name of the module from which a Win32 API function that allocates
resources was called.
Object Name
Name of the resource instance. It is formed as Class Name + period +
number. For example, Bitmap.3 means the third Bitmap resource
instance that was created after the profiling started.
Class Name
Name of the resource type (Registry, Menu, Handle, Bitmap, etc.).
Size
Size of the resource instance in bytes.
Thread
Specifies the thread where the allocation routine of the resource
instance was called.
Errors Category
When this category is active, the Report panel shows information about errors that occurred in resource
management functions when the results are generated. For instance, if the CreatePen function returns NULL,
which means that the function failed, the Report panel will hold a record that reports about this error. The panel
holds the following columns:
Columns (in alphabetical order)
Description
#
The creation number of the given resource-related error.
Description
Text that describes the problem.
DLL Name
The name of the dynamic link library from which the API function is
exported.
Error Code
The error code returned by the resource management function which
caused the error.
Image
The icon that indicates the category of the given error (that is, whether
it is an error or a warning).
Kind
The category of the resource management function that caused the
error. The profiled function categories which the Resource profiler
traces are specified by the profiler’s Resource categories to check
© 2010 AutomatedQA Corp.
www.automatedqa.com/support
496
AQtime Reference
Columns (in alphabetical order)
Description
option.
Reference
The hyperlink to the MSDN topic concerning the API function. To
open the topic, click the hyperlink.
Routine Name
Name of Win32 API’s resource management function that caused the
error.
Resource Profiler - Details Panel Columns
When you review the Resource profiler results, the Report panel displays information on resources that
existed at the moment of results generation (see Resource Profiler - Overview). The results that are shown in
the Report and Details panels depend on the category selected in the Explorer panel.
If the Objects category is selected, the Report panel displays results for resource instances while the
Details panel holds the stack of function calls that led to allocation of the resource instance selected in the
Report panel (the API function that allocated the given resource instance is at the top of the call stack). If the
Errors category is selected, the Report panel displays results for errors that occurred in API resource-related
functions during the run while the Details panels contains the call stack for the error selected in the Report
panel. In both instances, the call stack information is shown in the grid that has the following columns:
Columns (in alphabetical order)
Description
Module Name
Name of the module that holds the routine.
Routine Name
Name of the routine.
Source File
Name of the source file for the routine. The values for this column are
read from the application’s debug info. If debug info does not contain
information on the file name, the column is empty.
Source Line
Source file’s line number where the routine’s implementation begins.
The values for this column are read from the application’s debug info.
Resource Profiler Options
The Resource profiler includes two groups of customizable options:
•
One group contains options that affect the current result display. When you change these options,
AQtime refreshes the data in its panels.
•
Another group includes options that have effect on the profiler functioning. Changes in these
options will only apply to future profiler runs.
To modify options that affect the result display, use items of the Profiler toolbar. If this toolbar is hidden,
right-click somewhere in the toolbar area and select Profiler from the subsequent popup list. On the toolbar,
the following items are available:
•
View project classes only - Specifies whether profiling results are displayed only for the
modules that are added to the Setup panel (enabled) or for all the modules used by the profiled
application (disabled).
This filter applies both to Classes Data and Objects categories.
www.automatedqa.com
AQtime by AutomatedQA Corporation
Profilers
497
•
Filter objects by stack - Specifies whether to only display profiling results for objects created
in the Setup modules (enabled), or for all modules used by the profiled application (disabled).
This filter only applies to the Objects category.
•
Show all resources - If this option is on, profiling results include all resource types being
profiled. Otherwise, the results include only the resource types whose instances had been created
before the results were generated.
•
Filter standard leaks - If your application includes code that uses MFC, VCL or other
libraries, some of the allocated Windows resources can not be released due to errors in the
imported library code. If the Filter standard leaks option is enabled, AQtime excludes known
resource leaks that were produced by third-party software from the profiling results. A list of
known leaks is available at http://www.automatedqa.com/products/aqtime/leaks/.
•
Show routines with class names - If it is enabled, the Routine Name column of the Details
panels for the Resource profiler displays the name of the given routine along with the name of the
class the routine belongs to. Otherwise, this column only displays the routine name.
•
File names with path - If this option is enabled, the Source File and Module Name columns
of the Report and Details panels for the Resource profiler hold the entire path to the given file.
Otherwise, these columns hold the file name only.
To modify options that have effect on the way the profiler functions, do any of the following:
•
•
AQtime standalone:
Select Options | Options from AQtime’s menu and then choose the Profilers |
Allocation | Resource Profiler group from the ensuing Options dialog.
Press
Configure Current Profiler on the Standard toolbar when the Resource
profiler is selected.
AQtime integrated into Microsoft Visual Studio:
•
Select Tools | Options from Visual Studio’s menu and then choose the AQtime |
Profilers | Allocation | Resource Profiler group in the ensuing Options dialog.
AQtime integrated into Embarcadero RAD Studio:
Select AQtime | Options from RAD Studio’s menu and then choose the Profilers |
Allocation | Resource Profiler group from the ensuing Options dialog.
Options include:
•
•
Resource categories to check - Specifies the categories of resource management functions that
should be traced during profiling. Available categories are:
GDI and User Resources
GDI+ Resources
Kernel Resources
COM Resources
Registry Resources
Print Spooler Resources
Collect stack information - Specifies how the profiler should collect information on call stacks
when allocating resource instances and tracing errors in resource management functions. The
following values are available: None, By routines and By lines. Tracing the call stack can
significantly slow down the profiled application. If you do not need to know the call stack, you can
set this option to None. By routines means that the call stack entries will include information about
© 2010 AutomatedQA Corp.
www.automatedqa.com/support
498
AQtime Reference
routines only. If you want the call stack entries to include information on source line numbers as
well, set the option to By lines. This will let you, for example, determine from which source line a
function was called. Tracing source lines, however, requires time.
•
Thread model - Specifies which thread model AQtime uses to trace the call stack for functions
that allocate resources. For more information on supported values, see Profiling Multiple Threads
and Profiling COM Logical Threads.
www.automatedqa.com
AQtime by AutomatedQA Corporation
Profilers
499
Sequence Diagram Link Profiler
The topics of this section provide information on the Sequence Diagram Link profiler:
Sequence Diagram Link Profiler - Overview
Sequence Diagram Link Profiler Options
Sequence Diagram Link Profiler - Overview
The Sequence Diagram Link profiler analyzes the sequence of function calls in your application and then
builds a UML-style diagram of function calls in Microsoft Word or Microsoft Visio. It is a convenient tool to
trace links between methods and functions without running the application. Note that these are potential links
between routines, since the profiler statically analyzes your application and it cannot predict whether
conditional calls will be performed.
Currently, the Sequence Diagram Link profiler supports the following versions of Microsoft Word and
Microsoft Visio:
•
Microsoft Word 97 or higher
•
Microsoft Visio 2000 or higher
The program in which the diagram will be created is specified by the Target application option of the
profiler. For example, the following diagram was created in Microsoft Visio:
© 2010 AutomatedQA Corp.
www.automatedqa.com/support
500
AQtime Reference
The profiler algorithm is based on backtracking. After the profiler has been executed, it displays the Select
Start Point dialog:
www.automatedqa.com
AQtime by AutomatedQA Corporation
Profilers
501
Here you can select the routine, which will be the starting point of analysis. The Sequence Diagram Link
profiler parses the binary code of this routine and determines the functions called from it. Then it parses the
first function found and, if it finds calls to child function, it continues to the first function it finds. The analysis
is performed recursively until the profiler finds a function, which has no child function calls. When all
functions at a given level have been analyzed, the profiler moves up one level and continues with the next
function.
The Sequence Diagram Link profiler supports profiling areas of the routine level (the class- and line-level
areas as well as the Profile Entire .NET Code settings are ignored).
If a routine was not included in profiling, the profiler does not parse it and does not parse calls to its child
functions. Note however, that the Sequence Diagram Link analyzes only routines that are located in the module
to which the start-point routine belongs. It will ignore all other routines, even if they are specified in the
«Including» profiling areas.
The Sequence Diagram Link ignores calls to abstract and interface methods. The reason for this is that
debug info does not contain information on these methods, so the profiler is unable to analyze them.
Calls to properties are displayed as calls to property’s read or write methods (get_PropertyName and
set_PropertyName). If a property does not have a read (write) method, calls to this property are ignored.
The profiler can work until it parses all functions in the module. However, to avoid the creation overly
complex diagrams, AQtime lets you stop the analysis when the number of parsed routines exceeds the value
specified by the Warning level profiler option:
© 2010 AutomatedQA Corp.
www.automatedqa.com/support
502
AQtime Reference
Sequence Diagram Link Profiler Options
The Sequence Diagram Link profiler includes a number of options to customize. To modify them, do any
of the following:
•
•
AQtime standalone:
Select Options | Options from AQtime’s main menu (this will call the Options dialog), and
then choose Profilers | Static Analysis | Sequence Diagram Link from the tree view on the
left of the dialog.
Press Configure Current Profiler on the Standard toolbar when the Sequence Diagram
Link profiler is selected.
AQtime integated into Microsoft Visual Studio:
•
Select Tools | Options from Visual Studio’s main menu (this will call the Options dialog) and
then select AQtime | Profilers | Static Analysis | Sequence Diagram Link from the tree
view on the left of the dialog.
AQtime integrated into Embarcadero RAD Studio:
Select AQtime | Options from RAD Studio’s main menu (this will call the Options dialog),
and then choose Profilers | Static Analysis | Sequence Diagram Link from the tree view on
the left of the dialog.
In the dialog, the following options are available:
•
Target application - The application, used to create the diagram of function calls (Microsoft
Word or Microsoft Visio).
•
Warning level - The number of analyzed methods, after which AQtime displays a dialog box
asking if you want to continue profiling. This option helps to avoid the creation of overly complex
diagrams and saves its results. Possible values are between 0 and 1,000,000. Default: 50. 0 = never
ask.
•
Output diagram options
Draw message numbers - If this option is enabled, AQtime draws numbers next to function
names in the output diagram. Otherwise, the numbers are not drawn.
www.automatedqa.com
AQtime by AutomatedQA Corporation
Profilers
503
Static Analysis Profiler
The topics of this section provide information on the Static Analysis profiler:
Static Analysis Profiler - Overview
Static Analysis Profiler - Analyzing Results
Static Analysis Profiler - Report Panel Columns
Static Analysis Profiler - Columns of the Details and Call Tree Panels
Static Analysis Profiler Options
Static Analysis Profiler - Overview
This topic provides the Static Analysis profiler overview and describes the profiler results. The complete
profiler description includes the following topics:
Overview (this topic)
Static Analysis Profiler - Analyzing Results
Static Analysis Profiler - Report Panel Columns
Static Analysis Profiler - Columns of the Details and Call Tree Panels
Static Analysis Profiler Options
Static Analysis Tutorial
The Static Analysis profiler (as the word «static» indicates) does not launch the tested application, but
analyzes the debugging information (native applications) or metadata (.NET-connected applications) that is
included in the executable(s) to find information as:
•
the size of the routines in bytes,
•
their length in source code lines,
•
the routine addresses in memory,
•
the structure of method calls as written in the source code,
•
the binary code generated for the routine,
•
the number of binary instructions in the routine,
•
the number of loop instructions in the routine,
•
the number of exception handling frames in the routine,
•
the number of conditional operators in the routine,
•
the number of floating point operators in the routine,
•
and so forth
In addition, the Static Analysis finds all of the potential interlinks of your application’s classes through
their methods, that is, the links in all possible code branches. Therefore, the Static Analysis Profiler centers on
both methods (routines) and class interlinks.
The Static Analysis profiler supports both 32-bit and 64-bit applications.
When you start profiling with the Static Analysis profiler, the application does not execute; the profiler
simply checks the executable(s) included in the current AQtime project. Area and trigger settings are ignored.
Some questions that can be answered by this speedy analysis are:
© 2010 AutomatedQA Corp.
www.automatedqa.com/support
504
AQtime Reference
•
What code is used by an application? If the application includes a massive module only to use one
or two functions from it, you might choose to extract them from the module, or to re-implement
them so as to save on application size and dependencies.
•
Which routine is located by a certain address? For instance, if the application raises an exception,
you can launch Static Analysis and determine from the exception address reported which routine
caused it.
•
What binary code was produced by the compiler for a routine? This can tell you for instance if
array or string parameters are being passed by copying the data to the stack, or only a pointer.
•
What functions and procedures are called by a routine? This tells you what methods are called or
(more exactly) can be called from other methods.
•
Is a routine overburdened with too many loops, conditional jumps, exception handling frames and
other code structures that may impede the routine’s performance? Such routines are potential
candidates to be rewritten.
•
What classes exist in the application, what methods they have, which methods of other classes call
methods of the given class or are called by this class's methods (in source code, independent of
whether the call is ever executed).
The Report panel is the «main» results display. The Static Analysis profiler results are divided into two
categories: Routines Data and Classes Data. These categories are displayed as subnodes of the result set node
in the Explorer panel. The contents of the other panels (Report, Details, Call Graph, etc.) depend on the
currently selected category.
•
Routines Data. When this category is selected, the Report panel displays information about
routines that can be potentially called. Each row shows profiling results for every single routine:
the call count, address, size, etc. (For more detailed information, review Static Analysis Profiler Report Panel Columns). This gives you an entire picture of routine calls in your application. (Note
that you can also view the summary results in the Summary panel. It reports about routines that
are called most often, largest routines (in source code lines and in bytes), routines with maximum
number of binary instructions, etc.)
www.automatedqa.com
AQtime by AutomatedQA Corporation
Profilers
505
Sample Static Analysis Output for the Routines Data Category (AQtime Standalone)
© 2010 AutomatedQA Corp.
www.automatedqa.com/support
506
AQtime Reference
Sample Static Analysis Output for the Routines Data Category (AQtime Integrated into Microsoft Visual Studio)
www.automatedqa.com
AQtime by AutomatedQA Corporation
Profilers
507
Sample Static Analysis Output for the Routines Data Category (AQtime Integrated into Embarcadero RAD Studio)
•
Classes Data. When this category is selected, the Report panel displays information about class
interlinks (through potential calls between class methods) in your application. Every row in the
panel holds results for a single class: the number of methods in the class, the number of classes
whose methods call methods of the given class, the number of classes whose methods are called by
methods of the given class, etc. For more information about the Report panel columns, see Static
Analysis Profiler - Report Panel Columns.
© 2010 AutomatedQA Corp.
www.automatedqa.com/support
508
AQtime Reference
Sample Static Analysis Output for the Classes Data Category (AQtime Standalone)
www.automatedqa.com
AQtime by AutomatedQA Corporation
Profilers
509
Sample Static Analysis Output for the Classes Data Category (AQtime Integrated into Microsoft Visual Studio)
© 2010 AutomatedQA Corp.
www.automatedqa.com/support
510
AQtime Reference
Sample Static Analysis Output for the Classes Data Category (AQtime Integrated into Embarcadero RAD Studio)
You can arrange the Report panel the same way you organize the other AQtime panels.
For the Routines Data category, Static Analysis finds how routine calls are coded in source -- what is called
(child) from where (parent). The Call Graph panel displays this hierarchy in a convenient, browsable format.
Click a method line in Report and the method's parent callers and child callees will be shown in the Call
Graph with call counts (the number of points where calls occur in the source).
www.automatedqa.com
AQtime by AutomatedQA Corporation
Profilers
511
The Call Graph Contents for the Static Analysis Profiler - Routines Data Category (AQtime Standalone)
© 2010 AutomatedQA Corp.
www.automatedqa.com/support
512
AQtime Reference
The Call Graph Contents for the Static Analysis Profiler - Routines Data Category (AQtime Integrated into Microsoft Visual
Studio)
www.automatedqa.com
AQtime by AutomatedQA Corporation
Profilers
513
The Call Graph Contents for the Static Analysis Profiler - Routines Data Category (AQtime Integrated into Embarcadero RAD
Studio)
For the Classes Data category, the Call Graph displays the hierarchy of method interlinks between
classes. Click a class line in the Report pane, and the classes whose methods call the given class's methods or
are called by these methods will be shown in the Call Graph.
© 2010 AutomatedQA Corp.
www.automatedqa.com/support
514
AQtime Reference
The Call Graph Contents for the Static Analysis Profiler - Classes Data Category (AQtime Standalone)
www.automatedqa.com
AQtime by AutomatedQA Corporation
Profilers
515
The Call Graph Contents for the Static Analysis Profiler - Classes Data Category (AQtime integrated into Microsft Visual Studio)
© 2010 AutomatedQA Corp.
www.automatedqa.com/support
516
AQtime Reference
The Call Graph Contents for the Static Analysis Profiler - Classes Data Category (AQtime Integrated into Embarcadero RAD
Studio)
An alternative view for the same information is given in the Call Tree panel. This panel provides a
tree-view of the hierarchy of routine calls or class interlinks (see Static Analysis Profiler - Columns of the
Details and Call Tree Panels). For instance, the following picture illustrates how the routine call hierarchy
looks in the Call Tree panel.
www.automatedqa.com
AQtime by AutomatedQA Corporation
Profilers
517
The Call Tree Contents for the Static Analysis Profiler - Routines Data Category (AQtime Standalone)
© 2010 AutomatedQA Corp.
www.automatedqa.com/support
518
AQtime Reference
The Call Tree Contents for the Static Analysis Profiler - Routines Data Category (AQtime Integrated into Microsoft Visual Studio)
www.automatedqa.com
AQtime by AutomatedQA Corporation
Profilers
519
The Call Tree Contents for the Static Analysis Profiler - Routines Data Category (AQtime Integrated into Embarcadero RAD
Studio)
In addition, a click on a routine or a class in the Report panel will refresh the contents of the Details panel.
For routines, this panel represents the structure of function calls, but it does so as two lists. This lets you see all
possible parents and children of the selected method. See Static Analysis Profiler - Columns of the Details and
Call Tree Panels. Double-clicking a method line in either list (Children or Parents) refreshes Details and all
other panels with the information on the chosen method.
© 2010 AutomatedQA Corp.
www.automatedqa.com/support
520
AQtime Reference
The Details Panel Contents for the Static Analysis Profiler - Routines Data Category (AQtime Standalone)
www.automatedqa.com
AQtime by AutomatedQA Corporation
Profilers
521
The Details Panel Contents for the Static Analysis Profiler - Routines Data Category (AQtime Integrated into Microsoft Visual
Studio)
© 2010 AutomatedQA Corp.
www.automatedqa.com/support
522
AQtime Reference
The Details Panel Contents for the Static Analysis Profiler - Routines Data Category (AQtime Integrated into Embarcadero RAD
Studio)
For classes, the Details panel displays information on class interlinks for the class chosen in the Report
panel. This information is divided into several lists. The Routines list simply itemizes all methods of the given
class. The Class Callers and Class Callees lists display the classes whose methods call methods of the given
class or are called by methods of this class. If you click a class in either list, its methods will be displayed in the
corresponding list (Caller Routines or Callee Routines). Double-clicking a class line in either list (Class
Callers or Class Callees) refreshes Details and all other panels with the information on the chosen class. See
Static Analysis Profiler - Columns of the Details and Call Tree Panels.
www.automatedqa.com
AQtime by AutomatedQA Corporation
Profilers
523
The Details Panel Contents for the Static Analysis Profiler - Classes Data Category (AQtime Standalone)
© 2010 AutomatedQA Corp.
www.automatedqa.com/support
524
AQtime Reference
The Details Panel Contents for the Static Analysis Profiler - Classes Data Category (AQtime Integrated into Microsoft Visual
Studio)
www.automatedqa.com
AQtime by AutomatedQA Corporation
Profilers
525
The Details Panel Contents for the Static Analysis Profiler - Classes Data Category (AQtime Integrated into Embarcadero RAD
Studio)
To view the source code of a routine, do the following:
•
AQtime standalone:
•
AQtime integrated into Microsoft Visual Studio:
•
Double-click it in the Report, Details, Call Graph or Call Tree panel and then switch to
the Editor panel, which is available only if AQtime is running as a standalone application.
Double-click it in the Report, Details, Call Graph or Call Tree panel and then switch to
the Code Editor, which is the native editor of Microsoft Visual Studio.
AQtime integrated into Embarcadero RAD Studio:
Double-click it in the Report, Details, Call Graph or Call Tree panel and then switch to
the Editor, which is the native editor of RAD Studio.
The path to source files must be specified in the Project Search Directories or Search Directory dialogs. In
the editor, the routine code will be accompanied with the routine's profiling results that are represented as
comments.
© 2010 AutomatedQA Corp.
www.automatedqa.com/support
526
AQtime Reference
Static Analysis Results That Accompany the Source Code (AQtime Standalone)
www.automatedqa.com
AQtime by AutomatedQA Corporation
Profilers
527
Static Analysis Results That Accompany the Source Code (AQtime Integrated into Microsoft Visual Studio)
© 2010 AutomatedQA Corp.
www.automatedqa.com/support
528
AQtime Reference
Static Analysis Results That Accompany the Source Code (AQtime Integrated into Embarcadero RAD Studio)
Static Analysis Profiler - Analyzing Results
The Static Analysis profiler lets you get the entire hierarchy of routine calls and class interlinks as they are
coded in the application's source. The profiler does not even execute the application, it simply takes all these
data from debugging information (for native applications) or metadata (for .NET-connected applications). The
profiling results are organized into two categories: Routines Data and Classes Data. The Routines Data
category contains results for each single routine that exists in the application being profiled. The Classes Data
category allows you to view summary profiling results for each class in your application.
Here is a sample output of the Static Analysis profiler:
www.automatedqa.com
AQtime by AutomatedQA Corporation
Profilers
529
Sample Output of the Static Analysis Profiler (AQtime Standalone)
© 2010 AutomatedQA Corp.
www.automatedqa.com/support
530
AQtime Reference
Sample Output of the Static Analysis Profiler (AQtime Integrated into Microsoft Visual Studio)
www.automatedqa.com
AQtime by AutomatedQA Corporation
Profilers
531
Sample Output of the Static Analysis Profiler (AQtime Integrated into Embarcadero RAD Studio)
As you can see, the categories are shown in the Explorer panel. You can also select the desired category
from the Result Items toolbar item (by default, this item is hidden):
The Summary panel displays the summary results for the whole profiler run regardless of the selected
category. Use this panel to quickly find routines that can potentially perform poorly. The contents of other
panels depend on the currently selected category:
•
If you select the Routines Data category, AQtime will display profiling results one routine per line
in the Report panel. The Report panel is the «main» results display. Other AQtime panels, such
© 2010 AutomatedQA Corp.
www.automatedqa.com/support
532
AQtime Reference
as Details, Call Graph or Call Tree, hold additional results for the routine selected in the Report
panel.
•
If you select the Classes Data category, AQtime will display profiling results one class per line in
the Report panel. Again, the Report panel will serve as the main results display, while other
panels will contain additional results for the class selected in the Report panel.
Profiling Results - Report Panel
The Report panel displays results for the category that is selected in the Explorer panel or in the Result
Items list. For more information about the available columns, see Static Analysis Profiler - Report Panel
Columns. Note that by default the Report panel shows only a shred of available columns. You can easily add
more columns to the panel. For more information on this, see Adding and Removing Columns. You can arrange
the columns in the panel as you desire: move columns, change column width, etc. For more information on
this, see Arranging Columns, Lines and Panels.
The Profiler toolbar contains items that allow you to modify the results that are currently being displayed
as your needs dictate. For example, the
Show addresses as RVA toolbar item lets you choose the format
the profiler should use to display addresses in the Address column of the Report panel. Another toolbar item,
Routine name with class name, specifies whether the routine name should be preceded with the name of
the class the routine belongs to. For more information on the toolbar items, see Static Analysis Profiler Options.
The column footer shows summary results for the values displayed in that column. You can customize the
summary type and summary format using the Format Columns Dialog or the context menu that is brought up
by right-clicking the column footer. For instance, you can select one of the five summary types (Sum, Count,
Avg, Min, Max) or you can hide the summary for the column.
By default, the column summary is calculated for all rows displayed in the Report panel. However, if you
select two or more rows, AQtime will recalculate the summary for the selected rows only.
If the Routines Data category is selected, you can find the routines that are called most often or have the
greatest number of instructions. To do this, sort results by the Call Count or Instruction Count column
correspondingly. If the Classes Data category is selected, you can find classes that have the greatest number of
methods, classes whose methods are called the most often and classes that call methods of other classes the
most often. To do this, sort results by the Routine Count, Caller Class Count or Callee Class Count column
correspondingly.
Additionally, you can quickly filter out routines (classes) that call or do not call other methods (methods of
other classes). To do this, use the predefined result views Non-leaf routines (classes) or Leaf routines
(classes) correspondingly. If you want to separately view native code routines and classes, or .NET code
routines and classes, simply select the appropriate predefined view: Native code routines and classes or .NET
code routines and classes.
To select these results, do any of the following:
•
•
AQtime standalone:
Select the results from the Result Views dropdown list on the Standard toolbar.
Select the results from the View | Result Views AQtime’s menu.
AQtime integrated into Microsoft Visual Studio:
•
Select any of the result views from the Result Views dialog. To display the dialog, choose
AQtime | Result Views from Visual Studio’s menu.
AQtime integrated into Embarcadero RAD Studio:
Select these views from the Result Views dialog. To display the dialog, click the Result
Views button. Note that this button does not reside on any toolbar by default. However, you
www.automatedqa.com
AQtime by AutomatedQA Corporation
Profilers
533
can add the button to any RAD Studio’s toolbar via the Toolbar Customization dialog. In this
dialog, switch to the Commands page, select the View.AQtime category in the Categories
list, drag the Result Views command from the Commands list and drop it on the needed
toolbar.
See Result Views.
You can also group results by any column. Instead of grouping columns manually, you can use the View
by module predefined view to display profiling results grouped by the Module Name column. When you
group results by a column, besides «global» summaries shown at the footer of the panel, AQtime displays
«local» summaries at the end of each group node. For instance, grouping results by the Class Name column
helps you find the total number of instructions in all class methods (the summary for the Instruction Count
column should be enabled). For more information on how to group, sort, filter and search for profiling results,
see Analyzing Profiler Results.
Suppose that you changed the source of your application, recompiled it and want to see how this
modification affected the Static Analysis results. To do this, you can compare results of two profiler runs. See
Comparing and Merging Results.
Profiling Results - Call Graph, Call Tree, Editor and Details Panels
The Static Analysis profiler displays additional profiling results in the Call Graph, Call Tree, Details and
Editor panels. When you double-click on a routine (a class) in Report, AQtime refreshes these panels so that
they will display information about this routine (class). See AQtime Panels.
For routines, the Call Graph displays the hierarchy of potential function calls (parent - child), centering on
the clicked method. The critical path for the routine is displayed in bold (critical path is the «longest» path for
the routine in the hierarchy of potential function calls, for instance, the one that has the greatest number of
instructions). To configure, value of which column will be used to calculate the critical path, use the Customize
Call Graph dialog.
© 2010 AutomatedQA Corp.
www.automatedqa.com/support
534
AQtime Reference
Sample Call Graph Output - Routines Data (AQtime Standalone)
www.automatedqa.com
AQtime by AutomatedQA Corporation
Profilers
535
Sample Call Graph Output - Routines Data (AQtime Integrated into Microsft Visual Studio)
© 2010 AutomatedQA Corp.
www.automatedqa.com/support
536
AQtime Reference
Sample Call Graph Output - Routines Data (AQtime Integrated into Embarcadero RAD Studio)
For classes, the Call Graph displays the hierarchy of potential links between classes through their
methods. You can travel up and down the hierarchy in the panel by clicking.
www.automatedqa.com
AQtime by AutomatedQA Corporation
Profilers
537
Sample Call Graph Output - Classes Data (AQtime Standalone)
© 2010 AutomatedQA Corp.
www.automatedqa.com/support
538
AQtime Reference
Sample Call Graph Output - Classes Data (AQtime Integrated into Microsoft Visual Studio)
www.automatedqa.com
AQtime by AutomatedQA Corporation
Profilers
539
Sample Call Graph Output - Classes Data (AQtime Integrated into Embarcadero RAD Studio)
For the Routines Data category, the Call Tree panel also displays the hierarchy of potential function calls.
It contains two panes: Parents and Children. The Parents pane holds all function calls that lead to the call to the
currently selected routine. The Children pane displays the hierarchy of child calls that are initiated from the
selected routine.
© 2010 AutomatedQA Corp.
www.automatedqa.com/support
540
AQtime Reference
Sample Call Tree Output - Routines Data (AQtime Standalone)
www.automatedqa.com
AQtime by AutomatedQA Corporation
Profilers
541
Sample Call Tree Output - Routines Data (AQtime Integrated into Microsoft Visual Studio)
© 2010 AutomatedQA Corp.
www.automatedqa.com/support
542
AQtime Reference
Sample Call Tree Output - Routines Data (AQtime Integrated into Embarcadero RAD Studio)
For the Classes Data category, the Call Tree panel shows the hierarchy of class interlinks. It contains two
panes: Class Callers and Class Callees. The Class Callers pane holds the hierarchy of classes whose methods
eventually call methods of the currently selected class. The Class Callees pane displays the hierarchy of
classes calls to whose methods are initiated from the selected class.
www.automatedqa.com
AQtime by AutomatedQA Corporation
Profilers
543
Sample Call Tree Output - Classes Data (AQtime Standalone)
© 2010 AutomatedQA Corp.
www.automatedqa.com/support
544
AQtime Reference
Sample Call Tree Output - Classes Data (AQtime Integrated into Microsoft Visual Studio)
www.automatedqa.com
AQtime by AutomatedQA Corporation
Profilers
545
Sample Call Tree Output - Classes Data (AQtime Integrated into Embarcadero RAD Studio)
For more information on results displayed in the Call Tree panel's panes as well as for the column
description, see Static Analysis Profiler - Call Tree Panel Columns.
If your application was compiled with debug info, the Editor panel will also show the source code for the
routine you clicked (The source file of the routine must be specified in the Search Directory or Project Search
Directories). The Editor displays various profiling results as comments before the routine's source code. To
configure which columns you want to see in these comments, use the Customize Comments dialog.
© 2010 AutomatedQA Corp.
www.automatedqa.com/support
546
AQtime Reference
Source Code of the Chosen Routine (AQtime Standalone)
www.automatedqa.com
AQtime by AutomatedQA Corporation
Profilers
547
Source Code of the Chosen Routine (AQtime Integrated into Microsoft Visual Studio)
© 2010 AutomatedQA Corp.
www.automatedqa.com/support
548
AQtime Reference
Source Code of the Chosen Routine (AQtime Integrated into Embarcadero RAD Studio)
For the Routines Data category, the Details panel acts as a «magnifier» for parent-child call relationships
related to one row in the Report panel. Routines that call the currently selected routine are listed in the Parents
pane, while routines that are called by the selected routine are listed in the Children pane.
www.automatedqa.com
AQtime by AutomatedQA Corporation
Profilers
549
Sample Output of the Details Panel - Routines Data Category (AQtime Standalone)
© 2010 AutomatedQA Corp.
www.automatedqa.com/support
550
AQtime Reference
Sample Output of the Details Panel - Routines Data Category (AQtime Integrated into Microsoft Visual Studio)
www.automatedqa.com
AQtime by AutomatedQA Corporation
Profilers
551
Sample Output of the Details Panel - Routines Data Category (AQtime Integrated into Embarcadero RAD Studio)
For the Classes Data category, the Details panel displays additional information on the class selected in the
Report panel. The Routines pane displays all methods of the class that is currently selected in the Report panel.
The Class Callers pane lists classes whose methods call methods of the current class. At that, the Caller
Routines displays all methods of the class chosen in Class Callers. Similarly, the Class Callees pane lists
classes whose methods are called by methods of the current class, while the Callee Routines pane shows all
methods of the class chosen in Class Callees.
© 2010 AutomatedQA Corp.
www.automatedqa.com/support
552
AQtime Reference
Sample Output of the Details Panel - Classes Data Category (AQtime Standalone)
www.automatedqa.com
AQtime by AutomatedQA Corporation
Profilers
553
Sample Output of the Details Panel Classes Data Category (AQtime Integrated into Microsoft Visual Studio)
© 2010 AutomatedQA Corp.
www.automatedqa.com/support
554
AQtime Reference
Sample Output of the Details Panel - Classes Data Category (AQtime Integrated into Embarcadero RAD Studio)
For more information on results displayed in the Details panel’s panes as well as for the column
description, see Static Analysis Profiler - Details Panel Columns.
Double-clicking on a row in the Details panel will move the cursor to the Editor panel to the routine (or
class) displayed on that row. Also, the double-click will update the other panels to the clicked routine or class.
Switching from panel to panel in this way, when trying to get the desired information out of the Static Analysis
Display Previous and
Display Next,
profiler results, is made much easier by the «browser» buttons,
on the Report toolbar.
You can arrange the panes of the Details panel as you desire. For more information on this, see description
of the Details panel.
Static Analysis Profiler - Report Panel Columns
When you view results of the Static Analysis profiler, the Report panel contents depend on the currently
selected category in the Explorer panel -Classes Data Category
Routines Data Category
Classes Data Category
When this category is active, the Report panel shows information about classes whose instances can be
potentially created in the profiled application. The panel holds the following columns:
www.automatedqa.com
AQtime by AutomatedQA Corporation
Profilers
555
Columns (in alphabetical order)
Description
Call Count
The number of calls to the class methods in the source.
Callee Class Count
The number of classes whose methods are called by methods of the given
class.
Callee Count
The number of calls to other routines coded in the class source.
Caller Class Count
The number of classes whose methods call methods of the given class.
Class Name
Name of the class.
Finalizable
Specifies whether the class overrides the Finalize method (C# and
Visual C++ .NET use the destructor syntax for Finalize).
Module Name
Name of the executable module where the class is defined.
Namespace
Name of the namespace to which the class belongs. This column is only
used for managed routines.
Routine Count
The number of methods in the class.
Token
CLR token of the class.
Routines Data Category
When this category is active, the Report panel shows information about routines that can be potentially
called in the profiled application. The panel holds the following columns:
Columns (in alphabetical order)
Description
Address
The routine’s address in memory. This column is only used for
unmanaged (native-code) routines. The format of the address depends
upon the Show Addresses as RVA option.
Box Count
The number of times the routine is boxed in the source.
Call Count
The number of calls to the routine coded in the source.
Callee Count
The number of calls to other routines coded in the source of the given
routine.
Class Name
Name of the class to which the given routine belongs.
Code Size
Size of the routine’s binary code (in bytes).
Code Type
Type of the routine’s code. The following values are possible:
© 2010 AutomatedQA Corp.
•
MSIL - Managed-code routine with MSIL (Microsoft
Intermediate Language) code.
•
x64 - 64-bit code routine.
•
x86 - Native-code (unmanaged) routine.
www.automatedqa.com/support
556
AQtime Reference
Columns (in alphabetical order)
Description
•
Pseudo - Pseudo routine that was created by the context. For
example, <JIT Compiler>, <Garbage Collector>,
<Unknown PInvoke> or <Root>.
•
PInvoke - Native-code routine for which there is a
declaration in one of managed modules and that is called
from within the unmanaged code.
•
NGen - Managed routine that was compiled by the ngen
utility (CLR Native Image Generator) with the /prof
argument in its command line. The ngen compilation means
the routine was compiled before the application starts.
•
Byte-code - Java routine that was compiled into an
intermediate byte-code format. See Profiling Java
Applications for details.
Condition Count
The number of conditional instructions in the routine’s source.
Data Load/Store
The number of memory handling instructions in the routine’s source.
Direct Calls
The number of direct calls to other routines performed in the routine’s
source.
Exception Frames
The number of exception frames in the routine’s source.
Float Instructions
The number of floating point instructions in the routine’s source.
Indirect Calls
The number of indirect calls to other routines performed in the routine’s
source. These are calls to callback functions (when a pointer to a routine
is passed somewhere where the routine is actually called) and calls to
interface functions.
Instruction Count
The total number of instructions in the routine’s code.
Leaf
Specifies whether the routine is leaf or not. Leaf routines are those that do
not call other routines.
Line Count
The number of lines in the routine’s source.
Local Count
The number of local variables in the routine’s source.
Local Size
The size of memory (in bytes) occupied by the routine’s local variables.
Loop Count
The number of loop instructions in the routine’s source.
MMX Instructions
The number of MMX instructions in the routine’s source.
Module Name
Name of the executable module where the routine is defined.
Namespace
Name of the namespace to which the routine’s class belongs. This column
is only used for managed routines.
www.automatedqa.com
AQtime by AutomatedQA Corporation
Profilers
557
Columns (in alphabetical order)
Description
Parameter Count
The number of parameters that are passed to the routine.
Parameter Size
The size of memory (in bytes) occupied by parameters that are passed to
the routine.
Platform
The minimal processor configuration at which the routine’s code can be
run. This is determined by instructions used in the code. Possible values
are Blended (means that the process type is not strictly defined; actually it
means any Intel processor starting from Pentium), Pentium II, Pentium III
or Pentium IV.
Routine Name
Name of the given routine.
Recursive
Specifies whether the routine has recursive calls (i.e. calls to itself).
Source File
Name of the source file for the routine. If debug info does not contain
information on the file name, the column is empty.
Source Line
The source file’s line number where the routine’s implementation begins.
SSE Instructions
The number of SSE instructions in the routine’s source.
SSE2 Instructions
The number of SSE2 instructions in the routine’s source.
Stack Frame
Specifies whether a stack frame is created for the given routine. Stack
frames make debugging easier but hamper performance, because they
involve execution of additional code.
Token
The routine’s CLR token.
Unbox Count
The number of times the routine is unboxed in the source.
Unit Name
Name of the compiled linkage unit. This column is used for unmanaged
(native-code) routines only.
Unused Register Count
The number of registers that are not used in the routine’s source.
Word Overrides
The number of times when registers are used partly, not entirely. Large
values of this counter lead to poor performance of the routine.
Static Analysis Profiler - Columns of the Details and Call Tree Panels
When you review the Static Analysis profiler results, the Report panel displays information on potential
routine calls or potential calls between methods of the application's classes. The results that are shown in the
Report, Details, Call Graph and Call Tree panels depend on the category selected in the Explorer panel.
Routines Data Category
If the Routines Data category is selected, the Report panel displays results for routines and the Details and
Call Tree panels hold additional information about routine calls for the routine that is currently selected in the
Report panel. Both the Details and Call Tree panels contain two panes: Parents and Children. The Parents
© 2010 AutomatedQA Corp.
www.automatedqa.com/support
558
AQtime Reference
pane lists all routines that call the currently selected routine in the application source. The Children pane shows
routines that are called by the selected routine. This information is shown in grids that hold the following
columns (both Call Tree and Details have the same set of columns):
Columns (in alphabetical order)
Description
Call Count
The number of times the routine that is selected in Report called the given
child routine or is called by the given parent routine.
Class Name
Name of the class to which the given routine belongs.
Code Type
Type of the routine’s code. The following values are possible:
•
MSIL - Managed-code routine with MSIL (Microsoft
Intermediate Language) code.
•
x64 - 64-bit code routine.
•
x86 - Native-code (unmanaged) routine.
•
Pseudo - Pseudo routine that was created by the context. For
example, <JIT Compiler>, <Garbage Collector>,
<Unknown PInvoke> or <Root>.
•
PInvoke - Native-code routine for which there is a
declaration in one of managed modules and that is called
from within the unmanaged code.
•
NGen - Managed routine that was compiled by the ngen
utility (CLR Native Image Generator) with the /prof
argument in its command line. The ngen compilation means
the routine was compiled before the application starts.
•
Byte-code - Java routine that was compiled into an
intermediate byte-code format. See Profiling Java
Applications for details.
Module Name
Name of the executable module where the routine is defined.
Namespace
Name of the namespace to which the routine’s class belongs.
Routine Name
Name of the given routine.
Source File
Name of the source file for the routine. If debug info does not contain
information on the file name, the column is empty.
Source Line
The source files line number where the routine’s implementation begins.
Token
The routine’s CLR token.
Unit Name
Name of the compiled linkage unit.
Classes Data Category
If the Classes Data category is selected, the Report panel displays results for objects and the Details and
Call Tree panels hold additional information about class interlinks for the class that is currently selected in the
Report panel. Both the Details and Call Tree panels contain the Class Callers and Class Callees panes. The
Class Callers pane lists all classes whose methods call methods of the given class. The Class Callees pane
www.automatedqa.com
AQtime by AutomatedQA Corporation
Profilers
559
shows classes whose methods are called by methods of the given class. This information is shown in grids that
hold the following columns (both Call Tree and Details have the same set of columns):
Columns (in alphabetical order)
Description
Call Count
The number of times methods of the given class call methods of the class
selected in Report or are called by methods of that class.
Class Name
Name of the class.
Module Name
Name of the executable module where the class is defined.
Namespace
Name of the namespace to which the class belongs.
Additionally, the Details panel includes the Caller Routines, Callee Routines and Routines panes. The
Caller Routines pane lists all methods of the class selected in the Class Callers pane. Correspondingly, the
Callee Routines pane displays all methods of the class selected in the Class Callees pane. The Routines pane
displays all methods of the class that is selected in the Report panel. All the three panes hold the same set of
columns:
Columns (in alphabetical order)
Description
Call Count
For the Routines pane:
The number of times the given method is called in the source.
For the Caller Routines pane:
The number of times the given method calls methods of the class
currently selected in the Report panel.
For the Callee Routines pane:
The number of times the given method is called by methods of the class
currently selected in the Report panel.
Class Name
Name of the class to which the given method belongs.
Code Type
Type of the method’s code. Possible values are x86, x64, MSIL, Pseudo,
PInvoke or NGen.
Module Name
Name of the executable module where the method is defined.
Namespace
Name of the namespace to which the method’s class belongs.
Routine Name
Name of the given method.
Source File
Name of the source file for the method. If debug info does not contain
information on the file name, the column is empty.
Source Line
The source files line number where the method's implementation begins.
Token
The method’s CLR token.
Unit Name
Name of the compiled linkage unit.
Static Analysis Profiler Options
© 2010 AutomatedQA Corp.
www.automatedqa.com/support
560
AQtime Reference
The Static Analysis profiler includes options that affect the current result display. When you change these
options, AQtime refreshes the data in its panels. To modify these options, use items of the Profiler toolbar. If
this toolbar is hidden, right-click somewhere in the toolbar area and select Profiler from the subsequent popup
list.
The toolbar holds the following items (options):
•
Show addresses as RVA - This option specifies what format the profiler should use to display
addresses in the Address column of the Report panel. The address of each routine (or unit)
consists of two components: The base address of the module, which is the address where the
module is loaded in memory, and the offset of the routine relative to this base address. The offset is
also called a relative virtual address (RVA). If Show Addresses as RVA is enabled, the Address
column displays only relative virtual addresses. Otherwise, it displays the full routine addresses,
i.e. the base address + offset. Note that the base address can be determined only after the module
has been loaded into memory. Since Static Analysis does not run the executable, it uses the
preferred loading address as the base one. The preferred loading address is specified in the header
of the executable. To find it in AQtime, check the Optional header section on the PE Information
page of the PE Reader panel.
•
Show routines with class names - If it is enabled, the Routine Name column of the Report,
Details and Call Tree panels for the Static Analysis profiler displays the name of the given routine
along with the name of the class the routine belongs to. Otherwise, this column only displays the
routine name.
•
File names with path - If this option is enabled, the Source File and Module Name columns
of the Report, Details and Call Tree panels for the Static Analysis profiler hold the entire path to
the given file. Else, these columns hold the file name only.
www.automatedqa.com
AQtime by AutomatedQA Corporation
Profilers
561
Unused VCL Units Profiler
This section contains topics that describe the Unused VCL Units profiler:
Unused VCL Units Profiler - Overview
Description of the Report Panel Columns
Description of the Details Panel Columns
Unused VCL Units Profiler Options
Unused VCL Units Profiler - Overview
This topic provides an overview of the Unused VCL Units profiler and describes the profiling results that
the profiler generates. A complete profiler description includes the following topics:
Overview (this topic)
Recognition Issues (this topic)
Analyzing Profiling Results (this topic)
Description of the Report Panel Columns
Description of the Details Panel Columns
Unused VCL Units Profiler Options
Unused VCL Units Profiler Tutorial
Overview
The Unused VCL Units profiler helps you determine which VCL units are actually not used in your
application and decrease the size of the executable (or library) by excluding those units. The Unused VCL
Units profiler is a static profiler, it analyzes the application’s source code and does not require the application
to be running.
When a unit name is listed in the uses clause, the corresponding VCL unit is automatically included in the
executable / library file. However, the linker does not ascertain whether the program actually calls any of the
procedures from the included unit. This can occur if you drop a component onto a form to take a look at it and
then you delete the component from the form. The Delphi IDE does not remove the component’s unit from the
uses clause.
The problem is that the Delphi compiler generates the initialization and finalization procedures
for every included unit. Besides user-defined initialization / finalization code, the compiler adds its own code
to manage reference count variables. Therefore, the initialization and finalization procedures are
generated even if the unit does not have corresponding sections. Thus, if a unit is not actually used, then only
its initialization and finalization sections are called.
The Unused VCL Units profiler includes a database that contains information about the number of
procedures used by initialization and finalization sections of each standard VCL unit. This profiler compares
the number of procedures exported by a unit with the number specified for this unit in the database. If the unit
exports more functions than the database indicates, the profiler regards it as a used unit. If the number of the
exported procedures equals the number specified in the database, the unit is included in the list of unused ones.
The analysis procedure scans the source code (namely, the uses section) of each user unit and of each
standard unit referred by the application. Therefore, in order to use the profiler, you should specify the paths to
the standard IDE units, otherwise, the profiling results will not be precise. The location where the unit sources
will be sought for is defined in the Project Search Directories and Search Directory dialogs. To read the library
paths specified for the compiler in the registry, you can use the dialog’s Get Defaults button.
© 2010 AutomatedQA Corp.
www.automatedqa.com/support
562
AQtime Reference
The number of procedures in the initialization section varies from one Delphi version to another. The
profiler supports Borland Delphi versions from Delphi 3 to Delphi 2010. To specify which Delphi version was
used to build the profiled application, use the Delphi version option.
Recognition Issues
The described analysis algorithm has one drawback: If a unit is used in the application, but does not export
more functions than required for its initialization and finalization, the profiler still reports it as «unused».
This situation is possible in the following cases:
•
If a unit holds constants and variables.
•
If a unit declares class types that are used in other units.
•
If a unit declares one or several classes that only contain inherited methods and do not define their
own methods.
To resolve the issue, you can exclude these units from the analysis. This can be done by specifying unit
names either in the Ignore units with names containing option, or in the IgnoredUnits text file. The Ignore
units with names containing option defines a semicolon-separated list of words that can contain the names of
units to be skipped. Thus, you can exclude not only individual units, but also groups of units whose names
match the specified pattern. For instance, by specifying const, you can skip both MyConstants and
SrvConst units. The IgnoredUnits.txt file is located in the <AQtime>\Bin\Extensions folder and defines the
names of the units to be skipped for a particular version of the compiler. All the units whose names match the
value of the Ignore units with names containing option, or whose names are listed in the IgnoredUnits.txt file
are considered as used.
Analyzing Profiling Results
The profiling results are displayed in the Report and Details panels. Here is a sample output of the Unused
VCL Units profiler:
www.automatedqa.com
AQtime by AutomatedQA Corporation
Profilers
563
Sample Output of the Unused VCL Units Profiler (AQtime Standalone)
© 2010 AutomatedQA Corp.
www.automatedqa.com/support
564
AQtime Reference
Sample Output of the Unused VCL Units Profiler (AQtime Integrated into Microsoft Visual Studio)
www.automatedqa.com
AQtime by AutomatedQA Corporation
Profilers
565
Sample Output of the Unused VCL Units Profiler (AQtime integrated into Embarcadero RAD Studio)
As you can see, the Report panel lists all of the units imported by the application and marks those units that
AQtime assumes to be unused. The number of user units that refer to the chosen unit is displayed in the
Importing User Units column. If the columns' values are zero, then the selected unit is imported indirectly (by
another standard unit), otherwise, the unit name appears in the uses section of your application sources.
A complete list of units (both user units and standard ones) that refer to the unit selected in the Report panel
is displayed in the Details panel. When a unit is recognized as unused, you can remove references to it from all
user units shown in the panel.
To explore the unit’s source code, double-lick its name in the Report or Details panels and switch to the
Editor panel.
Keep in mind that units import one another, therefore to remove all unused units, you should verify your
application several times. The general sequence of iterations is as follows:
1. Profile the application with the Unused VCL Units profiler.
2. Open the application in the IDE and remove the previously found unused modules.
3. Recompile the application.
4. Profile the application with the Unused VCL Units profiler once again.
5. If more unused modules are found, repeat the actions starting from step 2.
For example, let’s assume your project contains two unused units - Buttons and Graphics (standard
VCL units). The Buttons unit uses some of the procedures from the Graphics one. So, the number of
exported procedures for Graphics is greater than the number specified for this unit in the database. Therefore,
the Unused VCL Units profiler considers the Graphics unit as used. After the first launch, the profiler will
© 2010 AutomatedQA Corp.
www.automatedqa.com/support
566
AQtime Reference
report that only the Buttons unit is unused. Remove this unit from your project, recompile your application
and return to AQtime. After the second launch, the profiler will report that the Graphics unit is not used.
Unused VCL Units Profiler - Report Panel Columns
When displaying results generated by the Unused VCL Units profiler, the Report panel holds the
following columns:
Columns (in alphabetical order)
Description
Importing User Units
The number of user units that refer to the current unit. The number is
valid when all of the sources’ paths are specified in the Project Search
Directories or Search Directory dialog.
Module
The name of the application module (.exe or .dll) that contains the
profiled unit.
Source File
The name of the source file where the unit is declared.
Unit
The name of the VCL unit.
Unused
Indicates whether the selected unit is used in the application. In certain
cases, the profiler can report a used unit as unused. Read the description
of these misleading situations in the Recognition Issues section of the
Unused VCL Units Profiler - Overview.
Unused VCL Units Profiler - Details Panel Columns
When displaying results of the Unused VCL Units profiler, the Report panel lists all VCL units that your
application includes. The Details panel displays a list of units that import the unit selected in the Report panel,
that is, those units that contain the name of the selected unit in their uses section. When the selected unit is
considered as unused, you can remove it from the application by excluding its name from the source code of all
non-standard units listed in the Details panel. After you remove it, you should recompile your application. The
list of importing units includes the following columns:
Columns (in alphabetical order)
Description
Module
The name of the application module (.exe or .dll) that contains the
profiled unit.
Source File
The name of the source file where the unit is declared.
Unit
The name of the VCL unit.
Note: If no paths to the sources of standard units were specified in the Project Search Directories or
Search Directory dialog, the profiler lacks information on how the standard units import one
another, and for most of them, the Details panel displays an empty list of importing units.
www.automatedqa.com
AQtime by AutomatedQA Corporation
Profilers
567
Unused VCL Units Profiler Options
The Unused VCL Units profiler includes a number of options that can be customized. To modify them, do
any of the following:
•
•
AQtime standalone:
Select Options | Options from AQtime’s main menu (this will call the Options dialog),
and then choose Profilers | Static Analysis | Unused VCL Units from the tree view on
the left of the dialog.
Press Configure Current Profiler on the Standard toolbar when the Unused VCL
Units profiler is selected.
AQtime integrated into Microsoft Visual Studio:
•
Select Tools | Options from Visual Studio’s main menu (this will call the Options dialog)
and then select AQtime | Profilers | Static Analysis | Unused VCL Units from the tree
view on the left of the dialog.
AQtime integrated into Embarcadero RAD Studio:
Select AQtime | Options from RAD Studio’s main menu (this will call the Options
dialog), and then choose Profilers | Static Analysis | Unused VCL Units from the tree
view on the left of the dialog.
In the dialog, the following options are available:
•
Delphi version - Specifies the version of the IDE with which the profiled application was created.
The profiler requires the IDE version to analyze the unit usage correctly. The possible values are:
Delphi 3, Delphi 4, Delphi 5, Delphi 6, Delphi 7, Delphi 2005, Delphi 2006, Delphi 2007, Delphi
2009, Delphi 2010.
•
Ignore units with names containing - Specifies the string used to exclude units from analysis. If
a unit name includes a string specified by this option, the profiler considers this unit as used. You
can specify several strings here. Use semicolons to separate them. The default string for the option
is const;type;messages;comstr;_TLB; That is, the Unused VCL Units profiler ignores all the units
whose names include either a const, type, messages, comstr or a _TLB string. An alternative to this
option
is
specifying
the
names
of
files
to
be
ignored
in
the
<AQtime>\Bin\Extensions\IgnoredUnits.txt file.
To learn why certain types of units should be ignored by the profiler, see the Recognition Issues
section in the Unused VCL Units Profiler - Overview.
© 2010 AutomatedQA Corp.
www.automatedqa.com/support
568
AQtime Reference
Counters Overview
This topic provides an overview of AQtime’s counters. It includes the following sections:
General Information
The Performance and Function Trace profilers can gather different kinds of information about the
application. What characteristic the profiler will measure depends on the selected counter. To select a counter
use the Active Counter profiler option.
All counters work for managed and unmanaged code and support 32-bit and 64-bit applications. The
following counters are available in the current AQtime version:
●
Elapsed Time
●
Split Load Replays
●
User Time
●
Split Store Replays
●
User+Kernel Time
●
Blocked Store Forwards Replays
●
CPU Mispredicted Branches
●
Soft Memory Page Faults
●
CPU Cache Misses
●
Hard Memory Page Faults
●
Context Switches
●
All Memory Page Faults
●
64K Aliasing Conflicts
With the help of counters you can not only locate the application routines that are performing poorly, but
investigate the reason for this performance issue. For instance, if a function operates slowly, it can be caused by
inefficient code, poor memory management or a call to a slow system function. Using several different
counters to profile a function, you can find out the exact reason of the delay. Advice on using counters is given
in the Searching for Bottleneck Reasons With the Performance Profiler topic.
Counter Descriptions
•
Elapsed Time. When you select this counter, the profiler measures the function execution time.
The resultant execution time is the time span between two points in time: the entrance and the exit
from the routine. This time period includes the time spent executing code in user mode, time spent
executing code in kernel mode, time spent executing code in other applications, time spent
switching between threads, etc. Use this counter to determine how fast your application executes
the required actions in real time.
•
User Time. This counter is also used to time the function execution. It lets you determine the
«pure» execution time of your code. That is, the resultant time includes only the time spent
executing code in user mode. It does not include time spent executing code in kernel mode as well
as times spent executing other applications or switching between threads. The launch of several
applications during profiling will not affect this counter, since it ignores the time spent executing
other threads and operating system code.
Though the User Time counter times the code execution in user mode only, you will see slight
inconsistency in profiling results. This happens because the profiled application depends on other
processes running in the system. For example, when the CPU switches the context from one thread
to another, it may need to update its caches. The time spent for cache update is added to the
execution time of your code.
•
User+Kernel Time. This counter is similar to User Time. However, profiling results will include
the time spent executing your application code as well as the time spent executing the kernel code
www.automatedqa.com
AQtime by AutomatedQA Corporation
Profilers
569
that was called from your code. The results do not include time spent executing other applications,
time spent switching between threads, etc.
Note:
Contrary to User Time and User+Kernel Time counters, Elapsed Time includes time,
which was spent for execution code in other threads, into the function execution time.
What does this mean? The CPU executes several threads concurrently by giving each
thread a short period of time for execution. When the time period given to the current
thread is over, the CPU switches to another thread, executes it for the short period of
time, then switches to the next thread, and so on. Since the time periods are short, the
threads seem to run simultaneously. Suppose now that there are 40 threads running in
the system and one of these threads is your application’s thread. Imagine, that the CPU
executed several initial instructions of the FuncA routine in your thread, but the time
period given to your thread is over and the CPU switches to one of the other threads.
The CPU will return to your thread and continue executing the FuncA code after it
«goes» through the other 39 threads (this is assuming that all threads have the same
priority). Before FuncA finishes, the CPU may switch the thread context a hundred
times. If you use the Elapsed Time counter, the FuncA time in the profiling results will
include time spent executing other threads (this will include time spent executing
threads of other applications as well as time of other threads of your application). If
you use User Time or User+Kernel Time, the profiling results for FuncA will not
include this time.
The «non-time» counters work similar to User Time and User+Kernel Time. For each
application routine they perform measurements «within» the routine’s thread only, but
not in other threads, where the CPU switched during the routine execution.
•
CPU Cache Misses. CPU uses the cache memory to read bytes from the main memory faster.
CPU loads data in cache and then works with this data, instead of reading them from the main
memory. Today CPUs have several levels of cache. The CPU reads data from the first level cache.
If data is not in this cache, the CPU attempts to load data from the second-level cache to the
first-level cache. If there is not any data in the second-level cache, the CPU attempts to read data
from the main memory or from the caches of the other levels.
A cache miss is an event that occurs when the CPU is trying to read data from the cache, but this
data is not in the cache. Cache misses reduce the application performance because the CPU needs
to access the next-level cache or the main memory (both of which function slower, than the cache
of the upper levels). Using the CPU Cache Misses counter you can determine how many times the
CPU had to update the second-level cache during function execution. This counter helps you find
routines that implement ineffective algorithms for working with memory. The better a routine
operates with data in memory, the less cache misses occur during its execution.
We would like to note that CPU Cache Misses counts only those cache misses that occur in the
thread where your routine executes. If during the routine execution the CPU switches context to
other threads, cache misses that occur in these threads will not be added to the «routine’s» cache
misses (see the note above).
•
Split Load Replays and Split Store Replays counters. The cache memory is organized as a set of
«lines» (the number of bytes in each line depends on the processor model). It is possible that data
loaded from the memory to the cache will be stored to several cache lines. For instance, an integer
value consists of four bytes. Two of these bytes can be stored to one cache line and the other two
bytes can be stored to another line. A split load is an event that occurs when the CPU reads data
from the cache and one part of the data are located in one cache line and another part - in another
line. A split store event is similar to split load but it occurs when CPU writes data to the cache.
© 2010 AutomatedQA Corp.
www.automatedqa.com/support
570
AQtime Reference
These events result in a performance penalty since the CPU reads (or writes to) two cache lines
instead of one line.
The Split Load Replays and Split Store Replays counters allow you to determine whether the
performance slowdowns are caused by the split load and split store events. They count
replays5when conditions for the correct execution of this operation are not satisfied.
Replays may be caused by cache misses, store forwarding issues, etc.
Normally, certain number of replays always occurs during the application execution. However, a
superfluous number of replays designate a performance problem that occur due to split loads and
split stores. The lower the values in profiler results, the less split load and split store events
occurred during application profiling. To decrease the number of the split load and split store
events, it is recommended to use the proper data alignment (for instance, 16-byte alignment) in
your application.
•
Blocked Store Forwards Replays counter. Use this counter to determine whether the
performance slowdowns are caused by the store-to-load forwards that were blocked. Store-to-load
forwarding means that the CPU forwards the store data to the load operation that follows the store.
Store forwarding occurs under certain conditions. If these conditions are violated, store-to-load
forwarding is blocked. This typically happens in the following cases (for more information, see the
Intel processor documentation at http://www.intel.com):
The CPU reads a small amount of data and then writes more data at the same address (for
example, the CPU reads one member of a structure and then writes the whole structure to
the memory).
The CPU stores lots of data and then loads a smaller block.
The CPU operates with data which is not aligned properly.
The counter measures the number of replays6when conditions for the correct execution of this
operation are not satisfied.
Replays may be caused by cache misses, store forwarding issues, etc.
Normally, certain number of replays always occur during the application execution. However, a
superfluous number of replays designates a performance problem that occur due to blocked store
forwards. Normally, blocked store forwards occur during each application run. However, an
excessive number of replays indicates a performance issue. To avoid blocked store forwards,
follow these rules where possible:
•
5
A load that uses store data must have the same start point and alignment that the store data
has.
Load data must be stored in the store data.
Instead of several small loads after a large store to the same region of memory, use a single
large load operation and then store data to the registers where possible.
To obtain non-aligned data, read the smallest aligned portion of data that entirely includes
the desired data and then shift or mask the data as needed.
64K Aliasing Conflicts counter. Use this counter to determine the number of 64K aliasing
conflicts that occur during application profiling. A 64K aliasing conflict occurs when the CPU
reads data from a virtual address that is more than 64K apart from the previously read address.
Such reading reduces the application performance since the CPU needs to update the cache. The
A replay is an attempt of executing a micro-operation.
www.automatedqa.com
AQtime by AutomatedQA Corporation
Profilers
571
64K aliasing conflicts typically occur if the application works with a lot of small memory blocks
that reside in memory far from one another.
•
CPU Mispredicted Branches. Modern pipelined processors include a branch prediction unit that
predicts the results of the comparison instructions. Correct prediction helps the CPU process
binary instructions faster. Wrong prediction leads to the pipeline update, which results in a time
penalty. In other words, code that is more predictable is executed faster than code that is not very
predictable.
The CPU Mispredicted Branches counter lets you determine how well your code can be predicted
by the branch prediction unit. If small values are reported, this means your application is more
predictable and therefore, faster. Higher values mean that the code is not very predictable and may
need to be optimized. This does not mean you need to redesign your algorithm. This just means
you can speed up your code by changing the code structure. Suppose, you have the following lines
of code:
if (a = 0)
c = 100;
else
c = 200;
If variable a assumes only 0 and 1 values, you can avoid the comparison by creating an array of two
elements and using a as the array index:
my_array[0] = 100;
my_array[1] = 200;
...
c = my_array[a];
Note: For more information on CPU cache misses, split load, split store and blocked store
forwarding events, 64K aliasing conflicts and on optimization of branch prediction, see
the Intel documentation at http://www.intel.com.
•
Context Switches. This counter allows you to assess how the operating system schedules threads
to run on the processor. A context switch is when the kernel suspends one thread’s execution on the
processor, records its current environment («context») and restores the newly executing thread’s
context. For instance, this happens when a thread with a higher priority than the running thread is
ready. A low rate of context switches in a multi-processing system indicates that a program
monopolizes the processor and does not allow much processor time for the other threads. A high
rate of context switches means that the processor is being shared repeatedly, which may cause
considerable performance cost.
•
Hard Memory Page Faults, Soft Memory Page Faults and All Memory Page Faults counters.
If you use these counters, AQtime monitors the application execution and counts how many page
faults occur. A «page fault» means that the CPU requests data from memory, but the memory page
that holds this data is not available at the moment. There is a difference between «soft» page faults
and «hard» page faults. A hard page fault means the operating system moved the memory page to
a page file on hard disk, so to provide the requested data, it has to load the memory page from the
page file. A soft page fault occurs when the desired memory page is located somewhere in
memory. A soft page fault also occurs when the application allocates memory blocks. The Hard
Memory Page Faults counter reports about hard page faults that occur during the routine
execution; Soft Memory Page Faults - about «soft» page faults. The All Memory Page Faults
counter is simply a sum of Hard Memory Page Faults and Soft Memory Page Faults.
© 2010 AutomatedQA Corp.
www.automatedqa.com/support
572
AQtime Reference
Page faults (especially hard page faults) have a dramatic impact on the application’s performance.
A delay that is caused by a page fault is much longer than a delay caused by a cache miss. For
example, a hard page fault can take 1,000,000 times longer to process than a cache miss.
Therefore, your application will be faster if there are not many page faults.
Soft page faults occur more often than hard page faults and they are not as «dangerous». However, a lot of
soft page faults can significantly slow down the application execution. Typically, a large number of soft page
faults means the application works with memory ineffectively and the algorithm of working with memory
should be optimized.
Counter Limitations
There are several limitations when using counters:
•
AQtime contains two packages: AQtime x86 and AQtime x64.
If you use AQtime x86 to profile a 32-bit application on a 64-bit operating system, the only
available counter is Elapsed Time. The other counters are not available.
If you use AQtime x64, you can use the Elapsed Time counter. The other counters are only
available if the 64-bit operating system is running in debug mode. For more information on
profiling applications under 64-bit platforms, see Profiling Under 64-bit Platforms.
•
AQtime supports a wide range of processors (see Supported Processor Models), however not all
counters are available for the particular processor models.
The Intel Core i7, Intel Core 2 Duo, Intel Pentium II, Intel Pentium III, Intel Pentium M,
AMD Phenom, AMD Athlon XP and AMD Athlon 64 processors support the Elapsed Time,
User Time, User+Kernel Time, CPU Cache Misses, CPU Mispredicted Branches, Context
Switches, Hard Memory Page Faults, Soft Memory Page Faults and All Memory Page Faults
profiler counters, but do not support the Split Load Replays, Split Store Replays, Blocked Store
Forwards Replays and 64K Aliasing Conflicts counters.
The Mobile Intel Pentium 4, AMD Opteron and AMD Turion processors only support the
Elapsed Time, Context Switches, Hard Memory Page Faults, Soft Memory Page Faults and
All Memory Page Faults counters.
The Intel Xeon and Intel Xeon MP multi-core processors with the Hyper-Threading
technology (for instance, Intel Xeon Duo Core) also only support the Elapsed Time, Context
Switches, Hard Memory Page Faults, Soft Memory Page Faults and All Memory Page Faults
counters. Single-core Intel Xeon and Intel Xeon MP processors support all of the counters.
The Intel Pentium 4 and Intel Pentium D processors are free from these limitations and support
all profiler counters.
If your processor supports the SpeedStep technology, we recommend that you turn off the
dynamic CPU frequency mode before you start profiling. Otherwise, the Elapsed Time, User Time
and User+Kernel Time counters may produce inaccurate timing results.
•
On virtual machines you can only use the Elapsed Time, Context Switches, Hard Memory Page
Faults, Soft Memory Page Faults and All Memory Page Faults counters. The following counters
require a real CPU for timing and do not work on virtual machines: User Time, User+Kernel Time,
CPU Cache Misses, Split Load Replays, Split Store Replays, Blocked Store Forwards Replays,
64K Aliasing Conflicts and CPU Mispredicted Branches.
If you have Windows DDK installed, then using some counters may cause the operating system to
stop unexpectedly and display the error desription on a blue screen.
To solve the problem, launch Driver Verifier (a tool from the Windows DDK package) and disable
www.automatedqa.com
AQtime by AutomatedQA Corporation
AQtime UI Reference
573
the aqIPD7.sys driver verification (this driver is part of AQtime). This Driver Verifier blocks the
AQtime driver.
If you cannot disable verification of the aqIPD.sys driver, you can still use the Elapsed Time, Context
Switches, Soft Memory Page Faults, Hard Memory Page Faults and All Memory Page Faults
counters.
© 2010 AutomatedQA Corp.
www.automatedqa.com/support
574
AQtime Reference
AQtime UI Reference
Menus and Toolbars
You can customize AQtime’s toolbars and menus like you customize toolbars and menus in Microsoft
products. AQtime toolbars can be docked to any side of AQtime’s window.
•
•
AQtime Menus
File - provides commands used to work with files.
Edit - provides the standard edit commands.
View - provides commands that affect AQtime's visual representation.
Project - provides commands that affect an AQtime project's structure.
Run - provides commands that affect the profiling process.
Options - provides commands that affect the options of the current AQtime project.
Help - provides commands that allow you to get support and help with AQtime.
AQtime Toolbars
Standard - provides commands that affect the structure of the current AQtime project.
Edit - provides the standard edit commands.
Setup - provides commands that allow you to add different items to your AQtime project.
Event View - provides commands that affect the Event View panel.
Report - provides commands that affect the Report panel.
PE Reader - provides commands that affect the PE Reader panel.
Explorer - provides commands that affect the Explorer panel.
Main Menu - provides AQtime menus.
Profiler - provides commands that affect the profiling process.
Source Control - provides commands that affect your source code control system.
To learn more about customization of AQtime toolbars, see Toolbars Customization.
Menus
AQtime menus:
•
File - provides commands used to work with files.
•
Edit - provides the standard edit commands.
•
View - provides commands that affect AQtime’s visual representation.
•
Project - provides commands that affect an AQtime project’s structure.
•
Run - provides commands that affect the profiling process.
•
Options - provides commands that affect the options of the current AQtime project.
•
Help - provides commands that allow you to get support and help with AQtime.
File
www.automatedqa.com
AQtime by AutomatedQA Corporation
AQtime UI Reference
575
The File menu provides commands that allow you to work with files. The available commands are:
New Project - Creates a new AQtime project. Alternatively, use the Shift+Ctrl+N shortcut.
New Project From Module - Creates a new AQtime project from the module specified via the standard
Open File dialog.
Open Project - Opens an existing AQtime project. Alternatively, use the Shift+Ctrl+O shortcut.
Recent - Contains a sub-menu that displays a list of .aqt files that you have recently opened in AQtime.
Save Project - Saves the current project item under its current name. Alternatively, use the Ctrl+S
shortcut.
Save Project As - Saves the current project item under a new name.
Close - Closes the current project.
Print Preview - Opens the standard Print Preview dialog where you can set up printing settings and
preview the document before printing it.
Print - Prints the current document. Alternatively, use the Ctrl+P shortcut.
Source Control - Contains a sub-menu that lets you work with source code control systems. The available
commands are:
●
Add to Source Control - Adds a project to the source code control system.
●
Unbind From Source Control - Unbinds a project from the source code control system.
●
Get Latest Version - Gets the latest version of a file from the source code control system.
●
Check Out - Checks a file out from the source code control system.
●
Check In - Checks a file in to the source code control system.
●
Undo Check Out - Undoes checking out a file from the source code control system.
●
Refresh Status - Synchronizes the check-in/check-out status of files in AQtime with the
source code control system’s status of the files.
●
Properties - Invokes a dialog that shows source control properties of your AQtime project.
This dialog is provided by the source code control system.
●
Run Source Control - Runs the source code control client application directly from AQtime.
Install Extenstions - Opens the Install Extensions dialog where you can see the list of installed script
extensions, as well as enable and disable them. See Installing Extensions.
Exit - Exists AQtime.
Edit
The Edit menu provides the standard edit commands that let you undo or revert an action, delete
information or cut, copy and paste it to and from the current project item. The available commands are:
Copy - Copies the text that you have highlighted to the clipboard. Alternatively, use the Ctrl+C
shortcut.
Delete - Deletes the text or project item that you have selected.
Expand All - Expands all the nodes displayed in the Call Tree panel.
Collapse All - Collapses all the nodes that are dispalyed in the Call Tree panel.
Select All - Selects the whole the text of the current item. Alternatively, use the Ctrl+A shortcut.
Find - Opens the standard Find dialog. Alternatively, use the Ctrl+F shortcut.
© 2010 AutomatedQA Corp.
www.automatedqa.com/support
576
AQtime Reference
Find Next - Goes to the next text fragment that meets the condition specified in the Find dialog.
Alternatively, use the F3 shortcut.
View
The View menu provides commands that affect AQtime's visual representation. The available commands
are:
Start Page - Opens the Start Page window or brings this window to front if it is hidden. Alternatively,
use the Ctrl+Alt+S shortcut.
Setup - Opens the Setup panel or brings this panel to front if it is hidden. Alternatively, use the
Ctrl+Alt+E shortcut.
Summary - Opens the Summary panel or brings this panel to front if it is hidden. Alternatively, use
the Ctrl+Alt+U shortcut.
Report - Opens the Report panel or brings this panel to front if it is hidden. Alternatively, use the
Ctrl+Alt+R shortcut.
Explorer - Opens the Explorer panel or brings this panel to front if it is hidden. Alternatively, use the
Ctrl+Alt+P shortcut.
Other Panels - Contains a sub-menu used to open additional panels. The following commands are
available:
●
Details - Opens the Details panel or brings this panel to front if it is hidden. Alternatively, use
the Ctrl+Alt+D shortcut.
●
Call Graph - Opens the Call Graph panel or brings this panel to front if it is hidden.
Alternatively, use the Ctrl+Alt+C shortcut.
●
Call Tree - Opens the Call Tree panel or brings this panel to front if it is hidden. Alternatively,
use the Ctrl+Alt+T shortcut.
●
Editor - Opens the Editor panel or brings this panel to front if it is hidden.
●
Disassembler - Opens the Disassembler panel or brings this panel to front if it is hidden.
Alternatively, use the Ctrl+Alt+B shortcut.
●
PE Reader - Opens the PE Reader panel or brings this panel to front if it is hidden.
Alternatively, use the Ctrl+Alt+Q shortcut.
●
Event View - Opens the Event View panel or brings this panel to front if it is hidden.
Alternatively, use the Ctrl+Alt+V shortcut.
●
Monitor - Opens the Monitor panel or brings this panel to front if it is hidden. Alternatively,
use the Ctrl+Alt+M shortcut.
Select Panel - Opens the Select Panel dialog. Alternatively, use the Alt+O shortcut.
Desktop - Contains a sub-menu used to save and load docking settings. The available menu items are:
●
Load Desktop - Loads a panel layout along with a toolbar layout from an external file.
●
Save Desktop As - Saves the current panel layout along with the toolbar layout to an external file.
●
Docking Allowed - If this menu item is checked, you can dock any panel anywhere you like. If
this item is unchecked, you cannot change the current docking scheme. To learn more, see the
Docking help topic.
●
Restore Default Docking - Restores the default panel layout.
●
Load Docking From File - Loads a layout from an existing .qtdock file.
www.automatedqa.com
AQtime by AutomatedQA Corporation
AQtime UI Reference
●
577
Save Docking to File - Saves the current layout to a .qtdock file.
To learn more about docking AQtime panels, see the Docking help topic.
Toolbars - Contains a sub-menu that affects toolbar customization. The available menu items are:
●
Load From File - Loads toolbar settings from the specified .aqtlb file.
●
Save to File - Saves the current toolbar settings to a .aqtlb file.
●
Restore Toolbar - Restores the default toolbar settings.
●
Customize - Opens the Customize dialog.
Results Views - Contains a sub-menu used to select the desired result view. The following commands
are available:
●
Default - Commands AQtime to use the Default result view.
●
Routines covered less than 50% - Commands AQtime to use the Routines covered less than 50%
result view.
●
Routines covered less than 90% - Commands AQtime to use the Routines covered less than 90%
result view.
●
Routines covered less than 100% - Commands AQtime to use the Routines covered less than
100% result view.
●
Unexecuted routines only - Commands AQtime to use the Unexecuted routines only results view.
To learn more about AQtime result views, see the Result Views help topic.
Project
The Project menu provides commands that allow you to add different project items to an AQtime project:
areas, actions, triggers and so on. The available commands are:
Add Module - Adds a new module to the current AQtime project.
Add Area - Adds a new area to the current AQtime project. To learn more about areas, see the Using
Profiling Areas help topic.
Add Action - Adds a new action to the current AQtime project. To learn more about AQtime project
actions, see the Using Actions help topic.
Add Trigger - Adds a new trigger to the current AQtime project. To learn more about AQtime project
triggers, see the Using Triggers help topic.
Files to Ignore - Excludes the specified files and routines from profiling. To learn more, see the
Excluding Code From Profiling help topic.
Search Directories - Opens the Project Search Directories dialog.
Reload Debug Info - Reloads debug information for the modules included in the current AQtime
project.
Run
The Run menu provides commands that let you start profiling the desired module, pause the profiling
process, get the profiling results and so on. The available commands are:
Run - Starts profiling the currently selected module. Alternatively, use the F5 shortcut. See the Starting
and Stopping Profiling help topic.
Attach to Process - Attaches AQtime to the specified application that has already been launched.
Alternatively, use the Shift+Ctrl+R shortcut. See the Attaching to Process help topic.
© 2010 AutomatedQA Corp.
www.automatedqa.com/support
578
AQtime Reference
Parameters - Opens the Run Parameters dialog.
Pause - Pauses the profiling process. See the Pausing and Resuming Profiling help topic.
Terminate - Closes the profiled application. Alternatively, use the Shift+F5 shortcut. See the Starting
and Stopping Profiling help topic.
Disable Profiling - Is this item is not selected, the profiling feature is enabled. Otherwise, application
profiling is disabled. See the Enabling and Disabling Profiling help topic.
Get Results - Obtains the profiling results during the project run. Alternatively, use the Ctrl+R
shortcut. To learn more, see the Getting Results During Profiling help topic.
Clear Results - Flushes all the gathered results. To learn more, see the Clearing Results During
Profiling help topic.
Options
The Options menu provides commands that let you customize the options of the current AQtime project.
The available commands are:
Options - Opens the Options dialog.
Customize Keyboard - Opens the Customize Keyboard dialog.
Help
The Help menu provides commands that allow you to get help with AQtime, visit AutomatedQA’s web
site or contact our support team. The available commands are:
Start Page - Opens the Start Page window or brings this window to front if it is hidden. Alternatively,
use the Ctrl+Alt+S shortcut.
Contents - Displays the contents of AQtime Help. Alternatively, use the Shift+Alt+F1 shortcut.
Index - Opens the index of AQtime Help. Alternatively, use the Shift+Alt+F2 shortcut.
Help On Selected Profiler - Opens the help topic about the currently selected AQtime profiler.
Check for Updates - Checks for updates for the current version of the product on AutomatedQA’s web
site.
Getting Started Tutorial - Opens the AutomatedQA web site’s page that contains a link to a tutorial
screencast.
AutomatedQA
Web
Site
http://www.automatedqa.com.
-
Allows
you
to
visit
AutomatedQA’s
web
site,
Contact
Support
Team
Opens
the
Contact
Support
Form
at
http://www.automatedqa.com/support/message that allows you to submit your question to our support
team.
Register - Opens the Registration Form.
About - Opens the About window that contains information about your current AQtime version, the URL
of AutomatedQA’s web site, your registration information and the version of your operating system.
www.automatedqa.com
AQtime by AutomatedQA Corporation
AQtime UI Reference
579
Toolbars
AQtime toolbars:
●
Standard - provides commands that affect the structure of the current AQtime project.
●
Edit - provides the standard edit commands.
●
Setup - provides commands that allow you to add various items to your AQtime project.
●
Event View - provides commands that affect the Event View panel.
●
Report - provides commands that affect the Report panel.
●
PE Reader - provides commands that affect the PE Reader panel.
●
Explorer - provides commands that affect the Explorer panel.
●
Main Menu - provides AQtime menus.
●
Profiler - provides commands that affect the profiling process.
●
Source Control - provides commands that affect your source code control system.
You can customize AQtime’s toolbars like you customize toolbars in Microsoft products. AQtime toolbars
can be docked to any side of AQtime’s window. To learn more about customization of AQtime toolbars, see
the Toolbars Customization help topic.
Standard
The Standard toolbar contains the following buttons that affect the structure of the current AQtime
project:
Open an Existing Project - Opens an existing AQtime project specified via the standard Open File
dialog. Alternatively, use the Shift+Ctrl+O shortcut.
New Project From Module - Creates a new AQtime project from the module specified via the standard
Open File dialog.
Profiling Modes - Allows you to select a profiling mode. To select one of the available modes, click the
button’s down arrow. The available modes are:
●
Service - Activates the Service profiling mode.
●
COM Server - Activates the COM Server profiling mode.
●
IIS - Activates the IIS profiling mode.
●
ASP.NET - Activates the ASP.NET profiling mode.
●
Normal (Default) - Activates the Normal profiling mode.
To learn more, see the About Profiling Modes help topic.
Attach to Process - Attaches AQtime to the specified application that has already been launched. To
learn more, see the Attaching to Process help topic. Alternatively, use the Shift+Ctrl+R shortcut.
Run - Starts profiling the currently selected module. Alternatively, use the F5 shortcut.
Select Profilers - Allows you to select the desired AQtime profiler from the drop-down list. To open the
list, click the down arrow on the right of the profiler name. To learn more, see the AQtime Profilers help topic.
Configure Current Profiler - Opens the Options dialog on the options page of the currently selected
AQtime profiler.
Clear Results - Flushes all the gathered results. To learn more, see the Clearing Results During
Profiling help topic.
© 2010 AutomatedQA Corp.
www.automatedqa.com/support
580
AQtime Reference
Terminate - Terminates application profiling. Alternatively, use the Shift+F5 shortcut.
Disable Profiling - Is this item is selected, the profiling feature is not enabled. Otherwise, the
application profiling is enabled.
Get Results - Obtains the profiling results during the project run. Alternatively, use the Ctrl+R
shortcut.
Results Views - Allows you to select a result view. To select one of the available result views, click the
button’s down arrow. The available items are:
●
Default - Activates the Default result view.
●
Routines covered less than 50% - Activates the Routines covered less than 50% result view.
●
Routines covered less than 90% - Activates the Routines covered less than 90% result view.
●
Routines covered less than 100% - Activates the Routines covered less than 100% result view.
●
Unexecuted routines only - Activates the Unexecuted routines only result view.
To learn more about AQtime result views, see the Result Views help topic.
Edit
The Edit toolbar contains the standard edit buttons that allow you delete information and copy it from the
current item. The available commands are:
Copy - Copies the text that you have highlighted to the clipboard. Alternatively, use the Ctrl+C
shortcut.
Delete - Deletes the text or project item that you have selected.
Setup
The Setup toolbar contains buttons that allow you to customize your AQtime project.
Note: The toolbar is located at the top of the Setup panel.
The available commands are:
Add Module - Adds a new module to the current AQtime project.
Remove Module - Removes the selected module from the current AQtime project.
Set as Active Module - Sets the selected module as active.
View By - Contains a drop-down list of commands used to arrange information in the Setup panel. To
open the list of available commands, click the down arrow on the right of the currently selected View By list
value. The following items are available: Default, Unit, Class, Routine, Source File, Package and Namespace.
To learn more, see the Modules pane section of the Setup panel help topic.
Sort Ascending - If this item is selected, AQtime sorts items in ascending order in the Setup panel.
Sort Descending - If this item is selected, AQtime sorts items in descending order in the Setup panel.
Exclude Standard Source Files - If this item is selected, AQtime excludes the modules provided by
standard libraries from the profiling process. Otherwise, all the modules the profiled application contains are
processed by AQtime.
Add Area - Adds a new area to the current AQtime project. To learn more about areas, see the Using
Profiling Areas help topic.
Add Trigger - Adds a new trigger to the current AQtime project. To learn more about AQtime project
triggers, see the Using Triggers help topic.
www.automatedqa.com
AQtime by AutomatedQA Corporation
AQtime UI Reference
581
Add Action - Adds a new action to the current AQtime project. To learn more about AQtime project
actions, see the Using Actions help topic.
Event View
The Event View toolbar contains buttons that allow you to handle events that occur in AQtime during its
functioning.
Note: The toolbar is located at the top of the Event View panel.
The available commands are:
Add Comment - Opens the Add Comment dialog.
Clear - Clears the Event View panel.
Go to Previous Event - Goes to the previous event of the same type as the current one.
Go to Next Event - Goes to the next event of the same type as the current one.
Show/Hide the Filter panel - If this item is selected, the Filter panel is shown at the bottom of the
Event View panel. Otherwise, the Filter panel is hidden.
Generate Process Dump - Generates an error report. To learn more, see the Generating Dumps for
Profiled Applications help topic.
Go to the Next Event - Goes to the next event with the same thread ID as the current one.
Go to the Previous Event - Goes to the previous event with the same thread ID as the current one.
Report
The Report toolbar contains buttons that allow you to work with profiling results.
Note: The toolbar is located at the top of the Report panel.
The available commands are:
Display Previous - Allows you to return to one of the previous entries in the table containing profiling
results. To navigate to a previous entry, click the button's down arrow and select the desired item from the list.
Display Next - Allows you to navigate to one of the next entries in the table containing profiling
results. To do this, click the button's down arrow and select the desired item from the list.
Field Chooser - Opens the Columns dialog that allows you to add or remove the desired columns to or
from the panel.
Show Group Panel - Shows the panel that allows you to customize the view the results are shown in.
To learn more, see the Grouping Results help topic.
Filter - If this item is selected, the Filter panel is shown at the bottom of the Event View panel.
Otherwise, the Filter panel is hidden.
PE Reader
The PE Reader toolbar contains buttons that help you work with the PE Reader panel.
Note: The toolbar is located at the top of the PE Reader panel.
© 2010 AutomatedQA Corp.
www.automatedqa.com/support
582
AQtime Reference
The available commands are:
Undecorated routine names - If this item is selected, the routine names shown in the Routine column
of the PE Reader panel are undecorated. Otherwise, the names are decorated.
Show Imported Modules - Lets you see the child modules of the currently selected module.
Reload Modules Tree - Updates the module tree.
Explorer
The Explorer toolbar contains buttons that help you work with the Explorer panel.
Note: The toolbar is located at the top of the Explorer panel.
The available commands are:
New Folder - Adds a new main branch to the Explorer panel.
Move to Saved Results - Moves the selected result to the Saved Results list.
Compare - Compares the selected results. To learn more, see the Comparing and Merging Results help
topic.
Filed Chooser - Opens the Columns dialog that allows you to add or remove the desired columns to or
from the panel.
Main Menu
The Main Menu toolbar contains the following items that correspond to similar AQtime menus:
●
File - provides commands used to work with files.
●
Edit - provides the standard edit commands.
●
View - provides commands that affect AQtime's visual representation.
●
Project - provides commands that affect the current AQtime project.
●
Run - provides commands that affect the profiling process.
●
Options - provides commands that affect an AQtime project's options.
●
Help - provides commands that allow you to get support and help with AQtime.
You cannot customize this toolbar, so, in the Customize dialog, the appropriate property is disabled.
Profiler
The Profiler toolbar contains items that affect the structure of the Report panel.
Note: The toolbar is located at the top of the Report panel.
The following items are available:
Mark partially executed lines as - Allows you to specify how AQtime will mark lines that were
executed partially during profiling:
●
Partially executed (yellow dot) (Default) - If this item is selected, the partially executed lines are
treated as partially executed and are marked with a yellow dot.
●
Non-executed (red dot) - If this item is selected, the partially executed lines are treated as
non-executed and are marked with a red dot.
www.automatedqa.com
AQtime by AutomatedQA Corporation
AQtime UI Reference
●
583
Completely executed (green dot) - If this item is selected, the partially executed lines are treated as
completely executed and are marked with a green dot.
Show routines with class names - If this item is selected, routine names are shown with their class
names within the Report panel. Otherwise, only routine names are shown.
Show file names with path - If this item is selected, file names are shown with their path within the
Report panel. Otherwise, only names are shown.
Help On Selected Profiler - Opens the help topic on the currently selected AQtime profiler.
Source Control
The Source Control toolbar contains the following buttons that affect your source code control system:
Add to Source Control - Adds a project to the source code control system.
Unbind From Source Control - Unbinds a project from the source code control system.
Get Latest Version - Gets the latest version of a file from the source code control system.
Check Out - Checks a file out from the source code control system.
Check In - Checks a file in to the source code control system.
Undo Check Out - Undoes checking out a file from the source code control system.
Properties - Invokes a dialog that shows source control properties of your AQtime project. This dialog
is provided by the source code control system.
Refresh Status - Synchronizes the check-in/check-out status of files in AQtime with the source code
control system’s status of the files.
Run Source Control - Runs the source code control client application directly from AQtime.
To learn more, see the Integration With Source Control Systems help topic.
Toolbars Customization
The way you customize AQtime’s toolbars and menus depend on whether you use the standalone AQtime
version or the integrated one.
AQtime integrated into Microsoft Visual Studio adds several elements to Visual Studio’s menu and
toolbars:
•
The AQtime item to Visual Studio’s main menu.
•
Several items to the Project menu of Visual Studio’s main menu.
•
The AQtime Standard and AQtime Profiling toolbars.
AQtime integrated into Embarcadero RAD Studio also adds several elements to RAD Studio’s menu and
toolbars:
•
The AQtime item to RAD Studio’s main menu.
•
The AQtime Profile Windows submenu to the View menu of RAD Studio’s main menu.
•
The Setup, Event View, Report, PE Reader, Explorer and Profiler toolbars.
•
The Allocation Profiler.AQtime, BDE SQL Profiler.AQtime, Coverage Profiler.AQtime,
Disassembler.AQtime,
Edit.AQtime,
Event
View.AQtime,
Explorer.AQtime,
Export.AQtime, File.AQtime, Function Trace Profiler.AQtime, Help.AQtime,
Monitor.AQtime, Options.AQtime, PE Reader.AQtime, Performance Profiler.AQtime,
Project.AQtime, Report.AQtime, Resource Profiler.AQtime, Run.AQtime, Setup.AQtime,
© 2010 AutomatedQA Corp.
www.automatedqa.com/support
584
AQtime Reference
Standard.AQtime, Static Analysis.AQtime and View.AQtime command categories providing
various commands that can be added to any toolbar via the Toolbar Customization dialog.
You can customize these toolbars and menus in the same manner as you customize other menus and
toolbars in Visual Studio or RAD Studio (however, it is not possible to configure menus in RAD Studio). In
addition to the mentioned toolbars, there are also toolbars located within AQtime panels that are integrated into
Visual Studio. These toolbars hold items that are specific to the panel to which the toolbar belongs. You can
show or hide items on these toolbars and dock these toolbars to any side of a panel (see below). However,
moving items among these toolbars and creating new toolbars of this type is currently not supported.
The standalone version of AQtime also have panel-specific toolbars. However, there are also toolbars (for
instance, the Standard toolbar) that are located within AQtime’s main window. Despite of the toolbars location
(panel or main window), you can customize that toolbars like you customize toolbars and menus in Microsoft
Visual Studio or in other Microsoft products, such as Word or Excel. For instance, like in Visual Studio,
AQtime toolbars can be docked to any side of AQtime’s window. A panel-specific toolbar can be docked to
any side of its panel or it can be undocked from its panel and docked to any side of AQtime’s main window.
To place a toolbar in a desired location in the standalone AQtime version, simply drag the toolbar by its
title bar to that location. The two figures below illustrate how the Setup toolbar can be docked:
The toolbar is docked to the top edge of AQtime’s
main window under the Standard toolbar.
The Setup toolbar is docked to the left side of the
Setup panel (by default, this toolbar is docked to
the top side of the panel).
Note: If you use AQtime integrated into Visual Studio, you can move panel-specific toolbars within
their panels only.
Toolbars in the standalone AQtime version can be organized into several rows. You can place more than
one toolbar in the same row. If the toolbar is not wide enough to show all of its items, it displays the >> button
at the end. Clicking this button opens a list with the toolbar items that are currently invisible:
www.automatedqa.com
AQtime by AutomatedQA Corporation
AQtime UI Reference
585
To hide or display buttons on a toolbar in the standalone AQtime version or in AQtime integrated into
Visual Studio, click the down arrow on the right of the desired toolbar and then click the Add or Remove
Buttons item. This will call a menu similar to the following one:
Simply uncheck the buttons you want to hide and check the items you want to be visible on the toolbar.
Note:
In the same manner you can hide or show items on the toolbars that are located within panels of
AQtime integrated into Visual Studio.
To add a button to the toolbar or to the main menu in the standalone AQtime version:
•
Right-click any toolbar and select Customize from the context menu or select View | Desktop |
Customize Toolbars from AQtime’s main menu. This will bring up the Toolbar Customization
dialog:
•
Switch to the Commands tabbed page.
•
Select the desired item on the Commands page and then drag it to the desired toolbar or menu.
To remove an item from the toolbar or menu, simply drag it and drop it somewhere outside the toolbar or
menu area when the Toolbar Customization dialog is displayed on screen.
Note: The Toolbar Customization dialog is not available if you use the integrated version of AQtime.
Instead, you should use native toolbar customization facilities that are available in Visual Studio
or RAD Studio.
When the Toolbar Customization dialog is visible, you can modify properties of a toolbar or menu item. To
do this, simply right-click the desired item and use the subsequent context menu:
© 2010 AutomatedQA Corp.
www.automatedqa.com/support
586
AQtime Reference
A unique mechanism, used for toolbar and menu functioning, provides a powerful feature that allows
menus to behave like a Recently Used Files list. In other words, frequently used menu items are visible, and
rarely used items are hidden. To enable this feature, just check the Menus show recently used command first
option in the Toolbar Customization dialog:
If the Show full menus after a short delay option is checked, menus display all their items (including
rarely used items that are hidden) after a short pause.
In the standalone AQtime version, you can save the current toolbar settings to an .aqtlb file by selecting
View | Desktop | Save Toolbar to File from AQtime’s main menu. To load the toolbar settings from a file, use
View | Desktop | Load Toolbar from File. To restore the default toolbar settings, select View | Desktop |
Restore Default Toolbar. To save or load toolbar settings along with the panel layout, use the View | Desktop
| Save Desktop As and View | Desktop | Load Desktop menu items.
www.automatedqa.com
AQtime by AutomatedQA Corporation
AQtime UI Reference
587
Panels
Assistant Panel
The Assistant panel helps you get started with AQtime quicker. The panel includes several pages that are
brought up depending on the current context. These pages display information to assist you in working with
AQtime. For instance, when you are reviewing profiler results, the Assistant panel displays the Analyze
Results page with information and links to help topics that hold information that concern viewing results.
By default, the panel is displayed to the right of AQtime's, Visual Studio's or RAD Studio's main window.
If the Assistant panel is not visible, you can bring it up by doing any of the following:
•
AQtime standalone:
Select Assistant from the View | Other Panels or Help menu.
•
AQtime integrated into Visual Studio:
•
Select Assistant from the Select Panel dialog, which is called by selecting View | Select
Panel.
Select Assistant from the Select Panel dialog, which is called by selecting AQtime |
Panel List.
Select Assitant from Visual Studio's Solution Explorer.
AQtime integrated into Embarcadero RAD Studio:
Select Assistant from the View | AQtime Profile Windows | Other menu.
To switch between pages in the Assistant panel, press the
the desired page name from the menu:
and
buttons at the top of the panel or select
Currently, the Assistant panel includes the only customizable option, Context-sensitive. It specifies
whether AQtime automatically changes the Assistant panel page according to changes in the context. You can
check or change this option using the Assistant Options dialog. To call it, do any of the following:
•
•
AQtime standalone:
Select Options from the context menu of the Assistant panel.
Select Options | Options from AQtime’s main menu and then choose Services |
Assistant in the ensuing Options dialog.
AQtime integrated into Visual Studio:
Select Options from the context menu of the Assistant panel.
© 2010 AutomatedQA Corp.
www.automatedqa.com/support
588
AQtime Reference
Right-click Assistant in Visual Studio's Solution Explorer and select Properties from the
context menu.
Select Tools | Options from the main menu of Visual Studio and then choose the AQtime
| Services | Assistant in the ensuing Options dialog.
•
AQtime integrated into Embarcadero RAD Studio:
Select Options from the context menu of the Assistant panel.
Select AQtime | Options from the main menu of RAD Studio and then choose Services |
Assistant in the ensuing Options dialog.
Call Graph Panel
Call Graph Panel - Description
The Call Graph panel can be used with the Performance, Function Trace and Allocation profilers. For the
Performance and Function Trace profilers, Call Graph displays the hierarchy of calls for the routine clicked
in the Report panel. For the Allocation profiler, the Call Graph displays the hierarchy of object references for
the object clicked in Report. To display the Call Graph panel, do any of the following:
•
AQtime standalone:
Select Call Graph from the View | Other Panels menu.
Select Call Graph from the Select Panel dialog, which is called by selecting View | Select
Panel.
Select Call Graph from the Assistant panel.
•
AQtime integrated into Visual Studio:
Select Call Graph from the Select Panel dialog, which is called by selecting AQtime |
Panel List.
Select Call Graph from Visual Studio's Solution Explorer.
Select Call Graph from the Assistant panel.
•
AQtime integrated into Embarcadero RAD Studio:
Select Call Graph from the View | AQtime Profile Windows | Other menu.
Select Call Graph from the Assistant panel.
www.automatedqa.com
AQtime by AutomatedQA Corporation
AQtime UI Reference
589
In the upper part of the rectangle you can see the routine name, and in the lower part, the profiling results:
In the object reference hierarchy, each object is represented as a rectangle and the arrows show the
sequence of references between objects. In the upper part of the rectangle you can see the class name and
instance number of the given object, and in the lower part, the object size.
All panel settings are divided into two large groups: options specific to the current profiler and options
common for all profilers. To modify options specific to the current profiler, use the Customize Call Graph
© 2010 AutomatedQA Corp.
www.automatedqa.com/support
590
AQtime Reference
dialog (to call it, select Customize from the Call Graph context menu). To modify options that do not depend
on the profiler, use the Call Graph Options dialog (it appears upon selecting Options from the context menu).
The Customize Call Graph dialog lets you select:
•
Result values to be displayed,
•
Result format,
•
Sorting order, etc.
If the Show results as hint option is enabled, profiling results are displays as a hint when you move the
mouse over a rectangle. If this option is off, profiling results are displayed within the rectangle.
In the Call Graph Customization dialog, you can also select what values should be displayed on the graph's
arrows. For instance, if you select Hit Count (for the Performance profiler) then the numbers at the beginning
of the arrows (from parent routines), specify how many times the highlighted routine was called from the
parent one. Those at the arrow heads (towards child routines) specify how many time