1
Quality Targets and
Indicators for
Sustainable Mobility
User Guide
Credits:
Published by:
Umweltbundesamt Dessau
Postfach 14 06
06813 Dessau
Tel. 0340/2103-0
Fax 0340/2103-2285
Internet: http://www.umweltbundesamt.de
Edited by:
Dr. Hedwig Verron
Marion Malow
Paul Klippel
Author:
BSV Büro für Stadt- und Verkehrsplanung
Dr.-Ing. Reinhold Baier GmbH, Aachen
Karl Heinz Schäfer
on the basis of the model project
People – Town – Transport – Environment.
Local Agenda 21 – Sustainable Mobility.
Phase 2: Implementation in the Model Towns
Erfurt, Görlitz and Lörrach.
Translated by:
Terence J. Oliver
© 2005 Umweltbundesamt Dessau
PEOPLE – TOWN – TRANSPORT – ENVIRONMENT
Quality targets and indicators for sustainable mobility in cities and regions
Contents
1.
Introduction: Users wanted..............................................................................................4
2.
Sustainable mobility requires targets and indicators .......................................................5
2.1
Setting the scene.............................................................................................................5
2.2
Definitions........................................................................................................................6
2.3
The benefits.....................................................................................................................7
2.4
A case study....................................................................................................................8
3.
Quality targets, indicators, guidelines – the overall catalogue.........................................9
3.1
Target areas and quality targets......................................................................................9
3.2
Indicators as assessment parameters...........................................................................11
3.3
Transport planning guidelines .......................................................................................14
3.4
The toolbox....................................................................................................................15
3.5
A “core set” for a start....................................................................................................16
4.
Information for users .....................................................................................................18
4.1
Creating the city-specific version...................................................................................18
4.2
Framework conditions having an influence ...................................................................19
4.3
FAQ – Frequently asked questions ...............................................................................20
4.4
Interim review – Getting down to it ................................................................................22
5.
Transport development planning and Local Agenda 21 ................................................24
5.1
Prospects of close connections .....................................................................................24
5.2
Participation models in practice.....................................................................................28
5.3
Expert-assisted lay planning as a Local Agenda 21 project ..........................................32
6.
Bibliography and list of sources.....................................................................................34
Appendix
Quality targets, indicators and transport planning guidelines for sustainable transport
development User Catalogue...................................................................................................35
-3-
PEOPLE – TOWN – TRANSPORT – ENVIRONMENT
Quality targets and indicators for sustainable mobility in cities and regions
1.
Introduction: Users wanted
Sustainable transport development planning is keyed to quality targets of a long-term nature
which together describe a holistic vision – in this case relating to mobility and transport – of a
city or community. Quality targets have this name because they set out quality requirements
for future development. They define a desired final situation that can be characterised by the
term “sustainable mobility”.
Indicators are key figures that make it possible to measure, calculate or at least describe in
concrete terms how successful the efforts to achieve the defined targets have been. They
stand for specific important aspects of the relevant quality targets and are partly based on
city-specific standards that are laid down in transport planning guidelines.
Formulation and exemplary use of quality targets and indicators was the focus of the Federal
Environment Agency’s model project with the title “People – Town – Transport –
Environment. Local Agenda 21 – Sustainable Mobility”.
The model project took place in two phases. The first project phase drew up a catalogue of
technical and planning oriented quality targets for sustainable mobility, and supplemented
these with proposals for indicators. Work started in December 1999, and the final report was
presented in July 2001 and has since been published.1
On the basis of the first phase, the second project phase drew up city-specific quality targets
and indicators for the field of mobility/transport in four cities – the model cities Erfurt, Görlitz
and Lörrach and the “accompanying city” Herdecke – that permitted systematic use for the
purpose described above. The project involved not only the municipal Environment,
Transport and Town Planning or Urban Development departments, but also citizens and
Local Agenda 21 interest groups. Phase two was completed after two and a half years in the
summer of 2004.2
The present User Guide summarises the main findings of the model project. It contains a
catalogue of quality targets, indicators and transport planning guidelines that provides local
authority users with a range of instruments for control and quality assurance in the field of
transport development planning. It also offers information on the design of processes for the
introduction and ongoing use of quality targets and indicators for the field of mobility /
transport, also taking account of the Local Agenda 21.
Sustainable mobility is a long-term municipal vision. Achieving this vision is virtually
unthinkable without clearly formulated objectives and repeated soundly based checking and
re-checking of steps already implemented. The instruments and methods developed in the
model project “People – Town – Transport – Environment” are therefore recommended for
use by other cities and municipalities.
1
Federal Environment Agency – Umweltbundesamt (Ed.): Kommunale Agenda 21 – Ziele und Indikatoren einer
nachhaltigen Mobilität, Berichte 8/02, Erich Schmidt Verlag: Berlin 2002. (Bearbeitung: Ulf Surburg, BPIConsult GmbH, Berlin / Norbert Kuntz, Jochen Richard, Planungsbüro Richter-Richard, Aachen.)
2
The final report is to be published in the UBA Series "Berichte" (Reports) in 2005.
-4-
PEOPLE – TOWN – TRANSPORT – ENVIRONMENT
Quality targets and indicators for sustainable mobility in cities and regions
2.
2.1
Sustainable mobility requires targets and indicators
Setting the scene
At the beginning of the model project it became clear from the discussions with the Local
Agenda 21 groups that working with quality targets and (verifiable) indicators can by no
means be taken for granted, not only among specialist planners and local politicians, but also
among interested citizens.
This is not surprising. Most people even have difficulty in dealing with personal targets and
the relevant parameters (indicators) and resolutions (measures).
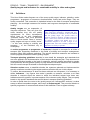
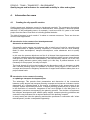
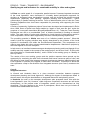
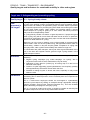
When embarking on a discussion of quality targets, indicators and measures in the field of
mobility / transport, it is therefore logical to fall back on examples from personal experience,
as illustrated in the following picture.
Quality targets, indicators and measures in our everyday life – an approximation.
This example is intended to demonstrate that formulating the target, defining suitable
indicators and deducing (and implementing) measures is only possible as the result of a
lengthy and serious discussion and decision process.
Basic understanding and agreement are underlying requirements for successful
implementation. In this respect the personal level does not differ from the municipal level.
-5-
PEOPLE – TOWN – TRANSPORT – ENVIRONMENT
Quality targets and indicators for sustainable mobility in cities and regions
2.2
Definitions
This User Guide makes frequent use of the terms quality target, indicator, guideline, action
programme / programme of measures, situation/interim review and action target. They are
closely connected. This connection is explained below for the field of transport development
planning – the municipal instrument for medium and long-term development of sustainable
mobility.
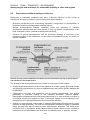
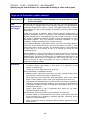
Quality targets are an expression of
long-term objectives. They are given this
name because they set out quality
requirements for future development
which have to do with fundamental
“protected assets”. One such protected
asset is human health. Seen in context,
quality targets add up to a holistic “vision”
– in this case relating to mobility and
transport – of the individual city or
municipality.
Quality targets frequently describe a vision. In
other words they formulate a standard that may
never be attained. For example, it may be assumed
that the quality target “No persons killed or
seriously injured in transport accidents within the
town” (vision zero) will never be achieved because
of situations (chance) and human error. It is
nevertheless helpful to set such a target as an
imagined ideal state and constantly endeavour to
approach it as closely as possible.
An action programme or programme of measures is based on concepts for all kinds of
transport plus supporting measures in the fields of mobility and transport management,
transport safety and transport marketing. The specific individual measures are intended to
ensure progress towards the stated (quality) targets.
Transport planning guidelines describe in more detail the strategies and standards that
are to be applied in the implementation of the transport development plan. They thus serve to
transpose individual targets to the level of measures, and also enable interested lay people
(local politicians and the general public) to judge whether individual measures are consistent
with the overall concept formulated in the transport development plan.
Situation reviews serve to establish whether the measures planned and implemented do
actually contribute to achieving the targets and how effective they are in this respect.
To ensure that assessments of what has been achieved are transparent, it is necessary to
define indicators – key figures that make it possible to measure, calculate or at least
describe in concrete terms the extent to which the individual targets have been met.
Indicators stand for specific, important aspects of the relevant quality targets. They are partly
based on city-specific standards that are laid down in transport planning guidelines.
In order to break down the route to the (quality) target into “manageable” sections, it makes
sense to define intermediate targets, also known as action targets. They must be linked to a
specific programme of measures and actions if their definition is not to appear arbitrary.
-6-
PEOPLE – TOWN – TRANSPORT – ENVIRONMENT
Quality targets and indicators for sustainable mobility in cities and regions
2.3
The benefits
On the basis of experience gained from the model project (and elsewhere), the benefits of
systematic use of quality targets and indicators in municipal transport development planning
are both numerous and clear:
• Users gain a systematic, soundly based instrument for controlling transport development
planning which takes account of the complex relations between actions and effects. It
makes it possible to arrive at a comprehensive description of the overall town planning
and transport planning objective of “sustainable mobility”, and to examine the route to
achieving it.
• Formulated quality targets and transport planning guidelines make transport development
planning more transparent. They offer local politicians and the general public access to a
better understanding of the complex relations between mobility, transport and
environment. This simplifies local discussions of transport planning topics and can help to
make them more objective.
• The preparation and updating of the data needed to determine the indicators is not an end
in itself. It permits permanent and systematic quality assurance within administrative
activities, because the current state of progress towards achieving the measures is always
known.
• Even with only a small number of quantified indicators, it is both possible and sensible to
start using a city-specific quality target indicator system. The approach developed in the
model project works on the basis that additional quality targets are initially included by
means of descriptive indicators. In all cases the target and result is a comprehensive
overall (interim) picture of the progress made by municipal transport development.
• In the long term, participation by interested citizens in transport development planning –
for example in the context of the Local Agenda 21 – makes for greater understanding and
acceptance in the planning and implementation of measures. Formulated quality targets
and transport planning guidelines provide a helpful basis for this.
-7-
PEOPLE – TOWN – TRANSPORT – ENVIRONMENT
Quality targets and indicators for sustainable mobility in cities and regions
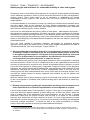
2.4
A case study
The town of Herdecke (population 27,000) is located in
North Rhine/Westphalia in the immediate vicinity of the
cities of Dortmund, Hagen and Witten.
Work on the “Sustainable Transport Development
Plan” started in 2001 and was completed at the end of
2004. Quality targets and indicators were an integral
part of the decision to prepare such a plan.3 The
transport planning analyses therefore included the
determination of data for specified individual indicators.
On this basis the project undertook a “situation review” – What is the position regarding
mobility and transport development in Herdecke in relation to the formulated quality targets?
– and an estimate of the targets that could be achieved by the year 2015 provided the
measures were implemented by then.
In the course of the planning process, the original approach to the city-specific quality target
indicator system was updated and modified. A city-specific “user catalogue” with quality
targets, indicators and transport planning guidelines is part of the planning complex.
Since 2001 the Herdecke administration has had a staff unit for implementation of the Local
Agenda 21 which reports direct to the mayor.
Dovetailing of transport planning and Local Agenda 21 first took place in 2001/2002 in the
context of a planning workshop for the urban development of the railway station.
Transport development planning was the second practical case. Participation involved a
public kick-off event in May 2003 and four meetings, lasting several hours each, of a
planning workshop of fixed composition from June 2003 to June 2004. In addition to relevant
local interests (institutions, associations, organisations), the parties in the local council were
also represented. The specialist administrative departments were represented at meetings
by the Local Agenda 21 officer, the heads of the Planning and Urban Development
department (responsible for the transport development plan), the Environment department
and the Engineering department.
Quality targets and indicator-based impact analyses formed an important background to the
substantive discussions in the planning workshop and the local authority bodies. This both
ensured a sound base and provided effective support for the results of the planning
workshop, which led to a unanimous recommendation to implement the jointly developed
concepts.
The town council recently decided that in future the Local Agenda 21 is to be integrated in all
planning projects in Herdecke – including further specification and implementation of concept
modules and measures under the Sustainable Transport Development Plan. The favourable
experience with the planning workshop was a major factor in this decision.
3
This made use of a preliminary version of the catalogue of quality targets and indicators that was drawn up in
the first phase of the model project.
-8-
PEOPLE – TOWN – TRANSPORT – ENVIRONMENT
Quality targets and indicators for sustainable mobility in cities and regions
3.
Quality targets, indicators, guidelines – the overall catalogue
3.1
Target areas and quality targets
A comprehensive overall catalogue of quality targets is more useful to local users than a
reduced “core set”, even if it is not possible to quantify all the targets by means of indicators
when the overall catalogue is applied. Descriptive indicators are also needed.
This was an important result of the model project – and one that was not originally expected.
The discussions in the participating cities focused on the objective of acquiring a comprehensive overall picture of progress on mobility and transport development by using a city-specific
quality target indicator system. No elements of sustainable transport planning were to be lost
in the evaluation process merely because they could not be measured or calculated. At the
same time the lack of quantifiability (frequently due to short-term difficulties in obtaining data
on individual indicators of special importance) was not to be used as an argument against
the earliest possible introduction of the quality targets and indicators drawn up.
By contrast with the initial hypothesis to “keep it simple”, the model project therefore worked
out an overall catalogue which also included non-quantified quality targets and indicators.
This catalogue serves as a basis for elaborating a city-specific quality target indicator
system.
The principal contents of the city-specific approaches in Erfurt, Görlitz, Herdecke and Lörrach
are largely identical. There are however some considerable differences in target
formulations, indicator definitions and the instructions for preparing them (measuring,
calculating, assigning scores4 or using verbal descriptions). Accordingly, the elements of the
overall catalogue need to be adapted to local conditions and requirements.
The target areas and quality targets of the overall catalogue are set out on the following
page.
4
Görlitz and Lörrach used a slightly different procedure than described in this User Guide. This was necessary
because environment-oriented audit procedures (European Energy Award in Görlitz, "Energiestadt" label in
Lörrach) were introduced in parallel with the model project. Both methods serve to introduce controlling and
quality assurance into the energy policy activities of local authorities, and include the topic of mobility in the
audit procedure. However, they work with the assignment of points by external auditors (for example, Lörrach
achieved 4.0 out of a possible 7.0 points for the target area "promoting walking").
-9-
PEOPLE – TOWN – TRANSPORT – ENVIRONMENT
Quality targets and indicators for sustainable mobility in cities and regions
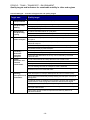
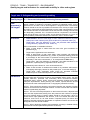
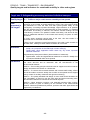
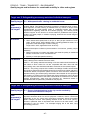
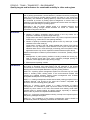
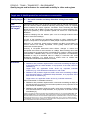
Overall catalogue – overview of target areas and quality targets
Target area
Quality target
1
Green choice of
transport mode
1.1 Maximum possible share of daily trips in “environmental network”
2
Safeguarding
and promoting
walking
2.1 Dense and adequately functioning footway network
Safeguarding
and promoting
cycling
3.1 Dense and safe network of cycle paths
Promotion of
public transport
4.1 Good availability of public transport in city and region in terms of time
and space
3
4
2.2 High quality of public spaces
2.3 Walking-friendly climate
3.2 Ensure that destinations in the city can be reached by bicycle
3.3 Cycling-friendly climate
4.2 Competitiveness of public transport compared with motorised
individual transport
4.3 Public transport stops easily accessible and attractively designed
4.4 Climate friendly to public transport
5
6
Safeguarding
necessary
motorised
individual
transport
5.1 Transport on major roads moves smoothly at low speeds
Health
protection and
resource
conservation
6.1 No health hazards and sleep disorders due to traffic noise
5.2 Widespread transport calming in residential areas
5.3 Ensure that destinations in the city can be reached by motorised
individual traffic
6.2 No health hazards due to traffic -induced air pollutants
6.3 No persons killed or seriously injured on the roads
6.4 Limit existing land use for transport to what is essential
6.5 Economical energy consumption and increased use of energy from
renewable sources in motorised traffic
7
Sustainable
planning,
participation and
information
7.1 Integrated municipal planning having regard to the close links between
urban development, transport development and environmental quality
7.2 Lay down environmentally friendly building and transport concepts in
zoning plans
7.3 Regular review of settlement and transport concepts and measures
implemented to achieve progress towards the defined action targets
7.4 Appropriate public participation in planning and decision making
7.5 Active support for and promotion of Local Agenda 21 activities by the
municipal administration
7.6 Provision of free access to important local authority data for all
interested residents
- 10 -
PEOPLE – TOWN – TRANSPORT – ENVIRONMENT
Quality targets and indicators for sustainable mobility in cities and regions
3.2
Indicators as assessment parameters
Indicators are necessary for assessing mobility and transport development, but require
differentiated use and in many cases additional interpretation. They serve to indicate states,
illustrate progress (and possibly stagnation and setbacks), and indicate qualities and deficits
on the road to sustainable development. They are not, however, a substitute for the
formulation of quality targets.
The indicators developed in the model project can be classified in three types, and these are
explained in more detail below:
• Quantifiable measures-oriented indicators,
• Quantifiable impact-oriented indicators, and
• Action-oriented and project-oriented indicators not suitable for quantification.
All three types of indicators are equally important in relation to the overall objective of
“sustainable mobility”:
Indicators relating to transport infrastructure and “transport climate” are geared to the
measures taken to achieve sustainable mobility and transport development, whereas impactoriented indicators are based on the formulated targets themselves.
Quantifiable
measures-oriented indicators
These indicators relate to infrastructure targets which are to be achieved by implementing
transport planning measures in the fields of pedestrian and bicycle transport, public transport
and motorised individual transport. Quantification is in percentages of a specified reference
parameter or of a target parameter laid down by planners and local politicians.
One example is the indicator “Share of main roads equipped with cycling facilities that meet a
certain standard”. The reference parameter here is the total length of main roads. The
standards required can be seen from the relevant city-specific transport planning guidelines.
At the same time, indicators of this type are useful tools for quality assurance in ongoing
planning, because they document the progress made in implementing individual programmes
of measures. Discussion and interpretation are facilitated by mapping the implementation
progress recorded. The spatial frame of reference shows up areas where deficits exist. Maps
also provide the planning administration with a helpful basis for planning further measures
and for discussions with local politicians and members of the public when it comes to
transport issues affecting specific parts of cities or towns or individual streets.
Individual indicators yield useful alarm figures indicating the extent to which adequate
account is taken of the transport impacts of concepts in the field of town planning (urban
redevelopment). The indicator “residents served”, for example, shows whether sufficient
population potential for economic operation exists in the catchment area of public transport
routes and stops. For this reason specific indicators are defined for cities with suburban line,
light railway or tram services in order to permit representation of their particular importance
for transport development. In Lörrach, for example, after creating three new Regio-S-Bahn
stops, the share of residents within 500 metres of the 7 stops inside the town boundaries has
risen to 46% – compared with the previous figure of 29%. In future, therefore, the S-Bahn will
perform not only a regional, but also an important urban function.
- 11 -
PEOPLE – TOWN – TRANSPORT – ENVIRONMENT
Quality targets and indicators for sustainable mobility in cities and regions
Quantifiable
impact-oriented indicators
These relate to pollution, affected parties, users or operating components of the transport
system. They describe situations that arise during the implementation of transport
development planning concepts and measures, whether such situations are intended and
desirable, or undesirable and in conflict with the set targets.
One example in the target area “Health” is the indicator “Share of residents permanently
affected by traffic noise in connection with threshold values for health hazards,
communication problems and sleep disorders”. The reference parameter is the number of
residents. The threshold values are based on scientific findings about cause-and-effect
relationships.
Assessment of progress towards targets is by means of comparisons over time or
comparisons with target figures. Here too, spatial mapping is helpful and to some extent
essential for discussion and interpretation of the results.
Not suitable for quantification
action-oriented and project-oriented indicators
These indicators are used largely for documentation purposes and for verbal assessment of
local authority activities to improve the transport climate. The focus here is on the means of
transport belonging to the “environmental network” (pedestrians, cyclists, public transport).
For example, there seems little point in defining an indicator which uses percentages to show
the implementation progress of individual projects such as “Installation of a pedestrian
control system in the city centre” or “Creation of a bicycle park at the station”. The measure is
either “completed” or “not (yet) completed”. Such lighthouse or beacon projects are
nevertheless important because they provide evidence of quality target orientation in
municipal planning, and even when financial resources are limited they represent milestones
on the way to sustainable mobility and transport development.
For this reason indicators of transport climate factors are also included in the overall
catalogue. In interim reviews of progress with the implementation of transport development
planning they should therefore be dealt with on a descriptive basis and illustrated by
examples, photographic documentation etc.
- 12 -
PEOPLE – TOWN – TRANSPORT – ENVIRONMENT
Quality targets and indicators for sustainable mobility in cities and regions
Cost and benefits of data collection
These have to be appraised separately for the three types of indicators:
• Experience in the model towns shows that quantifying transport infrastructure
indicators sometimes requires considerable initial input. This is particularly true in cases
where the existing infrastructure (e.g. cycle facilities, payment widths, city-centre car
parking space) has not been continuously recorded in the past. Once compiled, existing
data can however be updated without great effort. A geographical information system
(GIS) is very helpful here, and in the medium term it saves personnel, time and money.
At the same time, initial capture and updating serve the interests of quality assurance in
the field of transport planning.
• Impact-related indicators involve comparable costs for every update, since they always
have to be based on fresh surveys.
For example, the indicator for the target area “choice of means of transport” can only be
determined and updated on the basis of regularly repeated household surveys of the
residents’ mobility. As in the case of data on the target area “transport safety”, which is
mostly collected as standard in the context of police statistics on transport accidents, it
therefore seems likely that such surveys to determine indicators will only be conducted
where they are linked to obligatory municipal authority tasks – whether imposed by statute
or voluntary undertaking.
• Non-quantified indicators can usually be documented without special effort.
Moreover, scarce financial and human resources are an argument for – and not against –
starting to use indicator-based progress reviews of the kind proposed here, because
indicators considerably simplify controlling in the long term. By taking a phased approach to
the overall catalogue it is also possible to limit the cost of introducing a city-specific quality
target indicator system. This is done by initially quantifying only those indicators
− which facilitate controlling of transport development planning measures that are
particularly relevant or that are to due be implemented in the near future, or
− for which the necessary data is already available.
In addition, the remaining indicators should be used following the principle that “What is not
quantified should at least be documented and appraised verbally”. They can then be
quantified successively depending on the surveys and planning projects that can be used for
this purpose.
A “core set” of quality targets and indicators from the viewpoint of the model project is shown
in Section 3.5.
- 13 -
PEOPLE – TOWN – TRANSPORT – ENVIRONMENT
Quality targets and indicators for sustainable mobility in cities and regions
3.3
Transport planning guidelines
Local transport planning standards play a major role in city-specific definition of indicators.
Such standards are set out in transport planning guidelines.
For example, in Erfurt and Herdecke the indicator for the quality target “Dense and
adequately functioning footway network” is based on a differentiated pedestrian axis concept
with different standards for footway widths. Görlitz lays down a uniform minimum footway
width standard of 1.50 m. In Lörrach a standard width of at least 2.50 m is assumed, and
footway widths of 1.50-2.50 m are multiplied by 0.5 for inclusion in the assessment.
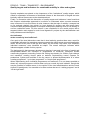
Thus transport planning guidelines describe in more detail the requirements and standards
that are to be applied in the implementation of the transport development plan.
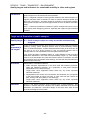
They also serve to transpose individual
targets to the level of measures, and
thereby also enable lay people (local
politicians and members of the public) to
judge the consistency of individual
measures with the formulated overall
concept and the underlying quality targets.
This makes transport development
planning more transparent and easier to
understand, and in decision processes on
individual measures it permits better
discussion in the necessary overall
context, i.e. above the level of individual
transport modes.
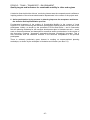
... e.g. guidelines for pedestrian transport:
GW 3 • The dimensions of footways depend on
their network function, adjacent uses and the
requirements arising from street life and
children playing. Footway widths should be not
less than 4.50 m in streets with an important
axis function for pedestrians, 3.50 m in streets
with other axis functions, or 2.50 m in other
streets. Paths intended solely for leisure and
recreational walking should be appropriate to
the expected volume of use and should be
designed to suit the natural situation.
The background to the fact that transport planning guidelines were included in the quality
target indicator catalogue as an additional element was largely the positive experience in
Lörrach. It was here that, in 1997/98, such guidelines for the various types of transport were
first included in the “Integrated Transport Concept” – the term used in Lörrach for the
transport development plan (LÖRRACH 1998).
Suggested wordings for transport planning guidelines can be found in the User Catalogue in
the Appendix.
- 14 -
PEOPLE – TOWN – TRANSPORT – ENVIRONMENT
Quality targets and indicators for sustainable mobility in cities and regions
3.4
The toolbox
In the ioproject, quality targets, indicators and guidelines were aggregated to form an overall
catalogue that provides a comprehensive “toolbox” for practical use in local authority
transport development planning and is designed to serve as a basis for more concrete cityspecific expressions.
Its compilation and the wording of the definitions was undertaken on the basis of the quality
targets and indicators developed in the model cities. In some cases, however, they were
merged, reclassified, or reworded on plausible grounds.
The overall catalogue can be found in the Appendix to this User Guide. Its structure is as
follows:
• The quality targets are grouped by target areas. Their meaning with regard to sustainable
urban and transport development is explained briefly under the overall objective of
“sustainable mobility”.
• Those indicators which proved useful in practice in the model project are assigned to the
quality target. In addition, the indicators are characterised in terms of the extent to which
they are to be quantifiable (measurable, calculable) or described verbally5 and of the
planning level (whole city, city centre or major individual measure) for which their use
appears meaningful.
In the case of quantifiable indicators, the target figure that can be associated with the term
“sustainability” is also specified.
• The toolbox also provides transport planning guidelines which are intended to make it
clear what principles, standards, measures and activities should be taken into account
when implementing the quality target. The list of suggestions makes no claim to be
exhaustive, even if it is based on important findings from a large number of transport
development plans (far in excess of the case studies in the model project).
There is room for discussing and deciding city-specific differentiation of the overall catalogue
with regard to:
− the scope and wording of the quality targets,
− the selection and city-specific focusing of the indicators to be used (including defining the
scope of quantification), and
− city-specific definition of standards in transport planning guidelines.
The extent to which the indicators in the catalogue are used in quantified form in the
individual case depends largely on the acquisition of the data and on the necessary human
and financial resources. When assessing the individual success of target achievement,
statements may have to be made with varying degrees of precision.
5
The classification does not by any means signify that meaningful quantification is not possible for these
indicators in individual cases. It may, for example, make sense to present the number of one-way streets or
the relevant length of streets in quantitative form in connection with an implementation programme for opening
one-way streets to oncoming cycle traffic. This is where city-specific focusing of the overall catalogue comes
in.
- 15 -
PEOPLE – TOWN – TRANSPORT – ENVIRONMENT
Quality targets and indicators for sustainable mobility in cities and regions
3.5
A “core set” for a start
In the model cities, special importance was attached to the quality targets and indicators
shown in the following table. They are therefore primarily suitable for quantification in the
context of starting up a city-specific procedure. In the overall catalogue (Appendix) the
indicators are indentified as “Lead indicators”.
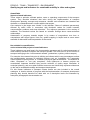
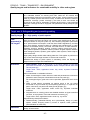
Extract from the overall catalogue: “Core set” of lead targets and lead indicators
Target area
Lead target
Lead indicator
Green choice of
transport mode
Maximum possible share
of daily trips in
“environmental network”
Share of daily trips by residents accounted for by
means of transport in environmental network,
including car passengers [%]
Safeguarding and
promoting walking
Dense and adequately
functioning footway
network
Share of total length of main roads accounted for
by main roads (basic urban network) with good
conditions for pedestrian traffic [%]
Assessment basis: City-specific standards in the guidelines
Safeguarding and
promoting cycling
High quality of public
spaces
Pedestrian areas, traffic-calmed areas and carfree paths as a proportion of the total length of the
city-centre network of roads and footways [%]
Dense and safe network
of cycle paths
Main roads (basic urban network) with adequately
dimensioned and designed cycle traffic facilities
or speed limited to 30 km/h, as a proportion of
total length of main roads [%]
Assessment basis: City-specific standards in the guidelines on
the basis of regulations in force such as the Road Traffic
Regulations Ordinance (StVO) and Recommendations for
Cycle Traffic Facilities (ERA 95)
Promotion of
public transport
Good availability of public
transport in city and
region in terms of time
and space
Residents within 300 m of bus stops and/or 500 m
from S-Bahn stations, light railway or tram stops,
as a proportion of the total number of residents
[%]
Schedules: City-specific standards in the guidelines and/or in
public transport concept / local transport plan
Safeguarding
necessary
motorised
individual transport
Traffic on major roads
moves smoothly at low
speeds
Main roads (basic urban network) with a speed
limit of 30 km/h, as a proportion of the total length
of main roads [%]
Health protection
and resource
conservation
No health hazards and
sleep disorders arising
from traffic noise
Residents with a permanent traffic noise level of
more than 65 dB(A) during the day and more than
55 dB(A) at night as the threshold value for health
hazards, as a proportion of the total number of
residents [%]
No health hazards arising
from traffic-induced air
pollutants
Residents with a critical suspended particulate
matter level (PM10), as a proportion of the total
number of residents [%]
Assessment basis: Daily mean limit value for PM10
No persons killed or
seriously injured on the
roads
Annual numbers of persons killed or seriously
injured in road traffic within the city boundaries,
per 10,000 residents
- 16 -
PEOPLE – TOWN – TRANSPORT – ENVIRONMENT
Quality targets and indicators for sustainable mobility in cities and regions
Explanation: Cost and
importance of lead indicators
There are differences here. The indicators chosen mostly relate to transport infrastructure,
because these are easier to update than impact-oriented indicators. They also provide an
important basis for everyday transport planning administration, which means the cost of
acquisition is justified for more than one reason.
In the case of the target areas “Green choice of transport mode” and “Health protection and
resource conservation”, however, there would seem to be no alternative to impact-oriented
lead indicators, as the measurable impacts of transport on health and the environment play a
decisive role here:
• In the model project it became clear that in terms of information value, simple indicators,
i.e. indicators that can be determined at low cost, are no substitute for data on modal
choice. From a transport planning point of view this indicator is best suited to showing up
clearly the impacts of planning concepts and measures on urban mobility.
However, it calls for expensive representative surveys of the kind conducted using the SrV
design6 in Erfurt (since 1972) and Görlitz (for the first time in 2003). The data obtained can
also be used for a wide range of other purposes, especially with regard to the aspects:
public transport marketing, transport marketing and transport climate. In the medium and
long term, cities and municipalities would be very well advised to budget for these
associated recurring costs.
• As things stand at present, the need to determine traffic-induced pollution in the form of
noise and air pollution (PM10) inevitably arises in many cities from the current
environmental legislation. The expense nevertheless seems justified, particularly in
connection with the municipal task of health protection for the general public. Instead of
costly emission calculations it is also possible to use simplified approaches to
determination (cf. for example MUNR BBG 1998 and MLUR BBG 2001).
• Traffic accident data is usually registered by the police authorities on a continuous basis
and is therefore more or less standard. Data acquisition for this indicator is
correspondingly simple.
6
SrV = a system for representative transport surveys; sociological survey of public mobility for transport
purposes, conducted in East German cities at 4 to 5-year intervals from 1972 to 2003.
- 17 -
PEOPLE – TOWN – TRANSPORT – ENVIRONMENT
Quality targets and indicators for sustainable mobility in cities and regions
4.
Information for users
4.1
Creating the city-specific version
Quality targets and indicators cannot be introduced overnight. The necessary discussions
and weighing-up processes at the levels of administration, Local Agenda 21 and local politics
take time. In the participating towns, for example, it took more than 2½ years in the model
project from the start of local work to a binding political decision.
The kick-off process is much easier if it relates to concrete measures. There are thus two
obvious basic approaches:
A Introduction in the context of an interdepartmental
discussion at administrative level
City-specific quality targets and indicators offer a helpful set of tools for controlling and
quality assurance in spatial planning, especially in connection with the local authority
tasks of urban development, transport development, noise abatement and air quality
control.
In this case the process objectives are first of all internal inter-departmental coordination
of targets, indicators and planning strategies and guidelines (which in some cases already
exist and are used within the administration), and subsequently internal use of the cityspecific quality indicator system jointly drawn up in this way. A political decision is not
necessary for this purpose, but may be helpful.
The Local Agenda 21 will not be brought into the discussions until it is necessary to deal
with concrete planning tasks and possible to discuss quality targets in the context of
concepts and measures. Obligatory introduction of targets and indicators takes place on a
project related basis.
B Introduction in the context of creating
or updating a transport development plan
The advantage: This permits direct presentation and discussion of the connections
between quality targets and transport planning concepts and measures. Indicators can be
determined on a targeted basis in the course of analyses of the present state of the
transport system and mobility structure. Transport planning guidelines play a special role
in the discussion of measures. Integration of the Local Agenda 21 can take place in a
participation procedure accompanying the planning process. The decision to implement
the transport development plan makes quality targets, transport planning guidelines and
evaluation using indicators into a required element of the planning complex.
In many towns and cities the planning and decision processes in connection with “urban
redevelopment” provide a comparable opportunity.
- 18 -
PEOPLE – TOWN – TRANSPORT – ENVIRONMENT
Quality targets and indicators for sustainable mobility in cities and regions
4.2
Framework conditions having an influence
Differences in framework conditions may have a decisive influence on the course of
discussions and work on content. In the model project these related to:
− Structural peculiarities such as declining population, incorporation of municipalities, or
borderline location in transboundary planning projects,
− Special process-related features, especially status and dynamics of transport
development planning and the Local Agenda 21 and city-specific manifestations of the
local “evaluation culture” (attitude to targets and indicators),
− Influence of general developments such as increasing shortage of resources in the
municipal budget or the introduction of new rules and standards having an impact on
defined indicators.
General and city-specific framework conditions for the introduction and use of quality targets
and indicators in the model project.
The findings of the model project permit a number of conclusions in this respect:
• Quality targets and indicators must not be regarded as a static system. Structural change
and changing requirements (e.g. due to legislation and rules) call for periodic updates and
modifications.
• Comparisons over time may sometimes call for broader interpretation. This applies
particularly to indicators relating to the reference parameter “affected parties”.
Demographic development and small-scale phenomena (e.g. rapid increase in number of
unoccupied homes) may appear to have a favourable impact on such indicators even
though there is no real improvement in the local pollution situation.
• Scarcity of resources and current tasks in transport development planning have a major
influence on data acquisition. The cost of such acquisition is easiest to justify for indicators
where the data can also be used for other administrative purposes. This leads to the
conclusion that a city-specific quality target indicator system should not be confined to
indicators that are quantifiable in the short term, but should pursue a “growing” concept.
- 19 -
PEOPLE – TOWN – TRANSPORT – ENVIRONMENT
Quality targets and indicators for sustainable mobility in cities and regions
4.3
FAQ – Frequently asked questions
The following questions occurred frequently in the model project – including the presentation
of results to a broader (specialist) public – and are therefore touched on again here.
City-specific quality targets:
Isn’t it a question of “keep it simple”?
The course of the discussions in the administrative working groups that accompanied the
model project made it clear that an assessment of the qualities of the individual urban
transport system and of the ongoing implementation tasks of transport development planning
is only possible with a broad set of quality targets and indicators.
For example, the transport-oriented development, design and protection of the city centre
played a special role in all the participating towns. Important aspects concern the
accessibility of the city centre for motorised individual transport, public transport and cycle
traffic, the availability of parking space, and pedestrian-friendly design of city-centre streets
and squares. This gave rise to the demand that quality targets (and indicators) be drawn up
specifically for the city centre as well as for the city as a whole.
It was also discovered that the original catalogue from the first phase of the project lacked
quality targets for city-friendly management of motorised individual transport. This concerned
the aspect of traffic quality, for example (“Traffic on major roads moves smoothly at slow
speeds”).
The participating Local Agenda 21 groups also demanded quality targets and indicators
going beyond the initial catalogue from the first phase of the project. Additional aspects
raised at the level of quality targets, for example, were freedom from obstacles to
pedestrians, traffic conditions in motorised individual transport (flow of traffic, parking), and
the transport climate7. The formulation of additional targets for these aspects was considered
an urgent necessity.
It was unanimously felt that a well-founded and informative overall picture of the mobility and
transport development situation required a differentiated concept of quality targets. At the
same time, however, the “core set” of guidelines and indicators described in Section 3.5 was
identified. This is of special importance for transport development planning and is therefore
particularly suitable for quantification.
Does the Local Agenda 21 need
its own, easily determined indicators?
The participants in the Local Agenda 21 groups were not interested in “simple” indicators that
they could determine themselves.8 They came to the conclusion that only differentiated
indicators had the necessary information value and catered adequately for the complex
relationships between mobility, transport and the environment.
At the same time, the determination and updating of indicators was regarded as a necessary
duty of the municipal administration to provide a sound basis for transport policy decisions.
7
The term "transport climate" is coming to play an increasingly important role in transport development
planning. At the behavioural and experience level, this means the extent to which pedestrians, cyclists and
public transport passengers in a city can feel that they are taken seriously as road users and are treated as
having equal rights to motorists. At the planning level this corresponds to the "soft" measures that are to be
implemented to promote these means of transport in support of constructional, operational and traffic control
measures. "Soft" measures are primarily concerned with information, education, advice, publicity and
motivation. The aim is to achieve long-term changes that influence individual mobility and transport behaviour
in the direction of sustainable mobility through understanding and insight.
8
In the first phase of the project a distinction was still made between such simple indicators (known there as
"S-indicators") and differentiated indicators ("D-indicators"); cf. UBA 2002.
- 20 -
PEOPLE – TOWN – TRANSPORT – ENVIRONMENT
Quality targets and indicators for sustainable mobility in cities and regions
Special emphasis was placed on the importance of the “institutional” quality targets, which
called for systematic involvement of interested citizens in the discussion of targets and also
basically required free access to the data determined.
Finally, in connection with the discussion of quality targets and indicators it was found that
the complex relationships appeared to be easier to understand when concrete measures
were concerned. It has to be borne in mind, however, that the topic of mobility / transport has
so far enjoyed relatively low priority in Local Agenda 21 projects and has largely been
concerned with peripheral aspects of transport development planning such as car sharing or
car-free residential areas. For this reason it was considered in the model project that a
targeted initiative and support for such Local Agenda 21 projects by the administration and
local politicians would be helpful.
Are indicators
at the overall city level sufficient?
One result of the local discussions was that in local authority practice there was a need for
quantifiable indicators for assessing progress towards the quality target at several application
levels. As well as the level of the city as a whole, the two levels “city centre” and “important
individual measures” were identified as helpful. The overall catalogue indicates which
indicators appear suitable for this purpose.
The background is that transport development planning is pursued in the form of spatial and
transportation-related sub concepts or programmes of measures. Examples include
constructing bypasses; extending routes and raising stop density for S-Bahn, light railways
and tramways; creating bicycle parks at stations; implementing control systems for
pedestrians, cyclists and motorists in the city centre; or phased implementation of a “zebra
crossing programme”, “cycle lane programme” or “bicycle park programme”.
When implementing such individual programmes and measures, it is not always possible to
detect any relevant progress or effects when using an overall city-level indicator, though this
may be possible for smaller areas. In the opinion of the local administrations and the Local
Agenda 21 participants, it is essential to be able to show that one is “making progress” and is
“on the right track”.
- 21 -
PEOPLE – TOWN – TRANSPORT – ENVIRONMENT
Quality targets and indicators for sustainable mobility in cities and regions
4.4
Interim review – Getting down to it
Interim reviews can serve two purposes: on the one hand, in the sense of an “Environmental
Report on Mobility / Transport”, they can be used to evaluate transport development planning
concepts and measures that have been implemented, and on the other they may serve to
update transport planning action programmes or programmes of measures. The overall
catalogue of quality targets, indicators and transport planning guidelines provides the
necessary basis for this. It is helpful if quality targets and assessment procedures have
previously been defined as obligatory elements of transport development planning,
preferably by a municipal policy decision. It is suggested that interim reviews be carried out
at five-year intervals, in line with the term of office of the local council. Such activities also
need political backing.
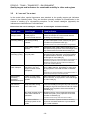
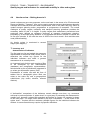
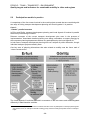
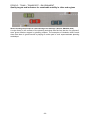
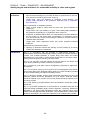
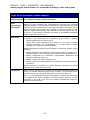
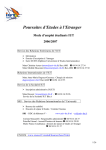
An interim review is conducted in several
stages (see diagram):
1
Inventory and
determination of indicators
The first step is to list and explain the measures
implemented in the period under review, and to
determine the current key figures for the
individual indicators and make a general
assessment in an overall picture.
An important basis for this work consists of files
to be developed by the administration
(database) and cartographic representations,
which should as far as possible be integrated in
an urban geo-information system (GIS).
Presentation of results can take the form of
tabular lists or cartographic plans. Both can
relate to the entire city and to geographical
subdivisions (city centre, districts, external
districts).
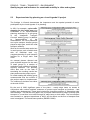
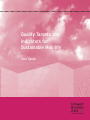
A “before/after” comparison of the indicators reveals changes over time, e.g. successes
achieved in previous periods. A “spider chart” is a good way of presenting the assessment in
graphic form, because it shows both potentials and deficits in context. An example is shown
on the next page. The target vision defined by the term “sustainable” – at the centre of the
spider chart – requires that the maximum possible figures for the individual indicators be
defined. In some cases this may require city-specific definitions.
- 22 -
PEOPLE – TOWN – TRANSPORT – ENVIRONMENT
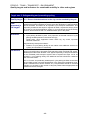
Quality targets and indicators for sustainable mobility in cities and regions
Example of Erfurt: Quantified indicators in a spider chart, here a before-and-after comparison
for 1995 and 2002 – The closer the individual target value is to the centre, the better the result.
2
Action programme
On the basis of the first step, the second step is to develop, discuss and lay down a binding
action programme (programme of measures) for the next 5 years. The following aspects
should always form part of the action plan:
−
−
−
−
−
−
Description of measures, with explanatory plans and documents,
Definition of implementation period,
Prioritisation,
Costs (non-recurring / recurring / ongoing),
Administrative responsibility for implementation of the measure,
Cooperating administrative departments, and partners outside the administration.
A tabular summary of this information in a “To Do list” has proved helpful in practice,
because it provides a good reference anchor for implementation.
3
Assessment and definition of action targets
The indicators make it possible to determine in advance what contribution the individual
measures of the action programme will make to achieving the targets. This allows one to set
concrete action targets for the next five years. Setting priorities calls for feedback between
steps 2 and 3.
4
Decision and publication
The political decision in favour of the action programme creates the necessary binding
character for the implementation of the measures and hence also for the action targets set.
With regard to the process-oriented quality targets – target area 7 in the overall catalogue –
publication of the interim review in the form of a brochure makes sense and also places all
those concerned under pressure to act.
- 23 -
PEOPLE – TOWN – TRANSPORT – ENVIRONMENT
Quality targets and indicators for sustainable mobility in cities and regions
5.
5.1
Transport development planning and Local Agenda 21
Prospects of close connections
A promising process of integration of the Local Agenda 21 in municipal transport
development planning requires
− a sound reason,
− a clearly defined substantive task with realistic prospects for implementation of measures
and actions,
− preparatory work on content and ongoing technical support for the process by the relevant
administrative departments,
− involvement of local stakeholders (politicians, administrative departments, associations,
pressure groups etc.) of relevance to the topic of mobility / transport,
− binding arrangements regarding the organisation and timing of the process framework,
− and above all, personal interest and commitment on the part of all concerned.
The following sections set out a number of process design recommendations that promise
success. These have emerged from the findings of the model project and explain the above
aspects in more detail.
1 There needs to be a sound reason for embarking on discussion of quality targets
and indicators for the action field “Mobility / Transport”.
Dealing with quality targets and indicators in the Local Agenda 21 is problematical where
there is no underlying political decision or concrete reference to transport planning
measures. As shown by the findings in Herdecke and Lörrach, a sound reason exists in
particular where quality targets are dealt with in connection with the preparation of a
transport development plan.
Without any direct relation to planning or measures, any discussion of targets (indicators,
guidelines) seems arbitrary for those concerned: At the level of municipal administration and
politics there are no binding requirements for dealing with any material produced at Local
Agenda 21 level, and the participants in the Local Agenda 21 working groups cannot see
clearly how their commitment could have any practical impact on municipal planning and
politics. This tends to affect their personal motivation to participate in this and follow-up
projects in the long term.
2 Local Agenda 21 working groups need terms of reference with clearly defined
content. At the same time administration and politicians must offer realistic
perspectives for the implementation of measures and actions.
For participants in Local Agenda 21 working groups, quality targets and indicators are
primarily of importance in the context of measures, as this is in line with their personal
interests and experience.
- 24 -
PEOPLE – TOWN – TRANSPORT – ENVIRONMENT
Quality targets and indicators for sustainable mobility in cities and regions
In the model project, familiarisation with the subject of “Mobility / Transport” worked most
successfully where there were concrete links with projects and measures. In Görlitz this was
the subject of mobility in the city centre, which had been suggested by the public as a topic
for discussion. In Lörrach the concern was to further specify and accompany the
implementation of modules of the integrated transport concept, in Herdecke it was to draw up
the transport development plan.
The individual working groups worked largely on concrete problems that were of special
importance in the municipal context: city-centre mobility (all forms of transportation); cycle
facilities on main roads; transport calming in the city centre; quality of services and access in
public transport; road safety. The subsequent feedback from the participants revealed a
strong personal connection with the topic dealt with, which ultimately determined their
interest, motivation and stamina.
It was not until they discussed the measures that the members of the public understood and
appreciated the significance of many targets and indicators.9
Local Agenda 21 projects end with specific suggestions for measures or actions. This must
be taken into account right from the start. The people involved in the process need clear
information about the form in which the material they have prepared is to be included in
further planning and about the framework conditions (favourable and unfavourable) for
possible implementation. This includes the question of the financial resources that are likely
to be available for implementation.
In this context the approach of testing individual parts of concepts and measures by means
of “transport experiments” (on the basis of Section 45 of the Road Traffic Regulations
Ordinance – StVO) in an inexpensive, controlled and revisable form may be regarded as a
typical feature of transport planning based on a Local Agenda 21. In this approach the
measures implemented are not only the focus of public attention, but the discussion and
assessment of identified effects of measures may also be made the subject of Local
Agenda 21 work. The resulting discussion process offers the participants and interested
parties joint learning experiences and helps to avoid unsound, over-emotional discussions.
Once recruited for the topic of sustainable mobility, participants are also prepared to play an
active (and unpaid) role in work on other issues and problems. It should however be made
clear from the start whether and in what form the administration wishes this. The two forms of
a permanent working group on the specific topic or a working group convened periodically for
individual issues seem equally well suited for this purpose. In Görlitz, for example,
agreement has been reached that the newly constituted Local Agenda 21 working group on
mobility for urban transport planning is in future to play the role of an informal “citizens’
advisory council”.
3 Preliminary work on content and ongoing technical support for the process by
the administrative departments responsible for transport, town planning and the
environment are absolutely essential and make it easier for Local Agenda 21
working groups to address the complex topic of sustainable mobility.
One basic demand of the Local Agenda 21 working groups was that the administration
should play a supporting role in the project work and should continuously participate or be
available as a point of contact. This applies in particular to the preparation of indicators, the
provision of necessary data, basic planning material and additional information, and the
communication and safeguarding of the necessary technical knowledge.
9
This, as transport development planning practice shows, also applies in connection with transport policy
discussions and decision processes. The agreement on initially formulated planning targets is soon put in
perspective when it comes to the question of what measures are necessary to achieve the targets and
whether they meet with public acceptance and majority approval and can thus be implemented.
- 25 -
PEOPLE – TOWN – TRANSPORT – ENVIRONMENT
Quality targets and indicators for sustainable mobility in cities and regions
Preparatory work on formulating a first approach to city-specific quality targets and indicators
is also absolutely essential in order to permit structured discussions in the Local Agenda 21
working groups. There would seem to be no alternative to establishing an internal
administrative working group for this purpose that cuts across technical disciplines and
responsibilities.
In the administration it is necessary to weigh up carefully the requirements mentioned above
and the related costs at the beginning of newly initiated participation processes and
safeguard them by allocating human and, where appropriate, financial resources. Otherwise
there seems to be little point in such an initiative.
One must not underestimate the learning effect for both sides – administration and public –
that results from intensive cooperation, and which can make a major contribution to fostering
acceptance of transport planning measures. As an additional positive side effect it was found
in the model project that the preliminary work by the administration had a marked stimulating
effect on inter-disciplinary inter-departmental cooperation and was also helpful in day-to-day
administrative work.
Thus the Local Agenda 21 processes ultimately encouraged an integrated planning
approach, which was at the same time one of the quality targets formulated for the topic of
“Sustainable Mobility” (see User Catalogue, Target Area No. 7).
4 All local stakeholders should be involved in Local Agenda 21 processes in the field
of mobility / transport. Participation by the local political parties plays a special role
in strengthening links between Local Agenda 21 and municipal planning, and would
seem to be indispensable for the acceptance and effectiveness of the activities.
Local Agenda 21 processes should be “a matter for the top”.
From a transport policy point of view, the greatest response to the Local Agenda 21 activities
was encountered in Lörrach. This is to a large extent due to the organisational structure that
has been in place there for some time now: As well as interested groups of citizens, an active
role in the Local Agenda 21 working group “Integrated Transport Concept” is also played by
politicians, the relevant administrative departments, and associations and institutions of local
importance (including the local press). Another strengthening factor is the fact that the
working group has been institutionalised as a policy advice body at municipal decision level,
and that the overall process is actively supported and furthered by the top political and
administrative levels.
With the decision that all future planning projects at municipal level would be accompanied
by the Local Agenda 21, Herdecke took a similar binding step in the direction of viable longterm structure.
5 Binding arrangements regarding the organisation and timing of the framework are a
basic requirement for successful implementation of Local Agenda 21 projects.
Like all project-related tasks, Local Agenda 21 projects, if they are to be successful, require
clear work structures agreed between all those taking part. In Erfurt and Görlitz, where the
topic of mobility was to be addressed in the Local Agenda 21 for the first time, it proved
particularly helpful that the project duration and the time to be spent on the individual
sessions were limited from the start. Sessions of about 2-3 hours at approximately monthly
intervals and a project duration of 6 to 12 months were evidently something the participants
could well manage and afford.10 In Görlitz the date of the public presentation of working
results, which was specified at the start, provided additional motivation.
10
It must be remembered here that in the great majority of cases this is a matter of unpaid voluntary work by
committed private individuals. One can hardly expect such individuals to display long-term commitment to LA
21 activities.
- 26 -
PEOPLE – TOWN – TRANSPORT – ENVIRONMENT
Quality targets and indicators for sustainable mobility in cities and regions
A decisive factor behind the citizens’ continuing interest was the cooperative and confidenceinspiring attitude of the relevant administrative departments in the course of the project work.
6 Active participation by lay persons in planning improves its acceptance and hence
the decision and implementation process.
Fundamental treatment of the subject of Sustainable Mobility in the context of Local
Agenda 21 is time-consuming and therefore presupposes special interest on the part of the
participants. Initially, as shown by the processes in Erfurt and Görlitz – and in connection
with the planning workshop for the transport development plan in Herdecke as well –, smallscale or sectoral problems and demands for measures tend to predominate. In the course of
the discussion, however, “integrated” approaches become increasingly important. This is
also connected with the observed increase in the technical competence of the process
participants.
There is evidently particularly great interest in working on expert-assisted planning
workshops, as shown by the examples in Herdecke and Lörrach (see also 5.3).
- 27 -
PEOPLE – TOWN – TRANSPORT – ENVIRONMENT
Quality targets and indicators for sustainable mobility in cities and regions
5.2
Participation models in practice
A comparison of the four towns involved in the model project reveals that one can distinguish
two ways of linking transport development planning and Local Agenda 21 in practice:
Case 1:
“Classic” parallel structure
In Erfurt and Görlitz, transport development planning and Local Agenda 21 existed in parallel
without any interlocking of content.
Relevant concepts of the current transport development plan were in the process of
implementation. Associated detailed planning was being undertaken as expert planning by
the competent planning departments without any participation by the Local Agenda 21.11
In both towns, transport development planning was not a subject of public discussion, though
individual transport projects certainly were.
One key area of planning discussions that also related to mobility was the future task of
“urban reconstruction”.
The Local Agenda 21 activities differed in momentum in the two towns and were integrated
differently in administrative activities.
11
For the sake of completeness it must be mentioned that other forms of participation on transport planning also
exist in both towns, for example in thematic working groups, citizens' meetings and public events on transport
topics.
- 28 -
PEOPLE – TOWN – TRANSPORT – ENVIRONMENT
Quality targets and indicators for sustainable mobility in cities and regions
In Erfurt one could speak of a “cooperative parallel structure” because important structures
of the Local Agenda 21 were developed in a broadly based participation approach for
devising an integrated urban development concept, and this involved the relevant sectoral
departments (especially town planning, transport planning and environment / nature
conservation) in parallel working structures. From an administrative point of view the Town
Planning Department has since been responsible for promoting and supporting the Local
Agenda 21.
A series of noteworthy “lighthouse projects” have been developed and implemented in Erfurt
since 1998. Some of these have been enabled to “stand on their own two feet” under the
auspices of a non-profit association (BürgerWerkStadtErfurt e.V.). Today the Town Planning
Department can call on a considerable “pool” of citizens interested in working on relevant
topics. The great variety of topics and occasions for Local Agenda 21 discussions results in
close cooperation, which is also supported by the other sectoral planning departments.
The prevailing practice in Görlitz was more of an “initiative parallel structure”. What this
means is that the ongoing activities were largely determined by the initiative of the Local
Agenda 21 coordination unit within the Environmental Department. This cooperates on a
case-by-case basis with other relevant administrative departments. Stand-alone projects by
the Local Agenda 21 are the exception.
In both towns, an interface between transport development planning and Local Agenda 21 on
mobility was only created in the context of the model project, and is thus “fresh”: in Erfurt with
the round table on “Sustainable Mobility”, and in Görlitz in the working group on “Mobility in
the City Centre”.
The results of the new working groups and the positive response have opened up the
opportunity for continuing the work from a thematic and human resources point of view, and
the efforts to forge closer links between transport development planning (administration) and
Local Agenda 21 (citizens) thus appear to have been successful. The extent to which this
also represents a step in the direction of an integrated structure (see Case 2) remains to be
seen.
Case 2:
Integrated structure
In Lörrach and Herdecke there is a close structural connection between transport
development planning and Local Agenda 21. Although its degree of development differs in
the two towns, this may be described as an integrated discussion and planning culture.
In Herdecke the work on the transport development plan prompted closer links with the
Local Agenda 21 (see 2.4). However, viable long-term cooperation structures are still under
development, so the present state of integration cannot yet be characterised as fully
developed. This also applies to the circle of participants, which does not yet include all
relevant local stakeholders and forces.
- 29 -
PEOPLE – TOWN – TRANSPORT – ENVIRONMENT
Quality targets and indicators for sustainable mobility in cities and regions
Compared with the other three towns, the integration of transport development planning
(referred to here as “Integrated Transport Concept”, or ITC for short) and Local Agenda 21
which is practised in Lörrach appears to be well developed and basically viable in the long
term. Key features of the structure practised in Lörrach since the end of 1997 are:
− Bundling of all conceptually important transport planning topics and tasks in the Local
Agenda 21 working group “Integrated Transport Concept”,
− Continuous participation in this working group by all locally relevant stakeholders in the
field of mobility, including the local press and the political parties on the town council,
− Prominent representatives of the administration on the working group in the form of the
heads of the two sectors involved in spatial planning (Urban Development, Town Planning
and Environment sector, and Transport and Safety sector), and the First Mayor as chair
and moderator of the working group meetings,
− A sound foundation for the content of the work right from the start through joint
preparation of a situation review on the state of transport development in Lörrach
(LÖRRACH 1998), including analysis of strengths and weaknesses and identification of
action modules based on a list of priorities for further specification and implementation of
measures,
− Intensive participation by the working group in drawing up substantive concepts, partly in
workshop form or going beyond this in the form of “expert-assisted lay planning” (see
below),
− Institutionalisation of the working group through its firm establishment as a policy advice
commission.
- 30 -
PEOPLE – TOWN – TRANSPORT – ENVIRONMENT
Quality targets and indicators for sustainable mobility in cities and regions
These characteristics play a large part in the success to date of the chosen approach to
integrating transport development planning and Local Agenda 21 in Lörrach. They can
therefore be recommended for other towns and municipalities where a comparable
integrated approach is to be developed.
Now that the implementation of major modules of the Integrated Transport Concept of 1998
is largely complete, it is planned to conduct a new interim review in Lörrach. Its purpose is to
evaluate the process to date and to update the transport development concept. It will also be
concerned with the binding introduction of quantified quality targets and indicators on the
basis of the integration approach developed in the model project.
- 31 -
PEOPLE – TOWN – TRANSPORT – ENVIRONMENT
Quality targets and indicators for sustainable mobility in cities and regions
5.3
Expert-assisted lay planning as a Local Agenda 21 project
The findings in Lörrach demonstrate the importance and the special potential of active
participation by the Local Agenda 21 in planning.
In 2001, for example, cycle traffic
planning for the entire town was
undertaken in an expert-assisted
planning workshop by a sub-group
of
the
“Integrated
Transport
Concept” working group. In addition
to
representatives
of
the
administration, the local pedestrian
and cycle transport interest groups
played a major part, as did the road
transport authority.
Work on the content was carried out
in small groups, each of which dealt
with an individual task, e.g.
complete planning of cycle transport
facilities for a single main road
route.
An external planner directed and
gave technical support for the work
in small groups in a number of
workshops and additional individual
advisory sessions. The planning
office also took on the task of
translating the working results into
plans and wrote the project report.
At a final meeting the working group
recommended that the content of
the project report be implemented.
The unanimous decision was taken
at the end of 2001.
By the end of 2003 significant parts of the plans – mostly edge lanes on streets in
conjunction with various localised measures to protect cycle transport at junctions – had
already been implemented. These also included the innovative solution of “alternating edge
lane markings”. This serves to fill gaps in the cycle path network and to protect (school) cycle
transport in a road that is not wide enough for edge lanes on both sides. The new element
was created in a transport experiment in 2003, and its effects on the flow of transport flow
were investigated. The results were positive (ENGELS 2003).
- 32 -
PEOPLE – TOWN – TRANSPORT – ENVIRONMENT
Quality targets and indicators for sustainable mobility in cities and regions
Sketch showing the principle of “alternate edge lane markings” (Source: ENGELS 2003)
A major factor in the success of the planning workshop was the fact that the “lay planners”
were given effective support by planning experts. The examples of Herdecke and Lörrach
show that there is great interest in playing an active part in such expert-assisted planning
workshops.
- 33 -
PEOPLE – TOWN – TRANSPORT – ENVIRONMENT
Quality targets and indicators for sustainable mobility in cities and regions
6.
Bibliography and list of sources
BAST 1998
Bundesanstalt für Straßenwesen (Ed.): Innenstadtverkehr und
Einzelhandel, Bericht V 52, Bergisch Gladbach 1998.
BBR 2003
Bundesamt für Bauwesen und Raumordnung (Ed.): Zukunft findet
Stadt, Strategien und Indikatoren nachhaltiger Stadtentwicklung,
Bericht zum ExWoSt-Forschungsfeld “Städte der Zukunft”,
Werkstatt: Praxis Nr. 6, Bonn 2003.
BSV 2004
BSV Büro für Stadt- und Verkehrsplanung Dr.-Ing. Reinhold Baier
GmbH: Modellvorhaben Mensch – Stadt – Verkehr – Umwelt.
Kommunale Agenda 21 – Nachhaltige Mobilität. Teilvorhaben 2:
Umsetzung in den Modellstädten Erfurt, Görlitz und Lörrach,
Abschlussbericht 10/2004.
BSV / VDR 2004
BSV Büro für Stadt- und Verkehrsplanung Dr.-Ing. Reinhold Baier
GmbH, VDR Verkehrsmanagement Dr. Ruske: Nachhaltiger
Verkehrsentwicklungsplan
Herdecke,
Berichte
und
Arbeitsmaterialien aus dem laufenden Arbeitsprozess, Aachen
2004.
ENGELS 2003
Engels, Andrea: Wirkungsanalyse “alternierender Schutzstreifen”
am Beispiel der Mühlestraße in Lörrach, Diplomarbeit an der
Fachhochschule Aachen, Studiengang Bauingenieurwesen /
Verkehrswesen, Aachen 2003.
FH ERFURT 2001
Fachhochschule
Erfurt,
Fachbereich
Verkehrsund
Transportwesen, Fachgebiet Verkehrspolitik und Raumplanung
(Ed.): Prozessindikatoren für die Lokale Agenda 21, Erfurt 2001.
MLUR BBG 2001
Ministerium für Landwirtschaft, Umweltschutz und Raumordnung
Brandenburg
(Ed.):
Verfahren
zur
Wirkungsabschätzung
verkehrsbeeinflussender Maßnahmen auf die städtische Umwelt,
Handbuch für Anwender, Potsdam 2001.
MUNLV NRW 2004
Ministerium für Umwelt und Naturschutz, Landwirtschaft und
Verbraucherschutz
Nordrhein-Westfalen
(Ed.): Umwelt –
Gesundheit – Verkehr, Kommunikationsinhalte und -formen zum
Wirkungszusammenhang von Umwelt, Gesundheit und Verkehr,
Studie im Aktionsprogramm Umwelt und Gesundheit NRW (PDF:
www.apug.nrw.de), Düsseldorf 2004.
MUNR BBG 1998
Ministerium für Umwelt, Naturschutz und Raumordnung
Brandenburg (Ed.): Lärmminderungsplanung im Land Brandenburg
1993-1998, brochure, Potsdam 1998.
LÖRRACH 1998
Stadt Lörrach (Ed.): Integrierte Verkehrs-Konzeption Lörrach,
Zwischenbilanz. brochure, Lörrach 1998.
ORTSCHEID / WENDE 2004
Ortscheid / Wende: Sind 3 dB(A) wahrnehmbar? – Eine
Richtigstellung. In: Zeitschrift für Lärmbekämpfung 3/2004.
UBA 2002
Umweltbundesamt (Ed.): Kommunale Agenda 21 – Ziele und
Indikatoren einer nachhaltigen Mobilität, Berichte 8/02, Erich
Schmidt Verlag: Berlin 2002. (Bearbeitung: BPI-Consult GmbH,
Berlin / Planungsbüro Richter-Richard, Aachen.)
- 34 -
PEOPLE – TOWN – TRANSPORT – ENVIRONMENT
Quality targets and indicators for sustainable mobility in cities and regions
Appendix
Quality targets, indicators and transport planning guidelines for
sustainable transport development User Catalogue
Target area 1: Green choice of transport mode
Quality target 1.1 Maximum possible share of daily trips in “environmental
network”
How
important is
the target?
From an environmental point of view, motorised individual transport is the most
problematical way people meet their daily mobility needs – in this case
expressed as the average number of trips per resident per day:
• Pedestrians and cyclists, in fact non-motorised means of transport in
general, do not produce any harmful emissions and have the lowest relative
land take; moreover, being mobile “under one’s own steam” is healthy and
promotes social contact. It is therefore particularly desirable from an
ecological and psycho-social point of view to use these “local mobility means
of transport” for a large proportion of daily trips.
• In the motorised transport sector, using public transport is the most
environmentally friendly means of getting from A to B.
• In motorised individual transport, the more people a private vehicle carries,
the more efficiently it is being used in environmental terms. The passenger
share is correspondingly high. In practice this passenger share is around
5-10% for business trips, and somewhat higher for shopping and leisure.
In general, therefore, one can make the following assertion: the greater the
proportion of daily trips made using transportation in the “environmental
network” (walking, cycling, public transport), the greener the achievement of
urban mobility and the more effective the measures to achieve ecological
targets of urban development and transport development planning.
The most sensible course would be to determine this share in relation to the
“weekday population”, i.e. to include commuters (business, education, shopping
etc.) in addition to residents. This figure, however, could only be determined at
considerable expense, which means that daily trips by residents are usually
taken as an approximation.
Indicators
Guidelines
• Lead indicator: Share of daily trips by residents accounted for by means of
transport in environmental network including car passenger share [%]
Guide figures (target figures): 70% in major cities / conurbations, 60% in
medium-sized cities / suburbs of major cities, 50% small towns / rural areas;
application levels: whole city, city centre (UBA 2002)
./.
- 35 -
PEOPLE – TOWN – TRANSPORT – ENVIRONMENT
Quality targets and indicators for sustainable mobility in cities and regions
Target area 2: Safeguarding and promoting walking
Quality target 2.1 Dense and adequately functioning footway network
How
important is
the target?
Indicators
Pedestrians are particularly in need of protection and sensitive to detours. A
dense network of footways is therefore important if pedestrian traffic, as the
greenest form of traffic, is to be encouraged on a long-term basis. The footway
network should be as free as possible from detours in the vicinity of major roads
and train or tram tracks as well. Especially in major roads, opportunities to cross
the road should cater for small-scale use as well, and the crossing points should
be adequately protected. As a functional minimum requirement, the footway
width should be 2.50 m for main roads, and an absolute minimum of 1.50 m. As
far as possible, pavements should not be narrower, even in access roads.
• Lead indicator: Share of total length of main roads accounted for by main
roads (basic urban network) with good conditions for pedestrian traffic [%]
Target value: 100% (for definition of “good”, see pavement width standards
in the guidelines); application level: whole city.
Other measurable or calculable indicators:
• Share of total length of roads within the town with good conditions for
pedestrians [%]
Target value / application level: see above
• Share of total length of main roads (basic urban network) with adequate
crossing facilities for pedestrians (e.g. share of protected crossing points as
a percentage of the total number of protected crossing points considered
necessary in the main road network; cf. for example MLUR BBG 2001)
Target value: 100% (for definition of “adequate”, see width standards in the
guidelines, especially GW 5); application level: whole city
Supplementary test indicator for “town of short distances”:
• Share of total number of residents accounted for by residents within 600 m
of shopping and supply centres for daily needs (max. 10 minutes walk) [%]
Target value: 100%; application levels: whole city, important individual
measures (here: location development in the retail sector)
Guidelines
GW 1 The footway network is to be further developed so that it not only
ensures safe and convenient access to the immediate urban vicinity, but also
creates attractive, protected and reasonably direct connections between
residential areas, schools, shops, leisure and recreation facilities and public
transport stops/stations. When planning the network, special attention should
be devoted to areas where people wait or congregate (“street-life function”).
GW 2 There should be attractive connections between the everyday footway
network and the leisure and footpath network. Access to areas with a recreation
function is particularly important.
GW 3 The size of footways depends on their network function, adjacent land
uses and the requirements arising from the presence and numbers of people
and from children playing. Footway widths should be not less than 4.50 m on
streets with a major pedestrian axis function, 3.50 m on streets with other axis
functions, and 2.50 m on all other streets. Footpaths purely for leisure and
rambling purposes should be appropriate to expected numbers and should be
designed to suit the natural situation.
GW 4 When designing footways and pedestrian crossings, disabled-friendly
standards should be implemented (absence of barriers).
- 36 -
PEOPLE – TOWN – TRANSPORT – ENVIRONMENT
Quality targets and indicators for sustainable mobility in cities and regions
GW 5 Traffic islands (pedestrian crossings) should be employed consistently
as a standard solution for ensuring that main roads can be crossed, and
correspondingly frequent use should be made of them. Along important routes
taken by children (school and leisure routes), increased use should be made of
pedestrian crossings (“zebra crossings”); the limits to their use should be
governed by the rules for pedestrian crossings (R-GFÜ 2001). Light-controlled
transport crossings should be equipped with pedestrian-friendly transport light
phases.
Target area 2: Safeguarding and promoting walking
Quality target 2.2 High quality of public spaces
How
important is
the target?
Pavements and footpaths and pedestrian zones also have to serve a number of
other functions that must be taken into account when deciding their size, for
example children on bicycles (under 10), inline skaters (assigned to pavements
as a “special means of transport” under the Road Traffic Regulations), and also
shop front displays, pavement cafés etc. Walking and spending time in public
spaces are therefore directly connected, and often there is no clear transition.
Standing, lingering, dawdling, strolling, watching, talking, playing and more –
many kinds of presence (street-life function) need to be given specific attention
when designing streets, squares, green spaces, water systems, artistic objects,
rows of trees etc.
High-quality design should make walking attractive. This applies in particular to
city-centre areas with large numbers of visitors and customers.
Obstacle-free design of public spaces is mandatory under the Equality of
Opportunities for People with Disabilities Act.
Indicators
• Lead indicator: Share of total length of city-centre network of road and
pavements accounted for by pedestrian areas, transport-calmed areas and
car-free paths [%]
Target value: 100%; application levels: City centre, important individual
measures.
Other measurable or calculable indicators:
• Share of total length of urban network of road and pavements accounted for
pedestrian areas, transport-calmed areas and car-free paths [%]
No meaningful target / guide value can be specified; application level: whole
city
• Share of total publicly accessible car parking space in the city centre
accounted for by non-street city-centre parking spaces (i.e. in open-air car
parks, multi-storey car parks and underground garages) [%]
Target value: 100%; application levels: whole city, important individual
measures
• Dropped kerbs at crossing points and disabled facilities at signal-controlled
junctions, as a proportion of the total measures necessary [%]
Target value: 100%; application levels: whole city, city centre
Supplementary descriptive indicator:
• Children-friendly, pedestrian-friendly and cyclist-friendly design of public
spaces, streets, shopping areas by means of squares, water, greenery
(documentation of measures)
Guideline
GW 6 Pedestrian-friendly design of the footway network includes varied
design of street areas.
- 37 -
PEOPLE – TOWN – TRANSPORT – ENVIRONMENT
Quality targets and indicators for sustainable mobility in cities and regions
Target area 2: Safeguarding and promoting walking
Quality target 2.3 Walking-friendly climate
How
important is
the target?
Walking is a healthy and particularly green form of transport. Walking is
something that virtually anyone can do – including those with wheelchairs and
special walking aids – regardless of the availability of transport modes. Children
in particular depend on walking for getting to or from school and leisure pursuits
if they want to be independently mobile.
A walking-friendly climate is therefore of great importance: If people feel good
when walking, they will do it more often. For example, they will leave the car at
home more frequently or have no problem about walking longer distances from
where they park the car to their final destination. This is good for central
shopping locations in particular, but also for other purposes: more pedestrians
instead of motorised traffic means a reduction in traffic noise and ensures
quieter living; well-populated streets make for social safety; children on foot
acquire greater competence in coping with everyday traffic and are
independently mobile etc.
Indicators
Exclusively descriptive indicators (documentation of measures, possibly simple
statistics):
• Regular pedestrian campaigns (e.g. model campaign “I’m walking”, health
advice, free delivery services etc.)
• Publication of special pedestrian street maps (e.g. as children’s town plan,
city-centre plan etc.)
• Creation of a pedestrian guidance system (destinations, time required),
possibly with supplementary information notices within the town
Guidelines
GW 7 A footway-based signpost systems (“pedestrian guidance system”) plus
overview plans and maps are a necessary part of providing the network.
GW 8 A positive pedestrian climate has to be developed and maintained by
means of regular pedestrian campaigns and special services for pedestrians.
The focus here should be on safety, health and well-being.
Target area 3: Safeguarding and promoting cycling
Quality target 3.1 Dense and safe network of cycle paths
How
important is
the target?
Cyclists in everyday urban road transport are similar to pedestrians in their need
for protection and their sensitivity to detours. In order for cycling to be promoted
and protected as a fully adequate means of transport, it is necessary to have a
separate, dense cycle-path network of safe design that is suitable for everyday
and leisure purposes.
Because main roads frequently offer the most direct connections (e.g. cycling to
and from school), and also because this is where many destinations are to be
found, there is a special need here for safe cycling facilities. Directing cycle
traffic solely via side streets and off-street routes is not sufficient in itself, but
should be provided where possible as an additional option, to offer cyclists a
quiet and attractive, albeit less direct alternative to the main roads. Protected
crossing points where cycle routes cross main roads are important building
blocks in a cycle-path network.
Cyclists are an important consumer group. Cycle routes between the city-centre
shopping and business area and other districts of the town are therefore of
special importance.
- 38 -
PEOPLE – TOWN – TRANSPORT – ENVIRONMENT
Quality targets and indicators for sustainable mobility in cities and regions
Indicators
• Lead indicator: Main roads (basic urban network) with adequately
dimensioned and designed cycle traffic facilities or speed limited to 30 km/h,
as a proportion of total length of main roads [%]
Target value: 100% (for definition of “adequate cycling facilities”, see
footway width standards in the guidelines, especially GW 7); application
level: whole city.
Other measurable or calculable indicators:
• Share of total length of roads within the town with good conditions for
cyclists [%]
Target value: 100% (for definition of “good”, see footway width standards in
the guidelines, especially GC 7); application level: whole city
• Proportion of residents within 300 m of uninterrupted cycle routes leading to
the city centre [%]; the space under consideration is a catchment area of
4 km around the city centre; the percentage is based on the total number of
residents within this radius.
Target value: 100%; application levels: City centre, important individual
measures
Supplementary descriptive indicator:
• Opening up dead-end streets and opening one-way streets for oncoming
cyclists (documentation of measures)
Guidelines
GC 1 In accordance with the principle of supply-based planning, a
differentiated, dense and uninterrupted everyday network is to be developed for
cyclists. This includes protection of cyclists along main roads, and further
development of cycle traffic in traffic-calmed streets and on non-street routes.
Priority should be given to school cycle traffic routes.
GC 2 The everyday cycle-path network should be linked to the leisure and
cycle touring network by means of attractive connections.
GC 3 Routing of cycle traffic close to carriageways, especially on edge lanes,
is preferred.
GC 4 At junctions, priority is to be given to the non-segregated cyclist stream
and to direct left turners. Enlarged waiting areas for cyclists should be provided
in minor streets leading into signal-controlled junctions.
GC 5 Wherever possible, access roads of particular importance for the cycle
transport network should be designated as cycle streets, dead-end streets
should be opened up for cyclists, and one-way streets should be opened up for
oncoming cyclists.
GC 6 No special cycle traffic facilities are to be provided in zones with a 30km
speed limit.
GC 7 Cycle traffic facilities are to be executed in accordance with safe and
functional design standards (width, surface, alignment, continuity). Widths are
specified by the Road Traffic Regulations and/or the underlying rules of the
FGSV (Forschungsgesellschaft für Straßen- und Verkehrswesen – Road Traffic
Research Association), and minimum widths are to be avoided where possible.
- 39 -
PEOPLE – TOWN – TRANSPORT – ENVIRONMENT
Quality targets and indicators for sustainable mobility in cities and regions
Target area 3: Safeguarding and promoting cycling
Quality target 3.2 Ensure that destinations in the city can be reached by bicycle
How
important is
the target?
Good accessibility in cycle transport also includes good, secure and preferably
weatherproof parking facilities for the bicycle at the destination. Parking facilities
should therefore be created at all important cycle transport destinations, and
especially at stations and stops for regional rail traffic, express bus stops, points
of access to city-centre pedestrian zones, in city sub-centres and at secondary
schools, leisure facilities and civic establishments open to the public.
Indicators
Measurable or calculable indicator:
• Cycle parking facilities in place, as a proportion of the total number of cycle
parking facilities planned in the urban area [%]
Target value: 100%; application levels: whole city, city centre, important
individual measures
Supplementary descriptive indicator:
• Creation of cycle parking facility at train station with additional services for
cyclists (documentation of measures)
Guidelines
GC 8 The catchment area of stops/stations can be expanded by providing
good cycle traffic links to important public transport stops combined with secure,
weatherproof Bike+Ride facilities. This applies especially to stops and stations
in the rail-based public transport system and to express bus stops. As far as
possible, a cycle parking facility with additional services should be created at
the main train station.
GC 9 Secure and preferably weatherproof cycle parking facilities should also
be provided at other important destinations in the urban area (pedestrian zone,
public establishments, leisure facilities etc.). Requirements should be checked
regularly on the basis of the number of bicycles parked. Where appropriate the
facilities should be enlarged.
- 40 -
PEOPLE – TOWN – TRANSPORT – ENVIRONMENT
Quality targets and indicators for sustainable mobility in cities and regions
Target area 3: Safeguarding and promoting cycling
Quality target 3.3 Cycling-friendly climate
How
important is
the target?
Cycling is an environmentally friendly and particularly healthy form of transport.
In view of the growing number of overweight persons (with sometimes serious
repercussions on health) in all population groups, the latter aspect in particular
is of special importance for promoting long-term health and reducing the burden
on the public health system. Older children and juveniles without a driving
licence depend on cycling for getting to or from school and leisure pursuits if
they want to be independently mobile.
A cycling-friendly climate is therefore of great importance: If people feel good
when cycling, they will do it more often and leave the car at home. In particular,
it should be remembered that many daily trips are less than three kilometres,
which is an ideal distance for cycling.
Moreover, as in the case of walking: more cyclists instead of motorised traffic
reduce traffic noise and ensure quieter living; well-populated streets make for
social safety; children on bicycles acquire greater competence in coping with
everyday traffic, older cyclists remain healthy and mobile for longer etc.
In combination with public transport, the bicycle offers a good alternative to the
car in the urban and regional context, given the right “cycling climate” in the
public transport context.
Indicators
Exclusively descriptive indicators (documentation of measures, possibly simple
statistics):
• Regular cycling campaigns (e.g. model campaign “I’m cycling”, also in
conjunction with routes to work, health advice, bicycle check)
• Publication of town plan for cyclists (e.g. as touring map or in the form of
individual route maps)
• Creation of cyclist signposting system (destinations, time required), possibly
with supplementary information notices within the town
• Facilities for taking bicycles on buses and trains, especially on hilly routes
within the town
Guidelines
GC 10 Cycle path signposting for everyday and leisure purposes is a
necessary part of network provision, as are overview plans and a special town
plan for cyclists.
GC 11 Public-sector employers should be encouraged to systematically
promote cycle transport by setting an example through appropriate offerings
(parking facilities, work bicycles, financial incentives etc.). This also includes
public advertising campaigns for everyday cycling.
GC 12 At least at certain times of day, it should be possible to take bicycles
on public transport at low cost on hilly routes within the town.
- 41 -
PEOPLE – TOWN – TRANSPORT – ENVIRONMENT
Quality targets and indicators for sustainable mobility in cities and regions
Target area 4: Promotion of public transport
Quality target 4.1 Good availability of public transport in city and region in terms
of time and space
How
important is
the target?
Bus and rail services offer all those who do not have a car and driving licence,
or who want to manage without, the necessary mobility for longer distances
(especially distances too great for cycling). This applies especially to children
and juveniles, but also to many women on errands for the family and to many
older people.
Unlike other means of transport, public transport services usually travel on
specified scheduled routes in accordance with published timetables during
defined operating hours. The passengers are solely “along for the ride”, i.e. they
are unable to determine important conditions of the trip themselves, but are
transported together. They are therefore particularly dependent on good
availability of public transport in terms of space and time.
Good spatial availability is presumed to be the case when the walking distance
from home to the nearest bus stop is not more than about 5 minutes, in other
words about 300 m as the crow flies. For rail-based services, longer distances
of 500-1,000 m or 8-15 minutes on foot or 5 minutes by bicycle are still
considered “good”.
Good availability in terms of time exists if bus and rail services run frequently
and regularly (i.e. preferably high-frequency fixed-interval services; see also
Guideline GPT 4) and if the operating hours or supplementary services such as
phone-ordered shared taxis, city minibus etc. also permit trips early in the
morning and late at night. This applies not only to weekdays, but also to
weekends and public holidays.
Indicators
• Lead indicator: Residents situated within 300 m of bus stops and/or 500 m
of S-Bahn stations, light railway or tram stops, as a proportion of total
number of residents [%]
Target value: 100%; application level: whole city.
Other measurable or calculable indicators:
• Residents within catchment area of 500 m for tram and light railway stops,
as a proportion of the total number of residents [%]
Guide figures from the model towns: Erfurt light railway: approx. 70%; Görlitz
trams / Lörrach S-Bahn: approx. 45% each); application level: whole city
• Trips offered and operating hours in urban bus and rail transport (weekdays,
Saturdays, Sundays and public holidays), as a proportion of the targets set
in the public transport concept of the transport development plan or in the
local transport plan [%]
Target / guide values cf. GPT 4; application level: whole city, city centre,
important individual measures
Supplementary descriptive indicators (documentation of measures):
• Services offered on a demand-driven basis and/or in combination with other
forms of transport (e.g. carsharing, ride-share agencies, carpooling, bicycle
transport on buses and trains)
• Good coordination of public transport entities at urban, regional and longdistance level.
- 42 -
PEOPLE – TOWN – TRANSPORT – ENVIRONMENT
Quality targets and indicators for sustainable mobility in cities and regions
Guidelines
GPT 1 The routes and runs offered by the public transport services should be
based on the mobility market, i.e. not just present, but also potential demand,
and their marketing should be correspondingly profit-oriented.
GPT 2 The demand characteristics, which are different in urban and regional
transport, are to be catered for by means of differentiated and coordinated
services and attractive fare structures.
GPT 3 Distances to stops should not exceed 300 m as the crow flies
(5 minutes on foot). In districts with high population density or destination
density (city centre, sub-centres), efforts should be made to provide stops every
150-200 m.
GPT 4 Coordinated high-frequency fixed-interval services are necessary to
guarantee “lean connections”, including between bus and rail. The basic interval
during peak hours should be 10 minutes or less on urban routes in major cities,
15 minutes or less in medium-sized towns, and not more than 30 minutes in
other urban settlement areas. Good coordination should be ensured between
the individual urban public transport services and with regional public transport,
in order to ensure direct connections and short changes for the passengers.
Target area 4: Promotion of public transport
Quality target 4.2 Competitiveness of public transport compared with motorised
individual transport
How
important is
the target?
Public transport, especially road-based tram and bus transport, is competitive
compared with motorised individual transport if – assuming good availability – it
offers short travelling times, good punctuality and low incidence of breakdowns
(or a flexible, competent breakdown management system). This can in
particular be supported by ensuring that on stretches with transport hold-ups
(frequent stop-and-go, jams) these forms of public transport are given priority
over motorised individual traffic, for example by means of signals (e.g. radiooperated demand for green light) and special lanes (also allowed to be used by
taxis and bicycles).
Indicators
Measurable or calculable indicators:
• Average transport speed in public transport or on individual public transport
lines or on important stretches (e.g. between district centres and city centre),
as a percentage of motorised individual transport speeds for the same
stretch [%]
Suitable target / guide values to be defined for individual stretches;
application levels: whole city, city centre, important individual measures
• Frequency of compliance with timetable for individual public transport lines
or stretches [%]
Target value: 100%; application level: important individual measures (here:
acceleration concept for individual lines, implementation of bus lane
programme etc.).
Supplementary descriptive indicators (documentation of measures):
• Direct routing of public transport in streets prohibited to motorised individual
traffic
• Acceleration measures through signal controls and special lanes
- 43 -
PEOPLE – TOWN – TRANSPORT – ENVIRONMENT
Quality targets and indicators for sustainable mobility in cities and regions
Guidelines
GPT 5 Where buses share roads with motorised individual traffic, priority for
public transport is to be ensured as far as possible.
GPT 6 Regional transport involves greater distances than urban transport. In
regional transport there is therefore a need to optimise transport speeds and
also “lean connections”. The latter applies in particular to connections between
urban public transport services and regional train services at stations and other
stops.
GPT 7 Wherever possible the interests of public transport services are to be
given priority when designing junctions, especially with regard to light-controlled
facilities.
Target area 4: Promotion of public transport
Quality target 4.3 Public transport stops are easily accessible and attractively
designed
How
important is
the target?
In the “environmental network” along with the non-motorised means of transport
(walking, cycling), public transport services offer an environmentally friendly
form of combined transport. It offers self-determined mobility to all those who do
not have a car (or a driving licence) or who for personal reasons wish to
manage without. The stops/stations are the spatial interfaces here.
They should be within acceptable walking or cycling distance of the home and
destination addresses in the urban area (see Quality Target 4.1). Their design
must be such that people can reach them without detours or obstacles, are safe
and protected from the weather while waiting, and are well informed about the
public transport services.
Indicators
Measurable or calculable indicators:
• Public transport stops/stations in the urban area with weather protection,
seats and additional elements, as a proportion of total public transport
stops/stations in the urban area [%]
Target value: 100%; application levels: whole city, city centre, important
individual measures
• Stops/stations with access free from detours and obstacles, as a proportion
of the total number of points of access, in each case from the nearest car
park, footway and other platform / bus stand [%]
Target value: 100%; application levels: whole city, city centre, important
individual measures.
Guideline
GPT 8 The public transport service should have a street presence. This
includes a vehicle fleet that complies with modern demands and technical
standards, and attractive, convenient design of the stops. Bus stops should
normally be designed as bus bulbs.
- 44 -
PEOPLE – TOWN – TRANSPORT – ENVIRONMENT
Quality targets and indicators for sustainable mobility in cities and regions
Target area 4: Promotion of public transport
Quality target 4.4 Climate friendly to public transport
How
important is
the target?
Customer friendliness with regard to information, fares, travel comfort etc. is – in
addition to good availability and competitiveness compared with motorised
individual transport – a fundamental requirement for strong demand for public
transport services. Whereas good and easily accessible information and an
easily understood fare structure are important for infrequent users of public
transport, regular users primarily want inexpensive fares for multiple trips, e.g.
in the form of job tickets for business commuters or transferable subscription
tickets for families (“second car”).
Indicators
Measurable indicator:
• Number of job tickets sold, as a proportion of the number of gainfully
employed persons in the urban area [%]
Target value: 100%; application level: whole city, city centre, important
individual measures (e.g. implementation of a location-specific mobility
management concept for an industrial estate).
Additional descriptive indicators (documentation of measures, possibly simple
statistics):
• Regular information and advertising, with special measures to introduce new
service modules in public transport (routes, vehicles, fares, timetables etc.)
• Mobility management for businesses, administrative departments and
service providers (job ticket etc.)
• Mobility consulting for public transport users
• Issuing of special pocket timetables to households in the urban area and to
commuters
Special services by businesses for public transport customers (e.g. public
transport bonus, home delivery services)
Guidelines
GPT 9 Major employers in the urban area should be approached about job
tickets. For smaller businesses and service providers, an organisational form
should be found which gives their employees access to a job ticket too.
GPT 10 Local authorities should provide targeted encouragement and support
for advertising and service measures by public transport operators for their
customers in the urban area. This also includes organisational support for
mobility consulting services.
- 45 -
PEOPLE – TOWN – TRANSPORT – ENVIRONMENT
Quality targets and indicators for sustainable mobility in cities and regions
Target area 5: Safeguarding necessary motorised individual transport
Quality target 5.1 Traffic on major roads moves smoothly at low speeds
How
important is
the target?
Low speed levels on main roads are particularly effective in reducing noise
nuisance or the number of people affected by noise. They also make it easier
for pedestrians to cross the road, and offer cyclists greater safety on the
carriageway. According to present knowledge, slight reductions in air pollution
are also possible if the flow of motorised traffic is made smoother, i.e. repeated
acceleration and braking is reduced; the relevant scientific findings are still
contradictory, however. Low speeds increase road safety, and above all they
bring a substantial reduction in the number and severity of injuries in traffic
accidents.
In many areas, especially central parts of the town, this also results in a
smoother flow of motorised individual traffic.
There is thus a subjective overall improvement in the urban “traffic climate” for
all road users, making for better relations between all concerned.
Indicators
• Lead indicator: Main roads (basic urban network) with a speed limit of
30 kph, as a proportion of the total length of main roads [%]
Target value: 100%; application levels: whole city, city centre, important
individual measures
Supplementary descriptive indicator (documentation of measures):
• Signal-based, control and organisational measures to achieve a steady flow
of motorised individual traffic at low speeds
Guidelines
GMIT 1 The local road network should be functionally classified depending on
the urban structure and its interaction with the sub-networks of the
environmental network.
GMIT 2 The bundling principle should be used to support economical network
design and reduce the burden on critical areas.
GMIT 3 To reduce environmental stresses and increase traffic safety, efforts
should be made to ensure a steady flow of traffic at low speeds and to support
this by means of ancillary measures and rigorous monitoring.
GMIT 4 The quality standard and design of main roads should be based on
the compatibility of claims for use with each other and with surrounding uses,
and should be selected to minimise environmental impacts.
GMIT 5 When designing junctions, and especially transport light controls,
priority should be given to catering for the interests of the environmental
network. Wherever possible and practical, junctions with traffic lights should be
replaced by roundabouts.
- 46 -
PEOPLE – TOWN – TRANSPORT – ENVIRONMENT
Quality targets and indicators for sustainable mobility in cities and regions
Target area 5: Safeguarding necessary motorised individual transport
Quality target 5.2 Widespread traffic calming in residential areas
How
important is
the target?
As described earlier, low speed levels on urban roads have a number of
positive effects. This applies particularly to streets in residential areas. A largescale approach to traffic calming is desirable here, by means of 30 kph zones
(supplemented by traffic-calmed areas in residential streets with special
requirements regarding street life and children playing). This should provide
effective support for the function of access roads for pedestrians and cyclists,
children and older people, in relation to playing, street life and a wide range of
social contacts.
Indicators
Measurable or calculable indicator:
• Urban streets with speed limit of 30 kph or less (30 kph sections of main
roads, 30 kph zones, traffic-calmed areas), including pedestrian areas, as a
proportion of the total length of urban roads [%]
Target value: 100%; application level: whole city
Additional descriptive indicators (documentation of measures, possibly simple
statistics):
• Design measures to increase road safety and street life quality in residential
streets, construction of mini roundabouts etc.
• Intensity of municipal speed monitoring
Guidelines
GMIT 6 Designation of 30 kph zones all over the town ensures large-scale
traffic calming in the network of access roads.
GMIT 7 The quality standard and design of access roads should be based on
the extent to which claims for use are compatible with each other and with
surrounding uses, and should be selected to minimise environmental impacts.
GMIT 8 The priority purpose of the creation and design of traffic-calmed areas
should be to safeguard and facilitate street life functions and children playing in
residential streets. Inexpensive partial conversion with extensive retention of
asphalt surfacing (for wheeled play) and kerbs is also suitable for this purpose if
the situation on entering the zone makes the change sufficiently clear to drivers
and if the special functions of the traffic-calmed area are evident from tree beds,
parking arrangements, seats and play elements etc. Dead-end streets in
residential areas are particularly suitable for this purpose.
Target area 5: Safeguarding necessary motorised individual transport
Quality target 5.3 Ensure that destinations in the city can be reached by
motorised individual transport
How
important is
the target?
The accessibility of urban destinations for motorised individual transport is an
important locational factor for various purposes: residents, visitors, consumers
(especially in the city centre) and commuting employees without acceptable
public transport services need parking facilities at the end of their journey.
Homes in particular have an important basic function in all urban areas – also
especially in the city centre – for example bringing life to the area, tying
purchasing power etc.
- 47 -
PEOPLE – TOWN – TRANSPORT – ENVIRONMENT
Quality targets and indicators for sustainable mobility in cities and regions
However, the various claims should be given differentiated treatment. In areas
with a parking space deficit (“excess demand”), residents should be privileged if
there are not enough private parking spaces (at least for one vehicle per
household). The demand for parking spaces by visitors and consumers should
be controlled by means of parking space management to ensure that it is
satisfied in the least disturbing manner possible and at the same time helps to
avoid transport searching for a parking space.
Especially in the city centre, parking space is a valuable resource, and
appropriate parking charges should therefore be levied on visitors and
consumers using their cars here.
Indicators
Measurable or calculable indicators:
• Number of publicly accessible parking spaces in the city centre, as a
proportion of defined city-specific target value [%]
Target value: see above; application levels: City centre, important individual
measures (e.g. construction of new parking facilities)
• Number of publicly accessible parking spaces in the city centre per 10,000
residents in the urban area [%]
Target value: A study in the mid 1990s revealed that a figure of 20 parking
spaces in the city centre per 1,000 residents in the city as a whole was the
statistical lower limit in cities with high purchasing power ties (BAST 1998),
application levels: City centre, important individual measures (see above)
Additional descriptive indicators (documentation of measures, possibly simple
statistics):
• Management of public parking facilities, including outside the centre (e.g.
seek to achieve prices that cover costs, introduce privileged parking for
residents, where appropriate night parking charge)
• Effectiveness of parking controls
Guidelines
GMIT 9 The qualified demand for parking space (residents, business traffic
and parts of shopping and visitor traffic) and the potential of the streets
concerned (incl. access routes) for absorbing such parking are crucial factors in
defining the scale and spatial distribution of public parking facilities.
GMIT 10 A parking space management system for the whole city is a major
factor in avoiding traffic, shifting traffic to the environmental network and
meeting the qualified demand. Parking space management also includes
acceptable development of the parking space.
GMIT 11 Parking management should ensure better parking prospects for the
qualified demand, and should at the same time achieve compatible and
economic use of the existing parking facilities.
GMIT 12 A parking control system is a useful component of parking
management. It is intended to guide city-centre visitors to the central parking
facilities by short routes in the main road network and thereby avoid traffic
caused purely by people looking for parking spaces, especially in sensitive
areas of the city centre and adjacent residential areas.
GMIT 13 A rigorously implemented monitoring concept is an important part of
the parking management system.
GMIT 14 The acceptance of the parking management system should be
increased by means of supporting information and education work.
- 48 -
PEOPLE – TOWN – TRANSPORT – ENVIRONMENT
Quality targets and indicators for sustainable mobility in cities and regions
Target area 6: Health protection and resource conservation
Quality target 6.1 No health hazards and sleep disorders arising from traffic
noise
How
important is
the target?
Persistent loud traffic noise is harmful to health, leads to reduced performance,
and can seriously affect individual well-being and quality of life. Its complex
effects influence the entire organism. Persistent noise exceeding 65 dB(A)
during the day and 55 dB(A) at night often gives rise to stress reactions (e.g.
high blood pressure), which represent special risk factors for cardiovascular
disorders.
Problems sleeping with the window open occur at overnight external sound
levels of more than 45 dB(A).
10-15% of the population are particularly sensitive to noise, especially older
people. A sharp rise in the proportion of older people is expected in the future.
Moreover, at continuous sound levels exceeding 55 dB(A) conversations at
normal volume are virtually impossible, which greatly reduces the social
usefulness of street spaces.
Contrary to oft-quoted statements about effects, changes in volume are
perceptible even below a level reduction of 3 dB(A). Recent findings show that
noise reductions are perceived from a level difference of about 1 dB(A) upwards
(ORTSCHEID / WENDE 2004). Thus it is neither purposeful nor scientifically
justifiable to cling to a threshold value of 3 dB(A) in connection with noise
abatement measures, e.g. speed limits to reduce noise on streets with
considerable residential and street life functions.
Indicators
Lead indicators:
• Residents with persistent daytime traffic noise levels exceeding 65 dB(A) as
a threshold value for health hazards, as a proportion of the total number of
residents [%]
Target value: 0%; application levels: whole city, important individual
measures (e.g. noise abatement measures on main roads
• Residents with persistent night-time traffic noise levels exceeding 55 dB(A)
as a threshold value for considerable sleep disorders, as a proportion of the
total number of residents [%]
Target value: 0%; application levels: whole city, individual measures:
Other measurable or calculable indicators*:
• Residents with persistent daytime traffic noise levels exceeding 55 dB(A) as
a threshold value for serious communication problems, as a proportion of the
total number of residents [%]
• Residents with persistent night-time traffic noise levels exceeding 45 dB(A)
as a threshold value for sleep disorders, as a proportion of the total number
of residents [%]
*Notes: The data may also be acquired using simplified methods; cf. for example MUNR BBG 1998
and MLUR BBG 2001. There have been various proposals to use the emission limits laid down in
the 16th Federal Immission Control Ordinance (BImSchV) for residential areas. These are 59 dB(A)
during the day from 6 a.m. to 10 p.m. and 49 dB(A) at night from 10 p.m. to 6 a.m. Note: The term
“considerable” is the subject of dispute. It is used here in the colloquial sense and is not necessarily
to be interpreted in the strict sense of the Ordinance.
- 49 -
PEOPLE – TOWN – TRANSPORT – ENVIRONMENT
Quality targets and indicators for sustainable mobility in cities and regions
Guideline
GH 1 All transport-related measures should be checked to see what effect
they have on the local noise situation. In particular, the possibility of imposing
30 kph speed limits and night-time bans on heavy goods vehicles in streets
used for residential purposes should be investigated, and if implemented should
be rigorously monitored. The reason for the restriction should where appropriate
be made known to road users by means of a supplementary sign “noise
abatement”.
Target area 6: Health protection and resource conservation
Quality target 6.2 No health hazards arising from traffic-induced air pollutants
How
important is
the target?
Although traffic-induced air pollution is decreasing in the long term thanks to
advances in vehicle technology, the components particulates (PM10) and
nitrogen dioxide (NO2) will remain critical in many places for some years to
come.
An increase in pollution by particulates (PM10) that are so fine that they can be
breathed into the lungs is accompanied by increased incidence of disorders of
the cardiovascular system and the respiratory tract. Recent studies indicate that
this is largely due to particularly fine dust (PM2.5). High pollution levels in
outside air also increase the risk of chronic respiratory disorders in children
suffering from asthma. The incidence of such disorders in Germany has shown
a further increase in recent years and currently stands at around 14%.
Individual constituents of the outside air such as (diesel) soot and benzene are
carcinogenic. For such substances it is not possible to state a threshold value
below which there is no health risk.
Motorised road traffic is the main cause of air pollution. New European
threshold values, which are also laid down in the Federal Immission Control Act
(22nd Federal Immission Control Ordinance) and which to some extent took
effect in 2005, set high standards in this respect.* In particular, compliance with
the threshold values for PM10 will hardly be possible on some heavily used
main roads even in the medium term.
* The daily average limit value of 50 µg/m3PM10 effective from 1 January 2005 may not be
exceeded on more than 35 days in the year. If it is shown to be exceeded, more precise studies are
needed in areas / stretches of street that are at risk. These studies should include analyses of the
people affected and should result in the preparation of action plans.
Indicators
Guideline
• Lead indicator: Residents with a critical suspended particulate matter level
(PM10), as a proportion of total number of residents [%]
Target value: 0%; application levels: whole city, important individual
measures (e.g. street-related measures in municipal air quality control plan)
GH 2 In connection with the question of traffic-induced air pollution, heavy
goods traffic should as far as possible be channelled onto less sensitive streets
without a residential or street life function. To this end an HGV route concept
should be drawn up that limits HGV traffic in sensitive areas to deliveries only.
- 50 -
PEOPLE – TOWN – TRANSPORT – ENVIRONMENT
Quality targets and indicators for sustainable mobility in cities and regions
Target area 6: Health protection and resource conservation
Quality target 6.3 No persons killed or seriously injured on the roads
How
important is
the target?
In spite of an ongoing decrease in road accidents, about one person a minute is
injured on Germany’s roads, and about one person an hour is killed. At the
same time invalidity resulting from road accidents is increasing, since the
chances of surviving a traffic accident have been considerably increased not
only by the many technical, legislative and transport planning measures, but
also by the improvements in rescue services and in accident and emergency
medicine.
General findings show that
− the groups most at risk are children and older people as pedestrians, and
children and juveniles as cyclists,
− the vast majority of road accidents involving children occur during their
leisure time and close to their homes,
− cycle accidents predominate as the children grow older,
− on the other hand children are increasingly rarely involved in accidents
because they are less often on the move out of doors than in the past (partly
because they are not allowed to by their parents),
− individual cyclists are generally less at risk in cities where more people use
their bicycles.
The economic costs of traffic accidents are considerable. In Germany they are
currently over €550.000 in the event of death and around €40,000 for serious
injuries, not to mention the individual suffering that every accident causes for
the injured person and their relatives.
Indicators
Guideline
• Lead indicator: Annual numbers of persons killed or seriously injured in
road traffic within the city boundaries, per 10,000 residents
Target value: 0 persons; application level: whole city.
GH 3 Road safety should have absolute priority over speed and smooth flow
in motorised individual traffic. Comprehensive road safety work should make a
contribution to protecting people (regardless of their means of transport), nature
and the environment, and to eliminating the principal causes of accidents. This
can be supported by a municipal road safety programme in which all local
institutions concerned with road safety aspects take part.
Target area 6: Health protection and resource conservation
Quality target 6.4 Limit existing land use for transport to what is essential
How
important is
the target?
Areas that are reserved for traffic and/or sealed for traffic purposes are no
longer available for other important functions. This applies particularly to the
aspects urban climate, nature (flora, fauna) and landscape. The increase in
surface sealing of land also increases the demands on municipal sewage plants
and results in substantial fluctuations in the amount of water carried by natural
watercourses.
The area required for traffic is primarily a direct result of urban planning models
and decisions. The more land-intensive the settlement structures, the greater is
the land take. For example, detached houses require more land for transport
access than do compact row houses, town house concepts or apartment
blocks.
- 51 -
PEOPLE – TOWN – TRANSPORT – ENVIRONMENT
Quality targets and indicators for sustainable mobility in cities and regions
For certain settlement structures it is nevertheless possible to achieve more or
less land-saving transport access with economical access networks for
motorised transport and economical street cross-sections that are sufficient for
the individual function required. Residential streets, for example, require much
smaller cross-sections than main roads, and in some cases they can therefore
be built as combination streets, i.e. all road users make joint use of the same
space (traffic-calmed zone).
Indicators
Measurable or calculable indicator:
• Street area per resident
Target/guide value: In individual cities this indicator is around 20-40 sq.m.
per resident (MLUR BBG 2001), depending on settlement density,
application levels: whole city, important individual measures
Supplementary descriptive indicator (documentation of measures):
• Safeguarding urban climate zones
Guidelines
GH 4 In the planning and construction of transport infrastructure, favourable
land balances and maximum efficiency are to be achieved by means of
economical design and construction standards with low production costs and
reasonable operating and maintenance costs.
GH 5 As far as possible, conversion and deconstruction of oversized transport
facilities is to be used to reduce surface sealing.
Target area 6: Health protection and resource conservation
Quality target 6.5 Economical energy consumption and increased use of energy
from renewable sources in motorised transport
How
important is
the target?
Apart from the aspect of conserving natural energy resources (especially oil as
a non-renewable energy source), the impacts of primary energy consumption
on climate and environment play an important role.
Indicators
Measurable or calculable indicators:
Public administrations and transport entities can set an example and play a
pioneering role, for example by using low-emission fuel-saving vehicles or by
supporting traffic -reducing forms of mobility (e.g. carpooling for travelling to and
from work, carsharing instead of second cars etc.).
• Number of cars registered per 1,000 inhabitants
Guide values, taken from [UBA 2002]: 300 cars/1,000 in major cities,
400 cars/1,000 in medium-sized cities, 500 cars/1,000 in small towns / rural
areas (UBA 2002), application level: whole city
• Number of carsharing participants per 1,000 inhabitants, compared over
time or in relation to the degree of motorisation of the population
Target / guide values not available, application level: whole city.
Guidelines
GH 6 Promotion of vehicle use that is more friendly to town and environment,
for example through carpooling for journeys to and from work and carsharing
initiatives as a substitute for keeping a private car, is to become a firm part of
sustainable transport development planning.
GH 7 In the long term, public transport and municipal fleets are to change
over to low-noise, low-emission vehicles. Relevant efforts by public transport
operators are to be supported by the municipal authorities and supplemented in
exemplary fashion by corresponding decisions in relation to municipal fleets.
- 52 -
PEOPLE – TOWN – TRANSPORT – ENVIRONMENT
Quality targets and indicators for sustainable mobility in cities and regions
Target area 7: Sustainable planning, participation and information
Quality target 7.1 Integrated municipal planning having regard to the close links
between urban development, transport development and
environmental quality
7.2 Lay down environmentally friendly building and transport
concepts in zoning plans
7.3 Regular review of settlement and transport concepts and
measures implemented to achieve progress towards the
defined action targets
7.4 Appropriate public participation in planning and decision
making
7.5 Active support for and promotion of Local Agenda 21 activities
by the municipal administration
7.6 Provision of free access to important local authority data for
all interested residents
How
important is
the target?
The fundamental importance of integrated planning relates to the cause-andeffect relationship that can be summed up as “transport follows land use”, i.e.
transport is to a large extent determined by certain land uses and their position
and relationship to each other (e.g. home, workplace and place of education/
training, shopping and supply centres, leisure facilities etc.).
It is thus both sensible and urgently necessary to pursue an integrated planning
policy that recognises this cause-and-effect relationship and sets out to
influence it, so that motorised traffic can as far as possible be avoided or at
least relocated to less problematical roads. This is symbolised by the “city of
short distances” with a correspondingly large proportion of “local mobility”
means of transport (walking, cycling and other non-motorised means of
transport).
The objective of regular checking of target achievement in connection with the
implementation of transport-related and mobility-related measures is ensured by
making interim reviews on a regular and binding basis to ascertain progress
with the implementation of transport development planning on the basis of this
catalogue of targets and indicators. The aim should be 5-yearly intervals, in line
with the term of office of the town or municipal council.
Systematic implementation of effective forms of information and participation
plus support for civic initiatives corresponds to the sustainability aspect of
fostering an understanding of the existing relationships – in this case between
transport / mobility on the one hand and environment / health / quality of life on
the other – and strengthening the individual responsibility of the citizens.
Indicators
No quantifiable indicators were specified for this area. Interim reviews should
include verbal documentation and discussion of the targets mentioned above.
- 53 -