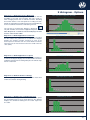
1
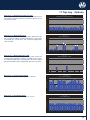
Operating Instructions
Trailer Analyser
Version 1.1
BPW · THE QUALITY FACTOR
ECO Tronic EBS. Trailer Analyser
Operating instructions
Version 1.1
04.001.21.37.5
Trailer Analyser - Operating Instructions
1 Introduction / 2 Minimum requirements
1 Introduction
Contents
Page
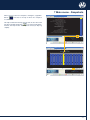
With the Trailer Analyser you can read analysis data stored in
the ECO Tronic EBS ECU to a PC and evaluate this data.
1 Introduction
2
2 Minimum requirements
2
3 Abbreviations
3
4 Installation
4
The vehicle data is stored in the ECO Tronic EBS ECU. It remains
stored even when the power to the EBS system is switched off.
5 Start screen - Description
6
6 Main menu - Overview
8
Note:
• The Trailer Analyser diagnostic adapter differs from the
diagnostic adapter used with the Trailer Manager and also
serves as a safety dongle for the programme. It is therefore
not possible to operate the Trailer Analyser with the Trailer
Manager diagnostic adapter or other adapters available in
the market (USB adapters).
7 Main menu - Snapshots
9
8 Main menu - Histogram
12
9 Histogram - Options
14
10 Main menu - Trip Log
17
11 Trip Log - Options
18
12 Main menu - User information
23
4.1
4.2
4.3
Hardware
Software
Installation options
A diagnostic adapter (PC dongle) enables data transfer between
the PC and the ECO Tronic EBS ECU. The connection to the
diagnostic adapter is by means of a USB cable connected to the
USB terminal of the computer and an additional cable connected
to the diagnostic terminal of the EBS ECU.
• The Trailer Analyser can only be opened and used with the
diagnostic adapter connected.
2 Minimum requirements
The minimum requirements for the PC or Laptop for operating
the Trailer Analyser are as follows:
• Processor
- minimum 486
RAM
- 64 MB
Hard disc
- 100 MB
Monitor
- minimum 1024 x 768 VGA
USB connection - for connecting the diagnostic cable
• MS Windows NT
MS Windows 2000
MS Windows XP
MS Windows Vista :
MS Windows 7 :
2
Installation only with administrator
rights
Installation only with administrator
rights
3 Abbreviations
Abbreviations Explanation
Description
2S/2M
2 Sensors / 2 Modulators
ABS system with 2 rotational speed sensors and 2 modulators
ABS
Anti-Lock Braking System
Prevents the locking of braked wheels to maintain lateral grip
ADM
Assembly Data Management
Software function for storing all important vehicle data
ADR
Accord européen relatif au transport European agreement on international transport of dangerous goods by road
international des marchandises
Dangereuses par Route
ASC
Adaptive Surface Control
ABS control that dynamically adapts to road conditions
AUX
AUXiliary
Additional input / output for sensors or actuators / valves
BPM
Brake Performance Monitoring
Software function for monitoring brake performance
Controller Area Network
Data bus system, used for controller communication in vehicles, among others
CAN
®
COLAS +
Lift and lower valve
Valve for lifting and lowering the vehicle body in the case of airsprung vehicles
DCV
Double Check Valve
Anti-compounding valve to prevent simultaneous application of service
brakes and emergency brakes
DTC
Diagnostic Trouble Codes
Brake system error / warning codes for diagnosis and repair
EBS
Electronic Braking System
ECE R13
Economic Comission for
Europe Regulation No. 13
Electro-pneumatic brake system with CAN communication between the truck
and the trailer
European regulation No. 13 - Brake systems
ECU
Electronic Control Unit
EEPROM
ELS
(LSV)
Electrically Erasable Programmable
Read Only Memory
Electronic Load Sensing
Function for automatically adapting the braking force to the load of the vehicle
Load Sensing Valve
EOLT
End Of Line Test
End of line system check to ensure correct system installation
EPRV
Electro Pneumatic Relay Valve
Electro pneumatically piloted relay valve of the EBS
GPI
General Purpose Input
AUX option
General Purpose Output
AUX option
Integrated Lift Axle Steering
EBS controlled lift axle valve
GPO
®
ILAS -E
Electronic controller
ISO 1185
Standardised interface between truck and trailer for lighting control
ISO 11992
CAN bus communication standard between truck and trailer for brake control
ISO 7638
Standardised interface between truck and trailer supplying ABS/EBS systems
with power, transferring a signal for a warning device and, if fitted, enabling
CAN communication as standardised in ISO 11992
LWS
Lining Wear System
Brake pad wear sensing
PPV
Pressure Protection Valve
Pressure protection valve that separates the brake and air suspension circuits
PTC
Push To Connect
Pneumatic connectors to ease installation
QRV
Quick Release Valve
REV
Relay Emergency Valve
Relay valve with emergency brake function
RCM
Road Condition Monitoring
Software function for recording and evaluating road profiles
RtR
Reset to Ride Height
Automatic return to ride height
SAUX
Super AUX
Installation-optimized possibility for three digital inputs
TA
Traction Assist
Starting traction control
TrCM
Trailer Control Module
Parking and manoeuvring valve with emergency brake function (and
integrated pressure protection)
TRS
Trailer Roll Stability
Function that reduces the risk of the trailer rolling over
3
Trailer Analyser - Operating Instructions
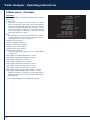
4 Installation
The software must be installed before connecting the diagnostic
adapter.
ECO Tronic EBS diagnostic kit
(BPW no. 99.00.000.9.65)
4.1 Hardware
To connect the ECO Tronic EBS to a standard PC the corresponding diagnostic kit (BPW no. 99.00.000.9.65), containing the
diagnostic adapter, the required connecting cables and a USB
stick with the Trailer Analyser software, is required.
If you already have the ECO Tronic EBS diagnostic kit with the
BPW number 99.00.000.9.64 you only need the Trailer Analyser
accessory kit no. 99.00.000.9.66 with the diagnostic adapter
(PC dongle) for use only with the Trailer Analyser. This Trailer
Analyser diagnostic adapter is the prerequisite for using the
software and constitutes the access authorisation. The software
cannot be opened until the diagnostic adapter is connected.
The diagnostic adapter has a multi-functional LED which shows
the proper function of the device as follows:
Yellow: The diagnostic adapter is connected to the PC and
supplied with power from the USB connection (PC
connection only).
Red:
The ECO Tronic EBS ECU is supplied with 24 V
power and connected to the diagnostic adapter.
Green: The data are being transferred.
Note: During connection the red and green LEDs light up
alternately.
4.2 Software
Note: The software will run only with the connected
diagnostic adapter.
Open the „msi file“ (installation file) for the Trailer Analyser and
follow the instructions on the screen to install the programme.
Note: In order to load the data via the Trailer Analyser from
the ECO Tronic EBS, there must be a connection between the
PC and the EBS. Furthermore, the EBS must be supplied with
power via ISO 7638.
The files are installed in the following PC folder:
C:\Program Files\BPW\Trailer Analyser
This concludes the installation.
Keep the installation software in a safe place in case you need
to install the software again.
To obtain the latest version of the Trailer Analyser, download
this in the required language from the BPW homepage under
www.bpw.de
4
Diagnostic adapter
Trailer Analyser
ISO 7638
Interface unit
USB stick
USB cable
Side wall diagnostic cable for adapter
4 Installation
4.3 Installation options
Option 1
Installation option 1
Connect the ECU via the ISO 7638 7-pin interface connection,
in which pins 6 and 7 serve as a CAN data bus. The required
cables are supplied with the ECO Tronic EBS diagnostic kit for
the Trailer Analyser.
Diagnostic
adapter
ISO interface unit
Installation option 2
Connect the ECU via the terminal on the side of the vehicle
(side wall diagnosis). The cable from the side wall diagnosis
interface to the adapter is supplied in the above diagnostic kit.
Option 2
Alternative positions
(side wall diagnosis)
Diagnostic adapter
Installation option 3
Connect the ECU via a cable (not included in the above
diagnostic kit) from the USB adapter directly to the DIAG
interface of the Modulator. You can then directly access the
ECU.
Supply 24 V power to the EBS system from an external source.
Lower voltages can cause connection problems. The LED on
the adapter must light up in red. If this is not the case, check
the connections and try again.
Option 3
Direct connection to
ECU
Diagnostic
adapter
Diagnostic
connection
“DIAG“ o ECU
5
Trailer Analyser - Operating Instructions
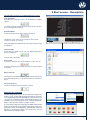
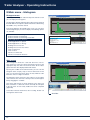
5 Start screen - Description
Starting the programme
Start the Trailer Analyser programme with the icon on the
desktop. The start screen is then displayed.
Note: The programme requires a connected diagnostic adapter.
If the adapter is not connected, a diagnostic adapter fault
message is displayed.
Trailer Analyser
Diagnostic adapter fault message
5 tabs
Elements of the Start screen
Five tabs are located at the top of the monitor for the Trailer
Analyser programme:
Overview, Snapshots, Histogram, Trip Log and User Info.
COM:1
Vehicle data window
The vehicle identification information is displayed in the vehicle
data window.
VIN:
Manufacturer:
Brake Calc:
Unit Type:
VIN:
Manufacturer:
Brake Calc:
Unit Type:
Serial:
Version:
Generation:
Dongle version:
6
Vehicle identification number
Name of trailer manufacturer
Brake calculation number
User defined (manufacturer)
The serial number of the ECU
Software version in the ECU
ECU type
Diagnostic adapter version
BPWV00334YHE27006 Serial:
BPW Version:
WS08 3112.00 Generation:
ZTS 34.20 Dongle Version:
M0666_13
C505
GEN 2
G430
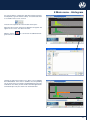
5 Start screen - Description
The following soft keys are available with every screen:
Search for ECU:
If an EBS ECU connection exists via the diagnostic adapter,
click on:
Actual ISO km
Trips
DTC Snapshots
Stability Snapshots
Over Speed Snapshots
Over Load Snapshots
Reservoir Snapshots
B+ Snapshots
24N Brake Applications
ISO Brake Applications
ABS Events
Stability Events
AUX1 Drive Activations
AUX2 Drive Activations
AUX3 Drive Activations
AUX4 Analogue GPI Activations
AUX5 Analogue GPI Activations
The Trailer Analyser programme then automatically searches
for an existing ECU connection.
Read from ECU:
To read out data from the ECU connected, click on:
239270.40
5045
32
14
2
1
0
0
160510
3374
10
1780
12173
0
0
0
BPWV00334YHE27006 Serial:
VIN:
Manufacturer:
This button is only active when an ECU has been found.
(“Search For ECU“ successful).
Brake Calc:
BPW Version:
WS08 3112.00 Generation:
ZTS 34.20 Dongle Version:
Unit Type:
M0666_13
C505
GEN 2
G430
0 0 2 3 9 2 7 0 40
COM:1
Note: If the diagnostic adapter is not connected, a fault message
is displayed.
Load from File:
If ECU data are stored in a file, you can display and analyse
these by clicking on
and selecting a stored file.
Save to File:
To store the data from the connected ECU, in a file, click on:
In general, data previously stored from the ECU can be viewed
at any time.
Export to Excel:
The “Export To Excel“ button allows you to save the data shown
in the Trailer Analyser as a .csv file and to process it further in
Excel.
Exit Trailer Analyser:
To exit the Trailer Analyser programme, click on:
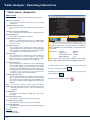
Selecting the language
The BPW Trailer Analyser bar is located at the lower edge of the
monitor screen. Clicking with the right mouse button on this bar
or on the BPW logo in the title bar displays a menu in which you
can select the „Language“ option. The following languages are
available: Czech, Dutch, English, French, German, Hungarian,
Italian, Polish, Russian, Spanish, Swedish, Turkish.
Restore
Move
Restore
Size
Move
Minimize
Size
Maximize
Minimize
Language...
Maximize
Close
Language...
Close
A screen with the flags for the languages available with the Trailer
Analyser is displayed. Clicking on the required flag changes the
programme to the selected language. With Windows Vista and
Windows 7, the language setting is stored only if the user has
administrative authorisation rights.
7
Trailer Analyser - Operating Instructions
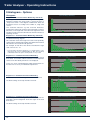
6 Main menu - Overview
Overview
The first tab displays the following information after loading a
data record:
Actual ISO km:
Shows the travel distance, which the trailer has covered
with a connected ISO 7638 supply. Also the total distance
traveled is calculated during which the trailer was attached
to ISO 7638 and 24N brake lights power supply or only to
24N emergency power supply. This is only an approximate
value, as the distance cannot be continuously recorded
without ISO 7638 power supply.
Trips:
A trip describes the transports in which the vehicle reaches
at least 10 km/h and covers a distance of at least 1 km thus
excluding travel over very short distances.
Number of DTC Snapshots*
Number of Stability Snapshots*
Number of Over Speed Snapshots*
Number of Over Load Snapshots*
Number of Reservoir Snapshots*
Number of B+ Snapshots*
- recorded when the voltage limit set is exceeded (default
setting 32 V)
Total number of 24N Brake Applications counted
Total number of ISO Brake Regulations counted
Total number of ABS Events counted
Total number of Stability Events counted
Total number of AUX1 Drive Activations counted
Total number of AUX2 Drive Activations counted
Total number of AUX3 Drive Activations counted
Total number of AUX4 Analogue GPI Activations counted
Total number of AUX5 Analogue GPI Activations counted
Displays the number of activations of the general purpose
inputs (GPI) when these exceed certain values defined in the
Trailer Manager
* See the following page for the definition of snapshot.
8
Actual ISO km
Trips
DTC Snapshots
Stability Snapshots
Over Speed Snapshots
Over Load Snapshots
Reservoir Snapshots
B+ Snapshots
24N Brake Applications
ISO Brake Applications
ABS Events
Stability Events
AUX1 Drive Activations
AUX2 Drive Activations
AUX3 Drive Activations
AUX4 Analogue GPI Activations
AUX5 Analogue GPI Activations
239270.40
5045
32
14
2
1
0
0
160510
3374
14
1780
12173
0
0
0
7 Main menu - Snapshots
Snapshots menu
{ test.fpf }
With the red „Snapshots“ tab at the top of the monitor screen
you can display the snapshots.
Vehicle Speed (km/h)
ISO Demand Pressure (Bar)
Yellow Line Pressure Demand (Bar)
Battery Voltage (V)
Stop Lamp Power (1/0)
LampOn Fault (1/0)
Lamp On (1/0)
Service Request (1/0)
Brake Apply Active (1/0)
Day
Month
Actual ISO km
Reservoir Pressure (Bar)
Suspension Pressure (Bar)
System On Duration (HH:MM:SS)
Definition: Snapshot is understood to mean the recording of
data at a particular moment in time. The recording is triggered
by threshold values previously set in the Trailer Analyser or the
occurring faults. The default values of these thresholds are
described on the following page.
The snapshots only show the most current events.
Peak
87 km/h
87
0.00
0.00
25.00
0
0
0
0
0
215052.41
7.50
6.80
00:04:28
VIN:
Selecting the snapshot type
Manufacturer:
Brake Calc:
Unit Type:
In the menu in the lower third of the monitor screen you can
select the snapshot type that you want to display. The following
options are available:
DTC:
Diagnostic Trouble Codes
Stability snapshots:
Braking events caused by the
Trailer Roll Stability (TRS)
Speed:
A snapshot is recorded (when the
set speed limit is exceeded)
Suspension:
A snapshot is recorded (when the
set load limit is exceeded)
Excessive pressure events
are displayed
Reservoir pressure:
Battery voltage:
01
02
03
04
05
06
07
08
09
10
11
12
13
14
15
16
17
18
19
20
BPWV00334YHE27006 Serial:
BPW Version:
WS08 3112.00 Generation:
ZTS 34.20 Dongle Version:
M0666_13
C505
GEN 2
G430
COM:1
Here over-voltage events are
displayed
Following selection of the required snapshot type, at the right
side of the monitor screen with a list of the available snapshots
is displayed. Selected snapshots are highlighted by flashing
buttons
as well as a coloured background. The
allow navigation through the individual snapshots. The snapshot
selected from this list is displayed in detail on the screen.
A maximum of 32 DTC snapshots and Stability 32 snapshots
can be stored and a maximum of 20 for the other types.
The most recent snapshot is stored under the number 01.
After exceeding the maximum number of snapshots data is
overwritten, beginning with the oldest snapshot.
9
Trailer Analyser - Operating Instructions
7 Main menu - Snapshots
Main screen
Each snapshot is comprised of the following data elements:
Vehicle Speed (km/h)
ISO Demand Pressure (Bar)
Yellow Line Pressure Demand (Bar)
Battery Voltage (V)
Stop Lamp Power (1/0)
LampOn Fault (1/0)
Lamp On (1/0)
Service Request (1/0)
Brake Apply Active (1/0)
Day
Month
Actual ISO km
Reservoir Pressure (Bar)
Suspension Pressure (Bar)
System On Duration (HH:MM:SS)
Vehicle speed (km/h)
The speed of the vehicle at the time of the recording
is indicated.
ISO Demand Pressure (bar)
The control pressure is transmitted via CAN indicated in
bar.
Yellow Line Pressure Demand (bar)
The control pressure of the yellow line is indicated in bar.
Peak
87 km/h
87
0.00
0.00
25.00
0
0
0
0
0
215052.41
7.50
6.80
00:04:28
01
02
03
04
05
06
07
08
09
10
11
12
13
14
15
16
17
18
19
20
Battery Voltage (V)
The voltage of the battery is indicated.
VIN:
Stop Lamp Power (1/0)
When a 1 is indicated the EBS was not supplied with
power via ISO 7368 but via the emergency power supply
(ISO 1185 / 24N).
Lamp-On Fault (1/0)
The recording shows whether the warning light was
activated at the time of the snapshot. If the warning light
was activated a 1 is displayed. The warning light on fault
is activated as soon as an EBS fault occurs.
Lamp On (1/0)
This recording shows whether the warning light was
activated at the time of the snapshot. The warning
light is activated e.g. in the event of insufficient supply
pressure or insufficient power (see also page 22).
Service Request (1/0)
The recording shows whether the service warning light
was activated at the time of the snapshot. The activation
of the warning lights can be allocated in the Trailer
Manager to certain AUX inputs and outputs. This service
warning light is activated if malfunctions of the AUX inputs
or outputs occur or when the service intervals are
exceeded (can be set in the Trailer Monitor).
Brake Apply Active (1/0)
This recording shows whether a brake actuation solenoid
was active at the time of the snapshot. This indicates
whether the electro-pneumatic relay valves (EPRV) of the
EBS were activated and the braking pressure therefore
applied.
Day
For an exact analysis, the day and month of the
Month event are indicated. These are available only if a Trailer
Monitor (with battery) was connected during the
recording.
Actual ISO km
This indicates the kilometre reading at the time of the
recording.
Reservoir Pressure (bar)
This indicates the air pressure in the reservoir tank.
Suspension Pressure (bar)
This indicates the bellows pressure in the air bags.
System On Duration
This indicates how long the system was supplied with power
(HH:MM:SS).
Remark:
1 = yes (activated)
0 = no (not activated)
10
BPWV00334YHE27006 Serial:
BPW Version:
Manufacturer:
WS08 3112.00 Generation:
Brake Calc:
ZTS 34.20 Dongle Version:
Unit Type:
M0666_13
C505
GEN 2
G430
0 0 2 1 5 0 5 2 41
COM:1
The speed, suspension, reservoir pressure and battery
voltage snapshots are recorded when a certain limit value
is exceeded.
Default values:
Speed:
Suspension:
Reservoir Pressure:
Battery Voltage:
100 km/h
130 %
9.75 bar
32 V
These values can be changed or adapted via the Trailer
Analyser with an ECU connected and supplied with power.
To adapt a value, enter the desired new value in the entry field
and click on the pencil symbol
.
Following successful transmission to the ECU, a green check
mark is displayed
.
Otherwise, a red symbol is displayed
.
7 Main menu - Snapshots
When you have selected a snapshot, clicking the „Hyperlink“
button
occured.
{ test.fpf }
switches to the trip in which the snapshot
DTC
WHEEL SENSOR 1A OUTPUT LEVEL
Vehicle Speed (km/h) 7
ISO Demand Pressure (Bar) 0.00
Yellow Line Pressure Demand (Bar) 0.00
Battery Voltage (V) 27.80
Stop Lamp Power (1/0) 0
LampOn Fault (1/0) 1
Lamp On (1/0) 0
Service Request (1/0) 0
Brake Apply Active (1/0) 0
Day Month Actual ISO km 238585.00
Reservoir Pressure (Bar) 6.65
Suspension Pressure (Bar) 4.95
System On Duration (HH:MM:SS) 00:01:05
This trip is featured in the trip sheet records in color. The mark
. Account must be taken,
may be reversed by the button
however, that only the last 1000 trips are stored (see Trip Log
chapter).
VIN:
01
02
03
04
05
06
07
08
09
10
11
12
13
14
15
16
17
18
19
20
21
22
23
24
25
26
27
28
29
30
31
32
BPWV00334YHE27006 Serial:
Manufacturer:
M0666_13
BPW Version:
Brake Calc:
C505
WS08 3112.00 Generation:
Unit Type:
GEN 2
ZTS 34.20 Dongle Version:
G430
COM:1
{ test.fpf }
Trips : ( 5045 )
Start Mileage (km)
250000 237851 237852 237924 237996 238175 238231 238351 238464 238585 238642 238709 238828 238946 238947 239064 239183 239251 239254 239259 239261
225000
200000
Start Mileage (km)
175000
150000
125000
100000
75000
50000
25000
0
0
9
8
1
0
9
8
2
0
9
8
3
0
9
8
4
0
9
8
5
0
9
8
6
0
9
8
7
0
9
8
8
0
9
8
9
0
9
9
0
0
9
9
1
0
9
9
2
VIN:
Manufacturer:
Brake Calc:
Unit Type:
0
9
9
3
0
9
9
4
0
9
9
5
0
9
9
6
0
9
9
7
0
9
9
8
BPWV00334YHE27006 Serial:
BPW Version:
WS08 3112.00 Generation:
ZTS 34.20 Dongle Version:
0
9
9
9
1
0
0
0
M0666_13
C505
GEN 2
G430
COM:1
11
Trailer Analyser - Operating Instructions
8 Main menu - Histogram
Histogram menu
{ test.fpf }
With the green „Histogram“ tab at the top of the monitor screen
you can display the histograms.
Brake Applications vs Pressure
test.fpf
80000
76165
72000
The histograms display important data collected over the life of
the EBS. With the exception of „Brake Performance Monitoring,
Resettable“, they cannot be erased.
64000
Brake Applications
56000
In the menu display in the middle of the screen, you can select
which histogram type you want to display. The following options
are available:
48000
40000
36218
32000
24000
22134
16000
13235
8134
8000
2828
61
0
0.5
1.0
1.5
2.0
2.5
3.0
3.5
836
322
111
53
84
140
378
330
13
4.0
4.5
5.0
5.5
6.0
6.5
7.0
7.5
8.0
Pressure (Bar)
Road Condition Monitoring
Brake Performance Monitoring
Brake Performance Monitoring, Resettable
Brake Applications vs Pressure
Brake Applications vs Speed
Brake Applications vs Energy
Braking Time vs Pressure
Braking Time vs Pressure, Hi-Res
Time vs Side Force
Time vs Aux 4
Distance vs Axle Load
Distance vs Reservoir Pressure
Brake Applications vs Pressure
Road Condition Monitoring
Brake Performance Monitoring
Brake Performance Monitoring, Resettable
Brake Applications vs Pressure
Brake Applications vs Speed
Brake Applications vs Energy
Braking Time vs Pressure
Braking Time vs Pressure, Hi-Res
Time vs Side Force
Time vs Aux 4
Distance vs Axle Load
Distance vs Reservoir Pressure
BPWV00334YHE27006 Serial:
M0666_13
BPW Version:
C505
WS08 3112.00 Generation:
GEN 2
ZTS 34.20 Dongle Version:
G430
Main screen
The histograms divide the collected data into classes,
each shown by a bar. The values beneath the bar show the
appropriate top class limit. The last bar shows all the values
greater than the value displayed beneath the bar.
{ test.fpf }
Brake Applications vs Pressure
test.fpf
850
13235
76165
36218
22134
8134
2828
836
765
By using the scrollbar on the left-hand side, you can scale the
histogram down, step by step, to the next lowest bar. In this
way, you can view lower values, which are only visible as a thin
bar in the chart, at a higher resolution.
680
Brake Applications
595
The right-hand chart shows the same values as in the above
chart. However, the chart was scaled up to the seventh-highest
bar by dragging the scroll bar.
510
425
378
340
170
140
111
85
84
61
53
13
0
0.5
1.0
1.5
2.0
2.5
3.0
3.5
4.0
4.5
5.0
5.5
6.0
6.5
7.0
7.5
8.0
Pressure (Bar)
This means that this bar is shown perfectly in the chart. The
bars around the 7.5 bar mark, which can hardly be told apart
in the top chart, are now easily visible and can be compared
graphically.
VIN:
Manufacturer:
Brake Calc:
Unit Type:
COM:1
A red value in the bar means that, due to scaling, the bar can
no longer be shown in full.
Scroll bar
12
330
322
256
BPWV00334YHE27006 Serial:
BPW Version:
WS08 3112.00 Generation:
ZTS 34.20 Dongle Version:
M0666_13
C505
GEN 2
G430
8 Main menu - Histogram
It is also possible to compare the data with another, previously
stored fpf file (e.g. from another vehicle). To load the data from
a second file to the screen, click on:
{ test.fpf }
Brake Applications vs Pressure
Brake Applications
test.fpf
and select the required file in the window which opens.
60000
54000
48000
42000
36000
30000
24000
18000
12000
6000
0
56438
28475
17625
10303
6588
44
0.5
1.0
1.5
2.0
2.5
3.0
2274
3.5
688
249
85
41
68
112
316
282
12
4.0
4.5
5.0
5.5
6.0
6.5
7.0
7.5
8.0
test.fpf
With the soft key
gram from the screen.
Brake Applications
When the file has been opened, two different histograms will
appear on the screen, one above the other.
you can remove the additional histo-
80000
72000
64000
56000
48000
40000
32000
24000
16000
8000
0
76165
36218
22134
13235
8134
61
0.5
1.0
1.5
2.0
2.5
3.0
2828
836
322
111
53
84
140
378
330
13
3.5
4.0
4.5
5.0
5.5
6.0
6.5
7.0
7.5
8.0
Pressure (Bar)
BPWV00334YHE27006 Serial:
VIN:
M0666_13
BPW Version:
Manufacturer:
C505
WS08 3112.00 Generation:
Brake Calc:
GEN 2
ZTS 34.20 Dongle Version:
Unit Type:
G430
COM:1
Clicking the right mouse button once allows you to highlight
the individual bars of the chart. In addition, the corresponding
x and y values (here, for example controlled brake pressure (top
and bottom class limits) and the number of brake applications
at this brake pressure) are shown in an information box.
{ test.fpf }
Brake Applications vs Pressure
test.fpf
80000
76165
72000
64000
Brake Applications
56000
48000
40000
36218
32000
Pressure (Bar) 1.5 2.0
Brake Applications 36218
24000
22134
16000
13235
8134
8000
2828
0
61
0.5
1.0
1.5
2.0
2.5
3.0
3.5
836
322
111
53
84
140
378
330
13
4.0
4.5
5.0
5.5
6.0
6.5
7.0
7.5
8.0
Pressure (Bar)
VIN:
Manufacturer:
Brake Calc:
Unit Type:
BPWV00334YHE27006 Serial:
BPW Version:
WS08 3112.00 Generation:
ZTS 34.20 Dongle Version:
M0666_13
C505
GEN 2
G430
COM:1
13
Trailer Analyser - Operating Instructions
9 Histogram - Options
Histograms
Road Condition Monitoring
test.fpf
90000
70000
This evaluation indicates e.g. that for 92781 kilometres
travelled, 0-5 rough road counts/km were registered. For 20713
kilometres, 5-10 rough road counts/km were registered. A low
number of rough road counts/km indicates that the vehicle was
operating on-road.
50000
40000
30000
20713
10000
6133
0
0
5
10
2252
1155
572
15
20
25
306
170
98
38
17
12
7
6
0
0
30
35
40
45
50
55
60
65
70
75
Rough Road Count / km
Road Condition Monitoring
test.fpf
900
848
810
720
630
Distance (km)
For example, for 160 km of the distance travelled the rough
road count was 30 - 35.
60000
20000
Diagram no. 1-2: Road Condition Monitoring / Off-Road*
This graph is another example of possible data in a Road
Condition Monitoring diagram.
This evaluation shows that rough road counts were repeatedly
registered for a relatively high number of the kilometres travelled.
This indicates increased off-road operation.
92781
80000
Distance (km)
Diagram no. 1-1: Road Condition Monitoring / On-Road*
This diagram shows the number of registered rough road
kilometres. Driving over rough roads is counted in terms of
„rough road counts“. In the diagram, all kilometres driven are
divided into classes according to the number of „rough road
counts“.
100000
540
452
450
373
360
266
270
257
238
193
180
160
131
120
106
98
35
40
45
50
90
* Road Condition Monitoring algorithm is not implemented in some
regional specific versions of BPW ECO Tronic EBS, thus rendering
of RCM data within histograms and trip details is not possible.
0
5
10
15
20
25
30
62
55
59
55
60
65
70
75
Rough Road Count / km
Diagram no. 2-1: Brake Performance Monitoring
The translucent green background represents the range of ECE
brake band. The number of brake actuations and their position
relative to the ECE brake performance are displayed.
Brake Performance Monitoring
test.fpf
7947
8000
7200
7670
6897
6400
Brake Applications
5600
In this case, most of the braking lies within the ECE band. It is
therefore not necessary to make brake adjustments.
77
0
5530
4800
4469
4000
3255
3200
2412
2400
1689
1600
1085
800
0
130
165
1
2
808
414
3
404
4
5
6
7
8
9
10
11
12
13
14
190
265
15
16
Decel Ratio Band
Diagram no. 2-2: Brake Performance Monitoring
In this case most of the braking lies outside the ECE band.
Brake Performance Monitoring
test.fpf
600
574
570
540
The brake settings and setup should be checked.
524
499
491
480
421
Brake Applications
420
382
360
300
240
211
180
113
120
60
47
19
7
3
2
0
2
11
12
13
14
15
16
0
1
2
3
4
5
6
7
8
9
10
Decel Ratio Band
Diagram no. 2-3: Brake Performance Monitoring
In this case part of the braking lies outside the ECE band. The
area with a green background shows the region of the ECE
brake band.
Brake Performance Monitoring
test.fpf
700
630
607
Brake Applications
420
412
395
350
319
280
261
210
131
140
70
0
56
0
0
1
1
12
1
2
3
4
5
12
6
7
8
9
Decel Ration Band
14
506
495
490
The brake settings and setup should be checked.
626
560
10
11
12
13
14
15
16
9 Histogram - Options
Brake Performance Monitoring, Resettable
test.fpf
9000
8017
8100
7200
5572
5400
4503
4500
3600
3276
2700
2425
1702
1800
The soft key for resetting the diagram is displayed
only with the EBS connected and supplied with power.
1100
900
0
130
169
1
2
814
417
3
406
4
5
Note: Diagram no. 2 cannot be erased and displays the data
over the entire life of the EBS.
6
7
8
9
10
11
12
13
14
194
268
15
16
Decel Ratio Band, Resettable
Brake Applications vs Pressure
test.fpf
80000
76165
72000
64000
56000
Brake Applications
Diagram no. 4: Brake Applications vs Pressure
With each application, the brake control pressure provided
via ISO 7368 or the yellow line is recorded. The diagram
displays the number of brake actuations in each of the
0.5 bar pressure intervals from 0 to 8 bar. Brake actuations
with a pressure of more than 8 bar are also stored in the last
class (8 bar).
7727
6949
6300
Brake Applications
Diagram no. 3: Brake Performance Monitoring
This evaluation is similar to diagram no. 2, however with the
possibility to reset and store new data. This tool is used e.g.
when changing tractor units to evaluate new data. Resetting
this function defines a new start point for recording new data.
Already recorded data is lost with this function and available only
via the usual Brake Performance Monitoring function.
48000
40000
36218
32000
24000
22134
16000
13235
8134
8000
0
2828
61
0.5
1.0
1.5
2.0
2.5
3.0
3.5
836
4.0
322
4.5
111
53
84
140
378
330
13
5.0
5.5
6.0
6.5
7.0
7.5
8.0
Pressure (Bar)
Brake Applications vs Speed
test.fpf
40000
36000
32000
30574
28000
Brake Applications
Diagram no. 5: Brake Applications vs Speed
With each application, the speed at the beginning of braking is
recorded. The diagram displays the number of brake actuations
at different start speeds. Recording takes place in 10 km/h steps
from 0 to 160 km/h.
24000
21249
22526
23591
20235
20000
16000
13522
12000
10108
8000
5724
6132
10
20
6980
4000
0
30
40
50
60
70
80
90
100
74
0
0
0
0
0
110
120
130
140
150
160
Speed (km/h)
Diagram no. 6: Brake Actuations vs Energy
The braking energy is estimated on the basis of the chassis load
and the deceleration during braking.
Brake Applications vs Energy
test.fpf
70000
68932
63000
56000
Brake Applications
49000
42000
35000
28000
21000
18750
14000
7000
5546
2903
1677
979
570
433
240
182
113
46
47
12
5
1
2.0
2.5
3.0
3.5
4.0
4.5
5.0
5.5
6.0
6.5
7.0
7.5
8.0
0:06
0:11
0:37
0:42
0:01
6.0
6.5
7.0
7.5
8.0
0
0.5
1.0
1.5
Brake Energy (MJ)
Diagram no. 7: Braking Time vs Braking Pressure
The duration of each application is measured in order to update
the total braking time for each control pressure. The diagram
displays the cumulative braking time in 0.5 bar steps from
0 to 8 bar.
Braking Time vs Pressure
test.fpf
50.0
45.0
47:11
48:37
44:32
40.0
35.0
Time (hours)
30.0
25.0
20.0
21:10
15.0
10.0
7:42
5:09
5.0
2:14
0.0
0:00
0.5
1.0
1.5
2.0
2.5
3.0
3.5
4.0
0:48
0:17
4.5
5.0
0:06
5.5
Pressure (Bar)
15
Trailer Analyser - Operating Instructions
9 Histogram - Options
Diagram no. 8: Braking Time vs Pressure (high resolution)
The diagram displays the total braking time for different
pressures over the range from 0 to 3.4 bar with a higher
resolution over a smaller range than for diagram 7.
Braking Time vs Pressure, Hi-Res
test.fpf
25.0
22.5
21:35
20:39
20.0
20:25
19:42
18:05
17.5
17:24
Time (hours)
15.0
13:57
13:03
12.5
10.0
9:40
7.5
6:21
5.0
4:13
4:04
2.5
1:41
0:49
0.0
0:00
0:05
0.4
0.6
0.8
1.0
1.2
1.4
1.6
1.8
2.0
2.2
2.4
2.6
2.8
3.0
3.2
3.4
Pressure (Bar)
Diagram no. 9: Time vs Side Force
The side force of the wheels is calculated on the basis of the
chassis load and the lateral acceleration (if available). For this
purpose the data taken from the lateral acceleration sensor and
the bellows pressure is evaluated.
Time vs Side Force
test.fpf
600.0
566:27
540.0
480.0
420.0
Time (hours)
360.0
300.0
240.0
180.0
120.0
118:25
60.0
25:52
13:04
7:12
3:17
0:45
0:00
0:00
0:00
0:00
0:00
0:00
0:00
0:00
0:00
30
40
50
60
70
80
90
100
110
120
130
140
150
160
0
10
20
Side Force (KN)
Time vs AUX 4
test.fpf
200
00:03:16
180
160
140
Time (seconds)
Diagram no. 10: Time vs AUX 4
This diagram records the voltage at the input AUX 4 as a
function of time. The possible configurations at AUX 4 are:
- Lining Wear Sensor
- General Purpose Input (GPI)
- Control Line Sensor
- Soft Docking
- Mechanical Height Sensor (leaf spring position sensor)
120
100
00:01:32
80
60
40
In this example, AUX 4 was parameterised as a „General
Purpose Input“ and a simple switch (with states „on“ (5 V) /
„off“ (0 V)) connected.
00:00:00 00:00:00 00:00:00 00:00:00 00:00:00 00:00:00 00:00:00 00:00:00 00:00:00 00:00:00 00:00:00 00:00:00 00:00:00 00:00:00
0
312
625
937
1250
1562
1875
2187
2500
2812
3125
3437
3750
4062
4375
4687
5000
59
32
30
32
ADC Value (mV)
Distance vs Axle Load
test.fpf
65000
63920
58500
52000
46732
45500
Distance (km)
Diagram no. 11: Distance vs Axle Load
This diagram displays the loading in relation to distance. After
each kilometre travelled the bellows pressure is monitored.
The axle load is calculated from the bellows pressure, using
the ELS (Electronic Load Sensing) brake parameters stored in
the ECU by the Trailer Manager. The result is a „load profile“,
as displayed in the diagram.
20
39000
32500
26000
19500
13000
6311
6500
0
0
241
2
4
6
731
552
323
238
297
123
109
300
8
10
12
14
16
18
20
22
24
4583
26
28
Load (1000 kg)
Diagram no. 12: Distance vs Reservoir Pressure
This diagram displays changes in the reservoir pressure over
the course of travel. The reservoir pressure is recorded after
each kilometre travelled in 0.5 bar steps.
Distance vs Reservoir Pressure
test.fpf
70000
68776
63000
55513
56000
Distance (km)
49000
42000
35000
28000
21000
14000
7000
0
0
0
0
0
0
0
3.0
3.5
4.0
4.5
5.0
5.5
5
16
160
6.0
6.5
7.0
Reservoir Pressure (Bar)
16
7.5
8.0
1
0
0
0
0
8.5
9.0
9.5
10.0
10.5
10 Main menu - Trip Logs
Trip Logs
{ test.fpf }
With the blue „Trip Log“ tab at the top of the monitor screen
you can display the transport protocols.
Trips : ( 5045 )
Start Mileage (km)
250000
Trips: The transport runs in which the vehicle reaches at least
10 km/h and covers a distance of at least 1 km, excluding
travel over very short distances.
225000
221925 222022 222098 222127 222189 222200 222216 222222 222256 222270 222321 222359 222454 222466 222476 222578 222593 222652 222654 222723
200000
Start Mileage (km)
175000
A maximum of 1000 trips is stored. After exceeding the maximum
number of trips, the older ones are overwritten. Therefore
numbers greater than 1000 can be displayed at the upper edge
of the screen and in the Trip Info Box.
Irrespective of this, the first 1000 trips are always numbered from
0001 to a maximum of 1000 at the lower edge of the screen.
150000
125000
100000
75000
50000
25000
0
4
6
9
3
4
6
9
4
4
6
9
5
4
6
9
6
4
6
9
7
4
6
9
8
4
6
9
9
4
7
0
0
4
7
0
1
4
7
0
2
4
7
0
3
4
7
0
4
4
7
0
5
4
7
0
7
4
7
0
8
4
7
0
9
4
7
1
0
4
7
1
1
BPWV00334YHE27006 Serial:
VIN:
Main screen
In the menu in the lower section of the monitor screen you can
select the trip variable you want to display.
4
7
0
6
4
7
1
2
M0666_13
BPW Version:
Manufacturer:
C505
WS08 3112.00 Generation:
Brake Calc:
GEN 2
ZTS 34.20 Dongle Version:
Unit Type:
G430
COM:1
The following options are available:
Selection menu
Trips : ( 5045 )
Start Mileage (km)
250000
225000
221925 222022 222098 222127 222189 222200 222216 222222 222256 222270 222321 222359 222454 222466 222476 222578 222593 222652 222654 222723
200000
175000
Start Mileage (km)
Start Mileage (km)
Date
Trip Distance (km)
Trip Distance with Axle Lifted (km)
Brake Demand Average (Bar)
Brake Applications
Brake Applications 24N
Speed Average (km/h)
Speed Max (km/h)
Stability Events
ABS Events
Axle Load Average (kg)
Axle Load Maximum (kg)
Reservoir Pressure Min (Bar)
Reservoir Pressure Max (Bar)
Trip Duration (minutes)
Lift Axle - Number of Operations (from Version C505)
Steer Axle - Number of Operations (from Version C505)
Warning Lamp Ignored (minutes) (from Version C505)
Residual Pressure Time (minutes)
Rough Road Count / km*
Event Codes
150000
125000
100000
75000
50000
25000
0
4
6
9
3
4
6
9
4
4
6
9
5
4
6
9
6
4
6
9
7
4
6
9
9
4
7
0
0
4
7
0
1
4
7
0
2
4
7
0
3
4
7
0
4
4
7
0
5
4
7
0
6
4
7
0
7
4
7
0
8
4
7
0
9
4
7
1
0
4
7
1
1
4
7
1
2
Trips : ( 5045 )
Start Mileage (km)
222200 222216 222222 222256 222270 222321 222359 222454 222466 222476 222578 222593 222652
4700
Clicking and holding down the left mouse button displays the
cursor as a hand. With the hand cursor you can drag the screen
display to the left or right in order to see all the stored data.
Clicking with the right mouse button on a trip bar displays a trip
summary (Trip Info Box). Clicking again removes this display.
The selected bar is given a coloured background.
4
6
9
8
4
6
9
8
4
6
9
9
4
7
0
0
4
7
0
1
Start Mileage (km)
Date
Trip Distance (km)
Trip Distance with Axle Lifted (km)
Brake Demand Average (Bar)
Brake Applications
Brake Applications 24N
Speed Average (km/h)
Speed Max (km/h)
Stability Events
ABS Events
Axle Load Average (kg)
Axle Load Maximum (kg)
Reservoir Pressure Min (Bar)
Reservoir Pressure Max (Bar)
Trip Duration (minutes)
Residual
Pressure
Time
(minutes)
4
4
4
4
Rough
Road
7
7
7 Count7 / km
0
0
0Event Codes
0
2
3
4
5
222222.71
223
107
1.20
230 239
0
73
96
0
0
15100
27000
6.20
8.55
180 189
40
4
72.75
7
00
0
6
7
4
7
0
8
4
7
0
9
4
7
1
0
Note: It is possible that not all variables are available on all
systems, for example the date only with the Trailer Monitor
connected, stability events only with existing stability sensor
and lift axle information only when a lift axle is present.
* Road Condition Monitoring algorithm is not implemented in some
regional specific versions of BPW ECOTronic EBS, thus rendering of
RCM data within histograms and trip details is not possible.
17
Trailer Analyser - Operating Instructions
11 Trip Log - Options
Trip Logs - Diagrams
250000
225000
221925 222022 222098 222127 222189 222200 222216 222222 222256 222270 222321 222359 222454 222466 222476 222578 222593 222652 222654 222723
200000
175000
Start Mileage (km)
Diagram no. 1: Start Mileage (km)
This diagram displays the kilometre reading at the beginning
of a trip. The total number of trips recorded is shown above
the diagram title.
Trips : ( 5045 )
Start Mileage (km)
150000
125000
100000
75000
50000
25000
0
4
6
9
3
4
6
9
4
4
6
9
5
4
6
9
6
4
6
9
7
4
6
9
8
4
6
9
9
4
7
0
0
4
7
0
1
4
7
0
2
Example of kilometre
reading at the beginning
of trip 4703 with the Trip
Info Box (trip summary).
4
7
0
4
4
7
0
5
4
7
0
6
4
7
0
7
4
7
0
8
4
7
0
9
4
7
1
0
4
7
1
1
4
7
1
2
4703
222321.81
Start Mileage (km)
Date
70.00
Trip Distance (km)
69.00
Trip Distance with Axle Lifted (km)
1.20
Brake Demand Average (Bar)
30
Brake Applications
0
Brake Applications 24N
67
Speed Average (km/h)
85
Speed Max (km/h)
0
Stability Events
1
ABS Events
4200
Axle Load Average (kg)
4716
Axle Load Maximum (kg)
7.00
Reservoir Pressure Min (Bar)
8.45
Reservoir Pressure Max (Bar)
61
Trip Duration (minutes)
4
4
4Pressure4 Time (minutes)
4 0
4
Residual
7
7
7
7Rough Road
7
7
2
Count / km
0 Event0 Codes 0 0
0
0
1
4
7
0
4
Diagram no. 2: Date
This diagram displays the date of the trip. The date is recorded
only with the Trailer Monitor (battery) installed. In this example,
no Trailer Monitor was connected for trips 25, 32 and 44.
4
7
0
3
5
7
6
8
9
0
Trips : ( 5045 )
Date
30
30
27
24
24
24
24
25
30
30
30
30
30
30
25
22
21
Date
18
15
12
09
7
7
0
0
4
1
0
0
4
2
06
3
4
4
0
0
3
9
0
0
4
0
03
0
0
0
0
2
5
0
0
2
6
0
0
2
7
0
0
2
8
0
0
2
9
0
0
3
0
Diagram no. 3: Trip Distance (km)
This diagram displays the trip distance in km for each trip.
0
0
3
1
0
0
0
3
2
0
0
3
3
0
0
3
4
0
0
3
5
0
0
3
6
0
0
3
7
0
0
3
8
0
0
4
3
0
0
4
4
Trips : ( 5045 )
Trip Distance (km)
250
225
200
Trip Distance (km)
175
150
133
125
100
88
50
50
0
0
0
4
6
0
0
4
7
15
15
0
0
4
8
0
0
4
9
0
0
5
0
0
0
5
1
3
7
0
0
5
2
0
0
5
3
26
30
0
0
5
4
0
0
5
5
29
0
0
6
0
0
0
6
1
18
17
8
0
0
5
6
0
0
5
7
0
0
5
8
0
0
5
9
0
0
6
2
0
0
6
3
0
0
6
4
0
0
6
5
Trips : ( 5045 )
250
225
200
175
150
125
100
82
69
75
60
48
50
30
28
25
29
17
15
0
0
18
31
Trip Distance with Axle Lifted (km)
Trip Distance with Axle Lifted (km)
Diagram no. 4: Trip Distance with Axle Lifted (km)
This diagram displays the trip distance with lift axle raised in
km for each trip.
10
61
49
28
25
83
70
75
0
0
4
6
0
0
0
4
7
0
0
4
8
0
0
0
4
9
0
0
5
0
0
0
5
1
3
0
0
0
0
5
2
0
0
5
3
0
0
5
4
2
0
0
5
5
0
0
5
6
0
0
0
5
7
0
0
5
8
0
0
0
5
9
0
0
6
0
0
0
0
6
1
0
0
6
2
0
0
0
6
3
0
0
6
4
0
0
6
5
11 Trip Log - Options
Trips : ( 5045 )
Brake Demand Average (Bar)
5,00
4,50
Brake Demand Average (Bar)
Diagram no. 5: Brake Demand Average (bar)
This diagram displays the mean value of the control pressure
transmitted via the ISO 7368 or the yellow line from the tractor
vehicle to the trailer.
4,00
3,50
3,00
2,50
2,00
1,50
1.80
1.40
1.40
1.20
1.50
1.30
1.30
1.40
1.30
1.30
1.00
1.10
1.20
1.20
0
0
5
6
0
0
5
7
0
0
5
8
1.30
1.40
1.20
1.20
1.10
1.10
0
0
6
1
0
0
6
2
0
0
6
3
0
0
6
4
0
0
6
5
159
159
150
150
47
39
45
0
2
8
5
0
2
8
6
0
2
8
7
0
2
8
8
1,00
0,50
0
0
0
4
7
0
0
4
8
0
0
4
9
0
0
5
0
0
0
5
1
0
0
5
2
0
0
5
3
0
0
5
4
0
0
5
5
0
0
6
0
Trips : ( 5045 )
450
405
360
315
229
270
220
225
159
180
189
180
150
135
78
90
45
43
54
55
37
38
28
22
4
0
0
2
6
9
0
2
7
0
0
2
7
1
0
2
7
2
0
2
7
3
0
2
7
4
0
2
7
5
23
24
0
2
8
1
0
2
8
2
0
2
8
3
0
2
8
4
3
0
2
7
6
0
2
7
7
0
2
7
8
0
2
7
9
0
2
8
0
Trips : ( 5045 )
Brake Applications 24N
10
09
Brake Applications 24N
Diagram no. 7: Brake Applications 24N
If the EBS is not supplied with power via ISO 7638, no trips are
recorded. When emergency power is available (via ISO 1185),
the 24N brake applications are displayed in the next recorded
trip when the EBS is again supplied with power via ISO 7638.
0
0
5
9
Brake Applications
Brake Applications
Diagram no. 6: Brake Applications
This diagram displays the number of brake applications per
trip. For higher numbers of brake applications a value range
is specified. E.g. for trip 0277, 220 - 229 brake applications
were recorded.
0
0
4
6
08
07
06
05
4
04
3
03
02
01
0
Diagram no. 8: Speed Average (km/h)
This diagram displays the mean speed for each trip.
0
0
0
0
0
0
0
6
0
0
0
7
0
0
0
8
0
0
0
9
0
0
1
0
0
0
0
0
0
0
0
1
1
0
0
1
2
0
0
1
3
0
0
1
4
0
0
1
5
0
0
1
6
0
0
0
0
0
0
0
0
0
0
0
1
7
0
0
1
8
0
0
1
9
0
0
2
0
0
0
2
1
0
0
2
2
0
0
2
3
0
0
2
4
0
0
2
5
Trips : ( 5045 )
Speed Average (km/h)
80
73
72
64
68
68
67
64
63
65
67
64
60
57
55
56
Speed Average (km/h)
67
53
53
51
4
48
44
41
40
36
32
24
24
16
08
0
0
1
2
2
0
1
2
3
0
1
2
4
0
1
2
5
0
1
2
6
0
1
2
7
Diagram no. 9: Speed Max (km/h)
0
1
2
8
0
1
2
9
0
1
3
0
0
1
3
1
0
1
3
2
0
1
3
3
0
1
3
4
0
1
3
5
0
1
3
6
0
1
3
7
84
86
88
0
1
3
8
0
1
3
9
0
1
4
0
0
1
4
1
Trips : ( 5045 )
Speed Max (km/h)
This diagram displays the maximum speed for each trip.
150
135
120
Speed Max (km/h)
105
90
88
84
88
85
89
88
88
87
86
85
85
89
73
75
89
86
8
70
62
60
45
30
15
0
0
1
2
2
0
1
2
3
0
1
2
4
0
1
2
5
0
1
2
6
0
1
2
7
0
1
2
8
0
1
2
9
0
1
3
0
0
1
3
1
0
1
3
2
0
1
3
3
0
1
3
4
0
1
3
5
0
1
3
6
0
1
3
7
0
1
3
8
0
1
3
9
0
1
4
0
0
1
4
1
19
Trailer Analyser - Operating Instructions
11 Trip Log - Options
Diagram no. 10: Stability Events
This diagram displays the number of brake actuations regulated
by the EBS stability function for each trip.
Trips : ( 5045 )
Stability Events
5
05
4
04
3
Stability Events
03
2
02
01
1
1
1
0
7
2
0
0
7
2
1
0
7
2
2
2
Diagram no. 11: ABS Events
This diagram displays the number of ABS-regulated brake
actuations for each trip.
2
1
0
00
2
0
7
2
3
0
7
2
4
0
7
2
5
0
7
2
6
0
0
7
2
7
0
7
2
8
0
7
2
9
0
7
3
0
0
0
0
0
7
3
1
0
7
3
2
0
7
3
3
0
7
3
4
0
0
0
0
7
3
5
0
7
3
6
0
7
3
7
0
0
7
3
8
0
7
3
9
Trips : ( 5045 )
ABS Events
20
18
16
14
ABS Events
12
10
08
7
06
04
3
3
3
2
02
2
3
2
2
1
0
1
1
2
0
1
1
3
0
1
1
4
2
1
0
0
0
1
1
5
0
1
1
6
Diagram no. 12: Axle Load Average (kg)
This diagram displays the mean axle load for each trip.
0
1
1
7
0
1
1
8
0
1
1
9
0
1
2
0
2
1
0
0
1
2
1
1
0
0
1
2
2
0
1
2
3
0
0
1
2
4
0
1
2
5
0
1
2
6
0
1
2
7
0
0
1
2
8
0
1
2
9
0
1
3
0
0
1
3
1
Trips : ( 5045 )
Axle Load Average (kg)
30000
27000 25700
26100
25700
24900
Axle Load Average (kg)
24300
23800
24000
23400
2
23400
21000
18000
15000
12000
9000
6000
4300
4200
4200
4300
0
1
1
5
0
1
1
6
0
1
1
7
4500
4200
4200
4300
0
1
2
3
0
1
2
4
4700
4200
4200
4300
0
1
3
0
0
1
3
1
3000
0
0
1
1
2
0
1
1
3
0
1
1
4
Diagram no. 13: Axle Load Maximum (kg)
This diagram displays the maximum axle load for each trip.
0
1
1
8
0
1
1
9
0
1
2
0
0
1
2
1
0
1
2
2
0
1
2
5
0
1
2
6
0
1
2
7
0
1
2
8
0
1
2
9
Trips : ( 5045 )
Axle Load Maximum (kg)
36000
32346
Axle Load Maximum (kg)
32400
28800 27972
27243
27243 27243
27486
27243
26271
25542
26514
25200
21600
18000
14400
10800
8
7200
4878
4644
4878
5040
0
0
5
1
0
0
5
2
4716
5130
4716
4554 5130
4716
3600
0
20
0
0
4
6
0
0
4
7
0
0
4
8
0
0
4
9
0
0
5
0
0
0
5
3
0
0
5
4
0
0
5
5
0
0
5
6
0
0
5
7
0
0
5
8
0
0
5
9
0
0
6
0
0
0
6
1
0
0
6
2
0
0
6
3
0
0
6
4
0
0
6
5
11 Trip Log - Options
Diagram no. 14: Reservoir Pressure Min (bar)
Displays the minimum air pressure (bar) in the reservoir.
Trips : ( 5045 )
Reservoir Pressure Min (Bar)
10.00
9.00
8.00
Reservoir Pressure Min (Bar)
7.15
7.35
6.90
7.00
7.15
6.85
6.40
7.10
7.10
7.30
7.40
7.50
7.20
7.30
6.85
7.30
7.05
6.45
6.20
6.20
6.00
4.80
5.00
4.00
3.00
2.00
1.00
0
0
0
7
8
Diagram no. 15: Reservoir Pressure Max (bar)
Displays the maximum air pressure (bar) in the reservoir per trip;
in this example, trip 0046 displays a too high reservoir pressure.
0
0
7
9
0
0
8
0
0
0
8
1
0
0
8
2
0
0
8
3
0
0
8
4
0
0
8
5
0
0
8
6
0
0
8
7
0
0
8
8
0
0
8
9
0
0
9
0
0
0
9
1
0
0
9
2
0
0
9
3
0
0
9
4
0
0
9
5
0
0
9
6
0
0
9
7
8.50
8.50
8.60
0
0
6
3
0
0
6
4
0
0
6
5
Trips : ( 5045 )
Reservoir Pressure Max (Bar)
10.00
9.00
8.80
8.50
8.45
8.55
8.45
8.50
8.40
8.40
8.55
8.50
8.50
8.45
8.65
8.50
8.50
8.50
0
0
4
7
0
0
4
8
0
0
4
9
0
0
5
0
0
0
5
1
0
0
5
2
0
0
5
3
0
0
5
4
0
0
5
5
0
0
5
6
0
0
5
7
0
0
5
8
0
0
5
9
0
0
6
0
0
0
6
1
8.70
Reservoir Pressure Max (Bar)
8.00
7.00
6.00
5.00
4.00
3.00
2.00
1.00
0
0
0
4
6
Trips : ( 5045 )
Trip Duration (minutes)
200
180
Trip Duration (minutes)
Diagram no. 16: Trip Duration (minutes)
The diagram displays the duration of the trips in minutes.
For longer trips a value range is given. E.g. for trip 0062, a trip
duration of 110 - 119 minutes has been recorded.
0
0
6
2
160
119
140
110
120
100
90
80
67
61
60
20
54
47
38
40
28
27
14
31
37
37
20
6
8
0
0
5
2
0
0
5
3
14
16
0
0
5
8
0
0
5
9
32
22
0
0
0
4
6
0
0
4
8
0
0
4
9
0
0
5
1
0
0
5
4
0
0
5
5
0
0
5
6
0
0
5
7
0
0
6
0
0
0
6
1
0
0
6
2
0
0
6
3
0
0
6
4
0
0
6
5
Trips : ( 5045 )
05
04
03
02
1
01
0
00
0
1
2
1
1
0
0
1
2
2
0
1
2
3
1
1
0
1
2
6
0
1
2
7
0
0
1
2
4
Diagram no. 18: Steer Axle - Number of Operations
0
1
2
5
0
0
0
1
2
8
0
1
2
9
1
1
1
0
1
3
0
0
1
3
1
0
1
3
2
1
0
0
1
3
3
1
0
0
1
3
4
0
1
3
5
1
1
0
1
3
8
0
1
3
9
0
1
4
0
1
1
0
1
3
9
0
1
4
0
0
0
1
3
6
0
1
3
7
0
Trips : ( 5045 )
Steer Axle - Number of Operations
05
Steer Axle Number of Operations
Displays the number of operations of the steer axle lock per trip (ECU
Software Version C505 and above). In this example the steer axle lock
was operated once on most trips (e.g. driving in reverse).
0
0
5
0
Lift Axle - Number of Operations
Lift Axle Number of Operations
Diagram no. 17: Lift Axle - Number of Operations
Displays the number of operations of the lift axle per trip (ECU
Software Version C505 and above). In this example, the lift axle
has been lifted once during several trips (e.g. depending on the
load after switching on the ignition) whereas, it was not used
during other trips (e. g. due to high load).
0
0
4
7
04
03
02
01
1
1
1
1
1
0
1
2
1
0
1
2
2
0
1
2
3
0
1
2
4
0
1
2
5
1
0
00
0
1
2
6
1
1
1
1
1
1
1
1
1
0
1
2
9
0
1
3
0
0
1
3
1
0
1
3
2
0
1
3
3
0
1
3
4
0
1
3
5
0
1
3
6
0
1
3
7
0
0
1
2
7
0
1
2
8
0
0
1
3
8
21
Trailer Analyser - Operating Instructions
11 Trip Log - Options
Diagram no. 20: Residual Pressure Time (minutes)
This diagram displays the residual pressure in the brake
cylinders when the EBS control pressure is no longer present.
This can result from actuating the parking brake.
Trips : ( 5045 )
Warning Lamp Ignored (minutes)
Warning Lamp Ignored (minutes)
05
04
3
03
02
1
01
00
0
0
0
0
0
0
1
2
1
0
1
2
2
0
1
2
3
0
1
2
4
0
1
2
5
0
1
2
6
0
0
0
0
0
0
0
0
1
2
7
0
1
2
8
0
1
2
9
0
1
3
0
0
1
3
1
0
1
3
2
0
1
3
3
0
1
3
4
0
0
0
0
0
0
0
1
3
5
0
1
3
6
0
1
3
7
0
1
3
8
0
1
3
9
0
1
4
0
Trips : ( 5045 )
Residual Pressure Time (minutes)
10.00
Residual Pressure Time (minutes)
Diagram no. 19: Warning Light Ignored (minutes)
This diagram displays the total time during which the red warning light
was ignored (from software version C505). When the red warning
light is illuminated, this can be for the following reasons:
- Low reservoir pressure (< 4.5 bar)
- Low supply voltage (< 19.0 V)
- Activation of the emergency brake function by the REV or
TrCM when the red line (reservoir pressure supply line) tears
away
- In exceptional cases with 3M drawbar trailers when the ABS
on one axis completely fails.
9.00
8.00
7.00
6.00
5.00
4
4.00
3
3
3.00
3
2.00
1
1.00
0
* Road Condition Monitoring algorithm is not implemented in some
regional specific versions of BPW ECO Tronic EBS, thus rendering
of RCM data within histograms and trip details is not possible.
0
0
0
4
6
0
0
4
7
0
0
0
4
8
0
0
4
9
0
0
5
0
0
0
0
0
0
0
0
5
1
0
0
5
2
0
0
5
3
0
0
5
4
0
0
5
5
0
0
5
6
0
0
0
0
0
0
0
0
5
7
0
0
5
8
0
0
5
9
0
0
6
0
0
0
6
1
0
0
6
2
0
0
6
3
0
5.31
2.55
2.83
2.89
4.78
2.10
0
0
1
5
0
0
1
6
0
0
1
7
0
0
1
8
0
0
1
9
0
0
2
0
0
0
0
0
0
0
0
4
1
0
0
4
2
0
0
4
3
0
0
4
4
0
0
4
5
0
0
6
4
0
0
6
5
Trips : ( 5045 )
Rough Road Count / km
60
54
48
Rough Road Count / km
Diagramm Nr. 21: Rough Road Count / km*
This diagram displays the number of rough road counts per
trip divided by the number of kilometers travelled per trip. This
allows the direct comparison of the number of rough road counts
/ km for the different trips. For trip 10, for example, a mean value
of 5.13 rough road counts / km was registered.
0
42
36
30
24
18
15.00
06
10.13
9.60
12
4.00
5.86
6.93
3.68
5.54
2.73
6.12
5.13
1.29
2.89
2.34
0
0
1
1
0
0
1
2
0
0
0
0
1
Diagram no. 22: Event Codes
The chart shows the number of different event codes which
occurred. Clicking the right mouse button on the bar causes the
event code(s) to be shown in the Trip Info Box in the bottom line.
0
0
0
2
0
0
0
3
0
0
0
4
0
0
0
5
0
0
0
6
0
0
0
7
0
0
0
8
0
0
0
9
0
0
1
0
0
0
1
3
0
0
1
4
Trips : ( 5045 )
Event Codes
06
05
The following event codes are possible:
Event Codes
04
In this case, only one event code (here Overload Snapshot
> 105 %) occurred.
03
02
1
01
-
Over Load Snapshots > 105%
(this standard threshold value cannot be changed)
-
Over Speed Snapshots > 105 km/h
(this standard threshold value cannot be changed)
-
DTC Snapshots
(occurring during a trip)
-
sd_24n_1m
(soft docking during supply of 24N power)
-
Reservoir Snapshots
(pressure in the reservoir tank)
-
B+ Snapshots
(battery voltage)
22
00
0
0
0
0
0
0
0
0
0
2
6
0
0
2
7
0
0
2
8
0
0
2
9
0
0
3
0
0
0
3
1
0
0
3
2
0
0
3
3
1
0
0
0
0
0
3
4
0
0
3
5
0
0
3
6
0
0
3
7
1
0
0
0
0
3
8
0
0
3
9
0
0
4
0
12 Main menu - User information
User Information
The yellow „User Info“ tab is the right most tab on the Trailer
Analyser screen. Here you can enter your notes and store them
with the ECU data in the Trailer Analyser. For example, here you
can store data relating to the driver, the vehicle, the freight or
other particular information. The maximum number of characters
is approximately 30,000 or 80 - 90 KB.
{ test.fpf }
VIN:
Manufacturer:
Brake Calc:
Unit Type:
BPWV00334YHE27006 Serial:
BPW Version:
WS08 3112.00 Generation:
ZTS 34.20 Dongle Version:
M0666_13
C505
GEN 2
G430
COM:1
23
BPW-BA-TA 37101101e
BPW Bergische Achsen Kommanditgesellschaft . Postfach 12 80 . 51656 Wiehl . Telefon +49 22 62 78-0 . [email protected] . www.bpw.de