1
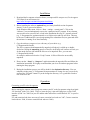
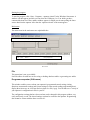
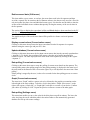
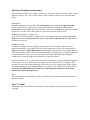
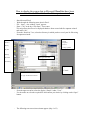
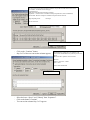
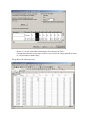
Installation and Operating Instructions for the iks Aquastar Winsoft
Demo-Software V0.1
List of contents
System requirements................................ ....................................................................................... 1
Installation................................................................................................................................ ...... 2
Operation................................................................ ................................ ................................ ........ 2
Connecting your PC to the iks aquastar ....................................................................................... 2
Starting the program ................................ ................................ ................................ ................... 3
Main menu.................................................................................................................................. 3
File ......................................................................................................................................... 3
Programme aquastar ( Edit menu) ........................................................................................... 3
Retrieve saved data ( Edit menu) ............................................................................................. 4
Display current values (Current values menu) ......................................................................... 4
Update database (Current values menu)................................ ................................ ................... 4
Data polling (Current values menu)......................................................................................... 4
Graph (Current values menu) .................................................................................................. 4
Data polling (Settings menu)................................ ................................ ................................ ... 4
Overview ( Graphics module menu) ................................ ................................ ........................ 5
Info (“?” menu) ................................ ....................................................................................... 5
Helpful Hints .................................................................................................................................. 6
Known Bugs ................................ ................................ ................................ ................................ ... 7
How to display the sensor data in Microsoft Excel that have been transferred to the PC with the aid
of iks-aquastar winsoft.................................................................................................................... 8
System requirements
Minimum:
Operating system:
Processor:
Main memory
Hard drive:
Graphics:
Mouse:
Windows 95, 98 NT 4.0, 2000
486 Intel processor or above or compatible
16 MB
15 MB vacant memory
VGA
compatible with Windows
Recommended:
Operating system:
Processor:
Main memory
Hard drive:
Graphic:
Mouse:
Windows 95, 98 NT 4.0, 2000
133 MHz Intel Pentium processor or above
32 MB or more
20 MB vacant memory
VGA or higher monitor resolution
Compatible with Windows
Installation
1. Download the iks aquastar-winsoft software (a compressed file setupex.exe; file size approx.
5352 kByte) from our Internet site
http://www.iks-aqua.com/html/d/aquastarwinsoft.htm.
2. Before installing the software, uninstall any previously installed version of aquastar
winsoft. To do so, proceed as follows:
In the Windows Start-menu, click on “Start – settings – control panel”. Click on the
“Software” icon and subsequently remove the “aquastar winsoft” program. If any elements
were not able to be removed, have a look in the installation directory of “aquastar winsoft”
(e.g. C:\Programme\iks\ aquastarwinsoft) to see if directories and files still exist. This may
be the case if additional files (saved programming files or database files) are generated while
the software is running. Erase these manually.
3. Copy the software (setupex.exe) to a directory of your choice (e.g.
C:\Programme\iks\install).
The file is compressed and automatically unpacks itself when it is called up or doubleclicked on. During the unpacking process of the file, the WinZip self-extractor will ask you
for the unzip directory into which the files are to be unpacked. Here, you can enter
C:\Programme\iks\install
for example, and then click on the “Unzip” button. 16 files will then be successfully
unpacked.
4. Please run the “ Setup” or “Setup.exe” application under the unpacked files and follow the
installation instructions. We highly recommend that you close all windows programs before
running the Setup program.
5. During the installation process you will be asked for the destination directory. You can
adopt the existing entry “C:\Programme\iks\aquastarwinsoft” change it to one you prefer by
means of the “Examine” button. If you do change the directory, it is a good idea to make a
note of the new one.
Operation
Connecting your PC to the iks aquastar
Before running the aquastar winsoft program, connect your PC to the iks aquastar using the original
“PC data lead” (Order No. 3000). To do so, insert the grey 9-pin sub-D plug into a serial COMinterface (COM 1 or COM 2) in your PC and the other end into the socket labelled “PC” in your iks
aquastar.
Use and extension lead where necessary(2-metre extension lead: order no. 3007, 5-metre extension
lead: order no. 3008, 10-metre extension lead: order no. 3009).
Starting the program
To start the program, click “Start – Programs – aquastar winsoft” in the Windows Start-menu. A
window will then appear in which you can select the COM port (1 or 2) to which you have
connected the data lead. Then, another window appears in which you can start polling the latest
sensor data from the aquastar. After that the “aquastar winsoft” main menu appears.
Main menu
The menu items in the main menu are explained below.
File Edit Current values Settings Graphics module
Date
Time
Sensor 1 ....
Data polling halted
Main window
File
This menu item is not yet available.
It will be able to be used later on for saving or loading data-base tables or generating new tables.
Programme aquastar ( Edit menu)
This window enables you to read out your aquastar’s programmed control settings, timing
functions, measurement settings and system settings (in other words reading programming data),
display them in an easy-to-view form and save them in a file (*.prg). You can thus save a variety of
your aquastar’s configurations in files in your PC.
The configuration settings that have been read out can be changed in this program window; very
easily and clearly set out. The altered settings can then be restored to the aquastar. Programming
data cannot be written with the demo-version v0.1.
Retrieve saved data ( Edit menu)
This item enables you to extract, or read out, the sensor data saved in the iks aquastar and then
saved in a separate file. In contrast to the iks Datastar software, the data are only saved in a file with
only one header line (date, time and individual sensor types). It is therefore not advisable to alter the
sockets of the individual sensors without subsequently clearing the memory of the saved values in
the iks aquastar.
The section “How to display the sensor data in Microsoft Excel that have been transferred to the PC
with the aid of iks-aquastar winsoft” at the end of this instruction tells you how you can input the
saved data into Microsoft Excel.
The graphic analysis of the saved sensor data will be possible in a future version of aquastarwinsoft.
Display current values (Current values menu)
Clicking on this menu item presents the latest sensor data from the iks aquastar in a separate
window stating the sensor type and your PC’s date.
Update database (Current values menu)
Clicking on this menu item enters the last input current sensor data into the currently open database
( Aquastar 1). To do this, the recording of the current values has to be briefly interrupted for
technical reasons. The table displayed in the main menu can be updated by clicking on the register
“Aquastar 1”.
Data polling (Current values menu)
Clicking on this menu item starts or stops the polling of current sensor data from the aquastar. The
current polling status (data polling stopped or data polling running) is displayed in the status bar of
the main menu at the bottom of the screen on the right or by a tick adjacent to the menu item “Data
polling”.
If data polling is stopped by the user, it takes a few seconds for the data-polling process to come to
a halt.
Graph (Current values menu)
The menu item “Graph” enables a sensor each to be allocated to the graphic presentations on the
left and right of the main window. To do this, click in the window “Graph: select source” on the
right or left register (“Graph left” or “Graph right”) and click on a sensor of your choice. Confirm
your choice by clicking on “OK”. Repeat the process to allocate a sensor to the other graph.
Data polling (Settings menu)
This menu item enables you to set the value for the delay between polls in minutes. The lower the
value, the faster the rate at which the table in the main window or the automatically generated
database file fills up with sensor readings.
Overview ( Graphics module menu)
This menu item enables you to display a window that gives you a graphic overview of all 8 of your
aquastar’s sensors. Here, you can also enlarge, reduce or shift a certain area for each individual
sensor.
Enlargement:
Inside the appropriate sensor graph, click the left-hand mouse button on the upper left-hand
corner of the section you want to view. Keeping the button pressed, drag the mouse pointer
downwards and to the right. Release the button as soon as the resulting white square has reached a
suitable size. You have now enlarged the area you want to scrutinise more closely.
Returning the graph to its original size:
To return a sensor-data graph to its original state, click anywhere inside the graph using the lefthand mouse button, keep it pressed and drag the mouse pointer upwards and to the left. Release
the button at any point.
Shifting an section:
To shift an enlarged section of a graph to another position ( for example to follow the curve
upwards, downwards, to the right or left) click on the appropriate section of the graph using the
right mouse button, keep the button pressed and drag the mouse pointer in the required direction.
If the mouse pointer comes off the section of graph while it is being moved, release the button and
repeat the procedure. If you lose track of the curve and cannot find it again after shifting an
enlarged area, restore the graph to its original size (as described above).
In the case of Sensor No. 1, you have the extra option of displaying a greatly magnified diagram in
a new window. To do so, double-click on “Graph overview” in the Sensor No. 1 diagram. This
provides you with all the zoom functions described above in a new window titled “Sensor graph”.
The option of printing out the enlarged diagram via a printer is not available in the demo version.
A greatly enlarged diagram of all sensor data can be displayed and printed out in future
commercial versions of the program.
Note:
The zoom functions described above are also available for the left-hand or right-hand diagram in
the main window.
Info (“?” menu)
This displays the version number of the aquastar-winsoft program and information relating to the
copyright.
Helpful Hints
1. Sensor values “-5000”
If a value of “-5000” among the sensor values displayed in the main-window is wholly
implausible, please try the following:
Under the main-menu item “system”, set the programming level in your iks-aquastars to
“Profi”.
Change the duration of the external display from 2 (standard setting) to 1 second. In
long-term test undertaken by the development department, no problems were
encountered with the 2 second setting. It is therefore not recommended to set the
duration of the external display to 3 or 4 seconds.
If such values appear nevertheless, it may be that the connection to the aquastar was
interrupted during polling or that something similar occurred..
For this reason, first stop polling (and wait for the message “Data polling halted” to
appear in the lower right-hand section of the status bar) before breaking the connection
to the aquastar or temporarily switching it off.
If an incorrect reading does appear, you can load, edit and save the data table “Aquastar
1.db” using numerous Paradox-compatible data-base programs (e.g. Microsoft Access).
The file is located in the directory “Database” in your destination directory of the
aquastar-winsoft installation (see Item 5 in the section “Installation” in this manual).
Table entries cannot be edited with the demo version !
This option is planned for the future commercial version.
2. Creating a new data-base table
If you want to create a new table when starting aquastar-winsoft, proceed as follows:
End the aquastar-winsoft program. Open Windows-Explorer and the directory
“Database” in the aquastar-winsoft installation destination directory. This is normally
“C:\Programme\iks\aquastarwinsoft” or a directory you have specified during
installation. Move or erase the files whose name begins with “Aquastar 1”. These files
will be recreated the next time you start the program. This will be more
straightforward in the future commercial version with various menu items within
the menu “File”.
Known Bugs
1. Overstepping the list index
Trick: Create a new data-base table as described above.
2. Table “Aquastar 1_Temp” does not exist or access denied.
This error occurs frequently when Windows-Explorer is open simultaneously and the abovementioned file is being displayed. Close aquastar-winsoft and restart the program. Select
another directory in Windows-Explorer.
3. “Unknown software error” with address in hexadecimal format.
4. The displayed value for an oxygen sensor in mg/l units is incorrect. (Factor 10)
Trick: In the main menu of your aquastar “Measurement settings - Display - Oxygen”, set
the unit to “% saturation” instead of “mg/l”.
Software errors are remedied as soon as possible and placed at your disposal in suitably revised
demo-versions for downloading from our homepage under http://www.iksaqua.com/html/d/aquastarwinsoft.htm .
Please let us know your opinion of the program or what you think requires improvement. We will
be glad to pass on your questions, ideas, suggestions for improvement and hints to our developers!
Send your e-mail to:
or fax to:
[email protected]
+49 (0) 7202 9411 - 41
(Please enter “winsoft demo-version” in the “Re.:” box)
Thank you
iks ComputerSysteme GmbH
How to display the sensor data in Microsoft Excel that have been
transferred to the PC with the aid of iks-aquastar winsoft
-
-
Start Microsoft Excel
Work through the following menu item in Excel:
File – Open -> the window “Open” appears.
Enter “*.iks” in the box “File name:”. Press enter.
This only allows the files to be displayed that have been created with iks-aquastar-winsoft
and end in “iks”.
From the “Search in:” box, select the directory in which you have saved your iks files using
iks-aquastar-winsoft.
List
Details
Properties
Preview
Open
Search in:
History
Arrange symbols
My files
Desktop
Favourites
Size Type Date Time
Networking
Open
Cancel
File name:
File type: all Microsoft Excel files
-
From the upper menu bar select the display “Details” under “View”.
Use the mouse to select the required file and confirm your choice by clicking on the “Open”
button.
-
The following text-conversion assistant appears (Step 1 of 3)
The text-conversion assistant has detected separators in your data. If all the data is correct, click
on “continue” or select the correct data type.
Original data type
Select the type of file that best describes your data:
Separated - characters such as commas or tabstops separate boxes (Excel 4.0-Standard).
Fixed width - Boxes are arranged in columns with spaces between each box.
Begin importing in line:
File origin:
Preview of the file .....
Cancel
-
Click on the “Continue” button.
Step 2 of 3 of the text-conversion assistant appears.
Previous
Continue
Complete
This dialogue box enables you to set separators. The
preview of the marked data shows you how your text will
appear.
Treat consecutive separators as one character
Separator
Tabstop semi-colon comma
Space other:
Preview of the marked data
Text-recognition character
-
Select the boxes “Space” and “Tabstop” from “Separators”.
Click on the button “Continue”
Tex-conversion assistant Step 3 of 3 appears.
specify the data type.
The option “Standard” retains dates and figures and
transforms all other values to text.
Additional
Data format in the columns
Standard
Text
Date DMY
Do not import column (skip)
-
It is now easiest to click on the button “Complete”
This produces the following result:
-
In Step 3 of 3 however, you can format each individual column.
-
However, it is only worthwhile formatting the first column with “Date”.
Columns that represent vacant sensor sockets (xxxx) can also be simply omitted by means
of “Do not import columns (skip)”.
This produces the following result:
You can also use Excel’s diagram assistant to present the saved values in the form of a graph.
File Edit View Add Format Extras Diagram Window ?
Temperature development
Temperature
Yours faithfully
iks ComputerSysteme GmbH