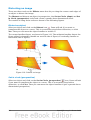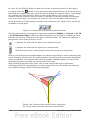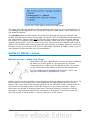
1
OpenOffice.org 3
Draw Guide
Drawing Vector Graphics in OpenOffice.org
Copyright
This document is Copyright © 2005–2011 by its contributors as listed below. You may
distribute it and/or modify it under the terms of either the GNU General Public
License (http://www.gnu.org/licenses/gpl.html), version 3 or later, or the Creative
Commons Attribution License (http://creativecommons.org/licenses/by/3.0/), version
3.0 or later. All trademarks in this guide belong to their legitimate owners.
Contributors
Agnes Belzunce
Thomas Hackert
Jared Kobos
Bernd Schukat
Claire Wood
Daniel Carrera
Regina Henschel
Hazel Russman
Wolfgang Uhlig
Linda Worthington
Martin Fox
Peter Hillier-Brook
Gary Schnabl
Jean Hollis Weber
Feedback
Please direct any comments or suggestions about this document to: [email protected]
Acknowledgments
Several chapters in this book are based on an original French document written for
OpenOffice.org 1.x by Michel Pinquier (translated into English by Alex Thurgood) and
previous content revised by Jim Taylor. The chapters were revised for OOo 2.0 by
Linda, Daniel, Jean, and Agnes, and later translated into German by Bernd, Regina,
and Wolfgang. The German revisions were then translated into English and revised
for OOo 3.3 by Martin Fox.
Publication date and software version
Published 27 August 2011. Based on OpenOffice 3.3.
You can download
an editable version of this document from
http://wiki.services.openoffice.org/wiki/Documentation/
Contents
Copyright.......................................................................................................................2
Chapter 1
Introducing Draw............................................................................................................7
Introduction...................................................................................................................8
The Draw workplace.....................................................................................................8
Rulers............................................................................................................................9
Status bar....................................................................................................................10
Toolbars.......................................................................................................................11
Drawing grid and guides............................................................................................15
Floating and moving toolbars.....................................................................................15
Quick printing.............................................................................................................17
Controlling printing....................................................................................................18
Exporting to PDF........................................................................................................22
Exporting to other formats.........................................................................................22
Exporting Draw documents as web pages.................................................................23
E-mailing documents..................................................................................................23
Chapter 2
Drawing Basic Shapes..................................................................................................24
Creating simple drawings...........................................................................................25
Custom shapes............................................................................................................25
Drawing basic shapes.................................................................................................25
Gluepoints and connectors (basics)...........................................................................32
Drawing geometric shapes.........................................................................................33
Adding text to objects.................................................................................................35
Chapter 3
Working with Objects and Object Points......................................................................38
Introduction................................................................................................................39
Moving and dynamically adjusting an object’s size..................................................41
Rotating and shearing an object using the mouse....................................................44
Setting size and position exactly................................................................................46
Editing object points...................................................................................................48
Another way to change the form of basic shapes......................................................48
How curves work........................................................................................................49
Chapter 4
Changing Object Attributes.........................................................................................55
Toolbars and menus....................................................................................................56
Editing lines and borders...........................................................................................57
Editing the inside (fill) of an object............................................................................63
Using styles.................................................................................................................71
Special effects.............................................................................................................72
Chapter 5
Combining Multiple Objects.........................................................................................78
OpenOffice.org 3.3 Draw Guide
3
Introduction: grouping and combining objects.........................................................79
Grouping objects.........................................................................................................79
Combining objects......................................................................................................80
Merging, subtracting, or intersecting shapes...........................................................81
Aids for positioning objects........................................................................................83
Chapter 6
Editing Pictures (Raster Graphics)..............................................................................88
Introduction................................................................................................................89
Importing raster and vector graphics........................................................................89
Exporting graphics.....................................................................................................92
Modifying raster object properties............................................................................95
The picture (editing) toolbar......................................................................................95
Cropping......................................................................................................................97
The graphic filter toolbar...........................................................................................98
Changing colors using the eyedropper....................................................................101
Conversion................................................................................................................105
Print options with raster graphics...........................................................................109
Chapter 7
Working with 3D Objects............................................................................................111
Creating 3D objects..................................................................................................112
Editing 3D objects.....................................................................................................116
Combining objects in 3D scenes..............................................................................134
Chapter 8
Tips and Tricks............................................................................................................138
Positioning objects with zoom..................................................................................139
Positioning objects with snap functions...................................................................140
Drawing to scale.......................................................................................................146
Splitting drawings on multiple layers......................................................................146
Creating a multi-page document..............................................................................150
Color palette: adding or changing single colors......................................................153
Changing colors using the Color dialog...................................................................155
Creating cool effects.................................................................................................157
Chapter 9
Organization Charts, Flow Diagrams, and More.......................................................159
Drawing an organization chart................................................................................160
Drawing a flow diagram...........................................................................................162
Glue points and connectors......................................................................................164
Adding text to connectors........................................................................................168
Chapter 10
Advanced Draw Techniques........................................................................................171
Drawing to scale.......................................................................................................172
Dimensioning a drawing...........................................................................................180
Working with text in Draw........................................................................................183
Guide to Bézier curves..............................................................................................196
4
OpenOffice.org 3.3 Draw Guide
Adding comments to a drawing................................................................................202
Connecting and breaking lines.................................................................................203
Index..............................................................................................................................204
OpenOffice.org 3.3 Draw Guide
5
Note for Mac users
Some keystrokes and menu items are different on a Mac from those used in Windows
and Linux. The table below gives some common substitutions for the instructions in
this chapter. For a more detailed list, see the application Help.
6
Windows/Linux
Mac equivalent
Effect
Tools > Options
menu selection
OpenOffice.org >
Preferences
Access setup options
Right-click
Control+click
Open context menu
Ctrl (Control)
z (Command)
Used with other keys
F5
Shift+z+F5
Open the Navigator
F11
z+T
Open Styles & Formatting window
OpenOffice.org 3.3 Draw Guide
1
Chapter
Introducing Draw
Introduction
Draw is a vector graphics drawing tool, although it can also perform some operations
on raster graphics (pixels). Using Draw, you can quickly create a wide variety of
graphical images.
Vector graphics store and display a picture as simple geometric elements such as
lines, circles, and polygons rather than as a collection of pixels (points on the screen).
This permits simpler storage and supports precise scaling of the picture elements.
Draw is fully integrated into the OpenOffice.org suite, and this simplifies exchanging
graphics with all components of the suite. For example, if you create an image in
Draw, reusing it in a Writer document is as simple as copying and pasting the image.
You can also work with drawings directly from within Writer or Impress, using a
subset of the functions and tools from Draw.
Draw’s functionality is extensive, and even though it was not designed to rival highend graphics applications, it possesses significantly more functionality than the
drawing tools that are generally integrated with most office productivity suites.
A few examples of the drawing functions are: layer management, magnetic grid-point
system, dimensions and measurement display, connectors for making organization
charts, 3D functions that enable small three-dimensional drawings to be created
(with texture and lighting effects), drawing and page-style integration, and Bézier
curves.
The Draw Guide is not a course book to be worked through from beginning to end.
Rather, it is a reference work in which you can browse for guidance on particular
topics.
This document describes only the functions associated with Draw. Some concepts,
such as file management or the way the OpenOffice.org environment works, are
mentioned only briefly; they are covered in more detail in the Getting Started guide.
The Draw workplace
The main components of the Draw interface are shown in Figure 1.
The large area in the center of the window is where you make the drawings. You can
surround the drawing area with toolbars and information areas. The number and
position of the visible tools vary with the task in hand and user preferences.
Therefore, your setup may look different. For example, many users put the main
Drawing toolbar on the left-hand side of the workspace—not at the bottom, as shown
here.
You can split drawings in Draw over several pages. Multi-page drawings are used
mainly for presentations. The Pages pane, on the left side of the Draw window in
Figure 1, gives an overview of the pages that you create. If the Pages pane is not
visible on your setup, you can enable it from the View menu (View > Page Pane). To
make changes to the page order, just drag and drop one or more pages.
In Draw 3.3, the maximum size of a drawing page is 300 cm by 300 cm.
8
OpenOffice.org 3.3 Draw Guide
Figure 1: Initial Draw window
Rulers
You should see rulers (bars with numbers) on the upper and left-hand sides of the
workspace. If they are not visible, you can enable them by selecting them from the
View menu (View > Ruler).
The rulers show the size of a selected object on the page (see the gray double lines,
highlighted in Figure 2). When no object is selected, they show the location of the
mouse pointer, which helps to position drawing objects more accurately.
You can also use the rulers to manage object handles and guide lines, making it
easier to position objects.
The page margins in the drawing area are also represented on the rulers. You can
change the margins directly on the rulers by dragging them with the mouse.
Chapter 1 Introducing Draw
9
Figure 2: Rulers show the size of the
selected object
To modify the units of measurement of the rulers (which you can define
independently), right-click on the desired ruler, as illustrated for the horizontal ruler
in Figure 3.
Figure 3: Rulers in a drawing
Status bar
The Status bar is located at the bottom of the Draw window and includes several
Draw-specific fields, as identified in Figures 4 and 5.
Figure 4: Left end of Draw status bar
Figure 5: Right end of Draw status bar
The Information field shows which action is being carried out, or which object type is
selected.
10
OpenOffice.org 3.3 Draw Guide
The Position field shows different information, depending on whether objects are
currently selected or not:
• When no object is selected, the left number pair shows the current position (in
X,Y Cartesian coordinates) of the mouse cursor.
• While an object is being resized with the mouse, the right number pair shows
the size of the object (width and height).
Note
The sizes are given in the current measurement unit (not to be confused
with the ruler units). This unit is defined in Tools > Options >
OpenOffice.org Draw > General, where you can also change the scale of
the page. Another way to change the scale is to double-click on the
number shown in the status bar.
• If an object is selected, the left number pair shows the X,Y coordinates of the
upper-left corner, and the right number pair displays the size of the object, as
seen in Figure 4. These numbers do not relate to the object itself, but to the
selection outline, which is the smallest possible rectangle that can contain the
visible part or parts of the object; see also Chapter 3 (Working with Objects
and Object Points).
• When an object is selected, a double-click on this field opens the Position and
Size dialog, which is described in detail in Chapter 4 (Changing Object
Attributes).
In the Indicator field, an asterisk (*) is shown whenever any change is made to the
document but not yet saved to disk.
If you wish to digitally sign the document, a double-click or right-click in the
Signature field brings up the signature box. Note that a document must be saved at
least once before it can be signed. After it is signed, an indicator is present in this
field.
The Slide field shows the sequence number for the current drawing page, in addition
to the total number of pages that you created so far. This is useful when your drawing
has a number of pages. If you select an object, the field enclosed by parentheses
shows the layer in which the object resides within the drawing. In the example of
Figure 5, the object is on the Layout layer of Slide 1, and there is a total number of
one slide so far.
The Page style field shows which template is being used.
The vertical bar in the middle of the Zoom slider represents a zoom factor of 100%.
To change the view magnification, drag the Zoom slider, or click on the + and – signs,
or right-click on the zoom level percent to pop up a list of magnification values from
which to choose. Double-clicking on the zoom level percent to open the Zoom &
View Layout dialog.
Toolbars
You can display or hide the various Draw toolbars, according to your needs. To
display or hide a toolbar, click View > Toolbars. On the menu that appears, choose
which toolbars you want to display.
You can also select the icons that you wish to appear on the toolbars. To change the
visible icons on any toolbar, click the arrow at the right-hand end of that toolbar and
Chapter 1 Introducing Draw
11
choose Visible Buttons from the drop-down menu. Visible icons are indicated by an
outline around the icon. Click on icons to hide or show them on the toolbar.
Figure 6: Selection of visible toolbar icons
The tools available in the various toolbars are explained in the following sections.
Standard toolbar
The Standard toolbar is the same for all OpenOffice.org components and is not
described in detail here.
Figure 7: Standard toolbar
Drawing toolbar
The Drawing toolbar is the most important toolbar in Draw. It contains all the
necessary functions for drawing various geometric and freehand shapes and for
organizing them on the page. It is described in detail in Chapter 2 (Drawing Basic
Shapes).
Figure 8: Drawing toolbar
Line and Filling toolbar
The Line and Filling toolbar lets you modify the main properties of a drawing object:
the icons and pull-down lists vary with the type of object selected. For example, to
change the thickness of a line with the spinner, hover the mouse over the spinner and
click the up or down arrow to achieve the desired thickness.
Figure 9: Line and Filling toolbar
In the example above, the available functions enable you to change the color, style,
and width of the line drawn or the fill color, style, and other properties of an object.
The object must first be selected with a mouse click. If the selected object is a text
frame, the buttons for line style and fill color are changed to Invisible by default. You
can change them to something else if you want.
12
OpenOffice.org 3.3 Draw Guide
Text Formatting toolbar
When text is selected, the Line and Filling toolbar changes to the Text Formatting
toolbar, which is very similar to the Formatting toolbar in Writer. A more detailed
explanation of the buttons on this toolbar can be found in Chapter 4 (Changing
Object Attributes).
Figure 10: Text Formatting toolbar
Color bar
To display the Color bar, use View > Toolbars > Color Bar. The toolbar then
appears at the bottom of the workspace and displays the current color palette.
Figure 11: Color bar
This toolbar lets you rapidly choose the color of the various objects (lines, areas, and
3D effects) in your drawing. The first box in the panel corresponds to transparency
(no color).
Choosing a color palette
You can access several specialized color palettes in Draw, as well as change
individual colors to your own taste. This is done using the Area dialog, reached by
choosing Format > Area, or the pouring can icon on the Line and Filling toolbar
(Figure 9).
On the Area dialog, choose the Colors tab (Figure 12).
To load another palette, click on the Load Color List button (circled). The file
selector dialog asks you to choose one of the standard OpenOffice.org palettes (files
bearing the file extension *.soc). For example, web.soc is a color palette that is
particularly adapted to creating drawings that are going to appear in Web pages.
These colors will display correctly on workstations with screens capable of at least
256 colors.
A more detailed description of color palettes and their options can be found in
Chapter 8 (Tips and Tricks).
Chapter 1 Introducing Draw
13
Figure 12. Changing the color palette
Options toolbar
The Options toolbar lets you activate or deactivate various drawing aids. The Options
Bar is not one of the toolbars displayed by default. To display it, select View >
Toolbars > Options.
Figure 13: Options toolbar
The options are described in the table below and in greater detail in other chapters of
the Draw Guide.
Table 1: Functions on the Options toolbar
Icon
Function
Rotation mode after clicking object
Display (or hide) the grid
Display (or hide) the guides
Display (or hide) guides when moving
14
OpenOffice.org 3.3 Draw Guide
Icon
Function
Snap to grid
Snap to guides
Snap to page margins
Snap to object borders
Snap to object points
Allow quick editing
Select text area only
Double-click to edit text
Simple handles
Large handles
Modify object with attributes
Exit all groups
Drawing grid and guides
Draw offers a grid as a drawing aid. The grid can be turned on or off by clicking on
the Grid icon on the Options toolbar. The points of the grid displayed on the screen
are not shown on the printed drawing. The color, spacing, and resolution of the grid
points can be individually chosen for each axis. This is described in more detail in
Chapter 8 (in the section titled “Configuring the grid”).
Guides are special “helper lines” that can be turned on or off by clicking on the
Guides icon on the Options toolbar. Draw offers a “Snap” function, with which you
can place drawings exactly on these guides or on a grid point, a page margin, or a
border or point of another object. All snap functions are described in detail in
Chapter 8 (Tips and Tricks).
Showing the position of the object while moving it makes positioning the object much
easier. If the Guides function is activated, pairs of vertical and horizontal lines
enclosing the object are shown while moving the object. These lines extend to the
edges of the drawing area. This function is also described in detail in Chapter 8.
Floating and moving toolbars
Many toolbar icons are marked with a small arrow. The arrow indicates that this icon
has additional tools. Click the arrow to display the full set of tools (see Figure 14).
Chapter 1 Introducing Draw
15
You can “tear off” this tool set so it becomes a floating toolbar. Click the area at the
bottom of the toolset, drag it across the screen to a location you want, and then
release the mouse button.
To dock a floating toolbar to the top or side of the Draw workspace, Ctrl+click on the
title of the toolbar. To float a docked toolbar, click on its handle and drag it off the
side of the workspace (see Figure 15). The floating-toolbar capability is common to all
components of OpenOffice.org.
Figure 14: An arrow next to an icon indicates additional functions
Note
When a toolset is made into a floating toolbar, the icon on the existing
toolbar remains in the toolbar and always shows the last command you
used. This means that the icon you see on your screen may differ from the
icon shown in this Guide.
Figure 15: Moving a docked toolbar
Tip
When you double-click on an icon on a floating toolbar, the command
corresponding to that icon will run. You can then repeat this action as
often as you like. To exit from this mode, press the Esc key or click on
another icon (for example
). This may not work for every icon on
every toolbar.
16
OpenOffice.org 3.3 Draw Guide
Customizing toolbars
You can customize toolbars in several ways. To show or hide icons defined for a
toolbar, see Figure 6 on page 12.
To add functions to a toolbar, move tools between toolbars, or create new toolbars.,
choose View > Toolbars > Customize, select the Toolbars tab (Figure 16) and the
toolbar you want to change, and then select the desired buttons for that toolbar.
Figure 16: Customizing a toolbar
Each toolbar has a different list of functions. For details, see Chapter 14
(Customizing OpenOffice.org) in the Getting Started guide. That chapter also
describes how to customize menus.
Quick printing
Click the Print File Directly icon
printer defined for your computer.
Note
to send the entire document to the default
You can change the action of the Print File Directly icon to send the
document to the printer defined for the document instead of the default
printer for the computer. Go to Tools > Options > Load/Save >
General and select the Load printer settings with the document
option.
Chapter 1 Introducing Draw
17
Controlling printing
For more control over printing, use the Print dialog (File > Print or Ctrl+P).
Figure 17. The Print dialog
The options selected on the Print dialog apply to this printing of this
document only.
Note
To specify default printing settings for OpenOffice.org, go to Tools >
Options > OpenOffice.org – Print and Tools > Options >
OpenOffice.org Draw – Print.
The Print dialog has four tabs, from which you can choose a range of options, as
described in the following sections.
Selecting general printing options
On the General tab of the Print dialog, you can choose:
• The printer (from the printers available)
• Which pages to print, the number of copies to print, and whether to collate
multiple copies (Range and copies section)
Select the Properties button to display a dialog where you can choose portrait or
landscape orientation, which paper tray to use, and the paper size to print on.
On the Options tab of the Print dialog (Figure 18) you can set a number of other,
lesser used, options for printing.
18
OpenOffice.org 3.3 Draw Guide
Figure 18: General print options
Printing multiple pages on a single sheet of paper
You can print multiple pages of a document on one sheet of paper. To do this:
1) In the Print dialog, select the Page Layout tab.
2) In the Layout section, select from the drop-down list the number of pages to
print per sheet. The preview panel on the left of the Print dialog shows how the
printed document will look.
When printing more than two pages per sheet, you can choose the order in
which they are printing across and down the paper. The two pictures below
show the difference.
3) In the Page sides section, select whether to print all pages or only some pages.
4) Click the Print button.
Selecting pages to print
In addition to printing a full document, you can choose to print individual pages,
ranges of pages, or a selection of a document.
Chapter 1 Introducing Draw
19
To print an individual page:
1) Choose File > Print from the menu bar.
2) Select the page to print.
a) In the Ranges and copies section of the Print dialog, select the Pages
option.
b) Enter the number of the page to print.
3) Click the Print button.
To print a range of pages:
1) Choose File > Print from the menu bar.
2) Select the pages to print.
a) In the Ranges and copies section of the Print dialog, select the Pages
option.
b) Enter the number of the pages to print (for example 1-4 or 1,3,7,11), or any
combination of the two, for example: 1-4,5-9,10.
3) Click the Print button.
To print a selection of a page, or a selection from multiple pages:
1) In the document, select the section of the page to print.
2) Choose File > Print from the menu bar.
3) Choose the Selection option in the Ranges and copies section of the Print
dialog.
4) Click the Print button.
Printing a brochure
In Writer, Impress, and Draw, you can print a document with two pages on each side
of a sheet of paper, arranged so that when the printed pages are folded in half, the
pages are in the correct order to form a booklet or brochure.
Tip
Plan your document so it will look good when printed half size; choose
appropriate margins, font sizes, and so on. You may need to experiment.
To print a brochure on a single-sided printer:
1) Choose File > Print.
2) In the Print dialog, click Properties.
3) Check the printer is set to the same orientation (portrait or landscape) as
specified in the page setup for your document. Usually the orientation does not
matter, but it does for brochures. Click OK to return to the Print dialog.
4) Select the Page layout tab in the Print dialog.
20
OpenOffice.org 3.3 Draw Guide
5) Select the Brochure option.
6) In the Page sides section, select Back sides / left pages option from the Include
drop-down list.
7) Click the Print button.
8) Take the printed pages out of the printer, turn the pages over, and put them
back into the printer in the correct orientation to print on the blank side. You
may need to experiment a bit to find out what the correct arrangement is for
your printer.
9) On the Print dialog, in the Page sides section, select Front sides / right pages
option from the Include drop down box.
10) Click the Print button.
Tip
If your printer can print double-sided automatically, choose All pages.
Printing in black and white (on a color printer)
You may wish to print documents in black and white on a color printer. Several
choices are available. Please note that some color printers may print in color
regardless of the settings you choose.
To change the printer settings to print in black and white or grayscale:
1) Choose File > Print to open the Print dialog.
2) Click Properties to open the Properties dialog for the printer. The available
choices vary from one printer to another, but you should find options for the
Color settings. See your printer’s help or user manual for more information.
3) The choices for color might include black and white or grayscale. Choose the
required setting.
4) Click OK to confirm your choice and return to the Print dialog,
5) Click the Print button to print the document.
Tip
Grayscale is best if you have any graphics in the document.
Chapter 1 Introducing Draw
21
To change the OpenOffice.org settings to print all color text and graphics as
grayscale:
1) Choose Tools > Options > OpenOffice.org > Print.
2) Select the Convert colors to grayscale option. Click OK to save the change.
3) Open the Print dialog (File > Print).
4) Click the Print button to print the document.
To change the Draw settings to print all color text as black, and all graphics as
grayscale:
1) Choose Tools > Options > OpenOffice.org Draw > Print.
2) Under Contents, select the Print text in black option. Click OK to save the
change.
3) Open the Print dialog (File > Print).
4) Click the Print button to print the document.
Exporting to PDF
OpenOffice.org can export documents to PDF (Portable Document Format). This
industry-standard file format is ideal for sending the file to someone else to view
using Adobe Reader or other PDF viewers.
The process and dialogs are the same for Writer, Calc, Impress, and Draw, with a few
minor differences mentioned in this section.
Quick export to PDF
Click the Export Directly as PDF icon
to export the entire document using your
default PDF settings. You are asked to enter the file name and location for the PDF
file, but you do not get a chance to choose a page range, the image compression, or
other options.
Controlling PDF content and quality
For more control over the content and quality of the resulting PDF, use File > Export
as PDF. The PDF Options dialog opens. This dialog has five pages (General, Initial
View, User Interface, Links, and Security). Select the appropriate settings, and then
click Export. In the following dialog, enter the location and file name of the PDF to
be created, and click Save to export the file. See Chapter 10 (Printing, Exporting,
Emailing) in the Getting Started book for details.
Exporting to other formats
OpenOffice.org uses the term “export” for some file operations involving a change of
file type. If you cannot find what you want under File > Save As, look under File >
Export as well.
OpenOffice.org can export files to XHTML. In addition, Draw can export to Adobe
Flash (.swf) and a range of image formats.
22
OpenOffice.org 3.3 Draw Guide
To export to one of these formats, choose File > Export. On the Export dialog,
specify a file name for the exported document, then select the required format in the
File format list and click the Export button.
See Chapter 6 (Editing Pictures) for more about exporting graphics.
Note
The content of the exported file will depend on the element(s) selected
on the page. No selection results in the entire image being exported. For
most export formats only the image on the current page will be
exported.
Exporting Draw documents as web pages
To export a multi-page Draw document to a series of web pages, choose File >
Export and select HTML Document as the file type. The HTML Export wizard
opens. Follow the prompts to creat the web pages. If you wish, the wizard can
generate a navigation aid to help in moving from page to page.
E-mailing documents
OpenOffice.org provides several ways to send documents quickly and easily as an email attachment in one of three formats: OpenDocument (OpenOffice.org’s default
format), Microsoft Office formats, or PDF.
Note
Documents can only be sent from the OpenOffice.org menu if a mail
profile has been set up.
To send the current document in OpenDocument format:
1) Choose File > Send > Document as E-mail. OpenOffice.org opens your
default e-mail program. The document is attached.
2) In your e-mail program, enter the recipient, subject, and any text you want to
add, then send the e-mail.
If you choose E-mail as PDF, OpenOffice.org first creates a PDF using your default
PDF settings (as when using the Export Directly as PDF toolbar button) and then
opens your email program with the PDF file attached.
You can email a document to several recipients. For details, see Chapter 10 (Printing,
Exporting, Emailing) in the Getting Started book.
Chapter 1 Introducing Draw
23
2
Chapter
Drawing Basic Shapes
Creating simple drawings
You can create 2D and 3D objects in Draw. This chapter shows how to draw simple
2D objects. The following chapters describe how to work with and edit such objects.
All shapes, whether they are lines, rectangles, or more complicated shapes, are
called objects. This is common notation in vector drawing software.
The drawing tools are found on the Drawing toolbar. Figures 19 and 32 show parts of
the standard form of the toolbar, as installed with Draw.
As described in Chapter 1 (Introducing Draw), the Drawing toolbar is normally
located at the bottom of the window. If you do not see it, you can activate it from the
View > Toolbars menu. As in all components of OpenOffice.org, you can place the
toolbar on the Draw window wherever you wish, and you can configure toolbars as
you wish by adding, moving, hiding, or deleting toolbar icons.
Custom shapes
Draw 3 offers the ability to create custom shapes. These correspond to autoshapes in
Microsoft Office.
The two types of shapes differ in their properties and are dealt with separately in the
relevant chapter of this guide. The main differences relate to the behavior of 3D
objects and text handling. Beginners can safely ignore both for the present.
Text frames in Draw 3 have their own geometric format.
Drawing basic shapes
Basic shapes include:
•
•
•
•
•
•
•
Lines
Arrows
Rectangles and squares
Ellipses and circles
Curves and polygons
Connectors
Lines and arrows
Note
When you draw a basic shape or select one for editing, the Information
field in the status bar changes to reflect the action taken or in progress:
Line created, Text frame xxyy selected, TextEdit: Paragraph 1, Row 1,
Column 8 and so on.
Figure 19 shows part of the Drawing toolbar with the icons needed in the following
sections. The Text icon is also included.
Figure 19: Part of the Drawing toolbar
Chapter 2 Drawing Basic Shapes
25
Drawing a straight line
We begin with the drawing of the simplest element—a straight line.
Click on the Line icon
on the Drawing toolbar and place the mouse pointer at the
point where you want to start the line (see Figure 20). Drag the mouse while keeping
the mouse button pressed. Release the mouse button at the point where you want to
end the line. A blue selection handle appears at each end of the line, showing that
this is the currently selected object.
Holding down the Shift key while you draw a line restricts the angle of the line to a
multiple of 45 degrees (0, 45, 90, 135, and so on).
Caution
This is the default behavior of the Shift key. However, if you have used
Tools > Options > OpenOffice.org Draw > Grid to set Snap position
to When creating or moving objects, the action of the Shift key is the
opposite: lines will always be at a multiple of 45 degrees unless the
Shift key is pressed.
Figure 20: Drawing a straight line
Keeping the Ctrl key pressed while drawing a line enables the end of the line to snap
to the nearest grid point.
Caution
The effect of the Ctrl key depends on the settings of the Snap to Grid
option on the View->Grid menu:
Snap to Grid on: Ctrl deactivates the snap option for this activity.
Snap to Grid off: Ctrl activates the snap option for this activity.
The spacing (resolution) of the grid points can be adjusted under Tools > Options >
OpenOffice.org-Draw > Grid. See also Chapter 8 (Tips and Tricks).
Holding down the Alt key while drawing a line results in the line extending outwards
symmetrically in both directions from the start point. This lets you draw lines by
starting from the middle of the line.
The line just drawn has all the standard line attributes, such as color and line style.
To change any of these properties, select the line by clicking on it, then right-click
and select Line.
While you are working with a line (or any other element), you can use the information
field on the status bar to monitor the activity. A description of the current activity or
selection is shown when you are working with elements. Figure 21 shows two
examples.
26
OpenOffice.org 3.3 Draw Guide
Figure 21: The information area in the status bar
Drawing an arrow
Arrows are drawn like lines. Draw classifies arrows as a subgroup of lines: lines with
arrowheads. The information field on the status bar shows them only as lines. Click
on the Line Ends with Arrow icon
to draw an arrow.
Drawing lines and arrows
If you added the lines and arrows toolbar to the main Drawing toolbar you can click
on the small black triangle on the Lines and Arrows
icon on the Drawing
toolbar to open a toolbar with ten tools for drawing lines and arrows (Figure 22).
(Alternatively View > Toolbars > Arrows opens the toolbar as a floating toolbar.) In
both cases, the last-used command will be stored on the toolbar to make it quicker to
call it up again: click directly on the symbol to repeat the last used command chosen
from this toolbar.
After drawing the line, you can change the arrow style by clicking on the Arrow
button in the Line and Filling toolbar and choose from 13 arrow start and end
options.
Chapter 2 Drawing Basic Shapes
27
5 6 7 8
1 2 3 4
9
1 Line
2 Line Ends with Arrow
3 Line with arrow/circle
4 Line with arrow/square
Figure 22: Arrows toolbar
10
5 Line (45°)
6 Line starts with arrow
7 Line with circle/arrow
8 Line with square/arrow
9 Dimension line
10 Line with arrows
Drawing a rectangle or square
Drawing a rectangle is similar to drawing a straight line, except that you click on the
Rectangle icon
on the Drawing toolbar, and the (imaginary) line drawn by the
mouse corresponds to a diagonal of the rectangle. In addition, the outline of the
future rectangle changes shape as you drag the mouse around. The outline may be
shown as a dashed line until you release the mouse button.
Figure 23: Drawing a rectangle
Draw considers squares to be rectangles with sides of equal length. Hold down the
Shift key to draw a square. Hold down the Alt key while dragging with the mouse to
create a rectangle with its center (rather than a corner) at the start point (where you
first clicked the mouse).
Note
28
Blue or green selection handles appear around an object made up of
more than 2 points, showing that this is the currently selected object.
The colors depend on the standard selection mode—green with a normal
selection or blue if you are in the point edit mode. This effect is easily
seen if both Simple Handles and Large Handles are switched on in
the Options toolbar. See Chapter 3 for more details on points.
OpenOffice.org 3.3 Draw Guide
Drawing ellipses (ovals) and circles
To draw an ellipse (also called an oval) or a circle, click on the Ellipse icon
on the
main Drawing toolbar. (A circle is simply an ellipse with both axes the same length.)
The ellipse drawn is the largest ellipse that fits within the (imaginary) rectangle
drawn by the mouse (Figure 24).
Figure 24: Drawing an ellipse
There are three ways to draw an ellipse or a circle:
• Holding down the Shift key while dragging with the mouse draws a circle.
• Holding down the Alt key (together with the Shift key) draws a symmetrical
ellipse (a circle) with the starting point at the center.
• Holding down the Ctrl key while dragging with the mouse draws an ellipse or
circle that snaps to the nearest grid points.
Note
If you first press and hold the Ctrl key down and then click on one of the
icons for Line, Rectangle, Ellipse or Text, a standard sized object is
drawn automatically in the work area: the size, shape, and color are all
standard values. These attributes can be changed later, if desired. This
only works if the icon has no associated toolbar—no arrow on the right
side of the icon.
Adding ellipse and arc tools to the Drawing toolbar
In previous versions of Draw, a long-click on the ellipse button opened a new toolbar
that contained tools for drawing elliptical and circular arcs. This function is not
directly available in Version 3.3.
If you really need this tool, you can add an Ellipse toolbar to the Drawing toolbar:
1) Click on the arrow on the right-hand end of the Drawing toolbar and select
Customize Toolbar.
2) On the Toolbars page of the Customize dialog, select Drawing in the Toolbar
field and click Add.
3) In the Add Commands dialog (Figure 25), select Drawing in the Category list,
select the first Ellipse command in the Commands list, click Add, and then
click Close.
Chapter 2 Drawing Basic Shapes
29
Figure 25: Adding the extended Ellipse toolbar
4) On the Customize dialog, ensure that the checkbox by the new Ellipse
command is selected, and then use the up and down arrow buttons to move it
to the desired position on the toolbar.
5) To remove the simple Ellipse icon from the Drawing toolbar, click to highlight
it in the Customize dialog, and press the Delete key (or click the Modify
button and choose Delete from the drop-down menu).
6) Click OK to complete the process.
You should now see this Ellipse icon
on the Drawing toolbar. If you use this
icon instead of the standard Ellipse icon, all the extended ellipse functions are
available. Clicking on the black arrow by the icon opens the floating Circles and
Ovals toolbar (Figure 26).
Figure 26: Circles and Ovals toolbar
30
OpenOffice.org 3.3 Draw Guide
Drawing elliptical and circular arcs
To draw an arc, choose the appropriate Arc symbol in the Circles
and Ovals toolbar. Drag with the mouse to create a guide circle or
ellipse.
Release the mouse button and move the cursor to the position where
you want the arc to start. In the status bar, you can measure the
actual angle in degrees. Single-click this point; the circle (or ellipse)
disappears and moving the mouse creates the arc. Again, the status
bar shows the current angle.
When you have drawn the arc to the length you want, click once
more. The drawing of the arc is complete.
Curves
The tools for drawing curves or polygons are on the toolbar that appears when you
click the Curve icon
on the Drawing toolbar. This toolbar contains eight tools
(Figure 27).
Note
Hovering the mouse pointer over this icon gives a tooltip of Curve. If you
convert the icon to a floating toolbar, however, the title is Lines, as
shown in Figure 27.
Polygon, Filled
Polygon (45°), Filled
Freeform Line, Filled
Curve, Filled
Freeform Line
Curve
Polygon
Polygon (45°)
Figure 27: Curves toolbar (incorrectly titled “Lines”)
If you move the mouse cursor over one of the icons, a tooltip pops up with a
description of the function. For a more detailed description of the handling of Bézier
curves (curves and filled curves), see Chapter 10 (Advanced Draw Techniques).
• Polygons: Draw the first line from the start point with the left mouse button
held down. As soon as you release the mouse button, a first corner point is
drawn; move the mouse to see how subsequent lines will look. Every mouse
click sets another corner point. A double-click ends the drawing. A filled
polygon automatically joins the last point to the first point to close off the
figure and fills it with the current standard fill color. A polygon without filling
will not be closed at the end of the drawing.
• Polygon 450: Like ordinary polygons, these are formed from lines but with
angles of only 45 or 90 degrees between them.
Chapter 2 Drawing Basic Shapes
31
• Freeform Line: With this tool you can draw just like with a pencil. Press and
hold the left mouse button and drag the mouse. It is not necessary to end the
drawing with a double-click. Just release the mouse button and the drawing is
completed. If you have selected Freeform Line, Filled, the end point is joined
automatically to the start point and the object is filled with the appropriate
color.
Gluepoints and connectors (basics)
Gluepoints
All Draw objects have associated invisible gluepoints, which become visible when you
choose any of the connectors under the Connectors icon
toolbar and then move the mouse pointer over the object.
on the Drawing
Most objects have four gluepoints, as shown in Figure 28. You can add more
gluepoints, and customize gluepoints, using the toolbar of the same name (Figure
29).
Figure 28: Four gluepoints
Figure 29: Gluepoints toolbar
Gluepoints are not the same as the little blue or green “handles” of an object. The
handles are for moving or changing the shape of an object, as described in Chapter 3
(Working with Objects and Object Points), but the gluepoints are used to “glue” a
connector to an object.
For a more detailed description of the use of gluepoints, see Chapter 9 (Organization
Charts, Flow Diagrams, and More).
Connectors
Connectors are lines or arrows whose ends automatically dock to a gluepoint of an
object. Connectors are especially useful in drawing organization charts, flow
diagrams, and mind-maps. Even when objects are moved or reordered, the
connectors remain attached.
Figure 30 shows two Draw objects and a connector.
32
OpenOffice.org 3.3 Draw Guide
Figure 30: A connector between two objects
Draw offers a range of different connectors and connector functions. Open the
floating Connectors toolbar by clicking on the arrow next to the Connector icon
(Figure 31).
Connector with Arrows
Line Connector
Connector Ends with Arrow
Connector
Straight Connector
Straight Connector Ends with Arrow
Straight Connector with Arrows
Line Connector Ends with Arrow
Line Connector with Arrows
Curved Connector with Arrows
Curved Connector Ends with Arrow
Curved Connector
Figure 31: The Connectors toolbar
For a more detailed description of the use of connectors, see Chapter 9 (Organization
Charts, Flow Diagrams, and More).
Drawing geometric shapes
Geometric shapes include:
•
•
•
•
•
•
Basic shapes
Symbol shapes
Block arrows
Flowcharts
Callouts
Stars
Chapter 2 Drawing Basic Shapes
33
Note
If you select shapes for editing, the information field in the toolbar
shows the type of shape selected and, if more than one object is
selected, the total number.
Figure 32 shows part of the Drawing toolbar with the icons referred to in the
following sections. Clicking on the arrow next to the icon opens a floating toolbar
with the relevant work tools.
Figure 32: Part of the main Drawing toolbar
Tip
The use of all these tools is similar to that of the Rectangle tool, even
though they produce different geometric shapes.
Basic shapes
The Basic Shapes icon
makes available a range
of tools for drawing basic shapes, including a rectangle
tool identical to the one on the main toolbar.
The only differences you will see are in the information
field in the status bar (in this case “Shape selected”
rather than “Rectangle selected”).
Symbol shapes
The Symbol Shapes icon
gives you an array of
tools for drawing various symbols.
Block arrows
The Block Arrows icon
toolbar.
34
opens the Block Arrows
OpenOffice.org 3.3 Draw Guide
Flowcharts
The tools for drawing flowcharts are accessed by
clicking on the Flowcharts icon
.
The creation of flowcharts, organization charts, and
similar planning tools are described in Chapter 9
(Organization Charts, Flow Diagrams, and More).
Callouts
Use the Callouts icon
toolbar.
, to open the Callouts
Stars and banners
These tools are associated with the Stars icon
.
You can add text to all these shapes. See “Using text elements in Draw objects” on
page 37.
Adding text to objects
Draw offers two ways to add text to a drawing: in a dynamic text frame as an
independent Draw object or as text contained within a previously drawn object. In the
latter case, the text is integrated with the object.
Using dynamic text frames
The text tool is activated by clicking on the Text icon
for horizontal text or the
Vertical Text icon
for vertical script (to be able see the icon and use this latter
option, you must check Enabled for Asian languages under Tools > Options >
Chapter 2 Drawing Basic Shapes
35
Language Settings > Languages). If you still do not see the Vertical Text icon,
enable it on the Drawing toolbar by clicking the arrow on the right hand side of the
toolbar, select Visible Buttons, and click on Vertical Text to make this icon show on
the toolbar.
Text frames can be moved and rotated like all draw objects. For more details on text
input, see Chapter 10 (Advanced Draw Techniques).
After activating Text command mode, click at the location where you want to position
the text. A small text frame appears. It contains only the cursor. You can move the
frame, if desired. The Text Formatting toolbar appears (Figure 33), and you can
choose the font type, font size, and other text properties and begin to type in your
text.
Figure 33: Text Formatting toolbar
The text frame grows with the text. You can insert a line break with the Shift+Enter
key combination. The Enter key begins a new paragraph. Neither line breaks nor new
paragraphs terminate the text frame.
Figure 34: Text input in a dynamic text frame
Observe the information field in the status bar: it shows that you are editing text and
also provides details about the current cursor location—paragraph, line, and column
numbers.
Text properties can also be changed during text input. Any changes will be reflected
from the cursor position onwards (Figure 35).
Text input – properties
changed
Figure 35: Changing text properties
After choosing the Text icon, you can also draw a frame with the mouse to contain
future text. You can move the frame only after typing some text in it. Line breaks are
inserted automatically at the right edge of the frame when the text fills the frame
36
OpenOffice.org 3.3 Draw Guide
width (Figure 36). You can, however,—just as when editing any other text—insert
your own line breaks, begin new paragraphs, or change any of the text properties.
Text input
in a fixed frame –
the text wraps
automatically
Figure 36: Text frame
Using text elements in Draw objects
A text element is associated with most Draw objects. By means of these elements,
text can be added to an object (see Figure 37).
The exceptions to this are control elements like buttons or list boxes, as well as 3D
scenes and their associated elements and groups.
If the Double-click to edit Text icon
on the Options toolbar is active, you can
start editing an object by double-clicking on it (or by pressing F2). In the middle of
the Draw object, a black bar indicates the text cursor; start typing to input text. The
status bar shows “Text Edit” at the lower left and the position of the cursor within the
text.
Text can contain paragraphs, and these can be in the form of bulleted or numbered
lists. To begin a new line without beginning a new paragraph, use the key
combination Shift+Enter (as in text documents). To end the text input, click next to
the object or press the Esc key.
Figure 37: Adding text to objects
Chapter 2 Drawing Basic Shapes
37
3
Chapter
Working with Objects
and Object Points
Introduction
This chapter looks at the tools and functions that let you modify existing drawings. All
of the functions apply to a selected object or group of objects, which can be
distinguished by small colored squares or circles located around it. These points are
called handles.
The handles form a rectangular frame that is just big enough to contain the object.
Where several objects are selected, the frame around them corresponds to the
smallest rectangle that can contain all of the objects. This frame is called the
selection rectangle.
If the Options toolbar is displayed (select View > Toolbars > Options to turn it on,
if it is not displayed), you can change the size of the handles using two buttons:
Simple Handles shows the handles as flat squares; otherwise they are shown in 3D.
Large Handles increases the size of the handles. You can combine the two effects.
The figure below shows the location of the handles and other buttons.
Figure 38: Location of handles on the Options toolbar
Selection modes
There are three selection modes:
1) Moving and changing size
2) Editing
3) Rotating points
To set the default mode (1 or 2) for selecting objects, click on the Points button
on the Drawing toolbar.
In standard mode (when you begin a new drawing), the Points
button is not active, and the default mode is for selections to be
moved or changed in size; these selections are indicated by
small green squares.
When the Points button is active, the default mode is for
selections to be edited; these selections are indicated by blue
squares. Some objects will have one or more extra handles,
which are larger or colored differently. This is explained in more
detail in “Editing object points” on page 48.
Chapter 3 Working with Objects and Object Points
39
Selections for rotating objects are indicated by small red circles
and a symbol representing the center of rotation. To choose
these selections, click on the Effects drop-down button
from the Drawing toolbar and after that on the object.
Changing the selection mode
To go from one mode to another, you can do one of the following:
• Choose the Points button
from the Drawing toolbar to switch from simple
selection mode to Points mode. You can also use the keyboard shortcut F8
(Points). See “Editing object points” on page 48 for details on using Points
mode.
• Choose the Effects drop-down button from the Drawing Toolbar
to
activate the Rotation mode for a selected object. To exit Rotation mode, click
on the Selection icon
.
• If you often work in Rotation mode, you can choose the Rotation Mode after
Clicking Object button
from the Options bar and cycle through normal
and rotation modes just by clicking on the object. This can be more convenient
than repeatedly clicking the selected object, then clicking the Rotate button
from the Drawing toolbar.
Selecting objects
Direct selection
The easiest way to select an object is to click directly on it. For objects that are not
filled, click on the object’s outline to select it. One click selects; a second click
deselects. To select or deselect more than one object, hold the shift button down
while clicking.
Selection by framing
You can also select several objects at once by using the mouse to
drag a large rectangle around the objects with the Select button,
as shown. For this to work, the
must be active.
icon on the Drawing toolbar
Only objects that lie entirely within the rectangle will be selected.
Selecting hidden objects
Even if objects are located behind others and not visible, they can still be selected.
Hold down the Alt key and click where the object is located. If there are several
overlapping objects, hold down the Alt key and click until you reach the object you
want. To cycle through the objects in reverse order, hold down the Alt+Shift keys and
40
OpenOffice.org 3.3 Draw Guide
click. The number and type of the selected objects is shown at the left of the status
bar to help you to select the correct object.
Note
This method generally works in Windows, but on a Linux system it usually
does not. If the Alt key on your system does not operate as described
above, use the Tab key method described below.
To select an object that is covered by another object using the keyboard, use the Tab
key to cycle through the objects, stopping at the object you wish to select. To cycle
through the objects in reverse order, press Shift+Tab. This is a very quick way to
reach the object you want, but it may not be practical if you have a large number of
objects in your drawing.
When you click on the selected object, its outline will appear briefly through the
objects covering it.
In the illustration to the right, the square located beneath the
circle was selected in this way (the circle has been made
semi-transparent in order to show the square).
Arranging objects
In a complex drawing, several objects may be stacked on top of one another. To
rearrange the stacking order (move an object to the front or to the back of the stack),
select the object, click Modify > Arrange and choose Bring Forward or Send
Backward. Or right-click the object, choose Arrange from the context menu, then
choose Bring Forward or Send Backward.
These options are also available from the Arrange tear-off toolbar accessible from the
icon on the Drawing toolbar. A keyboard shortcut is Shift+Ctrl+plus sign to
bring an object to the top, and Shift+Ctrl+minus sign to send an object to the
bottom.
Note, however, that an object located on the Controls layer always lies above all other
objects.
Moving and dynamically adjusting an object’s size
There are several ways of moving or changing the size of an object. The dynamic
method described here uses the mouse.
When you dynamically change an object, remember to check the left-hand area of the
status bar at the bottom of the Draw window. This area shows detailed information
about the ongoing manipulation
Chapter 3 Working with Objects and Object Points
41
Figure 39: Left end of status bar during dynamic adjustment
For example, when you are resizing an object, the object information fields show
which object is selected, the current position in X/Y coordinates, and object
dimensions (width x height). The information changes as the mouse is moved. The
units of measurement are those selected under Tools > Options > OpenOffice.org
Draw > General.
Dynamic movement of objects
To move an object, select it and then click within the object’s
border and hold down the left mouse button while dragging the
mouse. During movement, the shape of the object appears as
dotted lines to help with repositioning.
To drop the object at its new location, release the mouse button. The new position
appears immediately in the Status Bar.
Dynamic size modification of objects
To change the size of a selected object (or a group of selected
objects) with the mouse, move one of the handles located around
the selection. As shown in the illustration, the outline of the
resulting new object appears as a dotted line while the mouse
button is pressed.
The results depend on which handle you use. To resize an object
along one axis, use the appropriate side handle. To resize along
both axes, use a corner handle. The new size appears immediately in the status bar.
Note
42
If you press the Shift key while resizing an object, the change in size will
be carried out symmetrically with respect to the two axes, so that the
aspect ratio of the object remains the same.
OpenOffice.org 3.3 Draw Guide
Caution
This is the default behavior of the Shift key. However, if you have used
Tools > Options > OpenOffice.org Draw > Grid to set Snap position
to When creating or moving objects, the action of the Shift key is the
opposite: the aspect ratio will be preserved unless the Shift key is
pressed.
Dynamic size modification of objects with the help of the
status bar
If you select an object and modify it using the mouse, the changes are immediately
reflected in the information field of the status bar. With geometric shapes (such as
basic shapes, symbol shapes, block arrows), the only information shown in the status
bar is that the shape is being resized, as shown in the top-left image in Figure 40.
With geometric elements (rectangles, circles, and so on), the changes to the
attributes of the element (either relative or absolute) are also shown, as in the topright image in Figure 40.
Figure 40: The Information field during dynamic size modification of objects
In the case of a rectangle, the new size is shown as percentages of the original x and
y dimensions. For a line, much more information is given: the absolute change in x
and y coordinates of the end point being moved, together with the current length and
bearing of the modified line. These are updated dynamically as the end point is
moved (see Figure 40).
This is the only place where the exact start and end angles of an arc or the length
and bearing of a sloping line are shown. This information enables you to size the
object with considerable accuracy.
Modifying an arc
The beginning and end points of an arc can be modified. Select the arc and click on
the Points icon
on the Drawing toolbar to enter the Edit points mode (described
later in this chapter). In this mode, the handles on the selection frame change—two
larger blue handles appear at the beginning and end points of the arc. When the
mouse hovers over one of these points the cursor will change to a hand.
Chapter 3 Working with Objects and Object Points
43
Figure 41: Editing an arc
If you click and hold the mouse button when the hand cursor appears, moving the
mouse will change the location of the start or end point of the arc. The actual
coordinates are shown in the Status Bar (see lower left graphic in Figure 40.
Rotating and shearing an object using the mouse
Use the red rotation handles to either rotate an object around an axis or slant or
shear the object.
Rotating
To rotate an object (or a group of objects), drag a red corner handle point of the
selection with the mouse. The mouse cursor takes the shape of an arc of a circle with
an arrow at each end. A dotted outline of the object being rotated appears and the
current angle of rotation is dynamically shown in the status bar.
Note
Rotation works in a slightly different way for 3D objects because the
rotation occurs in 3D space and not in one plane. See Chapter 7 (Working
with 3D Objects) regarding rotation when the Edit Points mode is active.
Rotations are made about an axis which is displayed as a small symbol. This is
normally located at the midpoint of the object, but you can move the axis of rotation
with the mouse to any location you like, even outside the object.
If you hold down the Shift key during the rotation, the operation will be carried out in
increments of 15° (subject to whether Snap position is set to When creating or
moving objects under Tools > Options > OpenOffice.org Draw > Grid).
Figure 42: Rotating an object
44
OpenOffice.org 3.3 Draw Guide
Changing inclination or perspective
To slant or shear objects, use the red handles located at the midpoint of an edge of
the selected objects. The mouse pointer changes to a
over one of these midpoint handles.
Note
when the pointer hovers
In current versions of Draw, basic shapes can be sheared and slanted. The
effect however will probably be different to that obtained when a classic
object has the same slant or shear applied to it, particularly when the
mouse is used to create the effect.
The slant axis is the point directly opposite the midpoint handle to be used for
shearing the object. This point stays fixed in location; the other sides and edges move
in relation to it as the mouse is dragged (make sure that the
before dragging).
icon is showing
Figure 43 shows how the vertices move in relation to each other during the shearing
process. The circles represent the path of the vertices. The inclination axis is the
bottom vertex of the triangle (the slanting handle used is the midpoint of the upper
enclosing frame). All points on the figure will move through the same angle
irrespective of the final shape. The actual angle is shown in the status bar.
Figure 43: Shearing an object
Note
The triangle in Figure 43 was produced with the (unfilled) polygon tool
and then Close Object was selected from the context menu.
This tool can be used to produce perspective drawings. The series of pictures in
Figure 44 shows the method of constructing a cuboid or rectangular prism. To
shorten the edges leading from front to back, reduce the length before you distort the
height or width of the surface.
Figure 44: Perspective production of a cuboid
As with rotation, you can make the slanting occur in steps of 15° by pressing the
Shift key while moving the handle.
Chapter 3 Working with Objects and Object Points
45
Setting size and position exactly
You can position and resize objects with the mouse, but this method is not very exact.
If you need accurate positioning of objects, use Format > Position and Size from
the menu bar, or right-click the object and select Position and Size from the context
menu, or press F4.
Position and Size
Open the Position and Size dialog (see Figure 45) and click on the first tab to set
the appropriate values.
Figure 45: Position and size of an object
Position is defined as an X,Y coordinate relative to a fixed point (the base point),
typically located at the upper left of the drawing area. If desired, you can temporarily
change this base point to make positioning or dimensioning simpler (click on the
radio button corresponding to the location of the base point in either of the two
selection windows on the right side of the dialog—upper for positioning or lower for
dimensioning). The possible base point positions correspond to the handles on the
selection frame plus a central point. The change in position lasts only as long as you
have the dialog open; when you close this dialog, Draw resets the base point to the
standard position.
Tip
The Keep ratio checkbox is very useful. Click it to keep the ratio of width
to height fixed while you change the size of an object.
Either or both the size and position can be protected so that they cannot be
inadvertently changed. Check the appropriate boxes to achieve this.
Tip
46
You cannot move an object? Check to see if the position is protected!
OpenOffice.org 3.3 Draw Guide
Rotating objects
Click on the Rotation tab of the Position and Size dialog (see Figure 46). Here you
can define the rotation angle, as well as the location of the pivot point.
Figure 46: Rotating an object
Slant and corner radius
The slant angle (inclination or shearing) and corner radius can be set in this dialog
(Figure 47).
Figure 47: Setting rounded corners and slant angle
Corner radius
Figure 48: Example of setting rounded corners
Chapter 3 Working with Objects and Object Points
47
You can use this dialog to round the corners of the usual Draw objects—text boxes,
legends, rectangles, and squares, as shown in Figure 48. The same effect can be
achieved when you are in the points mode (click the Points icon on the Drawing
toolbar), by dragging the large handle with the mouse. The larger the value for the
corner radius, the rounder the object becomes.
Slant
You can shear both the older, classic Draw objects and the newer Shape objects.
Enter the slant angle in the box marked Slant Angle.
Figure 49: Example of setting the slant angle
Editing object points
For polygons and Bézier curves, Draw offers a complete set of tools that let you
accurately edit the contour of an object. To edit other objects in the same way, you
must first convert them into curves. To do this, select the object, then right-click and
choose Convert > To Curve or choose Modify > Convert > To Curve from the
menu bar.
You can also convert the shapes to a polygon (Convert > To Polygon). With
polygons, the edge points are always connected with straight lines and not with
curves. Some of the techniques described work equally with polygons as with curves.
Another way to change the form of basic shapes
In current versions of Draw, many of the new shapes can be directly edited without
having to convert them to curves first. You can recognize these objects by the
presence of one or more circular yellow handles as shown in Figure 50.
Figure 50: Some basic shapes with yellow “handles”
48
OpenOffice.org 3.3 Draw Guide
The mouse pointer changes shape when hovered over a yellow handle. If you drag
one of these handles, you can modify the shape of the object; the type of change is
dependent on the shape itself. For example, you can round the corners of a rectangle
or square, change the angles of an arc or ellipse, or alter the control points of a
circular or elliptical segment.
How curves work
The editing of curves depends on the mathematics of Bézier curves1. The complete
study of such curves goes beyond this scope of this guide, and only the basics are
covered here. Chapter 10 (Advanced Draw Techniques) provides more information on
drawing and manipulating Bézier curves.
The editing of a Bézier curve consists in principle of moving points or tangents
passing through these points. Each tangent has two control points—one at each end
—and a junction point where it meets the curve. The relative angle and distance
between the control points determine the shape of the curve. Figure 51 shows
several variations starting from a basic circle and changing only one point on the
circle.
You can create many different shapes by moving either the junction point itself, or
one or both of the round handle points at either end of the tangent.
Figure 51: Creating different shapes by changing the tangent
Draw offers even more possibilities when you use the functions on the Bézier curve
Edit Points toolbar.
The Edit Points toolbar
When you work in Edit Points mode, use the Edit Points toolbar, shown in Figure 52.
To activate this toolbar, choose View > Toolbars > Edit Points. It will then appear
whenever you select a curve and the Edit Points icon on the Drawing toolbar is
active.
On this toolbar, icons may be active or inactive depending on the selected object and
object point. With the Convert to Curve icon, you can determine for individual points
whether their connection will be made with straight lines or with curves.
Only with curves are the icons for tangents activated. An object that contains no
curves is treated as a polygon.
1 Bézier curves were invented by Pierre Bézier, an engineer working with the Renault car
manufacturer, who developed the technique in the 1960s. The technology was intended to
make modeling the surface of vehicles easier.
Chapter 3 Working with Objects and Object Points
49
1
2
3
4
Points
Move Points
Insert Points
Delete Points
5
6
7
8
Split Curve
Convert to Curve
Corner Point
Smooth Transition
9 Symmetric Transition
10 Close Bézier
11 Eliminate Points
Figure 52: Edit Points toolbar
The three kinds of tangent
Three buttons in the Edit Points Toolbar let you select the type of tangent and convert
from one type to another. Only one of these buttons can be active at any given time.
Their use is described in the following chapter.
Figure 53:
Symmetric
tangent
Figure 54:
Asymmetric
tangent
Choose the Symmetric Transition button
to work
with a symmetrical tangent (Figure 53). Any movement of
one or the other of the handles is carried over
symmetrically to the other handle.
Choose the Smooth Transition button
to separately
adjust the lengths of the two parts of a tangent and so
make the curve flatter or steeper. In Figure 54, the curve
is flatter on the longest side of the tangent. The tangent
remains as a single straight line. This kind of tangent is
known as a smooth junction.
It is also possible to separate both sides of the tangent
from the curve. In this case, the central point is known as
the inflexion point. Using this technique, you can draw
spikes and troughs in objects. Choose the Corner Point
Figure 55:
Inflexion point
button
to create an inflexion point around the
selected point.
Examples
The other buttons in the Edit Points Toolbar are described here in relation to working
examples. The following examples start from a filled circle. As mentioned earlier, in
order to use Edit Points mode, you first need to convert the object to a curve.
You will notice that after the conversion, the handles located in the corners of the
rectangle have disappeared. This behavior is normal in that the handles which are
used in the Edit Points mode are located along the outline or trace of the drawn
object.
50
OpenOffice.org 3.3 Draw Guide
The Move Points button
is the default mode when
editing points. If it has not been activated, click on its
button. When this mode is active, the mouse pointer has
the following shape when it is hovered over an edit point:
Figure 56: Moving a
junction point
Movement of a point is one of the easiest manipulations to
do. Figure 56 illustrates how you can draw an egg very
easily by starting from a circle and dragging the top point
upwards.
To change the direction or location of the tangents, move
the circular handles at each end. The mouse pointer then
looks like this:
Figure 57: Rotating a
tangent
Use the Points button
to add an extra edit point to
an existing curve. Click on the curve at the spot where
you want to insert a point and then move the mouse
slightly in any direction while holding down the button.
Caution
If you just click, the new point will not be
added.
Figure 58: Adding an
edit point to a curve
The tangent attributes associated with the new point
depend on the buttons that are selected on the toolbar.
Chapter 3 Working with Objects and Object Points
51
➊
The Delete Points button
has the opposite effect: it
subtracts one or more points from the curve. The
resulting curve stretches itself automatically around the
remaining points after subtraction.
Select one or more points to delete. You can select several
points by holding down the Shift key (➊).
When you have selected the points you want to delete,
click the Delete Points
button. The selected points
disappear from the curve, which then reforms around the
➋
Figure 59: Deleting
points from a curve
➊
➋
remaining points (➋).
You can also delete the selected points by pressing the
Del key on the keyboard.
Use the Split Curve button
to split or cut a curve at
the location of the selected handle. If the object is filled, it
will be emptied because the curve that represented the
edge is no longer closed.
Check that you have selected the correct handle (➊),
click the Split Curve button (➋) and notice that the
object is no longer filled. You can then check, by moving
3
the point, that the curve has indeed been separated ( ➌).
If you have an open curve, the start point of the curve is
larger than the others.
Figure 60: Cutting a
curve
You can also separate a curve at several points
simultaneously. Keep the Shift key pressed down and
select all of the points at which the cut should occur.
Drag and drop segments with the mouse to move them
from the original curve.
Figure 61: Moving a
segment
52
OpenOffice.org 3.3 Draw Guide
To close an existing curve, select an open curve and click
on the Close Bézier button
.
The opening point is identified by a slightly larger handle
(Figure 62).
Figure 62: Closing
an open curve
1.
Select object and set
Edit points mode
The Eliminate Points button
with lines with multiple points.
button only functions
If the button is active, click on a point, hold the mouse
button down and move the mouse to draw virtual straight
lines between the neighboring left and right points.
Release the mouse button when the two lines have more
or less coalesced into one straight line. The point is
deleted and the new line replaces the previous two lines,
eliminating one point.
2.
Draw virtual lines
3.
Release mouse button
Note that this only works when the angle between the two
lines (shown dashed in Figure 63) is less than a certain
amount.
In the Tools > Options > OpenOffice.org Draw > Grid
window there are options for snap settings relating to
editing points when rotating and in point reduction mode.
Figure 63: Reducing a
line by one point
Chapter 3 Working with Objects and Object Points
53
The Rotate function from the Effects drop-down button
on the Drawing toolbar and the Rotation Mode
after Clicking Object button
on the Options toolbar
can be used in Edit Point mode. In this case, it can be
used to move single points around the contour of an
object.
Switch into rotation mode by clicking on either of the
rotation buttons. Notice that in rotation mode, all of the
tangent points become red dots.
➊
Select the point to be moved and then drag it around the
contour while keeping the left mouse button pressed
down (➊). When you release the mouse button, the point
will be moved to the new position (➋).
➋
➋
Figure 64: Moving a
point on a curve
54
If you move one of the handles located at the end of the
tangents during rotation, you will make the object rotate
in exactly the same way as with the usual rotation
operations.
Important: To exit the effects mode, do not just click on
the Effects button; click the Select button
on the
Drawing toolbar.
OpenOffice.org 3.3 Draw Guide
4
Chapter
Changing Object
Attributes
Toolbars and menus
To change an object’s attributes (such as color or border width) you can use the Line
and Filling toolbar or the context menu.
Line and Filling toolbar
If the Line and Filling toolbar is not visible, you can display it using View > Toolbars
> Line and Filling. From here you can edit the most common object attributes. You
can also open the Line dialog by clicking on the Line
icon and the Area dialog by
clicking on the Area
icon to see more options.
1 Styles and Formatting
4 Line Style
2 Line
5 Line Width
3 Arrow Style
6 Line Color
Figure 65: Line and Filling toolbar
7
Area
8–9 Area Style / Filling
10 Shadow
Text Formatting toolbar
When you select text, the Line and Filling toolbar changes to show text formatting
options. You can also display the Text Formatting toolbar by choosing View >
Toolbars > Text Formatting.
Figure 66: Text Formatting toolbar (when text is selected)
The context menu
When an object is selected, you can right-click on the object to bring up a context
menu (Figure 67). The context menu provides additional access to the options shown
above and another way to change an object’s attributes. The entries with a small
arrow on the right-hand side contain a submenu.
56
OpenOffice.org 3.3 Draw Guide
Figure 67: Right-click on an object to see the context menu
Editing lines and borders
Lines, arrows, and the borders of an object are managed through the same dialog
(Figure 69).
Figure 68: Lines and borders
You can change some properties from the Line and Filling toolbar. To see more
options, select the object and right-click on the object and choose Line from the
context menu. This opens the Line dialog.
Chapter 4 Changing Object Attributes
57
Figure 69: Line dialog (right-click on an object and choose Line).
Common line properties
In most cases the property you want to change is the line’s style (solid, dashed,
invisible, and so on), its color, or its width. These options are all available from the
Line and Filling toolbar.
Figure 70: Common line options (style, width, color)
You can also edit these properties from the Line dialog. They are on the first tab, left
column (see Figure 69). From the Line dialog you can also change the line’s
transparency. Figure 71 illustrates different degrees of transparency.
Figure 71: The vertical lines have different levels
of transparency (0%, 25%, and 50%).
58
OpenOffice.org 3.3 Draw Guide
Drawing arrows
Arrowheads (and other line endings—usually referred to in this guide collectively as
arrows) are a line property. Select a line and click on the Arrow Style
This opens the Arrowheads menu.
icon.
Figure 72: Arrowheads menu
There are several types of arrowheads available. Each end of the line can have a
different arrowhead (or no arrowhead).
Note
Arrowheads are only applicable to lines. They have no effect on the
border of an object.
In the Line dialog (Figure 69), Arrow styles on the right-hand side contains a number
of options to fine tune the arrow properties. If Synchronize ends is selected, both
line endings will have the same appearance. The Center option places the center of
the arrow over the end point of the line. If this option is not selected, the line ends at
the far edge of the arrow. The following sketch illustrates the difference.
Figure 73: Default arrowheads (left) vs centered
arrowheads (right)
Chapter 4 Changing Object Attributes
59
Line shadows
Lines can have a shadow property associated with them.
Figure 74: Shadow page of Line dialog
Check the box Use shadow to enable this feature. The properties shown—position,
distance, color, and transparency—may be independently adjusted to your choice and
the results seen in the preview window. You can also click on the Filling
icon on
the Line and Filling toolbar—next to the area fill functions – to get a basic shadow.
Customizing line and arrow styles
You are not constrained to using the line and arrow styles provided by default in
Draw. You can modify the styles and create your own.
Customizing line styles
In the Line dialog, click on the Line Styles tab (see Figure 75). From here you can
customize the line styles or create your own by clicking on the Add button. You can
change the length of the dashes, the space between them, and several other
attributes.
Use the Load Line Style
and Save Line Style
icons to save a new definition
or read one from disk (file extension .sod).
60
OpenOffice.org 3.3 Draw Guide
Figure 75: Editing line styles
Customizing arrow styles
You can also create your own arrowheads to provide some interesting effects, such
as:
The first step is to draw a curve with the shape you want for the arrowhead.
Figure 76: To create your own arrowhead, you must
first draw a curve.
Note
The arrowhead must be a curve. A curve is something you could draw
without lifting a pencil. For example,
is a curve but
is not a curve.
You can however draw forms which are not curves and then convert
them to a curve afterwards.
Select the curve, open the Line dialog, and go to the Arrow Styles page. Click on
Add, enter a name for the arrow style and click OK (see Figure 77).
Chapter 4 Changing Object Attributes
61
Tip
The part of the shape which should point in the direction of the line must
be drawn facing upwards. In Figure 76 the top of the shape will point
towards the “outside” of the line.
Figure 77: Adding an arrow style
Now you can access the new style from the Arrow style list (Figure 78) or the
Arrowheads dialog (Figure 72).
Figure 78: Arrow style list
62
OpenOffice.org 3.3 Draw Guide
Editing the inside (fill) of an object
The OpenOffice.org term for the inside of an object is Area fill. The area fill of an
object can be a uniform color, a gradient, a hatching pattern, or an image. It can be
made partly or wholly transparent and can throw a shadow.
Figure 79: Different types of area fill
Common fill properties
In most cases, you will choose one of the standard fill options, whether it is a color, a
gradient or an image. These options are all available from the Line and Filling
toolbar.
If you want no fill at all, select the object you wish to edit and on the Line and
Filling toolbar select the option Invisible on the pull down list at the right of the
paint can.
Figure 80: Common fill options
Fill with a uniform color
Select the object you wish to edit. On the Line and Filling toolbar, select Color on
the pull down list at the right of the paint can, and then choose a color from the righthand menu.
Figure 81: Filling with a color
Chapter 4 Changing Object Attributes
63
Fill with a gradient
Select the object you wish to edit. On the Line and Filling toolbar, select Gradient
and then choose a gradient from the right-hand menu.
Figure 82: Filling with a gradient
Fill with a line pattern
The OOo term for line patterns is Hatching. Select the object you wish to edit. On the
Line and Filling toolbar, select Hatching and then choose an option from the menu.
Figure 83: Filling with a line pattern
Fill with an image
You can fill an object with a bitmap image (as opposed to a vector graphic image).
Select the object you wish to edit. On the Line and Filling toolbar, select Bitmap
and then choose an option from the menu.
64
OpenOffice.org 3.3 Draw Guide
Figure 84: Filling with an image
Adding a shadow to an area
Click on the Filling
icon on the Line and Filling toolbar—next to the area fill
functions (Figure 85).
Figure 85: Adding a shadow
Advanced area fill options
Click on the Area icon
to bring up the Area dialog. From this dialog, you can fine
tune the area fill of an object in greater detail.
Creating your own fill color
Click on the Colors tab of the Area dialog (Figure 86). From here you can modify
existing colors or create your own.
Depending on the color model in use (RGB or CMYK can be selected from the pull
down menu), you can change the individual values of the constituent colors—Red,
Green, and Blue or Cyan, Magenta, Yellow, and Black. Click on Add to add this color
to the color table. Clicking on the Modify button will change the values of the
current color (here it is Blue 8, shown in the upper rectangle) to those on the screen
in the lower rectangle. The Edit button allows you to fine tune the color using a
palette with visual feedback.
Further explanation about color palettes can be found in Chapter 8 (Tips and Tricks).
Chapter 4 Changing Object Attributes
65
Figure 86: Customizing the color palette
Creating your own gradient
On the Area dialog, click on the Gradients tab. From here you can modify existing
gradients or create your own.
Figure 87: Customizing gradients
A gradient works by creating a smooth transition from one color to another. First, you
need to choose two colors (Figure 88).
66
OpenOffice.org 3.3 Draw Guide
Figure 88: Choosing colors for a gradient
Then choose a type of gradient. There are several available (Linear, Axial, Radial, and
so on) and each has up to four different options to specify it in detail. For example, a
radial gradient has a center you can specify (Figure 89).
Figure 89: Center option in a radial gradient
Figure 90 shows how an ellipsoid gradient is rotated, moved vertically and
horizontally, and the color of the border area varied.
Figure 90: Center, Angle, and Border options for a gradient
Creating your own hatching (line pattern)
On the Area dialog, click on the Hatching tab (Figure 91). From here you can modify
existing hatchings (line patterns) or create your own.
Chapter 4 Changing Object Attributes
67
You can customize options like the spacing between lines, the angle and the color of
the lines. There is no way to edit the line thickness.
Figure 91: Modifying hatchings
Creating your own bitmap fill
You can add your own bitmap images to fill an area. First, you need to create the
bitmap image. This could be a photo or another sketch you have created in another
program. For example, you can draw something with Draw and export it as a PNG
format image file.
To export a PNG image file: Create the image, select it, then choose File > Export,
choose PNG from the pull-down list of file formats, give the file a name, and save it.
To use an image as a bitmap fill, open the Area dialog and click on the Bitmaps tab
(Figure 92).
Figure 92: Adding your own bitmap images
68
OpenOffice.org 3.3 Draw Guide
From there you can add new bitmap images to serve as area fills. Click on Import
and choose a file you previously saved. Give it a name that will make it easy to
remember. The last imported image will appear at the bottom of the pull-down list of
bitmap fills. Now you can use that image as an area fill.
Figure 93: Adding your own bitmap images
Tip
If the imported image seems to be very small in the preview (Figure 92)
you probably forgot to select the image before you exported it. In that
case, the exported image would be the whole page with a (small) drawing
on it.
Customizing shadows
First, select the object you want to apply a custom shadow to. Open the Area dialog
and go to the Shadow tab (Figure 94). There you can customize the shadow’s
position, distance and color.
Figure 94: Customizing shadows
Chapter 4 Changing Object Attributes
69
Shadows can also have transparency, so the shadow does not hide objects behind it.
Figure 95: Shadow with 50% transparency
Adding transparency
You can make objects partly or fully transparent, or even a with a varying degree of
transparency (as a gradient). On the Transparency page (Figure 96), choose
Transparency (for a uniform transparency) or Gradient for a gradient transparency.
Figure 96: Transparency page of Area dialog
An example of gradient transparency is shown in Figure 97. See also “Dynamic
gradients” on page 76.
Figure 97: Example of gradient transparency
70
OpenOffice.org 3.3 Draw Guide
Using styles
Suppose that you want to apply the same area fill, line thickness, and border to a set
of objects. This repetitive process can be greatly simplified by the use of styles. Styles
allow you to define a formatting template (a style) and then to apply that style to
multiple objects. For more about styles, see Chapter 6 (Introduction to Styles) in the
Writer Guide.
Click on the Styles and Formatting
icon on the Line and Filling toolbar or
press the F11 key to open the Styles and Formatting window (Figure 98). This
window can be docked to the left or right side of the main Draw window, if you wish.
Figure 98: Styles and Formatting window
Creating a new style
Select an object and customize the area fill and border. When you are satisfied, click
on the New Style from Selection
icon on the Styles and Formatting window.
This defines a new style based on the selected object. Type a name for the new style
and click OK.
Applying a style
Once the new style is defined, you can apply it to other objects. Select another object
and double-click on the style name you defined. The new object will acquire the area
fill and line properties of that style.
Tip
Question: What happens if I modify a style after it has been applied?
Answer: Then every object with that style is updated automatically!
Chapter 4 Changing Object Attributes
71
Modifying a style
Modifying a style is similar to creating a new style. Select an object with that style
and change the area and line properties. When satisfied, click on the Update Style
icon
. Alternatively click the Styles and Formatting icon or press F11, right-click
the style you wish to modify and select Modify. Edit the properties you want to
change and click OK to finish.
Special effects
First make sure that the Drawing toolbar is selected (View > Toolbars > Drawing).
On the Drawing toolbar, locate the Effects icon
. Click on the arrow next to that
icon. This opens a submenu with all the special effect tools (see Figure 99).
1 Rotate
2 Flip
3 In 3D Rotation Object
4 Set in Circle (perspective)
5 Set to Circle (slant)
6 Distort
7 Transparency
8 Gradient
Figure 99: Mode tear-off submenu
The tools are described in the following sections with the exception of the 3D rotation
tool, which is described in Chapter 7 (Working with 3D Objects).
Rotating an object
Click on the Effects
icon to select the Rotate tool. Then select an object. The
selected object will have red handles instead of the usual green handles.
Grab one of the handles and move it to
rotate the object. The black circle in the
middle of the object is the pivot (center of
rotation). You can move the location of the
pivot with the mouse.
72
OpenOffice.org 3.3 Draw Guide
Flip an object
Select an object and click on the Flip icon
. You will see a
dashed line through the middle of the object.
This dashed line is the axis of symmetry. The object will be
reflected about this line. Move one or both ends of the line
with your mouse to set the orientation of the axis.
Then, grab any one of the eight green handles and move it
across to the other side of the dashed line. The new position of
the figure is shown faintly until the mouse is released.
Note
If you press the Shift key while moving the line, the line will rotate in 45degree increments.
Mirror copies
Officially, this useful command does not (yet) exist in Draw. It can, however, be easily
emulated.
Move the axis of symmetry to the desired location of the mirror axis. Copy the object
to the clipboard. Flip the object, then click on an empty area of the Draw screen in
order to deselect the object. Paste from the clipboard to put a copy of the object in its
original location and now you have a mirror copy.
Figure 100: Making a mirror copy of an object
Chapter 4 Changing Object Attributes
73
Distorting an image
There are three tools on the Effects menu that let you drag the corners and edges of
an object to distort the image.
The Distort tool distorts an object in perspective, the Set to Circle (slant) and Set
in Circle (perspective) tools both create a pseudo three-dimensional effect.
The results of using these tools are shown in the following figures.
Distort an object
Select an object and click on the Distort icon
. Draw will ask if you want to
transform the object to a curve. This is a necessary step before distortion, so click
Yes. Then you can move the object handles to stretch it.
The corner handles distort, as shown in Figure 101. The midpoint handles distort the
figure either horizontally (handle on vertical side of figure) or vertically (handle on
horizontal side of figure).
Figure 101: Distort an image
Set in circle (perspective)
Select an object and click on the Set in Circle (perspective)
icon. Draw will ask
if you want to transform the object to a curve. This is a necessary step before
distortion, so click Yes. Then you can move the object handles to give a pseudo threedimensional perspective).
74
OpenOffice.org 3.3 Draw Guide
Figure 102: Set an image in a circle with perspective
Set to circle (slant)
Select an object and click on the Set to Circle (slant)
icon. Draw will ask if you
want to transform the object to a curve. This is a necessary step before distortion, so
click Yes. Then you can move the object handles to give a pseudo three-dimensional
slant perspective.
Figure 103: Set an image to a circle with slant perspective
Note
Transforming an object into a curve is a safe operation, but it cannot be
reversed other than by clicking the Undo button.
Chapter 4 Changing Object Attributes
75
Dynamic gradients
You can control transparency gradients in the same manner as color gradients. Both
types of gradient can be used together. With a transparency gradient, the direction
and degree of an object’s fill color changes from opaque to transparent (in a regular
gradient, the fill changes from one color to another, but the degree of transparency
remains the same).
If you have assigned transparency to an object with a color fill, you can control the
transparency by clicking on the Transparency icon
. To define a transparent
gradient, select an object, choose a transparency fill from the Line and Filling
toolbar, The transparency icon is now active. When you click on this icon, a dashed
line connecting two squares appears on the object. Move the two squares to modify
the gradient. You can define the direction of the gradient (vertical, horizontal, or at
any angle) and the spot at which the transparency begins.
A regular color gradient can be defined in the same manner. Select an object, choose
a gradient fill from the Line and Filling toolbar. The Gradient icon
is now
active. When you click on the gradient icon, a dashed line connecting two squares
appears on the object, just as it does for a transparency gradient.
In both cases, click outside the object to set the gradient.
If the transparency and gradient icons are not visible, you can display
them using View > Toolbars > Mode.
Note
Moving the squares will have different effects, depending on the type of
gradient. For example, for a linear gradient, the start and end squares of
the gradient will always be situated to either side of the center point of
the object.
The three examples in Figure 104 demonstrate how the type and degree of
transparency can be controlled.
76
OpenOffice.org 3.3 Draw Guide
A single color object and a transparency gradient,
covering part of the underlying object.
The gradient can be dynamically adjusted, made
more transparent by moving the white square or
more opaque by moving the black square.
An object with a color gradient, completely
covering another object.
The gradient is adjusted dynamically by moving
the squares – the color of the square relating to
the increase or decrease in that color.
An object with both color and transparency
gradients, partly covering the underlying object.
Figure 104: Dynamic gradients
Chapter 4 Changing Object Attributes
77
5
Chapter
Combining Multiple
Objects
Introduction: grouping and combining objects
Using Draw, you can combine drawing objects together in two distinct ways:
grouping and combining. These two methods allow you to treat multiple objects as
one unit, or to merge objects to form a new shape.
Grouping is like putting objects in a container. You can move them as a group and
apply global changes to them. A group can always be undone and the objects that
make up the group can always be manipulated separately.
A combination is a permanent fusion of objects leading to a new object. The original
objects are no longer available as individual entities and the operation is not
reversible.
Tip
To select multiple objects, click on each object while holding down the
Shift key or click the Select icon (on the Drawing toolbar) and draw a
rectangle around the objects.
Grouping objects
Grouping by common selection
When several objects are selected, any operations you carry out are applied to all of
the objects. For example, you can rotate a group of objects in its entirety. Groups
obtained through common selection of several objects are undone as soon as you
click outside the group. However, you can choose to maintain a grouping so that the
selected objects will remain together after they are deselected.
Maintaining groups and undoing groups
To group objects, first select the objects, then right-click and choose Group from the
pop-up menu. You can also use the keyboard shortcut Control+Shift+G or choose
Modify > Group from the menu bar.
When objects are grouped, any editing operations carried out on that group are
applied to all members of the group. If you click on one member of the group, the
whole group is selected.
Figure 105: Grouping objects using the right-click
menu
The objects of a group retain their own individual properties. To undo a group, rightclick and choose Ungroup from the pop-up menu, use the keyboard shortcut
Control+Alt+Shift+G or choose Modify > Ungroup from the menu bar.
Chapter 5 Combining Multiple Objects
79
Editing individual objects in a group
You can edit a member of a group individually without breaking the group. To do this,
right-click and choose Enter group or double-click on the group.
Figure 106: When you enter a group, objects outside
the group cannot be selected and appear pale
Once inside the group, click on any object to edit it.
Figure 107: Editing an object inside a group
To leave this mode, right-click and choose Exit group or double-click outside the
group.
Nesting groups
You can create “nested” groups, or groups of groups. In this case, Draw keeps the
initial group hierarchy. If you ungroup a group made of other groups, you are left
with individual groups that you can then ungroup further, until only single objects
remain.
Combining objects
In contrast to grouping functions, combinations create a new object; it is not possible
to edit an individual constituent afterwards. Select a collection of objects, then rightclick and choose Combine from the pop-up menu or use the keyboard shortcut
Control+Shift+K. The result of this operation is shown in Figure 108.
Figure 108: Combining objects
80
OpenOffice.org 3.3 Draw Guide
At first glance, the appearance of the combined objects can seem rather surprising.
However, once you understand the rules governing combination in Draw, it will
become clearer.
• The attributes (for example, area fill) of the resulting object are those of the
object furthest back. In this example, it is the circle.
• Where the objects overlap, the overlapping zone is either filled or empty
depending on the number of overlaps. When the number of overlaps is even,
you get an empty space; when the number is odd, you get a filled area.
Figure 109: Odd numbered overlaps are filled, even numbered
overlaps are empty
Tip
You can reorder objects before combining them so that they are further
back or further forward: right-click on the object and select Arrangement
from the pop-up menu. See also “Aids for positioning objects” on page 83.
An object which is a combination can be broken up again by selecting Modify >
Split or using the keyboard shortcut Control+Alt+Shift+K. The combination can also
be broken up into its constituent parts by selecting Modify > Break. These are not
an exact equivalent to ungrouping, as the objects were converted to Bézier curves
when they were combined. An object which is split will, for example, have an ellipse
converted to a Bézier curve.
A object which is broken will consist of a set of base level objects (for example, a
rectangle will be broken into 4 separate lines) and the original formatting—line
thickness, colors, and area properties—is not retained.
Connecting lines
Lines may be connected by selecting them and using Modify > Connect. The
connections established are based on joining the ends of pairs of lines with minimum
separation. Once a group of lines is connected, you can “close” the remaining gap by
selecting the line, right-clicking and choosing Close Object. The resultant object is
filled with the default fill. If you modified the line properties (color, weight) these are
retained in the resulting polygon.
Merging, subtracting, or intersecting shapes
After you have selected more than one object, the Merge, Subtract, and Intersect
functions can be reached in the Modify > Shapes menu or though the group’s rightclick menu under the heading Shapes.
Chapter 5 Combining Multiple Objects
81
Merge
When you merge objects, the new object covers the entire
surface of the original objects (it is the union of the
objects). In the same way as combining, the fill of the
merged object is determined by the fill of the object
furthest in the background. Other properties are not
taken over into the new object.
Subtract
When you subtract, the front object is subtracted from the
object behind it.
Intersect
When you intersect two objects, you get only the area
covered by both objects.
Tip
For more information on moving objects to the front or back, see page 83.
Practical example
The following example shows how you can use the merge functions to create a
complex shape—a knife with a wooden handle.
1) Draw an ellipse and then a rectangle overlapping half
of its width.
2) Select both shapes, right-click, and choose Shapes > Subtract from the popup menu. The result should resemble the shape to the right:
3) Draw another rectangle and put it over the top half of the ellipse. Then
subtract again.
82
OpenOffice.org 3.3 Draw Guide
4) Draw a small ellipse covering just the lower right corner and subtract again.
5) The knife blade is now complete. To make the handle, draw a rectangle and an
ellipse as shown.
6) Merge the shapes together.
7) Group this image with the previous one.
Aids for positioning objects
Draw has various tools to help you arrange the objects with respect to each other.
Here we explore some of the more important ones.
Moving an object to the front or to the back
When you combine or merge objects, the end result varies drastically depending on
which object is “in front” and which one is “behind”. In Figure 110 you can see the
difference.
Figure 110: Subtracting objects: the result varies depending on which object is in
front.
If you imagine several objects stacked one on top of the other, the one referred to as
“Front” is the one on top of the stack. The one referred to as “Back” is the one on the
very bottom of the stack.
First select an object, then on the Drawing toolbar, long-click on the Arrange icon
to open the Position toolbar. This toolbar can be torn off and made to float.
Chapter 5 Combining Multiple Objects
83
1
2
3
4
Bring to Front
Bring Forward
Send Backward
Send to Back
5 In Front of Object
6 Behind Object
7 Reverse
Figure 111: The floating Position toolbar
brings the selected object to the front of the group.
brings the selected object one step forwards.
sends the selected object one step backwards.
sends the selected object to the back of the group.
moves the selected object in front of another chosen object.
moves the selected object behind another chosen object.
Click first on the object you want to change in position. Next click on the icon
and then move the mouse over the other object. The mouse cursor changes
84
OpenOffice.org 3.3 Draw Guide
into a hand and the outline of the second object becomes a dashed line (see
below). Clicking on this object completes the rearrangement of position.
reverses the order of the selected objects (this option is grayed out if only
one object is selected).
Aligning objects
Select two objects and long-click on
on the Drawing toolbar to open the Align
toolbar. This toolbar can be torn off and made to float. The tools help you position
objects with respect to each other.
1 Align left
2 Center horizontally
3 Align right
4 Align top
5 Center vertically
6 Align bottom
Figure 112: The floating Align toolbar
Align left.
Center horizontally.
Chapter 5 Combining Multiple Objects
85
Align right.
Align top.
Center vertically.
Align bottom.
If you have selected only one object, clicking the various buttons on the Align toolbar
positions the object in relation to the drawing page.
Distributing the distance and space between objects
Select at least three objects. Now you are able to select the option Distribution on
the Modify menu or from the right-click menu. The Distribution dialog contains a
number of options, described below.
Figure 113: Distribution of spacing between objects
86
OpenOffice.org 3.3 Draw Guide
Horizontal distribution
None. Does not distribute the objects horizontally.
Left. The left edges of the objects are evenly spaced from one another.
Center. The horizontal centers of the objects are evenly spaced from one another.
Spacing. The horizontal spacing between the objects is evenly distributed.
Right. The right edges of the objects are evenly spaced from one another.
Vertical distribution
None. Does not distribute the objects vertically.
Top. The top edges of the objects are evenly spaced from one another.
Center. The vertical centers of the objects are evenly spaced from one another.
Spacing. The vertical spacing between the objects is evenly distributed.
Bottom. The bottom edges of the objects are evenly spaced from one another.
Figure 114 shows four objects before distribution of horizontal spacing.
Figure 114: Before distribution
The result of the selections made in Figure 113 is shown in Figure 115.
Figure 115: After distribution: change to equal horizontal spacing, no vertical change
Chapter 5 Combining Multiple Objects
87
6
Chapter
Editing Pictures
(Raster Graphics)
Introduction
Earlier chapters of the Draw Guide have dealt only with vector graphics. However,
Draw also contains a number of functions for handling raster graphics (bitmaps) such
as photographs and scanned pictures, including import, export, and conversion from
one format to another.
Draw can read all the usual graphics file formats. It has a subset of the same
capabilities as specialized raster graphics programs like Adobe Photoshop or The
Gimp.
Importing raster and vector graphics
To import stored graphics files, choose Insert > Picture > From File on the menu
bar or click the
icon on the Draw toolbar. Draw possesses import filters for many
different vector and raster graphics formats. If your file has a nonstandard extension,
you must choose the format explicitly when importing it.
Note
A filter for *.svg (scaleable vector graphics) files is available as an
extension (http://extensions.services.openoffice.org/en/project/svgimport),
but rather than using Insert > Picture > From File just open the *.svg
file with File > Open. The SVG graphic is translated during the import
into OOo graphics primitives.
If you select the Preview option in the Insert picture dialog (Figure 116), Draw
shows a preview of the picture in the box on the right-hand side. This makes it much
easier to choose the picture you want and to see whether Draw can import a file of
this format.
Figure 116: Inserting a picture; notice Link and Preview options in lower left of
dialog
Chapter 6 Editing Pictures (Raster Graphics)
89
To link or to embed?
If you select the Link option in the Insert picture dialog, the graphic is linked rather
than embedded. It is not actually inserted into the document; instead, a link to the
graphic is created. This link is relative to the folder where the document is stored,
even though it shows up in the Edit Links dialog (see Figure 117) as an absolute link.
If you store the document and the graphic in the same folder, and transport the folder
as a whole to another computer, the graphic will show up in the document as before.
Linked graphics are not changed as a result of any actions carried out within
OpenOffice.org. Such changes affect only the view of the graphic in the document
and not the graphic itself. In particular, the format of a linked graphic remains
unchanged. In contrast, when a raster graphic is embedded in an OOo document, it is
converted into PNG format.
Linking keeps the file size of the Draw document small. The picture can be edited or
even replaced by another and the link will still function. As long as the new picture is
given the same name as the old one, links will be re-established and updated when
the document containing the link is next opened. However, some actions do not last
beyond the current session (for example, Filter) or are simply not possible on a linked
graphic (for example using the color replacer to exchange colors).
Links can easily be removed. The linked picture will then be embedded in the
document. To break a link, choose Edit > Links from the main menu bar. In the Edit
Links dialog (see Figure 117), choose the link to be broken and then click on the
Break Link button.
Figure 117: Editing links to documents
Scanning
With most scanners you can directly insert a scanned picture into a document.
Scanned images are embedded in the document in PNG format.
Make sure that the scanner is supported by the SANE system if you are running a
Linux (or other UNIX-like) operating system, or TWAIN if you are using Windows, and
that it is already configured on the machine on which OpenOffice.org is running. If
more than one scanner or equivalent device is present, you can select the source
from Insert > Picture > Scan > Select Source.
90
OpenOffice.org 3.3 Draw Guide
To insert an image from the scanner:
1) Prepare the image in the scanner and make sure that the scanner is ready.
2) Choose Insert > Picture > Scan > Request.
3) The rest of the procedure depends on the scanner driver and interface. You
will normally be required to specify the resolution, a scan window, and other
options. Consult the scanner’s documentation for more information.
4) When the image is scanned, Draw places it on the page. At this point it can be
edited like any other image.
Pasting from the clipboard
The clipboard offers another way to insert graphics. Depending on the source and the
operating system, figures may be in different formats. You can obtain an overview by
choosing Edit > Paste Special from the menu bar or by clicking on the Paste icon’s
drop-down menu on the main toolbar. The choices on the list vary with the type of
graphic on the clipboard.
Dragging and dropping
Drag and drop is also possible in many cases. The exact way that drag and drop
works is determined by the operating system in use and the source of the graphic,
regardless of whether the graphic is to be embedded or linked. The behavior can be
controlled by the use of the Control or Control+Shift keys together.
Draw objects and images which are used frequently can be stored in the Gallery.
Objects can be dragged from the Gallery to the Draw surface quite simply. Working
with the Gallery is dealt with in Chapter 10 (Advanced Draw Techniques).
Inserting from a file
With this option, you can insert complete pages or single objects from existing Draw
or Impress documents into your Draw document. In addition you can insert text in
Rich Text Format (RTF), HTML format or plain text. The text will be contained within
a text frame. The usual paragraph and character formatting options are available for
this text.
Choosing Insert > File brings up the File selection dialog. Select the required file
and click Insert. If the file is a Draw or Impress document, the Insert Slides/Objects
dialog (Figure 118) opens.
To access single pages or slides of the document, click on the expansion symbol
(usually a + or a small triangle, depending on your operating system) to the left of
the file name in the selection area. The same method is used to display single objects
within slides. Raster graphics (for example, photos) and Metafiles are marked with a
, drawing objects with a
, and OLE objects with a
Chapter 6 Editing Pictures (Raster Graphics)
.
91
Figure 118: Inserting complete pages or objects on a page
Choose the slides or objects you want to insert; for multiple selections, press the
Control or Shift key while clicking on the items. Click OK to insert the selected items.
If the inserted object was named in the source document, it keeps its original name
unless the name already exists in the current document. In that case you must give
the object a new name before it is inserted. To rename an inserted object, right-click
and choose Name from the pop-up menu. Renaming has the advantage that the
object is then listed in the Navigator.
You can choose whether to embed or link the selected page or object.
Exporting graphics
Draw saves drawings by default in the *.ODG format. Some programs cannot open
these files. To use the drawings in other programs, you can export the graphics in
various formats. Choose File > Export and then in the File format pull-down list
select the desired format (see Figure 119).
Figure 119: Lower part of the Export dialog
Exporting the entire file
The file format options in the upper area of the File format box (HTML, XHTML, PDF,
and Flash) always apply to the complete file. Use of Flash or HTML format causes
each page of the Draw document to be exported as a raster graphic. You will no
longer be able to access individual objects on the page.
92
OpenOffice.org 3.3 Draw Guide
To export a multi-page Draw document as a series of web pages, choose File >
Export and select HTML Document as the file type. The HTML Export wizard
opens. Follow the prompts to create the web pages. If you wish, the wizard can
generate a navigation aid to help in moving from page to page.
If you want to use the objects in other applications, select one of the Metafile formats
(JPEG, PNG, TIFF, BMP and so on) in the lower part of the File format list (see Figure
120). With this type of export, only the currently active page is exported.
Figure 120: Section of the file selection list
Exporting single objects
In order to export individual drawing objects, you first need to select them. A
selection can include more than one object. Take care to choose the Selection option
on the Export dialog.
Exporting as a vector graphic
The choice of vector formats is still limited. An export to a DXF format file (Autocad)
is not yet possible. Even the export of a graphic to a SVG format file is not yet fully
implemented: 2D graphic objects are exported as paths and 3D objects only as
preview images. Best supported are the Metafile formats and exporting to one of
these is usually successful.
Exporting as a raster graphic
The choice of formats for export as a raster graphic is large enough to support most
other applications. In case of doubt, test different formats to see which gives the best
results; some programs behave differently depending on the format of the image
imported into them.
After typing in a name for the exported file and selecting the file format, you may be
able to set options for the exported image—compression, color format, version of
Metafile—depending on the format chosen. Some examples of the various option
dialogs are shown in Figure 121.
Where the export dialog allows you to specify the image resolution, this does not
affect the number of raster points in the image. Rather it inserts information into the
picture that tells other programs the dimensions to be used in displaying the image.
This means that, among other things, missing raster points can be interpolated when
the graphic is opened in the other program.
Chapter 6 Editing Pictures (Raster Graphics)
93
Figure 121: Adjusting format specific properties prior to export
The actual number of pixels used is determined by the screen resolution set up by the
operating system and the Drawing scale factor set in Tools > Options >
OpenOffice.org Draw > General. This is a limitation of the current user interface;
it is possible to set other resolutions using macros.
Embedded raster graphics, or objects that have been converted to a bitmap or
Metafile (from the context menu Convert > To Bitmap / To Metafile) may
subsequently be saved as a picture; from the context menu choose Save as Picture.
This saves the picture without Draw-specific additions such as text elements, borders,
or shadows and without the possibility of setting any of the options available when
exporting.
Draw objects can easily be imported into Writer, Calc, or Impress documents. For
objects used often, this is most simply done by storing them in the Gallery or by using
the clipboard. As Writer and Calc do not possess the same range of tools available
within Draw, it makes sense to use Draw to produce a complex drawing and then to
copy it into the other OOo application. A link to single drawing objects is not possible,
but you can incorporate Draw documents in the other modules as linked OLE objects.
Tip
94
To avoid problems when scaling Draw objects containing text after
importing them into Writer, convert the object to a polygon before
storing it in the Gallery or copying it to the clipboard. See “Convert to a
polygon” on page 105.
OpenOffice.org 3.3 Draw Guide
Modifying raster object properties
As with other objects, the properties of a raster graphic can be modified. You can
format the graphic using the Format menu or the context menu. Use the Picture
toolbar to add or change filters using the Graphic Filter Bar; adjust the Lines, Areas
and Shadows properties. The Transparency property in the Format menu does not
relate to the transparency of the raster graphic itself but to the background area. To
set the transparency of the graphic, you must use the Picture toolbar.
Graphics can also have a text element. For more on text, see Chapter 10 (Advanced
Draw Techniques).
You can change the position and size of graphics, or rotate them, using the methods
described in Chapter 3 (Working with Objects and Object Points). Raster graphics can
be flipped (Modify > Flip), but note that some Metafile formats might have problems
flipping text.
Graphics included as a member of a group behave like other drawing objects when
the properties of the group are modified.
It is a good idea to (re-)name the graphic using Name from the Modify menu or the
context menu. Only named objects are visible in the Navigator and only named
objects can be directly imported from another file.
The picture (editing) toolbar
If you have enabled the Picture toolbar (in View > Toolbars), it will automatically
appear on the screen whenever you select a (bitmap) picture (see Figure 122). It
appears either directly under the menu bar in place of the formatting toolbar or as a
floating toolbar elsewhere on the screen.
Figure 122: The Picture toolbar
The following table explains the individual functions on the Picture toolbar and
illustrates their use with examples.
Opens the Filter toolbar, which is described in “The graphic
filter toolbar” on page 98.
Filter
Graphics Mode
Use the Graphics mode menu to change the display of the
graphic from normal color to grayscale, black and white, or a
watermark. This setting affects only the display and printing of
the picture; the picture itself remains unchanged.
Default:
The graphic is displayed unaltered in color.
Grayscale:
The graphic is displayed in 256 shades of gray.
Black/White:
The graphic is displayed in black and white.
Watermark:
The brightness and contrast of the graphic are reduced to the
extent that the graphic can be used as a watermark
(background).
Chapter 6 Editing Pictures (Raster Graphics)
95
Color
Use the Color tool to adjust the values of the three RGB colors,
the brightness, contrast and the Gamma value. These
adjustments do not affect the original picture but the values
are stored in Draw as a separate formatting set.
You can select values from between –100% (no color) to
+100% (full intensity); 0% represents the original value of the
property.
The brightness can be adjusted between –100% (totally black)
and +100% (totally white).
The contrast can be adjusted between –100% (minimum) and
+100% (maximum).
The Gamma value affects the brightness of the middle color
tones. Values can range from 0.10 (minimum) to 10 (maximum)
Hint: Try adjusting this value if changing brightness /contrast
does not give you the result you want.
Transparency
The degree of transparency of the picture can be adjusted
between 0% (opaque) and 100% (fully transparent).
Line
Opens the Line dialog. In this context, line refers to the outline
of the border. See also Chapter 4 (Changing Object Attributes).
Area
Opens the Area dialog. Here you can edit color, gradient,
hatching and fills of the background area that contains the
graphic—not the graphic itself. To see the background, you
must set the transparency of the graphic to a suitably high
value.
Shadow
Use this tool to set a shadow effect around the graphic.
Crop
Use this function to crop (trim) an image. When you click on
this icon, crop marks appear on the image (Figure 123). Drag
one or more of these marks to crop the picture to your desired
size. For more accurate cropping, see “Cropping” below.
96
OpenOffice.org 3.3 Draw Guide
Figure 123: Interactive crop marks on an image
Cropping
Figure 124: The Crop dialog
More control and accuracy over cropping functions are available via the Format
menu. Click Format > Crop Picture and the dialog box in Figure 124 will appear.
The fields Left, Right, Top, and Bottom establish the amount to be trimmed off the
appropriate edge.
In addition to cropping, you can also enlarge or reduce the size of the graphic by
changing the percentage scaling values. The new dimensions of the graphic are
shown in the Image Size width and height boxes, which can also be directly adjusted.
In Figure 124 you can see that 2 cm from the left side and 1 cm from the top, bottom,
and right side will be trimmed from the original object. The preview pane shows the
location of the new edges of the graphic. In addition both height and width have been
scaled down by 28%.
Chapter 6 Editing Pictures (Raster Graphics)
97
•
If you choose Keep Scale, the graphic will be cropped to the scales shown in
the width and height boxes and the picture reduced in size accordingly.
•
If you choose Keep image size, the graphic will be cropped and then enlarged
to the original image size.
Take care with these operations: in the Crop dialog the width and height are treated
as totally independent values. Changing one without the other can result in
significant distortion of the image; this might not be what you want. (The Position and
Size dialog on the context menu has an option for keeping the width:height ratio
fixed while changing one of the two dimensions.) Changing values in one area (Scale
or Image Size) will show up correspondingly in the other area.
Caution
Any changes made in the Crop dialog change only the view of the
picture. The original picture is not changed. If you want to export a
cropped graphic, you must do it through File > Export. If you use the
option Save as Picture from the context menu, the changes are not
exported.
The graphic filter toolbar
Click the Filter icon
to open the Filter toolbar. Draw offers eleven filter effects.
Filters work on the current view of an object and they can be combined. Filters
always apply to the entire graphic; it is not possible to use filters to edit only a part of
the object.
Invert reverses (inverts) the colors of an image so that it appears as a
color negative of the image.
Smooth reduces the contrast between neighboring pixels and produces a
slight lack of sharpness. If you use the filter several times in a row, the
effect will be strengthened.
98
OpenOffice.org 3.3 Draw Guide
Sharpen increases the contrast between neighboring pixels, emphasizing
the brightness difference. This will accentuate the outlines. The effect will
be strengthened if you apply the filter several times in a row.
Remove noise compares every pixel with its neighbors and replaces the
extreme values (those that deviate in color by a large amount from a mean
value) by a pixel with a mean color value. The amount of picture
information does not increase, but because there are fewer contrast
changes our brains can better recognize the resulting graphic. This filter
tends to make the picture also a little more smooth.
Solarization was originally a photochemical effect. If the location of a
photograph is extremely highly lit, you can experience a reversal of color
and brightness. Similarly, entry of light during the developing process
reverses the brightness values. These phenomena were used for artistic
production of pictures.
With this filter you input a threshold brightness value, above which the
color values are reversed (middle picture, threshold value 70%). With the
Invert option the whole of the resulting picture is inverted in color (right
picture).
Chapter 6 Editing Pictures (Raster Graphics)
99
Aging lends pictures a certain “look” resembling that of old photos. The
process first produces a grayscale picture from the original and then
reduces the intensity of the blue and green color values, so that the final
picture appears darker and redder. In the middle example, the aging
degree was set to 0%, on the right it was 15%.
Posterize reduces the number of colors in the picture. The fewer colors,
the more flat the picture appears. In the right hand picture below the
number of colors was reduced to 8. The results of this filter are not always
good.
The Pop-Art filter is supposed to change the colors of the picture to a
pop-art format, but unfortunately it does not seem to function correctly at
present.
Charcoal sketch makes the picture appear as if it had been drawn with
charcoal. The outlines are in black and the original colors are suppressed.
100
OpenOffice.org 3.3 Draw Guide
The Relief filter calculates the edges in relief of the picture and produces
a picture as if illuminated by a light source, the position of the
illuminating light being variable and producing shadows that differ in
direction and magnitude.
Mosaic takes groups of pixels and converts them into a single color
rectangular tile. The whole picture appears to be a mosaic. The center and
right pictures below had an element resolution of 5 pixels. The picture on
the right also had the Enhance edges option selected; with the greater
contrast at the edges, it appears to be a little sharper.
Caution
If your picture is linked, filters are applied only to the current view. The
stored picture is not changed. When you close the document, all
filtering is lost. You should ensure that you export the picture to create
a copy with all the filters applied (File > Export).
If you have embedded the graphic in the document, all filters are
applied directly on the embedded graphic and cannot be undone in a
subsequent session. If you do not want to retain a filter, you must use
Edit > Undo to return to an earlier state of editing. After you save and
close the document, the filter effects are permanent.
Changing colors using the eyedropper
Use the eyedropper to change one color in a picture for another or set the color as
transparent. The tool always works on the entire picture; you cannot select only a
region for editing.
The changes are carried out on the graphic itself and therefore require it to be
embedded. Attempts to use the eyedropper tool on a linked graphic result in the
following message: This graphic is linked to a document. Do you want to unlink the
graphic is order to edit it?
The tool can be used on all raster graphic formats and with many—but not all—
Metafile formats.
Note
In OpenOffice.org 3.4, this feature is called the Color Replacer.
Chapter 6 Editing Pictures (Raster Graphics)
101
Practical example: Changing wrong colors to transparency
Some applications, which cannot correctly handle transparency, show transparent
areas with the color Magenta and then store the graphic with this color and without
the correct transparency information.
Bitmap graphic with area in magenta, which actually should be
shown transparent. On the left is the original picture, right is the
picture after saving it with MS Paint.
If you receive such a picture, you can recreate the transparency with the eyedropper
tool.
Open the Eyedropper dialog with Tools >
Eyedropper and click on the picture to be
edited.
Now click on the icon , to change to the
color selection mode. Outside the dialog the
cursor changes to a hand. The field next to
the icon shows the color immediately under
the hand cursor.
Click on the color to be changed. The first
Source Color box is now marked and the
color selected appears in the left box. In the
Replace with selection list, the option
Transparent is already selected. Click on
the Replace button at the top right of the
box to carry out the changes to the picture.
There is no preview of the effect. If the
result is not what you wanted, choose Edit
> Undo.
The dialog does not close automatically, so you can carry out further color
replacements. Mark first the field for the Source color and choose again the color
with the eyedropper. Close the dialog with Ctrl+F4 or the Close icon on the window
border. Draw uses a separate Alpha channel for transparency so that pixels of
different colors can be made transparent.
It is also possible to carry out the operation in reverse to change a transparent area
to a color. Select nothing in the graphic but choose the Transparency option at the
lower left of the dialog and the replacement color at the lower right.
102
OpenOffice.org 3.3 Draw Guide
The selection list for replacement colors shows all the available colors in the current
color palette of the document. You cannot define any new colors here but you can add
colors to the available palette before using the eyedropper tool. For more on this
topic, see Chapter 8 (Tips and Tricks).
Effect of the tolerance parameter
The tolerance parameter describes how closely a color value in the picture must
agree with the source color in order to be replaced. In the figure below, the red color
tone at the left edge of the rectangular color palette is used as the source color and a
pure blue as the replacement color with several different tolerances. The original is a
rectangle with color palette from red to green. Because the eyedropper is not usable
on drawings, the rectangle on the left side was converted into a raster graphic
(Convert > Bitmap). The picture was then exported in a Enhanced Metafile format
and inserted on the right for comparison.
Original
0% smallest value
20%
40%
80%
99% largest value
Note
As shown, the application of transparency and color replacement effects
on raster graphics and Metafiles leads to quite different results. This is a
known problem, which will be corrected in a future version.
Color depth
It is possible to reduce the color depth in OOo. The tools are available but you must
create a separate menu and add the tools to the menu if you wish to have them
available (refer to OOo help if you are not sure how to do this). To find the tools, click
on Tools > Customize, Toolbars, and Add (Command). The commands are in the
category Modify, at the top of the list.
Reducing color depth
Original with a 24 bit pixel depth (=8 bits per
channel)
Chapter 6 Editing Pictures (Raster Graphics)
103
1 bit dithered
The impression of grayscale is produced by a
raster. In reality there are only two colors.
1 bit threshold
The threshold determines which pixels are black
and which are white. You cannot set it directly
but you can influence which part of the image is
set to black by varying color settings on the
picture toolbar—red, green, blue level,
brightness, contrast, and/or gamma value—to see
what works best for your image. You must export
and save the modified image with File > Export
and then reopen it, before you finally change the
color depth.
4 bit color palette
With 4 bits a total of 16 colors can be produced.
The color steps are quite fine, because the
process does not use the 16 RGB basic colors, but
selects from the palette those that best match the
colors in the image.
4 bit grayscale palette
8 bit color palette
With 8 bits a total of 256 colors can be produced.
The image at left is at first glance very difficult to
distinguish from the original. A big difference is
that the picture file is only one third of the size of
the 24 bit version.
104
OpenOffice.org 3.3 Draw Guide
8 bit grayscale palette
Conversion
Convert to a contoured image
Select the picture so you see the green handles. From the context menu or from the
Modify menu choose Convert > to Contour. This command creates from the
original image a polygon or group of polygons, with four corner points and the image
set as a background graphic. In this state you are not able to further edit the graphic.
All your modifications must be completed before this point.
The polygon is in fact a vector graphic but the picture remains as a bitmap image.
Using a polygon offers possibilities for further change; for example, you can modify
the shape or define a transparency gradient.
Convert to a polygon
Select the picture so you see the green handles. From the context menu or from the
Modify menu, choose Convert > to Polygon. This command converts areas of the
same color into small filled polygons. The total image becomes a vector graphic and
can be resized with no loss of image quality or distortion of text. The resulting format
will be a Metafile.
Figure 125: Conversion of a picture to polygons
Chapter 6 Editing Pictures (Raster Graphics)
105
The Convert to Polygon dialog has a number of settings which can be tested using the
Preview button. Because graphics conversion can take some time, depending on the
picture and the computer, a progress bar is included at the bottom of the dialog.
Number of colors
Draw considers between 8 and 32 colors in the conversion. The picture can, however,
contain fewer colors than 8. For every color occurring in the picture, Draw creates a
polygon, which may consist of several disconnected parts. These polygons are then
filled with the relevant color.
The algorithm used to reduce the number of colors in the picture to the number
specified is not yet optimal. For this reason you may prefer to try reducing the
number of colors by changing the color depth or with the Posterize filter (page 100)
from the Graphic Filter toolbar (page 98).
Point reduction
Polygons will only be created if they have a size greater than the value given in this
setting. The section of the picture below, highly magnified, shows that with a larger
point count small flecks of color—typical of irregular color patterns—simply
disappear.
2 Pixel
3 Pixel
Fill holes
Point reduction can result in small areas or “holes” which are not covered by a
polygon. If the Fill holes option is marked, additional square, tiled areas are created
with a background color the same as the hole. The Tile size option allows the width
in pixels of the width of these square areas to be preset.
Original picture
106
Original picture with 16 colors and
0 Pixel point reduction vectorized
OpenOffice.org 3.3 Draw Guide
Original picture transformed with the
Poster filter and 64 colors …
… and then with 16 colors and 0 pixel
point reduction vectorized.
Here the picture is transformed with the
Poster filter, but this time with a point
reduction of 4 pixels and a tile size of
16 pixels.
The effect below was generated from the
picture to the left (posterized and
vectorized); the polygons were split with
Modify > Break, and a number (in this
case 6) of the (foreground) polygons
were deleted until the resulting
background was achieved.
Note: To select polygons for deletion,
click on a curved colored area (the text
in the status bar shows “Polygon nnn
corners selected”, where nnn is the
number of corners of the polygon) and a
frame with green handles encloses the
area of the polygons selected. Press
Delete to delete the polygons. Repeat
until you have achieved the desired
effect, (which here is to have only the
background showing).
If you next ‘split’ the existing Metafile (Modify > Split), access is gained to
individual polygons. To be able to operate on these together you should immediately
group them after splitting.
With this vectorized form of the image, you can carry out operations familiar from
classic drawing programs, for example a curved warping operation. For such
transformations, it is much less effort to use a conversion with background tiles so
that the edges of the picture are straight.
Chapter 6 Editing Pictures (Raster Graphics)
107
Using the graphic generated in the posterize and vectorize process above, Break and
Split it, and then try out some operations using the tools on the Effects toolbar.
To use this tool to vectorize the first letter of a chapter in a special font, convert the
graphic to a polygon, using no point reduction or background tiling. Use Modify >
Break to generate two polygons. An example is shown below.
Original polygon, converted from a Metafile.
Break the graphic into two polygons.
After the conversion there are two polygons, one
with the visible letter and another polygon, not
visible because the lines and area filling are all in
white. You can select this “invisible” polygon by
pressing the Tab button (click on the visible letter
first, then press Tab; this moves the current
selection to the next object). In the example at
the left, the invisible polygon has been moved to
the side. If you have Display Grid active and the
grid points set to display behind objects, you can
see where this invisible polygon is, since it
obscures the grid points behind it.
This invisible polygon encloses the letter. After
changing lines and/or area to a different color,
the polygon becomes visible.
108
OpenOffice.org 3.3 Draw Guide
Convert to bitmap
All drawing objects are vector graphics. Use the command Convert > To Bitmap
from the context menu to convert a vector graphic to a raster graphic. Draw creates
the raster graphic in PNG format with a color depth of 24 bits. Unfortunately any
transparency effects which were created in the vector graphic are lost in this
conversion, although the PNG format used in Draw does support transparency. Only
if you use the eyedropper tool to set transparency will an Alpha channel also be
produced.
To determine the height and width of the converted graphic (number of pixels), Draw
considers the dpi setting of the operating system for the screen and the percentage
scaling factor set under Tools > Options > OpenOffice.org > View in the section
User Interface.
Example:
Width of vector graphic: 1.5 inch
Monitor setting of operating system: 96 dpi ( = 96 dots per inch)
Scaling 130 %
Calculation: 1.5 inch x 96 dpi *130% = 187 pixels
The actual number of pixels will vary somewhat from this value due to rounding.
When the format permits, Draw uses a dpi value (in this case 125 dpi) which permits
the calculation to be reversed and the picture with this pixel value reproduced with
the correct width of 1.5 inch.
Print options with raster graphics
If you have only a black and white printer or are experiencing problems with
printing, you should check the following settings.
You can set up printing so that all text and all graphics are printed in grayscale or
black and white. The general settings are in Tools > Options > OpenOffice.org
Draw > Print in the section Quality (see Figure 126). To set these for the current
document only, use Options in the Print dialog (File > Print). With both Black/white
printing and Grayscale printing, no background is printed.
Figure 126: Options - OpenOffice.org Draw - Print
Other options are in Tools > Options > OpenOffice.org > Print (see Figure 127).
They relate to page options (scaling) and other printing variables. They affect the size
of the print file and the time taken to print the document. With most modern systems
you can simply accept the defaults. As different operating systems and printers have
their own requirements, you need to tailor the settings to your particular site
conditions. Refer to the Help file for more information.
Chapter 6 Editing Pictures (Raster Graphics)
109
Figure 127: Options - OpenOffice.org - Print dialog
110
OpenOffice.org 3.3 Draw Guide
7
Chapter
Working with 3D Objects
Creating 3D objects
Although Draw does not match the functionality of leading drawing or picture editing
programs, it is capable of producing and editing very good 3D drawings and pictures.
Draw offers two different types of 3D objects: 3D bodies and 3D shapes. Depending
on which type you choose, there are different possibilities for further editing of the
object (rotation, illumination, perspective). 3D shapes are simpler to set up and edit
than 3D bodies, but 3D bodies currently allow for more customization.
Creating 3D bodies
You can produce 3D bodies in three ways: extrusion, body rotation, and using ready
made objects. In this chapter, these methods are called Variation 1, 2, and 3. Two
further variations, extruding Basic Shapes and converting text to 3D, are also
described.
Variation 1: Extrusion
First, draw one of the common Draw objects, for example a square/rectangle,
circle/ellipse or a text box using the
or
icons on the Drawing toolbar.
Next, choose Modify > Convert > To 3D (or right-click on the object and choose
Convert > To 3D, or click the
icon) to produce a 3D object from the 2D surface.
The
icon is not usually visible on the Drawing toolbar. To make it visible, select
Visible Buttons from the toolbar menu at the right-hand end of the toolbar and click
on the icon to make it visible.
Figure 128: Extruding 3D objects from 2D surfaces
The procedure by which parallel surfaces are moved to create a 3D object is known
as extrusion. In this case the 2D surface is moved forwards “out of” the drawing
level. At the same time the object is slightly tilted and central projection turned on so
that one can better recognize the object. Draw uses a default value for the extrusion
(the body depth) based on the size of the 2D object. The value can be changed after
the extrusion; see “Editing 3D objects” on page 116).
Variation 2: Body rotation
Choose a common drawing object, for example a (non-black) line. Then change this
into a rotation body. Draw provides two methods to do this.
Method 1. Click the icon
in the Drawing toolbar (this icon also usually needs to
be made visible) or choose Modify > Convert > To 3D Rotation object. With this
rotation method, the axis of rotation coincides with the left edge of the enclosing
selection rectangle, through the green rectangle handles.
112
OpenOffice.org 3.3 Draw Guide
Figure 129: Rotation body created using variation 2.1
Method 2. Click the icon
on the Effects pull-down menu on the Drawing toolbar.
This icon can also be accessed from the Mode menu, accessible from View >
Toolbars > Mode. Notice that this icon lacks the curved red arrow of the fixed-axis
rotation icon.
With this method, you can change the location of the rotation axis, which appears as
a dotted line with two white circular endpoints.
Figure 130: Rotation body created using variation 2.2
Click one of the white endpoints and drag it so that the axis moves to the desired
position. You may need to move both ends to achieve this. The outline shows how the
figure will be rotated. When you click on the figure again, the rotation is carried out
and the new 3D body is produced.
Variation 3: Using ready-made objects
Use the 3D Objects toolbar/pull-down menu (Figure 131). To activate this toolbar,
click View > Toolbars > 3D Objects).
Figure 131: The 3D Objects toolbar
If you add the icon
to the Drawing toolbar, the 3D Object bar will be available
as a pull-down menu or as a floating toolbar.
Chapter 7 Working with 3D Objects
113
After choosing the type of object, left-click on the starting point and drag the mouse
diagonally until the outline of the object is the size you want.
After releasing the mouse button, the 3D object appears. To change the height:width
ratio of the object, keep the Shift key pressed while dragging the mouse. Most of
these objects are constructed by rotation. Cubes and spheres are special types of 3D
objects that are directly defined in the OOo program code.
3D scenes
Variations 1–3 all produce a result known as a 3D scene. If you click on a 3D scene,
the status bar text shows 3D scene selected. Such a scene is actually a group of
objects.
If you constructed the scene using one of the above methods, it consists of the 3D
body as a single element. 3D scenes can, however, be extended to include other 3D
objects, as described in “Combining objects in 3D scenes” on page 134.
As mentioned in Chapter 6 (Editing Pictures), you can access individual elements of
the group using Modify > Enter group or the context menu. The status bar text
then changes and shows the type of each individual element selected, for example
Sphere selected or Extrusion object selected.
Producing 3D shapes
Since the release of Version 2.0 of OpenOffice.org, Draw contains a type of drawing
object known as a (Basic) Shape. A special method of extrusion exists for these
shapes.
Variation 4: Extrusion of basic shapes
Figure 132: The Basic Shapes toolbar
You use the Basic Shapes toolbar (or another shape toolbar) to produce 2D surfaces.
Shapes such as cylinders or cubes are technically possible but not very useful,
because they produce curiously curved images. If you have drawn a shape, the last
icon
on the Drawing toolbar is active. A click on this icon can transform a 2D
surface into a 3D object (see Figure 133).
Extrusion of a shape does not create a new object type but just changes the shape’s
appearance. All the object’s properties and settings are retained. You can use this
button to toggle between a 2D and a 3D view. The actual object properties and
settings are not lost in the switching operation from one view to another.
Figure 133: 3D objects from basic shapes
114
OpenOffice.org 3.3 Draw Guide
If you click on such an object, the 3D-Settings toolbar is available. If this is not
automatically opened, switch it on with View > Toolbars > 3D-Settings.
Figure 134: 3D-Settings toolbar
The first icon
corresponds to the icon on the Drawing toolbar. This icon also
works as a toggle switch. After changing to 2D, the 3D-Settings toolbar is again
hidden. To change the object back to 3D, you must use the icon
toolbar.
on the Drawing
Variation 5: Fontwork
For text you can also use the shapes from the Fontwork Gallery. These produce a
similar type of extrusion objects to those from Variation 4.
To open the Fontwork Gallery, use the icon
on the Drawing toolbar.
Figure 135: Extrusion Shapes from the Fontwork Gallery
Note
If you save a document with extruded shapes in the older *.sxw format,
the shapes will be converted to 3D scenes.
Chapter 7 Working with 3D Objects
115
Editing 3D objects
Rotating 3D objects
Procedure for 3D bodies
The Rotation command used for 2D objects also works with 3D objects, but due to the
additional axis, there are a few differences with the editing of 3D objects (see Figure
136). The procedure for selecting the object is identical to that used for a 2D object.
Figure 136: 3D object rotation
You can rotate the object about each axis (X,Y,Z). The X and Y axes are those parallel
to the edges of the drawing layer, while the Z axis comes out of the page. It is not
possible to change the axis orientation.
The three axes are not shown directly, but the
point.
If you want to …
symbol indicates their intersection
You must ...
... rotate the object
about the X or Y axis.
... put the mouse cursor over the object. With the left
mouse key pressed you can now rotate the object as you
wish. Moving one of the red points at the middle of an
edge allows you to rotate the object about only one axis.
Note that the cursor initially has the shape for a (2D)
shearing movement but pressing the mouse button
changes it to a rotation cursor.
... rotate the object
about the Z axis.
... move the handle on one of the corner points with the
left mouse button pressed. Rotation about the Z axis is
independent of the setting of the rotation angle in the
dialog Position and Size.
... move the axis
intersection point.
... simply drag the Symbol
to the desired location. The
point is located by default in the middle of the object.
These rotations can be carried out on a 3D scene as a whole or on individual objects
within a 3D scene.
116
OpenOffice.org 3.3 Draw Guide
Procedure for 3D shapes
Objects produced using variations 4 and 5 (see above) can only be rotated about the
Z axis when using the three methods described in the previous section. This rotation
is carried out on the underlying 2D object. It is also possible to rotate the 3D object in
the same way as with a 2D object using Format > Position and Size > Rotation
(shortcut key for Position and Size is F4) and specifying the pivot point location and
the number of degrees of rotation desired.
Shape objects have their own procedure for rotation about the X and Y axes. If you
have activated the 3D-Settings toolbar (under View > Toolbars), this becomes active
when you select the 3D object; icons 2 to 5 on this toolbar (see Figure 137) rotate the
object in 5 degree increments about the X and Y axes.
Figure 137: 3D-Settings toolbar with rotation icons
indicated
3D settings for 3D bodies
3D Effects dialog – general buttons
The 3D Effects dialog offers a wide range of possible settings for 3D objects produced
with variations 1 to 3 (see previous sections). To open the dialog, right-click on the
object and choose 3D Effects from the pop-up menu. You can also activate a 3D
Effects icon
on the Standard toolbar or add it to another toolbar using
Customize Toolbar > Add > Category Options > 3D Effects.
Tip
If you cannot see 3D Effects on the pop-up menu you probably have a
3D object extruded from a basic shape by clicking on the icon for
Extrusion On/Off on the Drawing Toolbar.
The dialog can be docked in a similar manner to the Navigator or Template windows.
The possible settings are arranged in various thematic categories on separate pages,
accessible through the buttons at the top of the window, which act in a similar way to
tabs. To apply the settings you have altered, click the Assign button
. This applies
all the changes you have made to the object on the other pages of the dialog as well
as the current one.
Figure 138: Upper part of the 3D Effects dialog
Note
Only the selected effects are assigned to the object. There is no object
conversion; thus a cylinder cannot be transformed into a ring through
the application of a 3D effect. However, it is possible to change the
appearance to resemble a wooden or metal body. By the assignment of
a 3D effect, 2D objects are transformed into 3D objects.
Chapter 7 Working with 3D Objects
117
In order for the Effects dialog to take over all the current properties of the object,
you must click the
button. If you deactivate this button before you leave an object
and click on it again when you open the Effects dialog for another object, the settings
are carried over from the first object to the second object. You can use this to
transfer favorite settings from one object to another, as all the settings are brought
over to the new object. In normal use, however, the icon should be left activated.
At the bottom left of the dialog is another row of buttons (see Figure 139), which are
available on each page.
Figure 139: Buttons for geometric transformations
The first two buttons correspond to the menu commands Modify > Convert > To 3D
/ To 3D Rotation Object. When the Effects dialog for a 3D object is called up, these
buttons are inactive. Selecting a 2D object activates them. The third icon switches a
perspective view of the object on or off.
Converts the selected 2D object to an extrusion body.
Converts the selected 2D object to a rotation body.
Switches between a central projection and a perspective projection.
With a central projection parallel edges are shown as meeting at some common point
in the distance, as shown on the button symbol. Parallel projection retains all parallel
edges as parallel, a procedure often used to produce oblique figures in school. The
switching process is carried out on the entire 3D scene.
With central projection (see Figure 140), Draw creates the object with three
vanishing points. The parameters for central projection are set (indirectly) through
the camera settings on the Shading dialog page.
Figure 140: Figure shown using central projection.
For clarity, the projection lines have been added.
118
OpenOffice.org 3.3 Draw Guide
3D Effects - Geometry
On the Geometry page, you can make changes to the geometry of a 3D object. This
page is opened with the Geometry button
dialog.
in the upper part of the 3D Effects
Figure 141: Geometry page
In the first example, the depth (length) of a body is to be changed. This is possible
only if you created it through extrusion. To illustrate: draw a circle and convert it
according to Variation 1 into a 3D object (a flat cylinder); see Figure 142 a and b.
If necessary, select the cylinder, open the 3D Effects dialog, make sure the Geometry
page is active, change the parameter Depth to 3.5cm and click on the Assign icon
. The cylinder should now resemble the figure in Figure 142c.
Figure 142: Conversion by extrusion of a 2D object (a)
into a 3D object (b) and then changing its depth (c)
This parameter has no effect on a rotation body or on ready-made 3D objects,
although the input field remains active.
With the Rounding parameter you can specify how strongly the edges of the 3D
object are rounded. Select (if necessary) the lengthened cylinder again and use the
Chapter 7 Working with 3D Objects
119
3D Effects dialog to change the rounding to 30%. The cylinder should now resemble
that in Figure 143.
Figure 143: Edge rounding of
10% (a) and 30% (b)
This parameter also has interesting effects when you convert text into a 3D object.
The Scaled Depth parameter sets the size ratio of the front to the back for a 3D
object produced by extrusion. The front side of such an object always protrudes out
from the original surface; the rear side is the original surface of the 2D object (that
is, the 2D exit surface) even if the object has been rotated in the meantime.
By default the scaling is set to 100%, which results in both surfaces being scaled by
the same amount. If you set this scaling to 50% the cylinder becomes a truncated
cone (see Figure 144).
Figure 144: Cylinder with 50% scaling
The diameter of the front side is 50% that of the rear side. It is also possible to create
the reverse effect, with the rear side smaller than the front, by using a scaling depth
greater than 100%.
With rotation bodies this parameter influences the width of the surface parallel to the
axis of rotation. At the end of the rotation the surface width of the figure is given by
the scaling depth. The distance to the rotation axis remains unchanged. In Figure 145
a line is rotated to create a 3D object with a scaling depth figure of 0%.
Figure 145: Scaling depth of a rotation body
120
OpenOffice.org 3.3 Draw Guide
The Rotation Angle parameter is only available for rotation bodies. With this
parameter you can create a segment of a complete rotation body by choosing an
angle less than 360 degrees. Figure 146 shows a hemisphere with a rotation angle of
270°.
Figure 146: Hemisphere with
a rotation angle of 270°
The Horizontal and Vertical Segments parameters define the number of segments out
of which Draw builds spheres and rotation objects2. For rotation objects, the
horizontal segments are more important. The vertical segments influence the degree
of edge rounding.
In Figure 147 the left sphere is made up of 10 horizontal and vertical segments while
the right sphere has 25 segments. More segments give a smoother surface, but it will
take longer to generate the figure on the screen. By default, spheres and
hemispheres are constructed with 24 segments. For a square pyramid you need four
horizontal segments.
Figure 147: Sphere made from 10 segments
(left) and 25 segments (right)
These are properties belonging to individual objects. If you use the setting for
segments on a 3D scene, all the objects contained in the scene are modified
accordingly.
If you extrude an unfilled circle or intersecting lines with a filling the result may not
be what you expect. In this case the Double-Sided
tool, on the lower part of the
dialog page, may be able to help. It changes the line properties of an object from
invisible to continuous and so enables all edges to be seen. Otherwise it may happen
that some surfaces receive no filling (see Figure 148). For lines without filling the
effect is switched on by default and cannot be switched off. This is also a property of
single objects.
2 To reduce both calculation time and data storage, circles are often constructed as regular
polygons. If you cut a sphere or cylinder of 10 segments through the middle you end up
with a 20-cornered cut section (10-cornered for a hemisphere).
Chapter 7 Working with 3D Objects
121
Figure 148: Left: without “Double-Sided”
Middle: with continuous lines but without “Double-Sided”
Right: with “Double-Sided”
Use the buttons in the section Normals to modify the normals of a 3D object.
A Normal is a straight line which is perpendicular to the surface of an object (in the
same way that a vector, starting from an inner point and extending outwards, is at
right angles to the surface of the object at the point where it exits). Figure 149 shows
some normals extending outwards from a sphere made up of 10 segments.
Figure 149: Normals (vectors) of
a 3D sphere with 10 segments
Using normals, the display of the object surface and the variation in colors, textures
and lighting can be controlled, influencing directly how the surface of the object is
rendered.
The first three icons (in Figure 141) work as “either-or” switches. Only one of the
effects can be active at a given time; an effect can be switched off by clicking on one
of the other icons.
The settings belong to individual objects, not scenes; every object can have its own
setting. The rest of the icons are normal toggle “on-off” switches. The following
effects are available:
Object specific: The object is rendered to produce the best result
independent of its shape. Single segments are changed but their “edges” will
hardly be visible.
Flat: The surface of the 3D object will be divided into single polygons, whose
edges are clearly recognizable. Every polygon is generated with a uniform
color.
122
OpenOffice.org 3.3 Draw Guide
Spherical: The enclosing sphere is calculated for the object and then
projected onto the object. This form of calculation produces an object with a
smoother surface; the edges of individual segments are more smoothly
rounded than with the Object-specific effect (see Figure 150). However
surfaces that meet at a point do not show a realistic lighting effect.
Invert Normals: This results in a reversal of the lighting direction. The inside
of the body then becomes the outside. This property is particular to each
individual object.
Double sided illumination: The lighting is also computed for the inside of the
object. In other cases the lighting value for the outside is simply transferred
to the inner side. This property is of interest for open objects. It is a property
of the 3D scene and affects all objects in the scene.
Figure 150: Cylinder with 10 segments
a= Object-specific b=Flat, c=Spherical
The following table shows the linkage between double-sided illumination and inverted
normals.
The light source is on the
right.
Normals
not inverted
Normals inverted
No double sided illumination
With double sided
illumination
3D Effects - Shading
The Shading page offers functions for shading the object surface, adding shadows
and choosing camera settings.
Shading is a rendering method involving a consideration of lighting ratios, which is
used to produce curved 3D surfaces. The surfaces are broken down into small
triangular segments. Draw offers three methods to produce this effect: Flat, Phong
and Gouraud. The setting selected applies to all objects in the 3D scene.
Chapter 7 Working with 3D Objects
123
•
Flat is the fastest and simplest method. For every individual segment a special
color tone is determined, based on the lighting ratio and the direction of the segment
area. This tone is used for the whole area of the segment. The segmentation is clearly
visible.
•
Phong is the most time-consuming method. With this method, for each pixel the
associated normal is determined by interpolation, based on the normals of the
segment edges. This causes the segment area to appear curved and the segment
intersections are no longer visible.
Figure 151: Shading page
•
Gouraud is a relatively quick method. It determines the color value for the
segment corners and calculates the color value for every pixel through linear
interpolation. The segment edges are still recognizable, but significantly less so than
with the flat method. The Gouraud method considers only light reflection on diffuse,
reflecting surfaces (dispersal).
Figure 152: Flat, Phong and Gouraud shading
In Figure 152 the left sphere was rendered with flat shading, the middle with Phong
and the right with Gouraud. The quality of the flat method is clearly inferior to the
other two. The difference between Phong and Gouraud is small. With the Gouraud
method the segments can be very faintly seen and rendered objects have a slightly
less “shine” than with the Phong method.
124
OpenOffice.org 3.3 Draw Guide
All three methods function at the pixel level, and therefore shadowing and mirroring
inside the 3D scene (as permitted by ray tracing methods) are not possible..
With the the Shadow button
you can provide a 3D object with a shadow. By
changing the Surface angle you can influence the form of the shadow (see Figure
153). The left sphere has a surface angle of 0° (the paper represents a perpendicular
surface behind the object) while the right sphere has a surface angle of 45°. With 90°
the paper would be directly under the object.
Figure 153: Shadows using
different surface angles
The shape and size of the the shadow are also influenced by the lighting properties.
These can be adjusted on the Illumination page of the dialog. Multiple light sources
for shadows are not yet supported. The shadow properties can be set for individual
objects in a drawing but where objects form part of a 3D scene, the shadow produced
is that of the entire scene.
It is possible to set the shadow property for single objects using the Area property.
The shadow is then shown with the color selected in the shadow dialog, but again the
representation of the lighting of the scene determines the end result of the entire
scene. In this way, colored shadows, with different distances to the object, and
different color and transparency effects can be created.
In the Camera field of the shading dialog the settings of the virtual camera can be
changed. These settings relate only to the view in central projection and apply to the
entire 3D scene. The Distance parameter is used to adjust the spacing between the
camera and scene. The default value for an extruded body is equal to the depth or
length of the body. With equal length edges front and rear, the effect at large
distances is quite small. The standard value of Focal length is 10cm. It has the same
significance as with a real camera. Larger focal lengths simulate a telephoto lens,
smaller ones a wide-angle lens. The effect that changes in the camera settings have
on an object are shown in Figure 154.
Figure 154: Effect of camera settings
Chapter 7 Working with 3D Objects
125
Picture a shows a 3D object with the standard settings. The individual changes are
listed in the following table.
Distance:
Focal length:
a
b
c
d
0.81 cm
3.81 cm
0.81 cm
0.81 cm
10 cm
10 cm
5 cm
15 cm
3D Effects - Illumination
On the Illumination page (see Figure 155) you define how a 3D object is lit. The
settings apply to all objects in a scene.
Figure 155: Illumination (lighting) page
You can light a scene with a maximum of eight individual Light sources at the same
time. For each of these sources, the light color and position relative to the scene can
be set. The light sources are represented by eight small light bulbs. When you select
this page, the first bulb “lights up”
. At least one light source must be active;
otherwise the rendering and shading functions cannot function correctly.
Each symbol functions like a multi-function press switch. With the first mouse click
the bulb is selected and with the second click the settings mode for this light source
is activated (see Figure 156). A third click deactivates the light source.
126
OpenOffice.org 3.3 Draw Guide
Figure 156: Adjustment of light source
In the selection list next to the symbols you can choose the color of the active light
source. If desired, click the
button to open a color palette dialog, where you can
define your own color and also adjust the brightness. For the first light source, it is
best to retain the neutral color value (default is white); with several light sources it is
advisable to reduce the brightness.
In the lower right corner of the menu the light source location and orientation is
depicted. With the vertical slider bar you can adjust the lighting angle; with the
horizontal bar the light is rotated about the object. Alternatively you can click on the
light point and drag the point as you please (see Figure 157). Click on the small
square in the bottom right (circled) to change the preview image from a sphere to a
cube.
Figure 157: Moving the light source
To apply the changed settings to the selected object, click on the the Assign button
.
The use of additional light sources can result in some interesting effects.
Chapter 7 Working with 3D Objects
127
Figure 158: Lighting with three independent light sources
In Figure 158 the ring has the lighting settings from Figure 155 with the standard
color white. In addition it was lit with magenta, and also from the left underside with
yellow. The number and position of the light sources is shown in the window at the
lower right. The three light sources in use can be recognized by the “lit” symbols
.
To see the effect of a particular lighting effect you can also temporarily turn it off.
With an object selected, clicking on a “lit” symbol turns it off
. This new setting
must then be applied (assigned) to the scene. With a further mouse click on the light
source, the effect can be switched back on and then re-assigned.
You can also change the settings for the Ambient lighting. The selection of properties
(lighting color, brightness, and so on) is carried out in same way as for light sources.
3D Effects - Textures
Textures are raster graphics (bitmaps) which can be used as an object property for
the surface of an object. Every object in a 3D scene can have its own texture.
You can set a raster graphic as a texture for a 3D object in the same way as for a 2D
object (Format > Area > Bitmaps or right-click on the object > Area > Bitmaps) –
as is the case for Gradient and Hatching. More details are found in Chapter 4
(Changing Object Attributes).
If the Fill setting on the Area dialog is Color, then the Texture page is inactive.
Change it to Bitmap to activate the Texture page for 3D objects. If the texture is not
tiled or stretched and is smaller than the object, then the remainder of the area will
have the color of the Object color property on the Material page.
128
OpenOffice.org 3.3 Draw Guide
Figure 159: Textures page
In the first row of the page (Figure 159) are two Type switches allowing you to
choose between black and white or color for the texture (see Figure 160).
Figure 160: a - standard color setting, b - texture (color),
c - texture (black and white)
With the two switches in the row Mode you can control whether the texture of the
selected objects is rendered with light and shadows (Switch 2) or not (Switch 1); see
Figure 161. Appropriate lighting and shading adjustments allow the graphic object to
be more realistically rendered.
Chapter 7 Working with 3D Objects
129
Figure 161: Texture without (a) and with
(b) lighting and shadow effects
Projection X / Y
With one of these three buttons you can determine how the texture for this
coordinate axis should be projected onto the object. The default setting, Object
specific, usually gives the best result. Examples of the use of each button are shown
below.
Object specific
The texture is automatically adjusted for a best fit
with the form and size of the object.
Parallel
The texture is projected parallel to the axis of the
object. It is mirrored on the rear side of the object.
Circular
The axis of the texture pattern is wrapped around
the object.
For a rotation body, the turning axis is the Z axis and the wrapping is the X direction;
for an extrusion body, the extrusion direction is the Z axis and the extruded surface is
the X direction. Depending on how the object was produced, different positions of the
texture result.
OpenOffice.org
Projection X
Projection X
Projection X
Area fill without tiling,
with adjustments
Projection Y
Projection Y
(Difference is small)
Front and rear side
Figure 162: Cylinder as a rotation body
130
OpenOffice.org 3.3 Draw Guide
Projection X
OpenOffice.org
Projection X
Projection X
Area fill without
tiling, with
adjustments
Projection Y
Projection Y
(Difference is small)
Upper and under sides
Figure 163: Cylinder as an extrusion object
The Filter button
switches on and off a soft-focus filter. It can often remove slight
faults and errors in the texture.
3D Effects - Material
On this page you can assign the appearance of different materials to the 3D object.
Figure 164: Material menu
In the selection list under Favorites are the most commonly used materials (see
Figure 165).
Chapter 7 Working with 3D Objects
131
Figure 165: The favorites (from left to right): Metal,
Gold, Chrome, Plastic and Wood
With the individual color parameters, additional effects can be produced. The
meaning of these parameters corresponds to those on the Illumination dialog page.
Materials and textures can be combined with one another. Settings only simulate
materials and it is sometimes a matter of trial and error to achieve the desired result.
Tip
Do not use too high a brightness value for individual colors. These are
all additive and it is easy to end up with a totally white “colored” area.
The Illumination color brightens those
parts of the object which lie in shadow
making the body seem more illuminated.
When textures are used as well, the
Illumination color is combined with the
white color part of the texture. On the left
the object has a black Illumination color, on
the right bright green.
The Specular color simulates the reflecting
capacity of the surface. The position of the
illuminated point is determined by the
setting of the first light source.
Left: Set the Specular color the same as
the object color and the illumination point
intensity to a low value, in order to give the
impression of a matt body.
Right: Set the Illumination point color the
same as the light source color, in order to
give a shiny appearance to the object
surface.
Metallic surfaces and glass are not so well simulated, because the impression of
these materials is produced through reflection. Such simulation cannot (at the
moment) be calculated by OpenOffice.org.
3D settings for 3D shapes
3D shapes are handled quite differently from objects in 3D scenes. The appearance of
a shape object is changed using the 3D-Settings toolbar (see Figure 166). The 3D
Effects dialog described above should not be used for shape objects as it will not give
the correct formatting results.
132
OpenOffice.org 3.3 Draw Guide
Figure 166: 3D-Settings toolbar, indicating icons for
formatting 3D shapes
If you have used it in error, you can remove the incorrect formatting with Format >
Default Formatting.
With the buttons on this toolbar you can adjust the extrusion depth and perspective,
lighting and material properties as well as the extrusion color. There are tear-off
bars, which you open by clicking on the small black triangle. The purpose of each
individual button is described by its tool tip. You do not need to assign the result of
any of the functions to the object as you do with the 3D Effects dialog used with 3D
scenes; every action is immediately applied and you can see its effect on the object in
the main Draw window.
Note
The program may sometimes seem to generate the wrong formatting
with shape objects. The exact cause is not known, but you can undo the
action with Format > Default Formatting. One reason for bad
formatting can be that you have used a function from the 3D Effect
dialog on a 3D shape.
Here are some examples of formatting of 3D shapes:
Depth
left: 0.3cm (user defined)
right: 1cm (selection)
Direction
The examples show “columns” at right angles to
the drawing surface.
left: 5 cm depth, Parallel projection
Middle: 10 cm depth, Perspective
right: Infinity, Perspective
Chapter 7 Working with 3D Objects
133
Illumination
The light color cannot be changed, the
brightness can be changed only in three levels,
and some effects may not be rendered with total
correctness.
left: from left under, dim
middle: from left under, bright
right: from right under, normal
Surface
Only four built-in variations are possible. At
present only Wireframe and Matt are correctly
rendered.
left: Wireframe
right: Matt
You can also choose a gradient, hatching, or
bitmap for the surface; these are only applied to
the extruded surface—the sides remain in the
color of the object.
3D Color
Here you can choose the color of the sides of the
extruded surface.
The symbol shows the color of the most recently
chosen shape object.
Combining objects in 3D scenes
3D objects produced by extrusion or rotation are shown in the status bar as a
3D scene. You can group together several of these objects. Other object types cannot
be so grouped. Management of the group is carried out in the same way as described
in other parts of this guide (Modify > Enter Group, or Modify > Exit Group), see
also “Grouping Objects” in Chapter 5 (Combining Multiple Objects).
As an example, we will produce a game piece.
134
OpenOffice.org 3.3 Draw Guide
First produce both objects independently of each
other. The subsequent combination is made easier
if you use parallel projection and rotate the objects
into an upright, straight position.
Click on the sphere and use Edit > Copy to take
over the scene and put the sphere on the clipboard.
If you are sure that you do not need the original
anymore you can use Edit > Cut. In any case move
the sphere a little to the side.
Click now on the cone. The status bar will show 3D
Scene selected. Right-click and enter the group.
You will see that, as usual, elements that do not
belong to the group are less bright.
Use Edit > Paste. Now the objects (not the whole
scene) from the clipboard are pasted into this
scene.
The original position of the sphere now contains a
new sphere that belongs to the scene. This new
sphere can be dragged over to the cone. Exit the
group after moving the sphere.
Notice that combining 3D objects results in them
being more or less “fused” together – there is no
stacking or layering as with 2D objects.
Adjust the position of the objects as you wish. You
cannot arrange objects in front or behind others, as
with 2D objects, but can only move them parallel to
the drawing plane.
Chapter 7 Working with 3D Objects
135
Enter the group again and adjust the objects. The
status bar indicates which object is marked. Use
the Tab key to change from one object to the next
in the group, if it is not possible to do so with the
mouse. Exit the group.
Now you can rotate the entire 3D scene and view
your game piece from all sides.
Examples for your own experiments
All examples use objects in 3D scenes.
Hello Jean
Extruding a 2D object with text generates
letters as separate objects and they have a
larger extrusion depth than the background.
3D objects of the Shape type can be rendered
as wireframe models. This effect can be
produced in other 3D objects by setting the
Area fill to None and the line style to
Continuous.
136
OpenOffice.org 3.3 Draw Guide
If you select several 2D objects—without
grouping them—and extrude the selection,
they are transformed, according to their
stacking order, with different extrusion
depths. The object previously on top will be
uppermost on the extruded object.
For 2D objects use Modify > Shapes >
Merge/Subtract/Intersect to produce
complex objects. The resulting figures can be
also extruded, rotated and so on.
Rotation of lines produces concave bodies.
Use a bright line color. With a high number of
vertical segments, the transition to the
ground is relatively sharp-edged. Remember
to switch on two-sided illumination.
The transparency of the platter is adjusted in
the surface properties of the body. The best
effect is obtained only when the transparent
body is combined with other objects.
The color shadow of the fruit is produced by
the use of multiple light sources – they are
not “real” and do not rotate and change as
the scene is rotated.
Chapter 7 Working with 3D Objects
137
8
Chapter
Tips and Tricks
Positioning objects with zoom
With zoom you can place objects with greater precision.
Figure 167: Using zoom to place
objects with greater precision
Zoom adjustments using the status bar
The current zoom value is shown at the right-hand end of the status bar next to the
zoom slider.
Figure 168: Zoom level on Status Bar
You can adjust the zoom value by using the slider, right-click on the zoom percent to
select from a menu of preset values, or double-click to open the Zoom & View Layout
dialog.
Figure 169: Zoom & View Layout
You can enter a zoom factor in the Variable field, select 100%, or use one of the three
other choices. (The three options on the right hand side of the dialog are not
available in Draw; they are active only for text documents.)
• Optimal: The drawing or selected object (not the page) is enlarged so that it
just fits in the Draw page area.
• Fit width and height: The drawing page edges are set to show the entire page
within the Draw page area. This is the same effect as choosing “Entire Page”
from the right-click menu on the status bar.
• Fit width: The right and left page edges are set to the vertical edges of the
Draw page area.
Chapter 8 Tips and Tricks
139
The exact effect of choosing one of these options depends on whether you have the
Page pane switched on or off.
Figure 170: Zoom values – Fit width and height, Fit width, and Optimal
The Zoom toolbar
The Zoom toolbar provides additional zoom options. On the Standard toolbar (View >
Toolbars > Standard), click on the downwards arrow of the Zoom button
. You
can also permanently display the toolbar by clicking on View > Toolbars > Zoom.
Figure 171: Zoom Toolbar
Zoom in. Enlarges the monitor picture. First click on the button, then on
the object. Alternatively, drag to create a zoom “window”.
Zoom out. Makes the monitor picture smaller. Just click on the button.
Reverts objects to their original size.
Changes display to the previous and next zoom factors. If these buttons
are not visible, turn them on by clicking on the small black arrow on the
title bar of the Zoom toolbar, then on Visible Buttons and finally on either
of these two buttons.
Shows the entire page.
Zooms to page width.
Resizes the display to include all objects on the slide.
Zooms the selected object to Optimal.
Allows the whole drawing to be moved inside the Draw window, using the
mouse.
Positioning objects with snap functions
In Draw, objects can be accurately and consistently positioned using grid points,
special snap points and lines, object frames, individual points on objects, or page
edges. This function is known as Snap.
To use the snap function easily, work with the highest practical zoom value. You can
use two different snap functions at the same time, for example snapping to a guide
140
OpenOffice.org 3.3 Draw Guide
line and to the page edge. It is best, however, to activate only those functions that
you really need.
Examples for setting up the snap functions are found in Chapter 10 (Advanced Draw
Techniques).
Snap to grid
Use this function to move an object exactly to a grid point. This function can be
switched on and off with View > Grid > Snap to Grid and on the Options toolbar
with the icon
.
Figure 172: Exact positioning with
the snap to grid function
Showing the grid
To make the grid visible, choose View > Grid > Display Grid. Alternatively, turn the
grid on (or off) with the icon
on the Options toolbar.
Changing the color of the grid points
By default the grid points are bright gray and not always easy to see. Go to Tools >
Options > OpenOffice.org > Appearance. In the Drawing / Presentation section,
you can change the color of the grid points. On the Color Settings pull-down menu
select a more suitable/visible color, for example black.
Figure 173: Changing the color of the grid points
Configuring the grid
Under Tools > Options > OpenOffice.org Draw > Grid you can change the
settings of the grid (Figure 174).
Chapter 8 Tips and Tricks
141
There is no need to use the Grid section, as these settings can be changed directly
from the icons on the Options toolbar.
Figure 174: Configuring the grid
Resolution: sets the horizontal and vertical distance between two grid points.
Figure 175: Grids with different resolutions
Subdivisions: determines how many steps there are between adjacent grid points.
Intermediate steps make it possible to have a larger separation between two grid
points, so the drawing remains clearer. Objects can snap to intermediate points in
exactly the same way as to grid points.
Figure 176: Grid with intermediate steps (subdivisions)
The snap field settings are largely self-explanatory. One important setting is the Snap
range. Grid points and snap lines are both visual help elements that are managed
separately by Draw. If you have activated a snap function and then move an object,
142
OpenOffice.org 3.3 Draw Guide
Draw looks in the vicinity of the object for these special help elements to determine
the final position of the object; with the snap range setting, you can determine the
extent of this search area. Exactly how large the snap area is depends on the current
environment: which particular snap functions are in use, how the grid is configured,
and whether or not there may be collisions with other objects. It is usually necessary
to do a little experimenting to find what best suits your needs.
Snap to Snap objects (snap lines and snap points)
Unlike grid points, Snap lines and Snap points are created by the user. Snap lines run
horizontally or vertically and appear as dashed lines. Snap points appear as small
crosses, again with dashed lines.
Note
In Draw the names of the buttons in the Options toolbar are Display
Guides and Snap to Guides when what is actually meant is Display
Snap line and Snap to Snap line.
If you have activated this function, you can position objects exactly. Horizontal and
vertical snap lines can be used together. Snap lines are not active immediately after
inserting them but are turned on (or off) using the Display Guides
icon or with
the View menu. If the snap line is no longer needed you can hide it (or subsequently
display it again) with the
icon or by using the View menu.
Figure 177: Objects ‘connected’ to snap lines (left) or to a snap
point (right). Note that the snap point functions as if it were the
intersection of two snap lines.
Inserting a snap line with the mouse
To insert a snap line in a drawing:
1) Hover the mouse cursor over the vertical ruler to create a vertical snap line or
over the horizontal ruler to create a horizontal snap line. Click and hold the
left mouse button.
2) Drag the mouse into the drawing area to produce a snap line.
The snap line can be moved at any time by dragging it with the mouse. Moving a snap
line will not, however, move any objects that have already been snapped to that line.
Chapter 8 Tips and Tricks
143
Inserting snap points and snap lines using coordinates
The command Insert > Snap point / line opens a dialog where you can specify X
and Y coordinates and choose the type of snap object: point, vertical line, or
horizontal line. You can also access this menu by right-clicking in the draw area and
selecting Insert Snap Point/Line.
Figure 178: Setting a) snap object type and
b) snap object position using X,Y coordinates
Editing snap points and snap lines
All snap objects can be edited after setting them. If you right-click on a snap object,
an appropriate menu opens, allowing you to edit or delete the snap object. Snap
points and lines can also be deleted by dragging them entirely off of the page.
Snap to page edge
With this function you can snap objects to the page edge. It is also possible to
combine this with snap lines and snapping to grid.
Figure 179: Objects positioned on the
page margins
144
OpenOffice.org 3.3 Draw Guide
Snap to object border
With this function you can position one drawing object on the border of another. The
connection point can lie anywhere on the object border. To use this function, first
deactivate Snap to grid. Figure 180 shows some examples. Note that a typical object
border will touch the border of a round object at only one of its four points.
Figure 180: Objects positioned on the border of
another object
Snap to object points
This function operates in a similar manner to the one just described. The difference is
that the connection point can lie only at one of the four corner points of both the
object being moved and the target object. This leads to the situation where two round
objects have a connection point that does not lie on either object but at one of the red
circled points.
Figure 181: Objects connected to the object point of
another object
Help to position objects with guiding lines
To simplify the positioning of objects it is possible to make visible guide lines—
extensions of the edges of the object—while it is being moved. These guide lines have
no snap function.
Chapter 8 Tips and Tricks
145
The guide lines can be (de-)activated under Tools > Options > OpenOffice.org
Draw > View > Guides when moving, or by clicking the
toolbar.
icon on the Options
Figure 182: Working with guiding lines
Drawing to scale
In Draw a drawing is made on a predefined drawing area or canvas. This will usually
be in the Letter or A4 format depending on your locale settings, and will be output to
some “standard” printer that you have set up on your computer (usually referred to
as the default printer). Depending on the actual size of the drawn objects, it is often
necessary or convenient to reduce or enlarge the drawing by some scaling value. You
can specify the scale that you wish to use under Tools > Options > OpenOffice.org
Draw > General.
The scale and selected unit of measurement are automatically reflected in the rulers,
the window position and the window size. Scale settings can be stored permanently
in a template that you can then use for new drawings.
The scale you use has no effect on the basic drawing operations. Draw will
automatically calculate the necessary values (for example, dimension lines). The grid
spacing is independent of drawing scale as the grid is not a drawing element but only
an optical drawing aid.
Note
If you want to insert elements into a drawing from the Gallery or
Clipboard, you should draw these to the same scale as you are using for
the drawing to ensure the proper size ratio is maintained.
Splitting drawings on multiple layers
Layers are like transparencies that lie one on top of another on an overhead
projector. You can insert and extract single layers as desired. For example in
architecture the floor plan, heating, and electrical wiring can all be on separate
layers. With complex drawings this layer technique offers many advantages. You can
make layers visible or invisible as needed, or you can protect a layer from further
changes while you work.
146
OpenOffice.org 3.3 Draw Guide
In Draw three layers are always present by default: Layout, Controls, and Dimension
Lines. Layout is the default layer when you create a new drawing.
To change to a layer, click on its tab. Everything that is drawn will be placed on the
currently selected layer. The Controls layer is for control elements such as icons and
pull-down menus and is not usually used for ordinary drawing elements. The
Dimension Lines layer is used whenever you insert a dimension line on a drawing
(unless the layer is made invisible). Use Insert > Layer to insert a new layer into a
drawing (Figure 183).
Figure 183: Inserting a new layer
On the Insert Layer dialog you can specify the following properties:
• Visible: If this property is not activated, the layer will not be shown (the layer
is removed from the stack).
• Printable: If this property is not activated, the layer will not be printed. This is
useful if you use a ‘draft’ layer for guides or annotations that you use in
making the drawing but should not appear in the final output.
• Locked: All objects on this layer are protected from deletion, editing, or
moving. No additional objects can be added to a protected layer. This property
is useful when a base plan is to be protected while adding a new layer with
other details.
Right-click on a layer tab to bring up a menu where you can insert or delete a layer,
rename an existing layer, or modify a layer. You can change the names of the userdefined layers; the default layer names cannot be changed.
If you choose Modify the dialog is similar to Figure 183, but you cannot edit the
Name. You can edit the Title and Description and change the properties of the layer
(Visible, Printable, Locked).
Chapter 8 Tips and Tricks
147
Tip
You can move objects on one layer while you are working on another
layer. To avoid doing this accidentally, you should lock layers that you
are not currently working on.
An example drawing: house plan and furniture
A popular application for programs like Draw is the “moving the furniture” scenario.
You can easily draw the floor plan of a room or a house using Draw. The simplest way
is to draw walls as thick lines. Draw single rectangles or polygons and combine them:
place them together, select them, then from the right-click menu use Shapes >
Merge to make a single figure and add a hatching pattern. Before doing this, you
should read the section “Drawing to scale” on page 146.
For this example, a suitable measurement unit is the centimeter. The drawing scale
and grid settings depend on the size of the floor plan.
Use the Position and Size dialog (right-click and choose Position and Size) to position
and dimension the individual wall sections easily. Make sure that the rectangles
completely overlap (see Figure 184) otherwise the merging will give uneven edges.
Figure 184: Wall corner from two rectangles. From upper to
lower: before merging, after merging and after hatching
Figure 185 shows the finished floor plan. In addition, a chest of drawers has been
added.
The body of the chest is drawn on the Layout layer; the pulled-out drawer and the
open doors are drawn as a group and put on a separate user-defined layer (Layer4 in
our example). Figure 186 shows how this is done. Making the layer with the drawers
and doors visible or hidden will show them open and closed (see Figure 187). Hidden
layers are shown with a colored tab.
148
OpenOffice.org 3.3 Draw Guide
Figure 185: Floorplan with chest of drawers
Figure 186: Using layers for different parts of a drawing. (Left)
Draw the body of the chest on the Layout layer. (Right) Create a new
layer and draw the open drawers and doors, keeping the Layout
layer visible to help you position the additional objects.
Chapter 8 Tips and Tricks
149
Figure 187: Making layers visible or hidden. (Left) Hide the Layout layer to
see what is on Layer4. (Right) Show the Layout layer and hide Layer4 to
show chest with drawers closed.
Caution
If you copy a drawing object to the Clipboard or into the Gallery, all
layers other than the three standard layers (Layout, Controls and
Dimension Lines) are lost. Furthermore all objects are pasted into the
Layout layer. The reconstruction of layers is much easier if you
assemble objects on a layer into a group before copying.
Changing the layer of a drawing object
Draw has no direct command to change layers. To move an object to another layer,
change to the new layer, select the desired object or group, and then cut and paste it
into position. Watch the status bar (the selected object’s layer name is shown in the
information field) to follow and check the change.
You can also click on the object, hold the mouse button pressed for about two seconds
until the mouse cursor changes from a hand to a pointer with an open rectangle, and
then drag and drop it on the appropriate layer.
Creating a multi-page document
Draw documents, like presentation (Impress) documents, can consist of multiple
pages. As in Impress, tools to manage pages and backgrounds are available.
Pages are automatically named as Slide 1, Slide 2, and so on. This description is
relative; if you move pages around, they are automatically renumbered. If you want
to have fixed slide (page) names, you must name them yourself. Page names are
useful for working with the Navigator and when you want to insert single pages into
another document using Insert > File.
150
OpenOffice.org 3.3 Draw Guide
Using the Pages area
By default the Pages area is docked on the left of
the Draw window. It shows every page in the
document as a small picture. Select a picture from
the Pages area and the corresponding page is
loaded in the main workspace. Click on the page
to activate it for editing.
The Pages area behaves similarly to the Styles
and Formatting area. Drag on the gray separator
line to change the width of the Pages pane. Click
on the middle of this line to show or hide the
pane. Double-click with the Control key pressed in
the upper gray area to dock or undock the area,
which can be turned into a floating window.
In the Pages area you can drag and drop a picture
to change the order of pages in the document; a
black horizontal line shows the position where the
page will be inserted.
Using the context menu you can insert or delete
pages or duplicate pages with copy and paste
(alternatively create duplicate pages using Insert
> Duplicate Slide on the menu).
Using page backgrounds
With background pages you can set common settings for multiple pages of the Draw
document. These include setting the color or graphics of the background, background
objects, and fields such as page numbering and author.
Chapter 8 Tips and Tricks
151
Note
The terms used in this area may not be completely consistent, so that
the terms Slide/Page and Master/Background/Page Template are used
more or less interchangeably in places. When looking for information in
Help, it may be necessary to use alternative search terms.
Creating a page background
Change with View > Master to the Master view and note that a related Master View
toolbar opens. If this toolbar does not appear, activate it with View > Toolbars. In
this toolbar are switches for a new background page and for renaming the master
page. These functions are also available by right-clicking on a page picture in the
Pages area of the Master view. The button for deleting a master page is only available
when you select a background page in the Pages area which has not yet been
assigned to any page.
Figure 188: Master View toolbar
To return to normal mode, click the Close Master View button or View > Normal.
You can edit background pages just like normal pages. With Format > Page >
Background you can set the color, pattern, or background picture. These settings
are specific to each background page. In the Master view, you can set the size and
orientation of the page; such settings apply to all pages.
If you insert drawing objects on a background page, they are visible on all pages that
use this background. This a convenient way, for example, to place a logo on every
page.
Master pages are organized in layers just like normal pages. The layers of normal
pages are associated with the layer of the same name on the Master page.
Accordingly the layers Layout/Control/Dimension Lines are considered to be a unit
and the Master page layer Background objects is associated with them.
With Insert > Fields you can insert the date, time, page number, author and
filename. No other fields are available. With page number you cannot insert a fixed
page number but only a variable; the actual number appears on the page itself and is
determined by the position of the page. The number is automatically adjusted if the
page is subsequently moved.
Assigning and managing page backgrounds
You can open the Slide Design dialog (Figure 189) in two ways:
• Right-click on the page and choose Page > Slide design, or
• Look in the status bar to see which background page is the current one.
Double-click in this field.
The Slide Design dialog (Figure 189) shows the available background pages for that
page.
152
OpenOffice.org 3.3 Draw Guide
Figure 189: Slide design dialog
If the Exchange background page option is selected, the selected background page
will be used on all pages of the document, not just on the currently active page.
The Delete unused backgrounds option deletes any backgrounds (as shown in the
Slide Design dialog) that have not been assigned to a page.
Click the Load button to open the Load Slide Design dialog. From here you can load
previously prepared background pages. All Draw and Impress templates can be used
for this purpose. Note, however, that using Impress templates will bring in only the
background and not the other elements prepared in Impress.
Figure 190: Load Slide Design dialog
There is no special option to store background pages as templates. Instead you can
load a document with the desired background page and store this document as a
document template with File > Template > Save.
Color palette: adding or changing single colors
Draw (like all OpenOffice.org components) uses color palettes for the representation
of colors. In addition, you can customize the color palette to suit your own needs and
wishes. You can modify colors in a palette, add other colors, or create new color
palettes.
Chapter 8 Tips and Tricks
153
Reach these options with Tools > Options > OpenOffice.org > Colors or with
Format > Area > Colors (tab) (see Figure 191). The latter method allows color
palettes to be loaded or to be stored for future use. Any modifications made to colors
apply only to the currently active palette.
OpenOffice.org always uses the RGB color model internally. Other methods are also
available for the definition of a color value.
The color values can be input directly as numbers. Choose between the RGB color
model (base colors Red, Green and Blue) and CMYK (base colors Cyan, Magenta,
Yellow and Black, K= Key). The conversion to RGB values is made automatically.
Tip
Information about color models can be found under:
http://en.wikipedia.org/wiki/Color_model
Individual color tones are produced by using different values of the base colors. The
color value can be any integer value between 0 and 255. As an example, Red 3 has a
red value of 184, a green value of 71 and a blue value of 0 in the RGB model. The
CMYK color model uses percentages (in this case 0%, 44%, 72%, and 28%
respectively).
Change these values to manipulate the color tone. Either enter a number directly or
use the spinners on the right side of each field. The change in color will be shown in
the lower color field (see Figure 191). Click the Modify button to apply and store the
new setting.
To add a new color to the current palette, enter a new name in the Name field and set
the desired color values. Click Add. The new color will be added to the end of the
palette and stored in the currently active palette.
You can also delete colors from a palette. Select the color from the Color pull-down
menu and click on the Delete button, then on OK to confirm the change.
Figure 191: The Colors tab in the Area dialog
154
OpenOffice.org 3.3 Draw Guide
Click on the Edit button to open a dialog where you can set individual colors (see
Figure 192). Many more input possibilities are available in this dialog.
In the lower area you can enter values in the RGB and CMYK models as well as the
HSB (Hue, Saturation and Brightness) model.
The two color samples at the lower right show the current color (left) and the new
color specified by the color value fields (right).
Figure 192: Color dialog
The color windows in the upper area permit a direct selection of color without any
knowledge of color values. The right upper color window is linked directly with the
various color model input fields; if you click on a color in this window the numbers
change accordingly and a preview of the color appears in the right of the two color
fields (lower right in Figure 192; see also Method 2 below).
If you click OK, the color window is closed and the input field is again active. You can
at this stage select the color you have just defined, give it a new name, and store it by
clicking the Add button. The old color will then (without any further warning) be
overwritten.
Changing colors using the Color dialog
Method 1
You can change the current color by modifying the individual
color values explicitly. It is possible to change from one color
model to another during this process but the settings are
always calculated and stored according to the RGB model.
This may result in some slight adjustment to your input values
in the other models.
The color wheel to the right illustrates the HSB color model.
This model defines the color tone in terms of three
parameters: Hue (possible values from 0 to 359), Saturation
(possible values from 0 to 100) and Brightness (possible values from 0 to 100) is
Chapter 8 Tips and Tricks
155
defined. The number for the hue represents the angle in the color wheel; the other
two are both percentage values.
Method 2
You can select a new color by clicking on a point in the color window at the upper
right of the dialog. The chosen color is shown in a black frame which can be dragged
with the mouse. If this color is not quite right, you can fine tune it as described above
in Method 1 by changing the color values.
As you drag the small square you will see the value
change in the number fields. The CMYK and RGB are
more or less self explanatory. To make the HSB model a
little clearer, some additional comments are necessary.
To better understand the working of the HSB model,
move the frame from left to right and top to bottom. You
will see that the Hue and Saturation values swing
between their maximum and minimum (hue by
horizontal movement and saturation by vertical
movement), but the brightness remains the same (see
figure at left). This latter can only be adjusted by
entering a value into the number field.
Method 3
The left color window is divided like a chess board into 8 x 8 individual fields, each
with a different color. Most important are the colors in each of the corner fields. The
color red changes stepwise to green in the first row, and stepwise to yellow in the
first column. The color green in the last column changes stepwise to blue.
This window thus contains a stepwise change between each of the four main colors in
the corner points. If you hover the mouse over a square the RGB value is shown as a
tooltip. For example, the yellow corner field (lower left) has RGB values of 255, 255
and 0 (full red, full green and no blue).
Click on this yellow field. A frame appears. If you click the --> arrow under the color
windows the selected color is assigned.
You can change the color spread in this window to a more specific range by changing
one or more of the corner fields. Click on the corner you want to change, then select
the preferred color from the right color window with the mouse and/or set it using
the number fields. Now click on the <-- arrow; the new color will be assigned to the
corner square you selected and the overall appearance of the window changes
accordingly.
156
OpenOffice.org 3.3 Draw Guide
Figure 193: Changing the color of a corner square
Creating cool effects
Duplication
Duplication makes copies of an object while
applying a set of changes (such as color or
rotation) to the duplicates.
To start duplication, click on an object or group
and choose Edit > Duplicate. The Duplicate
dialog (Figure 195) appears.
Figure 194: Duplication example
Figure 195: Duplicate dialog
Choose the number of copies, their separation (placement), rotation, and so on. The
choices above applied to a blue rectangle produce the result shown in Figure 194.
Chapter 8 Tips and Tricks
157
Cross-fading
Cross-fading transforms one shape into another. The result is a new group of objects
including the two end points and the intermediate steps.
Figure 196: Cross-fading example
To do a cross-fade, first select two objects.
Figure 197: The two objects
selected for cross fading
Then choose Edit > Cross-fading.
Figure 198: Cross-fading dialog
On the dialog choose the number of increments (transition steps). You probably want
to have Cross-fade attributes and Same orientation both checked. The end result is
shown in Figure 196.
Which object goes in front?
How do I tell Draw that I want
and not
?
Select
(the object we want in front), right-click and choose Arrange > Bring to
Front (or press Ctrl+Shift+plus). Or select
(the object we want behind), rightclick and choose Arrange > Send to Back or press Ctrl+Shift+minus.
158
OpenOffice.org 3.3 Draw Guide
9
Chapter
Organization Charts, Flow
Diagrams, and More
Drawing an organization chart
Even though Draw does not have an organization chart toolbar, you can draw these
charts by drawing rectangles and connector lines (see Figure 199). You can indicate
hierarchies by using a color progression from dark to light tones. Your color choices
should maintain a good contrast between text color and background so that you can
easily read the printed diagram.
Figure 199: Example of an Organization Chart
Before you begin, prepare a setup page or draft, with snap lines, to assist in drawing
the various hierarchies, responsibility paths, and typical boxes that you will use in
drawing the chart.
Figure 200: Draft with snap lines
Place and dimension the individual boxes according to the size of the overall chart.
The exact size (particularly width), position, and color will be fixed later. It is
sometimes easier to draw only one box per level; later you can copy and paste this
box and then move the copies to the desired positions. Using styles can also be
helpful; see the relevant section in Chapter 4 (Changing Object Attributes).
You can also select one or more boxes and use Edit > Duplicate to make copies (see
Figure 201). The spacing of the duplicated objects relative to the original can be
controlled using the placement fields for the X and Y axes. Note that positive values
for X and Y are to the right and downwards from the original object.
160
OpenOffice.org 3.3 Draw Guide
Figure 201: Duplicating an object
Which replication technique you use is up to you. The draft for the example in this
chapter should look similar to that in Figure 202.
Figure 202: The finished draft
The next step is to add text to the boxes. It is easiest to insert it as a text element
within the box as described in Chapter 2 (Drawing Basic Shapes). Activate the
icon on the Options toolbar and then double-click the box to enter text into it.
Alternatively, select the box and press F2. You should then see a blinking cursor in
the box and the Text Formatting toolbar should be visible.
Set the text formatting and type the text. Depending on the length and format of the
text, you may need to adjust the size of the box and the spacing to neighboring boxes
or else change the formatting of the text to fit the box. Adjustments can be made
initially with the mouse and then fine-tuned with the Position and Size dialog.
Now set up the fill colors and save the drawing. The connections between the boxes
are not drawn with ordinary lines but with Draw’s connectors. How to draw these
connectors and add text to them is described in “Glue points and connectors” starting
on page 164.
Chapter 9 Organization Charts, Flow Diagrams, and More
161
You can use dynamic text frames instead of boxes. These have the advantage of
automatic line breaks. Figure 203 shows the sequence of text input into a frame,
adding borders, and setting the background color. The Line and Filling toolbar may
not be visible until you have set a line type for the frame. Set the line type using
Format > Line or right-clicking the text frame and selecting Line.
Figure 203: Working with text frames
Drawing a flow diagram
For drawing flow diagrams (also known as flowcharts), Draw offers a separate
toolbar (Figure 204); click the flowchart icon
on the main Drawing toolbar.
The easiest way to draw a flowchart is to follow the same setup procedure as for
organization charts. Select the symbols from the toolbar and drag them into position
as described in Chapter 2 (Drawing Basic Shapes). See Figure 205 for an example of
a typical flowchart.
The individual symbols must be exactly positioned if the connectors joining them are
to form a vertical line. The midpoints of all the symbols that lie in a vertical straight
line should have the same X coordinate and those on the same level on a horizontal
line should have the same Y coordinate.
162
OpenOffice.org 3.3 Draw Guide
Figure 204: The Flowchart
toolbar
Figure 205: Example of a flow diagram
Chapter 9 Organization Charts, Flow Diagrams, and More
163
Select the shapes that are to lie in a vertical straight line and center them with
Modify > Alignment > Centered. For those on a horizontal line, select the shapes
and center them with Modify > Alignment > Center. You can also set snap lines if
you need several vertical lines.
After adding text and setting the fill color, you can join individual symbols together
and add text to the connectors. This technique is described in the next section.
Glue points and connectors
These elements were briefly introduced in Chapter 2 (Drawing Basic Shapes). This
section describes how to use them.
Connectors are lines or arrows whose ends automatically dock to a connection or
glue point on an object. Connectors are particularly useful when drawing
organization charts, flow diagrams, and mind-maps. The connecting lines between
the symbols remain intact even when the latter are moved or rearranged.
The Connector toolbar
Click on the
toolbar.
arrow of the
button on the Draw toolbar to open the Connectors
If the type of
connector you want
is not shown, drag
the toolbar to make
it float, then click on
the
arrow in the
toolbar’s title bar. In
the list that appears,
click on Visible
buttons to open a
menu from which
you can activate
additional types of
connector (Figure
206).
Figure 206: Activating additional connectors
164
OpenOffice.org 3.3 Draw Guide
Connector types fall into four groups:
•
Standard connectors – the line segments run vertically and horizontally. All
angles are right angles. The connector does not bend around the objects it binds.
•
Line connectors – consist of a line segment and two smaller horizontal or
vertical segments at the ends.
•
Straight connectors – consist of a single line.
•
Curved connectors – are based on Bézier curves, as described in Chapter 10
(Advanced Draw Techniques).
You can modify all the connector types from the context menu. Select Connector to
change from one connector type to another (as well as some other properties). With
the Line dialog you can change the appearance of the line (color, arrow style, and line
style) but not the connector type.
Drawing connectors—basics
When you choose a connector from the toolbar, the mouse pointer changes to
.
As you move the cursor over an object, the available connection points (also referred
to as glue points) become visible. To connect two shapes, move the mouse cursor
over a glue point, click and hold down the left mouse button to establish the first
point, and then drag the mouse cursor (left button still pressed) to the other glue
point and release the mouse button. The ends of the line are now docked and the
connection is established (see Figure 207).
Figure 207: Gluing a connector to a shape
You can also attach the beginning or the end of a connector to the middle of an
object. This is useful when the final position of the object is not yet determined. When
you move the object, Draw automatically selects the optimal location for the
connector ends (see Figure 208).
Figure 208: Connector attached to the middle of an object
Chapter 9 Organization Charts, Flow Diagrams, and More
165
As with all other objects, connectors have one or more control points to simplify the
construction of the drawing. You can use these points to change the shape, length,
and proportions of the connector line (see Figure 209).
Figure 209: Control points of
a connector
To remove a connector from an object, either move the end of the connector away
from the glue point of the object or simply delete the connector entirely.
Editing glue points
Glue points can be edited using a separate toolbar (see Figure 210). This toolbar
appears when you click on the Glue Points icon
from the main menu.
or select Edit > Glue Points
Figure 210: The Glue points toolbar
The following briefly describes the function of each button on this toolbar.
Use this button to insert a new glue point into an object you have drawn. If
the object is filled, you can place a glue point anywhere inside the object or
on its frame. With unfilled objects you can place a glue point only on the
outside frame but you can then drag it inside the object provided that the
Glue Points icon on the Drawing toolbar is still active .
The glue points that you add remain visible as long as
the Glue Points icon is active. They appear as small blue
crosses. A selected glue point has a gray square behind
the cross. You can move a selected glue point with the
mouse or delete it with the Del key.
Use these four buttons to choose one or more directions permitted for a
connector to join to a particular glue point.
Activate Glue Points and then choose the direction. If, for example, you
activate only the
button, every connector will be forced to come to that
glue point from the left side.
166
OpenOffice.org 3.3 Draw Guide
In the left-hand drawing below is a glue point in the circle with a left entry
and one in the square with a right entry. The effect of this when adding a
connector between the two glue points is shown in the right-hand drawing..
If you are in glue point editing mode and you add another direction to a glue
point (for example by activating the
button), Draw tries to optimize the
length of the connector. For the example above, the connection inside the
circle would change as shown below.
If the Glue Point Relative button is active (as it is by default) the glue point
will move when you change the size of the object, as shown below.
If the Glue Point Relative button is deactivated, the remaining buttons on
the toolbar, previously grayed out, become active. With these buttons you
can decide how a glue point will be placed when the size of the object is
changed.
These buttons determine how the horizontal position of a glue point changes
when you resize the object containing the glue point. You can choose
whether the glue point remains at a fixed distance from the left edge of the
object, from a vertical line through the middle, or from the right edge of the
object when you change the size of the object. If the width of the object
becomes less than that distance, the glue point is attached to the object
frame.
The following example shows what happens when an object’s width is
changed and the glue point is set to be a fixed distance to the left frame.
Chapter 9 Organization Charts, Flow Diagrams, and More
167
These buttons determine in a similar manner the vertical position of a glue
point when the size of the object is changed.
Adding text to connectors
To add text to a connector, double-click the connector. The end and control points
become active and the familiar flashing text cursor appears (the cursor position is
determined by the most recent setting). The Text Formatting toolbar also appears
(under the menu bar). Use this toolbar to set the text properties; you can directly
insert the text.
If you draw a connector and then click on it, only the end points and control points
become visible. In spite of this, a connector has its own object frame—in this case an
invisible one. You can picture it easily by imagining a rectangle enclosing the start
and end points of the connector (Figure 211).
Figure 211: Object frame of a connector
When you add text to a connector, the location of the text is relative to this rectangle.
The exact position of the text can be set in the Text dialog (Figure 212). This dialog
appears when you double-click on text and then choose Text from the pop-up menu
or when you single-click on the connector and select Format > Text from the menu
bar.
Take particular note of the Spacing to borders and Text anchor sections in the Text
dialog. In the Text anchor section you can see the possible locations for the text. In
the example below the text is anchored at the top left. In the Spacing to borders
section at the lower left, negative values of spacing will position the text outside the
frame.
168
OpenOffice.org 3.3 Draw Guide
Figure 212: The Text dialog
Adjusting text to suit the connecting line
If you want the text to follow the slope or curve of a line, you need to activate and use
the Fontwork tool. To add this tool to the Draw toolbar:
1) Choose Tools > Customize from the menu bar.
2) On the Toolbars tab, select Drawing from the Toolbars pull-down list. In the
Toolbar content section, click Add.
3) On the Add Commands dialog, select Format from the left-hand list and the
command Fontwork. Click Add, then Close to return to the Customize dialog.
4) In the list of commands under Toolbar Content, move the Fontwork icon
the location you want by using the up/down arrows, and then click OK.
to
To write slanting text, follow these steps:
1) Add the text to the connector as described earlier. The anchor location of the
text is not important at this stage.
2) Select the object with the text (in this case the connector) and click on the
Fontwork icon
to open the Fontwork dialog.
3) To make the text lie along the inclined line, click the Rotate icon and set the
distance to the line you wish.
Chapter 9 Organization Charts, Flow Diagrams, and More
169
Figure 213: Adding text to an inclined line, Step 1
Figure 214: Adding text to an inclined line, Step 2
The Fontwork dialog provides many other possibilities for manipulating text. You can,
for example, rotate the text 180 degrees with the Orientation
icon (which was
done in the example above) or place the text under the line by assigning a negative
value to the spacing between text and line.
In addition, you can use the Fontwork dialog to generate curved text that follows the
shape of a curved line. Experiment a little to investigate some of the possibilities.
170
OpenOffice.org 3.3 Draw Guide
10
Chapter
Advanced Draw
Techniques
Drawing to scale
Draw is not a CAD (computer-aided design) program but a graphics program with
which you can produce drawings to scale. The example used for this chapter is a
drawing of a Logic Circuit Diagram. The exact meaning of the individual symbols is
not described here as we are only interested in the drawing techniques used to
produce the diagram.
The logic symbols in Figure 215 form the building block library for our scale drawing.
Figure 215: Logic Symbol library
Working with the Position and Size dialog
To ensure that the edges of the building block symbols do not coincide with the
wiring, they should be 8 mm wide and 8 mm high. The connections to the symbols
should have a length and separation of at least 5 mm. These values are somewhat
arbitrary and you can substitute values that suit your own needs.
For the drawing we used a measurement unit of millimeters, a grid spacing of 5 mm,
and a grid subdivision of 4 points. In addition you should probably activate Display
grid and Guides when moving as well as Snap to grid (see Chapter 8). This drawing
will serve later as a collection of available symbols, so you should not only draw the
symbols but fully detail them as well.
The first step is to draw a base element, an AND gate block. You can then dimension
and detail this element (use the Position and Size dialog, as shown in Figure 216;
double-click on the status bar or context menu to help with dimensioning). For this
example, the left upper corner of the block is at x=10 mm and y=5 mm.
Figure 216: Positioning and dimensioning a Draw object
172
OpenOffice.org 3.3 Draw Guide
Draw the first connection lead by eye and dimension and position it using the Position
and Size dialog.
Figure 217: Setting the position and dimension of the upper input
Use the same method to draw the remaining two leads. For positioning the input
leads, fix the right end points; for the output lead, fix the left one. The first wire lies
1.5 mm below the upper edge of the block. The leads have a 5 mm spacing between
them. The following table shows the relevant coordinates of the upper corner points
and the leads.
left (X/Y) [mm]
right (X/Y) [mm]
Input 1 (X/Y) [mm]
Output (X/Y) [mm]
10 / 5
18 / 5
10 / 6.5 (right EP.)
18 / 6.5 (left EP.)
For the lower input lead, increase the Y coordinate of Input 1 by 5 mm to 11.5.
The AND gate block is almost finished. We can use it as the basis for all the other
gates. Use Edit > Duplicate to ensure uniformity of shape and size, so that the
drawing gives a good visual impression
Because we want to copy the block vertically downwards, use a Placement on the X
Axis of 0 mm and on the Y Axis 15 mm.
Figure 218: Duplicating an object
Chapter 10 Advanced Draw Techniques
173
Using the same method, copy both blocks twice more to the right. Select both blocks,
call up the Duplicate dialog, and use placement values of 30 mm (X) and 0 mm (Y).
Your drawing should look similar to Figure 219.
Figure 219: The blocks after duplication
For the INVERTER or NOT gate the connection leads must be amended. Move one
input and one output lead to the middle of the block and delete the superfluous input
lead.
Draw the missing circle for negation with a diameter of 2 mm, place it by eye in the
center and then position it and dimension the connections from the Position and Size
dialog as described above.
You can copy the circle to the Clipboard and then paste it as many times as you need,
positioning it and adjusting the lead lengths as above.
A wiring diagram also needs a symbol to show a connection point. Draw a filled circle
for this.
Next add text to the symbols (&, =1 etc.). Activate the icon
on the Options
Toolbar. Double-clicking a symbol will now put you in a special text input mode. This
integrates the text as an element in the object (see also Chapter 2 of this guide). You
will find the OR symbol (≤) in the list of special characters (Insert > Special
Characters).
It is probably a good idea to create a group for each type of gate. This will make it
easier to use them in a diagram. Your diagram should now resemble Figure 215; save
it to disk.
If you want, you can add a name to each of the gate symbols (AND, OR ...). Use a
separate layer to add this text so that you can switch it off when necessary.
You can place glue points at the end of each connection lead. This will simplify the
actual “wiring up” later when you add in the connectors.
Setting glue points
This instruction assumes a basic knowledge of connectors and glue points. For
additional information refer to Chapters 2, 8, and 9 of this guide.
Note
If objects are included in a group, it is not possible in Draw 3.3 or
earlier to add glue points to them; glue points must be set before any
grouping is done. This will change in Draw 3.4.
The glue points on the connection leads must be placed exactly at the ends of the
lines (otherwise the wires will not be properly aligned). Unfortunately you cannot set
the position of glue points using numerical values. It is necessary to do it by hand.
174
OpenOffice.org 3.3 Draw Guide
The best solution is to use the Zoom toolbar to enlarge the diagrams. You can find
this as a tear-off toolbar on the standard Drawing toolbar. It contains (among others)
tools for zooming in and out (enlarging or shrinking the view) of the current page. If
you click on the Zoom In tool and then click on the page, the scale is doubled and
the view is centered on the place where you clicked.
As the ends of the connection leads in this example do not lie on grid points, you must
switch off Snap to Grid and activate Snap to Object Points.
When you have done this, you can open the Glue Points toolbar with the Insert Glue
Point icon
on the Drawing toolbar or using View > Toolbars from the menu bar.
Figure 220: The Glue Points toolbar
Select the block on which you want to insert a glue point. Click the Insert Glue
Point icon
. It is now activated and appears with a different background. The
mouse cursor changes to a small cross and you can set the first glue point. Click the
mouse at the desired location. If the point is not exactly where you want it, move it by
dragging with the mouse.
When you are satisfied with the location, click on the Glue Points toolbar the icon
with the exit direction you want (left, right, top or bottom). The selected icon now has
a different (lighter or darker) background. Set the exit direction of the input
connection leads to the left and the output leads to the right.
When you have set a glue point at the end of each gate’s connection lead, you can
copy it into the Gallery.
Copying individual pictures to the Gallery
The Gallery is a very convenient way of controlling building blocks for drawings. It
also functions as a symbol library.
First open the Gallery using Tools > Gallery or by clicking on the
present in one of the toolbars.
icon if it is
The Gallery appears above the drawing page. The left pane shows the folders
available for use and the right pane shows the images contained in the current folder.
Choose an image by clicking on it; additional information about the image appears in
the header bar.
In the left pane, click the New Theme button to create a new folder. A new window
opens. Click on the General tab and give the new theme a meaningful name (for
example Logic) to replace the default of New Theme. You can rename a theme by
right-clicking it in the folders pane on the left.
To import existing images into the Gallery, click on the Files tab and then on the Find
Files... button. It is possible to bring in complete folders or individual files; the
procedure is self-evident from the dialog windows that open, or see Chapter 14
(Working with the Gallery) in the Getting Started guide.
You can drag and drop Draw objects straight into the Gallery. (The Properties window
can be closed after typing in the name.) First select the destination folder, then click
on the first symbol that you wish to add to the Gallery. Position the mouse cursor
Chapter 10 Advanced Draw Techniques
175
inside the selection frame of the symbol. When the crossed arrows are visible, click
on the symbol and keep the mouse button pressed. After about 1 or 2 seconds the
cursor will briefly blink and change to the drag symbol. Drag the object into the
Gallery and release the mouse button. When you move the mouse into the Gallery
field, the cursor shape changes once more (see Figure 221).
Figure 221: Crossed arrows > Drag symbol > Gallery
symbol
Tip
Zoom in on very small graphics before you try to move them so that the
crossed arrow symbol can be clearly seen.
When you have placed all the symbols in the Gallery they can be titled. Right-click on
a symbol, choose Title from the menu and type the symbol name (AND, OR).
The symbol library is available to all OOo modules, for all users who have the
permission/rights to access it. Making the drawing collection available as a Draw file
is the simplest way to distribute a symbol library to other users. After opening the
drawing, other users can easily transfer the drawing objects into their own Gallery, as
described above.
Drawing a logic circuit diagram using the Gallery
The use of the symbol library which you have created and placed in the Gallery can
be illustrated by using the blocks to draw a half adder (see
http://en.wikipedia.org/wiki/Half_adder#Half_adder). You can precisely place all the
drawing objects with the help of Draw’s snap functions. The following instructions
are only one way to achieve this objective.
Begin with a new drawing. Set the unit of measurement to centimeter, a grid point
spacing of 0.5 cm and subdivision of 4 points. Activate the grid, guiding lines, and
associated snap functions.
In the first part of the exercise you should draw only the two signal leads a and b, the
two INVERTER gates and the two AND gates.
Begin by drawing the two signal leads. To make it a bit easier, you can use the values
in the following table.
Start point
Length
Signal wire a
X = 2 cm / Y = 3.0 cm
5.5 cm
Signal wire b
X = 3 cm / Y = 3.0 cm
5.5 cm
After drawing the two signal leads, you begin the hardest part. With grouped objects
the snap function works only on points on the outside contours. The only way to work
with these blocks as a unit, however, is as a grouped object. The input and output
leads must lie precisely on grid points if the connecting lines are to be exactly
horizontal or vertical.
176
OpenOffice.org 3.3 Draw Guide
Figure 222: Half adder drawn using logic symbol building blocks
Position two horizontal guiding lines (A, B) on the grid with Y=4.0 cm and Y=6.0 cm.
With Snap to Grid active, this should be no problem. With an INVERTER gate the
input and output leads lie in the middle of the block, 4 mm below the upper edge. In
order that the input and output are docked to the guiding line, the upper edges of the
INVERTER gate must be positioned (for a 5 mm grid spacing) at Y=4.1 cm and Y=6.1
cm. Right-click on the guiding line, select Edit guiding line from the context menu
and set the guiding lines to 4.1 cm and 6.1 cm.
In order that the blocks lie exactly underneath each other, insert vertical guiding
lines at X=5.0 cm (INVERTER gate) and X=8.0 cm (AND gate).
Now open the Gallery and drag the Inverter gate into approximately 0.64, the
position desired. If the function Snap to guiding line is still active, you will be able to
accurately position both blocks in the correct location. Your diagram should now look
like Figure 223.
Figure 223: Drawing a half adder – Step 1
Chapter 10 Advanced Draw Techniques
177
The input and output leads of the INVERTER lie at Y=4.5 cm and Y=6.5 cm. Move the
mouse over a guiding line. When the mouse cursor changes to a double arrow, drag
the guiding line (with the left mouse button pressed) onto the input and output leads
of the block. If the grid snap is still active, this should be exactly positioned without
much effort.
The leads of the AND gate lie 1.5 mm below the upper edges of the two horizontal
guiding lines. They must be moved up for the next step. The Y coordinates are
reduced to 4.35 cm and 6.35 cm (the top edges of the AND gates). When you have
moved the lines, you can drag both AND gates from the Gallery and position them.
Your drawing should now resemble that in Figure 224.
Next drag the horizontal guiding lines again over the input and output of the gates
(Y=4.5/6.5 cm), so that when you position the connection point of the leads (a small
black circle) it will sit exactly on top of the leads from the gates.
Figure 224: Drawing a half adder – Step 2
To position the two last gates, you need to set the following additional guiding lines: a
vertical line with X=11 cm and two horizontal lines (C,D) at Y=5.5 cm and Y=7.5 cm
respectively. Shift the horizontal lines C and D each 1.5mm upwards (so that Y=5.35
cm and Y=7.35 cm).
Drag the OR and the last AND gate from the gallery and position them as in Figure
225.
Figure 225: Drawing a half adder – Step 3
178
OpenOffice.org 3.3 Draw Guide
Since the OR gate will be connected to the two previously positioned AND gates, you
can delete the guiding line of the OR gate. Drag the 0.64 horizontal guiding lines C
and D over the inputs of the AND gates (Y=7.0 and 7.5 cm) and put two other lines
(E,F) on the remaining connections (Y=5.0 and 8.0 cm) as shown in Figure 226.
Deactivate all snap functions except Snap to grid. It is a good idea to zoom in so that
you can place the lead connections exactly over the intersection points. Drag the
connections singly from the Gallery to where you want to position them. You will need
to adjust their position with the mouse. The easiest way is to move the connection
diagonally to the desired location (see Figure 227).
The guiding lines are no longer needed and can be hidden (it is better to wait until
you have finished the drawing before you delete them). Your drawing should now
start to look like Figure 226.
Figure 226: Drawing a half adder – Step 4
The individual blocks must now be joined up so that the gates function as a half adder
system. To do this, you use connectors. Open the Connector toolbar. Use the standard
connector
to join the OR to the two AND gates. All the other leads run
horizontally and you can use the direct connector
.
When all six lead connections have been positioned, both signal wires should have a
small black circle added to their connection points. You can use the symbol for NOT
from the Gallery as the basis for this.
Figure 227: Setting the connections
Chapter 10 Advanced Draw Techniques
179
If you have correctly positioned the symbols in the drawing, all the connection leads
will be straight lines. At this time you can delete all the guiding lines, add text to the
drawing and your finished drawing should resemble Figure 222 on page 177.
Dimensioning a drawing
Configuring the dimensioning style
As is usual with Draw, you configure dimensioning using a style.
After opening a drawing, press F11 to access the Styles and Formatting window. In
the Graphic Styles list, right-click on the style Dimension Line and select Modify. The
dialog that opens contains the current settings. Click the Dimensioning tab (Figure
228).
Figure 228: Configuring dimension lines
You can configure all the properties you see in this window to suit your own needs.
The left section includes the basic settings for dimension lines and dimension guide
lines (these indicate where on the object the dimension is referenced):
• Line distance: the distance of the dimension arrow from the object edge
• Guide overhang: the distance the guide line extends past the arrow
• Guide distance: the distance of the guide line from the object edge
You can individually set the line lengths of the right and left guide lines and use
positive or negative values to have the line above or below the reference point. The
direction of the line with positive or negative distances depends on the setting of the
Measure below object option (box checked or not), but this is easy to check by
referring to the example dimension line in the bottom window of the dialog. For this
current exercise click the box and activate this option.
180
OpenOffice.org 3.3 Draw Guide
In the right section you can change the settings for the Legend, the text of the
dimension line. You can use the Text position choices to change the location of the
text – but only if one or both of the AutoVertical and AutoHorizontal checkboxes are
unchecked. Use the various options on the Text and Alignment tabs to further change
the text format.
Calculation of dimensions always takes into account the scale and dimension units
contained in Tools > Options > Draw > General. If you set a scale of 1:10 and a
unit of centimeter, then a 6 cm long object in the drawing will be shown with a
dimension of 60 cm when the option Show meas. unit is activated and the selection
window is set to Automatic. Deselecting this option turns off the display of units. You
can change the units displayed from Centimeters to (for example) Millimeters by
choosing Millimeter instead of Automatic in the selection window.
Adjust the font type and size for the text of a dimension line by means of the Text tab.
The Standard button at the bottom of the dialog sets all the properties of the
dimension line to the (inherited) standard properties of the style.
Note
The dimensioning style Dimension Line is always linked and stored with
the current work page. All the changes that you make apply only to this
page. New drawings are started with the standard properties of Draw.
If you want to use the amended style for future drawings, save the page
as an additional template.
Dimensioning objects
In this exercise you will dimension some logic blocks (see Figure 229). They are used
here to demonstrate the technique; you can use your own drawing or fetch a picture
from the Gallery.
Figure 229: Dimensioned logic blocks
So that Draw can clearly recognize the edges to be measured, you should set a
number of guide lines delineating the edges. The previous sections explain how to do
this. To place the guide lines exactly and easily, change the resolution of the Grid.
Suitable values for this work are a resolution of 5 mm and a subdivision of 4 points.
With this setting you should have a snap to grid function with 1 mm point separation.
We will begin by dimensioning the NOT gate. For this block we want the total width
(18 mm) and the width of the block itself (8 mm) to have dimension lines. The first
step is to add guide lines to delimit the dimension lines. With Snap to grid activated,
you can position these quite accurately (see Figure 230a). Be sure that the function
Snap to guide lines is active and zoom in to the part of the block to be dimensioned.
The block should not be selected.
Chapter 10 Advanced Draw Techniques
181
Start the dimensioning command by clicking the Dimension Line icon
on the
Arrows toolbar. This toolbar is not visible by default. The dimension line is placed
automatically on the Dimension Lines layer so that you can hide dimension lines if
you wish.
Figure 230: a) Delimiting the edges with guide lines
b) Dragging the dimension line (anticlockwise)
c) Finished dimension line
After clicking the Dimension Line icon, the mouse cursor changes into a small cross.
As we activated the option Dimension Line – Measure below Object, the dimensioning
should be made in a counterclockwise direction. Place the mouse cursor at the left
dimensioning point. Press the left mouse button and drag the mouse to the right
dimensioning point. Release the mouse button. If you press the Shift key while
dragging the mouse, you will restrain the dimensioning line in a horizontal (or
vertical) direction (see Figure 230b).
In the same way you can draw a vertical dimension line on the AND gate. The
dimensioning of the NEGATION symbol should also be simple to accomplish, but it is
important that for such small components you zoom in enough to accurately position
the lines.
Editing dimension lines
Dimension lines can be subsequently edited. You can select single dimension lines
which are displayed with four handles, located at the end of the dimension lines
(Figure 231).
Figure 231: Editing dimension lines
With the upper handles you can (only) change the length of the guide lines. With the
lower handles you can move the points that are being dimensioned. If you select the
dimension text, you can edit the font type and size as well as changing the dimension
units of the text.
If you only want to edit the text of the dimension, double-click on an unselected
dimension line to enter text edit mode.
182
OpenOffice.org 3.3 Draw Guide
All the changes that you make relate only to the selected dimension line. They are
stored and persistent, but do not affect the settings of the Dimension Line style. If
you insert other dimension lines, they will have the settings contained in the style.
If you want to make general setting changes to the Dimension Lines style, change the
appropriate style. As soon as you confirm the changes with OK, the new settings will
be applied to all dimension lines.
Working with text in Draw
You can use text in Draw in various ways:
•
•
•
•
as a text element
as text associated with a picture
as an element out of the Fontwork gallery
as a Writer OLE object
Configuring text elements with styles
Text, like all drawing objects, can be associated with styles. The text settings in styles
always affect the whole text element. You can format individual parts of a text
element, but only by using manual formatting, which is not related at all to styles and
templates. Styles for characters and paragraphs do not exist in Draw.
Open the Styles and Formatting dialog by pressing F11. Access the formatting
dialogs using the toolbar icons, the context menu, or the Format menu.
The Indents and Spacing, Text, Text effects, Tabs and Alignment tabs of the style
dialog function the same way as in text documents, although some options are not
available in Draw. Specific to drawing objects are the tabs Text and Text Animation.
Text animation
On the Text Animation tab, you can set how the text moves within the object frame.
Such effects are interesting mainly for documents that are to be shown on the screen.
They are therefore more commonly used in the Impress module. For printed text they
do not make any real sense and are not dealt with further in this guide.
Text
On the Text tab, you can determine the behavior of the text block in relation to the
border of the drawing object. The same settings can be altered—as manual
formatting—under the Text... command in the Format menu or in the context menu.
The type of drawing object determines which settings are active and what effect they
have on the text. Shapes behave differently to other drawing objects. To experiment
with the settings, use objects with rounded edges so that differences in spacing and
alignment show up better.
Chapter 10 Advanced Draw Techniques
183
Figure 232: Text tab of Graphic Styles dialog
Anchoring text
To try out the different settings possible for text anchors, start by drawing an ellipse
from the Drawing or Basic Shapes toolbars
, change into Text edit mode by
double-clicking on the ellipse and write several (not too long) lines of text. Repeat
with an ellipse from the Circles and Ovals toolbar (a classical drawing object). This
toolbar is not available by default; you must customize the Drawing toolbar to add it.
Note
To tell whether you have selected a basic shape or a classical drawing
object, look in the left hand side of the status bar; you will see either
Ellipse selected (Classical object) or Shape selected (Basic Shape).
In the Text tab of the Edit Style dialog, set the
values of the Spacing to Borders to 0 cm for all
four directions.
Set Options as Left in the tab Alignment.
184
OpenOffice.org 3.3 Draw Guide
Now we can try out some of the different possibilities of text anchoring.
Text anchored to left
middle – the text
block is placed on
the left side and
centered vertically.
Shapes
Classical drawing objects
“Left edge” here means the
edge of the text frame
whose left side fits totally
within the figure.
“Left edge” here means the
left side of the object frame –
the frame with the green
handles which is visible
when you click on the object.
The lower right corner of
the text block sits against
the edge of the figure.
The lower right corner of the
text block lies in the lower
right corner of the (invisible)
object frame.
Text anchor to lower
right.
The text anchoring
always relates to the
entire block, even
when single lines are
set differently to the
other text through
manual formatting.
If you checked the option Full width, the text block is always centered horizontally.
The area of the text block is maximized; here it extends either to the edge of the
figure or object frame or (when not that wide) to the width that is necessary to fit the
longest line. The difference becomes clear if you position the text on the left, but you
set single lines through hand formatting to be aligned on the right.
In the examples below, the first line of text was shortened to “First line with”,
spacings were set to 0 and text anchor to middle left.
Chapter 10 Advanced Draw Techniques
185
Shapes
Classical drawing objects
Without option
“Full width”
With option “Full
width”
Fitting text in frames
Here you find that shapes and classic Draw objects behave completely differently.
For shapes the options on the right are active.
Figure 233: Options active for shapes
These have the following effects.
Word wrap text in shape:
No automatic hyphenation is
available and you cannot insert a
fixed hyphen.
If the text does not fit within the
shape, the overflow appears above
or below the shape.
Resize shape to fit text:
186
Watch out! If you turn on this option
it is not possible to undo the size
changes – whether by using the
Undo function on the menu or by
switching off the option in the
dialog.
OpenOffice.org 3.3 Draw Guide
For the classic drawing objects, both lower left options in the dialog are active.
These options have the following effects.
Fit to frame:
The text is widened and compressed
so that it fills out to the object
frames.
Adjust to contour:
All the text is contained within the
figure. It is split over several lines if
necessary. Any text which does not
fit in the figure is not shown, but is
still retained.
Note that even if you have activated
hyphenation, words will be split
without regard to the hyphenation
rules.
Distance from frame
Spacing settings are added to the text. In this way the text block is invisibly reduced
or (with negative values) made bigger.
In the examples below, the text (M) is centered horizontally and the text block is
anchored in the upper middle part of the frame.
Value for spacing
“Above”
–2 cm
–1 cm
0 cm
1 cm
2 cm
3 cm
The behavior is the
same for classic
drawing objects
and shapes.
Chapter 10 Advanced Draw Techniques
187
If you anchor the text above, below, right or left, a positive spacing value positions
the text in such a way that it sits close to the outside of the object frame at the
anchoring point. Anchoring in the middle does not result in this movement.
It is easier to add text to a straight line if the line is created as a very thin rectangle.
Choose an anchor point in the middle of the rectangle and then determine the exact
position of the text by setting the spacing accordingly.
Text added to open line types such as Bézier curves (curves and freehand lines),
Polylines (polygon and polygon 45°), and Arcs is also positioned in relation to the
enclosing object frame. If you want to see the extent of this frame, just click on the
object. To add text along one of these lines, you can use the Fontwork tool described
on page 191.
Text added as described above is rotated when the object is rotated. The property
settings, particularly those dealing with spacing relative to the frame, relate only to
situations where the object is not rotated.
Text frames and callouts
To test the range of possible settings, use a text frame or a callout with rounded
corners. For text frames, as for rectangles, you can set the rounding in the Position
and Size dialog (Slant & Corner radius) or in Points mode. The latter makes sense
only if you have a visible outline. With callouts (as with text frames in Points mode),
drag the larger handle in the left upper corner with the mouse to give the desired
amount of rounding. An example of this is shown in Figure 234.
Figure 234: Legend with rounded corners
Unlike drawing objects, text frames and callouts support automatic line breaks and
you can switch on automatic hyphenation under Tools > Language > Hyphenation.
Non-breaking dashes and protected separators are however not available. For a
manual line break, use (as elsewhere) the key combination Shift+Enter.
With the text and callout icons (
and
) you can create text frames and
callouts with vertical text. You need to activate Enhanced language support >
Enabled for Asian languages in Tools > Options > Language Settings >
Languages. Text frames can be rotated like drawing objects, but it is not possible to
rotate callouts.
Text frames and callouts do not have a separate text element, but you still use the
Text dialog to set formatting properties. As soon as you have input text, the upper
three settings on the left side become active (Figure 235). The settings for Spacing to
Borders and Text anchors in the lower window area function in a similar manner to
normal drawing objects and are not dealt with further here.
188
OpenOffice.org 3.3 Draw Guide
Figure 235: Text options active for text frames and callouts
All options off
In versions of Draw before 3.2, the text is
broken at the object frame. You do not see
text that does not fit within the object
frame. It is still available and if you enlarge
the object it will be visible.
In versions 3.2 and later, the breaking of
the text at the frame border does not
appear to function (this is probably a bug).
If you double-click the frame to edit the
text, it appears to be truncated but exiting
text mode returns the original view.
As with normal drawing objects, the text
positioning relates not to the figure itself
but to the object frame. Observe that the
text frame in the example on the left
extends outside the ellipse.
Fit width to text
The width of the text frame or callout is
enlarged so that the longest line fits,
without a line break, inside the object
frame.
A previously inserted manual line break
(here after the word “longer”) remains in
effect.
Fit to frame
The text is widened or compressed so it fits
within the entire object frame. This effect is
the same as with normal drawing objects.
With the symbols
and
you can
produce a text frame that has this property
already set.
Chapter 10 Advanced Draw Techniques
189
Fit height to text
The height of the text frame or callout is
enlarged so that all lines fit within the
height of the object frame.
Pictures and text
Pictures also possess a text element. You can use this text element to place lettering
over the picture or to give the picture a caption. To format this text, proceed in the
same way as for a normal rectangle. Usually you produce text as a separate object
and then group it with the picture, because this gives you more flexibility.
Here are two examples showing what is technically possible with text elements.
tab: Font, Comic Sans MS, Bold, 40pt
tab: Font Effect, color white, with shadows
tab: Alignment, Options Right
tab: Text, Text anchor “upper right” and
Spacing to borders right 0.5 cm, top
0.5 cm, others 0.0 cm
tab: Font, Bitstream Vera Serif, 14pt
tab: Alignment, Options Left
tab: Text, Text anchor “lower left” and
Spacing to borders bottom -1.3 cm
Note: the line break after the word “sea,”
was inserted manually.
190
OpenOffice.org 3.3 Draw Guide
The construction of each example was carried out using a graphics style. Right-click
on the picture and choose Edit Style to open the Graphics Styles dialog (Figure 232).
You may first wish to choose a different style to edit for the picture, or create a new
style for a special purpose. For more about styles, see Chapter 4 (Changing Object
Attributes).
If you store the picture using File > Export, the text is exported along with the
graphic. If you use the context menu option Save as Picture, then the text is not
exported.
Fontwork Gallery
Click the icon
to open the Fontwork Gallery (Figure 236) which you can use to
insert an eye-catching caption to an image. Fontwork drawing objects belong to the
shape category. The Gallery contains a selection of popular text forms.
Figure 236: The Fontwork Gallery
You are not limited to these samples; you can subsequently edit and customize the
chosen caption type. Proceed as follows.
Choose a caption type from the Gallery and click
OK. The caption is then inserted into the middle
of your document.
Use the green handles to drag and resize the
caption.
Chapter 10 Advanced Draw Techniques
191
Double-click to enter text editing mode and
replace the placeholder text “Fontwork” with your
own text.
Click outside the object or press the Esc key to
leave editing mode.
With the Area dialog from the Format menu or
the context menu, you can set fill and shadow
properties. Use the Line dialog to set a frame
around the lettering.
For further adjustments use the Fontwork toolbar.
If this does not open automatically turn it on with
View > Toolbars > Fontwork.
The symbol on the far left is already familiar. It
opens the Fontwork Gallery.
Use the small triangle on the symbol
to open
the tear-off Fontwork Shape toolbar and choose a
shape for the frame of your caption.
Use the yellow handle to modify the form of the
caption.
With the other icons you can further customize
the text direction and spacings.
To change the font type of the caption, use (as for
other text) the dialog from the Format >
Character menu or the context menu.
To give the text a 3D appearance, refer to the
relevant section in Chapter 7 (Working with 3D
Objects).
192
OpenOffice.org 3.3 Draw Guide
Writer OLE object
In some cases, text frames are not flexible enough to meet your needs and offer too
few possibilities for adjustment. For example, you may want to show a figure in Draw
in exactly the form it was created in Writer. The best solution might be to insert an
OLE object. This means that the object is linked or connected to the application that
created it. Draw makes available to other applications (only) one viewing window.
The object itself is not edited in Draw but in the other application.
Insert
Use Insert > Object > OLE Object to open the dialog as shown in Figure 237. Use
the Create new option to embed the OLE object in the Draw document. With the
Create from file option, you can choose whether the object should be embedded or
linked. With a linked file any change in the stored file will be shown in Draw and
conversely: any change you make in Draw will be stored in the file on disk.
If you have decided to embed the object you can still create an independent text
document from the OLE object. For this use the Save Copy as command from the
context menu.
Figure 237: Inserting an OLE Object
Editing mode
As soon as you click on OK, the object is created and opens in editing mode. You can
recognize this mode by the gray frame around the object and the small black handles.
Take special note of the toolbars. These are no longer those of the Draw module but
of the Writer module. Input the text and format it almost the same as if you were in
Writer itself. You now have available all the format styles from Writer.
Figure 238: Writer OLE object in editing mode
Chapter 10 Advanced Draw Techniques
193
With the handles of the gray frame you can determine which section of the entire text
document is visible. You should switch off the ruler view.
Figure 239: Editing in Writer as an OLE object
Click outside the object to leave editing mode. Double-click on the object or use Edit
> Object > Edit to change again into editing mode.
In an embedded Writer OLE object, you can connect to further “sub” OLE objects. In
current versions of Draw, this is possible only if you open the embedded object as a
standalone object in Writer. Similarly you cannot edit a linked Writer “sub” OLE
object directly in Draw; you must open it as a text document in Writer. This limitation
can be illustrated by the use of formulas. Such formulas are technically OLE objects
that belong to the Math module. To use mathematical formulas inside flowing text,
save the text in a separate text document and insert it as a linked OLE object in
Draw. Inserting graphics from a file is however possible within the OLE environment
in Writer.
Object mode
Click on an object to enter object mode, recognizable by the presence of the green
handles. In object mode you remain in the Draw module.
Possibly you noticed that in edit mode there is no Zoom. Set the size of the OLE
object on the Draw page in Object mode from the Position and Size dialog. In the lefthand image of Figure 240 the object was inserted at the original size, in the righthand image the size was reduced. If you change the size, take care that the option
Keep ratio is checked or else the object will become distorted. Line and Area
properties are not available for OLE objects, nor is it possible to rotate objects as
with text frames.
Figure 240: Zoom vs resizing of an OLE Writer object
OLE objects can be overlaid just like other drawing objects. In Figure 241 a drawing
object from the basic shapes menu has been placed behind the OLE object.
194
OpenOffice.org 3.3 Draw Guide
Figure 241: Draw object behind an OLE object
The page with the text document has the background property set to transparent. If
you change the background color of the OLE object in Edit mode, it will also show in
the Draw document.
The Format menu has the entries Area and Line grayed out because they are not
usable, but the menu entries Paragraph, Character, Text, and Bullets and Numbering
are all available. These relate not to the text object which you are currently editing
but rather to a separate independent text element within the object, which you can
open by pressing F2. (This is similar to the way that pictures are linked with an OLE
object.) The double-click, which opens the text element in images, does not work here
because it puts you into the OLE object’s edit mode. Whether it makes sense to use a
text element within text like this is questionable!
Guide to Bézier curves
Bézier curves—what are they?
OpenOffice.org uses cubic Bézier curves. A curve is defined
by means of a start point P0, an end point P3, and two
control points P1 and P2 (see the figure at left). For points
on the curve the terms nodes or anchors are often used.
For the mathematical background of Bézier curves, see
http://en.wikipedia.org/wiki/Bezier_curve.
Bézier curves are very useful for experimenting with the shape and form of curves. In
point mode you can change the curve alignment by dragging the points with the
mouse. The curve leaves the starting point P0 in the direction of the control point P1
and arrives at the end point P3 from the direction of the control point P2. These
directions are shown in Draw by blue lines. The more distant a control is from its
starting or end point the smaller the curvature at that point. If a control point lies
directly on one of these points, it has no influence on the curve.
Chapter 10 Advanced Draw Techniques
195
Direct drawing of a Bézier curve
Open the Curve toolbar by clicking on the small
black triangle of the
symbol on the
Drawing toolbar. Click on the Curve icon
The mouse cursor changes to
.
.
Click on the starting point of the curve and keep
the mouse button pressed (starting and end
points are shown here in the figures as snap
points).
Drag the mouse to approximately the position of
your first control point. It does not matter if this
is not exactly right as you can move the control
point location later. If you hold the Shift key
down while dragging, the control point will lie
on a 45 degree grid.
Release the mouse button and move the mouse
to the position of the end point of the curve. You
can see that the line of the curve follows the
movement of the mouse. Double-click at the end
position.
Turn on point mode with the
Draw toolbar.
icon from the
At the end of the curve you will see not only the
end point but also an associated control point,
the round handle. Hover the mouse cursor over
this point; the cursor shape changes to show
that you are in edit mode of a control point. You
may have to click on the control point to see this
change in behavior (see next section).
Now you can drag the control point to its correct
position, if necessary.
196
OpenOffice.org 3.3 Draw Guide
Point mode of the Bézier curve
After drawing a curve using the
icon from the Draw toolbar or with the Edit
points command from the context menu, you can switch to point mode from which
you edit individual points on the curve. Points on the curve are shown with a square
handle
; the control points with a round handle
. The starting point of a curve
appears somewhat larger than the other points. When you hover the mouse over a
curve point the mouse cursor changes to
- over a control point it changes to
.
In point mode the toolbar Edit Points should appear. If not, turn it on from View >
Toolbars > Edit Points.
You can switch on the option All control points in Bézier editor under Tools >
Options > OpenOffice.orgDraw > View. The default is to see the control points
and guide lines only when a point is marked by clicking on it. By holding the Shift key
down as you mark, you can select and mark several points at the same time. A
marked point is shown a little darker
.
Drawing a succession of Bézier curves
Several lines or Bézier curves can be linked together. The single parts are referred to
as segments. Technically such a succession of Bézier curves and lines is known as a
path.
Begin the drawing as with a simple Bézier curve. At the end position of the first
segment, end not with a double-click but with one of the following:
• Click on the end point of the first segment but do not keep the mouse button
pressed. In this way you produce a curve point which is a control point for both
segments. This control point lies, however, on an actual curve point and so
does not influence the direction of the following curve segment. Move the
mouse to the end position of the second segment. This segment appears to be
a straight line but is in fact a Bézier curve. Either double-click to finish the
curve or repeat the above procedure to add successive segments.
or
• Go back and click once on the end point of the first segment and keep the
mouse button pressed. Now you can drag the initial control point for the
second segment into place, as described above. Release the mouse button at
the desired position of the control point and move the mouse to the end
position of the second segment. The curve follows the line of movement of the
mouse.
You can either end the drawing here with a double-click or continue and link in
further segments.
To generate a closed curve, select the curve and click on the Close Bézier icon
on the Edit Points toolbar, or right-click and select Close object from the context
menu.
Chapter 10 Advanced Draw Techniques
197
Transition points
For the transition from one segment to the next, there are three different types of
points, each with its own properties.
Corner points
This is the only common point between two segments which are otherwise
independent of each other. It is likely that the curve has a kink at this point
(depending on the angle of the tangents, the lines from the corner point to each
control point; see Figure 242).
Figure 242: Corner point
Smooth transition points
The tangent lines to the common point have the same angle and form a straight line.
If you change the position of one of the control points the other also moves, so that
the tangents remain in a straight line. This also applies to the case where a Bézier
curve meets a straight line: the tangent line lies on the straight line and cannot be
moved sideways.
Figure 243: Smooth transition point
Symmetric transition points
In this case the tangents not only lie on a straight line but the distance of the control
points from the curve point is the same. The segments have the same direction and
the same curvature at the transition point.
Figure 244: Symmetric transition point
Changing point types
When a point is selected, the Edit Points toolbar activates the three corner point
icons (circled in the illustration below).
198
OpenOffice.org 3.3 Draw Guide
The circled icons are, from left to right, Corner point, Smooth transition, and
Symmetric transition. The latter two icons appear the same but you can identify them
by looking at the tooltip. At any time only one of the three icons will be active. To
change the type of point, click on one of the other two icons.
Note
If you cannot see the control point for a segment, try changing the
point type from Corner point to Smooth transition and then back again.
This often forces a redraw and you can then see both control points of
the common corner point.
Closing the curve
To close an open curve, use Close object from the context menu or the Close Bézier
icon
from the Edit Points toolbar. A straight line is drawn between the start and
end points if these points are Corner points.
If the start and end points are Smooth points or Symmetric points and the control
point does not lie directly on the curve point, it changes position so it is in a straight
line with the line segment and the closing line will be a curve (see Figure 245 for a
comparison).
To prevent this happening, change the curve point type before closing to a corner
point.
Figure 245: Close curve – start and end points are corner points (left),
smooth or symmetric points (right)
Transformation between straight line and Bézier curve
Transform a straight segment into a Bézier curve
Select the larger of the two handles at the ends of the straight line; this will be the
starting point of the curve. After a short time the Convert to curve icon
on the
Edit Points toolbar becomes active. It starts in the “out” position. Click the icon to
turn on the function. The straight line is transformed into a Bézier curve. The type of
the segment end point remains as it was. Using this function you can convert one side
of a polygon or a part of a polyline into a Bézier curve.
Chapter 10 Advanced Draw Techniques
199
Transform a Bézier curve into a straight segment
Select the larger of the two handles at the ends of the curve; this will be the starting
point of the straight segment. After a short time the Convert to curve icon
on
the Edit Points toolbar becomes active. It starts in the “in” position. Click the icon to
turn off the function. The Bézier curve segment is transformed into a straight line.
The type of the segment end point remains as it was. If all segments are straight
lines, Draw converts the object to a polygon or a polyline.
Transform complete curves, polylines and polygons
Transform a polygon or a polyline into a curve
Select the whole polygon or polyline. The object does not need to be in point mode.
Choose Convert to curve from the context menu or the Modify menu. The points in
the resulting curve are all of the type Corner point and the control points lie on the
curve segments. All the segments thus appear as straight lines.
Transform a curve into a polygon or a polyline
Select the whole curve. Choose Convert to polygon from the context menu or the
Modify menu. The curve does not need to be in point mode to do this. The individual
segments are not replaced by straight lines. Instead additional points are generated
on the curve so that the line of the polygon/polyline matches that of the curve as
closely as possible. These points are placed closer together as the curvature
increases.
before
after
Freehand lines
You can also produce a curved line from a Bézier curve using the freehand line tool
. This tool automatically inserts anchor points and control points to render the
curve as close as possible to the original Bézier curve.
Place the mouse cursor at the beginning point and keep the mouse button pressed
until you reach the end of the curve. As soon as you release the mouse button, the
curve is complete.
Normal view
200
Point mode
OpenOffice.org 3.3 Draw Guide
Combining closed curves
If you draw a Bézier curve segment and, at the end point of the segment, click and
hold the mouse button, followed by a single press of the Alt key, the curve is closed
with a straight line and you are placed in Combining mode. You can now begin a
second curve at an arbitrary point. Ending the drawing with a double-click also closes
this curve. If you end it with an Alt-click as described above, you can draw further
curves. The curves that you have just drawn form a common object, a so-called
Combination. You can use this (for example) to place holes in filled curves.
If you want to bind two curves together into a Combination at some stage, select both
curves and use Modify > Combine.
Even if you use a Combination, the individual curves are still available as objects. You
can use Modify > Split to convert the Combination back to single objects.
You can create Combinations only from closed curves. Other objects, such as
rectangles or polygons, will be automatically transformed into curves, and curves
that are not closed will be closed with a straight line.
Connecting curves
To join curves together, select them and use Modify > Connect. A connection is only
possible with open curves. If you use this tool on closed curves, they are first opened
and an additional end point inserted at the starting point. A straight line is used to
connect the curves.
The behavior of connected curves cannot (at present) be modified. It is not obvious in
advance how the transition properties of the connected curves are calculated, nor
which end points will be connected. It is therefore a good idea to work on a copy and
try out the effect with different positions of the end points of the individual curves. To
avoid changes to a shape, first set the property of the new connection point to the
type Corner point.
Adding comments to a drawing
Starting with OOo 3.2, Draw supports comments (formerly called notes) similar to
those in Writer and Calc. To insert a comment, choose Insert > Comment from the
menu bar. A small box containing your initials appears in the upper left-hand corner
of the Draw page, with a larger text box beside it. Draw has automatically added your
name and the date at the bottom of this text box.
Chapter 10 Advanced Draw Techniques
201
Type or paste your comment into the text box. You can optionally apply some basic
formatting to parts of the text by selecting it, right-clicking, and choosing from the
pop-up menu. From this menu, you can also delete the current comment, all the
comments from the same author, or all the comments in the document.
You can move the small comment markers to anywhere you wish on the page.
Typically you might place it on or near an object you refer to in the comment.
To show or hide the comment markers, choose View > Comments.
Select Tools > Options > User Data to configure the name you want to appear in
the Author field of the comment, or to change it.
If more than one person edits the document, each author is automatically allocated a
different background color.
Connecting and breaking lines
It is possible in Draw to join separate line elements into one line. Select a number of
lines and choose Modify > Connect. The lines are converted to curves and adjacent
end points are joined together. The resulting shape is a polyline, not a closed shape.
To add text to the polyline, press F2 and type the text. To make a closed shape from
the polyline, right-click the polyline and choose Close Object. You can add text and
also change area properties and edit the object as with any polygon object. Note that
you can only use the Close Object command on connected lines, freehand lines and
unfilled curves.
If you select a shape and choose Modify > Break, this does not reverse the Connect
process but simply converts the polygon into a collection of individual lines. Text
added to the shape will be associated with one of the lines (often the last one). You
cannot apply a fill to a closed shape made up of lines resulting from the Break
command.
202
OpenOffice.org 3.3 Draw Guide
Index
3
3D bodies 112
creating by body rotation 112
creating by extrusion 112
extrusion 112
ready-made objects 113
rotating 116
segments 121
settings 117
3D effects
geometry 119
illumination 126
material 131
shading 123
textures 128
3D effects dialog 117
3D scenes 114
combining objects 134
3D settings for 3D shapes
3D color 134
depth 133
direction 133
illumination 134
surface 134
3D shapes
extrusion 114
rotating 117
A
add points 51
aging filter 100
aligning objects 85
Alpha channel 102
ambient lighting 128
anchor point 188
anchoring text 184
AND gate 172
arcs 188
Area dialog 65, 96
area fill, editing 63
arranging objects 41
arrow styles, customizing 60, 61
arrows 59
axis intersection point 116
B
back, send object to 158
background pages 151
Basic Shapes toolbar 114
Bézier curves 49, 188
linking 197
point mode 197
transition points 198
bitmap fill 68
Index
bitmaps 64, 89, 94, 109, 128
black and white printing 109
booklet printing 20
borders, editing 57
breaking links 90
brightness 96
bring forward 41
bring to front 83
brochure printing 20
C
CAD (computer-aided design) 172
callouts 188
camera field 125
caption type 191
central projection 118
charcoal sketch 100
close Bézier 53
CMYK color model 154
color adjustments 96
Color bar 13
color depth 103
color fill 63
color inversion 98
color negative 98
color options 95
color palette 13, 153
color parameters 132
color picker dialog 155
colors, number of 106
combining objects 80
combining objects in 3D scenes 134
comments, adding 201
connectors
adding text 168
adjusting text 169
definition 164
drawing 165
Connectors toolbar 164
context menu 56
contoured image 105
contrast 96
controls layer 41
convert
to bitmap 109
to contoured image 105
to polygon 105
convert polygon to curve 200
convert straight line to Bézier curve 199
convert to polygon 200
corner points 198
cropping 97
cross-fading 158
curve toolbar 196
curved connectors 165
203
curved text 170
curves 49
closing 199
combining closed curves 201
connecting 201
converting to 199
customizing toolbars 17
D
delete points 52
delete unused backgrounds 153
Dimension Line style 180
dimension lines
editing 182
placing 182
dimensioning 180, 181
display grid 141
distance camera parameter 125
distorting an image 74
distributing space between objects 86
dithering 104
double-sided illumination 123
Double-Sided tool 121
dragging and dropping 91
drawing
arcs 31
arrows 27
banners 35
block arrows 34
callouts 35
circles 29
connectors 32
curves 31
ellipses 29
flowcharts 35
miscellaneous shapes 34
polygons 31
rectangles 28
squares 28
stars 35
straight lines 26
symbols 34
drawing to scale 146
Drawing toolbar 12
duplicate 157, 160
dynamic gradients 76
dynamic size modification 43
E
e-mailing documents 23
Edit Points toolbar 50
editing objects in a group 80
effects 54, 72, 157
effects menu 113
embedding graphics 90
exchange background page 153
exporting
204
as a raster graphic 93
as a vector graphic 93
as PDF 22
directly as PDF 22
graphics 92
to other formats 22
extrusion 112
eyedropper 101
F
fields 152
file formats 92
fill color, creating 65
fill holes 106
fill properties 63
fill, editing 63
filter toolbar 98
fit width and height 139
flat normal effect 122
flat shading 124
flip an object 73
floating toolbar 16
flowchart (flow diagram) 162, 164
focal length 125
Fontwork dialog 169
Fontwork Gallery 115, 191
freehand line 200
front, bring object to 158
G
Gallery 175
Gamma value 96
geometry - 3D effects 119
Glue Point Relative button 167
glue points 32
editing 166
Glue Points toolbar 175
inserting 166
setting 174
Gouraud shading 124
gradient fill 64
gradients 76
fill 66
transparency 76
graphic filter toolbar 98
graphics mode 95
grayscale 104
grayscale printing 109
grid 15
grid points 140, 141
grid settings 141, 148
grouping objects 79
guide distance 180
guide lines 15, 145
guide overhang 180
OpenOffice.org 3.3 Draw Guide
H
O
half adder 176
handles 39
hatching 64
hidden objects 40
horizontal distribution of objects 87
HSB color model 155
hyphenation 186, 188
object specific effect 122
objects
adjusting size 41
arranging 41
dynamic movement 42
dynamic size modification 43
editing points 48
framing 40
hidden 40
moving 41
re-sizing 42, 46
rotating 44, 47
selecting 40
slanting 45
OLE objects
editing mode 193
inserting 193
object mode 194
Options toolbar 14, 39
organization charts 160, 164
I
illumination color 132
illumination of 3D objects 126
image 64
import filters 89
importing
Draw objects 91
Impress objects 91
scanned images 90
Insert Layer dialog 147
intersecting objects 82
invert colors 98
invert normals 123
L
layer, changing object's 150
layers 146, 152
light source 127
Line and Filling toolbar 12, 56
line connectors 165
Line dialog 96
line distance 180
line pattern 64, 67
line properties 58
line styles, customizing 60
lines, connecting and breaking 202
lines, editing 57
linking 90
Load Slide Design dialog 153
logic circuit diagram 172
M
Master view 152
measure below object 180
merging objects 82
metafile 91, 94, 107
mindmaps 164
mirror copies 73
modifying raster object properties 95
mosaic 101
move points 51
move to front or back 83
multiple pages 150
N
Navigator 92
nesting groups 80
normals 122
Index
P
page backgrounds 151
page margins 9
Pages area 151, 152
pasting from the clipboard 91
path 197
PDF
export documents to 22
Phong shading 124
Picture (editing) toolbar 95
pictures and text 190
point reduction 106
point types, changing 198
polygon 105
polylines 188, 202
pop-art filter 100
Position and Size dialog 172
positioning objects 83
posterize filter 100
Print dialog 18
print file directly 17
Print options with raster graphics 109
printing
black and white on color printer 21
booklet 20
brochure 20
general options 18
grayscale on color printer 21
multiple pages per sheet 19
page orientation 18
selecting what to print 19
projection 130
R
raster graphics 89, 90, 128
205
reducing color depth 103
relief filter 101
remove noise 99
removing links to files 90
renaming objects 95
RGB colors 96, 154
rotating 3D objects 116
rotating an object 44, 72
rotation angle of 3D bodies 121
rotation mode 54
rounding of 3D object 119
rulers 9
S
scale drawings 172
scaled depth of 3D object 120
segments of 3D bodies 121
selecting objects 40
selection mode 39, 40
send backward 41
send document as e-mail 23
send to back 84
set in circle (perspective) 74
set to circle (slant) 75
shading of 3D objects 123
shadow effect 96
shadows 65, 69
shadows of 3D objects 125
sharpen image 99
slanting text 169
Slide Design dialog 152
slides 150
smooth image 98
smooth transition 50, 198
snap functions 15, 140
snap lines
definition 143
editing 144
inserting using coordinates 144
inserting with mouse 143
snap points 143
snap range 142
snap to grid 141
snap to object frame 145
snap to object points 145
snap to page edge 144
solarization filter 99
spacing settings 187
spacing to borders 168
special effects 72
specular color 132
spherical normal effect 123
split curve 52
standard connectors 165
Standard toolbar 12
Status bar 10
206
straight connectors 165
styles 71
subtracting objects 82
symbol library 176
symmetric transition 50, 198
T
tangents 50
templates 153
text anchors 168, 184
text animation 183
text frames 186
text in drawings
addition to draw objects 37
dynamic frames 35
fixed frames 36
text styles 183
textures of 3D objects 128
threshold, apply 104
tile size 106
tolerance parameter 103
toolbars 11
basic shapes 34
block arrows 34
callouts 35
circles and ovals 30
connectors 32
curves 31
drawing 25
Edit Points 49, 50
flowcharts 35
lines and arrows 27
stars and banners 35
symbol shapes 34
text formatting 36
transition points 198
transparency 70, 95, 96, 102, 137
U
ungrouping 79
V
vectorize 105, 108
vertical distribution of objects 87
vertical text 188
W
wiring diagram 172
workplace 8
Writer OLE object 193
Z
zoom 11
Zoom toolbar 140, 175
zoom value 139
OpenOffice.org 3.3 Draw Guide