1
ACC X.25 Data Analyzer User’s Guide
Edition 1
HP 9000 Networking
Manufacturing Part Number : Z7345-90004
E0204
© Copyright 2004 Hewlett-Packard Company.
2
Legal Notices
The information in this document is subject to change without notice.
Hewlett-Packard makes no warranty of any kind with regard to this
manual, including, but not limited to, the implied warranties of
merchantability and fitness for a particular purpose. Hewlett-Packard
shall not be held liable for errors contained herein or direct, indirect,
special, incidental or consequential damages in connection with the
furnishing, performance, or use of this material.
Warranty. A copy of the specific warranty terms applicable to your
Hewlett- Packard product and replacement parts can be obtained from
your local Sales and Service Office.
Restricted Rights Legend. Use, duplication or disclosure by the U.S.
Government is subject to restrictions as set forth in subparagraph (c) (1)
(ii) of the Rights in Technical Data and Computer Software clause at
DFARS 252.227-7013 for DOD agencies, and subparagraphs (c) (1) and
(c) (2) of the Commercial Computer Software Restricted Rights clause at
FAR 52.227-19 for other agencies.
HEWLETT-PACKARD COMPANY 3000 Hanover Street Palo Alto,
California 94304 U.S.A.
Use of this manual and flexible disk(s) or tape cartridge(s) supplied for
this pack is restricted to this product only. Additional copies of the
programs may be made for security and back-up purposes only. Resale of
the programs in their present form or with alterations, is expressly
prohibited.
Copyright Notices. ©copyright 1983-2000 Hewlett-Packard Company,
all rights reserved.
Reproduction, adaptation, or translation of this document without prior
written permission is prohibited, except as allowed under the copyright
laws.
©copyright 1979, 1980, 1983, 1985-93 Regents of the University of
California
3
This software is based in part on the Fourth Berkeley Software
Distribution under license from the Regents of the University of
California.
©copyright 1980, 1984, 1986 Novell, Inc.
©copyright 1986-1992 Sun Microsystems, Inc.
©copyright 1985-86, 1988 Massachusetts Institute of Technology.
©copyright 1989-93 The Open Software Foundation, Inc.
©copyright 1986 Digital Equipment Corporation.
©copyright 1990 Motorola, Inc.
©copyright 1990, 1991, 1992 Cornell University
©copyright 1989-1991 The University of Maryland
©copyright 1988 Carnegie Mellon University
©copyright 1989-1997 Data Connection Limited
Trademark Notices UNIX is a registered trademark in the United
States and other countries, licensed exclusively through X/Open
Company Limited.
X Window System is a trademark of the Massachusetts Institute of
Technology.
MS-DOS and Microsoft are U.S. registered trademarks of Microsoft
Corporation.
OSF/Motif is a trademark of the Open Software Foundation, Inc. in the
U.S. and other countries.
4
Publishing History
The manual publishing date and part number indicate its current
edition. The publishing date will change when a new edition is
published. Minor changes may be made without changing the publishing
date. The manual part number will change when extensive changes are
made.
Manual updates may be issued between editions to correct errors or
document product changes. To ensure that you receive the updated or
new editions, you should subscribe to the appropriate product support
service. See your HP sales representative for details.
First Edition
February 2004
Release 1.0
5
6
Preface
This manual describes the Data Analyzer accessory product for the ACC
family of multiplexers.
Manual Organization
This manual contains the following chapters and appendices:
Chapter 1
Chapter 1, “Overview,” provides an overview of the
data analyzer, a description of data analyzer features,
and data analyzer requirements.
Chapter 2
Chapter 2, “Installing the Data Analyzer,” describes
how to install analyzer Y-cables, install the analyzer
software, and configure the analyzer.
Chapter 3
Chapter 3, “Data Analyzer Commands,” describes each
of the data analyzer program commands. Each
command is described in detail and followed by
example of use of the command.
Appendix A
Appendix A, “Network Configuration,” provides
detailed information on setting up the network
configuration file.
Appendix B
Appendix B, “Typical X.25 and Data Analyzer
Sessions,” provides the results of actual data analyzer
sessions that were run using this software.
7
Related Documentation
The documentation available for the Multiprotocol ACC family of
products includes the following hardware and software manuals:
Hardware Manuals
•
8 Channel PCI ACC Multiplexer Hardware Installation and
Reference Manual
Software Manuals
•
•
•
•
•
•
•
•
•
•
•
•
•
8
ACC Installation and Configuration Guide
ACC Utilities Reference Guide
ACC Programmer’s Reference Guide
ACC Error Guide
HDLC Frame Protocol User’s Guide
ACC X.25 Protocol User’s Guide
ACC X.25 Data Analyzer User’s Guide
ACC HDLC/LAP-B (ABM) Protocol User’s Guide
HDLC-NRM (SDLC) Protocol User’s Guide
X.25/ACC Installation and Configuration Guide
X.25/ACC Update Guide
X.25/9000 User’s Guide
X.25/9000 Programmer’s Guide
Contents
1. Overview
Data Analyzer Overview . . . . . . . . . . . . . . . . . . . . . . . . . . . . . . . . . . . . . . . . . . . . . . . . . 12
Data Analyzer Features. . . . . . . . . . . . . . . . . . . . . . . . . . . . . . . . . . . . . . . . . . . . . . . . . . 15
Data Analyzer Requirements . . . . . . . . . . . . . . . . . . . . . . . . . . . . . . . . . . . . . . . . . . . . . 16
2. Installing the Data Analyzer
Installing the Analyzer Software . . . . . . . . . . . . . . . . . . . . . . . . . . . . . . . . . . . . . . . . . .
Software Removal . . . . . . . . . . . . . . . . . . . . . . . . . . . . . . . . . . . . . . . . . . . . . . . . . . . . .
Software Installation . . . . . . . . . . . . . . . . . . . . . . . . . . . . . . . . . . . . . . . . . . . . . . . . . .
Verifying Installation . . . . . . . . . . . . . . . . . . . . . . . . . . . . . . . . . . . . . . . . . . . . . . . . . .
Configuring the Analyzer . . . . . . . . . . . . . . . . . . . . . . . . . . . . . . . . . . . . . . . . . . . . . . . .
Dynamic Set-Up of Analyzer Configuration . . . . . . . . . . . . . . . . . . . . . . . . . . . . . . . .
18
18
19
20
23
23
3. Data Analyzer Commands
Detailed Command Descriptions. . . . . . . . . . . . . . . . . . . . . . . . . . . . . . . . . . . . . . . . . . .
display. . . . . . . . . . . . . . . . . . . . . . . . . . . . . . . . . . . . . . . . . . . . . . . . . . . . . . . . . . . . . . . .
Format . . . . . . . . . . . . . . . . . . . . . . . . . . . . . . . . . . . . . . . . . . . . . . . . . . . . . . . . . . . . . .
Description . . . . . . . . . . . . . . . . . . . . . . . . . . . . . . . . . . . . . . . . . . . . . . . . . . . . . . . . . .
Example. . . . . . . . . . . . . . . . . . . . . . . . . . . . . . . . . . . . . . . . . . . . . . . . . . . . . . . . . . . . .
exit . . . . . . . . . . . . . . . . . . . . . . . . . . . . . . . . . . . . . . . . . . . . . . . . . . . . . . . . . . . . . . . . . .
Format . . . . . . . . . . . . . . . . . . . . . . . . . . . . . . . . . . . . . . . . . . . . . . . . . . . . . . . . . . . . . .
Example. . . . . . . . . . . . . . . . . . . . . . . . . . . . . . . . . . . . . . . . . . . . . . . . . . . . . . . . . . . . .
help . . . . . . . . . . . . . . . . . . . . . . . . . . . . . . . . . . . . . . . . . . . . . . . . . . . . . . . . . . . . . . . . . .
Format . . . . . . . . . . . . . . . . . . . . . . . . . . . . . . . . . . . . . . . . . . . . . . . . . . . . . . . . . . . . . .
Examples . . . . . . . . . . . . . . . . . . . . . . . . . . . . . . . . . . . . . . . . . . . . . . . . . . . . . . . . . . . .
options. . . . . . . . . . . . . . . . . . . . . . . . . . . . . . . . . . . . . . . . . . . . . . . . . . . . . . . . . . . . . . . .
Format . . . . . . . . . . . . . . . . . . . . . . . . . . . . . . . . . . . . . . . . . . . . . . . . . . . . . . . . . . . . . .
Description . . . . . . . . . . . . . . . . . . . . . . . . . . . . . . . . . . . . . . . . . . . . . . . . . . . . . . . . . .
Example. . . . . . . . . . . . . . . . . . . . . . . . . . . . . . . . . . . . . . . . . . . . . . . . . . . . . . . . . . . . .
protocol . . . . . . . . . . . . . . . . . . . . . . . . . . . . . . . . . . . . . . . . . . . . . . . . . . . . . . . . . . . . . . .
Format . . . . . . . . . . . . . . . . . . . . . . . . . . . . . . . . . . . . . . . . . . . . . . . . . . . . . . . . . . . . . .
Description . . . . . . . . . . . . . . . . . . . . . . . . . . . . . . . . . . . . . . . . . . . . . . . . . . . . . . . . . .
run. . . . . . . . . . . . . . . . . . . . . . . . . . . . . . . . . . . . . . . . . . . . . . . . . . . . . . . . . . . . . . . . . . .
Format . . . . . . . . . . . . . . . . . . . . . . . . . . . . . . . . . . . . . . . . . . . . . . . . . . . . . . . . . . . . . .
Description . . . . . . . . . . . . . . . . . . . . . . . . . . . . . . . . . . . . . . . . . . . . . . . . . . . . . . . . . .
26
27
27
27
28
30
30
30
31
31
31
32
32
32
33
34
34
34
35
35
35
9
Contents
Examples . . . . . . . . . . . . . . . . . . . . . . . . . . . . . . . . . . . . . . . . . . . . . . . . . . . . . . . . . .
runc . . . . . . . . . . . . . . . . . . . . . . . . . . . . . . . . . . . . . . . . . . . . . . . . . . . . . . . . . . . . . . . . . .
Format . . . . . . . . . . . . . . . . . . . . . . . . . . . . . . . . . . . . . . . . . . . . . . . . . . . . . . . . . . . . . .
Description . . . . . . . . . . . . . . . . . . . . . . . . . . . . . . . . . . . . . . . . . . . . . . . . . . . . . . . . . .
show . . . . . . . . . . . . . . . . . . . . . . . . . . . . . . . . . . . . . . . . . . . . . . . . . . . . . . . . . . . . . . . . .
Format . . . . . . . . . . . . . . . . . . . . . . . . . . . . . . . . . . . . . . . . . . . . . . . . . . . . . . . . . . . . . .
Description . . . . . . . . . . . . . . . . . . . . . . . . . . . . . . . . . . . . . . . . . . . . . . . . . . . . . . . . . .
shutdown . . . . . . . . . . . . . . . . . . . . . . . . . . . . . . . . . . . . . . . . . . . . . . . . . . . . . . . . . . . . .
Format . . . . . . . . . . . . . . . . . . . . . . . . . . . . . . . . . . . . . . . . . . . . . . . . . . . . . . . . . . . . . .
Description . . . . . . . . . . . . . . . . . . . . . . . . . . . . . . . . . . . . . . . . . . . . . . . . . . . . . . . . . .
stop . . . . . . . . . . . . . . . . . . . . . . . . . . . . . . . . . . . . . . . . . . . . . . . . . . . . . . . . . . . . . . . . . .
Format . . . . . . . . . . . . . . . . . . . . . . . . . . . . . . . . . . . . . . . . . . . . . . . . . . . . . . . . . . . . . .
Description . . . . . . . . . . . . . . . . . . . . . . . . . . . . . . . . . . . . . . . . . . . . . . . . . . . . . . . . . .
stopd . . . . . . . . . . . . . . . . . . . . . . . . . . . . . . . . . . . . . . . . . . . . . . . . . . . . . . . . . . . . . . . . .
Format . . . . . . . . . . . . . . . . . . . . . . . . . . . . . . . . . . . . . . . . . . . . . . . . . . . . . . . . . . . . . .
Description . . . . . . . . . . . . . . . . . . . . . . . . . . . . . . . . . . . . . . . . . . . . . . . . . . . . . . . . . .
36
37
37
37
38
38
38
40
40
40
41
41
41
42
42
42
A. Network Configuration
Setting Up the Network Configuration File . . . . . . . . . . . . . . . . . . . . . . . . . . . . . . . . .
Mux Firmware Download File . . . . . . . . . . . . . . . . . . . . . . . . . . . . . . . . . . . . . . . . . . .
Port Definitions . . . . . . . . . . . . . . . . . . . . . . . . . . . . . . . . . . . . . . . . . . . . . . . . . . . . . . .
ZLU Definitions . . . . . . . . . . . . . . . . . . . . . . . . . . . . . . . . . . . . . . . . . . . . . . . . . . . . . .
Running TTGEN and Starting the ACC Mux . . . . . . . . . . . . . . . . . . . . . . . . . . . . . . .
Starting ACC Subsystem and Analyzer . . . . . . . . . . . . . . . . . . . . . . . . . . . . . . . . . . .
Running PDISPLAY . . . . . . . . . . . . . . . . . . . . . . . . . . . . . . . . . . . . . . . . . . . . . . . . . . .
Sample Network Configuration File . . . . . . . . . . . . . . . . . . . . . . . . . . . . . . . . . . . . . . . .
44
44
45
45
46
47
48
50
B. Typical X.25 and Data Analyzer Sessions
Introduction . . . . . . . . . . . . . . . . . . . . . . . . . . . . . . . . . . . . . . . . . . . . . . . . . . . . . . . . . . . 54
General Procedures. . . . . . . . . . . . . . . . . . . . . . . . . . . . . . . . . . . . . . . . . . . . . . . . . . . . 54
10
1
Overview
This chapter provides an overview of the data analyzer, a description of
data analyzer features, and data analyzer requirements.
Chapter 1
11
Overview
Data Analyzer Overview
Data Analyzer Overview
The data analyzer is supplied with the ACC Base System product. It is a
software based tool that allows real-time capture and analysis of X.25
traffic on one or more X.25 links simultaneously. It runs within an
HP-UX based HP 9000 system. Although the data analyzer is designed to
monitor X.25 or ISDN traffic from the ACC products, it can be attached
to any RS-232 or V.35 X.25 connections with line speeds up to 1222 Kb/s.
Each X.25 connection to be monitored on an 8-Channel card requires two
ACC multiplexer ports, thus a single 8-channel ACC multiplexer card
can support up to four analyzer sessions. Two ports are required on the
8-channel PCI card only if a non-ACC X.25 link is being monitored. The
analyzer can provide up to 8 concurrent sessions by using the ports on
two or more 8-Channel ACC cards. For ISDN traffic analysis, each
connection requires only one sub-channel.
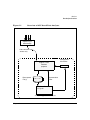
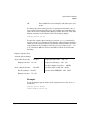
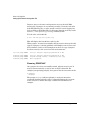
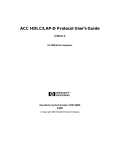
The Data Analyzer is composed of three major components:
•
HDLC frame receiver multiplexer firmware
•
HP-UX capture/filter daemon
•
Display and analysis program
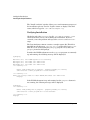
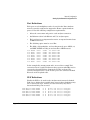
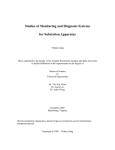
Figure 1-1 on page 13 shows the relationships between these
components, as well as the unique 'software-only' input configuration
with respect to the 8-Channel PCI ACC products. Configuration
information is set up either in the ACC TTGEN configuration file, or
dynamically by means of the convenient runc command.
12
Chapter 1
Overview
Data Analyzer Overview
Figure 1-1
Overview of ACC based Data Analyzer
8 port PCI &
mux card(s)
Uses software
access only
Configuration
information
Capture / Filter
Daemon
runc
pcapture
Data capture
File(s)
Commands to
Filter
Display / Control
Program
Analyzer Application Software
Chapter 1
13
Overview
Data Analyzer Overview
Only one copy of the capture daemon runs in each HP 9000 system. It
handles all analyzer sessions. The control of these sessions comes from
one or more invocations of the Display program. The pdisplay program
is designed to work on any HP-UX TTY device. Several copies of the
pdisplay program can independently control several analyzer sessions
simultaneously, or one pdisplay program may control multiple sessions.
The pcapture program can monitor all traffic on a particular X.25 link,
or it can selectively monitor only traffic belonging to certain Virtual
Circuits (VCs) on a link. The VCs of interest are identified by their
Logical Channel Number (LCN); up to six filter LCNs may be specified
for each X.25 analyzer session. By using this filter option, the size of the
capture file can be minimized.
The pdisplay program also provides a filtering mechanism to select
events from the capture file by LCN. Both these filtering mechanisms are
independent. The pdisplay program also provides many options for
displaying the captured X.25 or ISDN traffic (see “display” on page 27 for
a detailed description of the display command).
14
Chapter 1
Overview
Data Analyzer Features
Data Analyzer Features
The following list summarizes the features offered by the ACC X.25 data
analyzer.
•
Simultaneous monitoring of up to 8 X.25 lines - up to 32 may be
configured
•
Line speeds of up to 2Mb/s supported on 8-channel PCI mux cards
•
V.35 and RS 232 support
•
Capture file size up to 2Gb (depends on the size of HP-UX disk
subsystem)
•
Pre-processing filtering by LCN available (up to 6 LCNs)
•
Real-time display of X.25 or ISDN events
•
Post-processing filtering by LCN number (up to 6 LCNs)
•
Review of capture files by event number or range
•
X.25 L2 LAP-B header decoding
•
X.25 Packet header decoding
•
X.25 facilities decoding
•
Raw data display in Hex, ASCII, and EBCDIC
•
Event number and time-stamp display
See Chapter 3, “Data Analyzer Commands,” on page 25 for detailed
descriptions of how to use the data analyzer commands.
Chapter 1
15
Overview
Data Analyzer Requirements
Data Analyzer Requirements
The data analyzer requires that the ACC Base System product has been
installed, including at least one ACC Interface card and (if the hardware
is 8-Channel) a selected multiplexer panel.
16
Chapter 1
2
Chapter 2
Installing the Data Analyzer
17
Installing the Data Analyzer
Installing the Analyzer Software
Installing the Analyzer Software
The data analyzer software is provided with the ACC Base Product,
which comes in SD-UX format.
Installation requires the following general steps:
1. Remove any previous version of the data analyzer software with
swremove.
2. Use swinstall to install the ACC base product (or just the data
analyzer software if ACC base software is already installed).
3. Check /var/adm/sw/swagent.log for any errors during install.
4. Configure the analyzer.
Software Removal
If a previous version of the ACC X.25 Protocol Analyzer product is
already on the target system, remove it before the new software is
installed.
CAUTION
It is very important to follow the instructions, provided with the ACC
software that is currently installed in the system, to shut down and
remove that software. This procedure may change between major
releases of the ACC product.
Step 1. Log in to the system as superuser.
Step 2. Terminate the ACC Mux Subsystem by typing:
% zmasterd kill
Step 3. Run swremove to remove the ACC X.25 Protocol Analyzer product.
% swremove
18
Chapter 2
Installing the Data Analyzer
Installing the Analyzer Software
NOTE
swremove will fail if any ACC daemon is still active. Terminate any
active ACC daemon indicated in the log file and try again.
Any or all of the ACC related products besides Data Analyzer can be
removed by selecting them and then marking them for removal. (Both
the terminal interface and the GUI interface for swremove behave the
same; only the means for selecting items differs.)
Step 4. Select the items to be removed in the “Software Selection Window” and
mark for removal, using the “Mark for Remove” function under the
“Actions” menu.
When all items are marked, select the “Remove(analysis)” action.
Open “Logfile” to view running status of the removal process, and follow
any screen prompts until the removal process is done.
Software Installation
The ACC Data Analyzer software is read from the HP-UX Application
CD-ROM, in superuser mode, using the swinstall utility. The steps are
shown below.
Step 1. Log in to the system as “root.”
Step 2. Place the media in a local or remote CD-ROM drive.
Step 3. Run swinstall, which behaves the same in the GUI interface as for the
terminal interface. When the “Specify Source” box opens, select “Source
Depot Type” to “Local CDROM,” or for a remote CD-ROM driver, select
for “Network Directory/CDROM” and set “Source Host Name...”. Select
“OK.”
Step 4. Select the ACC Base Product (or the bundle that contains this). If the
ACC Base Product is already installed, you may just select the Analyzer
fileset from the ACC Base Product (hit the [Return] key to step into the
product). Open the “Actions” menu and select “Mark for Install.”
Step 5. When this item has been marked, select “Install (analysis);” select “OK”
and proceed.
Chapter 2
19
Installing the Data Analyzer
Installing the Analyzer Software
The “Install (analysis)” window allows you to track summary progress of
the installation process. Use the “Logfile” feature to display a detailed
status, which is logged to /var/adm/sw/swagent.log.
Verifying Installation
Check the end of the swinstall log file /var/adm/sw/swagent.log to
ensure that there were no errors during the installation. If errors
occurred, correct the problem and repeat the swremove and swinstall
steps.
The Data Analyzer software contains a sample capture file. This file is
installed into the directory /var/opt/acc/log and is called sample.eve.
This file can be viewed using the pdisplay program. To try this, run
pdisplay from the shell prompt.
If neither the ZCOM subsystem nor the pcapture program are currently
up and running, the following message will be displayed:
$ pdisplay
Bad zinit call, error:ZCOM
Bad zopen call, error:Must
Bad zopen call, error:Must
Bad zname call, error:Must
***** Warning *****
system is not started up
call ZINIT first
call ZINIT first
call ZINIT first
Cannot find primary ZLU of pcapture - pcapture probably not running
Some functions of this program will not be available
***** Warning *****
Cannot get storage offset for label ANLYZR,Error:Must call ZINIT first
Display>
If the ZCOM subsystem is up and running but the pcapture daemon is
not running, the following message will be displayed:
$ pdisplay
***** Warning *****
Cannot find primary ZLU of pcapture - pcapture probably not running
Some functions of this program will not be available
***** Warning *****
Display>
20
Chapter 2
Installing the Data Analyzer
Installing the Analyzer Software
However, the prompt Display> indicates that pdisplay is ready for
interactive commands, and you can still use it for this installation
verification procedure.
Use help or ?? to display the possible commands.
The next command (see below) will display the first four events in the
sample capture file. Here the option “-e 1 4” selects the first four events.
(Refer to the display and options commands in Chapter 3, “Data
Analyzer Commands,” on page 25) After this command has been
successfully performed, proceed to the section on “Configuring the
Analyzer” on page 23.
Display> display /var/opt/acc/log/sample.eve -e 1 4
The following four events will be displayed:
event
0001 Chan:00 00:00:00.000
lead status:
RS DTR
CS DSR CD
event
0002 Chan:00 00:00:00.788
LAPB:INFO
C Addr01 Nr4 Ns7
X.25:CALL REQUEST
mod8
LCI 20
Called addr 46500561
Calling addr 46500561
event
0003 Chan:00 00:00:00.917
LAPB:INFO
C Addr03 Nr0 Ns4
X.25:INCOMING CALL
mod8
LCI 1
Called addr 46500561
Calling addr 46500561
event
0004 Chan:00
00:00:00.927
LAPB:INFO
C Addr01 Nr5 Ns0
X.25:CALL ACCEPTED
mod8
LCI 1
Called addr Addr length = 0
Calling addr Addr length = 0
Total events =251, events displayed =4
Display>
Chapter 2
21
Installing the Data Analyzer
Installing the Analyzer Software
When complete, the Display> prompt reappears. More commands can be
entered now, or the program may be terminated by entering exit at the
prompt. The program will exit and the shell prompt displayed:
Display> exit
Exit Program
$
22
Chapter 2
Installing the Data Analyzer
Configuring the Analyzer
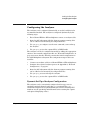
Configuring the Analyzer
The analyzer can be configured dynamically, as needed, and this is the
recommended method. The analyzer is configured dynamically by the
following steps:
•
For 8-Channel EISA or NIO multiplexers connect an analyzer cable.
•
Start the ACC subsystem with the daemon pcapture running (this
can be added to the zmasterd_list configuration file).
•
Use pdisplay to configure (use the runc command), start and stop
the analyzer.
•
Use pdisplay to view the captured X.25 or ISDN traffic.
The analyzer can also be configured manually by adding the appropriate
entries to the network configuration file (see “Network Configuration” on
page 43 for more details). This file contains the initial configuration for
the ACC Multiplexer subsystem. The configuration steps in this case
would be:
•
Connect an analyzer cable for 8-Channel EISA or NIO multiplexers.
•
Configure the required analyzer ports as in Appendix A, “Network
Configuration,” on page 43.
•
Start the ACC subsystem with the daemon pcapture running (this
can be added to the zmasterd_list configuration file).
•
Use pdisplay to start and stop the analyzer.
•
Use pdisplay to view the captured X.25 or ISDN traffic.
Dynamic Set-Up of Analyzer Configuration
The analyzer can be conveniently configured and set up to run on
specified ports/sub-channels using the runc command. The runc
command configures the required ZCOM table entries (including ZLU
numbers) for the specified port/subchannel before starting the capture
and optional displaying of data.
Chapter 2
23
Installing the Data Analyzer
Configuring the Analyzer
For example, you can set-up and run the analyzer on the first two ports
of the first 8-Channel multiplexer card in the ACC subsystem by
entering the runc command as follows:
Display> runc 0 0
All of the options that are applicable to the run command also apply to
the runc command. See the entry for the runc command on page 37.
NOTE
24
For the 4-port cards and Z7340A 8-port PCI card, all channels can be
monitored. For 8-port EISA and HP-PB cards, the ports used for data
capture may NOT be used for active X.25 connections.
Chapter 2
3
Data Analyzer Commands
This chapter describes each of the pdisplay program commands. Each
command is described in detail and followed by example of use of the
command.
Chapter 3
25
Data Analyzer Commands
Detailed Command Descriptions
Detailed Command Descriptions
The following sections describes each of the pdisplay program
commands. Each command is described in detail and followed by
example of use of the command. The following list shows all of the
commands available.
26
display
Display capture (.eve) file data
exit, /e
Exit this program
help, ?, ??
Display help information on available commands
options
Set or show display options
protocol
Select L2 or L3 protocol
run
Run the analyzer on ZLU
runc
Create and run ZLU for analyzer
show
Display the analyzer ZLUs
shutdown
Shutdown pcapture program
stop
Halt the analyzer on ZLU
stopd
Halt analyzer and delete the ZLU
Chapter 3
Data Analyzer Commands
display
display
The display command displays the contents of the capture file (.eve) to
the screen or to standard out.
Format
display filename [-f] [-o opts] [-e e1 [e2]] [-l lcn#1 ...]
Description
The display command options have the following meanings:
Chapter 3
-f
Follow the end of the file (i.e. wait and display data as
it arrives).
-o
Set the display options (see the options command for
details of option setting). Note the option settings
modified in this command change the default options
for the next display command.
-e
Specify event numbers to display. If <e1> is specified
alone, then only <e1> will be displayed. If <e1> and
<e2> are specified, then events in the range <e1> to
<e2> are displayed.
-l
Display only the events for the LCN numbers specified.
Up to 6 LCN numbers may be specified. Note the LCN
masking done here is post processing from the file, and
is different from the pre-processing done by the run
command.
-p
Specify level 2 or level 3 protocol for analysis and trace
display. See the protocol command for specific details
on format for option -p.
27
Data Analyzer Commands
display
Example
The following example demonstrates usage for this command.
NOTE
See “Typical X.25 and Data Analyzer Sessions” on page 53 for examples
of both X.25 and ISDN analyzer sessions.
Display> display x25bc.eve -e 1 3
event
0001 Chan:00
00:00:00.000
lead status:
RS DTR
CS DSR CD
event
0002 Chan:00
00:00:00.788
LAPB:INFO
C Addr01 Nr4 Ns7
X.25:CALL REQUEST
mod8
LCI 20
Called addr 46500561
Calling addr 46500561
event
0003 Chan:00
00:00:00.917
LAPB:INFO
C Addr03 Nr0 Ns4
X.25:INCOMING CALL
mod8
LCI 1
Called addr 46500561
Calling addr 46500561
Total events =251, events displayed =3
Display> display x25bc.eve -e 1 3 -o X
event
0001 Chan:00
00:00:00.000
lead status:
RS DTR
CS DSR CD
event
0002 Chan:00
00:00:00.788
LAPB:INFO
C Addr01 Nr4 Ns7
X.25:CALL REQUEST
mod8
LCI 20
Called addr 46500561
Calling addr 46500561
Facilities Field
Flow control packet size negot
Called DTE pack size =
256
Calling DTE pack size =
256
Flow control window size negot
Called DTE wind size =
7
Calling DTE wind size =
7
Throughput class negotiation
Called DTE = 48000
Calling DTE = 48000
event 0003 Chan:00
00:00:00.917
LAPB:INFO
C Addr03 Nr0 Ns4
28
Chapter 3
Data Analyzer Commands
display
X.25:INCOMING CALL
mod8
LCI 1
Called addr 46500561
Calling addr 46500561
Facilities Field
Throughput class negotiation
Called DTE =
1200
Calling DTE = 1200
Flow control packet size negot
Called DTE pack size =
256
Calling DTE pack size =
256
Flow control window size negot
Called DTE wind size =
2
Calling DTE wind size =
2
Total events =251, events displayed =3
Chapter 3
29
Data Analyzer Commands
exit
exit
The exit command is used to exit from pdisplay. Note that when
pdisplay is exited, any analyzer sessions that have been previously
started will continue to run even after pdisplay has stopped. To stop the
analyzer sessions use the stop command.
Format
exit
or
ex
or
/e
Example
Display> ex
Exit program
30
Chapter 3
Data Analyzer Commands
help
help
help displays help information on available commands, and details on
each of the commands.
Format
?? [command]
or:
? [command]
or:
help [command]
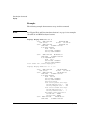
Examples
Display> ??
Help table
Command
?, ??
help
show
shutdown
run
stop
runc
stopd
display
options
protocol
exit
/e
- Description ...........
- Help, or help on command
- Display this list
- Display the analyzer ZLUs
- Shutdown pcapture daemon
- Run the analyzer on a given pair of ZLUs
- Stop the analyzer on a given pair of ZLUs
- Create analyzer ZLUs and run the analyzer
- Stop the analyzer and delete the ZLUs
- Display data from a .eve file
- Set or show display options
- Display/select L2 L3 protocol
- Exit this program
- Exit this program
For more information about a command type “? XX” where XX is the
command
For example, to get more help on the stop command use:
Display> ?? stop
Format stop ZLU
This command stops the analyzer running on the ZLU specified and
its partner ZLU. It will shutdown the two ZLUs and close the
capture file.
Chapter 3
31
Data Analyzer Commands
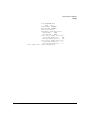
options
options
The options command shows or sets the display options.
Format
options [set <string>]
or:
options [show]
or:
options [default]
Description
The options command sets the display options for subsequent display or
run commands. Once set, the options remain in effect until altered, or
until pdisplay is restarted. The following options are available:
32
a
Display raw data in ASCII8.
b
Display raw data in EBCDIC.
c
Display raw data in compressed ASCII (Non-display
as __).
h
Display raw data in HEX.
s/S
Display raw data as single line (s) or all (S).
e/E
Turn off/ON Event number and timestamp display.
l/L
Turn off/ON Lead change display.
r/R
Reverse the sense of DTE/DCE.
u/U
Turn off/ON Level 2 header decode.
v/V
Turn off/ON Level 2 raw display (s/S option gives raw
mode).
w/W
Turn off/ON Level 3 header decode.
x/X
Turn off/ON Level 3 facilities decode.
y/Y
Turn off/ON Level 3 raw display (s/S option gives raw
mode).
Chapter 3
Data Analyzer Commands
options
z/Z
Turn off/ON Level 4 raw display (s/S option gives raw
mode).
To change the option setting use the set parameter followed by one or
more of the letters in the table above; for example, the command below
turns off the event and timestamp display, enables the Level 4 raw data
display, and turns on the Modem control lead change display.
Display> options set eZL
To show the current option setting, use just the options command by
itself or use the show parameter. Note that the options display includes a
summary of the letters required to modify the setting beside each of the
state indications. For example, in the line “Level 2 header decode: Yes
u/U,” the letters u/U are used to turn OFF or ON the Level 2 header
decoding.
Display> options show
Current option settings
Level 2 Decode header:
Display raw data:
Yes u/U
No v/V
Display Event# & time (e/E) No
Display Lead changes
(l/L) Yes
Raw data display (see below)
Level 3 Decode header:
Yes w/W
Decode facilities: Yes x/X
Display raw data
ASCII8
Raw data single or full (s/S) Single
Reverse Sense DTE/DCE (r/R) DCE
No y/Y
Example
To set the display options back to their original state use the default
parameter:
Display> options default
Default display options set
Chapter 3
33
Data Analyzer Commands
protocol
protocol
The protocol command Selects Level 2/Level 3 protocols for display of
analyzer trace data.
Format
protocol l2
lap/lapb/lapbe/lapd/hdlc/sdlc
l3 x25/q931
Description
Entering the protocol command without arguments displays the
current Level 2 and Level 3 protocol selection.
This command lets you specify a level 2 or level 3 protocol for analysis
and display. It is usually followed by use of the run, runc or display
command.
The function of the protocol command is also implemented in the form
of an option to the run and runc commands. When you use run or runc
with the -f option, to immediately monitor the data, you can use the -p
option, with the parameters specified below, to select the level 2 and level
3 protocol decoding to be used.
34
lap
link access
lapb
x.25 level-2, Mod 8
lapbe
x.25 level-2, Mod 128
lapd
ISDN level-2
hdlc
high level data link (no level-2 decoding)
sdlc
synchronous data link (or HDLC-NRM)
x25
x.25 level-3
q931
ISDN level-3
Chapter 3
Data Analyzer Commands
run
run
The run command starts the analyzer on a specified pair of ZLUs.
Format
run ZLU [-n filename] [-s filesize] [-l lcn#1 ..] -o {opts] -f
Description
The run command starts the analyzer running on a specified ZLU. It will
automatically find the associated partner ZLU so that the correct DCE
and DTE ZLUs are started together.
Chapter 3
-n
Specify the capture file. If not given it will be defaulted
to /var/opt/acc/log/anz_ZLU.eve where ZLU is the
number specified in the command.
-s
Specify the maximum size of the capture file. If not
given, a default size of 1Mbyte will be used. Once this
file size is reached, the capture halts.
-o
Set the display options (refer to the options command
for details of option setting). Note the option settings
modified in this command will change the default
options for the next display command. These options
only have an immediate effect if the follow option is
used.
-f
Set follow mode. In this mode the capture is started
and then the program goes into display mode,
displaying the data as it is stored into the capture file.
The display mode uses the previously defined options
plus any modifications in a -o option within this
command.
-l
Specify LCN masking for events to be stored into the
capture file. If no LCN masking is given then all X.25
L2 and L3 traffic is stored into the file. If masking is
specified then only L3 traffic with matching LCN
numbers is stored. A maximum of 6 LCN numbers may
be specified.
35
Data Analyzer Commands
run
-p
Specify level 2 or level 3 protocol for analysis and trace
display. See the protocol command for specific details
on format for option -p.
Examples
To start the analyzer on ZLUs 19 and 20 use the command:
run 19
The command run 20 would have the same effect. In this example the
default file name would be /var/opt/acc/log/anz_19.eve. If run 20
had been used the file name would have been
/var/opt/acc/log/anz_20.eve, but the data captured would have been
the same.
Display> run 19
Analyzer on ZLUs 19 and 20 started OK
To start the analyzer with LCN filtering for LCN numbers 120, 139, and
200 use the following command:
Display> run 19 -l 120 139 200
Analyzer on ZLUs 19 and 20 started OK
36
Chapter 3
Data Analyzer Commands
runc
runc
The command runc creates a pair of analyzer ZLUs using the specified
interface card, port and subchannel, and runs the analyzer on these
ZLUs.
Format
runc card port
[subch] [-dce | dte] [<any_”run”_options>]
Description
For cards which support subchannelling (T1/E1 cards for example) the
subchannel number is mandatory.
In lieu of manually editing the (ASCII text) network (ttgen)
configuration file to configure the analyzer ZLUs, this command can be
used to dynamically generate them.
Use the -dce option to specify that the port being monitored is configured
as a DCE device. Otherwise the monitored port is assumed, by default, to
be a DTE.
Any of the run command’s standard options may be used with runc, but
they must appear at the end of the runstring, per the format outlined
above.
On cards which allow “same port monitoring” (E1/T1 and 8-port PCI
cards for example) the two analyzer ZLUs are created on the requested
card, port and subchannel number.
Other card types (which require an analyzer cable), have the first
analyzer ZLU created on the given card and port number, and the second
ZLU created on the next adjacent port. For this reason the last port of
this type of card cannot be specified in the runc command.
If runc is used with the -f option to have the decoded data displayed in
real time, then CNTL-C stops the command and also deletes the pair of
ZLUs.
The default capture file name has a timestamp appended to it when the
runc command is used to start the analyzer.
Chapter 3
37
Data Analyzer Commands
show
show
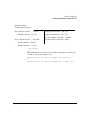
This command displays all the ZLUs configured in the ACC Mux system.
Format
show
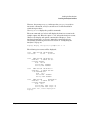
Description
The show command shows the mode, state, and file information for each
ZLU. For example:
Display> show
ZLU.# MX
19 02 2
20 02 3
21 02 4
22 02 5
23 02 6
24 02 7
P Sub Typ AZLU# Mode Stat LC.M size
000 DTE
20 Halt Stop None 508
000 DCE
19 Halt Stop None 508
000 DTE
22 Halt Run None 256
000 DCE
21 Halt Run None 256
000 DTE
24 Halt Stop None
0
000 DCE
23 Halt Stop None
0
Filename................
/var/opt/acc/log/anz_19.eve
/var/opt/acc/log/anz_19.eve
/var/opt/acc/log/anz_21.eve
/var/opt/acc/log/anz_21.eve
The columns in the example above are explained below:
38
ZLU.#
This is the ZLU number of a port assigned to the Data
Analyzer. These ZLUs are recognized by the
application number being set to 90 in the network
configuration file.
MX P
This shows the mux number and port number within
the mux that the ZLU # is connected to.
Sub
This shows the sub-channel number within the mux
and port number that the ZLU # is connected to.
Typ
The Port must be either a DTE or DCE. This identity is
setup in the network configuration file. If the port is
configured as a DTE then the Y-cable port labeled TX
monitor should be connected to it, if it is a DCE port
then the RX monitor cable should be connected to it.
See the configuration section for more details.
Chapter 3
Data Analyzer Commands
show
Chapter 3
AZLU
This is the partner ZLU, which should also appear in
the display. The partner ZLU must be a different type
(DCE if this ZLU is a DTE, and DTE if DCE).
Mode
The mode field gives the action that pcapture takes
when the capture file is full. It may be Halt or Wrap. If
Halt is indicated then the analyzer will halt when the
file is full; if Wrap is indicated then the file will be
overwritten with new data.
Stat
This is the current state of the analyzer which may be
either run or stop.
LC.M
This shows that the LCN numbers are being used for
preprocessing filtering. Refer to the “run” command for
more details. If no LCN filters are set then this field
displays none and all traffic is captured to the file,
otherwise Yes is displayed and only the traffic for LCN
numbers specified in the run command are saved into
the file.
Size
This is the current maximum file size in bytes.
Name
This is the name of the capture file specified in the run
command or the default file name if no file was
specified. The default file name is of the form
/var/opt/acc/log/anz_ZLU.eve, where ZLU is the
ZLU number used in the run command.
39
Data Analyzer Commands
shutdown
shutdown
The shutdown command shuts down the pcapture program.
Format
shutdown
Description
This command is used to cleanly shut down the pcapture program.
When this command is invoked pdisplay will prompt to ensure that the
shutdown is to proceed. If this question is answered with a “y” then a
message is sent to pcapture to shut it down. The pcapture program will
then shut down all current analyzer traces, close all analyzer files, and
then shut itself down and exit.
Display> shutdown
Shutdown pcapture? (y/n) -n
No shutdown performed
After shutdown, pcapture must be restarted by running it from a shell.
40
Chapter 3
Data Analyzer Commands
stop
stop
The stop command stops the analyzer on a specified pair of ZLUs.:
Format
stop ZLU
Description
This command stops the analyzer running on the ZLU specified and its
partner ZLU. It shuts down the two ZLUs and closes the capture file.
To stop the analyzer on ZLU 19 and 20, use the stop 19 command; The
command stop 20 has the same effect.
Display> stop 19
Analyzer on ZLUs 19 and 20 stopped
Chapter 3
41
Data Analyzer Commands
stopd
stopd
The stopd command stops the analyzer and deletes the analyzer ZLUs
in use provided that they were dynamically configured by previous use of
the runc command.
Format
stopd card port [subchannel]
Description
This command stops the protocol analyzer on the specified card, port and
(if an applicable card type is in use) subchannel.
pdisplay then deletes the corresponding pair of analyzer ZLUs.
This command cannot be used to delete analyzer ZLUs statically
configured in the network (ttgen) configuration file.
NOTE
42
Be sure that you intend to DELETE the ZLU pair on the specified
mux/port/subchannel. If you only intend to halt the analyzer, use the
stop command.
Chapter 3
A
Appendix A
Network Configuration
43
Network Configuration
Setting Up the Network Configuration File
Setting Up the Network Configuration File
The first step is to configure the analyzer ports into the ttgen
configuration file. A sample file is supplied with the product to illustrate
how the configuration should be done. This file is called
/opt/acc/cfg/x25an_sample.answ, or x25an_4ch_sample.answ. A full
listing of these files is given at the end of this appendix. Some parts of
these files are used below to illustrate the configuration process.
NOTE
If the sample file is to be used as a test of the product, ensure that the
multiplexer bus and slot numbers are changed in the file so that they
correspond to the actual position of the multiplexer card.
Mux Firmware Download File
The Frame capture protocol used by the X.25 Protocol Analyzer is
provided in all the downloadable files. The X.25 Protocol Analyzer may
be used with any of these files.
The mux firmware download file is specified in the network
configuration file in the card-type statement. For example:
z7340a 0 0:4 /opt/acc/z7340a/x25.zabs
Each multiplexer that is to run X.25 connections, or Data Analyzer ports,
will need a card-type entry, such as z7340a. The bus and slot numbers
must correspond to the physical position of the interface card. Refer to
the ACC Installation and Configuration Guide for more information on
determining the hardware location.
44
Appendix A
Network Configuration
Setting Up the Network Configuration File
Port Definitions
Each port on each multiplexer card to be used for the Data Analyzer
must be correctly configured to support the Frame capture firmware
protocol. Note the following configuration requirements:
•
Select the correct mux and port for each analyzer connection.
•
Set RS232 mode for both RS-232 and V.35 analyzer ports.
•
The baud rate is not important but set for an expected nominal rate
(57600 chosen here).
•
The Clocking option must be set to Ext.
•
The Mode, clock multiplier, and encoding must be set to SDLC, x1,
and NRZ. If NRZI encoding is used set this to NRZI instead.
Port
Port
Port
Port
Port
Port
Port
Port
00:00
00:01
00:02
00:03
00:04
00:05
00:06
00:07
RS232
RS232
RS232
RS232
RS232
RS232
RS232
RS232
57600
57600
57600
57600
57600
57600
57600
57600
Int
Ext
Ext
Ext
Ext
Ext
Ext
Ext
SDLC
SDLC
SDLC
SDLC
SDLC
SDLC
SDLC
SDLC
x1
x1
x1
x1
x1
x1
x1
x1
NRZ
NRZ
NRZ
NRZ
NRZ
NRZ
NRZ
NRZ
In the example file, mux 0 ports 0 and 1 are used for a sample X.25
connection that is looped back between these ports. marked External is
connected as described below. Connect the Y-cable as shown. The
connector designated “P2” on the Y-cable goes to the connector marked
External on the loopback cable.
ZLU Definitions
Finally the ZLUs to be used for the Analyzer session must be defined.
Take care to define these carefully since errors in these definitions may
not be detected by ttgen. If there are such errors they may not be
detected until the ports are used.
Term
Term
Term
Term
Term
Term
Appendix A
0019
0020
0021
0022
0023
0024
0:2
0:3
0:4
0:5
0:6
0:7
HDLC.FRAME
HDLC.FRAME
HDLC.FRAME
HDLC.FRAME
HDLC.FRAME
HDLC.FRAME
0
0
0
0
0
0
0
0
0
0
0
0
90
90
90
90
90
90
20
19
22
21
24
23
1
2
1
2
1
2
0
0
0
0
0
0
0
0
0
0
0
0
”Protocol
”Protocol
”Protocol
”Protocol
”Protocol
”Protocol
Analyzer”
Analyzer”
Analyzer”
Analyzer”
Analyzer”
Analyzer”
45
Network Configuration
Setting Up the Network Configuration File
Follow the steps below to configure the ZLUs, refer to the examples
above for clarification. In the example, ZLUs 19 and 20 form an analyzer
pair, so do 21 and 22, and 23 and 24.
•
Choose ZLU numbers for each of the analyzer ports so they are
unique within the whole ttgen configuration file.
•
Note the ZLU numbers for each analyzer pair; there should always
be an even number of analyzer ZLUs.
•
Set the mux:port numbers so they correspond to the ports defined in
the “Port Definitions” section.
•
Select the HDLC.FRAME protocol for each of the analyzer ZLUs, and
set the “poll” and “select” configuration parameters to zero (0) .
•
Set the Application number to 90. If this is not set correctly the
pcapture and pdisplay programs will not be able to find the analyzer
ZLUs. (Use the pdisplay command show when the software is
running, to ensure the ZLUs have been correctly configured.)
•
Set the parameter after the 90 (application number) to the partner
ZLU number. In the example, the partner ZLU for 19 is 20, for 21 is
22, etc.
•
Set the next parameter to 1 if the port is to be the DTE (TX monitor)
port, and 2 if it is to be the DCE (RX monitor port). Note that the
DTE/DCE definitions for partner ZLUs must be different.
•
Set the last two parameters to 0.
•
The port description (“Protocol Analyzer,” above) may have any
string of up to 30 characters. This is a comment field and its value
will not affect the analyzer operation. The field is displayed by
ZMNTR and may be used for application or operational description,
for example, “Backup X.25 link monitor.”
Running TTGEN and Starting the ACC Mux
Once the network configuration is complete, the file must be compiled by
ttgen. To run ttgen use the following command:
$ ttgen -o file.answ file.tmem
Here file.answ is the source file that has just been set up, and file.tmem
is the output file to be used by zmon to start the ACC Mux system. For
example, to compile the sample file:
46
Appendix A
Network Configuration
Setting Up the Network Configuration File
$ ttgen -o /opt/acc/cfg/x25an_sample.answ \
/opt/acc/cfg/x25an_sample.tmem
Here the -o option allows a previous copy of the output file
/opt/acc/cfg/x25an_sample.tmem to be overwritten if it already exists.
If there are inconsistencies in the configuration file, ttgen may report
errors or warnings. These should be corrected and ttgen rerun until it
runs without error.
Once ttgen has been successfully run, ACC Mux subsystem must be
restarted (note this command must be executed as superuser). First stop
ACC Mux using:
$ zmasterd stop
Starting ACC Subsystem and Analyzer
Once the ttgen file is properly configured, the ACC Mux subsystem can
be started using the appropriate .tmem file.
$ zmasterd cold /opt/acc/cfg/x25an_sample.tmem
Once ACC Mux is up and running, start the pcapture daemon.
$ pcapture
The pcapture program can also be started automatically with the ACC
Mux Subsystem by adding the statement “start pcapture” to the file
/opt/acc/cfg/zmasterd_list. This will cause zmasterd to automatically
start this program.
Appendix A
47
Network Configuration
Setting Up the Network Configuration File
Pcapture runs as a daemon and reports its errors to the ACC Mux
message file. If pcapture is not running correctly, look at the end of the
daily ACC Mux log file, or on the system console if console logging has
been enabled for ACC Mux. The log file name depends on the day of the
week (i.e., /var/opt/acc/log/mon.tlog is Monday’s file).
To look at the end of this file:
$ tail -20 /var/opt/acc/log/mon.tlog
This will display the last 20 lines of the log file.
When pcapture is started successfully only the revision message should
appear; if pcapture is having problems it will display some reasons and
then terminate. In the second example more than one copy of pcapture
has been started, so the second one fails and terminates.
19:11:38 pcapt 00001
Protocol analyzer capture program Rev B.11.00
21:04:55 pcapt 00001
21:04:55 pcapt 00004
21:04:55 pcapt 00007
Protocol analyzer capture program Rev B.11.00
Program already running - terminating this copy
End of pcapture
Running PDISPLAY
Once pcapture has been successfully started, pdisplay may be run. It
may be run interactively, or may be run as single commands. For
example just specifying pdisplay alone puts it into the interactive mode:
$ pdisplay
Display>
The prompt Display> indicates pdisplay is ready for interactive
commands. Starting pdisplay with a command following the program
name causes it to execute the single command and terminate, for
example:
48
Appendix A
Network Configuration
Setting Up the Network Configuration File
$pdisplay options
Current option settings
Level 2 Decode header:
Display raw data:
Yes u/U
No v/V
Display Event# & time (e/E) No
Display Lead changes
(l/L) Yes
Raw data display (see below)
Level 3 Decode header:
Yes w/W
ASCII8
Raw data single or full (s/S) Single
Decode facilities: Yes x/X
Display raw data
No y/Y
Exit program
$
This method may be used to save the display output from a capture file
to a file, or to pipe the output to more:
$pdisplay display /var/opt/acc/log/sample.eve > printfile
$
$pdisplay display
Appendix A
/var/opt/acc/log/sample.eve -e 1 200 | more
49
Network Configuration
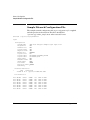
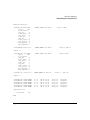
Sample Network Configuration File
Sample Network Configuration File
The sample network configuration file (ttgen configuration file) supplied
with the product is shown below. The file is installed in
/opt/acc/cfg/x25an_sample.answ when swinstall is run.
#include ”/opt/acc/cfg/ttgendefine”
ttgen
Configuration
System-name
Program-Zlu
Terminal-zlu
Logical-Term
Physical-Term
Buffer-Pool
Logical-size
Logical-data
Logical-data
Queue-Limit
Transmit-Limit
Unack-Limit
Port-Limit
E1T1-Port-Limit
Node-Entry
*
”ACC X.25 analyzer example ttgen input file”
100
800
700
700
3000000
252
10 X25CNT,0,X25CNT_LDSIZE
99 X25UDT,0,20
500
200
5000
20000
100000
1
Interface-Definition
mx#
bus#:slot#
z7340a 0 0:4 /opt/acc/z7340a/x25.zabs
Port-Definition
Port
Port
Port
Port
Port
Port
Port
Port
50
00:00
00:01
00:02
00:03
00:04
00:05
00:06
00:07
RS232
RS232
RS232
RS232
RS232
RS232
RS232
RS232
57600
57600
57600
57600
57600
57600
57600
57600
Int
Ext
Ext
Ext
Ext
Ext
Ext
Ext
SDLC
SDLC
SDLC
SDLC
SDLC
SDLC
SDLC
SDLC
x1
x1
x1
x1
x1
x1
x1
x1
NRZ
NRZ
NRZ
NRZ
NRZ
NRZ
NRZ
NRZ
Appendix A
Network Configuration
Sample Network Configuration File
Terminal-Definition
Term 0017 0:0 X25.LAPB
option
30h
*
no_autostart
last_pvc
0
first_insvc
0
last_insvc
0
first_svc
1
last_svc
3
first_outsvc 0
last_outsvc
0
def_inpacket 8
def_outpacket 8
Term 0500 0:0 x25.svc.io
Repeat
Term 0531 0:1 x25.svc.io
Term
Term
Term
Term
Term
Term
”Level.2 DCE”
0000h 0000h 99 0 0 0 0
”Level.3 SVC in”
8009H 43EAH 10 0 0 0 0
”Level.2 DTE”
2
Term 0018 0:1 X25.LAPB
option
30h
*
no_autostart
last_pvc
0
first_insvc
0
last_insvc
0
first_svc
1
last_svc
3
first_outsvc 0
last_outsvc
0
def_inpacket 8
def_outpacket 8
Repeat
0009H 43EAH 10 0 0 0 0
0000h 0000h 99 0 0 0 0
”Level.3
SVC out”
2
0019
0020
0021
0022
0023
0024
0:2
0:3
0:4
0:5
0:6
0:7
HDLC.FRAME
HDLC.FRAME
HDLC.FRAME
HDLC.FRAME
HDLC.FRAME
HDLC.FRAME
0
0
0
0
0
0
0
0
0
0
0
0
90
90
90
90
90
90
20
19
22
21
24
23
1
2
1
2
1
2
0
0
0
0
0
0
0
0
0
0
0
0
”Protocol
”Protocol
”Protocol
”Protocol
”Protocol
”Protocol
Analyzer”
Analyzer”
Analyzer”
Analyzer”
Analyzer”
Analyzer”
Node-Definition
Local-Node
123
End$
Appendix A
51
Network Configuration
Sample Network Configuration File
52
Appendix A
B
Appendix B
Typical X.25 and Data Analyzer
Sessions
53
Typical X.25 and Data Analyzer Sessions
Introduction
Introduction
This section provides the results of actual Data Analyzer sessions that
were run using this software. The sessions were run on an 8-Channel
multiplexer.
Because the 8-Channel multiplexer was not designed to provide ISDN
service, only an X.25 session is described for this product.
General Procedures
The process involved with all sessions described in this appendix is
generally as follows:
•
Ensure that the ACC multiplexer hardware and its base system and
X.25 software are properly installed (per supplied manuals );
•
Ensure that the X.25/ACC configuration has been properly set up:
refer to the X.25/ACC Installation and Configuration Guide as
needed;
•
Start up the ZCOM muliplexer subsystem (described below);
•
Establish an X.25 connection via the ACC Multiplexer (described
below);
•
Send packets over the connection using the X25Check utility
(described below);
•
Run Data Analyzer’s pdisplay program to observe trace of the
captured file.
These sessions were run with the HP-UX utility Script executing in the
background, to preserve a trace of all terminal activity involved with the
procedures.
54
Appendix B