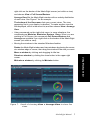
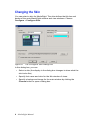
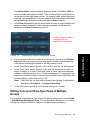
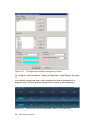
1
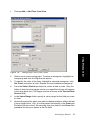
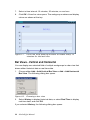
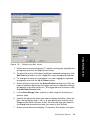
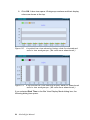
MaxInSight™
User Manual
MaxACD Release 6.5.8
December 2012
WARNING!
Toll fraud is committed when individuals unlawfully gain access to
customer telecommunication systems. This is a criminal offense.
Currently, we do not know of any telecommunications system that is
immune to this type of criminal activity. AltiGen Communications, Inc.,
will not accept liability for any damages, including long distance charges,
which result from unauthorized and/or unlawful use. Although AltiGen
Communications, Inc., has designed security features into its products, it is
your sole responsibility to use the security features and to establish security
practices within your company, including training, security awareness, and
call auditing.
NOTICE
While every effort has been made to ensure accuracy, AltiGen
Communications, Inc., will not be liable for technical or editorial errors or
omissions contained within the documentation. The information contained
in this documentation is subject to change without notice.
This documentation may be used only in accordance with the terms of the
AltiGen Communications, Inc., License Agreement.
AltiGen Communications, Inc.
410 East Plumeria Dr.
San Jose, CA 95134
Telephone: 888-AltiGen (258-4436)
Fax:
408-597-9020
E-mail:
[email protected]
Web site:
www.altigen.com
TRADEMARKS
MaxACD for Lync, MaxACD Administrator, MaxAgent, MaxSupervisor,
MaxInSight, MaxReports, VRManager, and Enterprise Manager are
trademarks or registered trademarks of AltiGen Communications, Inc.
All other brand names mentioned are trademarks or registered trademarks
of their respective manufacturers.
Copyright © AltiGen Communications, Inc. 2012. All rights reserved.
Contents
CHAPTER 1
Overview and Installation . . . . . . . . . . . . . . . . . . . . . . . . . . . . 1
Licensing . . . . . . . . . . . . . . . . . . . . . . . . . . . . . . . . . . . . . . . . . . . . . 1
System Requirements . . . . . . . . . . . . . . . . . . . . . . . . . . . . . . . . . . . . 1
Pre-Installation Checklist . . . . . . . . . . . . . . . . . . . . . . . . . . . . . . . . . 2
Installing MaxInSight on a Client System . . . . . . . . . . . . . . . . . . . . 2
Uninstalling MaxInSight . . . . . . . . . . . . . . . . . . . . . . . . . . . . . . . . . 2
CHAPTER 2
Getting Started . . . . . . . . . . . . . . . . . . . . . . . . . . . . . . . . . . . . . 3
Logging In . . . . . . . . . . . . . . . . . . . . . . . . . . . . . . . . . . . . . . . . . . . . 3
When Connection Is Broken. . . . . . . . . . . . . . . . . . . . . . . . . . . . . 4
The MaxInSight Main Window . . . . . . . . . . . . . . . . . . . . . . . . . . . . 4
Making Workgroups Available for Monitoring . . . . . . . . . . . . . . . . 5
Arranging the Display . . . . . . . . . . . . . . . . . . . . . . . . . . . . . . . . . . . 6
Changing the Skin . . . . . . . . . . . . . . . . . . . . . . . . . . . . . . . . . . . . . . 8
CHAPTER 3
Configuring Data Displays . . . . . . . . . . . . . . . . . . . . . . . . . . . 11
Configuring Workgroup Data Displays . . . . . . . . . . . . . . . . . . . . . 11
Setting a Single Row-Type Display . . . . . . . . . . . . . . . . . . . . . . 11
Setting Concurrent Row-Type Views of Multiple Groups. . . . . 13
Setting Other Data Displays . . . . . . . . . . . . . . . . . . . . . . . . . . . . . . 15
Gauge View . . . . . . . . . . . . . . . . . . . . . . . . . . . . . . . . . . . . . . . . 15
Time Line View . . . . . . . . . . . . . . . . . . . . . . . . . . . . . . . . . . . . . 16
Bar Views - Vertical and Horizontal . . . . . . . . . . . . . . . . . . . . . 18
Changing the Parameters of a View . . . . . . . . . . . . . . . . . . . . . . . . 21
Clearing an Alert Threshold Configuration . . . . . . . . . . . . . . . . 25
List of Fields . . . . . . . . . . . . . . . . . . . . . . . . . . . . . . . . . . . . . . . . . 25
Index . . . . . . . . . . . . . . . . . . . . . . . . . . . . . . . . . . . . . . . . . . . . . . . 27
MaxInSight Manual
iii
iv MaxInSight Manual
CHAPTER 1
AltiGen MaxInSight is a workgroup performance application. It provides call
center managers and agents with the ability to track workgroup status and
performance data from a wall-mounted LCD panel or from their computers.
MaxInSight includes the ability to see the following for single or multiple
workgroups:
• Real-time queue status
• Real-time workgroup resource status
• Daily operation results
• Trends of data over time
Users can configure:
• Several types of data displays, or views
• Alerting thresholds
• The display interval for different workgroups’ statuses when those
workgroups are configured into in a single template
• Character font size and color
• The MaxInSight skin
MaxInSight runs with the MaxACD for Lync server.
Licensing
MaxInSight requires an AltiGen MaxInSight license.
System Requirements
The client system must meet the following minimum requirements:
• IBM/PC AT compatible system
• 1GHz CPU
• Windows XP Professional SP2 or above or Windows Vista Business
Edition (32-bit or 64-bit), Windows 7 (32-bit or 64-bit), or Windows 8
(32-bit or 64-bit)
• 1GB available hard drive disk space
MaxInSight Manual
1
Overview and
Installation
Overview and Installation
• 1GB RAM
• SVGA monitor (1024 x 768) with 256 color display, or better
• Keyboard and mouse
• MaxACD running on a server accessible to this client.
Pre-Installation Checklist
Before installing MaxInSight, make sure the following is done:
• MaxACD has been installed on the system server.
• The MaxInSight License Key has been installed and activated on the
system server.
• TCP/IP is enabled on both machines.
• The client is able to connect to the server on the network.
• The person installing MaxInSight has local administrator rights on the
client computer.
Installing MaxInSight on a Client System
When the above items are done, follow these steps on the client machine:
1.
Exit all Windows applications.
2.
Insert the MaxACD Clients CD into the CD ROM drive.
3.
Open the MaxInSight folder, and run the Setup program in that folder,
following the step-by-step installation instructions as they appear on the
screen.
Alternatively, if your system administrator has loaded MaxInSight on a
shared network server, you can copy the files in the MaxInSight folder to
your desktop computer, and run the MaxInSight Setup program.
Uninstalling MaxInSight
1.
From the Windows Start menu, select Control Panel > Add/Remove
Programs > MaxInSight to uninstall MaxInSight.
2.
Click Remove, and respond to any additional prompts.
2
MaxInSight Manual
CHAPTER 2
Getting Started
Start MaxInSight from the Microsoft Windows Start menu, by choosing
Start > All Programs > MaxInSight > MaxInSight.
Logging In
1.
If this is your first login to this MaxACD system, enter the system
server’s IP address or the name of the system server you will be using.
To obtain the server name or IP address, ask your system
administrator.
Figure 1.
The MaxInsight login window
(Subsequently, when you log in, you’ll see the IP address in the Server
field.)
2.
Enter your Extension number and Password assigned to your phone.
(You can also log in as a workgroup or a huntgroup.)
MaxInSight Manual
3
Getting Started
If you are connecting to the Internet through a modem connection, before
you log in, establish a session connection from your computer to your local
Internet service provider. If you’re using a low-speed connection, the login
may take some time, since a large amount of data is transferred to your
desktop.
If you want to store your login password and have it entered automatically the next time you log in to MaxInSight, check the Always save
password check box.
3.
Click Sign in. (To cancel, press the Esc key.)
Figure 2.
4.
The Data Source window
In the dialog box, select a log service. Only enabled and connected log
servers can be selected. (The number of entries listed in the Choose
Data Source dialog box depends on the number of logger servers
installed with the MaxACD server.)
When Connection Is Broken
When a connection with the phone server is broken, a message box pops
up letting you know. After you click OK in the message box, the application
closes, and you will need re-launch it.
The MaxInSight Main Window
Once you log in to MaxInSight, a blank window opens. It has a menu bar at
the top, containing Configure, Add, View, and Help menus. The next figure
shows the Configure menu.
4
MaxInSight Manual
Figure 3.
Main window with the Configure menu open
Making Workgroups Available for Monitoring
Before you can monitor a workgroup, you must add it. To do so, choose
Configure > Configure Workgroup to Monitor.
Click a column
head to sort the
column in
ascending or
descending order
Figure 4.
The Monitor Workgroup window with three workgroups
MaxInSight Manual
5
Using MaxSupervisor
MaxInSight remembers the workgroups you enable, and the configuration
and position of views, so when you log in again, the remembered workgroups are enabled automatically, and the views are displayed as they were
when you logged out.
To add a workgroup, click Add, enter the workgroup number and password,
and then click OK.
Figure 5.
The Add Workgroup dialog box
To disable a workgroup, select it and click the Disable button. Workgroups
that you disable will not be available in other MaxInSight configuration
screens.
To remove a workgroup from the list, select it and click Remove.
Arranging the Display
After you have configured views (see “Configuring Data Displays” on page
11), you can control the MaxInSight display with the following methods.
• Using commands on the View menu (and keyboard equivalent):
Figure 6.
The View menu
Full Screen enlarges a view to fill the screen and hides the MaxInSight
title bar and menus. To get the MaxInSight main window and its menus
back, press Ctrl+U (Ctrl+U is a toggle) or the Esc key. You can also
6
MaxInSight Manual
right-click on the border of the MaxInSight screen (not within a view)
and choose View > Full Screen/Restore.
Arrange View fills the MaxInSight window with an orderly distribution
of each view. See Figure 7 for an example.
The bottom of the View menu lists your current views. The view
appearing first in your display is checked. To make another view the
first displayed, click it in the menu list, and then choose View > Arrange
View.
• Using commands on the right-click menu: in some situations, the
commands are Minimize, Maximize, Restore, Close. When you are
working in Full Screen, the commands Full Screen/Restore and
Arrange are available if you right-click on the border of the MaxInSight
screen (not within a view).
• Moving the windows in the standard Windows fashion:
Resize the MaxInSight window and view windows by placing the cursor
at a window edge or corner, then drag the window to the size you want.
Move a window by clicking and dragging its title bar.
Using MaxSupervisor
Dismiss a window by clicking the close button in the upper right
corner.
Minimize a window by clicking its Minimize button.
Figure 7.
Result of choosing View > Arrange View to show five
views
MaxInSight Manual
7
Changing the Skin
You can select a skin for MaxInSight. The skin defines the title bar and
border of the main MaxInSight window and view windows. Choose
Configure > Configure Skin.
Figure 8.
The Configure Skin dialog box
In this dialog box, you can
• Select a skin (the display in the dialog box changes to show what the
skin looks like)
• Specify font name and color for the title window of views
• Specify a background image for the main window by clicking the
Choose button to open a dialog box:
8
MaxInSight Manual
Figure 9.
Selecting a background image
• Choose a .bmp image file from any folder, and click Open.
• Choose to remove the AltiGen logo from the background of the Main
window by clearing the Display AltiGen logo on the background
check box.
Using MaxSupervisor
MaxInSight Manual
9
10 MaxInSight Manual
CHAPTER 3
Configuring Data Displays
After you have enabled the workgroups you want to monitor (Configure >
Configure Workgroup to Monitor), you can then configure the data
displays you want to see.
Configuring Workgroup Data Displays
You can display rows of workgroup data in the following ways:
• One workgroup only
• Multiple workgroups in rotating views, one workgroup at a time
• Multiple workgroups on display at the same time
In addition to row views, you can also create gauge views, time line views,
and bar views.
You can configure individual fields to alert you when specified thresholds
are reached. See See Figure 24.
Setting a Single Row-Type Display
To configure a row view for a single workgroup or multiple workgroups in a
rotating display, choose Add > Add Single Workgroup View.
A dialog box shows the workgroups you enabled.
MaxInSight Manual
11
Select
WGs to
view
Highlight a
field to see
it described
here
Figure 10.
Configuring workgroup display
1.
To select a workgroup, highlight it and click the Right-arrow button. You
can select multiple workgroups to monitor, but in this configuration only
one workgroup view at a time is displayed. When multiple workgroups
are selected, the data of each one is displayed in rotation. You can
specify the order of the rotating display by arranging the order of the
selected workgroups: highlight a workgroup and click the Up or Down
arrow button to move it to where you want it.
2.
Select the fields you want to monitor. The fields are arranged in three
categories: Queue, Workgroup, Agent. To see an explanation of each
field (appearing just above the fields list), highlight the field.
12 MaxInSight Manual
Use Shift+click to select multiple adjacent fields. Use Ctrl + click to
select multiple non-adjacent fields. Then click the Right-arrow button to
move them to the right-hand column. To remove fields, select them and
click the Left-arrow button. You can change the order of selected fields
by highlighting a field and clicking the Up or Down buttons.
3.
In the Row Count field, specify the number of rows to use to display the
fields you have selected. In the following example, six fields were
selected, and Row Count was set to 2:
In this example, data is
configured to be
displayed in two rows.
Figure 11.
Configuring single-workgroup views
If you have selected more than one workgroup, specify in the Rotate
Interval field how many seconds you want to display one workgroup
view before MaxInSight rotates to the next group’s view.
5.
In the Field Name panel, specify a font and a color for the field names.
6.
In the Field Value panel, specify a font and the maximum number of
digits to display in a field. If the field value is more than the maximum
number of digits specified, then "?" will be displayed. For example if the
maximum number of digits is set to 2 but the field value is 123, then the
content display on the view will be “1?”.
Note: Font color for the field value is set in the Alerting Configuration
dialog box (Configure > Configure Alerting).
7.
In the WG panel, specify a color for the workgroup number.
Setting Concurrent Row-Type Views of Multiple
Groups
To configure simultaneous row views of multiple workgroups, choose Add
> Add Multiple Workgroup View. The configuration dialog box for multiple
workgroup views is similar to that for a single workgroup display.
MaxInSight Manual
13
Using MaxSupervisor
4.
Figure 12.
Configuring multiple-workgroup views
To configure, see the steps in “Setting a Single Row-Type Display” on page
11.
In a multiple workgroup view, each workgroup’s data is displayed in a
separate row. The first column displays the number of the workgroup.
Figure 13.
Data from two workgroups, each in its own row
14 MaxInSight Manual
Setting Other Data Displays
In addition to the basic row views, you can configure four other views:
Gauge – Shows the real time status of a single data value in a dial format.
Timeline – Shows trends of data elements over time. The data points are
plotted on the graph and connected with lines.
Vertical or Horizontal Bars – Shows one field of either one workgroup or
multiple workgroups in a vertical or horizontal bar view. This view reflects
either historical data or real time data, whichever you specify.
Gauge View
A gauge view displays the status of a single field in an easy-to-read dial
format. With a gauge view and with alerting configured, it’s easy to see, for
example, whether service level is normal or too low, the number of callers in
queue is too high, or queue time is too long.
To set parameters for a gauge view,
1.
Choose Add > Add Gauge View.
Using MaxSupervisor
Figure 14.
2.
Configuring Gauge views
Specify the workgroup, the field to track, and a value range.
Note: Only the fields appropriate to a gauge view are available
3.
Select a font and color for the workgroup and for the field name. Click
OK.
A gauge view is displayed similar to the following:
MaxInSight Manual
15
Figure 15.
Gauge view showing % of abandoned calls
Time Line View
A time line view is used to display trends of data elements over time. The
data points are plotted on a graph and connected with lines.
To set parameters for a time line view,
16 MaxInSight Manual
1.
Choose Add > Add Time Line View.
Configuring Time Line views
2.
Select one or more workgroups. To select a workgroup, highlight the
workgroup and click the Right-arrow button.
3.
To specify the color of the lines, highlight a selected workgroup, click
Set Color and select a color. Repeat for each additional workgroup.
4.
From the Select Field drop-down list, select a field to chart. Only the
fields of data from the logger service you specified at login will appear
in the drop-down list. (The logger service is shown in the Current Data
Source field.)
5.
In the Value Range fields, specify a value range for the field you want
to chart.
6.
Specify the period for which you want to display statistics: either the last
x hours (select from 1-24), or a time period you specify in the From and
To fields (24-hour clock). Be sure the time you select in the From field
precedes the time you select in the To field.
MaxInSight Manual
17
Using MaxSupervisor
Figure 16.
7.
Select a time interval: 15 minutes, 30 minutes, or one hour.
8.
Click OK. A time line view opens. The workgroup numbers and display
colors are shown at the top.
Figure 17.
Time Line View showing number of incalls every 15
minutes for the last hour
Bar Views - Vertical and Horizontal
You can display one selected field of multiple workgroups in a bar view that
shows either historical data or real time data.
1.
Choose either Add > Add Vertical Bar View or Add > Add Horizontal
Bar View. The following dialog box opens.
Figure 18.
2.
Choosing a bar view
Select History to display historical data, or select Real Time to display
real time data, and click OK.
If you selected History, the following dialog box opens:
18 MaxInSight Manual
Configuring Bar views
1. Select one or more workgroups. To select a workgroup, highlight the
workgroup and click the Right-arrow button.
2. To specify the color of the bars, highlight a selected workgroup, click
Set Color and select a color. Repeat for each workgroup selected.
3. To change the order of workgroups in a view, highlight a selected
workgroup and click the Up or Down button.
4. Select a field to chart from the Select Field drop-down list. Only the
fields of statistics data from the logger service you specified at login
will appear in the drop-down list. (The logger service is shown in the
Current Data Source field.)
5. In the Value Range fields, specify a value range for the field you
want to chart.
6. Specify the period for which you want to display statistics: either the
last x hours (select from 1-24), or a time period you specify in the
From and To fields (24-hour clock). Be sure the time you select in
the From field precedes the time you select in the To field.
7. Select a time interval for display: 15 minutes, 30 minutes, one hour.
MaxInSight Manual
19
Using MaxSupervisor
Figure 19.
8. Click OK. A bar view opens. Workgroup numbers and their display
colors are shown at the top.
Figure 20.
A vertical bar view showing history data for abandoned
calls in two workgroups. (No calls were abandoned.)
Figure 21.
A horizontal bar view showing history data for abandoned
calls in two workgroups. (No calls were abandoned.)
If you selected Real Time in the Bar View Display Mode dialog box, the
following dialog box opens:
20 MaxInSight Manual
Figure 22.
Configuring Real time bar views
1. Select a workgroup.
2. Select a field to view.
3. Specify a value range for the field you want to view.
4. Click OK. A bar view is displayed. The workgroup number and
display color are shown at the top.
Using MaxSupervisor
Figure 23.
Vertical bar view showing number of abandoned calls for
a workgroup. (No calls were abandoned.)
Changing the Parameters of a View
To change the parameters of a view you’re displaying in MaxInSight, rightclick the view, and choose Modify View Parameters. Make your changes
in the Parameters dialog box and click OK.
MaxInSight Manual
21
The right-click
menu on a view
Figure 24.
The right-click menu
Configuring Alerts
For each field you’re interested in tracking, you can choose to be alerted
when data in the field crosses a threshold you specify (a warning threshold
and a critical threshold). MaxInSight alerts you through a different color
display and, optionally, by playing a sound file.
To configure alerts for a field,
1.
Choose Configure > Configure Alerting.
Figure 25.
2.
Configuring alerts
Select the display colors you want to use for normal, warning and
critical levels. By default, green represents normal level, yellow
represents warning level, and red represents critical level.
22 MaxInSight Manual
3.
Select a workgroup in the Workgroup List, and then select a field on
which you want to set the threshold for the three levels.
Note: To arrange the Workgroup Number, Workgroup Name, Field
Name, or the Type columns in ascending or descending order,
click the column heading. Click again to reverse order.
4.
Click the Configure button or double-click the field. The Alerting
Configuration dialog box for the selected workgroup opens:
The workgroup number
The field you selected is
described here
The dialog box varies,
depending on the field
you selected
5.
Configuring upward alerts
Select Upward or Downward, as appropriate, configure the field’s
thresholds, and click OK.
Note: If you select Downward, the Normal above field is filled in
automatically when you specify the warning level. For example:
MaxInSight Manual
23
Using MaxSupervisor
Figure 26.
When 8 was entered in
the Warning field, 8
appeared automatically
in the Normal above
field
Figure 27.
6.
Configuring downward alerts
If you want, configure an alerting sound to be played when the field
value falls into the warning or critical level. To do so, select a file from
the Sound File drop-down list. You can click the Play button to preview
the sound.
Note: Wave files are stored in the WAV folder under the MaxInSight
folder. You can add your own sound file to this folder, and it will
appear in the selection list. The duration of your sound file
should be less than 5 seconds.
Note: Only one sound file can be used per workgroup.
7.
When you are finished configuring, click OK.
In this view, alerting
parameters are set
to: 10 calls in queue
is normal, 11-13 CIQ
is at the warning
level, more than 13
CIQ is at the critical
level
Figure 28.
A gauge view with alerting parameters set
24 MaxInSight Manual
Clearing an Alert Threshold Configuration
To quickly clear an alert threshold configuration on a field, open the Alert
Configuration dialog box (Configure > Configure Alerting), select the
workgroup and then the field whose configuration you want to clear, and
click the Reset button.
List of Fields
The following tables show all the fields supported in MaxInSight. They also
show what fields are available to what kinds of views. (In the tables, Numeric
means single workgroup view and multiple workgroup view.)
Using MaxSupervisor
Table 1: Workgroup queue real time status fields
Table 2: Agent availability status fields
MaxInSight Manual
25
Table 3: Daily performance statistics fields
26 MaxInSight Manual
Index
Symbols
? in display data 13
F
alerts, configuring 22
always save password 4
arranging views 6
fields
definitions 11, 25
descriptions 23
list 25
font color, changing 8
font, changing 8
B
G
A
background image, changing 8
bar view, configuring 18
broken connection 4
C
changing
background image 8
look of MaxInSight 8
number of digits displayed 13
view parameters 21
configuration, remembered 5
configuring
alerts 22
data displays 11
skin 8
connection with server broken 4
D
data displays, configuring 11
data source, choosing 4
data, displaying 11
digits displayed, changing number
of 13
disabling workgroups 6
display
changing parameters 21
display mode 18
displaying data 11
gauge view 15
H
history display mode 18
horizontal bar view, configuring 18
I
image, background, changing
installation 2
installation requirements 1
8
L
license required 1
logger servers 4
logging in 3
M
main window 4
menus, restore 6
monitoring workgroups 5
multiple rows, configuring 13
multiple workgroup views 13
O
overview of MaxInSight
1
P
password, always save 4
MaxInsight Manual 27
R
real time display mode 18
reconnecting 4
required license 1
requirements, system 1
restore MaxInSight menus 6
rotate interval 13
rotating display 11
row count 13
rows, displaying multiple 13
row-type display 11
row-type views
multiple workgroups, displaying
simultaneously 13
S
server IP address 3
single workgroup view 11
skin, changing 8
sound file
adding 24
configuring 24
starting MaxInSight 3
statistics period 17, 19
system requirements 1
T
threshold
clearing configuration
for alerts 22
thresholds, setting 23
time line view
configuring 16
definition 16
25
U
uninstalling
2
V
vertical bar view, configuring 18
View menu 6
view, changing parameters 21
views
28 MaxInsight Manual
arranging 6
moving 7
W
wav files 24
windows, moving 7
workgroup displays
configuring 11
workgroups
disabling 6
making available to monitor
5