1
THE TURBO TAX REVOLUTION?
EVALUATING THE ABILITY OF TECHNOLOGY
TO SOLVE THE TAX COMPLEXITY DILEMMA
Austan Goolsbee
University of Chicago, G.S.B.,
American Bar Foundation and N.B.E.R.
Current Draft: January 25, 2002
INTRODUCTION
There is a fundamental trade-off in the tax code surrounding the issues of
complexity and the costs of compliance. Over the last two decades, policy makers facing
strict rules about budget expenditures have increasingly turned to the tax code to promote
various types of behaviors or give money back to particular constituencies (see, for
example, the overview of tax policy in the 1990s in Steuerle, 2002). Doing so, however,
necessarily involves adding layers of complexity to the system that are both costly and
that tends to increase people’s opposition to the system.
Academics typically think of these compliance costs as additional deadweight loss
from raising revenue. As such, they are important for various positive and normative
theories about the size of government (for instance Slemrod and Yitzhaki, 1996; Becker,
1983; Becker and Mulligan, 2001).
If a new technology arrived on the scene, however, that could reduce the cost of
complying with the tax code this could potentially eliminate the dilemma faced by the
policy makers, at least in the short-run. Policy makers might be able to target the
behaviors they want without having to worry about the problems raised by added
complexity. I shall refer to this idea as a ‘technological solution’ to the policy makers'
complexity dilemma. The technological solution is not as far fetched as it might sound.
Indeed, some have argued that information technology in general and tax planning
software such as Intuit’s Turbo Tax or Kiplinger’s Tax Cut in particular, may be just such
a solution. 1
1
Orszag (2002) and Burman (2002), for example, discuss the potential of tax software to allow for more
complexity without the typical costs.
This paper will consider the economic issues associated with the rise of tax
planning software by using an extensive source of data on more than 60,000 households
that includes information on whether they use such software. Specifically the paper will
deal with three issues: 1) whether the use of these programs is widespread or is restricted
to a narrow class of people, 2) whether consumers are actually using these programs to
reduce complexity and 3) whether the gain from expanding the use of tax software such
the recent Bush administration Free-Filing Initiative would be as large as pursuing other
technology based solutions such as return- free filing of 1040EZ forms.
The data essentially answer all three in the negative. First, use of tax planning
programs is quite small, concentrated among highly educated people (as well as people
with very high incomes), and is unlikely to be widespread for many years to come. As a
result, the people who would be hurt by increasing the complexity of the tax code are the
ones not using the programs and that tends to be precisely the people for whom
complexity is the most costly—people with little education, few resources, who
frequently do not speak English.
Second, though, and more importantly, the data do not provide any evidence that
people adopt tax software in order to reduce the complexity of their tax compliance (as
opposed to, say, getting the services they might get from an accountant but at a cheaper
price). Regression analysis of people’s decision to use the software shows that, holding
other things equal, a host of factors that should make the tax situation more complicated-operating a business from home, having children under six years old, having a complex
state income tax, and the like--do not make people more likely to adopt. Instead, the
decision seems to be driven primarily by the computer and Internet savvy of the taxpayer.
People use the programs when the costs of learning how are low not when the benefits
from improved simplicity are high.
The paper then makes the point that switching some or all of the 1040EZ returns
to automatic, return free electronic filings would have a bigger impact on complexity of
the tax system in the near-term and would be geared toward people for whom complexity
is most difficult. Even if this could only be done for childless single people and married
couples with only one working spouse to reduce administrative problems, it could still
eliminate compliance costs for as many as 18 million taxpayers that are on the order of $1
to $2 billion per year.
THE TAX ASSISTANCE INDUSTRY
It isn’t surprising that for something as complicated as filling out a tax return,
there would be a booming business in assisting people who don’t know much about the
process. The traditional form of help has been the accountant. H&R Block and Jackson
Hewitt are the best known national brand names but there are thousands of accountants
throughout the country that do similar work.
In recent years, there has been a fairly significant rise the number of people using
tax management software to help individuals fill out the ir returns rather than turning to an
accountant. The market leader is Intuit’s TurboTax but there are several others including
Kiplinger’s Tax Cut—owned by H&R Block—and many other small players. The
TurboTax market share is very high. According to Mahoney (2001) and the data cited by
Intuit (2002), TurboTax has approximately 70 percent of the market.
Basically, these programs allow the taxpayer to enter the information into a
computer program which asks various questions about possible deductions, sources of
income, and so on, and at the end, prints out a tax return and tells the payer how much
they owe or are due for a refund. For people that use computer financial planning
software such as Microsoft Money or Intuit’s Quicken, it is possible to load data directly
into the software without having to type it in. Similarly, some financial firms, such as
Fidelity, have deals with Intuit to allow users to download information on capital ga ins
distributions and realizations and on interest income directly without having to type it in.
In general, these types of programs are not geared toward the truly complex tax
returns of people at the very top of the income distribution and their help with advice on
things like bequest management and estate taxation are fairly limited. They are, instead
geared toward most everyone else paying the personal income tax—and certainly not just
itemizers.
The cost of these programs is small compared with a typical accountant. In 2001,
for example, TurboTax for the web cost $6.95-$9.95 for a 1040EZ form and $14.95$19.95 for a standard 1040. TurboTax in a box costs a bit more (about $30 for the basic
package). Completing a state income tax form involves another small charge.
It is important to note at the outset that tax management software is not the same
thing as filing electronically. Electronic filing refers only to the method of delivery to the
I.R.S. While there is much overlap among the two groups, if there is to be a
technological solution to the complexity problem, it will rest with the tax planning
software, not with the electronic filing. The main advantages of electronic filing include
knowing right away if the return has been received/accepted and receiving a refund in a
substantially shorter amount of time. There are many brick-and- mortar accountants—
H&R Block, for example—where a taxpayer can file electronically even if they have not
used a computer program themselves. The filing is done by H&R Block and to the
taxpayer is no different than just going to an accountant in the pre-software days with the
exception that one can get a refund quicker. This is electronic filing with no reduction in
complexity.
On the other side, at the conclusion of a tax management software program, the
taxpayer receives a copy of their tax return and then they can decide to mail in the tax
return as in a conventional filing or they can file electronically. Here, if they mail it in,
they could have benefited from reduced complexity by using the program but not filed
electronically. It is the software that is the key.
Data Sources and Basic Results
To examine the impact of tax planning software, I will rely on data from the
Technographics program of Forrester Inc., a leading market research firm. The
Technographics 2001 benchmark sample includes detailed micro data from more than
90,000 people across the U.S. The field work was done by NFO using a mail survey to a
subset of their ongoing NFO survey panel. The data are meant to be nationally
representative and, in addition to extensive demographic and economic information about
the individuals, the respondents answer questions about how they manage their finances
and one of the things they answer is whether they use “Tax Planning Software (e.g.,
Turbo Tax).”2 For those with access to a PC at home, the respondents answer
2
This is the same data source used in Goolsbee (2000).
information such as how frequently they use the computer, whether they have ever
bought online, whether this is their first computer, and so on.
From this information, I can construct the a profile of the users of tax
management software and seek to explain who uses it and why. This is the only
systematic source of micro- level information about the use of such programs in existence.
In addition, it allows will allow me to match people’s demographics to their tax situation
in a way that would be impossible using tax return data, even if one could get individual
level information since returns do not include much demographic information.
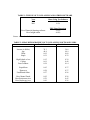
Since it will be the basis of the results, however, it is important to know whether
the data are truly nationally representative as regards this type of software. Summary
information is presented at the top of Table 1. Looking at the data as of January 2001,
some 9.9 percent of households reported having used tax planning software, an increase
of 13 percent from the level in 2000, and a percentage corresponding to between 10 and
11 million households. Intuit (2002) claims that Turbotax users totaled 7.8 million in
2001. Given the 70 percent market share, this would imply an overall market of 10.9
million so the Forrester data appears to match the national numbers fairly well.
WHO USES TAX SOFTWARE?
The first step in evaluating the role of tax planning software is to understand how
many people are actually using tax planning software and who they are. Using just the
aggregate number (about 10 percent of households), it is quite clear that without a
dramatic increase in adoption over the next several years, policy makers' technological
solution will have to wait. At current growth rates, it could take decades. Further, since
about one third of U.S. households have no access to a computer, even with rapid growth
among computer users, it may take a long time for software usage to become
comprehensive. In the near term, in all likelihood, the most that could be hoped for
would be penetration rates to rise as high as other related related activities such as
financial planning software or having bought a product online. The shares for each of
these in 2001 is listed in table 1. They are significantly larger, though still not at all
comprehensive.
The limited use of the tax software means that making the code more complex
while relying on the software to simplify it has the potential to make the costs of
compliance worse for the 90 percent of people who do not use the software. It is highly
relevant, then, who the users and non- users are. The work on tagging and heterogeneity
of Akerlof (1978) and Kopczuk (2001) ha s shown that an optimal tax system might
involve allowing special ways for certain groups to avoid taxes so long as the social
welfare function says those groups should receive more weight. The problem with
applying that argument here is that it potentially gives a special reduction in complexity
to highly skilled people (i.e., computer software users). The people suffering from the
higher complexity might very well be people unprepared to deal with it--people with
worse educations and lower incomes.
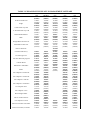
To gauge the relevance of this point in reality, Table 2 presents the demographic and
economic characteristics of such users compared to non-users in 2001. It is clear that the
two differ quite a lot. In particular, the tax software users have average incomes almost
40 percent higher than non-users, are substantially more likely to have assets such as
retirement accounts and brokerage accounts, and have a great deal more education. The
share of software users with a high school degree or less, for example, is only 15.4
percent versus almost 40 percent for non- users. The software users also tend to be
slightly younger, slightly more white, slightly more Republican, and slightly more likely
to have children but these are much smaller differences than the income, asset and
education differences.
Though on a separate issue than the prevalence of tax software, it is worth
considering the ways that software usage may differ from the use of paid tax preparers.
There is no information in the Forrester data on the subject but I can compare it to the
zip-code level data from I.R.S. (2003a) that (among other things) provides average AGI
and share of returns prepared by a paid preparer. The files are released by state. For
simplicity, I use information from the top seven states, together accounting for about 40
percent of the U.S. population. 3 There are more than 17,000 zipcode included in those
data. I restrict the sample to zipcodes with at least 10 respondents in the Forrester data
and then rank them by ave rage AGI.
The share of returns signed by a paid taxpreparer is 55.8 percent and the share of
respondents in the Forrester data reporting that they use tax software is about 13.0
percent. Among the zipcodes with average AGI in the bottom quartile (with average AGI
less than $36,000), almost 56.7 percent of returns are signed by a paid tax preparer but
only 9.8 percent of Forrester respondents report using tax software. Among zipcodes in
the highest quartile (with average AGI greater than $59,700), the share of returns signed
by a paid tax preparer is actually a slight bit lower at 55.7 percent while the share using
tax software is much higher than before at 15.1 percent. So the use of these programs
does not appear to be too closely tied to an overall demand for tax assistance.
3
These are California, Texas, New York, Florida, Illinois, Pennsylvania, and Ohio.
IS TAX SOFTWARE REALLY ABOUT SIMPLIFICATION?
Most of the discussion about tax software has simply taken for granted that people
adopt it because it substantially simplifies tax filing (as opposed to just providing the
same services people could get from an accountant but at a lower price). In this section, I
question whether this is, in fact, the case. Essentially, taxes complicate people’s lives in
three ways: they induce people to engage in complicated transactions that they would not
otherwise engage in; they necessitate extra record keeping; and they are complicated to compute
and file. Software has no effect on the first, almost no effect on the second, and a lot of effect on
the third but the third is the least important of the three.
Without being able actually to observe why people are using the software, it is
important to look for indirect evidence. One basic idea would be that if a main attraction
of these programs is to make things simpler, we would expect to see that, holding other
things equal, people with more complex tax filing situations should be more likely to use
them. We are, essentially, indirectly asking about the demand curve for tax software. It
is important to note that this regression will not estimate the demand for tax planning in
general since the data do not include information about paid tax preparers. It will
estimate the demand for the software, given the current existence of substitutes. If
accountants did not exis t, people might all switch to tax software and its benefits might
be great. Given that accountants do exist, though, we want to know whether complexity
is leading people to use software. If complexity leads people to switch to accountants the
answer will be no. As described earlier, if the only thing tax software can do is reduce
very minor complexity but once you get past that, an accountant takes over, it is hard to
imagine the consumer surplus gain from the product as being very large.
There are two natural alternative explanations for what drives tax software adoption
(other than the desire to reduce complexity). One explanation is that that the adoption
decision is driven, or at least correlated, with various general demographic factors such as
more education, greater wealth, and so on. The second is that tax software is simply a
complement to computer usage and particularly to certain types of computer usage such
as keeping family budgets on computer, etc.
I will examine the individual level decision to use tax planning software by doing
regression analyses on the Forrester data. Given the nature of the survey respondents, it
probably most appropriate only to do this regression among people who actually do have
the choice of using such software which means people with personal computers. People
without computers will answer no to the question rather automatically. More interesting
is examining why the people who actually could adopt choose not to. 4 Restricting the
sample to people with a home PC reduces the sample to a bit over 60,000 respondents. I
will also present results including people without home computers to be sure that
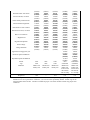
selection is not a problem. The results will be very similar. Table 3 lays out several
regressions where the dependent variable is the individual level {0,1} decision of whether
that use tax planning software.
Column 1 presents a basic linear probability specification. Factors that I include that
are correlated with more complex returns (to test whether a desire to reduce complexity
drives the software adoption decision) include the number of lines on the state income tax
form, whether the person's state has an income tax at all, dummies for the number of
4
The regression with only computer users will have a selection bias if, as an example, people are more
likely to buy computers if they want to do their taxes using the software. I do not view this as especially
problematic. Including the entire sample , on the other hand, will then make the results influenced by the
factors drive the adoption of personal computers. Goolsbee and Klenow (2002) cover that topic in some
detail.
children under six years old in the household (which make it more likely to have day care
expenses), whether they run a business from home either full or part-time, and whether
they have bought or sold a house in the past year. These coefficients are listed in the first
rows of the specification.
Variables that I include to control for the independent influence of demographics and
other factors include gender, race, education, family size and market size dummies as
well as dummies for the types of assets the respondent has (such as full-service brokerage
accounts, discount brokerage, mutual funds invested indirectly and in banks, and
retirement accounts) as well as a cubic function of their age and income.
Variables that I include to control for the either the general taste for new technology
or the complementarities between tax software and other computer software include
dummies for the frequency of computer usage, whether an individual has bought
something online before, whether this is the first PC the household has owned, whether
the respondent uses a computer at work, whether they own a cellular phone, a palm
pilot/PDA, and whether the respondent uses Microsoft Money, Intuit's Quicken, or
another type of financial planning software. In the full sample regression I will have to
drop some of the computer variables but will add a variable for whether the individual
has access to a PC at home.
The results in table 3 are not supportive of the view that tax management software is
driven by a desire to reduce complexity. Taxpayers do not appear to be any more likely
to use it if their tax status becomes more complicated. The number of lines on the state
income tax has the wrong sign—more entries on the state income tax form make you less
likely to use tax software, although the coefficient is quite small (the mean of the
dependent variable is .099). Not having a state income tax has an extremely small
coefficient that is not significant. Having child care age children also has no significant
effect on the likelihood of using a tax program and the point estimate is negative. There
is similarly no significant effect of buying or selling a house nor of operating a business
from home.
Many of the demographic variables do matter—college graduates and people with
graduate education are much more likely to use the software (controlling for everything
else). Men are more likely as are younger people, though the age coefficients are not
reported in the table to conserve space. Race plays little role as does the existence of
most types of financial accounts.
The thing that is rather clearly the strongest determinant of usage of tax planning
software is the individual's use of computers and especially use of financial planning
software. By far the biggest coefficients as well as the most significant are on the usage
of Microsoft Money, Intuit's Quicken, and on other financial planning software. Use of
one of these products doubles or even triples the probability that the respondent uses a tax
planning program. Since the market leader by far is Intuit's Turbo Tax, the fact that
Intuit's Quicken has the largest coefficient is not surprising since it is, presumably, the
easiest one to integrate information into the tax program with. Of course, it might also
represent combined advertising or something of that nature.
Essentially all of the other measures of computer usage show up significantly and
with the correct sign. Compared to people who report using their computers every day,
for example, less frequent usage is correlated with a lower likelihood of using the
software. Usage is greater for respondents that own a Palm Pilot or other Personal
Digital Assistant, those for whom their current PC is not their first, and people that use a
computer at work. Interestingly, even the controls for the types of financial accounts
point to the computer usage explanation in that the largest coefficients are on ownership
of discount brokerage and retirement accounts for which there is online access. The same
accounts without online access have small or insignificant effects on tax software
adoption.
Column (2) repeats the same specification but in a Probit model rather than the
linear probability model. The estimated marginal effects are very close to the linear
model in almost every respect so this does not seem to be a particularly troubling issue.
Column (3) expands the sample to include all survey respondents (i.e., including
non-computer users) and adds a variable to the regression of whether the individual has a
computer at home. Do ing this regression necessitates dropping the computer usage
related variables such as frequency of use, have ever bought online, and so on, since these
are not asked of the non computer users. The results are very similar to those in the
sample of just computer users. All of the tax variables have the same insignificant and/or
perverse signs with the exception of home-based business which still has a small
coefficient (having a home based business raises the probability of using turbotax by
.007—less than one quarter of a standard deviation) but now is significant. It is still
rather clearly the computer and technology related factors that are the primary
determinants of the decision to use the software.
Column (4) returns to the base specification in (1) but includes further
information including dummies for the total value of assets, dummies for the hours of
leisure each week, dummies for the year the respondent's latest computer was purchased,
a full set of age dummies and income dummies rather than the cubic function, a dummy
for whether the individual applied for a mortgage in the past year and dummies for
whether the respondent is affiliated with Republicans or Democrats (unaffiliated or other
is the omitted category). Several of these other variables include missing observations so
the number in the sample falls from 61,724 to 42,170 but the results are highly similar. It
is still the case that the tax complexity variables are not correlated with higher likelihoods
of using tax software but the use of computers and other software is.
The bottom line is that people seem to adopt tax planning software not when their
taxes are complex but rather when the costs of learning how to use the program or to
integrate it into financial planning that they already do are particularly low. Examining
how the programs work, perhaps this is not too surprising. They make filling out the
forms more convenient but they don't really make it that much simpler to qualify for
various deductions or anything like that. Indeed the internal research done by the Internal
Revenue Service indicates that holding everything else equal, people that use tax
software end up spend ing more time doing their taxes than comparable people not using
the programs (I.R.S., 2002). At the least, it is hard to see how these programs make filing
a tax return any simpler than they already were with an accountant (and have been for
many years).
The main reason for adoption may be that it can provide similar services as a paid
tax preparer but at lower cost. The reason this distinction matters for estimating the value
of the software comes from the basic fact that if the software is just doing something that
already exists but at a slightly lower price, the consumer welfare gain is rather seriously
bounded above by the change in the price from the first alternative—a small number—
rather than the typical entire-area- under-the-demand-curve calculation one would do for a
completely new good. In short, no one can have a very high valuation (i.e., dramatically
higher than the price they have to pay) for the tax planning services offered by the
software because if they did, they could have hired an accountant to do the same thing at
prices only slightly higher than what the software costs.
ALTERNATIVE TECHNOLOGICAL APPROACHES TO SIMPLIFICATION
The recent decision of the Bush administration to make free electronic filing
available to people is a mo ve in the direction of trying to accelerate the expansion of tax
planning software. In this section I argue that an alternative approach to simplification
would have greater benefit to taxpayers in the near term and might be a better place to
devote resources. Ironically, this benefit comes from converting the least complex tax
form of all—the 1040EZ—to automatic, return- free electronic filing, even just for some
fraction of such filers.
As of 2001, the data suggest that something like 11 million households prepared
tax returns using tax planning software. As of 2000, though, there were around 20
million 1040EZ returns filed (I.R.S., 2001-2002). 5 Clearly the EZ forms are not as
complicated as other forms but it is equally evident that eliminating EZ filings would
affect more people than increasing the use of the tax software can.
Economists and other tax analysts—people that typically have great deal of
educatio n themselves—are not used to thinking of the 1040EZ form as being complicated
and, indeed, frequently say there isn’t much objection to the compliance costs with such a
5
Of course some people using tax planning software are using it to fill out EZ forms so the groups are not
exclusive.
form (see, for example, Sperling, 2002). The irony is that the people who find the EZ
form simple are exactly the ones that cannot use it. For the typical person filling out a
1040EZ for themselves, the process is not always trivial. As an example, note that
although the form is only 13 lines long, the instruction booklet on the Internet is some 32
pages! It involves several worksheets and a fair amount of gathering and computing
numbers and then adding and subtracting.
Although there is no information from the IRS on the educational background of
people using EZ forms, in the Forrester data, among people with household income less
than $50,000 that hold no brokerage or mutual fund accounts (something approximating
the requirements of the EZ form), close to 60 percent have a high school diploma or less.
The work of Bernheim (**) and others has emphasized that retirement savings tend to be
inadequate among people without education and has argued for a program of financial
literacy. This may be quite analogous to the situation with taxes. Basic computational
tasks which are obviously vital for filling out tax returns are not trivial to many people.
Perhaps that is one reason why almost 50 percent of people filling out a 1040EZ form
hire a paid tax preparer, typically at a cost of one to two hundred dollars (see Berube et
al., 2002).
The IRS’s own time disclosure estimate suggests it would take someone 4 hours
and 11 minutes to fill it out the 1040EZ form (I.R.S., 2001) and such numbers are
typically thought to be underestimates. 6
In the aggregate, people are spending close to
100 million hours filling out the easiest form the IRS has—time worth something like $1
to $2 billion dollars at average wage rates. The odd thing about the entire enterprise is
6
Slemrod and Sorum (1984), Blumenthal and Sle mrod (1992) and Arthur D. Little (1988) have considered
the true compliance burdens of tax filing and preparation.
that for many, if not most of these taxpayers, all the information they fill out on their
1040EZ is already reported to the IRS directly. So why not just have the employers pay
the money directly and skip the 1040EZ form altogether? Even if the employer simply
filled out the form for them and gave it to them instead of their W-2 it would reduce
complexity greatly. The employee would just have to sign it and send it in.
Clearly, enacting complete return- free status would entail some additional costs to
the I.R.S. but would they really total $1 to $2 billion per year? As a comparison, I.R.S.
(2003b) indicates that the entire I.R.S. bud get for processing, administration and
management (covering all taxpayers) was $3.6 billion in 2001.
These would be the simplest types of reforms imaginable. If attempting to
connect married payers across employers is too complex or too costly a task, consider
just applying the return- free option for single people. The Forrester data suggests that
about 45 percent of people with household incomes of less than $50,000 and no
brokerage or mutual fund accounts are single. This would still be close to 10 million
people. In the married households, only one third have both spouses working, leaving
some 7.5 million more people potentially covered by this most simple case. 7
Of these
single and married people with one earner, 70 percent do not have children. Restricting it
just to the childless to avoid any complications arising from the Earned Income Tax
Credit would still leave more than 12 million potential beneficiaries of the program.
This revision to the tax system would be concentrated at the low end of the
income distribution. Even the restricted program (restricted just to childless single
people and married couples with only one working spouse) could reduce the hours spent
on 1040EZ forms by more than 50 million hours or up to $1 billion worth of time per
7
Gale and Holtzblatt (1997) look in detail at the issues involved in converting to a return-free system.
year. If these people were going to paid tax preparers at a cost of $150, instead of
preparing it themselves, the reform would save the 12.25 million taxpayers almost $2
billion in accountant costs. Can anyone truly claim that the costs of going return- free
strictly for the people where it would be easiest on the I.R.S. would total more than $1 to
$2 billion per year?
CONCLUSION
This paper has considered the promise and problems associated with relying on
electronic tax software as a solution to the complexity problem of the tax code. There are
two basic difficulties with relying on the technological solution. The first is that in the
near future, only a small fraction of people use such software and those that do are highly
educated and have very high incomes. The people that do not use the software tend to be
just the people for whom the losses from complexity are the greatest.
The second is that regression analysis of the individual decision of whether to use
such software or not suggests that people are not using such software because it makes
filling out their tax returns less complicated. Many individual factors associated with
more complexity such as having a complex state income tax (or a state with an income
tax at all), running a business from home, having children under six years of age, and the
like, do not increase the likelihood of using tax management software. Instead, the
driving factors seem to be computer related things such as how long the taxpayer has had
access to the Internet, whether they have ever bought things online, whether they use a
computer for family budgeting or paying bills, and whether they have a brokerage
account with online access. In other words, people use tax management software when
the costs—either price or learning costs—are low, not when the simplification benefits
are high.
An alternative approach tha t could reduce complexity for 10 to 15 million
Americans, although it might not do much to eliminate the complexity tradeoffs in policy
making, would be to eliminate many or even all 1040EZ filings and replace it with
automatic return- free filing through the employer. In the near term, the distrib utional
considerations and the limited spread of tax planning software suggest it would have a
bigger impact.
Perhaps it is also worth considering the deeper issue of whether a purely
technological solution to complexity is the right approach. In the extreme, such solutions
have the potential to make the tax system a black box—at the end of the year, a machine
tells you to pay some amount. If people do not understand the incentives embodied in the
system, they will not respond to them. On one hand, this makes the system efficie nt/nondistortionary—people will not do things just because of the tax rules. On the other hand,
the ability to influence behavior was exactly the policy makers' point of creating the
complex tax system to begin with. In the long-run, that would be lost.
BIBLIOGRAPHY
Akerlof, George (1978), “The Economics of ‘Tagging’ as Applied to the Optimal Income
Tax and Other Things," American Economic Review (March l978).
Arthur D. Little (1988), Development of the Methodology for Estimating Taxpayer
Paperwork Burden. Final Report to the Department of the Treasury, I.R.S. (June).
Becker (1983)
Becker and Mulligan (2001), “Deadweight Costs and the Size of Government,”
forthcoming, Journal of Law and Econo mics.
Bernheim (*), Financial Literacy
Berube, Alan, Anne Kim, Benjamin Forman, and Megan Burns , "The Price of Paying
Taxes: How Tax Preparation and Refund Loan Fees Erode the Benefits of the EITC,"
Center on Urban and Metropolitan Policy, Brookings Institution and Progressive Policy
Institute Survey Series, May 2002.
Blumenthal, Martha and Joel Slemrod (1992), “The Compliance Cost of the U.S.
Individual Income Tax System: A Second Look After Tax Reform,” National Tax
Journal, 45(June): 185-202.
Burman, Leonard (2002), “Comment” on Stuerle (2002) in American Economic Policy in
the 1990s, Jeffrey Frankel and Peter Orszag eds., MIT Press (Cambridge, Mass.), pp.
176-183.
Cleamons, (1999), “Guide to Technographics,” Forrester Report
Gale, William and Janet Holtzblatt (1997), “On the Possibility of a No-Return Tax
System,” National Tax Journal.
Goolsbee (2000), “In a World without Borders: The Impact of Taxes on Internet
Commerce,” Quarterly Journal of Economics, May 2000, vol 115(2), pp. 561-576.
Goolsbee and Peter Klenow (2002), “Evidence on Learning and Network Externalities in
the Diffusion of Home Computers,” Journal of Law and Economics, October.
Internal Revenue Service (2002), "Measuring Taxpayer Compliance Burden: A
Microsimulation Approach," Report, November 8.
.R.S. Bulletin, Winter 2001-2002.
I.R.S., Form 1040EZ Instruction Booklet, 2001, Government Printing Office,
Washington, D.C.
Internal Revenue Service (2003), " Costs Incurred by the Internal Revenue Service, by
Budget Activity, Fiscal Years 2000 and 2001," < http://www.irs.gov/pub/irssoi/01db29cs.xls> accessed 1/20/2003.
Intuit (2002), "Another Record Tax Year for TurboTax," press release, April 18, 2002, <
http:// www.intuit.com/company/press_releases/2002/04-18.html>, accessed January
20,2003
Kopczuk, Wojciech (2001), "Redistribution when Avoidance Behavior is
Heterogeneous," Journal of Public Economics 81(1), 51-71.
Mahoney (2001), “Online Tax Filing Firms in Battle of Goliath vs. Goliath,” ECommerce Times, March 12, http://www.ecommercetimes.com/perl/ story/8092.html,
accessed October 22, 2002.
Orszag, Peter (2002), “Summary of Discussion,” on Stuerle (2002) in American
Economic Policy in the 1990s, Jeffrey Frankel and Peter Orszag eds., MIT Press
(Cambridge, Mass.), p.188-190.
Slemrod, Joel and Nikki Sorum (1984), “The Compliance Cost of the U.S. Individual
Income Tax System,” National Tax Journal 37 (December): 461-74
Slemrod, Joel and Shlomo Yitzhaki, "The Social Cost of Taxation and the Marginal Cost
of Funds" (with Shlomo Yitzhaki). International Monetary Fund Staff Papers, pp. 172198, March 1996.
Sperling, Gene (2002), “Summary of Discussion,” on Stuerle (2002) in American
Economic Policy in the 1990s, Jeffrey Frankel and Peter Orszag eds., MIT Press
(Cambridge, Mass.), p.188-190.
Stuerle, Eugene (2002), “Tax Policy from 1990 to 2001,” in American Economic Policy
in the 1990s, Jeffrey Frankel and Peter Orszag eds., MIT Press (Cambridge, Mass.), pp.
139-169.
Toder, Eric **
http://www.intuit.com/company/press_releases/2001/05-03a.html
TABLE 1: THE USE OF TAX PLANNING AND OTHER SOFTWARE
Year
2000
2001
Share Using Tax Software
8.8%
9.9%
Use of financial planning software
Have bought online
2001 Share Reporting
22.3%
46.9%
Source: Author’s calculations
TABLE 2: MEAN DEMOGRAPHICS OF TAX PLANNING SOFTWARE USERS
Tax Software Users
Tax Software non-users
Income (in $000s)
Age
White
Single
78.3
46.8
0.92
0.21
56.8
49.9
0.89
0.32
High School or less
College
Post-Graduate
0.15
0.61
0.24
0.39
0.48
0.14
Republican
Democrat
Unaffiliated/Other
0.45
0.28
0.27
0.37
0.37
0.26
0.42
0.70
0.46
0.26
0.45
0.26
Have Mutual Funds
Have Retirement Acct.
Have Brokerage Acct.
Source: Author’s Calculations
TABLE 3: EXPLAINING THE USE OF TAX MANAGEMENT SOFTWARE
# Lines on State Income Tax
No State Income Tax
Single
1 Child Under 6 yrs old
2+ Children under 6 yrs old
Home Based Business
Male
Bought Home in Past Year
Sold Home in Past Year
(1)
OLS
-0.0003
(0.0001)
-0.0021
(0.0046)
-0.0130
(0.0034)
-0.0048
(0.0049)
-0.0051
(0.0081)
0.0041
(0.0035)
0.0123
(0.0026)
-0.0082
(0.0060)
0.0126
(0.0074)
(2)
PROBIT
-0.0003
(0.0001)
-0.0028
(0.0043)
-0.0129
(0.0031)
-0.0034
(0.0044)
-0.0037
(0.0070)
0.0045
(0.0031)
0.0111
(0.0024)
-0.0061
(0.0055)
0.0082
(0.0065)
0.0943
(0.0044)
0.1660
(0.0034)
0.1132
(0.0070)
0.0023
(0.0029)
0.0351
(0.0050)
-0.0077
(0.0048)
-0.0102
(0.0034)
-0.0145
(0.0044)
-0.0194
(0.0069)
-0.0265
(0.0079)
-0.0170
(0.0126)
-0.0265
(0.0072)
0.0408
(0.0030)
0.0368
(0.0030)
0.0100
(0.0033)
-0.0009
(0.0041)
-0.0016
0.0724
(0.0035)
0.1106
(0.0027)
0.0770
(0.0053)
0.0037
(0.0028)
0.0183
(0.0044)
-0.0075
(0.0048)
-0.0089
(0.0030)
-0.0136
(0.0039)
-0.0203
(0.0062)
-0.0350
(0.0069)
-0.0190
(0.0125)
-0.0458
(0.0064)
0.0443
(0.0027)
0.0489
(0.0031)
0.0162
(0.0033)
0.0000
(0.0035)
-0.0012
Have A Home PC
Use Microsoft Money
Use Intuit Quicken
Use other financial program
Cellular Phone
Palm Pilot or other PDA
White
Use computer 4-6 times/wk
Use computer 2-3 times/wk
Use computer 1 time/wk
Use computer 2-3 times/mo
Use computer 1/mo
Use computer <1/mo
Have Bought Online
This is not their first PC
Use computer at work
Full service broker with online
Full service broker, no online
(3)
OLS
-0.0002
(0.0001)
-0.0026
(0.0035)
-0.0112
(0.0024)
-0.0048
(0.0038)
-0.0057
(0.0063)
0.0077
(0.0028)
0.0090
(0.0020)
-0.0055
(0.0047)
0.0125
(0.0058)
-0.0304
(0.0027)
0.1072
(0.0038)
0.1842
(0.0029)
0.1204
(0.0058)
0.0056
(0.0022)
0.0373
(0.0040)
0.0003
(0.0033)
0.0163
(0.0025)
0.0013
(0.0033)
0.0007
(4)
OLS
-0.0004
(0.0001)
-0.0063
(0.0060)
-0.0092
(0.0043)
-0.0080
(0.0064)
-0.0107
(0.0104)
0.0037
(0.0045)
0.0158
(0.0035)
-0.0102
(0.0080)
0.0104
(0.0092)
(5)
OLS
-0.0004
(0.0001)
-0.0061
(0.0060)
-0.0095
(0.0043)
-0.0081
(0.0064)
-0.0110
(0.0104)
0.0037
(0.0045)
0.0158
(0.0035)
-0.0103
(0.0080)
0.0107
(0.0092)
0.0974
(0.0054)
0.1676
(0.0042)
0.1101
(0.0087)
0.0070
(0.0038)
0.0329
(0.0061)
-0.0129
(0.0064)
-0.0119
(0.0043)
-0.0139
(0.0058)
-0.0265
(0.0097)
-0.0473
(0.0121)
-0.0386
(0.0227)
-0.0608
(0.0156)
0.0426
(0.0039)
0.0434
(0.0041)
0.0083
(0.0044)
-0.0036
(0.0052)
-0.0027
0.0972
(0.0054)
0.1676
(0.0042)
0.1104
(0.0087)
0.0071
(0.0038)
0.0328
(0.0061)
-0.0128
(0.0064)
-0.0118
(0.0043)
-0.0140
(0.0058)
-0.0266
(0.0097)
-0.0475
(0.0122)
-0.0378
(0.0227)
-0.0603
(0.0156)
0.0426
(0.0039)
0.0433
(0.0041)
0.0084
(0.0044)
-0.0035
(0.0052)
-0.0028
(0.0048)
(0.0048)
0.0663
0.0663
(0.0058)
(0.0058)
Discount broker, no online
0.0002
0.0001
(0.0104)
(0.0104)
mutual funds purchase direct
0.0120
0.0120
(0.0039)
(0.0039)
mutual funds through bank
-0.0040
-0.0039
(0.0070)
(0.0070)
Retirement account w/online
0.0512
0.0512
(0.0042)
(0.0042)
Retirement account, no online
0.0145
0.0146
(0.0041)
(0.0041)
Have no investments
0.0092
0.0092
(0.0055)
(0.0055)
< High School
-0.0364
-0.0368
(0.0103)
(0.0103)
High School Diploma
-0.0336
-0.0339
(0.0059)
(0.0059)
Some College
-0.0254
-0.0257
(0.0054)
(0.0054)
College Graduate
0.0029
0.0029
(0.0049)
(0.0049)
Applied for mortgage this year
0.0068
0.0069
(0.0070)
(0.0070)
Democrat political affliation
-0.0092
-0.0092
(0.0044)
(0.0044)
Republican political affiliation
-0.0031
-0.0031
(0.0042)
(0.0042)
Income
cubic
cubic
cubic
cubic
34 dummies
Age
cubic
cubic
cubic
9 dummies
9 dummies
Dummies
Market size
Market size
Market size
Market size
Market size
Family size
Family size
Family size
Family size
Family size
Assets value
Assets value
Hrs Leisure
Hrs Leisure
Year of comp. Yr. of comp.
Observations
61,724
61,724
84,493
42,170
42,170
R-squared
0.12
-0.13
0.11
0.11
Notes: The dependent variable is a {0,1} of whether the individual reports using tax planning software.
Standard errors are in parentheses. Columns 1,3, 4, and 5 are linear probability models. Column 2 gives the
marginal effects from a Probit. Column 3 includes all people. The other columns include only people with
a home PC.
Discount broker with online
(0.0038)
0.0669
(0.0048)
0.0054
(0.0083)
0.0165
(0.0031)
-0.0095
(0.0055)
0.0497
(0.0034)
0.0166
(0.0032)
0.0084
(0.0040)
-0.0283
(0.0073)
-0.0301
(0.0046)
-0.0224
(0.0043)
0.0057
(0.0040)
(0.0033)
0.0365
(0.0037)
0.0050
(0.0069)
0.0124
(0.0027)
-0.0080
(0.0049)
0.0359
(0.0029)
0.0134
(0.0029)
-0.0046
(0.0041)
-0.0329
(0.0063)
-0.0271
(0.0038)
-0.0150
(0.0036)
0.0058
(0.0034)
(0.0030)
0.0751
(0.0040)
0.0040
(0.0065)
0.0145
(0.0025)
-0.0105
(0.0042)
0.0466
(0.0027)
0.0150
(0.0026)
0.0098
(0.0030)
-0.0286
(0.0048)
-0.0348
(0.0035)
-0.0252
(0.0034)
0.0042
(0.0032)