1
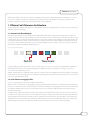
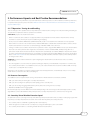
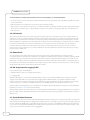
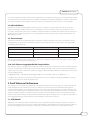
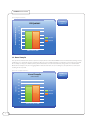
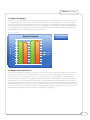
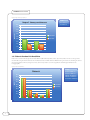
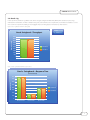
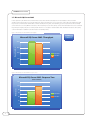
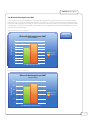
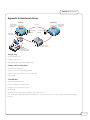
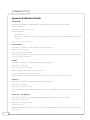
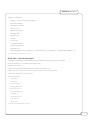
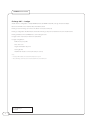
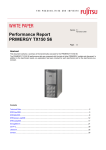
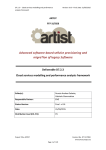
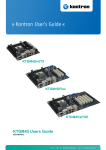
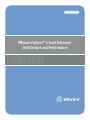
WHITE
VMware vSphere™ 4 Fault Tolerance:
Architecture and Performance
PAPER
VMware white paper
Table of Contents
1. VMware Fault Tolerance Architecture . . . . . . . . . . . . . . . . . . . . . . . . . . . . . . . . . . . . . . . . . . 3
1.1. Deterministic Record/Replay . . . . . . . . . . . . . . . . . . . . . . . . . . . . . . . . . . . . . . . . . . . . . . . . . . . . . . . . . . . . . . . . . . . .
1.2. Fault Tolerance . . . . . . . . . . . . . . . . . . . . . . . . . . . . . . . . . . . . . . . . . . . . . . . . . . . . . . . . . . . . . . . . . . . . . . . . . . . . . . . . .
1.3. VMware vLockstep Interval . . . . . . . . . . . . . . . . . . . . . . . . . . . . . . . . . . . . . . . . . . . . . . . . . . . . . . . . . . . . . . . . . . . . .
1.4. Transparent Failover . . . . . . . . . . . . . . . . . . . . . . . . . . . . . . . . . . . . . . . . . . . . . . . . . . . . . . . . . . . . . . . . . . . . . . . . . . . .
3
3
4
4
2. Performance Aspects and Best Practice Recommendations . . . . . . . . . . . . . . . . . . . . . 5
2.1. FT Operations: Turning On and Enabling . . . . . . . . . . . . . . . . . . . . . . . . . . . . . . . . . . . . . . . . . . . . . . . . . . . . . . . .
2.2. Resource Consumption . . . . . . . . . . . . . . . . . . . . . . . . . . . . . . . . . . . . . . . . . . . . . . . . . . . . . . . . . . . . . . . . . . . . . . . . .
2.3. Secondary Virtual Machine Execution Speed . . . . . . . . . . . . . . . . . . . . . . . . . . . . . . . . . . . . . . . . . . . . . . . . . . . .
2.4. I/O Latencies . . . . . . . . . . . . . . . . . . . . . . . . . . . . . . . . . . . . . . . . . . . . . . . . . . . . . . . . . . . . . . . . . . . . . . . . . . . . . . . . . . .
2.5. Network Link . . . . . . . . . . . . . . . . . . . . . . . . . . . . . . . . . . . . . . . . . . . . . . . . . . . . . . . . . . . . . . . . . . . . . . . . . . . . . . . . . . .
2.6. NIC Assignments for Logging Traffic . . . . . . . . . . . . . . . . . . . . . . . . . . . . . . . . . . . . . . . . . . . . . . . . . . . . . . . . . . . . .
2.7. Virtual Machine Placement . . . . . . . . . . . . . . . . . . . . . . . . . . . . . . . . . . . . . . . . . . . . . . . . . . . . . . . . . . . . . . . . . . . . .
2.8. DRS and VMotion . . . . . . . . . . . . . . . . . . . . . . . . . . . . . . . . . . . . . . . . . . . . . . . . . . . . . . . . . . . . . . . . . . . . . . . . . . . . . . .
2.9. Timer Interrupts . . . . . . . . . . . . . . . . . . . . . . . . . . . . . . . . . . . . . . . . . . . . . . . . . . . . . . . . . . . . . . . . . . . . . . . . . . . . . . . .
2.10. Fault Tolerance Logging Bandwidth Sizing Guideline . . . . . . . . . . . . . . . . . . . . . . . . . . . . . . . . . . . . . . . . . . .
5
5
5
6
6
6
6
7
7
7
3. Fault Tolerance Performance . . . . . . . . . . . . . . . . . . . . . . . . . . . . . . . . . . . . . . . . . . . . . . . . . . 7
3.1. SPECjbb2005 . . . . . . . . . . . . . . . . . . . . . . . . . . . . . . . . . . . . . . . . . . . . . . . . . . . . . . . . . . . . . . . . . . . . . . . . . . . . . . . . . . . 7
3.2. Kernel Compile . . . . . . . . . . . . . . . . . . . . . . . . . . . . . . . . . . . . . . . . . . . . . . . . . . . . . . . . . . . . . . . . . . . . . . . . . . . . . . . . . 8
3.3. Netperf Throughput . . . . . . . . . . . . . . . . . . . . . . . . . . . . . . . . . . . . . . . . . . . . . . . . . . . . . . . . . . . . . . . . . . . . . . . . . . . . 9
3.4. Netperf Latency Bound Case . . . . . . . . . . . . . . . . . . . . . . . . . . . . . . . . . . . . . . . . . . . . . . . . . . . . . . . . . . . . . . . . . . . . 9
3.5. Filebench Random Disk Read/Write . . . . . . . . . . . . . . . . . . . . . . . . . . . . . . . . . . . . . . . . . . . . . . . . . . . . . . . . . . . . 10
3.6. Oracle 11g . . . . . . . . . . . . . . . . . . . . . . . . . . . . . . . . . . . . . . . . . . . . . . . . . . . . . . . . . . . . . . . . . . . . . . . . . . . . . . . . . . . . 11
3.7. Microsoft SQL Server 2005 . . . . . . . . . . . . . . . . . . . . . . . . . . . . . . . . . . . . . . . . . . . . . . . . . . . . . . . . . . . . . . . . . . . . . 12
3.8. Microsoft Exchange Server 2007 . . . . . . . . . . . . . . . . . . . . . . . . . . . . . . . . . . . . . . . . . . . . . . . . . . . . . . . . . . . . . . . 13
4. VMware Fault Tolerance Performance Summary . . . . . . . . . . . . . . . . . . . . . . . . . . . . . . . 14
5. Conclusion . . . . . . . . . . . . . . . . . . . . . . . . . . . . . . . . . . . . . . . . . . . . . . . . . . . . . . . . . . . . . . . . . . 14
Appendix A: Benchmark Setup . . . . . . . . . . . . . . . . . . . . . . . . . . . . . . . . . . . . . . . . . . . . . . . . . 15
Storage Array . . . . . . . . . . . . . . . . . . . . . . . . . . . . . . . . . . . . . . . . . . . . . . . . . . . . . . . . . . . . . . . . . . . . . . . . . . . . . . . . . . . . . 15
Primary and Secondary Hosts . . . . . . . . . . . . . . . . . . . . . . . . . . . . . . . . . . . . . . . . . . . . . . . . . . . . . . . . . . . . . . . . . . . . . . 15
Client Machine . . . . . . . . . . . . . . . . . . . . . . . . . . . . . . . . . . . . . . . . . . . . . . . . . . . . . . . . . . . . . . . . . . . . . . . . . . . . . . . . . . . . 15
Appendix B: Workload Details . . . . . . . . . . . . . . . . . . . . . . . . . . . . . . . . . . . . . . . . . . . . . . . . . . 16
SPECjbb2005 . . . . . . . . . . . . . . . . . . . . . . . . . . . . . . . . . . . . . . . . . . . . . . . . . . . . . . . . . . . . . . . . . . . . . . . . . . . . . . . . . . . . . . 16
Kernel Compile . . . . . . . . . . . . . . . . . . . . . . . . . . . . . . . . . . . . . . . . . . . . . . . . . . . . . . . . . . . . . . . . . . . . . . . . . . . . . . . . . . . . 16
Netperf . . . . . . . . . . . . . . . . . . . . . . . . . . . . . . . . . . . . . . . . . . . . . . . . . . . . . . . . . . . . . . . . . . . . . . . . . . . . . . . . . . . . . . . . . . . 16
Filebench . . . . . . . . . . . . . . . . . . . . . . . . . . . . . . . . . . . . . . . . . . . . . . . . . . . . . . . . . . . . . . . . . . . . . . . . . . . . . . . . . . . . . . . . . 16
Oracle 11g — Swingbench . . . . . . . . . . . . . . . . . . . . . . . . . . . . . . . . . . . . . . . . . . . . . . . . . . . . . . . . . . . . . . . . . . . . . . . . 16
MSSQL 2005 — DVD Store Benchmark . . . . . . . . . . . . . . . . . . . . . . . . . . . . . . . . . . . . . . . . . . . . . . . . . . . . . . . . . . . . . 17
Exchange 2007 — Loadgen . . . . . . . . . . . . . . . . . . . . . . . . . . . . . . . . . . . . . . . . . . . . . . . . . . . . . . . . . . . . . . . . . . . . . . . . 18
2
VMware white paper
VMware® Fault Tolerance (FT) provides continuous availability to virtual machines, eliminating downtime and disruption — even in
the event of a complete host failure. This whitepaper gives a brief description of the VMware FT architecture and discusses the
performance implication of this feature with data from a wide variety of workloads.
1. VMware Fault Tolerance Architecture
The technology behind VMware Fault Tolerance is called VMware® vLockstep. The following sections describe some of the key aspects
of VMware vLockstep technology.
1.1. Deterministic Record/Replay
Deterministic Record/Replay is a technology introduced with VMware Workstation 6.0 that allows for capturing the execution of a
running virtual machine for later replay. Deterministic replay of computer execution is challenging since external inputs like incoming
network packets, mouse, keyboard, and disk I/O completion events operate asynchronously and trigger interrupts that alter the code
execution path. Deterministic replay could be achieved by recording non-deterministic inputs and then by injecting those inputs at
the same execution point during replay (see Figure 1). This method greatly reduces processing resources and space as compared to
exhaustively recording and replaying individual instructions.
Figure 1. Event Injection during Replay
Disk I/O
Timer Event
In order to efficiently inject the inputs at the correct execution point, some processor changes were required. VMware collaborated
with AMD and Intel to make sure all currently shipping Intel and AMD server processors support these changes. See KB article
1008027 for a list of supported processors.
VMware currently supports record/replay only for uniprocessor virtual machines. Record/Replay of symmetric multi-processing (SMP)
virtual machines is more challenging because in addition to recording all external inputs, the order of shared memory access also has
to be captured for deterministic replay.
1.2. Fault Tolerance Logging Traffic
Figure 2 shows the high level architecture of VMware Fault Tolerance.
VMware FT relies on deterministic record/replay technology described above. When VMware FT is enabled for a virtual machine (“the
primary”), a second instance of the virtual machine (the “secondary”) is created by live-migrating the memory contents of the primary
using VMware® VMotion™. Once live, the secondary virtual machine runs in lockstep and effectively mirrors the guest instruction
execution of the primary.
The hypervisor running on the primary host captures external inputs to the virtual machine and transfers them asynchronously to the
secondary host. The hypervisor running on the secondary host receives these inputs and injects them into the replaying virtual machine
at the appropriate execution point. The primary and the secondary virtual machines share the same virtual disk on shared storage, but
all I/O operations are performed only on the primary host. While the hypervisor does not issue I/O produced by the secondary, it posts
all I/O completion events to the secondary virtual machine at the same execution point as they occurred on the primary.
3
VMware white paper
Figure 2. High Level Architecture of VMware Fault Tolerance
Primary
Secondary
APP
OS
APP
OS
FT Logging Traffic
VM
VM
wa
re
wa
re
ACKs
Record
Client
Replay
Shared Storage
The communication channel between the primary and the secondary host is established by the hypervisor using a standard
TCP/IP socket connection and the traffic flowing between them is called FT logging traffic. By default, incoming network traffic and
disk reads at the primary virtual machine are captured and sent to the secondary, but it is also possible to make the secondary virtual
machine read disk I/O directly from the disk. See KB article 1011965 for more information about this alternative mode.
1.3. VMware vLockstep Interval
The primary virtual machine’s execution is always ahead of the secondary with respect to physical time. However, with respect to
virtual time, both the primary and secondary progress in sync with identical execution state. While the secondary’s execution lags
behind the primary, the vLockstep mechanism ensures that the secondary always has all the information in the log to reach the same
execution point as the primary. The physical time lag between the primary and secondary virtual machine execution is denoted as
the vLockstep interval in the FT summary status page.
Figure 3: vLockstep Interval in the FT Summary Status Page
The vLockstep interval is calculated as a moving average and it assumes that the round-trip network latency between the primary
and secondary hosts is constant. The vLockstep interval will increase if the secondary virtual machine lacks sufficient CPU cycles to
keep up with the primary. Under this circumstance, whenever the primary virtual machine becomes idle (for example while waiting
for an I/O completion) the secondary will catch up and the vLockstep interval will reduce. If the vLockstep interval is consistently
high, the hypervisor may slow the primary virtual machine to let the secondary catch up.
1.4. Transparent Failover
FT ensures that there is no or data or state loss in the virtual machine when the failover happens. Also, after a failover, the new
primary will perform no I/O that is inconsistent with anything previously issued by the old primary. This is achieved by ensuring that
the hypervisor at the primary commits to any externally visible action, such as network transmits or disk writes, only after receiving an
acknowledgement from the secondary that it has received all the log events preceding that event.
4
VMware white paper
2. Performance Aspects and Best Practice Recommendations
This section describes the performance aspects of Fault Tolerance with best practices recommendations to maximize performance.
For operational best practices please refer to the VMware Fault Tolerance Recommendations and Considerations on VMware
vSphere 4 White Paper.
2.1. FT Operations: Turning On and Enabling
There are two types of FT operations that can be performed on a virtual machine: Turning FT on or off, and enabling or disabling FT.
The performance implications of these operations are as follows:
“Turn On FT” prepares the virtual machine for FT.
• When FT is turned on, devices that are not supported with FT are prompted for removal, and the virtual machines memory
reservation is set to its memory size to prevent ballooning or swapping.
• Use of processor’s hardware MMU feature (AMD RVI/Intel EPT) results in non-determinism and therefore it is not supported
with FT. When FT is turned on for a virtual machine, hardware MMU feature is disabled for that virtual machine. However, virtual
machines that don’t have FT turned on can take advantage of hardware MMU on the same host.
• Turning on FT will not succeed if the virtual machine is powered on and is using Hardware MMU. In this case, the virtual machine
first needs to be either powered off, or migrated to a host that does not have hardware MMU. Similarly turning off FT on a
powered-on virtual machine would not make the virtual machine automatically use hardware MMU; the virtual machine would
need to be powered off and powered back on or migrated to a host that supports hardware MMU for the changes to take effect.
Please see KB article 1008027 for more information on which guest OS and CPU combination requires power on/off operations
for changes to take effect.
“Enable FT” operation enables Fault Tolerance by live-migrating the virtual machine to another host to create a secondary
virtual machine.
• Since live-migration is a resource-intensive operation, limiting the frequency of enable/disable FT operations is recommended.
• The secondary virtual machine uses additional resources on your cluster. Therefore if the cluster has insufficient CPU or memory
resources, the secondary will not be created.
When “Turn on FT” operation succeeds for a virtual machine that is already powered on, it automatically creates a new secondary
virtual machine. So it has the same effect as “Enabling FT”.
2.2. Resource Consumption
The additional resource requirements for running a virtual machine with Fault Tolerance enabled are as follows:
• CPU cycles and memory for running the secondary virtual machine
• CPU cycles for recording on the primary host and replaying on the secondary host
• CPU cycles for sending FT logging traffic from the primary host and receiving it on the secondary
• Network bandwidth for the FT logging traffic
Record and replay may consume different amounts of CPU depending on the event being recorded and replayed, and as a result,
slight differences in the CPU utilization of the primary and the secondary virtual machines is common and can be ignored.
2.3. Secondary Virtual Machine Execution Speed
As explained in section 1.3, the hypervisor may slow down the primary virtual machine if the secondary is not keeping up pace with
the primary. Secondary virtual machine execution can be slower than the primary for a variety of reasons:
• The secondary host has a CPU with a significantly lower clock frequency
• Power management is enabled on the secondary host, causing the CPU frequency to be scaled down
• The secondary virtual machine is contending for CPU with other virtual machines
5
VMware white paper
To ensure that the secondary virtual machine runs as fast as the primary, it is recommended that:
• The hosts in the FT cluster are homogenous, with similar CPU make, model, and frequency. The CPU frequency difference should
not exceed 400 MHz.
• Both the primary and secondary hosts use the same power management policy.
• CPU reservation is set to full for cases where the secondary host could be overloaded. The CPU reservation setting on the primary
applies to the secondary as well, so setting full CPU reservation ensures that the secondary gets CPU cycles even when there is
CPU contention.
2.4. I/O Latencies
All incoming network packets to the primary, and all disk reads at the primary, are immediately sent to the secondary. However, as
explained in section 1.4, network transmits and disk writes at the primary are held until the secondary acknowledges that all events
that precede the packet transmit or disk write. As a result, the round-trip network latency between the primary and the secondary
affects the I/O latency of disk writes and network transmit operations. Since the round trip latency in a LAN environment is usually in
the order of a few hundred microseconds, and disk I/O latencies are usually on the order of a few milliseconds, this delay does
not impact disk write operations. One may, however, notice delays in network ping responses if the response time is shown in
microseconds. For best performance, it is recommended that the round-trip network latency between the primary and secondary
host be less than 1 millisecond.
2.5. Network Link
Since the primary and secondary virtual machines proceed in vLockstep, the network link between the primary and the
secondary host plays an important role in performance. A Gigabit link is required to avoid congestion. In addition, higher bandwidth
network interfaces generally have lower transmission latency. If the network is congested and the primary host is not able to send
traffic to the secondary (i.e. when the TCP window is full), then the primary virtual machine will make little or no forward progress. If
the network connection between the primary and secondary hosts goes down, either the current primary or the current secondary
virtual machine will take over, and the other virtual machine will die.
2.6. NIC Assignments for Logging Traffic
FT generates two types of network traffic:
• Migration traffic to create the secondary virtual machine
• FT logging traffic
Migration traffic happens over the NIC designated for VMotion and it causes network bandwidth usage to spike for a short time.
Separate and dedicated NICs are recommended for FT logging traffic and VMotion traffic, especially when multiple FT virtual
machines reside on the same host. Sharing the same NIC for both FT logging and VMotion can affect the performance of FT virtual
machines whenever a secondary is created for another FT pair or a VMotion operation is performed for any other reason.
VMware vSwitch networking allows you to send VMotion and FT traffic to separate NICs while also using them as redundant links for
NIC failover. See KB article 1011966 for more information.
Adding multiple uplinks to the virtual switch does not automatically result in distribution of FT logging traffic. If there are multiple FT
pairs, then traffic could be distributed with IP-hash based load balancing policy, and by spreading the secondary virtual machines to
different hosts.
2.7. Virtual Machine Placement
FT logging traffic is asymmetric: the bulk of the traffic flow happens from the primary to the secondary hosts and the secondary host
only sends back acknowledgements. If multiple primary virtual machines are co-located on the same host, they could all compete for
the same network bandwidth on the logging NIC. Idle virtual machines consume less bandwidth, but I/O-intensive virtual machines
can consume a lot of network bandwidth. It can be helpful to place the primary of one FT pair and the secondary of another FT pair
on the same host to balance the traffic on the FT logging NIC.
6
VMware white paper
It is recommended that FT primary virtual machines be distributed across multiple hosts and, as a general rule of thumb, the number
of FT virtual machines be limited to four per host. In addition to avoiding the possibility of saturating the network link, it also reduces
the number of simultaneous live migrations required to create new secondary virtual machines in the event of a host failure.
2.8. DRS and VMotion
DRS takes into account the additional CPU and memory resources used by the secondary virtual machine in the cluster, but
DRS does not migrate FT enabled virtual machines to load balance the cluster. If either the primary or secondary dies, a new
secondary is spawned and is placed on the candidate host determined by HA. The candidate host determined by HA may not be an
optimal placement for balancing, however one can manually VMotion either the primary or the secondary virtual machines to a
different host as needed.
2.9. Timer Interrupts
Though timer interrupts do not significantly impact FT performance, all timer interrupt events must be recorded at the primary
and replayed at the secondary. This means that having a lower timer interrupt rate results in a lower volume of FT logging traffic.
The following table illustrates this.
Guest OS
Timer interrupt rate
Idle VM FT traffic
RHEL 5.0 64-bit
1000 Hz
1.43 Mbits/sec
SLES 10 SP2 32-bit
250 Hz
0.68 Mbits/sec
Windows 2003 Datacenter Edition
82 Hz
0.15 Mbits/sec
Where possible, lowering the timer interrupt rate is recommended. See KB article 1005802 for more information on how to reduce
timer interrupt rates for Linux guest operating systems.
2.10. Fault Tolerance Logging Bandwidth Sizing Guideline
As described in section 1.2, FT logging network traffic depends on the number of non-deterministic events and external inputs that
need to be recorded at the primary virtual machine. Since the majority of this traffic usually consists of incoming network packets
and disk reads, it is possible to estimate the amount of FT logging network bandwidth (in Mbits/sec) required for the virtual machine
using the following formula:
FT logging bandwidth ~= [ (Average disk read throughput in Mbytes/sec * 8) + Average network receives (Mbits/sec) ] * 1.2
In addition to the inputs to the virtual machine, this formula reserves 20 percent additional networking bandwidth for recording
non-deterministic CPU events and for the TCP/IP headers.
3. Fault Tolerance Performance
This section discusses the performance characteristics of Fault Tolerant virtual machines using a variety of micro-benchmarks and
real-life workloads. Micro-benchmarks were used to stress CPU, disk, and network subsystems individually by driving them to
saturation. Real life workloads, on the other hand, have been chosen to be representative of what most customers would run and
they have been configured to have a CPU utilization of 60 percent in steady state. Identical hardware test beds were used for all the
experiments, and the performance comparison was done by running the same workload on the same virtual machine with and
without FT enabled. The hardware and experimental setup details are provided in the Appendix. For each experiment, the traffic on
the FT logging NIC during the steady state portion of the workload is also provided as a reference.
3.1. SPECjbb2005
SPECjbb2005 is an industry standard benchmark that measures Java application performance with particular stress on CPU and
memory. The workload is memory intensive and saturates the CPU but does little I/O. Because this workload saturates the CPU and
generates little logging traffic, its FT performance is dependent on how well the secondary can keep pace with the primary.
7
VMware white paper
Figure 4. SPECjbb2005 Performance
FT traffic:
Relative performance (%)
SPECjbb2005
1.4 Mbits/sec
120
100
80
60
FT Disabled
40
FT Enabled
20
0
RHEL 5 64-bit, 4GB
3.2. Kernel Compile
This experiment shows the time taken to do kernel compile, which is both CPU and MMU intensive workload due to forking of many
parallel processes. As with the previous experiment, CPU is 100 percent utilized and thus FT performance is dependent on how well
the secondary can keep pace with the primary. This workload does some disk reads and writes, but generates no network traffic.
Besides timer interrupt events, the FT logging traffic includes the disk reads. As seen in theFigure 5, the performance overhead of
enabling FT was very small.
Figure 5. Kernel Compilation Performance
FT traffic:
3 Mbits/sec
Kernel Compile
(lower is better)
350
300
Seconds
250
200
FT Disabled
150
FT Enabled
100
50
0
SLES 10 32-bit, 512MB
8
VMware white paper
3.3. Netperf Throughput
Netperf is a micro-benchmark that measures the throughput of sending and receiving network packets. In this experiment netperf
was configured so packets could be sent continuously without having to wait for acknowledgements. Since all the receive traffic
needs to be recorded and then transmitted to the secondary, netperf Rx represents a workload with significant FT logging traffic.
As shown inFigure 6, with FT enabled, the virtual machine received 890 Mbits/sec of traffic while generating and sending 950 Mbits/
sec of logging traffic to the secondary. Transmit traffic, on the other hand, produced relatively little FT logging traffic, mostly from
acknowledgement responses and transmit completion interrupt events.
Figure 6. Netperf Throughput
FT traffic Rx: 950 Mbits/sec
Netperf throughput
FT traffic Tx: 54 Mbits/sec
1000
900
800
Mbits/sec
700
600
500
FT Disabled
400
FT Enabled
300
200
100
0
Receives
Transmits
3.4. Netperf Latency Bound Case
In this experiment, netperf was configured to use the same message and socket size so that outstanding messages could only be
sent one at a time. Under this setup, the TCP/IP stack of the sender has to wait for an acknowledgment response from the receiver
before sending the next message and, thereby, any increase in latency results in a corresponding drop in network throughput.
Note in reality almost all applications send multiple messages without waiting for acknowledgement, so application throughput is
not impacted by any increase in network latency. However since this experiment was purposefully designed to test the worst-case
scenario, the throughput was made dependent on the network latency. There are not any known real world applications that would
exhibit this behavior. As discussed in section 1.4, when FT is enabled, the primary virtual machine delays the network transmit until
the secondary acknowledges that it has received all the events preceding the transmission of that packet. As expected, FT enabled
virtual machines had higher latencies which caused a corresponding drop in throughput.
9
VMware white paper
Figure 7. Netperf Latency Comparison
FT traffic
Netperf - latency sensitive case
Rx: 500 Mbits/sec
1000
Tx: 36 Mbits/sec
900
800
Mbits/sec
700
600
500
FT Disabled
400
FT Enabled
300
200
100
0
Receives
Transmits
3.5. Filebench Random Disk Read/Write
Filebench is a benchmark designed to simulate different I/O workload profiles. In this experiment, filebench was used to generate
random I/Os using 200 worker threads. This workload saturates available disk bandwidth for the given block size. Enabling FT did not
impact throughput; however, at large block sizes, disk read operations consumed significant networking bandwidth on the
FT logging NIC.
Figure 8. Filebench Performance
FT traffic
Filebench
2K read: 155 Mbits/sec
2K write: 3.6 Mbits/sec
9000
64K read: 1400 Mbits/sec
8000
64K write: 1.96 Mbits/sec
7000
2K read/write: 34 Mbits/sec
IOPS
6000
5000
FT Disabled
4000
FT Enabled
3000
2000
1000
0
2KB read
10
64KB read
2KB write
64KB write 2KB read/write
VMware white paper
3.6. Oracle 11g
In this experiment, an Oracle 11g database was driven using the Swingbench Order Entry OLTP (online transaction processing)
workload. This workload has a mixture of CPU, memory, disk, and network resource requirements. 80 simultaneous database sessions
were used in this experiment. Enabling FT had negligible impact on throughput as well as latency of transactions.
Figure 9. Oracle 11g Database Performance (throughput)
FT traffic:
Oracle Swingbench - Throughput
11 – 14 Mbits/sec
5000
Operations/min
4500
4000
3500
3000
2500
FT Disabled
2000
FT Enabled
1500
1000
500
0
Figure 10. Oracle 11g Database Performance (response time)
Oracle - Swingbench = Response Time
(lower is better)
800
700
Milliseconds
600
500
400
FT Disabled
300
FT Enabled
200
100
0
Browse Product
Process Order
Browse Order
11
VMware white paper
3.7. Microsoft SQL Server 2005
In this experiment, the DVD Store benchmark was used to drive the Microsoft SQL Server® 2005 database. This benchmark
simulates online transaction processing of a DVD store. Sixteen simultaneous user sessions were used to drive the workload. As with
the previous benchmark, this workload has a mixture of CPU, memory, disk, and networking resource requirements. Microsoft SQL
Server however issues many RDTSC instructions, which read the processor time stamp counter. This information has to be recorded at
the primary and replayed by the secondary virtual machine. As a result, the network traffic of this workload includes the time stamp
counter information in addition to the disk reads and network packets.
Figure 11. Microsoft SQL Server 2005 Performance (throughput)
FT traffic:
Microsoft SQL Server 2005 - Throughput
18 Mbits/sec
Operations/min
2000
1500
1000
FT Disabled
FT Enabled
500
0
Figure 12. Microsoft SQL Server 2005 Performance (response time)
Microsoft SQL Server 2005 - Response Time
(lower is better)
120
Milliseconds
100
80
60
FT Disabled
40
FT Enabled
20
0
Avgerage Response Time
12
VMware white paper
3.8. Microsoft Exchange Server 2007
In this experiment, the Loadgen workload was used to generate load against Microsoft Exchange Server 2007. A heavy user profile
with 1600 users was used. This benchmark measures latency of operations as seen from the client machine. The performance charts
below report both average latency and 95th percentile latency for various Exchange operations. The generally accepted threshold for
acceptable latency is 500 ms for the Send Mail operation. While FT caused a slight increase, the observed SendMail latency was well
under 500 ms with and without FT.
Figure 13. Microsoft Exchange Server 2007 Performance
FT traffic:
Microsoft Exchange Server 2007
13 to 20 Mbits/sec
(lower is better)
80
70
Milliseconds
60
50
40
FT Disabled
30
FT Enabled
20
10
0
Send Mail Average Latency
Figure 14. Microsoft Exchange Server 2007 Performance
Microsoft Exchange Server 2007
(lower is better)
250
Milliseconds
200
150
FT Disabled
100
FT Enabled
50
0
Send Mail 95 Percentile Latency
13
VMware white paper
4. VMware Fault Tolerance Performance Summary
All Fault Tolerance solutions rely on redundancy. Additional CPU and memory resources are required to mirror the execution of a
running virtual machine instance. Also, some amount of CPU is required for recording, transferring, and replaying log events. The
amount of CPU required is mostly dependent on incoming I/O. If the primary virtual machine is constantly busy and resource
constraints at the secondary prohibit catching up, the primary virtual machine will be de-scheduled to allow the secondary to
catch up.
The round-trip network latency between the primary and the secondary hosts affects the I/O latency for disk writes and network
transmits. Impact on disk write operation, however, is minimal since the round trip latency is usually only on the order of a few
hundred microseconds, and disk I/O operations have latencies in milliseconds.
When there is sufficient CPU headroom for record/replay, and sufficient network bandwidth to handle the logging traffic, enabling
FT has very little impact on throughput. Real-life workloads exhibit very small, generally user imperceptible latency increase with
Fault Tolerance enabled.
5. Conclusion
VMware Fault Tolerance is a revolutionary new technology that VMware is introducing with vSphere. The architecture and design of
VMware vLockstep technology allows hardware-style Fault Tolerance on single-CPU virtual machines with minimal impact to
performance. Experiments with a wide variety of synthetic and real-life workloads show that the performance impact on throughput
and latency is small. These experiments also demonstrate that a Gigabit link is sufficient for even the most demanding workloads.
14
VMware white paper
Appendix A: Benchmark Setup
Primary
Intel Xeon E5440
2.8GHz – 8 CPUs
8GB of RAM
Secondary
Cross cable
APP
OS
VM
wa
re
Intel Optin XF SR
10GB NIC
Intel NC364T
Quadport Gigabit
APP
OS
Intel Optin XF SR
10GB NIC
VM
wa
re
ESXi 4.0
ESXi 4.0
Client
Intel Xeon E5440
2.8GHz – 8 CPUs
8GB of RAM
EMC Clariion CX3-20
Flare OS 03.2.6.020.5.011
AMD Operteron
Processor 275 – 4 CPUs
2.21GHz 8GB of RAM
Storage Array
System: ClariiON CX3-20
FLARE OS: 03.26.020.5.011
LUNs: RAID 5 LUNs (6 disks), RAID 0 LUNS (6 disks)
Primary and Secondary Hosts
System: Dell PowerEdge 2950
Processor: Intel® Xeon® CPU E5440 @ 2.83GHz
Number of cores: 8; Number of sockets: 2; L2 cache: 6M
Memory: 8GB
Client Machine
System: HP Proliant DL385 G1
Processor: AMD Opteron 275 @2.21 Ghz
Number of cores: 4, Number of sockets: 2
Memory: 8GB
OS: Windows Server 2003 R2 Enterprise Edition, Service Pack 2, 32-bit
NICs: Two Broadcom HP NC7782 Gigabit Ethernet NICs, one connected to the LAN, one connected via private switch to the primary
ESX host.
15
VMware white paper
Appendix B: Workload Details
SPECjbb2005
Virtual machine configuration: 1 vCPU, 4GB RAM, Enhanced VMXNET virtual NIC, LSI Logic virtual SCSI adapter
OS version: RHEL5.1, x64
Java Version: JRockit R27.4.0, Java 1.6.0_22
Benchmark parameters:
No of warehouses: Two
J VM Parameters: -XXaggressive -Xgc:parallel -XXcompactratio8 -XXminblocksize32k -XXlargeObjectLimit=4k -Xmx1024m -Xms1024m
Note: Scores for the first warehouse run were ignored.
Kernel Compile
Virtual machine configuration: 1 vCPU, 1GB RAM, LSI Logic Virtual SCSI adapter
OS version: SLES 10 SP2 x86_64
Kernel version: 2.16.16.60-0-21-default
Benchmark details: Time taken to compile (make bzImage) Linux kernel 2.6.20 was measured. Experiment was repeated 5 times and
the average run time was reported.
Netperf
Virtual machine configuration: 1 vCPU, 1GB RAM, LSI Logic Virtual SCSI adapter
OS version: SLES 10 SP2 x86_64
Kernel version: 2.16.16.60-0-21-default
Netperf configuration for throughput case: Remote and local
Message size: 8K, Remote and local socket size: 64K
Netperf configuration for latency sensitive case: Remote and local message size: 8K; Remote and local socket size: 8K
Filebench
Virtual machine configuration: 1 vCPU, 1GB RAM, LSI Logic Virtual SCSI adapter
OS version: SLES 10 SP2 x86_64
Kernel version: 2.16.16.60-0-21-default
Filebench configuration: IO size :2K, 64K shadow threads: 200, disk type: raw, directIO:1, usermode: 0, personality: oltp_read, runtime:
300 secs
Oracle 11g — Swingbench
Virtual machine configuration: 1 vCPU, 4GB RAM, Enhanced VMXNET virtual NIC, LSI Logic virtual SCSI adapter
OS version: SLES 10 SP2, x86_64
Kernel version: 2.16.16.60-0-21-default
Oracle Version: 11.1.0.6.0
Database Details: Max number of processes – 150; SGA buffer size: 1535MB; Data file size: 23GB, index, redo and database files on the
same location
16
VMware white paper
Swingbench configuration:
Swingbench version: 2.2, Calling Circle Database
No of orders: 23550492
No of Customers: 864967
Runtime: 30 mins
ODBC driver: ojdbc6.jar
Driver Type: Thin
No of Users: 80
Pooled: 1
LogonDelay: 0
Transaction MinDelay: 50
Transaction MaxDelay: 250
QueryTimeout: 60
Workload Weightage: NewCustomerProcess – 20, BrowseProducts – 50, ProcessOrders – 10, BrowseAndUpdateOrders – 50
Note: Database was restored from backup before every run
MSSQL 2005 — DVD Store Benchmark
Virtual machine configuration: 1 vCPU, 4GB RAM, Enhanced VMXNET virtual NIC, LSI Logic virtual SCSI adapter
OS version: Windows Server 2003 R2 Datacenter Edition, 64 bit
MSSQL version: 9.0.1399
Database Size: 20,2971MB (~200GB), split into two vmdk files of 150GB size each
Database row count: 200,000,000 customers, 10,000,000 orders per month, 1,000,000 products
Dell DVD Store benchmark version: 2007/12/03
Benchmark parameters
n_threads: 16
ramp_rate: 2
run_time: 30 mins
warmup_time: 4 mins
think_time: 0.40 secs
pct_newcsutomers: 40
n_searches: 5
search_batch_size: 8
n_line_items: 10
db_size_str: L
Note: Database was restored from backup after every run
17
VMware white paper
Exchange 2007 — Loadgen
Virtual machine configuration: 1 vCPU, 4GB RAM, Enhanced VMXNET virtual NIC, LSI Logic virtual SCSI adapter
OS version: Windows Server 2003 R2, Datacenter Edition, 64-bit
Exchange version: Exchange Server 2007 SP1, 64-bit version (08.01.0240.006)
Exchange configuration: AD, Mail Hub, IIS and all other Exchange components installed on the same virtual machine
Exchange Database: Two 150GB databases, each hosting 800 users
Loadgen version: 08.02.0045, 32-bit version (4/25/2008)
Loadgen configuration:
Profile: Heavy user profile
Users: 1600 users
Length of Simulation day: 8 hrs
Test length: 4hrs
Total Number of tasks: 107192 (1.24 tasks per second)
Notes:
• Exchange mailbox database was restored from backup before every run
• Microsoft Exchange Search Indexer Service was disabled when the benchmark was run
VMware vSphere 4 Fault Tolerance: Architecture and Performance
Source: Technical Marketing, SD
Revision: 20090811
18
VMware, Inc. 3401 Hillview Ave Palo Alto CA 94304 USA Tel 877-486-9273 Fax 650-427-5001 www.vmware.com
Copyright © 2009 VMware, Inc. All rights reserved. This product is protected by U.S. and international copyright and intellectual
property laws. VMware products are covered by one or more patents listed at http://www.vmware.com/go/patents.
VMware is a registered trademark or trademark of VMware, Inc. in the United States and/or other jurisdictions. All other
marks and names mentioned herein may be trademarks of their respective companies. VMW_09Q2_WP_vSphere_FaultTolerance_P19_R1