
1
Oracle9i Application Server
Oracle HTTP Server powered by Apache Performance Guide
Release 1.0.2 for AIX-Based Systems, Compaq Tru64 UNIX, HP 9000 Series HP-UX,
Linux Intel, and Sun Solaris Intel
October 2000
Part No. A86828-01
Oracle9i Application Server Oracle HTTP Server powered by Apache Performance Guide, Release 1.0.2
Part No. A86828-01
Copyright © 2000, Oracle Corporation. All rights reserved.
Authors: Pallavi Bhowmik, and Julia Pond.
Contributors: Corinne Arne, Rupesh Das, Danielle Higgins, Prashanth Joshi, Rajesh
Konanganparambath, Saurabh Pandey, and Sriram V.R. Nagaraja Rao .
The Programs (which include both the software and documentation) contain proprietary information of Oracle
Corporation; they are provided under a license agreement containing restrictions on use and disclosure and are
also protected by copyright, patent, and other intellectual and industrial property laws. Reverse engineering,
disassembly, or decompilation of the Programs is prohibited.
The information contained in this document is subject to change without notice. If you find any problems in the
documentation, please report them to us in writing. Oracle Corporation does not warrant that this document is
error free. Except as may be expressly permitted in your license agreement for these Programs, no part of these
Programs may be reproduced or transmitted in any form or by any means, electronic or mechanical, for any
purpose, without the express written permission of Oracle Corporation.
If the Programs are delivered to the U.S. Government or anyone licensing or using the programs on behalf of the
U.S. Government, the following notice is applicable:
Restricted Rights Notice Programs delivered subject to the DOD FAR Supplement are "commercial computer
software" and use, duplication, and disclosure of the Programs, including documentation, shall be subject to the
licensing restrictions set forth in the applicable Oracle license agreement. Otherwise, Programs delivered subject
to the Federal Acquisition Regulations are "restricted computer software" and use, duplication, and disclosure
of the Programs shall be subject to the restrictions in FAR 52.227-19, Commercial Computer Software Restricted Rights (June, 1987). Oracle Corporation, 500 Oracle Parkway, Redwood City, CA 94065.
The Programs are not intended for use in any nuclear, aviation, mass transit, medical, or other inherently
dangerous applications. It shall be the licensee’s responsibility to take all appropriate fail-safe, backup,
redundancy, and other measures to ensure the safe use of such applications if the Programs are used for such
purposes, and Oracle Corporation disclaims liability for any damages caused by such use of the Programs.
Oracle is a registered trademark, and the Oracle Logo, Internet Application Server, Oracle8i, Oracle Enterprise
Manager, Oracle Internet Directory, and PL/SQL are trademarks or registered trademarks of Oracle
Corporation. All other company or product names mentioned are used for identification purposes only and
may be trademarks of their respective owners.
This product includes software developed by the Apache Group for use in the Apache HTTP server project
(http://www.apache.org/).
This product includes software developed by the OpenSSL project for use in the OpenSSL Toolkit
(http://www.openssl.org/). This product includes cryptographic software written by Eric Young
([email protected]). This product includes software written by Tim Hudson ([email protected]).
This product includes software developed by Ralf S. Engelschall ([email protected]) for use in the mod_ssl
project (http://www.modssl.org/).
Contents
Send Us Your Comments .................................................................................................................. vii
Preface............................................................................................................................................................ ix
1
Performance Overview
Performance Terms .............................................................................................................................
What is Performance Tuning? ..........................................................................................................
Response Time ..............................................................................................................................
System Throughput......................................................................................................................
Wait Time.......................................................................................................................................
Critical Resources .........................................................................................................................
Effects of Excessive Demand.......................................................................................................
Adjustments to Relieve Problems ..............................................................................................
Setting Performance Targets .............................................................................................................
Setting User Expectations..................................................................................................................
Evaluating Performance ....................................................................................................................
Performance Methodology ...............................................................................................................
Factors in Improving Performance ............................................................................................
Architecture........................................................................................................................................
2
1-2
1-2
1-3
1-4
1-4
1-5
1-6
1-6
1-7
1-7
1-7
1-8
1-9
1-10
Monitoring Your Web Server
Monitoring Processor Use ................................................................................................................. 2-2
Using the sar Utility (AIX, HP-UX, Intel Solaris)..................................................................... 2-2
Using the top Utility..................................................................................................................... 2-3
iii
Monitoring the Web Server...............................................................................................................
Using the mod_status Utility ......................................................................................................
Logging Server Statistics to a File...............................................................................................
Monitoring JServ Processes ..............................................................................................................
3
Sizing and Configuration
Sizing your Hardware and Resources.............................................................................................
Understanding Concurrent Users and User Population .............................................................
Determining CPU Requirements....................................................................................................
Secure Sockets Layer Impact on CPU Requirements ..............................................................
Determining Memory Requirements..............................................................................................
Memory for Non-HTTP Server Software and Operating System .........................................
HTTP Server Memory Requirements ........................................................................................
JServ Memory Requirements ......................................................................................................
Determining Java Heap Size .......................................................................................................
Servlet and OracleJSP pages Memory Requirements..............................................................
Number of JServ Processes..........................................................................................................
4
4-2
4-4
4-9
4-10
4-10
4-11
4-11
4-14
Optimizing Apache JServ
JServ Overview....................................................................................................................................
Optimizing Servlet Performance .....................................................................................................
Loading Servlet Classes ...............................................................................................................
Automatic Class Reloading .........................................................................................................
Load Balancing..............................................................................................................................
iv
3-1
3-1
3-3
3-3
3-3
3-4
3-4
3-4
3-4
3-5
3-6
Optimizing HTTP Server Performance
TCP Tuning ..........................................................................................................................................
Linux Tunables..............................................................................................................................
MaxClients ...........................................................................................................................................
SSL Session Caching ........................................................................................................................
Impact of Logging .............................................................................................................................
HTTP/1.1 .............................................................................................................................................
Persistent Connections ...............................................................................................................
Apache Versions ................................................................................................................................
5
2-3
2-4
2-6
2-8
5-2
5-3
5-3
5-3
5-4
Using Single Thread Model Servlets..........................................................................................
What is OracleJSP? .............................................................................................................................
OracleJSP Page Performance Tuning ..............................................................................................
Impact of Session Management..................................................................................................
Developer Mode ...........................................................................................................................
Buffering ........................................................................................................................................
Enhancing OracleJSP Performance ............................................................................................
5-7
5-8
5-8
5-8
5-9
5-9
5-9
Index
v
vi
Send Us Your Comments
Oracle9i Application Server, Oracle HTTP Server powered by Apache Performance Guide,
Release 1.0.2
Part No. A86828-01
Oracle Corporation welcomes your comments and suggestions on the quality and usefulness of this
publication. Your input is an important part of the information used for revision.
■
■
■
■
■
Did you find any errors?
Is the information clearly presented?
Do you need more information? If so, where?
Are the examples correct? Do you need more examples?
What features did you like most about this manual?
If you find any errors or have any other suggestions for improvement, please indicate the chapter,
section, and page number (if available). You can send comments to us in the following ways:
■
■
E-mail - [email protected]
Postal service:
Oracle Corporation
500 Oracle Parkway, M/S 6op4
Redwood Shores, CA 94065
USA
If you would like a reply, please give your name, address, and telephone number below.
If you have problems with the software, please contact your local Oracle Support Services.
vii
viii
Preface
Audience
This guide is written for Oracle Internet Application Server 8i developers and
system administrators who are responsible for configuring and tuning the Oracle
HTTP Server powered by Apache.
Assumptions
There are many sources of information on configuring and tuning web servers,
Apache in particular. This guide refers to those sources when expedient, and, where
practical, quantifies the performance gains resulting from configuration actions
found in those sources. Any recommendations not validated by our in-house testing
are cited as such, with attribution to the original source.
All of our in-house tests were run on a dedicated 100 Mbps network, in order to
achieve repeatable test results. Your results will vary based on network
configuration and contention characteristics.
Conventions
This manual uses the following typographical conventions:
Convention
Example
Explanation
bold
tnsnames.ora
runInstaller
www.oracle.com
Identifies file names,
utilities,
processes,
and URLs
ix
Convention
Example
Explanation
italics
file1
Identifies a variable in text; replace this place
holder with a specific value or string.
angle brackets
<filename>
Identifies a variable in code; replace this
place holder with a specific value or string.
courier
owsctl start wrb
Text to be entered exactly as it appears. Also
used for functions.
square brackets
[-c string]
Identifies an optional item.
[on|off]
Identifies a choice of optional items, each
separated by a vertical bar (|), any one
option can be specified.
braces
{yes|no}
Identifies a choice of mandatory items, each
separated by a vertical bar (|).
ellipses
n,...
Indicates that the preceding item can be
repeated any number of times.
The term, Oracle Server, refers to the database server product from Oracle
Corporation.
The term, oracle, refers to an executable or account by that name.
The term, oracle, refers to the owner of the Oracle software.
Oracle Services and Support
A wide range of information about Oracle products and global services is available
from:
■
http://www.oracle.com
The sections below provide URLs for selected services.
Oracle Support Services
Technical Support contact information worldwide is listed at:
■
http://www.oracle.com/support
Templates are provided to help you prepare information about your problem before
you call. You will also need your CSI number (if applicable) or complete contact
details, including any special project information.
x
Product and Documentation
For U.S.A customers, Oracle Store is at:
■
http://store.oracle.com
Links to Stores in other countries are provided from this site.
Product documentation can be found at:
■
http://docs.oracle.com
Customer Service
Global Customer Service contacts are listed at:
■
http://www.oracle.com/support
Education and Training
Training information and worldwide schedules are available from:
■
http://education.oracle.com
Oracle Technology Network
Register with the Oracle Technology Network (OTN) at:
■
http://technet.oracle.com
OTN delivers technical papers, code samples, product documentation, self-service
developer support, and Oracle key developer products to enable rapid
development and deployment of application built on Oracle technology.
xi
xii
1
Performance Overview
This chapter discusses performance and tuning concepts, and briefly describes
Oracle9i Application Server architecture.
Contents
■
Performance Terms
■
What is Performance Tuning?
■
Setting Performance Targets
■
Setting User Expectations
■
Evaluating Performance
■
Performance Methodology
■
Architecture
Performance Overview 1-1
Performance Terms
Performance Terms
Following are performance terms used in this book:
concurrency
The ability to handle multiple requests simultaneously.
Threads and processes are examples of concurrency
mechanisms.
latency
The time that one system component spends waiting for
another component in order to complete the entire task.
Latency can be defined as wasted time. In networking
discussions, latency is defined as the travel time of a
packet from source to destination.
response time
The time between the submission of a request and the
completion of the response.
scalability
The ability of a system to provide throughput in
proportion to, and limited only by, available hardware
resources.
A scalable system is one that can handle increasing
numbers of requests without adversely affecting response
time and throughput.
service time
The time between the initiation and completion of the
response to a request.
think time
The time the user is not engaged in actual use of the
processor.
throughput
The number of requests processed per unit of time.
wait time
The time between the submission of the request and
initiation of the response.
What is Performance Tuning?
Performance must be built in. You must anticipate performance requirements
during application analysis and design, and balance the costs and benefits of
optimal performance (see "Setting Performance Targets" on page 1-7). This section
introduces some fundamental concepts:
1-2
■
Response Time
■
System Throughput
Oracle HTTP Server powered by Apache Performance Guide
What is Performance Tuning?
■
Wait Time
■
Critical Resources
■
Effects of Excessive Demand
■
Adjustments to Relieve Problems
Response Time
Because response time equals service time plus wait time, you can increase
performance in this area by:
■
Reducing wait time
■
Reducing service time
Figure 1–1 illustrates ten independent tasks competing for a single resource.
Figure 1–1
Sequential processing of independent tasks
In this example, only task 1 runs without waiting. Task 2 must wait until task 1 has
completed; task 3 must wait until tasks 1 and 2 have completed, and so on.
(Although the figure shows the independent tasks as the same size, the size of the
tasks will vary.)
Performance Overview 1-3
What is Performance Tuning?
In parallel processing with multiple resources, more resources are available to the
tasks. Each independent task executes immediately using its own resource: no wait
time is involved.
System Throughput
System throughput is the amount of work accomplished in a given amount of time.
You can increase throughput by:
■
■
Reducing service time
Reducing overall response time by increasing the amount of scarce resources
available. For example, if the system is CPU bound, and you can add more
CPUs.
Wait Time
While the service time for a task may stay the same, wait time will lengthen with
increased contention. If many users are waiting for a service that takes one second,
the tenth user must wait 9 seconds. Figure 1–2 shows the relationship between wait
time and resource contention.
Figure 1–2
1-4
Wait time rising with increased contention for a resource
Oracle HTTP Server powered by Apache Performance Guide
What is Performance Tuning?
Critical Resources
Resources such as CPU, memory, I/O capacity, and network bandwidth are key to
reducing service time. Adding resources increases throughput and reduces response
time. Performance depends on these factors:
■
How many resources are available?
■
How many clients need the resource?
■
How long must they wait for the resource?
■
How long do they hold the resource?
Figure 1–3 shows that as the number of units requested rises, the time to service
completion rises.
Figure 1–3
Time to service completion vs. demand rate
To manage this situation, you have two options:
■
Limit demand rate to maintain acceptable response times
■
Add resources
Performance Overview 1-5
What is Performance Tuning?
Effects of Excessive Demand
Excessive demand increases response time and reduces throughput, as shown in
Figure 1–4. If there is any possibility of the demand rate exceeding the achievable
throughput, a demand limiter (such as MaxClients in the Oracle HTTP Server and
security.maxConnections in JServ) is essential. Look at the possible demands that
may be placed on the system and design the application or configure the system
with these constraints in mind.
Figure 1–4 Increased Demand/Reduced Throughput
Adjustments to Relieve Problems
Performance problems can be relieved by making adjustments in the following
areas:
1-6
unit consumption
Reducing the resource (CPU, memory)
consumption of each request can improve
performance. This might be achieved by
pooling and caching.
functional demand
Rescheduling or redistributing the work
will relieve some problems.
capacity
Increasing or reallocating resources (e.g.,
CPUs) relieves some problems.
Oracle HTTP Server powered by Apache Performance Guide
Evaluating Performance
Setting Performance Targets
Whether you are designing or maintaining a system, you should set specific
performance goals so that you know how and what to optimize. If you alter
parameters without a specific goal in mind, you can waste time tuning your system
without significant gain.
An example of a specific performance goal is an order entry response time under
three seconds. If the application does not meet that goal, identify the cause (for
example, I/O contention), and take corrective action. During development, test the
application to determine if it meets the designed performance goals.
Tuning usually involves a series of trade-offs. Once you have determined the
bottlenecks, you may have to modify performance in some other areas to achieve
the desired results. For example, if I/O is a problem, you may need to purchase
more memory or more disks. If a purchase is not possible, you may have to limit the
concurrency of the system to achieve the desired performance. However, if you
have clearly defined goals for performance, the decision on what to trade for higher
performance is simpler because you have identified the most important areas.
Setting User Expectations
Application developers, database administrators, and system administrators must
be careful to set appropriate performance expectations for users. When the system
carries out a particularly complicated operation, response time may be slower than
when it is performing a simple operation. Users should be made aware of which
operations might take longer.
Evaluating Performance
With clearly defined performance goals, you can readily determine when
performance tuning has been successful. Success depends on the functional
objectives you have established with the user community, your ability to measure
whether or not the criteria are being met, and your ability to take corrective action
to overcome any exceptions.
Ongoing performance monitoring enables you to maintain a well tuned system.
Keeping a history of the application’s performance over time enables you to make
useful comparisons. With data about actual resource consumption for a range of
loads, you can conduct objective scalability studies and from these predict the
resource requirements for anticipated load volumes.
Performance Overview 1-7
Performance Methodology
Performance Methodology
Achieving optimal effectiveness in your system requires planning, monitoring, and
periodic adjustment. The first step in performance tuning is to determine the goals
you need to achieve and to design effective usage of available technology into your
applications. After implementing your system, it is necessary to periodically
monitor and adjust your system For example, you might want to ensure that 90% of
the users experience response times no greater than 5 seconds and the maximum
response time for all users is 20 seconds. Usually, it’s not that simple. Your
application may include a variety of operations with differing characteristics and
acceptable response times. You will need to set measurable goals for each of these.
Figure 1–5 Adjusting Capacity and Functional Demand
You will also need to determine variances in the load. For example, users might
access the system heavily between 9:00am and 10:00am and then again between
1:00pm and 2:00pm. If your peak load occurs on a regular basis, for example, daily
or weekly, the conventional wisdom is to configure and tune systems to meet your
peak load requirements. The lucky users who access the application in off-time will
typically achieve better response times than your peak-time users. If your peak load
is infrequent, you may be willing to tolerate higher response times at peak loads for
the cost savings of smaller hardware configurations.
1-8
Oracle HTTP Server powered by Apache Performance Guide
Performance Methodology
Factors in Improving Performance
Performance spans several areas:
■
■
■
■
■
Application design: Designing applications that efficiently utilize hardware
resources and handle increasing numbers of users effectively.
Sizing and configuration: Determining the type of hardware needed to support
your performance goals. See Chapter 3, "Sizing and Configuration".
Parameter tuning: Setting configurable parameters to achieve the best
performance for your application. See Chapter 5, "Optimizing Apache JServ"
and Chapter 4, "Optimizing HTTP Server Performance".
Performance monitoring: Determining what hardware resources are being used
by your application and what response time your users are experiencing. See
Chapter 2, "Monitoring Your Web Server".
Troubleshooting: Diagnosing why an application is using excessive hardware
resources, or why the response time exceeds the desired limit.
Performance Overview 1-9
Architecture
Architecture
Figure 1–6 shows the architecture of Oracle9i Application Server.
This guide addresses the performance and configuration of these components:
■
Oracle HTTP Server powered by Apache
■
Apache JServ
■
OracleJSP
See the Oracle9i Application Server Overview Guide for a list of publications that
describe other components.
Figure 1–6 Oracle9i Application Server architecture
1-10
Oracle HTTP Server powered by Apache Performance Guide
2
Monitoring Your Web Server
This chapter describes utilities and processes you can use to gather information
from your system. This information helps you to determine the best use of your
resources.
Contents
■
Monitoring Processor Use
■
Monitoring the Web Server
■
Monitoring the Web Server
■
Monitoring JServ Processes
Monitoring Your Web Server
2-1
Monitoring Processor Use
Monitoring Processor Use
To determine process utilization, you should gather CPU statistics. You should also
monitor system scalability by adding users and increasing the system workload.
Use utilities such as sar (System Activity Reporter) and mpstat to monitor process
use.
Using the sar Utility (AIX, HP-UX, Intel Solaris)
You can use sar to sample cumulative activity counters in the operating system at
specified intervals.
Report CPU Utilization
To determine process use, use the following sar command:
$ sar -u 5 5
This command samples CPU usage five times, in five second intervals, as shown
below:
:
$ sar -u 5 5
15:30:25
15:30:30
15:30:35
15:30:40
15:30:45
15:30:50
Average
%usr
49
52
46
46
50
%sys
36
41
45
44
41
%wio
0
0
0
0
0
%idle
14
7
8
10
9
46
41
0
9
The statistics above show that the CPU was only 9% idle for the given time interval.
If your performance criteria specify that CPU usage must be below a certain
percentage, you can use sar to sample usage at a chosen interval during peak load
times.
2-2
Oracle HTTP Server powered by Apache Performance Guide
Monitoring the Web Server
The sar command (-u option) provides the following statistics:
Table 2–1 CPU statistics, as reported by the sar utility
CPU Statistics
Description
%usr
percentage of time in which the processor is running in user
mode
%sys
percentage of processes running in system time
%wio
percentage the processor spends waiting on I/O requests
%idle
percentage that the processor is idle
Using the top Utility
You can use the top utility to view the ongoing processor activity in real time. Please
refer to the man pages for usage.
Example:
$ top
4.:16pm up 15 days, 5:39 23 users, load average: 0.51, 0.38, 0.49
265 processes: 261 sleeping, 3 running, 1 zombie, 0 stopped
CPU states: 7.1% user, 44.3% system, 0.0% nice, 48.4% idle
Mem: 2009664K av, 1954828K used, 54836K free, 75288K shrd, 1448352K buff
Swap: 2096440K av, 10376K used, 2086064K free
250576K cached
PID USER
PRI NI SIZE RSS SHARE STAT LIB %CPU %MEM TIME COMMAND
20892 oasport
6 0 13908 13M 5068 R
0 24.9 0.6 0:06 oraweb
20928 oasport
7 0 13652 13M 4896 R
0 24.9 0.6 0:05 oraweb
20936 rkonanga
5 0 1252 1252
916 R
0 1.4 0.0 0:00 top
15187 oasport
0 0 2232 2232 1372 S
0 0.4 0.1 0:02 xterm
20728 oasport
0 0 2984 2984 1604 S
0 0.1 0.1 0:00 oasoorb
1 root
0 0
156 136
92 S
0 0.0 0.0 0:04 init
2 root
0 0
0
0
0 SW
0 0.0 0.0 0:10 kflushd
3 root
0 0
0
0
0 SW
0 0.0 0.0 6.35 kupdate
Monitoring the Web Server
Monitoring is essential to performance tuning. The Oracle HTTP Server provides
server side status information, including current server statistics, via the
mod_status module. To obtain these server status reports, you must configure the
web server as described below.
Monitoring Your Web Server
2-3
Monitoring the Web Server
Using the mod_status Utility
To enable monitoring, edit the httpd.conf file to replace your_domain.com with
the hostname of the server you want to monitor.
<Location /server-status>
SetHandler server-status
Order deny, allow
Deny from all
Allow from your_domain.com
</Location>
Ensure that the ExtendedStatus directive is set to On, so that the maximum
amount of information is displayed.
When you allow access from all domains, instead of just your_domain.com, you
can monitor the server from machines outside of your domain, but be aware of the
security implications of this: your server status is accessible from any site. It is
probably best to specify the domain(s) from which you want to monitor your
system.
With monitoring enabled, you can view current statistics from
http://hostname:port/server-status. These statistics help you to gain
insight on how busy your system is.
The display includes:
■
Hostname for which status is displayed
■
Server version
■
Date server was built
■
Current time, restart time, uptime
■
Number of requests currently being processed
■
Number of httpd processes serving requests
■
Number of idle httpd processes
■
Current server state (e.g., waiting for connection, reading request, sending
reply, etc.
Figure 2–1 is a screen capture of a server status page with ExtendedStatus
turned on.
2-4
Oracle HTTP Server powered by Apache Performance Guide
Monitoring the Web Server
Figure 2–1 Server status page
Interpreting Server Status Information
The display (with ExtendedStatus enabled) shows that 6 requests are being
processed and four servers are idle. You can determine what stage of processing
each server is in from the value in the M (Mode column). In Figure 2–1, 6 servers are
sending replies and 4 servers are waiting for connections.
If your system has poor response times, or you suspect that httpd processes have
stopped responding, look at the Req (request) column. It shows the number of
milliseconds required to process the most recent request. Check to see if this
number is greater than the time expected to service the request. If, after a request
Monitoring Your Web Server
2-5
Monitoring the Web Server
has been completed, there is a W in the M (mode) column for the process, the
process is probably not responding.
Another situation that is important to monitor is that of the system being CPU
bound, where CPU utilization is around 90%. The server status page displays CPU
usage and the number of processes spawned. If the system is approaching the httpd
process limit (the MaxClients directive’s setting in httpd.conf), performance is
poor, and the processes are all always busy, you may need to change your
MaxClients setting. See "MaxClients" on page 4-9.
Customizing the Server Status display
Figure 2–1 is a snapshot of a server for a moment in time. You can get updated
server statistics at any interval you choose by including the refresh parameter in the
server-status URL:
http://servername:port/server-status?refresh=x
where x is an integer representing the number of seconds after which the data is
refreshed. For example, specify refresh=3 to update statistics every 3 seconds.
You may also find it useful to have the statistics displayed in a machine-readable
format, for processing in a data analysis or spreadsheet program. To do this, add
auto to the end of the URL, as shown below:
http://servername:port/server-status?auto
Figure 2–2 Server statistics display
Logging Server Statistics to a File
The Apache Group provides a Perl script, logstatus.pl, to automate server
monitoring. It is included in the $ORACLE_HOME/Apache/Apache/bin/
directory.
2-6
Oracle HTTP Server powered by Apache Performance Guide
Monitoring the Web Server
The script is designed to be run by cron (or an equivalent daemon that executes
commands at intervals). To use the script, you must modify the following
configuration variables:
Table 2–2 Log status script variables
Variable
Value
$wherelog
The pathname of the log file location, for example:
/private/admin/logs/
The script creates a file name, such as: 20010945.
$port
Port number of the server to monitor. The default is 80.
$server
The server host name. The default is localhost.
$request
The server status request with the auto parameter as entered in
the browser, for example:
http://servername:port/server-status?auto
Enabling server status is very useful if an httpd process is not responding, and you
need to identify that process. Operating system utilities such as ps, top, or pmap do
not identify which process is not responding.
For more information on mod_status, see:
http://www.oreillynet.com/pub/a/apache/2000/04/21/wrangler.html
http://www.apache.org/docs/mod/mod_status.html
Monitoring Your Web Server
2-7
Monitoring JServ Processes
Monitoring JServ Processes
After you start the Oracle9i Application Server, you can check to ensure that all
JServ processes have started normally.
1.
Remove the comments in the JServ status handler section of the jserv.conf file to
enable monitoring and specify the host(s) that can access JServ status (the
default is localhost). Be aware of security implications when selecting the hosts
that will be allowed to access status information on your system.
<Location /jserv/>
SetHandler jserv-status
order deny, allow
deny from all
allow from oracle.com
</Location>
2.
Type the following into your browser:
http://hostname:port/jserv/
The port must be the port on which the web server listens (found in the
httpd.conf file). Always include the trailing slash (/) in this URL. A “not found”
error occurs if you omit the trailing slash.
A Configured Hosts column displays links to hosts.
3.
Click the host to monitor.
The JServ status information for the host displays as shown in Figure 2–3.
Note: The JServ status monitor shows all of the JServ processes
that are configured in the jserv.conf file, but not all of these may
have been started. For example, Figure 2–3 shows four processes,
but only two have a Status of Up (indicating that the process is able
to service requests).
2-8
Oracle HTTP Server powered by Apache Performance Guide
Monitoring JServ Processes
Figure 2–3 JServ status display
The Status column shows the current shared memory (shm) state of each
process.
Monitoring Your Web Server
2-9
Monitoring JServ Processes
Note: The Status column is populated only for processes that are
started in manual mode. It is not populated for a single process
started in automatic mode.
The symbols that appear in parentheses after the word Up or Down have the
following meanings:
2-10
Symbol
Meaning
+
The process is running.
-
The process is stopped.
X
The process was terminated in a harsh shutdown.
/
The process was terminated in a graceful shutdown
(existing requests were handled before the process was
terminated).
Oracle HTTP Server powered by Apache Performance Guide
3
Sizing and Configuration
This chapter provides guidelines for sizing and configuration which can help you
meet performance goals. It also discusses performance factors, such as memory
consumption, I/O issues, and network and software constraints.
Contents
■
Sizing your Hardware and Resources
■
Understanding Concurrent Users and User Population
■
Determining CPU Requirements
■
Determining Memory Requirements
Sizing your Hardware and Resources
In addition to the minimum installation recommendations, your hardware
resources need to be adequate for the requirements of your specific applications. To
avoid hardware-related performance bottlenecks, each hardware component should
operate at no more than 80% of capacity. See "Using the sar Utility (AIX, HP-UX,
Intel Solaris)" on page 2-2 for information on measuring CPU utilization.
Processor and memory resources in particular should be allocated generously, for
the maximum user load expected.
Understanding Concurrent Users and User Population
The amount of hardware resources required varies based on the application. A
common mistake is to use resource estimates that do not incorporate user think time
and network latencies. In sizing applications, you must have some idea of the
Sizing and Configuration
3-1
Understanding Concurrent Users and User Population
relationship between the number of potential users and the number of concurrent
users. This is determined by the think time and the average response time for your
application.
To determine memory requirements, you also need to consider the number of
concurrent executing users (not the total user population) times the cost per user.
Note: The MaxClients setting in your httpd.conf file limits the
number of concurrently executing users. See "MaxClients" on
page 4-9 for information on the MaxClients directive.
Table 3–1 provides an example of the impact of think time and service time on the
concurrency and resulting performance of a system.
Table 3–1 Concurrent executing users
User
population1
Think
time
(sec)2
Service
time
(sec)3
Average
Range of
response Requests per CPU
concurrent Time
second
utilization
users4
(throughput)6 (%)7
(sec)5
100
0
0.3
100
5.2
19
99
100
1
0.3
65-100
4.2
19
99
100
10
0.3
0-32
0.9
9
48
100
10
0.6
0-53
2.9
8
80
1
2
3
4
5
6
7
3-2
User population - total users.
Think time - the time the user is not engaged in actual use of the processor (the time between
requests).
Service time (seconds) - elapsed time to complete the operation measured for a single user.
Range of concurrent users - the number of users measured on the server, taken in snapshots from the
server-status display (requests currently being processed). See "Using the mod_status Utility" on
page 3-3 for information on server-status.
Average response time - response time measured at the client under load.
Requests per second (throughput) - number of requests processed.
CPU utilization - average total CPU utilization as a percentage.
Oracle HTTP Server powered by Apache Performance Guide
Determining Memory Requirements
Determining CPU Requirements
For most applications, the majority of the CPU utilization is spent in processing the
application’s code. The CPU requirement of any application depends on its
complexity and workload, as shown in Table 3–2.
You will need to monitor the CPU requirements of applications throughout the
development cycle. See Chapter 2, "Monitoring Your Web Server" for information
on how to do this.
Table 3–2 Application CPU requirements
Application
CPU requirement
(per request)
Static page, 20K
5 ms
Simple servlet, JDK 1.2
20 ms
Simple servlet, JDK 1.1.8
40 ms
Medium application
100-200 ms
Complex application
400-600 ms
Secure Sockets Layer Impact on CPU Requirements
Secure Sockets Layer (SSL) is a protocol used for transmitting documents securely
over the Internet. URLs for Web pages that require an SSL connection begin with
https instead of http.
Establishing an SSL connection is costly in terms of response time and CPU
utilization. For example, a request with a response time of 0.5 seconds without SSL
generated a response time of 1.7 seconds with SSL (measured on an internal 100
Mbps network). Most of the performance cost in using SSL is in establishing the
connection (approximately 125 ms of CPU time per connection on a 336 Mhz
processor).
The high connection cost is incurred for the first connection in a client’s SSL session,
because the HTTP Server can cache the SSL session information, reducing the
overhead for subsequent connections. For more information, see "SSL Session
Caching" on page 4-10.
Determining Memory Requirements
This section discusses memory requirements for the following components:
Sizing and Configuration
3-3
Determining Memory Requirements
■
Memory for Non-HTTP Server Software and Operating System
■
HTTP Server Memory Requirements
■
JServ Memory Requirements
■
Determining Java Heap Size
■
Servlet and OracleJSP pages Memory Requirements
■
Number of JServ Processes
Memory for Non-HTTP Server Software and Operating System
In an idle system with memory resources freely available, your operating system
statistics may indicate that the resident memory usage is close to the virtual size. As
users place more load on the system, the operating system reclaims unneeded
memory from these processes, and the amount of resident memory they consume
decreases. If you are monitoring your own system, take snapshots of processes at
varying usage levels.
Refer to your operating system hardware and software documentation for more
information on measuring and tuning operating system memory usage. You can
monitor memory usage and processor statistics with standard operating system
tools. See Chapter 2, "Monitoring Your Web Server" for more information.
HTTP Server Memory Requirements
In a series of tests of listener memory usage, each HTTP listener used (at startup)
approximately 400K of resident memory. This size increased by 500-600K per
process when the listener was active. When it was dormant, the operating system
reduced the listener’s memory usage back to the startup size.
Using standard operating system tools, you can examine resident memory sizes. If
you look at a listener process, you will see that it is larger than the figure above
because the displayed size includes shared memory.
JServ Memory Requirements
A JServ process using JDK 1.2 requires 12-15 MB at startup. Using JDK 1.1.8, it
requires 10 MB.
Determining Java Heap Size
For JDK 1.1.8, the default maximum heap size is 16MB. For JDK 1.2, it is 24MB.
3-4
Oracle HTTP Server powered by Apache Performance Guide
Determining Memory Requirements
To maximize performance, set the maximum heap size to accommodate application
requirements. To determine how much Java heap you need, include calls in your
program to the Runtime.getRuntime().totalMemory() and
Runtime.getRuntime().freeMemory methods in the java.lang package.
Subtract free memory from total memory; the difference is the amount of heap that
the application consumed.
Suppose you determine that you need 128MB of heap. To change the heap size, you
would set the maximum Java heap size in the jserv.properties file for automatic
mode:
wrapper.bin.parameters=-mx128m
In manual mode, if more than one JServ process is running, the heap size must be
set on the command line for each JServ process.
When a JServ process exceeds its maximum heap size, the process terminates. In
automatic mode, a new process is started, but performance is degraded
significantly. In manual mode, a terminated process will not be restarted, so ensure
that the heap size is sufficient.
Note: The process size reported by utilities such as top or ps will
be larger than the maximum heap size, because private memory is
added to the maximum heap size.
Servlet and OracleJSP pages Memory Requirements
OracleJSP pages (Oracle’s implementation of Sun’s JavaServer Pages) and servlets
require different amounts of memory, depending on the version of the JDK used.
The chart below compares memory requirements for a simple servlet and an Oracle
JSP page under load with 10-30 active threads. The servlet did not use sessions. The
OracleJSP page had sessions on (the default).
Table 3–3 Servlet and OracleJSP pages memory
Component
JDK 1.1.8
JDK 1.2
Servlet
10MB
24MB
OracleJSP page
10MB
32MB
Sizing and Configuration
3-5
Determining Memory Requirements
The amount of memory needed depends on whether sessions are used; a session
consumes about 0.5KB. For maximum performance, if sessions are not being used,
turn them off in the OracleJSP application as follows:
<%@ page session=”false” %>
<html><body>
HelloWorld
</body></html>
As a starting point, figure that each active user consumes at least 150K to 200K for
Java applications, plus the size of the server processes. For Java applications, the
base process is approximately 12-15 MB.
An application’s memory needs also depend on its size, the amount of data cached,
and other factors.
See the OracleJSP Developer’s Guide and Reference in the Oracle Internet Application
Server 8i documentation library for more information on OracleJSP pages.
Number of JServ Processes
Oracle recommends about 2 JServ processes per CPU as a starting point. The default
thread setting (security.maxConnections=50) in the JServ configuration file is
also a good starting point. (See "Load Balancing" on page 5-4 for instructions on
changing parameters in the configuration files.)
If your application code performs a lot of synchronization, or creates many new
Java objects, then you should consider increasing the number of JServ processes,
while limiting the number of threads per process to between 10 and 20. In this way
you avoid increased queuing and processing required for object synchronization in
the JVM. This is because the httpd process (mod_jserv) sends incoming requests to
the JServ processes in a distributed fashion. See "Load Balancing" on page 5-4 for
details on how the requests are distributed among the available JServ engines.
(Readers familiar with the Oracle Application Server will recall that requests are
sent to a servlet engine until its thread limit is reached, and subsequent requests are
sent to the next servlet engine.)
3-6
Oracle HTTP Server powered by Apache Performance Guide
Determining Memory Requirements
Figure 3–1 Request distribution
Sizing and Configuration
3-7
Determining Memory Requirements
3-8
Oracle HTTP Server powered by Apache Performance Guide
4
Optimizing HTTP Server Performance
This chapter provides information on improving the Oracle HTTP Server’s
performance, including tuning TCP parameters, the effects of changing the
MaxClients parameter, SSL caching, and logging.
Contents
■
TCP Tuning
■
MaxClients
■
SSL Session Caching
■
Impact of Logging
■
HTTP/1.1
■
Apache Versions
Optimizing HTTP Server Performance
4-1
TCP Tuning
TCP Tuning
Correctly tuned TCP parameters can improve performance dramatically. This
section contains recommendations for TCP tuning and a brief explanation of each
parameter.
The table below contains recommended TCP parameter settings.
Table 4–1 Recommended TCP parameter settings for Intel Solaris
Parameter
Setting
Comments
32768
See "Increasing TCP
Connection Table Access
Speed" on page 4-6.
tcp_conn_hash_size
4-2
tcp_close_wait_interval 60000
Parameter name in Solaris 2.6.
See "Specifying Retention time
for Connection Table entries"
on page 4-7.
tcp_time_wait_interval
60000
Parameter name in Solaris 2.7.
See "Specifying Retention time
for Connection Table entries"
on page 4-7.
tcp_conn_req_max_q
1024
See "Increasing the Handshake
Queue Length" on page 4-7.
tcp_conn_req_max_q0
1024
See "Increasing the Handshake
Queue Length" on page 4-7.
tcp_slow_start_initial
2
See "Changing the Data
Transmission Rate" on
page 4-8.
tcp_xmit_hiwat
32768
See "Changing the Data
Transfer Window Size" on
page 4-8.
tcp_recv_hiwat
32768
See "Changing the Data
Transfer Window Size" on
page 4-8.
Oracle HTTP Server powered by Apache Performance Guide
TCP Tuning
Table 4–2 Tuning HP-UX for Performance Benchmarking
Parameter
Scope
Default Value
Tuned
Value
tcp_time_wait_interval
ndd/dev/tcp
60,000
60,000
tcp_conn_req_max
ndd/dev/tcp
20
1,024
tcp_ip_abort_interval
ndd/dev/tcp
600,000
60,000
tcp_keepalive_interval
ndd/dev/tcp
7,20,00,000
900,000
tcp_rexmit_interval_initial
ndd/dev/tcp
1,500
1,500
tcp_rexmit_interval_max
ndd/dev/tcp
60,000
60,000
tcp_rexmit_interval_min
ndd/dev/tcp
500
500
tcp_xmit_hiwater_def
ndd/dev/tcp
32,768
32,768
tcp_recv_hiwater_def
ndd/dev/tcp
32,768
32,768
Table 4–3 Tru64 TCP/IP Tunables
Parameter
Module
Default
value
Tuned Value
tcbhashsize
sysconfig -r inet
512
16,384
tcbhashnum
sysconfig -r inet
1
16 (as of 5.0)
tcp_keepalive_default
sysconfig -r inet
0
1
tcp_sendspace
sysconfig -r inet
16,384
65,535
tcp_recvspace
sysconfig -r inet
16,384
65,535
somaxconn
sysconfig -r socket
1,024
65,535
sominconn
sysconfig -r socket
0
65,535
sbcompress_threshold
sysconfig -r socket
0
600
Optimizing HTTP Server Performance
4-3
TCP Tuning
Table 4–4 AIX TCP Parameters (using no command)
Parameter
Model
Default
Value
Recommended Value
rfc1323
/etc/rc.net
0
1
sb_max
/etc/rc.net
65,536
1,31,072
tcp_mssdflt
/etc/rc.net
512
1,024
ipqmaxlen
/etc/rc.net
50
100
tcp_sendspace
/etc/rc.net
16,384
65,536
tcp_recvspace
/etc/rc.net
16,384
65,536
xmt_que_size
/etc/rc.net
30
150
Linux Tunables
Raising Network Limits on Linux Systems for 2.1.100 or greater
Linux only allows you to use 15 bits of the TCP window field. This means that you
have to multiply everything by 2, or recompile the kernel without this limitation.
See Also: Tuning at Compile Time
Tuning a Running System
There is no sysctl application for changing kernel values. You can change the
kernel values with an editor like VI.
Tuning the Default and Maximum Size
Edit the files listed below to change kernel values.
Table 4–5 Linux TCP Parameters
Filename
/proc/sys/net/core/rmem_default
4-4
Details
Default Receive Window
/proc/sys/net/core/rmem_max
Maximum Receive Window
/proc/sys/net/core/wmem_default
Default Send Window
/proc/sys/net/core/wmem_max
Maximum Send Window
Oracle HTTP Server powered by Apache Performance Guide
TCP Tuning
You will find some other possibilities to tune TCP in /proc/sys/net/ipv4/:
■
tcp_timestamps
■
tcp_windowscaling
■
tcp_sack
There is a brief description of TCP parameters in
/Documentation/networking/ip-sysctl.txt.
Tuning at Compile Time
All the above TCP parameter values are set default by a header file in the Linux
kernel source directory /LINUX-SOURCE-DIR/include/linux/skbuff.h
These values are default. This is run time configurable.
# ifdef
#define
#define
# else
#define
#define
#endif
CONFIG_SKB_LARGE
SK_WMEM_MAX 65535
SK_RMEM_MAX 65535
SK_WMEM_MAX 32767
SK_RMEM_MAX 32767
You can change the MAX-WINDOW value in the Linux kernel source directory
/LINUX-SOURCE-DIR/include/net/tcp.h.
#define MAX_WINDOW 32767
#define MIN_WINDOW 2048
Note: Never assign values greater than 32767 to windows,
without using window scaling.
The MIN_WINDOW definition limits you to using only 15bits of the window field in
the TCP packet header.
For example, if you use a 40kB window, set the rmem_default to 40kB. The stack
will recognize that the value is less than 64 kB, and will not negotiate a winshift. But
due to the second check, you will get only 32 kB. So, you need to set the
rmem_default value at greater than 64 kB to force a winshift=1. This lets you
express the required 40 kB in only 15 bits.
Optimizing HTTP Server Performance
4-5
TCP Tuning
With the tuned TCP stacks, it was possible to get a maximum throughput between
1.5 and 1.8 Mbits via a 2Mbit satellite link, measured with netperf.
Setting TCP parameters
To set the connection table hash parameter, on Intel Solaris, you must add the
following line to your /etc/system file, and then restart the system:
set tcp:tcp_conn_hash_size=32768
On Tru64, tcbhashsize can be set at /etc/sysconfigtab.
A sample script, tcpset.sh, that changes TCP parameters to the settings
recommended here, is included in the
$ORACLE_HOME/Apache/Apache/bin/ directory.
If your system is restarted after you run the script, the default settings will be
restored and you will have to run the script again. To make the settings permanent,
enter them in your system startup file.
Increasing TCP Connection Table Access Speed
If you have a large user population, you should increase the hash size for the TCP
connection table. The hash size is the number of hash buckets used to store the
connection data. If the buckets are very full, it takes more time to find a connection.
Increasing the hash size will reduce the connection lookup time, but increases
memory consumption.
Suppose your system performs 100 connections per second. On Intel Solaris, if you
set tcp_close_wait_interval to 60000, then there will be about 6000 entries in
your TCP connection table at any time. Increasing your hash size to 2048 or 4096
will improve performance significantly.
On a system servicing 300 connections per second, changing the hash size from the
default of 256 to a number close to the number of connection table entries decreases
the average round trip time by three to four seconds. The maximum hash size is
262144. Ensure that you increase memory as needed.
On Intel Solaris, to set the tcp_conn_hash_size, add the line below to your
/etc/system file. The parameter will take effect when the system is restarted.
set tcp:tcp_conn_hash_size=32768
On Tru64, tcbhashsize can be set at /etc/sysconfigtab.
4-6
Oracle HTTP Server powered by Apache Performance Guide
TCP Tuning
Specifying Retention time for Connection Table entries
The TCP connection table maintains data associated with connections. The server
maintains a TCP connection table entry for some time after a connection is closed,
so that it can identify and properly dispose of any leftover incoming packets from
the client.
Access speed to this table impacts performance; the access speed depends on the
number of entries in the table, and on its hash size. The number of entries in the
table depends on the rate of incoming requests, and the lifetime of each connection.
You can control the length of time that TCP connection table entries are maintained
with the tcp_close_wait_interval parameter (renamed
tcp_time_wait_interval on Solaris 2.7). This parameter is commonly set to
60,000 ms. Use the following command to set it (note the difference in parameter
name for Solaris 2.6 and 2.7).
On Solaris 2.6:
prompt>/usr/sbin/ndd -set /dev/tcp tcp_close_wait_interval 60000
On Solaris 2.7, and HP-UX:
prompt>/usr/sbin/ndd -set /dev/tcp tcp_time_wait_interval 60000
Note: If your user population is widely dispersed (with respect to
Internet topology), you may want to set this parameter to a higher
value. You can improve access time to the TCP connection table
with the tcp_conn_hash_size parameter.
Increasing the Handshake Queue Length
During the TCP connection handshake, the server, after receiving a request (SYN)
from a client, sends a reply, and waits to hear back from the client. The client
responds to the server’s message and the handshake is complete. Upon receiving
the first request from the client, the server makes an entry in the listen queue. After
the client responds to the server’s message, it is moved to the queue for messages
with completed handshakes. The second queue makes it possible for the server to
continue servicing requests for which the handshake has been completed.
On Intel Solaris, the maximum length of the queue for incomplete handshakes is
governed by tcp_conn_req_max_q0, which by default is 1024. The maximum
length of the queue for requests with completed handshakes is defined by
tcp_conn_req_max_q (default is 128).
Optimizing HTTP Server Performance
4-7
TCP Tuning
On most web servers, the defaults will be sufficient, but if you have more than 1024
concurrent users, these settings may be too low. In that case, connections will be
dropped in the handshake state because the queues are full. You can determine
whether this is a problem on your system by inspecting the values for
tcpListenDrop, tcpListenDropQ0, and tcpHalfOpenDrop with
netstat -s. If either of the first two values are nonzero, you should increase the
maximums.
The defaults are probably sufficient, but Oracle recommends that you increase the
value of tcp_conn_req_max_q to 1024. You can set these parameters with:
On Intel Solaris:
prompt>/usr/sbin/ndd -set /dev/tcp tcp_conn_req_max_q 1024
prompt>/usr/sbin/ndd -set /dev/tcp tcp_conn_req_max_q0 1024
On HP-UX:
prompt>/usr/sbin/ndd-set /dev/tcp tcp_conn_req_max 1024
Changing the Data Transmission Rate
Typically, all packets in a data transfer are sent at once. TCP implements a slow
starting data transfer to prevent overloading a busy segment of the Internet. With
slow start, one packet is sent, an acknowledgment is received, then two packets are
sent. The number sent to the server continues to be doubled after each
acknowledgment, until the TCP transfer window limits are reached.
Some versions of Microsoft Windows (including NT 4.0 and 95) do not
acknowledge receipt of a single packet when a connection is initiated, but if two
packets are received, an acknowledgment is sent immediately. Because Solaris sends
only one packet when initiating a connection (per the TCP standard), this can
increase the connection startup time. This is especially apparent on fast local
networks, where the latency is expected to be low.
You can configure Solaris to start with two packets when initiating a data transfer:
prompt>/usr/sbin/ndd -set /dev/tcp tcp_slow_start_initial 2
Changing the Data Transfer Window Size
The size of the TCP transfer windows for sending and receiving data determine
how much data can be sent without waiting for an acknowledgment. The default
window size is 8192 bytes. Unless your system is memory constrained, these
windows should be increased to the maximum size of 32768. This can speed up
4-8
Oracle HTTP Server powered by Apache Performance Guide
MaxClients
large data transfers significantly. Use the following commands to enlarge the
window.
On Intel Solaris:
prompt>/usr/sbin/ndd -set /dev/tcp tcp_xmit_hiwat 32768
prompt>/usr/sbin/ndd -set /dev/tcp tcp_recv_hiwat 32768
On HP-UX:
prompt>/usr/sbin/ndd -set /dev/tcp tcp_xmit_hiwater_def 32768
prompt>/usr/sbin/ndd -set /dev/tcp tcp_recv_hiwater_def 32768
Because the client typically receives the bulk of the data, it would help to enlarge
the TCP receive windows on end users’ systems.
MaxClients
The MaxClients directive limits the number of clients that can simultaneously
connect to your web server, and thus the number of httpd processes. You can
configure this parameter in the httpd.conf file up to a maximum of 1024 in Oracle9i
Application Server v. 1.0.2 (in the previous version, the maximum was 256). The
default is 150, which should be adequate for most uses. If the MaxClients setting
is too low, and the limit is reached, clients will be unable to connect.
Increasing MaxClients when system resources are saturated does not improve
performance. When there are no httpd processes available, connection requests are
queued in the TCP/IP system until a process becomes available, and eventually
clients terminate connections.
Note: If you are using persistent connections, you may require
more concurrent httpd server processes. See "httpd Process
Availability" on page 4-13 for a discussion of the relationship
between persistent connections and the number of server processes.
For dynamic requests, if the system is heavily loaded, it might be better to allow the
requests to queue in the network (thereby keeping the load on the system
manageable). The question for the system administrator is whether a timeout error
and retry is better than a long response time. In this case, the MaxClients setting
Optimizing HTTP Server Performance
4-9
SSL Session Caching
could be reduced, to act as a throttle on the number of concurrent requests on the
server.
SSL Session Caching
The Oracle HTTP server caches a client’s SSL session information by default. With
session caching, only the first connection to the server incurs high latency. For
example, in a simple test to connect and disconnect to an SSL-enabled server, the
elapsed time for 5 connections was 11.4 seconds without SSL session caching. With
SSL session caching enabled, the elapsed time for 5 round trips was 1.9 seconds.
The SSLSessionCacheTimeout directive in httpd.conf determines how long the
server keeps a session alive (the default is 300 seconds). The session information is
kept in a file. You can specify where to keep the session information using the
SSLSessionCache directive; the default location is the
$ORACLE_HOME/Apache/Apache/logs/ directory. The file can be used by
multiple Oracle HTTP Server processes.
The duration of an SSL session is unrelated to the use of HTTP persistent
connections.
Impact of Logging
This section discusses types of logging, log levels, and the performance implications
for using them.
Access Logging
For static page requests, access logging of the default fields results in a 2-3%
performance cost.
HostNameLookups
By default, the HostNameLookups directive is set to off. The server writes the IP
addresses of incoming requests to the log files. When HostNameLookups is set to
on, the server queries the DNS system on the Internet to find the host name
associated with the IP addresses of each request, then writes the host names to the
log.
Performance degraded by about 3% (best case) in Oracle in-house tests with
HostNameLookups set to on. Depending on the server load and the network
connectivity to your DNS server, the performance cost of the DNS lookup could be
high. Unless you really need to have host names in your logs in real time, it is best
4-10
Oracle HTTP Server powered by Apache Performance Guide
HTTP/1.1
to log IP addresses. You can resolve IP addresses to host names off-line, with the
logresolve utility (found in the $ORACLE_HOME/Apache/Apache/bin/ directory).
For more information, see Dale Gaudet’s Apache Performance Notes at:
http://www.apache.org/docs/misc/perf-tuning.html
Error logging
The server notes unusual activity in an error log. The ErrorLog and LogLevel
directives identify the log file and the level of detail of the messages recorded. The
default level is warn. There was no difference in static page performance on a
loaded system between the warn, info, and debug levels.
For more information on the LogLevel directive, see:
http://www.apache.org/docs/mod/core.html#loglevel
HTTP/1.1
The Oracle HTTP server can use HTTP/1.1. Netscape Navigator 4.0 still uses
HTTP/1.0, with some 1.1 features, such as persistent connections. Internet Explorer
uses HTTP/1.1. The performance benefit of persistent connections comes from
reducing the overhead of repeatedly establishing and tearing down connections
(one per request). A persistent connection accepts multiple requests from a user.
For a small static page request, the connection latency can equal or exceed the
response latency (the time to fulfill the request after the connection is established),
so using persistent connections can result in major performance gains.
For more information about performance and the HTTP/1.1 protocol, see:
http://www.w3.org/Protocols/HTTP/Performance/Pipeline.html
Persistent Connections
If your users’ browsers support persistent connections (the default behavior of
HTTP/1.1), you can support them on the server using the KeepAlive directives in
Apache. (Some browsers that do not support all HTTP/1.1 features do support
persistent connections; for example, recent versions of Netscape.)
Optimizing HTTP Server Performance 4-11
HTTP/1.1
Shorter Response Times
Persistent connections can improve total response time for a web interaction that
involves multiple HTTP requests, because the delay of setting up a connection only
happens once.
Consider the total time required, without persistent connections, for a client to
retrieve a web page with three images from the server.
Activity
Seconds
Establish connection
1
Produce and send the text
portion of the page
5
Establish connection
1
Transfer first image file
2
Establish connection
1
Transfer second image file
2
Establish connection
1
Transfer third image file
2
Total 15
With persistent connections, the response time for the same request is reduced:
Activity
Seconds
Establish connection
1
Produce and send the text
portion of the page
5
Transfer first image file
2
Transfer second image file
2
Transfer third image file
2
Total 12
4-12
Oracle HTTP Server powered by Apache Performance Guide
HTTP/1.1
This is a 20% reduction in service time. When the system is under load, the benefit
of reducing connection time with persistent connections is even greater, due to the
corresponding reduction of the TCP queue.
Reduction in Server Workload
Another benefit of persistent connections is reduction of the work load on the
server. Because the server need not repeat the work to set up the connection with a
client, it is free to perform other work. For a very inexpensive servlet (Hello World),
the CPU ms per request was reduced by approximately 10% when the same client
made 4 requests per connection. (The impact would be far less significant for a
realistic servlet application that does more work.)
httpd Process Availability
There are some serious drawbacks to using persistent connections with Apache. In
particular, because httpd processes are single threaded, one client can keep a
process tied up for a significant period of time (the amount of time depends on your
KeepAlive settings). If you have a large user population, and you set your
KeepAlive limits too high, clients could be turned away because of insufficient
httpd deamons.
The default settings for the KeepAlive directives are:
KeepAlive on
MaxKeepAliveRequests 100
KeepAliveTimeOut 15
These settings allow enough requests per connection and time between requests to
reap the benefits of the persistent connections, while minimizing the drawbacks.
You should consider the size and behavior of your own user population in setting
these values on your system. For example, if you have a large user population and
the users make small infrequent requests, you may want to reduce the above
settings, or even set KeepAlive to off. If you have a small population of users that
return to your site frequently, you may want to increase the settings.
FIN_WAIT_2
There is a known problem with some browsers which will leave the server with a
TCP connection in the FIN_WAIT_2 state. If too many connections are left in this
state, the system will run out of the memory allocated for storing TCP connections,
and stop.
Optimizing HTTP Server Performance 4-13
Apache Versions
The problem is that when a connection becomes idle, and the server closes it
because the keep alive time limit has expired, the client host may not perform the
TCP protocol steps required to complete the closure of the connection. The host,
having sent the close request, is left with the connection in the FIN_WAIT_2 state
taking up memory until it gets the appropriate packets back from the client, or until
an internal flush occurs. If a connection is left in the FIN_WAIT_2 state, the httpd
process with which the connection is associated is freed to service other requests as
indicated, so this problem won’t tie up web server processes.
Apache Versions
The difference between Apache versions 1.3.9 and 1.3.12 was primarily corrected
bugs. With static page and servlet performance measurements, there was no
performance difference measured between the versions.
4-14
Oracle HTTP Server powered by Apache Performance Guide
5
Optimizing Apache JServ
This chapter describes the JServ architecture, and discusses ways you can improve
its performance. It also includes performance information on OracleJSP pages (the
Oracle implementation of Sun Microsystems’ JavaServer Pages 1.1.)
Contents
■
JServ Overview
■
Optimizing Servlet Performance
■
What is OracleJSP?
■
OracleJSP Page Performance Tuning
Optimizing Apache JServ
5-1
JServ Overview
JServ Overview
Apache JServ is made up of an Apache module called mod_jserv, which runs in the
httpd process, and a servlet engine, which runs in a Java process. mod_jserv, which
is implemented in C, functions as a dispatcher, routing each servlet request to a
JServ process for execution.
The servlet engine runs in its own JVM and is solely responsible for parsing the
request and generating a response. As Figure 5–1 shows, multiple JServs can service
requests. The HTTP server process and the JServ process communicate using the
Apache JServ Protocol 1.2.
Figure 5–1 Apache JServ components
5-2
Oracle HTTP Server powered by Apache Performance Guide
Optimizing Servlet Performance
Optimizing Servlet Performance
This section discusses strategies for optimizing JServ performance: loading servlets
when starting the JVM, and load balancing.
The terms “repository” and “zone” are used in this discussion. Servlets,
repositories, and zones are analogous to files, directories and virtual hosts. A servlet
is a single unit, a repository is a collection of servlets, and a zone is a collection of
repositories.
Loading Servlet Classes
Apache JServ allows you to load servlet classes when the JVM is started. To do this,
put the servlets to load in the servlets.startup directive in the servlet zone
properties file. When the servlet is loaded, its init()method is called. All other
servlets (those not listed in servlets.startup) are loaded and initialized on first
request.
Using this facility increases the start-up time for your JServ process, but improves
first-request latency for servlets.
Pre-Loading with JSPs
If you are using a JSP as the servlet (your code does not extend HttpServlet), you
will be unable to use this pre-load option, but you could pre-load the JSP runner by
including the oracle.jsp.jspServlet in servlets.startup.
If the first-request latency for your initialization routines is really a performance
issue, you can achieve some of the results described above by creating a dummy
servlet to call your one-time initialization routines in its init() method. You must
add the name of the dummy servlet to servlets.startup.
Automatic Class Reloading
If autoreload.classes is set to true for a zone (the default), then each time one
of that zone’s servlets is requested, every class that has been loaded from a
repository in that zone is checked to see if it has been modified. If one of the classes
has changed, then all previously loaded classes from the zone’s repositories are
unloaded, which means that as the classes are needed, they will be loaded from
their class files again.
This is a useful development feature, because you can install new versions or drop
in new class files without restarting the server. For optimal performance in
production environments, however, you should set both automatic class reloading
Optimizing Apache JServ
5-3
Optimizing Servlet Performance
parameters to false, since there is a performance cost in checking the repositories on
every execution of a servlet. Change these parameters in the zone properties file:
autoreload.classes=false
autoreload.file=false
Load Balancing
It is often beneficial to spread the servlet application load among multiple JServ
processes, especially when the application is run on a multiprocessor or if the
servlets and HTTP server are run on separate nodes. Running multiple Apache
JServ processes generally results in higher throughput and shorter response time,
even on a single-processor host. (See Chapter 3, "Sizing and Configuration" for
specific recommendations.)
This section explains how to balance incoming requests between two JServ
processes running on the same host as the HTTP server. Examples from the
jserv.properties files are included with the procedures; substitute your own port
numbers and directory locations where needed.
If you use load balancing, you must start and stop processes manually, because
JServ cannot automatically start and stop more than one JServ process. (Sample
scripts for starting and stopping the JServ processes and the Oracle HTTP Server are
included in the $ORACLE_HOME/Apache/Apache/bin/ directory.) This means
that if a process terminates for any reason, JServ will not restart it. To prevent
processes from terminating due to memory shortage, ensure that you have a
sufficient maximum heap size set for your JServ processes. See "Determining Java
Heap Size" on page 3-4.
Configuring the JServ processes
Each JServ process in your load balancing scheme must be configured to listen on
its own port and to log to its own file. If you have a jserv.properties file containing
the parameters needed to run your application, you can duplicate it to create a
properties file for each JServ process.
1.
Create a properties file for each JServ process.
prompt>cp jserv.properties jserv1.properties
prompt>cp jserv.properties jserv2.properties
2.
Edit jserv1.properties as follows:
port=8001
log.file=/usr/local/jserv/logs/jserv1.log
5-4
Oracle HTTP Server powered by Apache Performance Guide
Optimizing Servlet Performance
3.
Edit jserv2.properties as follows:
port=8002
log.file=/usr/local/jserv/logs/jserv2.log
Note: If your HTTP server will be running on a different host than
the JServ processes, you must also add the IP address of the host
running the HTTP server to the security.allowedAddresses
parameter in each jserv.properties file.
If JServ is included in your CLASSPATH, you can start the JServ processes with
these commands:
java JServ jserv1.properties
java JServ jserv2.properties
To start and stop the processes and the web server, it is convenient to use scripts.
Samples are included in the $ORACLE_HOME/Apache/Apache/bin/ directory
(startJServ. sh and stopJServ.sh).
Modifying jserv.conf to distribute the load
1.
Set the flag to start processes manually.
ApJServManual on
2.
Indicate where the servlet request is to be sent.
a.
Locate the ApJServMount directive.
ApJServMount /servlets /root
If the user requests http://your.server.com/servlets/testServlet, the
ApJServMount directive above will execute testServlet in the zone called
/root.
b.
Change the zone identifier from /root to balance://set/root and
then add the directives needed to describe the processes sharing the load:
ApJServMount /servlets balance://JServ_set/root
ApJServBalance JServ_set JServ1
ApJServBalance JServ_set JServ2 2
ApJServHost JServ1 ajpv12://127.0.0.1:8001
Optimizing Apache JServ
5-5
Optimizing Servlet Performance
ApJServHost JServ2 ajpv12://127.0.0.1:8002
ApJServRoute JS1 JServ1
ApJServRoute JS2 JServ2
ApJServShmFile /usr/local/apache/logs/jserv_shm
*
The ApJServMount directive, with /servlets
balance://set/root, now balances requests for servlets in /servlets
between JServ1 and JServ2.
*
The ApJServBalance directive identifies JServ1 and JServ2 as the
processes that share the load. The ’2’ following JServ2 is a weight value.
It specifies that twice as many requests will be sent to JServ2 as would
be otherwise, i.e., that JServ2 will get about 2/3 of all incoming
requests. See "Distribution of JServ Requests" below for details.
*
The ApJServHost directive identifies the host and port on which the
processes are listening.
*
The ApJServRoute directive associates JServ processes with sessions.
JServ uses this information to keep all of a session’s requests together in
one process. The JServ session mechanism sends the process route
information back to the user (generally in a cookie). You need only
modify it if your application uses sessions.
*
The ApJServShmFile directive specifies a shared memory file that the
httpd processes may use to track the state of the JServ processes.
Distribution of JServ Requests
mod_jserv selects the JServ engine to handle a request using the process outlined
below:
1.
An httpd process is started.
2.
mod_jserv creates a list of available JServs, with extra entries for JServs with a
weight value greater than 1 (for example, JServ2 in our example above, as
specified by ApJServBalance set JServ2 2).
3.
An httpd daemon receives a servlet request and hands it to mod_jserv.
4.
mod_jserv selects the JServ engine that will handle the request.
a.
5-6
mod_jserv checks to see if the request is part of a current session. If so, it
uses the ApJServRoute directives to find the JServ that handled the other
requests for that session.
Oracle HTTP Server powered by Apache Performance Guide
Optimizing Servlet Performance
b.
If the request is not part of a session, mod_jserv selects an engine based on
the process ID of the httpd process and the number of entries in the list of
available JServs, as follows:
JServ_id to handle the request = httpd_pid % number of JServs in the list
This method distributes requests across the available JServ engines fairly
evenly.
Using Single Thread Model Servlets
Oracle recommends that you write your servlets to implement the
SingleThreadModel (STM) interface. An application that was modified to
implement the STM interface demonstrated a 25% improvement in response time,
probably due to a decrease in synchronization bottlenecks.
It is also much easier to manage database connections with STM servlets. The
database connection can be set up in the init() method of the servlet, and closed
in the destroy() method. When executing the servlet’s doGet() or service()
method, you need not be concerned with obtaining a database connection.
Alternatively, you can use JDBC connection caching.
There are three parameters in the zone.properties file that impact the performance
of STM servlets in particular. These govern:
■
The minimum number of servlet object instances that will be generated and
available after the servlet class is loaded
■
The maximum number that can be generated
■
The number that should be generated if the available instances are insufficient
Because it is very costly to generate instances while the system is running, Oracle
recommends that you set your minimum to equal your maximum value. The
optimum value depends somewhat on how many connections your database server
can handle. This should be split among the JServ processes, as follows:
Total DB connections / Number of JServ processes = Number of STM servlet
instances per process
See Chapter 3, "Sizing and Configuration" for suggestions on determining the right
number of JServ processes for your application, and "Load Balancing" on page 5-4
for the steps to configure them. Suppose you’ve determined that you want 10
servlet instances per process. Then, in the properties file for your zone, set:
Optimizing Apache JServ
5-7
What is OracleJSP?
singleThreadModelServlet.initialCapacity = 10
singleThreadModelServlet.incrementCapacity = 0
singleThreadModelServlet.maximumCapacity = 10
Warning: The value for
singleThreadModelServlet.maximumCapacity in the zone
properties file must be at least as large as the value for
security.maxConnections in the jserv.properties file. If it is not,
and the number of requests sent to the JServ process exceeds the
maximum capacity, requests will fail.
What is OracleJSP?
OracleJSP 1.1.0.0 is Oracle’s implementation of the Sun Microsystems JavaServer
Pages 1.1 specification. Some of the additional features it includes are custom
JavaBeans for accessing Oracle databases, SQL support, and extended data types.
See the Oracle Internet Application Server 8i Overview Guide in the Oracle Internet
Application Server 8i documentation library for detailed descriptions of the
features.
OracleJSP Page Performance Tuning
This section explains how you can improve OracleJSP pages’ performance.
Impact of Session Management
In general, sessions add performance overhead; they consume about 0.5 KB of
resident memory. You must turn off sessions if you do not want a new session to be
created with each request. By default, sessions are enabled in OracleJSPs, so if they
are not being used, turn them off by including the following line at the top of the
page:
<%@ page session="false" %>
If you are going to use sessions, ensure that you explicitly close them. If you don’t,
they will linger until they time out (the default value for session timeout is 30
minutes). To close a session manually, use the session.invalidate() method.
See the OracleJSP Developer’s Guide and Reference in the Oracle Internet Application
Server 8i documentation library for more information on configuring OracleJSP
pages.
5-8
Oracle HTTP Server powered by Apache Performance Guide
OracleJSP Page Performance Tuning
Developer Mode
Another parameter that has a significant effect on performance is developer mode.
It is a useful feature for debugging during development, but it degrades
performance. The default value is true, so you will need to set it to false in the
jserv.properties file as follows:
servlet.oracle.jsp.JspServlet.initArgs=developer_mode=false
With developer mode set to true, OracleJSP and the servlet engine examines every
request to determine whether to reload or retranslate the page or application. With
developer mode off, only the first request is examined.
In a test using JDK 1.2 with 50 users, 128 MB heap, and the default TCP settings, the
performance gains with developer mode off were 14% in throughput, and 28% in
average response time.
Buffering
If an OracleJSP page is not using any features that do not require resetting the buffer
(such as error pages, contextType settings, forwards, etc.), disabling the JSP page
buffer will improve performance. This is because memory will not be used in
creating the buffer, and the output can go directly to the browser. Use this page
directive to disable buffering:
<%@ page buffer=”none” %>
The default size of an OracleJSP page buffer is 8 KB.
Enhancing OracleJSP Performance
The Oracle JavaServer Pages Developer’s Guide and Reference provide detailed
information about Oracle JSP pages, implementation guidelines, configuration
issues, and performance tips, listed below:
Caching database connections
Since creating database connections is very expensive, it is more performant to use a
cache of connections. The OracleJSP application can then get a connection from the
pool of database connections and return it when it is finished.
Optimizing Apache JServ
5-9
OracleJSP Page Performance Tuning
Update statement batching
The JDBC driver accumulates a number of execution requests (the batch value) and
passes them to the database to be processed at the same time. You can configure the
batch value to control how frequently processing occurs.
JDBC statement caching
Cache executable statements that are repeatedly used, to avoid re-parsing,
statement object recreation, and recalculation of parameter size definitions.
Pre-fetching rows
During a query, pre-fetch multiple rows into the client to reduce round trips
between the database and the server.
Caching rowsets from the database
Cache small sets of data that are accessed frequently and do not change often. This
is not as beneficial for large data sets, since they consume more memory.
Using static includes
To invoke static includes, use the page directive:
<%@ include file=“/jsp/filename.jsp” %>
Static include creates a copy of the file in the JSP, thereby affecting its page size. This
is useful in avoiding trips to the request dispatcher (unlike dynamic includes, which
must go through the request dispatcher each time). However, file sizes should be
small to avoid exceeding the 64K limit of the service method of the generated page
implementation class.
Dynamic include
To invoke dynamic includes, use the page directive
<jsp:include page=”/jsp/filename.jsp” flush="true" />
This directive is analogous to a function call, and therefore does not increase the
page size of the JSP. However, a dynamic include increases the processing overhead
since it must go through the request dispatcher. Dynamic includes are useful for
including other pages without increasing page size.
5-10
Oracle HTTP Server powered by Apache Performance Guide
Index
A
D
Apache JServ Protocol 1.2, 5-2
ApJServBalance, 5-5
ApJServManual, 5-5
ApJServMount, 5-5
ApJServRoute, 5-6
ApJServShmFile, 5-6
architecture
JServ, 5-2
Oracle Internet Application Server 8i,
database connection, 5-7
demand limiter, 1-6
demand rate, 1-5, 1-6
developer_mode, 5-9
E
ExtendedStatus,
2-4
1-10
F
C
caching
database connections, 5-9
SSL, 3-3
capacity, 1-6
concurrency
defined, 1-2
limiting, 1-7
concurrent executing users, 3-2
concurrent users, 3-2, 4-8
MaxClients and, 3-2
connection caching, 5-7
contention, 1-4
CPU
insufficient, 1-4
statistics, 2-2
usage, 2-2
cron, 2-7
functional demand,
1-6
G
graceful shutdown,
2-10
H
harsh shutdown,
2-10
J
JDBC, 5-7
JServ
described, 5-2
load balancing, 5-4
process start-up time, 5-3
processes per CPU, 3-6
processes, load balancing, 5-4
starting and stopping processes,
threads per, 3-6
JServ Protocol 1.2, 5-2
5-4
Index-1
jserv.conf, 2-8
jserv.properties,
JSP, 5-8
5-4
L
latency
defined, 1-2
first-request, 5-3
network, 3-1
load balancing, 5-4
load variances, 1-8
logging, 4-10
M
MaxClients
concurrent users and, 3-2
configuring, 4-9
increasing, 2-6
memory usage, 3-4
mod_jserv, 5-2, 5-6
mod_status, 2-3, 2-7
monitoring
CPU usage, 2-2
httpds processes, 2-4, 2-5
JServ processes, 2-8
server, 2-6
server side status, 2-3
server, automating, 2-6
mpstat, 2-2
O
Oracle Internet Application Server 8i
architecture, 1-10
oracle.jsp.jspServlet, 5-3
P
performance goals, 1-7, 3-1
protocol
Apache JServ 1.2, 5-2
HTTP/1.1, 4-11
SSL, 3-3
Index-2
R
repository, defined, 5-3
response time, 1-4
defined, 1-2
goal, 1-7
improving, 1-3
peak load, 1-8
sizing and, 3-2
S
sar utility, 2-2
scalability
defined, 1-2
monitoring, 2-2
security.allowedAddresses, 5-5
security.maxConnections, 3-6
server statistics, 2-4
server-side status information, 2-3
server-status, 2-4
service time, 1-3
defined, 1-2
servlet
database connection and, 5-7
engine, 5-2
pre-loading classes, 5-3
SingleThreadModel interface and,
zone properties file, 5-3
servlets.startup, 5-3
sessions
JServ processes and, 5-6
SSL and, 4-10
SetHandler, 2-4
shutdown, 2-10
SSL
defined, 3-3
performance cost, 3-3
session caching, 4-10
statistics
CPU, 2-2
server, 2-4, 2-6
status reports, 2-3
5-7
T
think time
defined, 1-2
resources and, 3-1
thread
limit, 3-6
throughput
defined, 1-2
demand limiter and,
increasing, 1-4
1-6
U
unit consumption, 1-6
uptime, 2-4
users, concurrent, 3-2
utilities
sar, 2-2
W
wait time
contention and, 1-4
defined, 1-2
parallel processing and,
1-4
Z
zone, defined, 5-3
zone.properties, 5-7
Index-3
Index-4


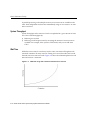
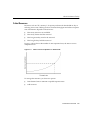


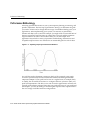

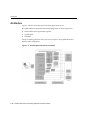

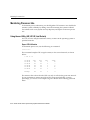


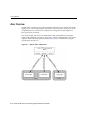


![[1 ] Oracle® Enterprise Manager](http://vs1.manualzilla.com/store/data/005669073_1-0396df232df5e560fdd03210f5126330-150x150.png)
