1
MANAGEMENT GUIDE
EliteViewTM 6.20
SNMP-Based
Network Management Softwarefor Windows™
EliteView™
User Guide
SNMP-Based Network Management Software for Windows™
20 Mason
Irvine, CA 92618
Phone: (949) 679-8000
May 2008
Pub. # 149100039100A
E052008-DG-R6.20
Information furnished by SMC Networks, Inc. (SMC) is believed to be accurate and reliable. However, no responsibility is
assumed by SMC for its use, nor for any infringements of patents or other rights of third parties which may result from its
use. No license is granted by implication or otherwise under any patent or patent rights of SMC. SMC reserves the right to
change specifications at any time without notice.
Copyright © 2008 by
SMC Networks, Inc.
20 Mason
Irvine, CA 92618
All rights reserved.
Trademarks:
SMC is a registered trademark; and EliteView, EZ Switch, TigerStack and TigerSwitch are trademarks of SMC Networks, Inc. Other product and company names are
trademarks or registered trademarks of their respective holders.
Licence Agreement
The Purchaser MUST read this agreement before using the software provided in this package. As used in this Agreement the terms “You”,
“Your”, “LICENSEE”, and “Purchaser” refer to the licensee of the SOFTWARE and accompanying written materials in this package, as
described below. If you do not agree to the terms of this License Agreement, return the package, unused, to the point of purchase for a refund
of any license fee which you paid.
1. Grant of license
SMC Networks, Inc. (SMC) grants to you a non-exclusive right to use one copy of the program (hereinafter the “SOFTWARE”). The
SOFTWARE is provided by SMC on CD-ROM. SMC also grants to you a non-exclusive right to use the programs on the enclosed CD-ROM
(hereinafter the “SOFTWARE”) on one local area network. SMC reserves all rights not expressly granted to the LICENSEE.
2. Ownership of license
All SOFTWARE, and each copy thereof, remains the property of SMC and/or one or more of its licensors. This license is not a sale of any
SOFTWARE, or of any copy. You disclaim forever any rights of ownership in any SOFTWARE, or in any copy. The only rights that you obtain
with respect to any SOFTWARE are those expressly set forth in this License Agreement.
3. Copy restriction
You acknowledge that the SOFTWARE and accompanying written materials are copyrighted and entitled to protection under the copyright
laws of nations where the SOFTWARE is installed, and under international conventions. Except for the copying of SOFTWARE as expressly
permitted in the next sentence, you may not copy any SOFTWARE or accompanying written materials, or any portion of any of them, or
remove any copyright or proprietary notice from any of them; and you agree not to allow any other person or entity to do so. Subject to these
restrictions, you may make copies of the SOFTWARE solely for backup purposes.
4. Use restriction
As the LICENSEE, you may physically transfer the SOFTWARE from one computer to another within a licensed local area network. You may
not distribute copies of the SOFTWARE or accompanying written materials to others. Furthermore, the LICENSEE is not permitted to modify, disassemble, reverse or de-engineer, or create any derivative works based on the SOFTWARE.
5. Transfer restrictions
This SOFTWARE is licensed only to you, the LICENSEE, and may not be transferred to anyone without prior written consent of SMC. Any
authorized transferee of the SOFTWARE shall be bound by the terms and conditions of this Agreement. In no event may you transfer, assign,
rent, lease, sell or otherwise dispose of the SOFTWARE on a temporary or permanent basis except as expressly provided herein.
6. Termination
This license agreement is effective until terminated by SMC. This license may be terminated without notice by SMC if the LICENSEE fails to
comply with any provision of this license. Upon termination, it is the LICENSEE’s obligation to destroy the written materials and all copies of
the SOFTWARE. Further use of the SOFTWARE components will be in violation of this license.
Limited Warranty
The Warranty Period for the media on which the SOFTWARE is recorded is for 5 years from the date of its delivery to the original user as evidenced by a receipt.
You must give SMC prompt written notice within the Warranty Period of any warranty claim. Conditioned on your providing prompt written
notice to SMC within the Warranty Period, SMC shall, as your sole and exclusive remedy, repair or replace media not conforming to this warranty, or accept return of any such nonconforming media. The election of whether to repair, replace, or refund shall be SMC’s, in its sole discretion.
i
EXCEPT FOR THE EXPRESS WARRANTY SET FORTH ABOVE IN THIS LIMITED WARRANTY SECTION, THERE ARE NO
WARRANTIES, EITHER EXPRESS OR IMPLIED. THE SOFTWARE IS PROVIDED AS IS, WITH ALL FAULTS. SMC DISCLAIMS
AND EXCLUDES ANY AND ALL WARRANTIES, INCLUDING WITHOUT LIMITATION ANY AND ALL IMPLIED
WARRANTIES OF MERCHANTABILITY, FITNESS FOR A PARTICULAR PURPOSE, AGAINST INFRINGEMENT AND THE
LIKE, AND ANY AND ALL WARRANTIES ARISING FROM ANY COURSE OF DEALING OR USAGE OF TRADE. YOU
ACKNOWLEDGE THAT YOU ARE NOT RELYING ON SMC’S SKILL OR JUDGEMENT TO SELECT OR FURNISH SUITABLE
GOODS.
PRODUCTS AND SERVICES PROVIDED BY SMC ARE NOT DESIGNED, INTENDED OR AUTHORIZED FOR USE IN ANY
LIFE SUPPORT OR OTHER APPLICATION WHERE PRODUCT FAILURE COULD CAUSE OR CONTRIBUTE TO PERSONAL
INJURY OR SUBSTANTIAL PROPERTY DAMAGE. IF YOU APPLY ANY PRODUCT OR SERVICE PURCHASED OR LICENSED
FROM SMC TO ANY SUCH UNINTENDED OR UNAUTHORIZED USE, YOU SHALL INDEMNIFY AND HOLD SMC, ITS
AFFILIATES AND THEIR RESPECTIVE SUPPLIERS, HARMLESS AGAINST ALL CLAIMS, COSTS, DAMAGES AND EXPENSES
ARISING, DIRECTLY OR INDIRECTLY, OUT OF ANY SUCH UNINTENDED OR UNAUTHORIZED USE, EVEN IF SUCH
CLAIM ALLEGES THAT SMC OR ANY OTHER PERSON OR ENTITY WAS NEGLIGENT IN DESIGNING OR MANUFACTURING THE PRODUCT.
Limitation of Liability and Damages
IN NO EVENT SHALL SMC BE LIABLE FOR INCIDENTAL, INDIRECT, SPECIAL, PUNITIVE, OR CONSEQUENTIAL DAMAGES; OR FOR LOST PROFITS, SAVINGS OR REVENUES OF ANY KIND; OR FOR ANY ACTUAL DAMAGES IN EXCESS OF
$100,000; REGARDLESS OF THE FORM OF ACTION, WHETHER BASED ON CONTRACT; TORT; NEGLIGENCE OF SMC OR
OTHERS; STRICT LIABILITY; BREACH OF WARRANTY; OR OTHERWISE; WHETHER OR NOT ANY REMEDY IS HELD TO
HAVE FAILED OF ITS ESSENTIAL PURPOSE, AND WHETHER OR NOT SMC HAS BEEN ADVISED OF THE POSSIBILITY OF
SUCH DAMAGES.
Copyright © 2008 by
SMC Networks, Inc.
20 Mason
Irvine, CA 92618
ii
ABOUT THIS GUIDE
About This Guide
Welcome to EliteView network management software. This guide describes the procedures for installing and using
this program. Detailed instructions on how to use every module and practical examples make it easy for you optimize the performance and efficiency of your network.
General Manual Coverage
This manual is your guide to using EliteView to manage all your network resources. It covers the following topics:
Introduction to EliteView
Software Installation
Getting Started
Mapping Out Your Network
Basic Management Tools
SNMP MIB Management
Logging Network Statistics
Managing Events
Using RMON
Chapter 1
Chapter 2
Chapter 3
Chapter 4
Chapter 5
Chapter 6
Chapter 7
Chapter 8
Chapter 9
Conventions Used in this Manual
This manual uses a variety of editorial and typographical conventions to help you locate and interpret information
easily. These conventions are:
italics
Italicized words refer to keyboard keys you have to press, menu options you have to select to
invoke an action, or a section in this manual or another manual you can consult for reference.
For example: <Enter>, Reboot
Courier New Words shown in Courier New typeface are used to represent screen displays, filenames, or
commands you must enter to initiate an action.
Additional References
System Help
Help files may be accessed directly from EliteView via on-line help. To get help, select Help from the menu bar and
then click on Index. Last-minute information regarding EliteView has been recorded in the README.TXT file.
iii
iv
CONTENTS
1
Introduction . . . . . . . . . . . . . . . . . . . . . . . . . . . . . . . . . . . . . . . . . . . . . . . . . . . . . . . . . . 1-1
General Description . . . . . . . . . . . . . . . . . . . . . . . . . . . . . . . . . . . . . . . . . . . . . . . . . . . . . . . . . . . . . . . . . . . . . . . . . . 1-1
Management Functions . . . . . . . . . . . . . . . . . . . . . . . . . . . . . . . . . . . . . . . . . . . . . . . . . . . . . . . . . . . . . . . . . . . . . . . 1-2
Application Interface . . . . . . . . . . . . . . . . . . . . . . . . . . . . . . . . . . . . . . . . . . . . . . . . . . . . . . . . . . . . . . . . . . . . . . . . . 1-2
Features of EliteView . . . . . . . . . . . . . . . . . . . . . . . . . . . . . . . . . . . . . . . . . . . . . . . . . . . . . . . . . . . . . . . . . . . . . . . . . 1-3
2
Installation . . . . . . . . . . . . . . . . . . . . . . . . . . . . . . . . . . . . . . . . . . . . . . . . . . . . . . . . . . .2-1
Installation for EliteView . . . . . . . . . . . . . . . . . . . . . . . . . . . . . . . . . . . . . . . . . . . . . . . . . . . . . . . . . . . . . . . . . . . . . . 2-1
System Requirements . . . . . . . . . . . . . . . . . . . . . . . . . . . . . . . . . . . . . . . . . . . . . . . . . . . . . . . . . . . . . . . . . . . 2-1
Using SETUP to Install EliteView . . . . . . . . . . . . . . . . . . . . . . . . . . . . . . . . . . . . . . . . . . . . . . . . . . . . . . . . 2-2
3
Getting Started . . . . . . . . . . . . . . . . . . . . . . . . . . . . . . . . . . . . . . . . . . . . . . . . . . . . . . . .3-1
Overview . . . . . . . . . . . . . . . . . . . . . . . . . . . . . . . . . . . . . . . . . . . . . . . . . . . . . . . . . . . . . . . . . . . . . . . . . . . . . . . . . . 3-1
Network Interface . . . . . . . . . . . . . . . . . . . . . . . . . . . . . . . . . . . . . . . . . . . . . . . . . . . . . . . . . . . . . . . . . . . . . 3-1
Event-Driven, Modular Architecture . . . . . . . . . . . . . . . . . . . . . . . . . . . . . . . . . . . . . . . . . . . . . . . . . . . . . . 3-1
EliteView Modules . . . . . . . . . . . . . . . . . . . . . . . . . . . . . . . . . . . . . . . . . . . . . . . . . . . . . . . . . . . . . . . . . . . . . . . . . . . 3-2
Alive Test . . . . . . . . . . . . . . . . . . . . . . . . . . . . . . . . . . . . . . . . . . . . . . . . . . . . . . . . . . . . . . . . . . . . . . . . . . . . 3-2
Backup . . . . . . . . . . . . . . . . . . . . . . . . . . . . . . . . . . . . . . . . . . . . . . . . . . . . . . . . . . . . . . . . . . . . . . . . . . . . . . . 3-2
BatchUp . . . . . . . . . . . . . . . . . . . . . . . . . . . . . . . . . . . . . . . . . . . . . . . . . . . . . . . . . . . . . . . . . . . . . . . . . . . . . 3-2
BOOTP Server . . . . . . . . . . . . . . . . . . . . . . . . . . . . . . . . . . . . . . . . . . . . . . . . . . . . . . . . . . . . . . . . . . . . . . . . 3-2
Device Manager . . . . . . . . . . . . . . . . . . . . . . . . . . . . . . . . . . . . . . . . . . . . . . . . . . . . . . . . . . . . . . . . . . . . . . . 3-2
Discovery . . . . . . . . . . . . . . . . . . . . . . . . . . . . . . . . . . . . . . . . . . . . . . . . . . . . . . . . . . . . . . . . . . . . . . . . . . . . 3-3
EliteView Main Program . . . . . . . . . . . . . . . . . . . . . . . . . . . . . . . . . . . . . . . . . . . . . . . . . . . . . . . . . . . . . . . . 3-3
Event Manager . . . . . . . . . . . . . . . . . . . . . . . . . . . . . . . . . . . . . . . . . . . . . . . . . . . . . . . . . . . . . . . . . . . . . . . . 3-3
Log Utilities . . . . . . . . . . . . . . . . . . . . . . . . . . . . . . . . . . . . . . . . . . . . . . . . . . . . . . . . . . . . . . . . . . . . . . . . . . . 3-3
MIB Browser . . . . . . . . . . . . . . . . . . . . . . . . . . . . . . . . . . . . . . . . . . . . . . . . . . . . . . . . . . . . . . . . . . . . . . . . . 3-3
MIB Compiler . . . . . . . . . . . . . . . . . . . . . . . . . . . . . . . . . . . . . . . . . . . . . . . . . . . . . . . . . . . . . . . . . . . . . . . . . 3-4
MIB-2 Viewer . . . . . . . . . . . . . . . . . . . . . . . . . . . . . . . . . . . . . . . . . . . . . . . . . . . . . . . . . . . . . . . . . . . . . . . . . 3-4
Name Database Manager . . . . . . . . . . . . . . . . . . . . . . . . . . . . . . . . . . . . . . . . . . . . . . . . . . . . . . . . . . . . . . . . 3-4
Report . . . . . . . . . . . . . . . . . . . . . . . . . . . . . . . . . . . . . . . . . . . . . . . . . . . . . . . . . . . . . . . . . . . . . . . . . . . . . . . 3-4
RMON Manager . . . . . . . . . . . . . . . . . . . . . . . . . . . . . . . . . . . . . . . . . . . . . . . . . . . . . . . . . . . . . . . . . . . . . . . 3-4
TFTP Server . . . . . . . . . . . . . . . . . . . . . . . . . . . . . . . . . . . . . . . . . . . . . . . . . . . . . . . . . . . . . . . . . . . . . . . . . . 3-5
Trap Manager . . . . . . . . . . . . . . . . . . . . . . . . . . . . . . . . . . . . . . . . . . . . . . . . . . . . . . . . . . . . . . . . . . . . . . . . . 3-5
WUR . . . . . . . . . . . . . . . . . . . . . . . . . . . . . . . . . . . . . . . . . . . . . . . . . . . . . . . . . . . . . . . . . . . . . . . . . . . . . . . . 3-5
Data Logging and Event Management . . . . . . . . . . . . . . . . . . . . . . . . . . . . . . . . . . . . . . . . . . . . . . . . . . . . . . . . . . 3-6
How the Event Manager Works . . . . . . . . . . . . . . . . . . . . . . . . . . . . . . . . . . . . . . . . . . . . . . . . . . . . . . . . . . 3-7
Starting EliteView . . . . . . . . . . . . . . . . . . . . . . . . . . . . . . . . . . . . . . . . . . . . . . . . . . . . . . . . . . . . . . . . . . . . . . . . . . . 3-8
Using the Main EliteView Program . . . . . . . . . . . . . . . . . . . . . . . . . . . . . . . . . . . . . . . . . . . . . . . . . . . . . . . . 3-9
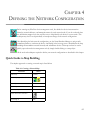
4
Defining the Network Configuration . . . . . . . . . . . . . . . . . . . . . . . . . . . . . . . . . . . . . .4-1
v
CONTENTS
Quick Guide to Map Building . . . . . . . . . . . . . . . . . . . . . . . . . . . . . . . . . . . . . . . . . . . . . . . . . . . . . . . . . . . . . . . . . . 4-1
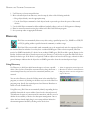
Discovery . . . . . . . . . . . . . . . . . . . . . . . . . . . . . . . . . . . . . . . . . . . . . . . . . . . . . . . . . . . . . . . . . . . . . . . . . . . . . . . . . . 4-2
Using Discovery . . . . . . . . . . . . . . . . . . . . . . . . . . . . . . . . . . . . . . . . . . . . . . . . . . . . . . . . . . . . . . . . . . . . . . . 4-2
Name Database Manager . . . . . . . . . . . . . . . . . . . . . . . . . . . . . . . . . . . . . . . . . . . . . . . . . . . . . . . . . . . . . . . . . . . . . . 4-6
Adding a New Entry . . . . . . . . . . . . . . . . . . . . . . . . . . . . . . . . . . . . . . . . . . . . . . . . . . . . . . . . . . . . . . . . . . . . 4-7
Deleting Device Entries . . . . . . . . . . . . . . . . . . . . . . . . . . . . . . . . . . . . . . . . . . . . . . . . . . . . . . . . . . . . . . . . . 4-7
Updating Device Entries . . . . . . . . . . . . . . . . . . . . . . . . . . . . . . . . . . . . . . . . . . . . . . . . . . . . . . . . . . . . . . . . 4-7
Searching for Device Entries . . . . . . . . . . . . . . . . . . . . . . . . . . . . . . . . . . . . . . . . . . . . . . . . . . . . . . . . . . . . . 4-8
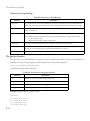
Creating Network Maps . . . . . . . . . . . . . . . . . . . . . . . . . . . . . . . . . . . . . . . . . . . . . . . . . . . . . . . . . . . . . . . . . . . . . . . 4-8
Menu Description for Map Functions . . . . . . . . . . . . . . . . . . . . . . . . . . . . . . . . . . . . . . . . . . . . . . . . . . . . . . 4-9
Editing Map Objects . . . . . . . . . . . . . . . . . . . . . . . . . . . . . . . . . . . . . . . . . . . . . . . . . . . . . . . . . . . . . . . . . . 4-11
5
Network Tools . . . . . . . . . . . . . . . . . . . . . . . . . . . . . . . . . . . . . . . . . . . . . . . . . . . . . . . .5-1
Setting Addresses with the BOOTP Server . . . . . . . . . . . . . . . . . . . . . . . . . . . . . . . . . . . . . . . . . . . . . . . . . . . . . . . 5-1
The BOOTP Protocol . . . . . . . . . . . . . . . . . . . . . . . . . . . . . . . . . . . . . . . . . . . . . . . . . . . . . . . . . . . . . . . . . . 5-1
Starting the BOOTP Server . . . . . . . . . . . . . . . . . . . . . . . . . . . . . . . . . . . . . . . . . . . . . . . . . . . . . . . . . . . . . . 5-2
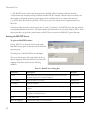
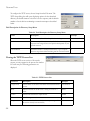
Adding and Modifying Node Information . . . . . . . . . . . . . . . . . . . . . . . . . . . . . . . . . . . . . . . . . . . . . . . . . . 5-3
Adding Filename Mappings . . . . . . . . . . . . . . . . . . . . . . . . . . . . . . . . . . . . . . . . . . . . . . . . . . . . . . . . . . . . . . 5-4
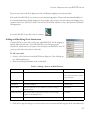
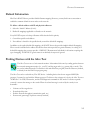
Default Information . . . . . . . . . . . . . . . . . . . . . . . . . . . . . . . . . . . . . . . . . . . . . . . . . . . . . . . . . . . . . . . . . . . . . . . . . . 5-5
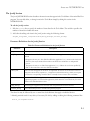
Probing Devices with the Alive Test . . . . . . . . . . . . . . . . . . . . . . . . . . . . . . . . . . . . . . . . . . . . . . . . . . . . . . . . . . . . . 5-5
Problem Solving with the Alive Test . . . . . . . . . . . . . . . . . . . . . . . . . . . . . . . . . . . . . . . . . . . . . . . . . . . . . . . 5-7
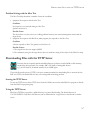
Downloading Files with the TFTP Server . . . . . . . . . . . . . . . . . . . . . . . . . . . . . . . . . . . . . . . . . . . . . . . . . . . . . . . . 5-7
Starting the TFTP Server . . . . . . . . . . . . . . . . . . . . . . . . . . . . . . . . . . . . . . . . . . . . . . . . . . . . . . . . . . . . . . . . 5-7
Using the TFTP Server . . . . . . . . . . . . . . . . . . . . . . . . . . . . . . . . . . . . . . . . . . . . . . . . . . . . . . . . . . . . . . . . . . 5-7
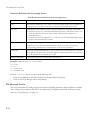
Viewing the TFTP Process List . . . . . . . . . . . . . . . . . . . . . . . . . . . . . . . . . . . . . . . . . . . . . . . . . . . . . . . . . . . 5-8
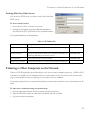
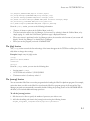
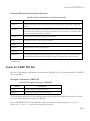
Fetching Files from Other Servers . . . . . . . . . . . . . . . . . . . . . . . . . . . . . . . . . . . . . . . . . . . . . . . . . . . . . . . . 5-9
Telneting to Other Computers on the Network . . . . . . . . . . . . . . . . . . . . . . . . . . . . . . . . . . . . . . . . . . . . . . . . . . . 5-9
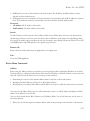
Where You Are (WUR) . . . . . . . . . . . . . . . . . . . . . . . . . . . . . . . . . . . . . . . . . . . . . . . . . . . . . . . . . . . . . . . . . . . . . . 5-10
File Menu Commands . . . . . . . . . . . . . . . . . . . . . . . . . . . . . . . . . . . . . . . . . . . . . . . . . . . . . . . . . . . . . . . . . 5-10
Device Menu Commands . . . . . . . . . . . . . . . . . . . . . . . . . . . . . . . . . . . . . . . . . . . . . . . . . . . . . . . . . . . . . . . 5-11
Option Menu Commands . . . . . . . . . . . . . . . . . . . . . . . . . . . . . . . . . . . . . . . . . . . . . . . . . . . . . . . . . . . . . . 5-12
Output . . . . . . . . . . . . . . . . . . . . . . . . . . . . . . . . . . . . . . . . . . . . . . . . . . . . . . . . . . . . . . . . . . . . . . . . . . . . . . 5-13
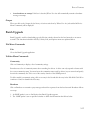
Batch Upgrade . . . . . . . . . . . . . . . . . . . . . . . . . . . . . . . . . . . . . . . . . . . . . . . . . . . . . . . . . . . . . . . . . . . . . . . . . . . . . 5-13
File Menu Commands . . . . . . . . . . . . . . . . . . . . . . . . . . . . . . . . . . . . . . . . . . . . . . . . . . . . . . . . . . . . . . . . . 5-13
Utilities Menu Commands . . . . . . . . . . . . . . . . . . . . . . . . . . . . . . . . . . . . . . . . . . . . . . . . . . . . . . . . . . . . . . 5-13
Edit Menu Commands . . . . . . . . . . . . . . . . . . . . . . . . . . . . . . . . . . . . . . . . . . . . . . . . . . . . . . . . . . . . . . . . . 5-14
Options Menu Commands . . . . . . . . . . . . . . . . . . . . . . . . . . . . . . . . . . . . . . . . . . . . . . . . . . . . . . . . . . . . . . 5-15
Backup . . . . . . . . . . . . . . . . . . . . . . . . . . . . . . . . . . . . . . . . . . . . . . . . . . . . . . . . . . . . . . . . . . . . . . . . . . . . . . . . . . . 5-15
File Menu Commands . . . . . . . . . . . . . . . . . . . . . . . . . . . . . . . . . . . . . . . . . . . . . . . . . . . . . . . . . . . . . . . . . 5-15
Utilities Menu Commands . . . . . . . . . . . . . . . . . . . . . . . . . . . . . . . . . . . . . . . . . . . . . . . . . . . . . . . . . . . . . . 5-16
Options Menu Commands . . . . . . . . . . . . . . . . . . . . . . . . . . . . . . . . . . . . . . . . . . . . . . . . . . . . . . . . . . . . . . 5-17
vi
CONTENTS
6
SNMP MIB Management . . . . . . . . . . . . . . . . . . . . . . . . . . . . . . . . . . . . . . . . . . . . . . .6-1
MIB Compiler . . . . . . . . . . . . . . . . . . . . . . . . . . . . . . . . . . . . . . . . . . . . . . . . . . . . . . . . . . . . . . . . . . . . . . . . . . . . . . 6-2
Starting the MIB Compiler . . . . . . . . . . . . . . . . . . . . . . . . . . . . . . . . . . . . . . . . . . . . . . . . . . . . . . . . . . . . . . . 6-3
MIB-2 Viewer . . . . . . . . . . . . . . . . . . . . . . . . . . . . . . . . . . . . . . . . . . . . . . . . . . . . . . . . . . . . . . . . . . . . . . . . . . . . . . . 6-5
MIB-2 Directory . . . . . . . . . . . . . . . . . . . . . . . . . . . . . . . . . . . . . . . . . . . . . . . . . . . . . . . . . . . . . . . . . . . . . . . 6-7
System Information . . . . . . . . . . . . . . . . . . . . . . . . . . . . . . . . . . . . . . . . . . . . . . . . . . . . . . . . . . . . . . . . . . . . 6-7
Interface Administration . . . . . . . . . . . . . . . . . . . . . . . . . . . . . . . . . . . . . . . . . . . . . . . . . . . . . . . . . . . . . . . . 6-8
Interface Statistics . . . . . . . . . . . . . . . . . . . . . . . . . . . . . . . . . . . . . . . . . . . . . . . . . . . . . . . . . . . . . . . . . . . . . . 6-9
MIB Browser . . . . . . . . . . . . . . . . . . . . . . . . . . . . . . . . . . . . . . . . . . . . . . . . . . . . . . . . . . . . . . . . . . . . . . . . . . . . . . 6-11
Basic Functions of MIB Browser . . . . . . . . . . . . . . . . . . . . . . . . . . . . . . . . . . . . . . . . . . . . . . . . . . . . . . . . 6-11
Menu Description . . . . . . . . . . . . . . . . . . . . . . . . . . . . . . . . . . . . . . . . . . . . . . . . . . . . . . . . . . . . . . . . . . . . . 6-12
Accessing Device Values . . . . . . . . . . . . . . . . . . . . . . . . . . . . . . . . . . . . . . . . . . . . . . . . . . . . . . . . . . . . . . . 6-13
Using the Output Options . . . . . . . . . . . . . . . . . . . . . . . . . . . . . . . . . . . . . . . . . . . . . . . . . . . . . . . . . . . . . . 6-18
Viewing Output Data . . . . . . . . . . . . . . . . . . . . . . . . . . . . . . . . . . . . . . . . . . . . . . . . . . . . . . . . . . . . . . . . . . 6-18
7
Collecting Data with Log Manager . . . . . . . . . . . . . . . . . . . . . . . . . . . . . . . . . . . . . . . .7-1
Overview . . . . . . . . . . . . . . . . . . . . . . . . . . . . . . . . . . . . . . . . . . . . . . . . . . . . . . . . . . . . . . . . . . . . . . . . . . . . . . . . . . 7-1
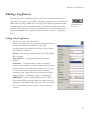
Editing a Log Process . . . . . . . . . . . . . . . . . . . . . . . . . . . . . . . . . . . . . . . . . . . . . . . . . . . . . . . . . . . . . . . . . . . . . . . . 7-3
Adding a New Log Process . . . . . . . . . . . . . . . . . . . . . . . . . . . . . . . . . . . . . . . . . . . . . . . . . . . . . . . . . . . . . . 7-3
. . . . . . . . . . . . . . . . . . . . . . . . . . . . . . . . . . . . . . . . . . . . . . . . . . . . . . . . . . . . . . . . . . . . . . . . . . . . . . . Log Controls 7-5
Viewing Log Data . . . . . . . . . . . . . . . . . . . . . . . . . . . . . . . . . . . . . . . . . . . . . . . . . . . . . . . . . . . . . . . . . . . . . . . . . . . 7-5
Using the Log Database Manager . . . . . . . . . . . . . . . . . . . . . . . . . . . . . . . . . . . . . . . . . . . . . . . . . . . . . . . . . 7-5
File Menu . . . . . . . . . . . . . . . . . . . . . . . . . . . . . . . . . . . . . . . . . . . . . . . . . . . . . . . . . . . . . . . . . . . . . . . . . . . . 7-6
Edit Menu . . . . . . . . . . . . . . . . . . . . . . . . . . . . . . . . . . . . . . . . . . . . . . . . . . . . . . . . . . . . . . . . . . . . . . . . . . . . 7-6
Defining Filter Formulas . . . . . . . . . . . . . . . . . . . . . . . . . . . . . . . . . . . . . . . . . . . . . . . . . . . . . . . . . . . . . . . . . . . . . . 7-7
Filter Formula . . . . . . . . . . . . . . . . . . . . . . . . . . . . . . . . . . . . . . . . . . . . . . . . . . . . . . . . . . . . . . . . . . . . . . . . . 7-7
Filter Formula syntax . . . . . . . . . . . . . . . . . . . . . . . . . . . . . . . . . . . . . . . . . . . . . . . . . . . . . . . . . . . . . . . . . . . 7-8
Defining Threshold Formulas . . . . . . . . . . . . . . . . . . . . . . . . . . . . . . . . . . . . . . . . . . . . . . . . . . . . . . . . . . . . . . . . . 7-10
Threshold vs. Filter Formula . . . . . . . . . . . . . . . . . . . . . . . . . . . . . . . . . . . . . . . . . . . . . . . . . . . . . . . . . . . . 7-10
Accuracy . . . . . . . . . . . . . . . . . . . . . . . . . . . . . . . . . . . . . . . . . . . . . . . . . . . . . . . . . . . . . . . . . . . . . . . . . . . . 7-10
Threshold Formula . . . . . . . . . . . . . . . . . . . . . . . . . . . . . . . . . . . . . . . . . . . . . . . . . . . . . . . . . . . . . . . . . . . . 7-11
Threshold Formula Syntax . . . . . . . . . . . . . . . . . . . . . . . . . . . . . . . . . . . . . . . . . . . . . . . . . . . . . . . . . . . . . . 7-11
Chart Manager Utility . . . . . . . . . . . . . . . . . . . . . . . . . . . . . . . . . . . . . . . . . . . . . . . . . . . . . . . . . . . . . . . . . . . . . . . 7-14
Basic Functions of Chart Manager . . . . . . . . . . . . . . . . . . . . . . . . . . . . . . . . . . . . . . . . . . . . . . . . . . . . . . . 7-14
Menu Description . . . . . . . . . . . . . . . . . . . . . . . . . . . . . . . . . . . . . . . . . . . . . . . . . . . . . . . . . . . . . . . . . . . . . 7-14
Creating Log Charts . . . . . . . . . . . . . . . . . . . . . . . . . . . . . . . . . . . . . . . . . . . . . . . . . . . . . . . . . . . . . . . . . . . 7-15
Editing Data . . . . . . . . . . . . . . . . . . . . . . . . . . . . . . . . . . . . . . . . . . . . . . . . . . . . . . . . . . . . . . . . . . . . . . . . . 7-15
Summarizing Data . . . . . . . . . . . . . . . . . . . . . . . . . . . . . . . . . . . . . . . . . . . . . . . . . . . . . . . . . . . . . . . . . . . . 7-16
Displaying Graphic Charts . . . . . . . . . . . . . . . . . . . . . . . . . . . . . . . . . . . . . . . . . . . . . . . . . . . . . . . . . . . . . . 7-17
Graph Controls . . . . . . . . . . . . . . . . . . . . . . . . . . . . . . . . . . . . . . . . . . . . . . . . . . . . . . . . . . . . . . . . . . . . . . . 7-18
vii
CONTENTS
8
Managing Events . . . . . . . . . . . . . . . . . . . . . . . . . . . . . . . . . . . . . . . . . . . . . . . . . . . . . .8-1
Understanding the Event Manager . . . . . . . . . . . . . . . . . . . . . . . . . . . . . . . . . . . . . . . . . . . . . . . . . . . . . . . . . . . . . . 8-1
Starting the Event Manager . . . . . . . . . . . . . . . . . . . . . . . . . . . . . . . . . . . . . . . . . . . . . . . . . . . . . . . . . . . . . . 8-1
Defining Events . . . . . . . . . . . . . . . . . . . . . . . . . . . . . . . . . . . . . . . . . . . . . . . . . . . . . . . . . . . . . . . . . . . . . . . . . . . . . 8-2
Pre-Defined “System” Events . . . . . . . . . . . . . . . . . . . . . . . . . . . . . . . . . . . . . . . . . . . . . . . . . . . . . . . . . . . . 8-2
Defining “User” Events . . . . . . . . . . . . . . . . . . . . . . . . . . . . . . . . . . . . . . . . . . . . . . . . . . . . . . . . . . . . . . . . . 8-2
Defining Event Actions . . . . . . . . . . . . . . . . . . . . . . . . . . . . . . . . . . . . . . . . . . . . . . . . . . . . . . . . . . . . . . . . . . . . . . . 8-2
Event Data . . . . . . . . . . . . . . . . . . . . . . . . . . . . . . . . . . . . . . . . . . . . . . . . . . . . . . . . . . . . . . . . . . . . . . . . . . . 8-4
Receiving SNMP Traps with the Trap Manager . . . . . . . . . . . . . . . . . . . . . . . . . . . . . . . . . . . . . . . . . . . . . . . . . . . . 8-6
Limitations of Trap Messages . . . . . . . . . . . . . . . . . . . . . . . . . . . . . . . . . . . . . . . . . . . . . . . . . . . . . . . . . . . . 8-6
Trap Types . . . . . . . . . . . . . . . . . . . . . . . . . . . . . . . . . . . . . . . . . . . . . . . . . . . . . . . . . . . . . . . . . . . . . . . . . . . 8-6
Trap Manager . . . . . . . . . . . . . . . . . . . . . . . . . . . . . . . . . . . . . . . . . . . . . . . . . . . . . . . . . . . . . . . . . . . . . . . . . 8-6
Posting Messages to the Report Window . . . . . . . . . . . . . . . . . . . . . . . . . . . . . . . . . . . . . . . . . . . . . . . . . . . . . . . . . 8-7
Edit Menu . . . . . . . . . . . . . . . . . . . . . . . . . . . . . . . . . . . . . . . . . . . . . . . . . . . . . . . . . . . . . . . . . . . . . . . . . . . . 8-8
9
Using RMON . . . . . . . . . . . . . . . . . . . . . . . . . . . . . . . . . . . . . . . . . . . . . . . . . . . . . . . . .9-1
Introduction . . . . . . . . . . . . . . . . . . . . . . . . . . . . . . . . . . . . . . . . . . . . . . . . . . . . . . . . . . . . . . . . . . . . . . . . . . . . . . . . 9-1
A Brief Description of RMON . . . . . . . . . . . . . . . . . . . . . . . . . . . . . . . . . . . . . . . . . . . . . . . . . . . . . . . . . . . 9-1
Starting the RMON Manager . . . . . . . . . . . . . . . . . . . . . . . . . . . . . . . . . . . . . . . . . . . . . . . . . . . . . . . . . . . . . 9-2
RMON Utilities . . . . . . . . . . . . . . . . . . . . . . . . . . . . . . . . . . . . . . . . . . . . . . . . . . . . . . . . . . . . . . . . . . . . . . . . . . . . . 9-4
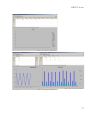
Statistics Group . . . . . . . . . . . . . . . . . . . . . . . . . . . . . . . . . . . . . . . . . . . . . . . . . . . . . . . . . . . . . . . . . . . . . . . 9-5
Viewing Statistics . . . . . . . . . . . . . . . . . . . . . . . . . . . . . . . . . . . . . . . . . . . . . . . . . . . . . . . . . . . . . . . . . . . . . . 9-6
History Group . . . . . . . . . . . . . . . . . . . . . . . . . . . . . . . . . . . . . . . . . . . . . . . . . . . . . . . . . . . . . . . . . . . . . . . 9-10
Alarm and Event Groups . . . . . . . . . . . . . . . . . . . . . . . . . . . . . . . . . . . . . . . . . . . . . . . . . . . . . . . . . . . . . . . 9-13
Host Group . . . . . . . . . . . . . . . . . . . . . . . . . . . . . . . . . . . . . . . . . . . . . . . . . . . . . . . . . . . . . . . . . . . . . . . . . . 9-15
Host Top N Group . . . . . . . . . . . . . . . . . . . . . . . . . . . . . . . . . . . . . . . . . . . . . . . . . . . . . . . . . . . . . . . . . . . 9-18
Matrix Group . . . . . . . . . . . . . . . . . . . . . . . . . . . . . . . . . . . . . . . . . . . . . . . . . . . . . . . . . . . . . . . . . . . . . . . . 9-20
Filter and Capture Groups . . . . . . . . . . . . . . . . . . . . . . . . . . . . . . . . . . . . . . . . . . . . . . . . . . . . . . . . . . . . . . 9-22
A
Typical EliteView Applications . . . . . . . . . . . . . . . . . . . . . . . . . . . . . . . . . . . . . . . . . . A-1
Adding a New MIB Using the MIB Compiler . . . . . . . . . . . . . . . . . . . . . . . . . . . . . . . . . . . . . . . . . . . . . . . . . . . .
Managing a Third-Party Device Using the MIB Browser . . . . . . . . . . . . . . . . . . . . . . . . . . . . . . . . . . . . . . . . . . .
Using the Log and Event Managers to Monitor the Network . . . . . . . . . . . . . . . . . . . . . . . . . . . . . . . . . . . . . . . .
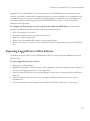
Customizing EliteView to Receive Third-Party Traps . . . . . . . . . . . . . . . . . . . . . . . . . . . . . . . . . . . . . . . . . . . . . .
Exporting Logged Data to Other Software . . . . . . . . . . . . . . . . . . . . . . . . . . . . . . . . . . . . . . . . . . . . . . . . . . . . . .
B
A-1
A-2
A-3
A-6
A-7
Customizing EliteView . . . . . . . . . . . . . . . . . . . . . . . . . . . . . . . . . . . . . . . . . . . . . . . . B-1
EliteView’s Initialization Files . . . . . . . . . . . . . . . . . . . . . . . . . . . . . . . . . . . . . . . . . . . . . . . . . . . . . . . . . . . . . . . . . .B-1
Inside the NETMGR.INI File . . . . . . . . . . . . . . . . . . . . . . . . . . . . . . . . . . . . . . . . . . . . . . . . . . . . . . . . . . . . . . . . .B-1
Description of Sections in NETMGR.INI . . . . . . . . . . . . . . . . . . . . . . . . . . . . . . . . . . . . . . . . . . . . . . . . . .B-1
Changing Parameters in NETMGR.INI . . . . . . . . . . . . . . . . . . . . . . . . . . . . . . . . . . . . . . . . . . . . . . . . . . . .B-2
viii
CONTENTS
The [system] Section . . . . . . . . . . . . . . . . . . . . . . . . . . . . . . . . . . . . . . . . . . . . . . . . . . . . . . . . . . . . . . . . . . . .B-3
The [device] Section . . . . . . . . . . . . . . . . . . . . . . . . . . . . . . . . . . . . . . . . . . . . . . . . . . . . . . . . . . . . . . . . . . . .B-3
The [tools] Section . . . . . . . . . . . . . . . . . . . . . . . . . . . . . . . . . . . . . . . . . . . . . . . . . . . . . . . . . . . . . . . . . . . . .B-5
The [bitmaps] Section . . . . . . . . . . . . . . . . . . . . . . . . . . . . . . . . . . . . . . . . . . . . . . . . . . . . . . . . . . . . . . . . . . .B-6
The [util] Section . . . . . . . . . . . . . . . . . . . . . . . . . . . . . . . . . . . . . . . . . . . . . . . . . . . . . . . . . . . . . . . . . . . . . . .B-8
The [tftp] Section . . . . . . . . . . . . . . . . . . . . . . . . . . . . . . . . . . . . . . . . . . . . . . . . . . . . . . . . . . . . . . . . . . . . . .B-9
The [startup] Section . . . . . . . . . . . . . . . . . . . . . . . . . . . . . . . . . . . . . . . . . . . . . . . . . . . . . . . . . . . . . . . . . . .B-9
The [discover] Section . . . . . . . . . . . . . . . . . . . . . . . . . . . . . . . . . . . . . . . . . . . . . . . . . . . . . . . . . . . . . . . . .B-10
Inside the TRAP.INI File . . . . . . . . . . . . . . . . . . . . . . . . . . . . . . . . . . . . . . . . . . . . . . . . . . . . . . . . . . . . . . . . . . . .B-11
The [generic] Section . . . . . . . . . . . . . . . . . . . . . . . . . . . . . . . . . . . . . . . . . . . . . . . . . . . . . . . . . . . . . . . . . .B-12
The [enterprise] Section . . . . . . . . . . . . . . . . . . . . . . . . . . . . . . . . . . . . . . . . . . . . . . . . . . . . . . . . . . . . . . . .B-13
Specific Trap Sections . . . . . . . . . . . . . . . . . . . . . . . . . . . . . . . . . . . . . . . . . . . . . . . . . . . . . . . . . . . . . . . . .B-14
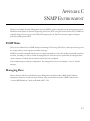
C
SNMP Environment . . . . . . . . . . . . . . . . . . . . . . . . . . . . . . . . . . . . . . . . . . . . . . . . . . . C-1
SNMP Roles . . . . . . . . . . . . . . . . . . . . . . . . . . . . . . . . . . . . . . . . . . . . . . . . . . . . . . . . . . . . . . . . . . . . . . . . . . . . . . . .C-1
Managing Data . . . . . . . . . . . . . . . . . . . . . . . . . . . . . . . . . . . . . . . . . . . . . . . . . . . . . . . . . . . . . . . . . . . . . . . . . . . . . .C-1
Objects . . . . . . . . . . . . . . . . . . . . . . . . . . . . . . . . . . . . . . . . . . . . . . . . . . . . . . . . . . . . . . . . . . . . . . . . . . . . . . . . . . . .C-2
table.index notation . . . . . . . . . . . . . . . . . . . . . . . . . . . . . . . . . . . . . . . . . . . . . . . . . . . . . . . . . . . . . . . . . . . .C-2
iso origin . . . . . . . . . . . . . . . . . . . . . . . . . . . . . . . . . . . . . . . . . . . . . . . . . . . . . . . . . . . . . . . . . . . . . . . . . . . . .C-3
Branches . . . . . . . . . . . . . . . . . . . . . . . . . . . . . . . . . . . . . . . . . . . . . . . . . . . . . . . . . . . . . . . . . . . . . . . . . . . . .C-4
D
Technical References . . . . . . . . . . . . . . . . . . . . . . . . . . . . . . . . . . . . . . . . . . . . . . . . . . D-1
RFC Reports . . . . . . . . . . . . . . . . . . . . . . . . . . . . . . . . . . . . . . . . . . . . . . . . . . . . . . . . . . . . . . . . . . . . . . . . . . . . . . .
Managing Data . . . . . . . . . . . . . . . . . . . . . . . . . . . . . . . . . . . . . . . . . . . . . . . . . . . . . . . . . . . . . . . . . . . . . . . . . . . . .
RFC Reports . . . . . . . . . . . . . . . . . . . . . . . . . . . . . . . . . . . . . . . . . . . . . . . . . . . . . . . . . . . . . . . . . . . . . . . . .
Industry-Related Documentation . . . . . . . . . . . . . . . . . . . . . . . . . . . . . . . . . . . . . . . . . . . . . . . . . . . . . . . . . . . . . .
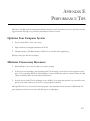
E
Performance Tips . . . . . . . . . . . . . . . . . . . . . . . . . . . . . . . . . . . . . . . . . . . . . . . . . . . . . E-1
Optimize Your Computer System . . . . . . . . . . . . . . . . . . . . . . . . . . . . . . . . . . . . . . . . . . . . . . . . . . . . . . . . . . . . . .
Minimize Unnecessary Resources . . . . . . . . . . . . . . . . . . . . . . . . . . . . . . . . . . . . . . . . . . . . . . . . . . . . . . . . . . . . . .
Other Tips . . . . . . . . . . . . . . . . . . . . . . . . . . . . . . . . . . . . . . . . . . . . . . . . . . . . . . . . . . . . . . . . . . . . . . . . . . . . . . . .
Managing Data . . . . . . . . . . . . . . . . . . . . . . . . . . . . . . . . . . . . . . . . . . . . . . . . . . . . . . . . . . . . . . . . . . . . . . . . . . . . .
RFC Reports . . . . . . . . . . . . . . . . . . . . . . . . . . . . . . . . . . . . . . . . . . . . . . . . . . . . . . . . . . . . . . . . . . . . . . . . .
Industry-Related Documentation . . . . . . . . . . . . . . . . . . . . . . . . . . . . . . . . . . . . . . . . . . . . . . . . . . . . . . . . . . . . . .
F
D-1
D-1
D-2
D-3
E-1
E-1
E-2
E-2
E-2
E-4
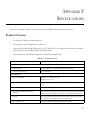
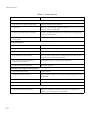
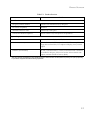
Specifications . . . . . . . . . . . . . . . . . . . . . . . . . . . . . . . . . . . . . . . . . . . . . . . . . . . . . . . . F-1
Product Overview . . . . . . . . . . . . . . . . . . . . . . . . . . . . . . . . . . . . . . . . . . . . . . . . . . . . . . . . . . . . . . . . . . . . . . . . . . .F-1
G
CodeBase 6.0 DLL
Sub-License Agreement G-1
ix
CONTENTS
H
Troubleshooting . . . . . . . . . . . . . . . . . . . . . . . . . . . . . . . . . . . . . . . . . . . . . . . . . . . . . . H-1
I
Error Messages . . . . . . . . . . . . . . . . . . . . . . . . . . . . . . . . . . . . . . . . . . . . . . . . . . . . . . . . I-1
EliteView . . . . . . . . . . . . . . . . . . . . . . . . . . . . . . . . . . . . . . . . . . . . . . . . . . . . . . . . . . . . . . . . . . . . . . . . . . . . . . . . . . I-1
BOOTP Server . . . . . . . . . . . . . . . . . . . . . . . . . . . . . . . . . . . . . . . . . . . . . . . . . . . . . . . . . . . . . . . . . . . . . . . . . . . . . . I-4
BOOTP.DLL . . . . . . . . . . . . . . . . . . . . . . . . . . . . . . . . . . . . . . . . . . . . . . . . . . . . . . . . . . . . . . . . . . . . . . . . . . . . . . . I-5
. . . . . . . . . . . . . . . . . . . . . . . . . . . . . . . . . . . . . . . . . . . . . . . . . . . . . . . . . . . . . . . . . . . . . . . . . . . . . . . . . . Discovery I-8
Event Manager . . . . . . . . . . . . . . . . . . . . . . . . . . . . . . . . . . . . . . . . . . . . . . . . . . . . . . . . . . . . . . . . . . . . . . . . . . . . . I-12
ICMP.DLL . . . . . . . . . . . . . . . . . . . . . . . . . . . . . . . . . . . . . . . . . . . . . . . . . . . . . . . . . . . . . . . . . . . . . . . . . . . . . . . . I-12
IPX.DLL . . . . . . . . . . . . . . . . . . . . . . . . . . . . . . . . . . . . . . . . . . . . . . . . . . . . . . . . . . . . . . . . . . . . . . . . . . . . . . . . . . I-15
Log Manager . . . . . . . . . . . . . . . . . . . . . . . . . . . . . . . . . . . . . . . . . . . . . . . . . . . . . . . . . . . . . . . . . . . . . . . . . . . . . . . I-15
MESSAGE.DLL . . . . . . . . . . . . . . . . . . . . . . . . . . . . . . . . . . . . . . . . . . . . . . . . . . . . . . . . . . . . . . . . . . . . . . . . . . . I-16
MIB Browser . . . . . . . . . . . . . . . . . . . . . . . . . . . . . . . . . . . . . . . . . . . . . . . . . . . . . . . . . . . . . . . . . . . . . . . . . . . . . . I-17
MIB Compiler . . . . . . . . . . . . . . . . . . . . . . . . . . . . . . . . . . . . . . . . . . . . . . . . . . . . . . . . . . . . . . . . . . . . . . . . . . . . . I-19
MIB.DLL . . . . . . . . . . . . . . . . . . . . . . . . . . . . . . . . . . . . . . . . . . . . . . . . . . . . . . . . . . . . . . . . . . . . . . . . . . . . . . . . . I-22
Mib-2 Viewer . . . . . . . . . . . . . . . . . . . . . . . . . . . . . . . . . . . . . . . . . . . . . . . . . . . . . . . . . . . . . . . . . . . . . . . . . . . . . . I-23
Report . . . . . . . . . . . . . . . . . . . . . . . . . . . . . . . . . . . . . . . . . . . . . . . . . . . . . . . . . . . . . . . . . . . . . . . . . . . . . . . . . . . . I-24
TFTP Server . . . . . . . . . . . . . . . . . . . . . . . . . . . . . . . . . . . . . . . . . . . . . . . . . . . . . . . . . . . . . . . . . . . . . . . . . . . . . . . I-25
TFTP.DLL . . . . . . . . . . . . . . . . . . . . . . . . . . . . . . . . . . . . . . . . . . . . . . . . . . . . . . . . . . . . . . . . . . . . . . . . . . . . . . . . I-26
Trap Manager . . . . . . . . . . . . . . . . . . . . . . . . . . . . . . . . . . . . . . . . . . . . . . . . . . . . . . . . . . . . . . . . . . . . . . . . . . . . . . I-29
J
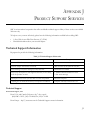
Product Support Services . . . . . . . . . . . . . . . . . . . . . . . . . . . . . . . . . . . . . . . . . . . . . . . . J-1
Technical Support Information . . . . . . . . . . . . . . . . . . . . . . . . . . . . . . . . . . . . . . . . . . . . . . . . . . . . . . . . . . . . . . . . . J-1
Technical Support . . . . . . . . . . . . . . . . . . . . . . . . . . . . . . . . . . . . . . . . . . . . . . . . . . . . . . . . . . . . . . . . . . . . . . J-1
Glossary
Index
x
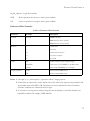
TABLES
Table 3-1
Table 3-2
Table 4-1
Table 4-2
Table 4-3
Table 4-4
Table 4-5
Table 4-6
Table 4-7
Table 4-8
Table 5-1
Table 5-2
Table 5-3
Table 5-4
Table 5-5
Table 5-6
Table 6-1
Table 6-2
Table 6-3
Table 6-4
Table 6-5
Table 6-6
Table 6-7
Table 7-1
Table 7-2
Table 7-3
Table 7-4
Table 7-5
Table 7-6
Table 8-1
Table 8-2
Table 8-3
Table 9-1
Table 9-2
Table 9-3
Table 9-4
Table 9-5
Table 9-6
Table 9-7
Table 9-8
EliteView Program Menu Definitions . . . . . . . . . . . . . . . . . . . . . . . . . . . . . . . . . . . . . . . . . . . . . . . . 3-10
EliteView Program Toolbar . . . . . . . . . . . . . . . . . . . . . . . . . . . . . . . . . . . . . . . . . . . . . . . . . . . . . . . . 3-11
Creating a Network Map . . . . . . . . . . . . . . . . . . . . . . . . . . . . . . . . . . . . . . . . . . . . . . . . . . . . . . . . . . . 4-1
Discovery Menu Definitions . . . . . . . . . . . . . . . . . . . . . . . . . . . . . . . . . . . . . . . . . . . . . . . . . . . . . . . . 4-3
Field Description for Discovery Setup Menu . . . . . . . . . . . . . . . . . . . . . . . . . . . . . . . . . . . . . . . . . . . 4-4
Name Database Manger – Editing Tools . . . . . . . . . . . . . . . . . . . . . . . . . . . . . . . . . . . . . . . . . . . . . . 4-7
Menu Description for Map Functions . . . . . . . . . . . . . . . . . . . . . . . . . . . . . . . . . . . . . . . . . . . . . . . . . 4-9
Map Editing Toolbar Buttons . . . . . . . . . . . . . . . . . . . . . . . . . . . . . . . . . . . . . . . . . . . . . . . . . . . . . . 4-10
Map Generic Device Types . . . . . . . . . . . . . . . . . . . . . . . . . . . . . . . . . . . . . . . . . . . . . . . . . . . . . . . . 4-11
Map Add New Object Dialog Box . . . . . . . . . . . . . . . . . . . . . . . . . . . . . . . . . . . . . . . . . . . . . . . . . . 4-11
BOOTP Server Dialog Box . . . . . . . . . . . . . . . . . . . . . . . . . . . . . . . . . . . . . . . . . . . . . . . . . . . . . . . . . 5-2
Adding a Node to the BOOTP Server . . . . . . . . . . . . . . . . . . . . . . . . . . . . . . . . . . . . . . . . . . . . . . . . 5-3
Alive Test Statistics . . . . . . . . . . . . . . . . . . . . . . . . . . . . . . . . . . . . . . . . . . . . . . . . . . . . . . . . . . . . . . . . 5-6
Field Description for Discovery Setup Menu . . . . . . . . . . . . . . . . . . . . . . . . . . . . . . . . . . . . . . . . . . . 5-8
TFTP Process List . . . . . . . . . . . . . . . . . . . . . . . . . . . . . . . . . . . . . . . . . . . . . . . . . . . . . . . . . . . . . . . . 5-8
TFTP Read File . . . . . . . . . . . . . . . . . . . . . . . . . . . . . . . . . . . . . . . . . . . . . . . . . . . . . . . . . . . . . . . . . . . 5-9
MIB Compiler Dialog Box . . . . . . . . . . . . . . . . . . . . . . . . . . . . . . . . . . . . . . . . . . . . . . . . . . . . . . . . . . 6-3
MIB-2 Viewer Menu Bar . . . . . . . . . . . . . . . . . . . . . . . . . . . . . . . . . . . . . . . . . . . . . . . . . . . . . . . . . . . 6-7
Field Descriptions for System Information Window . . . . . . . . . . . . . . . . . . . . . . . . . . . . . . . . . . . . . 6-7
Field Description for Interface Admin Window . . . . . . . . . . . . . . . . . . . . . . . . . . . . . . . . . . . . . . . . . 6-8
Field Description for Interface Statistics Window . . . . . . . . . . . . . . . . . . . . . . . . . . . . . . . . . . . . . . . 6-9
MIB Browser Menu Definitions . . . . . . . . . . . . . . . . . . . . . . . . . . . . . . . . . . . . . . . . . . . . . . . . . . . . 6-12
MIB Variable Textual Definitions . . . . . . . . . . . . . . . . . . . . . . . . . . . . . . . . . . . . . . . . . . . . . . . . . . . 6-14
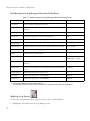
Field Description for Log Manager/Information Dialog Boxes . . . . . . . . . . . . . . . . . . . . . . . . . . . . 7-4
Elements of Filter Formulas . . . . . . . . . . . . . . . . . . . . . . . . . . . . . . . . . . . . . . . . . . . . . . . . . . . . . . . . . 7-9
Elements of Threshold Formulas . . . . . . . . . . . . . . . . . . . . . . . . . . . . . . . . . . . . . . . . . . . . . . . . . . . 7-13
Chart Manager Menu Definitions . . . . . . . . . . . . . . . . . . . . . . . . . . . . . . . . . . . . . . . . . . . . . . . . . . . 7-14
Log Chart Information . . . . . . . . . . . . . . . . . . . . . . . . . . . . . . . . . . . . . . . . . . . . . . . . . . . . . . . . . . . . 7-15
Chart Manager - Graph Control . . . . . . . . . . . . . . . . . . . . . . . . . . . . . . . . . . . . . . . . . . . . . . . . . . . . 7-18
Event Actions . . . . . . . . . . . . . . . . . . . . . . . . . . . . . . . . . . . . . . . . . . . . . . . . . . . . . . . . . . . . . . . . . . . . 8-3
Event Data . . . . . . . . . . . . . . . . . . . . . . . . . . . . . . . . . . . . . . . . . . . . . . . . . . . . . . . . . . . . . . . . . . . . . . 8-5
Report Window Menu Definitions . . . . . . . . . . . . . . . . . . . . . . . . . . . . . . . . . . . . . . . . . . . . . . . . . . . 8-7
RMON Manager Probe Window . . . . . . . . . . . . . . . . . . . . . . . . . . . . . . . . . . . . . . . . . . . . . . . . . . . . . 9-2
RMON Manger Main Screen . . . . . . . . . . . . . . . . . . . . . . . . . . . . . . . . . . . . . . . . . . . . . . . . . . . . . . . . 9-3
RMON Groups . . . . . . . . . . . . . . . . . . . . . . . . . . . . . . . . . . . . . . . . . . . . . . . . . . . . . . . . . . . . . . . . . . 9-4
Statistics Group Control Table . . . . . . . . . . . . . . . . . . . . . . . . . . . . . . . . . . . . . . . . . . . . . . . . . . . . . . 9-5
SMC6724L3 1 Interface Description . . . . . . . . . . . . . . . . . . . . . . . . . . . . . . . . . . . . . . . . . . . . . . . . . . 9-6
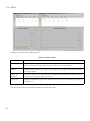
Statistics Areas . . . . . . . . . . . . . . . . . . . . . . . . . . . . . . . . . . . . . . . . . . . . . . . . . . . . . . . . . . . . . . . . . . . . 9-8
Statistics Parameter Descriptions . . . . . . . . . . . . . . . . . . . . . . . . . . . . . . . . . . . . . . . . . . . . . . . . . . . . . 9-9
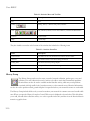
Statistics Menu and Tool Bar . . . . . . . . . . . . . . . . . . . . . . . . . . . . . . . . . . . . . . . . . . . . . . . . . . . . . . . 9-10
xiii
TABLES
Table 9-9
Table 9-10
Table 9-11
Table 9-12
Table 9-13
Table 9-14
Table 9-15
Table 9-16
Table 9-17
Table 9-18
Table 9-19
Table 9-20
Table 9-21
Table 9-22
Table 9-23
Table 9-24
Table A-1
Table A-2
Table A-3
Table B-1
Table B-2
Table B-3
Table B-4
Table B-5
Table B-6
Table B-7
Table B-8
Table B-9
Table B-10
Table B-11
Table B-12
Table B-13
Table B-14
Table B-15
Table C-1
Table D-1
Table E-1
Table F-1
Table J-1
xiv
Statistics Status Bar . . . . . . . . . . . . . . . . . . . . . . . . . . . . . . . . . . . . . . . . . . . . . . . . . . . . . . . . . . . . . . 9-10
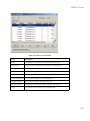
History Control Table . . . . . . . . . . . . . . . . . . . . . . . . . . . . . . . . . . . . . . . . . . . . . . . . . . . . . . . . . . . . . 9-11
Alarm Control Table . . . . . . . . . . . . . . . . . . . . . . . . . . . . . . . . . . . . . . . . . . . . . . . . . . . . . . . . . . . . . . 9-13
Event Control Table Index Entries . . . . . . . . . . . . . . . . . . . . . . . . . . . . . . . . . . . . . . . . . . . . . . . . . . 9-15
Host Control Table . . . . . . . . . . . . . . . . . . . . . . . . . . . . . . . . . . . . . . . . . . . . . . . . . . . . . . . . . . . . . . . 9-16
Host Control Table Menu and Tool Bar Descriptions . . . . . . . . . . . . . . . . . . . . . . . . . . . . . . . . . . . 9-17
Host Top N Menu and Tool Bar Descriptions . . . . . . . . . . . . . . . . . . . . . . . . . . . . . . . . . . . . . . . . . 9-19
Matrix Control Table . . . . . . . . . . . . . . . . . . . . . . . . . . . . . . . . . . . . . . . . . . . . . . . . . . . . . . . . . . . . . 9-20
Matrix Menu and Tool Bar Descriptions . . . . . . . . . . . . . . . . . . . . . . . . . . . . . . . . . . . . . . . . . . . . . . 9-22
Channel and Buffer Control Table . . . . . . . . . . . . . . . . . . . . . . . . . . . . . . . . . . . . . . . . . . . . . . . . . . 9-23
Filter Configuration Options . . . . . . . . . . . . . . . . . . . . . . . . . . . . . . . . . . . . . . . . . . . . . . . . . . . . . . . 9-25
Channel and Buffer Add/Edit Dialog Box . . . . . . . . . . . . . . . . . . . . . . . . . . . . . . . . . . . . . . . . . . . . 9-27
Separate Control Tables: Channels . . . . . . . . . . . . . . . . . . . . . . . . . . . . . . . . . . . . . . . . . . . . . . . . . . 9-29
Separate Control Tables: Filters . . . . . . . . . . . . . . . . . . . . . . . . . . . . . . . . . . . . . . . . . . . . . . . . . . . . . 9-30
Separate Control Tables: Buffers . . . . . . . . . . . . . . . . . . . . . . . . . . . . . . . . . . . . . . . . . . . . . . . . . . . . 9-31
Buffer Menu and Toolbar Descriptions . . . . . . . . . . . . . . . . . . . . . . . . . . . . . . . . . . . . . . . . . . . . . . 9-33
Log and Event Manager Parameters . . . . . . . . . . . . . . . . . . . . . . . . . . . . . . . . . . . . . . . . . . . . . . . . . A-4
Port Packet Reception Parameters . . . . . . . . . . . . . . . . . . . . . . . . . . . . . . . . . . . . . . . . . . . . . . . . . . . A-5
Target Device Packet Reception Parameters . . . . . . . . . . . . . . . . . . . . . . . . . . . . . . . . . . . . . . . . . . . A-6
Description of Sections in NETMGR.INI . . . . . . . . . . . . . . . . . . . . . . . . . . . . . . . . . . . . . . . . . . . . .B-1
Description of Parameters in NETMGR.INI . . . . . . . . . . . . . . . . . . . . . . . . . . . . . . . . . . . . . . . . . . .B-3
Parameter Definitions for the [device] Section . . . . . . . . . . . . . . . . . . . . . . . . . . . . . . . . . . . . . . . . . .B-4
Parameter Definitions for the [tools] Section . . . . . . . . . . . . . . . . . . . . . . . . . . . . . . . . . . . . . . . . . . .B-5
Identifying Particular Tools for a Device . . . . . . . . . . . . . . . . . . . . . . . . . . . . . . . . . . . . . . . . . . . . . .B-6
Enumerating Graphic Bitmaps . . . . . . . . . . . . . . . . . . . . . . . . . . . . . . . . . . . . . . . . . . . . . . . . . . . . . .B-7
Parameter Definitions for the [util] Section . . . . . . . . . . . . . . . . . . . . . . . . . . . . . . . . . . . . . . . . . . . . .B-8
Parameter Definitions for the [startup] Section . . . . . . . . . . . . . . . . . . . . . . . . . . . . . . . . . . . . . . . .B-10
Parameter Definitions for the [discover] Section . . . . . . . . . . . . . . . . . . . . . . . . . . . . . . . . . . . . . . .B-11
Description of Sections in TRAP.INI . . . . . . . . . . . . . . . . . . . . . . . . . . . . . . . . . . . . . . . . . . . . . . . .B-11
Elements of a Trap Message . . . . . . . . . . . . . . . . . . . . . . . . . . . . . . . . . . . . . . . . . . . . . . . . . . . . . . .B-12
Parameters of the [generic] Section . . . . . . . . . . . . . . . . . . . . . . . . . . . . . . . . . . . . . . . . . . . . . . . . . .B-12
Parameters of the [enterprise] Section . . . . . . . . . . . . . . . . . . . . . . . . . . . . . . . . . . . . . . . . . . . . . . . .B-13
Trap Message Parameters . . . . . . . . . . . . . . . . . . . . . . . . . . . . . . . . . . . . . . . . . . . . . . . . . . . . . . . . . .B-14
Trigger Event Parameters . . . . . . . . . . . . . . . . . . . . . . . . . . . . . . . . . . . . . . . . . . . . . . . . . . . . . . . . . .B-15
Branches to the iso Origin . . . . . . . . . . . . . . . . . . . . . . . . . . . . . . . . . . . . . . . . . . . . . . . . . . . . . . . . . .C-4
RFC Reports: Networking Information . . . . . . . . . . . . . . . . . . . . . . . . . . . . . . . . . . . . . . . . . . . . . . D-2
RFC Reports: Managing Data . . . . . . . . . . . . . . . . . . . . . . . . . . . . . . . . . . . . . . . . . . . . . . . . . . . . . . E-2
Product Overview . . . . . . . . . . . . . . . . . . . . . . . . . . . . . . . . . . . . . . . . . . . . . . . . . . . . . . . . . . . . . . . . .F-1
Technical Support Information . . . . . . . . . . . . . . . . . . . . . . . . . . . . . . . . . . . . . . . . . . . . . . . . . . . . . . J-1
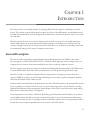
CHAPTER 1
INTRODUCTION
EliteView provides a user-friendly interface for managing SMC Networks, Edgecore and third-party network
devices. This software is specifically designed to support the efforts of the MIS manager, system administrator(s),
technical staff responsible for network management and maintenance, and network operators who use the system
on a daily basis.
EliteView provides all the tools you need to manage nearly any kind of network. You can readily monitor the
traffic load throughout the network and make the changes required to avoid major crises ahead of time. This
software is designed around an event-driven architecture, which allows you to define event-handling routines that
can automatically manage a wide variety of common network tasks.
General Description
EliteView is based on the industry standard Simple Network Management Protocol (SNMP), and provides
protocol support for UDP/IP and IPX. EliteView is a Windows-based application used to manage nearly every
component in your network, from internetworking devices down to end-node computer resources.
EliteView manages network devices using the comprehensive Management Information Base. This MIB consists
of various MIB modules which define basic system parameters for both general and specific device types.
EliteView is based on a sophisticated graphical interface that permits it to manage any network device that
supports SNMP. By opening your network map and clicking on various objects, specific management interfaces
and system information can be readily accessed.
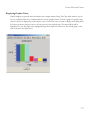
Interface statistics and traffic load can be illustrated by line charts. This information can be automatically recorded
by the Log Manager to maintain historical records. A powerful reporting feature is also provided for recording
significant information from any management window. Reports can be edited, saved and retrieved again during a
later session for subsequent analysis or comparison.
Event management is a key feature of EliteView. By defining specific data filters and thresholds, you can activate
event-handling routines that help you keep the network functioning. You can easily shut down malfunctioning
ports, switch to backup systems, or reconfigure network connections; and then restore system parameters back to
normal values after component problems have been resolved or the traffic falls off.
1-1
INTRODUCTION
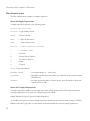
Management Functions
EliteView is a Windows-based software package. It provides state-of-the-art utilities which allow you to perform
the following network management tasks:
•
•
•
•
•
•
Generate a detailed hierarchical map of your entire network configuration. These maps display the current
status of network nodes, and provide a hot link to the management module for each device.
Maintain centralized boot services that provide network addresses and information on system files to
download. Boot services are used to quickly reassign network addresses, and fetch filenames required for
downloading frequently modified system software for test devices.
Monitor and log significant events and statistics. EliteView provides access to common MIB variables, as well
as specific parameters for SMC devices. Network statistics can then be displayed in tabular or graphic form.
Automatically respond to network problems with a variety of actions. By defining thresholds for parameters
based on device-specific criteria or traffic loading, you can invoke event handling routines designed to warn the
network manager of potential system problems or automatically take corrective action.
Quickly fetch or set MIB variables for network devices. Data in the Management Information Base
(e.g., RFC 1213 for generic internetworking devices) can be managed on an item-by-item basis.
Remotely manage or reconfigure network devices. SMC provides a wide variety of intelligent networking
devices, including hubs and switches, which can be remotely managed via an SNMP agent. Software modules
based on an advanced graphic user interface are provided to manage every aspect of these devices. Using the
MIB Browser, extensive management functions are also provided for third-party devices.
Application Interface
EliteView runs on a personal computer attached to the network you want to manage. Management actions
normally occur via the network map, through which you can activate the appropriate software module simply by
double-clicking on the concerned device or by selecting a target device and then invoking the appropriate module
from the menus. By sending commands across the network, EliteView can directly manage a wide variety of
SNMP-based devices.
Using this powerful management tool, you can generate a device map of a complete view of the network, where
each device is represented as an icon. Network devices can be added or deleted manually, or located using
Discovery. Device icons can be placed anywhere within a map using simple drag and drop. Object attributes can
also be easily changed.
1-2
FEATURES OF ELITEVIEW
A full hierarchical representation can be generated by creating submaps that
expand to a more detailed view when selected. Moreover, multiple submaps
can be opened simultaneously. Each device included in the map can be
checked periodically to verify that it is still attached to the network. When any
device loses its network connection, its icon will change to indicate device
state, and an alarm may be generated.
The standard method of starting EliteView is to double-click
on the EliteView icon, open your network map, select a target device, and
then invoke the required management module. However, you can directly
invoke any of the modules displayed below.
The EliteView program group includes over twenty different modules. The
main program, labeled EliteView Platform, serves as the platform through
which you display the network map, manage the network, and access any of
the other management modules.
Features of EliteView
EliteView includes the following features:
•
•
•
•
•
•
•
Windows-based SNMP network management.
Manages unlimited number of network devices running SNMP agent
software.
Provides detailed information on device parameters, such as statistics for
the overall SNMP agent, device component status, and network interface configuration/statistics.
Management controls are displayed with graphic and text-oriented windows, which can be accessed via the
network map, or from a pull-down menu, for better functional grouping and a more intuitive user interface.
Hierarchical, interactive network management map with unlimited devices and network levels.
Displays real-time graphical statistics for various counters including network traffic. Monitors the status and
traffic load of each attached device, e.g., displaying the number of incoming, outgoing and discarded frames.
Flexible event management allows you to log relevant factors on device status and traffic.
1-3
INTRODUCTION
1-4
CHAPTER 2
INSTALLATION
This chapter describes setup procedures for EliteView network management software. EliteView can manage any
of SMC’s network devices via standard and private MIB definitions; and also manage any third-party device that
has a resident SNMP agent via standard MIB definitions. Installation of EliteView software designed to manage
specific devices is covered in the corresponding manuals.
(Refer to “Additional References” on page iii.)
Installation for EliteView
EliteView can be readily installed on most Windows-compatible personal computers. The EliteView setup
program will guide you through a step-by-step procedure.
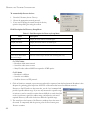
System Requirements
Before installing EliteView, please review these minimum computer and network system requirements for a
“dedicated” network management system (NMS).
Hardware:
•
•
•
•
•
•
PC with 1.6 GHz Pentium IV or better
Minimum 256MB memory
Hard disk with a minimum of 200 MB free disk space
SVGA adapter and display
Mouse
10/100/1000Mpbs Network adapter
Software:
•
•
•
•
•
Microsoft Windows 95
Microsoft Windows 98
Microsoft Windows NT 4.0
Microsoft Windows 2000
Microsoft Windows XP
2-1
INSTALLATION
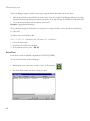
Using SETUP to Install EliteView
The SETUP program will install EliteView from the distribution CD-ROM. This program decompresses files and
copies them to a location you specify on your hard disk.
To Start SETUP:
1. Start Windows.
2. Insert the EliteView installation CD-ROM in your drive.
3. The CD will auto-run and display the installation screen.
4. If the CD does not auto-run, please select the Setup file on the CD.
5. Follow the on-screen instructions to install the software.
2-2
CHAPTER 3
GETTING STARTED
Welcome to the EliteView network management program for Microsoft Windows. EliteView is a powerful
network management product that provides detailed device management functions, together with a sophisticated
graphical interface. The complete package is marketed as EliteView, which includes the main EliteView program
and over twenty core program modules. This chapter provides an overview of the structure, and explains how the
various EliteView modules are related.
Overview
EliteView is a flexible network management system based on international and industry standards.
It is a Windows-based program that runs on an inexpensive PC platform. This full-featured network management
software allows management of SMC or third-party network devices. In addition, it supports an open platform for
the development of any kind of management application.
EliteView can manage various SMC network devices and examine the management information base in third-party
devices.
Network Interface
EliteView can function on various network protocol stacks for greater flexibility and efficiency. In the Windows
environment, EliteView can be configured to run on a Windows TCP/IP package with a standard WINSOCKET
interface. At the application level, network devices are managed via SNMP over IP or IPX.
Event-Driven, Modular Architecture
Designed around an event-driven, multi-tasking architecture, EliteView consists of the main program and
supplementary modules. Each module works independently or in conjunction with other modules. Running any
module is as easy as invoking it from the main EliteView program, or by simply double-clicking on the
corresponding icon from the EliteView program group.
3-1
GETTING STARTED
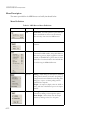
EliteView Modules
EliteView includes support for many SMC products, including the EZ Stack, TigerStack, and TigerSwitch, series.
This section briefly describes the basic support modules included in EliteView. The modules for specific SMC
products are described in the on-line help files.
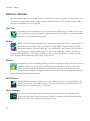
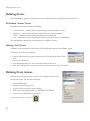
Alive Test
This module tests the connection to any network node with ICMP messages. It sends an echo request
to the specified network node and gathers replies to determine device existence, round trip delay time,
and the ratio of successfully returned packets.
Backup
Backup is a tool that used to backup the latest version of the configuration file on a network device. It
replaces the conventional way used to backup files by setting SNMP commands. Backup can load
devices from a Map file (Created by EliteView) or an exported file (*.dbf), discover and collect lots of
networking devices located in different places. Users can use simply Drag and Drop operations to
configure backup information. After clicking the Backup or Start Schedule speed button (or using the Utilities
menu) the program will automatically process these devices in turn.
BatchUp
This module is used for downloading operating code files into switches located on the local network or
on remote networks. Use the Broadcast and Search features to find devices on the network. These
devices can then be added to the Backup List and have their configuration file backed up. Use the
Backup feature to backup the configuration files for network devices. Create a backup schedule using
the Start Schedule and Stop Schedule features.
BOOTP Server
The BOOTP Server maintains a database of network addresses and a list of corresponding boot files.
BOOTP protocol runs on the UDP/IP stack. It is used by network devices to find out their own IP
address and device initialization file(s) to download.
Device Manager
Each of these modules supports advanced management functions for the corresponding device.
On-line help is provided for each of these devices. EliteView currently includes device management
modules for the EZ stack, TigerStack and TigerSwitch series.
3-2
ELITEVIEW MODULES
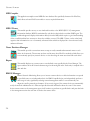
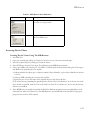
Discovery
This module is used to automatically detect active devices on the network by polling within a specified
network address range or community. Discovery sends commands out to the network and waits for
responses. When a device responds, EliteView queries its functionality. If it responds correctly, a
corresponding bitmap icon is added to the Discovery window.
EliteView Main Program
The main EliteView program provides the primary interface to all EliteView modules. The Tools and
Utilities menus provide access to nearly every module under EliteView. The main program also provides
all the tools you need to generate a detailed map of your network via menus and tool buttons. Moreover,
it supports MDI (Multiple Document Interface) which allows you to simultaneously manage several
submaps. After locating the required device on your map, simply double-click on it to invoke the relevant
management application.
Event Manager
This module serves as the management center for all events generated under the main EliteView
program, Log Manager and Trap Manager. In response to input from these modules, the Event
Manager can define and dispatch responses in various forms. Actions may range from sounding an
audible signal, displaying an on-screen message, logging the event into the report window, running a
user-specified program such as a beeper, fax, pager, email, etc., or logging the event into a database for later
analysis.
Log Utilities
The Log Manager can collect the current value of SNMP MIB variables at a specified interval. A wide
range of parameters on device status and network traffic can be sampled for selected nodes and stored
in the database for long-term analysis. This information is displayed with the Log Database Manager in
numeric form (including date, time and data).
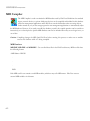
MIB Browser
This module is a generic SNMP management tool used to browse device MIBs. By browsing MIBs, you
can send commands to get or set information defined in the MIB.
Information to be recorded into the Log Manager can be selected directly from the MIB. Moreover, the
MIB Browser also provides a convenient editing tool which can be used to quickly extract information from the
MIB and store it for future reference or prepare it as a technical report.
3-3
GETTING STARTED
MIB Compiler
This application compiles textual MIB files into database files specifically formatted for EliteView,
which allows relevant EliteView modules to access required information.
MIB-2 Viewer
This module provides an easy-to-use windowed interface to the MIB II (RFC 1213) management
information database. MIB II is maintained by each device that includes a resident SNMP agent. The
traditional approach displays information directly from the MIB, which requires a good understanding
of the overall hierarchical tree structure to locate the variables you need. The MIB-2 Viewer, on the other hand,
organizes this information in a set of commonly referenced items which are displayed in a convenient and easily
understood format.
Name Database Manager
This module provides a convenient means to map an easily remembered mnemonic name to each
device in the network. These names are then used in many other EliteView modules, which allows you
to conveniently specify any network device or view data using the name associated with each device.
Report
This module displays any system events or user-defined events specified in the Event Manager. The
report window shows all network alarm messages in chronological order. Each entity is stamped with a
time and date.
RMON Manager
Remote Network Monitoring allows you to instruct a remote device to collect information or respond
to specified events on an independent basis. An RMON-capable device can independently perform a
wide range of tasks, significantly reducing network management traffic. It can continuously run
diagnostics and log network performance. If an event is triggered, the remote device can automatically
notify the network administrator of a failure and provide historical information about the event. If the remote
device cannot connect to the management agent, it will continue to perform any specified tasks and pass data back
to the management station the next time it contacts the remote device.
3-4
ELITEVIEW MODULES
TFTP Server
This module is used to download agent software to the requesting device. It can be used to download
software to any EZ Stack, TigerStack, and TigerSwitch management module. For all other SMC devices,
downloading is performed via out-of band mode. The TFTP server is also used to perform file transfers
between any two stations running EliteView.
Trap Manager
Trap Manager has no tangible user interface. It is only used to pass events to the Event Manager. This
module receives trap messages and converts them into events. By default, the Trap Manager generates a
“Trap” event and outputs a text message to the Event Manager according to the pattern specified in
TRAP.INI. These events are then handled according to the options selected in the Event Manager.
WUR
Where You Are is a tool that is used to locate which port on the switch and port to which a remote host
is connected. You only need to input the IP address or MAC address of the remote host; then either
enter a broadcast domain or enter a particular IP range to search for switches, then click Go. Where You
Are will then display the port and the switch that the remote host is connected to.
3-5
GETTING STARTED
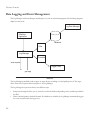
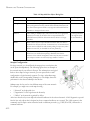
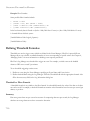
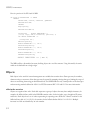
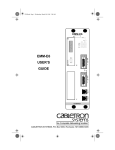
Data Logging and Event Management
The Log Manager and Event Manager modules play a key role in network management. The following diagrams
depict how they work.
Log Data Manager
EliteView
Application
Database
Filter
Log Manager
Threshold
send request
Trigger Event
get reply
Network
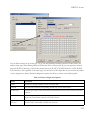
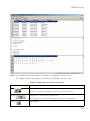
The Log Manager periodically sends requests to target devices according to a fixed polling interval. The target
device receives the requests and sends replies to the Log Manager.
The Log Manager then processes data in two different ways:
•
•
3-6
Data passes through the filter you set; it may be saved in the database depending on the condition specified in
the filter.
Data is checked against a threshold formula. If conditions are satisfied, the Log Manager automatically triggers
the event associated with the log process.
DATA LOGGING AND EVENT MANAGEMENT
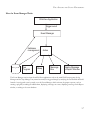
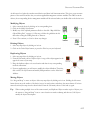
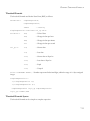
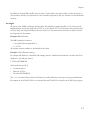
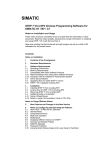
How the Event Manager Works
EliteView Application
trigger event
Event Manager
database
management
Run
Program
Beep
Action
Message
Box
Display Message
in Report Window
The Event Manager receives input from EliteView applications such as the main EliteView program, the log
Manager and the Trap Manager. Any named event may be triggered simply by satisfying the user-defined threshold
formula. Any triggered event is passed on to the Event Manager, which activates the proper response, such as
running a program, sounding an audible alarm, displaying a message on screen, displaying a message in the Report
window, or writing to the event database.
3-7
GETTING STARTED
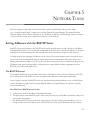
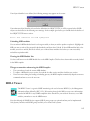
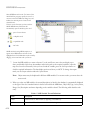
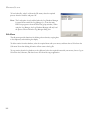
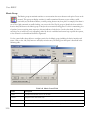
Starting EliteView
The main EliteView program provides an
intuitive interface to other program modules.
You can invoke specific management
applications (by clicking on the appropriate
device icon in the network map), verify current
network connections with Discovery, check
device response (via broadcast/search) with
the Alive Test, or fetch information about
selected devices using the MIB browser.
Each module is closely integrated with the
main EliteView program, and can be quickly
invoked by selecting the required function from the Utilities menus. For certain device-specific applications, first
select a target device from the network map and then select the required function from the Tools menu. The
overall relationship between the main EliteView program and its submodules is depicted below.
3-8
STARTING ELITEVIEW
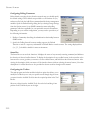
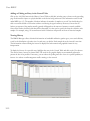
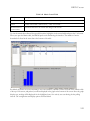
Using the Main EliteView Program
To invoke the main EliteView program click on the EliteView icon. Many functions under the main
program provide support for network mapping. These functions include most of the toolbar buttons,
along with the File, Edit and Windows menus. Network mapping is described in the next chapter,
Defining the Network Configuration. After you map out your network, you will want to use the other
functions listed below.
Alive Test
Bootp Server
TFTP Server
Discovery
TigerSwitch 8
Log Manager
TigerSwitch 100
Log Database
Event Manager
EliteView
Platform
Trap Manager
MIB Browser
Telnet
EZ Stack 10
TigerStack II
MIB-2 Viewer
Report
3-9
GETTING STARTED
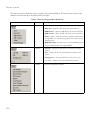
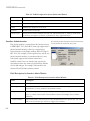
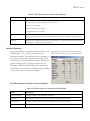
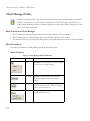
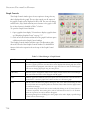
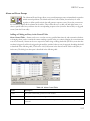
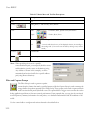
The menu items and tool buttons used on a regular basis are described below. The items used to construct and
maintain your network map are described in the next chapter.
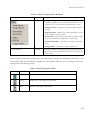
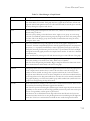
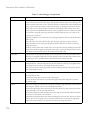
Table 3-1 EliteView Program Menu Definitions
Menu
Label
Tools
Description
• Zoom – Opens the management module for the selected device.
• Alive Test – Opens the Alive Test for the selected device.
• MIB Browser – Opens the MIB Browser for the selected device.
• MIB-2 Viewer – Opens the MIB-2 Viewer for the selected device.
• Telnet - Opens a connection to another computer on the network
through which you can execute programs or access data as though
attached locally.
• RMON Manager – Provides access to to all nine RMON groups
for recent SMC products that support RMON.
Window
• Cascade – Arranges all open EliteView windows in cascaded
fashion.
• Tile – Arranges all currently open EliteView windows in tiled
fashion.
• Arrange Icons – Arranges all EliteView icons on the screen.
• select window – Switches to the selected EliteView window.
Utilities
3-10
Accesses most EliteView modules.
STARTING ELITEVIEW
Table 3-1 EliteView Program Menu Definitions
Menu
Label
Description
Options
• Change Settings – Allows you to define the default map, SNMP
community, polling interval, default timeout, default retries, and
whether or not to save the desktop when EliteView is closed.
• Change Password – Changes the password required to display
the map.
• Map Information – Displays all user-defined parameters for each
device included in the current map.
• Search Object – Searches for a network device by address or label
(the later of which must be defined in the network map).
• Toolbar & Status Bar – toggle buttons to display or hide these
items.
• Config Toolbar – Utility used to specify toolbar layout.
(not shown here)
Floating
By clicking anywhere in the background of the EliteView program
you can open a menu that includes various functions relevant to the
current module.
Many of the items included in the menu bar are also provided in the toolbar. The following table describes a few of
the buttons found in the main EliteView program. The other buttons, which are used for creating network maps,
are described in the following chapter.
Table 3-2 EliteView Program Toolbar
Button
Label
Description
Exit
Shuts down the main EliteView program and all subordinate modules.
About
Displays the version number for this module.
Help
Provides on-line help for this module.
3-11
GETTING STARTED
Configuring Polling Parameters
Before directly accessing devices from the network map, you should specify
the default settings. These defaults are provided as a convenience for you,
and are used by both the Add Object command and the device management
modules. Open the Default Settings dialog box by selecting Change Settings
from the Options menu. Set an SNMP community name and polling
parameters which are applicable for your particular network environment.
Depending on your current configuration, you may need to provide any of
the following information.
1. Define a Community describing the administrative relationship between
SNMP entities.
2. Specify the Polling Interval between sending requests, the Default
Timeout to wait for a response, and number of Default Retries to make contact. The settings displayed here
(i.e., 5, 3, 3) should be suitable for most environments.
Status Bar
The Status Bar serves two basic functions. It displays the status of any currently executing command, and indicates
the function of selected toolbar buttons. To display the description for any toolbar button (in the status bar at the
bottom of the screen), position your mouse over the toolbar button, and hold down the left mouse button. After
viewing the description, slide your mouse off the interface button (without releasing the mouse button). Note that
descriptions for toolbar buttons are also provided in relevant sections throughout this manual.
Configuring the Toolbar
The main program and other modules include an option that allows you to
modify the toolbar layout to suit your specific needs. Simply drag the icons
you want from the Available Tools list into the required position in the Tool
Bar list.
Select any object from the Available Tools list on the left and drag it into
position in the Tool Bar layout on the right.
3-12
CHAPTER 4
DEFINING THE NETWORK CONFIGURATION
Before running any EliteView device management tools, first define the device interconnection
hierarchy, network addresses, and mnemonic names for each network node. If you do not already have
this information mapped out, then use Discovery to help identify each device in your network. This
technique may also be used periodically to incorporate changes in the network configuration.
After identifying the basic network configuration, use the Name Database Manager to assign easily
remembered names to each network device. And finally, in the last step, create a detailed network map
including all intermediate network hierarchy and subordinate devices. This map can then be used to
quickly open relevant device management tools by simply double-clicking on a map object.
All the tools and techniques required to define your network configuration are described in this chapter.
Quick Guide to Map Building
The simplest approach to creating a network map is listed below:
Table 4-1 Creating a Network Map
Command
Discovery
Menu
Utilities
Add Object(s) to Name Database
Get Objects
Edit
Add Object
Edit
Modify Object
Edit
Draw Network Connection
Save Map As
File
4-1
DEFINING THE NETWORK CONFIGURATION
1. Use Discovery to locate network devices.
2. Move selected objects from Discovery onto the map by either of the following methods:
• Drag objects directly onto the appropriate map.
• Use the Get Objects command to fetch objects based on protocol type from the queue of discovered
devices.
3. Use the Add Object command to define additional symbolic objects, such as a LAN Segment or Submap.
4. Draw in network connections using the toolbar in the EliteView Platform program.
5. Save your map under an appropriate filename.
Discovery
EliteView can automatically discover any device using a specified protocol (i.e., SNMP over UDP/IP
or IPX) by polling within a specified network community or address range.
EliteView’s Discovery module sends commands out to the network and waits for responses. Devices
are classified based on whether or not they have a resident SNMP agent. When a device responds, EliteView
queries for SNMP functionality. If a device has no resident SNMP agent, EliteView adds a generic bitmap (to the
window for discovered devices) based on protocol type. However, if a device has an agent then EliteView tries to
identify the device type. If the device is recognized, it adds an object icon based on device type, otherwise it adds a
generic bitmap to indicate that the object has an SNMP agent and to show the associated protocol type.
Using Discovery
Use Discovery to build your initial network map or to locate a specific
device. After you have located the concerned devices, drag them onto a
network map where they can be used to conveniently monitor your
network.
You can select Discovery from the Utilities menu in the main EliteView
program, or activate it by clicking on the Discovery icon in the EliteView
program group. Specify the required protocol and then use Broadcast or
Search to locate attached devices.
Using Discovery, EliteView can automatically identify responding devices
and label them with the correct address (based on the selected protocol).
This indicates the status of current network connections, and also serves to
validate the accessibility of devices for subsequent management. Once a
device has been found, simply drag it onto a map and then initiate the
relevant management module by clicking on the device icon.
4-2
1. Select the appropriate network protocol.
2. Broadcast or Search for attached devices.
3. Drag key devices onto the configuration
map for later use.
DISCOVERY
When looking for devices using Broadcast, you may need to press the Broadcast button several times to ensure that
all attached devices have responded. For nodes that do not respond to broadcast queries, use the Search function.
In general, it may be necessary to search for devices not located in the same network with the EliteView
management station.
Menu Description
The menus provided for Discovery are briefly introduced below. Toolbar buttons are also described in this section.
Menu Definitions
Table 4-2 Discovery Menu Definitions
Menu
Label
Description
File
Exit current module – Closes the Discovery window and exits to the
calling program (i.e., EliteView platform or Windows Program Manager)
Protocol
Protocol selection and advanced settings
Select the devices to display based on network protocol:
UDP/IP – IP & ICMP, SNMP over UDP/IP agent
IPX – IPX, SNMP over IPX agent
Setup menu – Toggles display of devices without an SNMP agent; also sets
the scan rate and retry count.
Name
Name database management – Provides editing functions for the name
database, including adding or modifying object data. You can also dump all
the information gathered by Discovery into the Name database.
Tools
Alive Test – The Alive Test is used to directly test device response.
Help
Help and Version information – Provides detailed on-line help and
displays the version number for this software module.
4-3
DEFINING THE NETWORK CONFIGURATION
To automatically discover devices:
1. From the Edit menu, choose Discovery.
2. Choose the appropriate network protocol.
3. If you need to change the search criteria for devices,
open the Setup dialog box using the toolbar.
Field Description for Discovery Setup Menu
Table 4-3 Field Description for Discovery Setup Menu
Field
Description
Display IP Node
Display IP Nodes without an SNMP agent.
Display IPX Node
Display IPX Nodes without an SNMP agent.
Display Novell Server
Display Novell Servers.
Scan Rate
The scan rate between broadcast requests.
Retry
The number of times to query for device response.
Auto Set as default when
Protocol changes
Save the current setup as default when restarting Discovery.
For TCP/IP Nodes
• Broadcast within same network.
• Search for nodes across routers.
• Many IP nodes without SNMP can respond to ICMP queries.
For IPX Nodes
• Broadcast is sufficient.
• Search is not available.
• NetWare Servers use IPX protocol.
4. Click on Broadcast to transmit a query message and wait for responses from the local network. Broadcast is also
adequate for gathering global responses from IPX or Ethernet nodes located on different networks.
However, to find IP nodes on other networks, use the Search command and
provide a specific address range. If you are only interested in a specific range
of stations or need to search for stations that are difficult to reach, then click
on the Search button, specify the address range, and adjust the scan rate if
required. Discovery will search for devices within the specified range.
5. The status line at the bottom of the Discovery window shows the status of
the search. To temporarily halt the process, press the Pause button; press
Resume to continue.
4-4
DISCOVERY
6. The message End of Search will appear when the discovery
process is completed.
7. Move selected objects from Discovery onto the map by either of
the following methods:
• Drag objects directly onto the appropriate map.
• Use the Get Objects command (under the Edit menu) to fetch
objects based on protocol type from the queue of discovered
devices.
8. Draw in the existing connections and save the updated map.
(Refer to Creating Network Maps for detailed information on
building a network map.)
Adding Community Strings to Discovery
Discovery will search for devices within the specified communities.
To include any communities other than “public,” add the appropriate name to the
Community dialog box. You can include all the communities defined for your
network in a broadcast or search command. However, be aware that a blind search
creates excess traffic. Using a more conservative search will have less impact on
network performance.
Insert access control string for
authorized community
To automatically discover devices in a community:
1. Click on Community to display a list of community strings.
2. To add or modify a community string, click on an entry in the list and edit the
entry in the Edit field. Click OK to continue or Cancel to abandon the new entry.
3. Click on Broadcast to begin searching for devices.
Updating the Name Database
You can enter information directly from Discovery into the name
database. (Refer to the following section for a detailed description of
the Name Database Manager and its applications.) After the search
process has completed, you can use the Discovery toolbar to add
information for selected objects into the database, change information
for a selected object, or dump all the object data directly into the
database.
To add a device into the name database or to edit the description for a
pre-existing device, select an object with the mouse, click on the Add or Change button, and fill in the pertinent
information, including a name that will display beneath the object in the network map and notes for management
reference.
4-5
DEFINING THE NETWORK CONFIGURATION
Exiting Discovery
To close this module:
1. From the File menu, choose Exit.
2. The Discovery program will be closed.
Name Database Manager
Device names assigned with the Name Database Manager are used in many other EliteView modules
to help you readily select or identify network devices. The Name Database Manager can be opened
from the Utilities menu under the main EliteView program, or directly from the EliteView group
window by double-clicking on the icon shown here.
Also refer to the discussion on Updating the Name Database under the section on Discovery.
You can store information about network devices in the
name database, including a name, network address, physical
address, network protocol, device type, and informal notes.
For normal maintenance, we recommend updating this
information via Discovery. However, when you need to view
the entire database, you can use the Name Database
Manager.
All items included in the menu bar (under the File, Control
and Help menus) are also provided in the toolbar.
4-6
NAME DATABASE MANAGER
This table describes the basic editing tools.
Table 4-4 Name Database Manger – Editing Tools
Button
Label
Description
Add Record
Adds a new entry into the name database.
Delete
Record
Deletes an entry from the name database.
Update
Record
Updates a current entry in the name
database.
Search
Records
Searches for specified record(s) in the name
database.
Adding a New Entry
Click on the Add Record button to open this dialog box. Enter a suitable mnemonic
name, the network address (UDP/IP or IPX), the physical device address, the
network protocol (IP or IPX), the functional device type, and any informal notes.
Remember to indicate specific device types for SMC network devices and generic
designations for all other network devices. (Also note that the Get MAC function is
only enabled for the UDP/IP protocol under Windows 98, Windows NT 4.0
Service Pack 4 or later, Windows 2000 and Windows XP.)
Deleting Device Entries
Use your mouse to highlight the entries you want to delete and press the delete button. (Note that the same
conventions are followed for selecting multiple items as those used by the Windows File Manager.)
Updating Device Entries
Use your mouse to highlight the entry you want to update. Then change any of fields
in the dialog box as described above under Adding a New Entry. Note that when
device information is dumped from Discovery, the Name field is automatically filled
in using the network address. Therefore, you should update each entry to include a
meaningful name for these devices. You can do this directly from Discovery, but it
may be easier using the Name Database Manager, where the entire list of devices is
readily available for reference.
4-7
DEFINING THE NETWORK CONFIGURATION
Searching for Device Entries
You can easily display all device entries that meet your specified search criteria. Simply click on the Search button
and fill in the following parameters:
•
Search Mode – ALL or MATCHED
•
Sort Key – Device Type, MAC address, Name or Protocol
•
Sort Order – Ascending or Descending
• Search Keys – Name, Address, MAC Address, Protocol and Device type
If you select a search mode of ALL, then the search keys are disabled and all entries in the name database will be
displayed. If you select MATCHED search mode, you should include the device name, network address, physical
MAC address, protocol type, or device type, or any combination of these. Also remember that the search for
device name is case sensitive.
Creating Network Maps
Network maps are like road maps, they visually depict the entire network hierarchy. Network
administrators use them to trace out the connections between various network devices, and to quickly
activate dedicated management tools for a selected device. These maps describe the status of network
devices, their physical location, and their logical organization. This section describes how to create,
maintain and use network maps.
You can organize
network maps using
any number of
hierarchal levels.
The main EliteView program is used as the primary interface to most of the EliteView modules. However, this is
also where you create and edit network maps. The following menus are used for map functions.
4-8
CREATING NETWORK MAPS
Menu Description for Map Functions
Many of the items included in the menu bar are also provided in the toolbar. The following table describes these
basic tools.
Table 4-5 Menu Description for Map Functions
Menu
Label
Description
File
New Map – Initializes required parameters to create a new network
map.
Open Map – Opens an existing network map.
Save Map – Saves the current map along with any changes.
Save Map As – Saves the current map under a new name.
Exit – Exits EliteView, closing all subordinate modules.
Edit
Add Object – Adds a new object based on a textual description to
the map.
Modify Object – Allows you to modify any parameters for a map
object.
Delete Object – Deletes the selected map object.
Duplicate Object – Copies the selected object, after which you
should reposition it on the map and modify any required parameters.
Connect – Draws in a device connection from the currently selected
object to the next object you click on.
Disconnect – Removes a connection from the currently selected
object to the next object you click on.
Lock – Prevents any changes from being made to the current map.
Unlock – Allows changes to be made to the current map.
Background Bitmap – Selects a bitmap file to use for the map
background.
Text – Allows you to edit text that will be displayed on the map.
Arrange Objects – Orders objects in the map according to your
specifications.
Get Objects – Moves objects from queue of devices (found by
Discovery) onto the network map based on selected protocol type or
network identifier.
4-9
DEFINING THE NETWORK CONFIGURATION
Table 4-5 Menu Description for Map Functions
Menu
Label
Description
Options
Change Settings – Allows you to define the default map which will
be automatically displayed every time you open the main EliteView
program.
Change Password – Changes password required to display the
current map.
Map Information – Displays all user-defined parameters for each
device included in the current map by means of the Report Program.
Search Object – Locates specified object within map based on label
or address.
For information on menu items or buttons that appear under the main EliteView module but are not described in
this section, refer to “Using the Main EliteView Program” on page 3-9.
Table 4-6 Map Editing Toolbar Buttons
Button
4-10
Label
Description
Add New Object
Adds a new object to the current map.
Delete Object
Deletes an object from the current map.
Modify Object
Modifies the description for an object.
Connect Object
Connects the selected object to another
object.
Disconnect Object
Disconnects the selected object from
another object.
CREATING NETWORK MAPS
Editing Map Objects
The Edit menu provides all the tools you need to compose a full-scale hierarchical map of your entire network.
You may add or modify object descriptions, draw in physical connections, specify a bitmap to display as the
background image for your map, edit any labels or legends required for the map, and then lock it to prevent further
modification.
Adding a Map Object
The best approach to adding a map object is to first locate the target device using Discovery, drag the object onto
your network map, and then enter the additional information using the Modify Object function. However, you may
also add a new object based entirely on the textual description provided under the Add New Object dialog box.
1. Click on the Add New Object button (or press <Insert>).
2. Select an object type. Specific types are provided for SMC network devices. EZ Stack, TigerStack and
TigerSwitch devices are SMC products. For all other network entities, select the appropriate generic device type
as described below.
Table 4-7 Map Generic Device Types
Device Type
Description
IP Node
Any device connected via IP network protocol.
LAN Segment
A network backbone (i.e., view-only object).
SNMP Node
Any network device that supports general SNMP/UDP/
IP or functions.
Submap
A “hot link” to a submap.
3. Fill in the dialog box with the object attributes described below.
Table 4-8 Map Add New Object Dialog Box
Attribute
Description
Example
Label
Enter up to 16 characters. This label appears below the device icon.
Mktg001, Bldg1020,
Hub42.32
Address
The network address of the device. Enter in IP or IPX address notation,
depending on selected protocol type, where:
IP: 192.72.24.05
IP – Internet address and IPX – network number: node number.
Community
The community string used to access the device. This text string must
match the community string stored in the device. (An incorrect
community string will prevent access to the device.)
IPX: 000ACC01:
000000000001
public
4-11
DEFINING THE NETWORK CONFIGURATION
Table 4-8 Map Add New Object Dialog Box
Attribute
Description
Example
Protocol
The network protocol of UDP/IP or IPX.
UDP
Polling Interval
The interval between polling (in seconds). Setting a low value (2 seconds
or less) will generate excessive network traffic and make EliteView seem
very slow and unresponsive. While a very high value will make EliteView
insensitive to changes in device status.
5
Timeout
After sending an SNMP request, EliteView will wait for an appropriate
response (in seconds). If the device does not respond before the
specified timeout, EliteView will assume that the device is no longer
accessible.
3 (values greater than
3 are supported, but
not recommended)
Retries
When a device does not respond within the Retries limit, the device is
assumed to be off-line. The event “Connection Lost” is announced and
the icon turns red. EliteView will continue polling for responses (unless
Monitor is turned off, as described for the next parameter).
10
Monitor
If this box is checked, then it will be polled at the specified time interval.
If this box is not checked, then polling is disabled. Note that the
resources of the network management station may become overtaxed if
you attempt to monitor an excessively large number of stations.
Yes (checked)
Sample Configuration
For large networks, you should break the map up into several pieces that
can be opened independently. The following figure shows an example of
the network map for our offices in Europe. The submap icons are logical
links to other maps. In larger networks, you can represent the overall
configuration as logical network segments. To view a subordinate map,
double-click on the corresponding submap icon. The display shows the
path name for the selected submap in the title bar.
Submaps may also be used to view different maps of the same network.
For example, you might use several maps showing • “\Network” as the physical view
• “\Organization” as the logical network hierarchy
• “\Offices” as the network organized by offices
At the next lower level you can depict the network backbone for the selected network. A LAN Segment is a special
kind of view-only object that is designed to show a common backbone on a network. The LAN segment is also
commonly used to depict various networks based on different protocols (e.g., UDP/IP or IPX) connected to a
common backbone.
4-12
CREATING NETWORK MAPS
At the lowest level, place the actual network devices and draw in all interconnections. This gives you an accurate
picture of the network and also lets you activate applicable management software modules. For SMC’s network
devices, the corresponding device management module will be activated when you double-click on the device icon.
Modifying Objects
1. Select a network device by clicking on its corresponding icon.
2. Click on the Modify Object button.
3. Modify any of the required parameters. Refer to the table “Map Add New
Object Dialog Box” on page 4-11. Be sure to follow the guidelines in this
table when setting the Polling Interval or Timeout.
4. Press OK to continue, or Cancel to abort any changes.
Deleting Objects
1. Select any map object by clicking on its icon.
2. Click on the Delete Object button, or press the Delete key on your keyboard.
Duplicating Objects
1. Select any map object by clicking on its icon.
2. From the Edit menu, choose Duplicate Object. A copy of the object appears in the
upper left corner of your map.
3. Drag the duplicate object to its new location and draw in any corresponding
network connections.
4. For most applications, you will want to modify the object definition. Therefore,
click on the Edit Object button and modify field parameters such as Label and
Address.
Moving Objects
Use “drag and drop” to move an object. Select any map object by clicking on its icon. Holding the left mouse
button down, move the outline of the device icon to its new location, and release the mouse button. If an icon
cannot be moved, the map view has been locked. From the Edit menu, choose Unlock and try again.
Tip:
When creating multiple views of the same network, use Duplicate Object to make copies of objects, use
the mouse to “drag and drop” icons to a new location or another submap, and then use Edit Object to
modify the object’s description.
4-13
DEFINING THE NETWORK CONFIGURATION
Object Status
When an object is first added to the map, the device is “offline.” If an object's monitor flag is enabled, EliteView
will begin polling the device immediately. When the object first responds, device status changes to “online” and a
“device up” event is generated. If an object fails to respond within the specified timeout and retry limits, device
status changes to “offline” and a “connection lost” event is generated. Changes in the status of objects at lower
hierarchal levels in the network map are also reflected in the icons at higher levels (i.e., submap icons change color
to reflect changes in subordinate devices).
Note: To post changes in object status to the Report window, specify Device Up or Connection Lost in the Action
list for the Event Manager. For more information on defining event responses, see Managing Events,
Chapter 8.
Map Limitations
EliteView maps are designed without any arbitrary program limitations. Practical limits are set by the available
system resources.
4-14
CHAPTER 5
NETWORK TOOLS
EliteView supports a wide range of network tools that can be accessed directly from the device maps
(see “Creating Network Maps,” Chapter 4) or from the Window’s Program Manager. This chapter describes
utilities designed to allow a device to identify its own IP address, to help the network manager verify the existence
of a device in the network, and to update device software over the network.
Setting Addresses with the BOOTP Server
BOOTP is a protocol (running on the UDP/IP stack) used by network devices to find out their own IP address
and identify files which are to be subsequently downloaded to the client device. Typically, IP addresses are assigned
manually by the network administrator and recorded in the device’s permanent storage for ready reference.
For many network sites, managing IP addresses can be a chore. The network manager needs a convenient way to
access every device and dynamically assign its logical address from a central location. Since every device has a
distinct physical network address, a server can run a special network protocol that lets each device lookup its own
IP address based upon its physical address. Although there are many different address assignment protocols,
BOOTP is one of the most popular ones.
The BOOTP Protocol
The complete BOOTP protocol provides a wide variety of information services. However, EliteView’s BOOTP
Server only provides an IP address for device recognition and a filename for subsequent downloading.
Once a request is received, the BOOTP server uses the client station’s physical address as a key to find the client
station’s IP address. It replies with the corresponding IP address and a path/filename for a generic or specific
device initialization file.
How EliteView’s BOOTP protocol works:
1. A client station needs its IP address or filename information.
2. The client station sends a BOOTP request. Since it may not know its own IP address at this time, it may send
out a request via broadcast.
3. The EliteView BOOTP Server receives the request and uses the client station’s physical address as a key to
lookup the client station’s IP address. Next, the BOOTP Server looks up the filename for the client station.
5-1
NETWORK TOOLS
4. The BOOTP Server sends a reply message back to the MAC address initially provided by the client.
A client station may frequently lookup a filename with BOOTP. For example, a filename may be needed by the
client station to download operating system software from a dedicated file server using another protocol
(e.g., TFTP). Since EliteView also provides a TFTP Server, the service request can be completed entirely via
EliteView.
If the client station provides a generic name, such as “unix” or “hubware,” the BOOTP Server will reply with the
corresponding filename in the server. This allows multiple file download services for many kinds of devices. If the
client station does not provide a generic name, the BOOTP server returns the DEFAULT generic filename.
Starting the BOOTP Server
To open the BOOTP Database:
Choose BOOTP Server from the Utilities menu in the
main EliteView program, or directly from the EliteView
program group.
The dialog box for the BOOTP Server will display.
The screen has two parts. The upper half is the list of
address mappings, while the lower half is the list of file
mappings. Each client station has the following
attributes:
Table 5-1 BOOTP Server Dialog Box
5-2
Parameter
Description
Example
Name
Node name. This value is not used by BOOTP, but is useful for the
network manager.List of filename mappings.
NetWareSV2
MAC Address
Physical address of this node.
0000e80a3e9c
IP Address
IP network address.
192.219.74.32
Subnet Mask
This mask identifies the host address bits used for routing to specific
subnets.
255.255.0.0
Default Gateway
The gateway must be defined if the device is not located in the same IP
segment as the BOOTP server.
10.1.0.254
Note
A short memo field.
SNMPDRV2.BIN
Boot File Mappings
Generic names map to an actual filenames.
SETTING ADDRESSES WITH THE BOOTP SERVER
Select an entry in the node list to display the Note and filename mapping for the selected node.
Each node in the BOOTP Server can have its own filename mapping list. This provides maximum flexibility for
the network administrator. Default mapping is also provided, where in most cases per-node special mapping is not
required. Click on the DEFAULT name to set both the IP and MAC addresses to zero; this represents the default
file mapping list.
To exit the BOOTP server, click on the Exit button.
Adding and Modifying Node Information
The BOOTP Server starts with a single entry called DEFAULT. No file mapping is
initially defined for this entry. To provide BOOTP service based on generic
information, add the entries you require to the file map for the DEFAULT node. To
service specific nodes, enter data for each node.
To add a new node:
1. Click the Add Node button in the BOOTP Server dialog box. This will bring up
the Add Record dialog box.
2. Enter the following information in the record fields.
Table 5-2 Adding a Node to the BOOTP Server
Parameter
Description
Example
Name
Node name; enter up to 14 characters.
NetWareServer2
Note: The name cannot contain
space characters.
MAC Address
Physical address of the device.
000E80A301
IP Address
IP Network Address.
192.255.74.32
Subnet Mask
This mask identifies the host address bits used for routing to
specific subnets.
255.255.0.0
Default Gateway
The gateway must be defined if the device is not in the same
segment as the BOOTP server.
10.1.0.254
Note
Enter a note of 100 characters or less.
Backup file at Bldg 100-34.5
3. Click OK to accept the changes or Cancel to abort them. New node information appears in the node address list.
5-3
NETWORK TOOLS
To modify a node:
1.
2.
3.
4.
Click on the required node in the node address list.
Click the Edit Node button.
Make any changes to the current information.
Click on OK to accept the changes.
To delete a node:
1. Select a node entry by clicking on its address entry.
2. Click on the Del Node button.
The node entry and all associated file mappings are removed.
Adding Filename Mappings
The file mapping list shows every node defined.
To add a filename mapping:
1. Click on an entry in the node address list.
2. Click the Add... button in the File Mappings field to insert a new file map entry.
– The Add File Mapping dialog box will appear.
3. Input the generic name and filename, including the path.
4. Click OK to store the new mapping.
– The new entry will appear in the file mappings list.
To view the note and file mapping(s) for a node, click on the required entry in the address list.
To change filename mappings:
1.
2.
3.
4.
Select the file mapping.
Click on the Edit button.
Change information in the Edit File Mapping dialog box.
Click OK to accept changes.
To delete a file mapping:
1. Select the file mapping.
2. Click on Delete.
The filename mapping will be removed.
5-4
DEFAULT INFORMATION
Default Information
EliteView’s BOOTP Server provides flexible filename mapping. However, you may find it most convenient to
establish a common default for most nodes on the network.
To define a default address with IP and physical addresses:
1. Select the “default” address (0.0.0.0).
2. Define file mappings applicable to all nodes on the network.
Every BOOTP request to lookup a filename will be checked in this priority:
1. Consult the specific node address.
2. If no address is found for the specified node, consult the default file mappings.
In addition to the explicit default file mappings, the BOOTP Server also provides implicit default file mapping.
When a node is included in the address list and the client station provides no generic filename, it is asking for a
default file mapping that you must provide. A DEFAULT filename must be defined for all stations requiring this
type of mapping. If a DEFAULT generic name is not defined, the request is ignored.
Probing Devices with the Alive Test
The Alive Test serves as a basic network monitor. It determines link status by sending packets between
the network management station (i.e., your PC) and the target node (e.g., gateway, hub or node). This
test can be initiated from the Tools menu in the main EliteView program, from the Discovery module,
or directly from the EliteView program group.
The Alive Test can be used with any IP or IPX device – including devices that do not support SNMP (like
gateways). It cannot be used with the Ethernet protocol. To discover the existence of a device, the Alive Test uses
“ICMP echo” for UDP/IP networks, and the IPX Diagnostic command for IPX nodes. If a device responds
correctly, it returns the message to the sender. When the echoed message is received by the sender, it can
determine:
•
•
•
•
Existence of the target device
Round trip delay time
Relative network throughput (transmission speed, etc.)
Return ratio (percentage of packets correctly returned)
5-5
NETWORK TOOLS
To select a target device:
If you open the Alive Test from the EliteView program group or from the Discovery
module, select the network protocol as UDP/IP or IPX. Then specify the target
address and polling interval.
Initialization window
displayed when opening the
Alive Test from the
EliteView program group or
from Discovery.
However, if you activate the Alive Test from within the main EliteView program
follow these steps:
1. Open a map containing the target device.
2. Select the device with your mouse.
3. From the Tools menu, select Alive Test.
Note that network protocol, target address, and polling interval default to the object
description as defined in the EliteView map.
In a few seconds, a dialog box opens showing device status.
To adjust parameters for the Alive Test:
•
•
•
•
•
•
Adjust the Time Interval by clicking the up/down arrow to increase or decrease its value. Time interval is the
duration (in seconds) between the transmission of query messages from your PC, the network management
station (NMS).
Click Pause to halt the Alive Test temporarily.
Click Resume to re-start the Alive Test.
Click Reset to clear all the statistics.
Click Set to specify a gateway for the target device.
To exit the Alive Test, click on Exit.
The Alive Test collects a number of statistics. These include:
Table 5-3 Alive Test Statistics
5-6
Statistics
Description
Example
Packets Sent
Number of messages sent by Alive Test.
7
Packets Received
Number of echoed messages received by Alive Test.
6
Received Percentage
Ratio of messages received to messages sent.
85%
Average Round Trip
Average time interval between the original message sent and the echoed
message received.
900 ms
DOWNLOADING FILES WITH THE TFTP SERVER
Problem Solving with the Alive Test
The Alive Test helps determine a number of network conditions:
1. Symptom: No response with the Alive Test.
Condition:
No response is ever received during an Alive Test.
(packets received is 0).
Possible Cause:
The device does not exist or there is a cabling problem between your network management station and the
target device.
2. Symptom: No response with EliteView (main program), but responds to the Alive Test.
Condition:
A device responds to Alive Test (packets received is not 0).
Possible Causes:
a. The target device does not support SNMP.
b. The community string for the target device does not match the setting for the object in the EliteView map.
Downloading Files with the TFTP Server
Network devices frequently include embedded firmware (software stored in ROM or flash memory)
required for their operation. For example, SMC’s EZ family of manageable devices
(e.g., the EZ Stack 10) all include memory for an SNMP agent.
The trivial file transfer protocol (TFTP) is the most common standard for downloading files to network devices.
SMC uses TFTP to download files for most of its manageable networking products.
Starting the TFTP Server
To start the TFTP Server, choose TFTP Server from the Utilities menu in the main EliteView program or directly
from the EliteView program group.
Using the TFTP Server
EliteView’s TFTP Server provides a public directory for general downloading. The default directory is
C:\EV50\PUBLIC. Only files in this directory can be downloaded to a target device or transferred to another
server.
5-7
NETWORK TOOLS
To configure the TFTP server, choose Setup from the File menu. The
TFTP Setup dialog box will open, displaying options for the download
directory, the default timeout to wait for a service response, and the default
number of retries before terminating a connection attempt as described
below.
Field Description for Discovery Setup Menu
Table 5-4 Field Description for Discovery Setup Menu
Field
Description
Example
Public Read Directory
Default directory for all files for public downloading.
C:\EV50\PUBLIC
Default Timeout
Maximum elapsed time (in seconds) TFTP will wait until it gets a
response from a target device. The optimal value depends on your
specific network
5 seconds
Default Retries
Maximum number of attempts TFTP will try to get a response
from the target device before declaring that the session has failed.
3
Viewing the TFTP Process List
When the TFTP server receives a file transfer
request, an entry appears in the process list window.
For each entry, the following parameters are
displayed:
Table 5-5 TFTP Process List
5-8
Parameter
Description
Example
Target Node
The IP address of the device that initiates the TFTP file transfer
session.
192.74.255.74
Role
Indicates whether the TFTP server is acting as a server or a
client.
Server
Action
Indicates file download or simple transfer.
SEND
Filename
The file being accessed.
SNMPDRV.BIN
Progress
Current status of the file transfer (based on a percentage of the
file that has already been transferred).
10%
TELNETING TO OTHER COMPUTERS ON THE NETWORK
Fetching Files from Other Servers
You can use the TFTP server as a client to receive files from other
TFTP servers.
To start a transfer session:
1. Choose Read File From... from the Service menu.
2. A dialog box will appear requesting additional information.
Check the box Keep File Upon Failure to save a partial file transfer.
The required parameters are defined below.
Table 5-6 TFTP Read File
Parameter
Description
Example
Target Node
IP address of the target TFTP server. This is the source of the original
file.
192.74.255.74
Remote Filename
The file you want from the TFTP server. The path is restricted to the
EliteView public directory for security reasons.
SNMPDRV.BIN
Local Filename
Name of the file after it has been received.
SNMPDRV.BIN
Keep File Upon Failure
Click on this check box to save partial results when file transfer fails.
Telneting to Other Computers on the Network
Telnet is a TCP/IP application protocol that allows you to access a remote computer system (e.g., a UNIX or SUN
workstation) as though you were attached locally via a serial terminal. As long as you have a user account on the
target system and the necessary user privilege, you can execute any text command.
If you require frequent access to a particular workstation, you may want to include it in your network map as an IP
Node.
To telnet into a workstation using your network map:
1. Select the appropriate IP node from the network map with your mouse.
2. Open the Tools menu under the main EliteView window and click on Telnet.
3. Log into the remote workstation.
5-9
NETWORK TOOLS
Where You Are (WUR)
Where You Are is a tool that is used to locate which port on the switch and port to which a remote host is
connected. You only need to input the IP address or MAC address of the remote host; then either enter a
broadcast domain or enter a particular IP range to search for switches, then click Go. Where You Are will then
display the port and the switch that the remote host is connected to.
File Menu Commands
Load Profile
Loads a saved profile.
Saving a Profile
Saves information on switches discovered by Where You Are by using either Search or Broadcast. The information
includes the switch IP address, MAC address, community string, and the SNMP version used by Where You Are.
This information is automatically written into the switch.ini file in the Program File folder in your PC's file
directory. When Where You Are is subsequently booted up it will automatically read the information previously
written into the switch.ini file and display this information in the main Where You Are screen.
Community
The broadcast function uses a list of SNMP community strings when searching for devices. A device can only
respond to frames with the correct community string. Where You Are can obtain information from switches with
known community strings that have been set to read/write or read- only access mode via the Web interface or the
CLI. You must know the community strings used by devices in your network and enter them in the "Community
Strings" list in the "Community" dialog box (this is one of the security features of the SNMP protocol). Follow the
instructions below to enter the read/write community strings of the Where You Are supported devices from
which you wish to obtain information.
Select Utilities>Community from the Utilities Menu to open the "Community" dialog box. The first time that you
do so, the only string that will be displayed is the default string "public." (This string has read-only access.)
To add or modify a community string, click on an entry in the list, type known existing community strings in the
"Edit" field then click OK to continue or Cancel to abandon the new entry.
Broadcast
Use the Utilities>Broadcast command in the Utilities Menu to transmit a query message and wait for responses
from the local network.
Broadcast follows two steps:
5-10
WHERE YOU ARE (WUR)
1. SNMP packets are sent to find switches on the local network. The IP address and MAC address of these
switches are discovered and saved.
2. ICMP packets are sent to all switches on the local network to provide them with the MAC addresses of remote
hosts. These addresses can then be learned and stored in the switches' dynamic address tables.
Parameters
• IP Address: The IP address of the switch.
• MAC Address: The MAC address of the switch.
Search
To find IP nodes on other networks, select Utilities>Search in the Utilities Menu. If you are only interested in a
specific range of devices or need to search for devices that are difficult to reach, then in the Search Range dialog
box, specify the address range, and adjust the scan rate if required. After clicking OK button, Where You Are will
send SNMP packets and ICMP packets to the specific range of devices.
Remove All
Remove all clears all data and returns the application to its original status.
Exit
Closes the WUR application.
Device Menu Commands
Address
Before using the Address function you must first go through the procedures explained in Broadcast or in Search.
Then select Device> Address from the Device menu, enter the IP address or the MAC address of remote host and
click OK. This will result in Where You Are carrying out three functions:
1. Determining the content of the dynamic address tables for all ports on all located switches.
2. Identifying the MAC addresses of all ports on all identified switches
3. Identifying the port number, MAC address and IP address of the port to which the remote host is connected.
If you enter the IP address, Where You Are will automatically convert it to a MAC address and display the MAC
address in the Where You Are title bar.
After you have entered either a MAC Address or an IP Address Where You Are will then carry out the series of
actions listed below.
1. Where You Are will interrogate the dynamic address tables of all previously located switches on the network.
5-11
NETWORK TOOLS
2. Where You Are will then copy these dynamic address tables to your PC and display them in a list in the lower
part of the Where You Are dialog box under the heading "Building host table."
3. After completing the copying of dynamic address tables, Where You Are will identify the MAC addresses of all
ports on the located switches and record these in the form of "self address tables."
4. These self address tables will then be displayed beneath the list of dynamic address tables.
5. Where You Are will then identify the port number of the port to which the remote host is connecte, and also
the IP address and MAC address of this port. This information will be displayed below the list of self address
tables.
If Where You Are cannot determine the switch port to which the remote host is connected, it will display a "Not
found" message.
The reasons for Where You Are not determining the switch port to which the remote host is connected are listed
below.
1. The remote host is not connected to any of the previously located switches.
2. All of the switches on the network are unmanaged.
3. The dynamic address table does not record the MAC address of the remote host.
Learn Table
To display the contents of the dynamic address tables (see Device Menu Commands ) for a specific switch, select
the switch and then click on the Learn tab at the bottom of the Where You Are dialog box.
Self Table
To display the contents of the self address tables (see Device Menu Commands ) for a specific switch, select the
switch and then click on the Self tab at the bottom of the Where You Are dialog box.
Option Menu Commands
Setup
Before sending packets to the devices on the local network, you should specify the default settings.
1. Select Options>Setup from the Option Menu.
2. In the Setup dialog box, set polling parameters that are applicable for your particular network environment.
Parameters
• Default Polling: This is the number of times per second that Where You Are will issue SNMP query
messages (see Broadcast.)
• Default Timeout: Maximum elapsed time (in seconds) Where You Are will wait for a response from a target
device. The optimal value depends on your specific network. Default: 5 seconds
• Default Retries: Maximum number of attempts Where You Are will try to get a response from the target
device before declaring that the session has failed. Default: 3
5-12
BATCH UPGRADE
•
Auto broadcast on startup: If this box is checked, Where You Are will automatically transmit a broadcast
message on startup.
Output
When you click on the Output tab, the history of actions carried out by Where You Are (as described in Device
Menu Commands) will be displayed.
Batch Upgrade
Batch Upgrade is used for downloading op-code files into switches located on the local network or on remote
networks. The functions included in the File, Utilities, Edit, and Options menus are explained below.
File Menu Commands
Exit
Closes the Batch Upgrade application.
Utilities Menu Commands
Community
Click on Community to display a list of community strings.
Broadcast uses a list of community names when searching for devices. A device can only respond to frames with
the correct community name. You must know the community names used by devices in your network and specify
them in the community list. This is one of the security features of the SNMP protocol.
To add or modify a community string, click on an entry in the list and edit the entry in the Edit field. Click OK to
continue or Cancel to abandon the new entry.
Broadcast
Click on Broadcast to transmit a query message and wait for responses from the local network. Broadcast follows
two steps:
1. An SNMP packet is sent to find devices that Batch Upgrade supports.
2. The SNMP packet is sent to specified switches to obtain the information that follows below.
5-13
NETWORK TOOLS
If Batch Upgrade can get a response from devices using broadcast frames, it will try to identify the device type by
using SNMP commands. If a device is recognized, the parameters listed below will be displayed on the screen. If a
known switch on the local network is not discovered by Broadcast, then use the Search option.
Search
Use Search to find a specific range of stations, stations on the local network that cannot be discovered by
Broadcast, or stations on IP nodes on other networks. Click on the Search button, specify the address range, adjust
the scan rate if required, then click OK.
Remove All
Remove all clears all data and returns the application to its original status.
TFTP Server
Opens the TFTP Server application. See “Downloading Files with the TFTP Server” on page 5-7.
Upgrade
Click on Upgrade to download the op-code to devices. Upgrade will then process switches in turn. If switches
receive firmware successfully, Upgrade will set the op-code file for start-up and then reboot the device. If a switch
fails to receive the firmware, Upgrade will display an error message and continue to process other switches.
Edit Menu Commands
Select All
Click Select All to select the devices for which you want to upgrade the firmware. You can also click Clear to clear
the devices you have selected from the screen.
5-14
BACKUP
Options Menu Commands
Setup
Click on Setup in the options menu to open a dialog box with the following commands:
Download Same-numbered Version
Check the Download same-numbered version check box to download firmware with the same version number as
the existing firmware in the switch. You may wish to do so if this version of the firmware has been previously
loaded into the switch and there have subsequently been problems with this firmware.
Download Older Version
Check the Download older version check box to download op-code with an older version number than the existing
firmware in the switch.
Default Polling
This is the number of times per second that Batch Upgrade will issue SNMP query messages messages see
Broadcast.
Default Retries
This is the number of times that Batch Upgrade will issue SNMP query messages messages see Broadcast.
Backup
Backup is a tool that used to backup the latest version of the configuration file on a network device. It replaces the
conventional way used to backup files by setting SNMP commands. Backup can load devices from a Map file
(Created by EliteView) or an exported file (*.dbf), discover and collect lots of networking devices located in
different places. Users can use simply Drag and Drop operations to configure backup information. After clicking
the Backup or Start Schedule speed button (or using the Utilities menu) the program will automatically process
these devices in turn.
File Menu Commands
Load From Map
Map View can load device from a Network map file.
Refresh File List
Refresh File List refreshes the files in the File View tab.
5-15
NETWORK TOOLS
Utilities Menu Commands
Broadcast
Click Broadcast from the Utilities menu to transmit a query message and wait for responses from the local network.
Broadcast
is also useful for gathering global responses form Ethernet nodes located on different networks. When you click
Broadcast the Backup application does the following:
1. Sends an SNMP packet (IP address is 255.255.255.255) to find network devices.
2. Sends an SNMP packet to specified switches and gets the device information.
3. Adds devices on the network to the Discover view tab.
The user can then select a device, then drag and drop them to the Backup List.
Search
If you are only interested in a specific range of stations or need to search for stations that are difficult to reach or
to find IP nodes on other networks, use the Search command. Click Search from the Utilities menu to open the
Search Range screen. Then, specify the IP address range, adjust the scan rate if required and click OK. When you
click OK the Backup application does the following:
1. Sends an SNMP packet to find network devices within the specified range and gets the device information.
2. Adds devices on the network with an IP address within this range to the Discovery view tab.
The user can then select a device, then drag and drop them to the Backup List.
Backup
To backup the configuration file of the devices, click Backup from the Utilities menu (or the Backup icon) to
download the configuration file from the devices added to the Backup List. Backup will process devices in turn. If
operation is failed that you backup configuration file from a device, Backup will display the error message and
change to process other devices.
5-16
BACKUP
Start Schedule
Select a device from the Backup List and click Start Schedule to start the download schedule for that devices
configuration file.
Stop Schedule
Click Stop Schedule to stop the download schedule for that devices configuration file.
Options Menu Commands
Community
Backup will Check and search for devices within the specified communities. To include any communities other than
“private”, add the appropriate name to the Community dialog box, you can include all the communities defined for
your network in a broadcast or search command.
To automatically discover devices in a community:
Click menu Community from the Options menu to display a list of community strings.
To add or modify a community string, click on an entry in the list and edit the entry in the Edit field. Click OK to
continue or Cancel to abandon the new entry.
Click Broadcast or Search from the Utilities menu to begin searching for devices.
(Note: the Community Strings has to Input read-write privilege for Set Request)
Setup
The Setup screen allows the user to configure daily and weekly backup times as well as the default polling times,
timeout time and number of retries.
Set the start time using the hour (0-23) and minute (0-59) fields. Set the days which to backup by selecting one or
more or the day checkboxes.
Click OK to save the changes
5-17
NETWORK TOOLS
5-18
CHAPTER 6
SNMP MIB MANAGEMENT
For all of SMC’s intelligent network devices which include an SNMP-based management agent, you can use the
device management modules in EliteView to easily access and manage detailed network information. EliteView’s
map module allows you to intuitively “zoom in” on objects to see low-level details on device hardware/software
configuration and associated network interface parameters. For all SNMP-based devices (both ours and third-party
products), you can access the complete SNMP Management Information Base (MIB) using the MIB Browser
utility.
EliteView provides three basic MIB management utilities:
•
•
•
MIB Compiler – Used to update or add modules to MIB database.
MIB-2 Viewer – Displays MIB-II variables based on a functional grouping.
MIB Browser – Provides full access to all MIB variables, such as MIB II, Bridge MIB, as well as SMC private
MIBs.
This chapter provides detailed information on managing your device database. The following sections use objects
you have added to your network map. If you do not have a network map, you may want to turn to “Creating
Network Maps” in Chapter 4. For more information about managing specific devices, refer to the appropriate
EliteView users guide.
6-1
SNMP MIB MANAGEMENT
MIB Compiler
The MIB Compiler is used to maintain the MIB database used by EliteView. Definitions for standard
objects, network devices, or private third-party devices can be compiled and included in this database.
All device management applications under EliteView consult this database when accessing devices.
Under normal use, rely on the setup program for new management applications to automatically adjust
the MIB database. However, if you need to modify the database yourself, the compile operation can be carried out
interactively, or as a batch process. Specific MIB databases can also be unloaded when they are no longer in use, or
out of date.
Caution: Compiling changes the MIB. Quit EliteView before running this process to make sure no module
accesses the database while it is being compiled.
MIB Database
MIB.DBF, MIB.DBF and MIB.MDX – You can find these files in the EliteView directory. MIB text files have
the following format:
<MIB Name> BEGIN
.
.
.
END
Each MIB text file can contain several MIB modules, which we may call <MIB name>. EliteView accesses
external MIB variables via this name.
6-2
MIB COMPILER
Starting the MIB Compiler
Running the MIB Compiler
Select MIB Compiler from the EliteView program group.
It will automatically load the current MIB database as shown below.
The following table describes each function.
Table 6-1 MIB Compiler Dialog Box
Item
Description
MIB Module List
Shows all the modules used by EliteView.
Sample Display
Compile Status
Filename
The filename for a module to add or update.
smc8608.mib
Module
The name of a module as recognized by the MIB database.
SMC8608-MIB
Status
Shows the current compile status.
Merge
Line
The current line being compiled.
145
Label
The macro currently being processed.
6-3
SNMP MIB MANAGEMENT
Table 6-1 MIB Compiler Dialog Box
Item
Description
Sample Display
Load
Loads a MIB text file into the database.
Filename:
C:\EV60\MIB\SMC.MIB
Unload
Unloads a MIB module from the database. If the specified module
has any dependencies; i.e., has other modules attached to it, the
compiler will ask whether or not you want to unload the specified
module and all of its dependencies. This is analogous to deleting a
subdirectory – You cannot delete a subdirectory without first deleting
the files it contains.
Current MIB:
RFC1213-MIB
Functions
Loading a new MIB
1. Select Load from the MIB Compiler.
2. Type the full name of the MIB file in the Filename field.
Each MIB file defines a MIB module. The MIB name is indicated at the beginning of the file as in the example
below, where the name of the module is given as RFC1213-MIB.
RFC1213-MIB DEFINITIONS::=BEGIN...
All MIBs are defined under the same tree, making MIB definitions related to one another.
The EliteView MIB database identifies MIB objects with names and modules. Each object has a distinct name
within a module, and each module may be loaded or unloaded at any time.
The MIB Compiler reads the specified MIB file and displays the names of the MIB objects as the file is scanned. If
any error occurs during this process, it will stop scanning and display the object label and the line number near
where the error occurred as in the example below:
6-4
MIB-2 VIEWER
If an object identifier is not defined, the following message may appear on the screen:
If an unknown object identifier is found in the definition for OBJECT-TYPE, it will be reported after all MIB
objects are checked as in the following error message. In the example given below, you should check the last line of
the OBJECT-TYPE macro section.
Error: Lost connection for node sysObjectID
Unloading MIB modules
You can unload a MIB module when it is no longer needed, or when you wish to update or replace it. Highlight the
MIB you want to unload, list currently loaded modules, and then select Unload. If other MIB modules link to the
module you wish to unload, EliteView will ask you to unload these modules first before you can successfully
unload the required module.
Viewing the MIB Module List
Use the scroll bar next to the MIB Module List on the MIB Compiler. This list shows the modules currently loaded
in the MIB compiler.
Things to remember when using the MIB Compiler
•
•
•
The system always loads the current MIB database.
To replace a MIB with its new version, first unload the older version and then load the new version.
If an error occurs during the loading or unloading process, the MIB Compiler automatically skips the erroneous
command and moves on to the next one.
MIB-2 Viewer
The MIB-2 Viewer is a generic SNMP monitoring tool used to browse MIB II (i.e., the Management
Information Base defined by RFC 1213). By browsing through this MIB, you can access information
recorded in MIB II for any SNMP-compliant device attached to your network. However, to set MIB
variables, remember to use the MIB Browser.
Note that although all SNMP devices support MIB II, most groups are optional and may not be implemented.
Only System, Interface and SNMP groups are likely to be found on all systems.
6-5
SNMP MIB MANAGEMENT
You can invoke the MIB-2 Viewer from the Tools menu in the main EliteView program (preferably after selecting
a device from the EliteView map), or by clicking on the appropriate icon in the EliteView program group. If you
are not opening the MIB-2 Viewer directly from the EliteView map, then you must also fill in the device interface
parameters in the MIB2VIEW initialization dialog box, including protocol type, target address, SNMP community,
and polling specifications.
Once loaded, the MIB-2 Viewer begins searching for definitions for the
specified object in EliteView’s MIB database. After the target data has been
retrieved, open the directory branches along the path leading to the required
variable by double-clicking on each intervening node. (Note that the icons for
collapsible nodes are highlighted at the top.)
After opening the required window, you can readily view all the key variables
associated with the selected topic. To copy MIB data into the Output
window, just press the Output button. You can edit and save the information
copied to the Output window using the buttons provided in toolbar.
New
Open Save Save As
Undo
Cut
Copy
Paste
The toolbar for the MIB Viewer contains two basic button groups for file
management and output editing. After creating a status report via cut &
paste and manual annotation, be sure to save your file before exiting
EliteView. Note that a brief description of every toolbar button is provided
in the Status bar at the bottom of the screen.
( For a more detailed description refer to “Status Bar” in Chapter 3.)
A description of the menus and a few of the display screens used by the
MIB-2 Viewer is provided below. For more detailed information of specific variables, refer to the MIB Browser or
the appropriate RFC.
6-6
MIB-2 VIEWER
Menu Bar
The menu bar for the MIB-2 Viewer provides five key menus, namely, File, Edit, Search, Window and Help.
Clicking on any of these items will open a pull-down menu from which you can invoke corresponding commands.
Table 6-2 MIB-2 Viewer Menu Bar
Menu
Description
File
Contains commands to open and save report files (New Output, Open File, Save Output, Save Output As),
and to exit the host management program (Exit).
Edit*
Contains standard editing commands used in conjunction with the Output Window.
Search*
Contains editing commands used to find or replace specified text in the Output Window.
Window
Contains standard commands for arranging your windows (Cascade, Tile) and icons (Arrange Icons), or
switching to another window.
Help
Used to invoke available on-line help functions, or to display the revision number for your current version of
EliteView.
* Only displayed in conjunction with the Output Window.
MIB-2 Directory
The information displayed in the MIB-2 directory is presented in easily understood graphic windows. A few of
these windows are fully described below. For further details on the other directory entries, please refer to textual
descriptions provided by the MIB Browser.
System Information
System information is extracted from the System Group in MIB II
(RFC 1213). It provides data on the SNMP agent installed on the device
being monitored.
System Information Window
System Information provides data on the SNMP agent.
Field Descriptions for System Information Window
Table 6-3 Field Descriptions for System Information Window
Field
Description
Description
Name of the management agent, version number and release date.
Object ID
Unique identifier for device model.
6-7
SNMP MIB MANAGEMENT
Table 6-3 Field Descriptions for System Information Window
Field
Description
System Up for
Time since the SNMP agent was last re-initialized.
Contact
Name of contact person for this monitored node; and how to make contact.
Name
Administrative designation for this node.
Location
Physical location of this node.
Service Layers
Internet protocol services offered by this node. The OSI model includes: (1) Physical, (2) Data Link,
(3) Network, (4) Transport, (5) Session, (6) Presentation, and (7) Application layers.
Interface Administration
Data for this window is extracted from the Interface Group
in MIB II (RFC 1213). Each MAC frame type supported by a
physical network interface is listed as a unique logical
network interface in the display window. (Refer to ifType in
RFC 1156.) For example, even though there may only by one
physical network interface on a monitored device, it may
concurrently support both ethernet-csmacd and
iso88023-csmacd. Also note that the same type may be
reported more than once where a logical interface includes
several valid subtypes. For example, ethernet-802.2 and
ethernet-II both fall under ethernet-csmacd.
This window provides a description and status information
on each subnetwork connected to this system.
Field Description for Interface Admin Window
Table 6-4 Field Description for Interface Admin Window
6-8
Field
Description
Interface (Index)
A unique index for each subnetwork connection.
Description
A textual description of the interface, which may include items such as the product name,
manufacturer, or version number for the hardware interface.
Type
The interface type based on the physical/link protocols running immediately below the network
layer, e.g. ethernet-csmacd (where csmacd indicates Carrier Sense Multiple Access/Collision
Detection).
Physical Address
The interface address used at the protocol layer immediately below the network layer. This value
will be zero for interface types that do not support such an address.
MIB-2 VIEWER
Table 6-4 Field Description for Interface Admin Window
Field
Description
Interface State
The requested state of the interface including the following items. Note that when the interface is
in testing mode, no operational packets can be passed.
up:ready to pass packets
down:not allowed to pass packets
testing:operating in a test mode
Operational State
The current operational status of the interface, including the same states as defined above for
Interface State, except where “down” indicates that the device is not capable of passing packets.
Specific
Reference to an MIB with definitions for the media type (e.g., Ethernet) used by the interface. If no
information is available, this value will be zero.
Interface Statistics
Data for this window is extracted from the Interface Group This window provides statistical information on the
traffic and associated errors for the selected interface.
in MIB II (RFC 1213). An entry is included for each
subnetwork interface. This window provides information on
the amount of traffic passing through this interface and the
associated errors. This information can also be displayed as a
graph by clicking STAT, or passed to the EliteView Log
Manager by clicking LOG and defining the required event
criteria. Refer to the sections on Viewing Statistics or Adding
a Log Process if these functions are required.
Field Description for Interface Statistics Window
Table 6-5 Field Description for Interface Statistics Window
Field
Description
Interface (Index)
A unique index for each subnetwork connection.
InOctets
Total number of bytes received on the interface, including framing characters.
InUcastPkts
Number of subnetwork unicast packets delivered to a higher-layer protocol.
InNUcastPkts
Number of non-unicast packets (i.e., broadcast or multicast) delivered to a higher-layer protocol.
6-9
SNMP MIB MANAGEMENT
Table 6-5 Field Description for Interface Statistics Window
Field
Description
InDiscards
Number of inbound packets that were discarded even though no errors were detected. One
reason for discarding such packets is lack of buffer space.
InError
The number of inbound packets containing errors that prevented them from being delivered to
a higher-layer protocol.
OutOctets
Total number of bytes transmitted from the interface, including framing characters.
OutUcastPkts
Total number of packets requested by higher-level protocols for retransmission to a unicast
address, including those either discarded or not sent.
OutNUcastPkts
Total number of packets requested by higher-level protocols for retransmission to a broadcast
or multicast address, including those either discarded or not sent.
OutDiscards
The number of outbound packets containing errors that prevented them from being delivered
to a higher-layer protocol. One reason for discarding such packets is to free up buffer space.
OutError
Number of outbound packets that could not be transmitted due to errors.
Viewing Statistics
The STAT button is used to display a real-time graph of the
corresponding counter read during each polling interval.
Click Stat to display the corresponding graph.
Click on Config under the Option menu to change parameters for the
graph. The Config Statistics dialog box appears. You can change the
graph’s scale, ruler, style [i.e., filled curve, curve (fill)], and color, or reset
the graph. Click OK to return to the graph, or Cancel to abort any
changes.
Click on Exit under the Option menu to return to the invoking window.
6-10
MIB BROWSER
Adding a Log Process
The Log button is used to define a new log process for the Log Manager.
The Log Manager performs the following basic functions:
• Periodically records values for device variables.
• Sets thresholds to trigger events when conditions are met.
Click on Log to display the Log Information dialog box.
Complete the entries for Log Name, Filter, Threshold, Event Name, Notes, and
Polling Interval to provide precise control over Logging operations. Refer to Chapter 7, “Collecting Data with the
Log Manager,” for a detailed explanation of the Log Information dialog box.
MIB Browser
The MIB Browser is a generic SNMP management tool used to browse MIBs. By browsing through the
MIB, you can send commands to get or set information defined in the MIB.
You can invoke the MIB Browser by selecting MIB Browser from the Tools menu in the main EliteView
program, or by clicking on the MIB Browser icon in the EliteView program group. Once loaded it begins searching
for definitions for the specified object in EliteView’s MIB database. After selecting a desired variable, you may
issue SNMP commands to get or set various device parameters
Basic Functions of MIB Browser
1. The MIB Browser window provides access to the EliteView MIB database. The definitions for all known MIB
variables can be consulted here. This window also provides access to variables stored in managed devices via
the SNMP Get, Get Next, Get Bulk, and Set commands. You can view any of these variables in either ASCII or
binary format, set values for variables that provide write access, or specify a log process.
2. The log utility allows you to define new processes for the Log Manager, and quickly paste selected variables
into the filter and threshold fields.
6-11
SNMP MIB MANAGEMENT
Menu Description
The menus provided for the MIB Browser are briefly introduced below.
Menu Definitions
Table 6-6 MIB Browser Menu Definitions
Menu
6-12
Label
Description
File
Create Tree – Provides options to open a new tree
(where the default sets the root at the currently
selected node). Exit closes the MIB Browser.
Search
Search Functions – Provides search related
functions.
SNMP
Access MIB Variables – Provides standard access
commands for MIB variables, along with utilities to
add a new log process, display a graph for a selected
variable, use SNMP Walk to get the value of all the
child nodes of a selected node or show and edit data
in a table using the MIBTable Browser.
Options
Polling – Adjust timing for data requests, including
polling interval, timeout, and retries. Set polling to
comply with the retries defined in the Polling Time
dialog box, or opt to continue polling until the
queried device responds.
Output – Set output to display values in ASCII or
binary, and select value fields to pass to the output
window
View
Viewing Facility – View or hide the toolbar and
status bar by clicking on the respective option.
Erase Output – Erase all text from the output
window by clicking on the Clear All option
MIB BROWSER
Table 6-6 MIB Browser Menu Definitions
Menu
Label
Description
Window
Manage Windows – Arrange windows or icons,
or activate an existing window.
Help
Help Facility – Access detailed help information
about the MIB Browser.
Accessing Device Values
Fetching Device Values Using The MIB Browser
1.
2.
3.
4.
5.
Start EliteView
Open your network map. (Refer to Chapter 4 if you have not yet created your network map.)
Select the required device by clicking on it with the mouse.
Select MIB Browser from the Tools menu. This will bring up the MIB Browser window.
Open a new MIB tree by selecting File, New MIB Tree, this will open the New Subtree dialog box. Then open a
new MIB tree by specifying the root variable:
a) Indicate whether the object type is a Label or numeric Object Identifier (e.g. the object identifier for internet
is 1.3.6.1).
b) Select the MIB containing the root from the scroll list.
c) Specify the tree root (or the name of the required object) in the Object edit box.
d) To use the first entry matching the specified prefix, clear the Find exactly check box. To set the tree root at the
exact variable as specified, mark the Find exactly check box. Click OK to continue or Cancel to start the browser
without a tree window.
6. If the MIB Browser is opened from within the EliteView Platform program, the protocol and address of the
selected device will be used. However, if the MIB Browser is activated directly from the EliteView program
group, the last used tree will be opened.
6-13
SNMP MIB MANAGEMENT
Select MIB Browser from the Tools menu of the
main EliteView program, specify the root for a
new tree in the New MIB Tree dialog box, and
indicate the network protocol used for the
selected device.
If this is not the first time you have used the
SNMP MIB Browser, EliteView will
automatically open the window(s) last used.
- press for new subtree
- collapsible node
- expandable node
- leaf node
SNMP window showing MIB description as it
appears in the MIB database and value for the
highlighted item. Each subwindow may be resized by
dragging on the inner frame with your mouse.
7. Locate the MIB variable you want to browse. Use the scroll bar to move the tree display up or
down, and double-click on any intermediate nodes in the path to the required variable to open the
map for a lower-level hierarchy. After you have found the variable, press the Get Request button to
fetch the required information. The data display options are binary or ASCII. To change the output
mode, use the Output selection under the Options menu.
Note: Object names may be duplicated in different MIB modules. For accurate results, you must select the
correct node.
8. When you select any MIB variable, the textual description (as listed in the database) is automatically displayed
to the right of the tree. Standard entries in the list box include the MIB Name, Object ID, Type, Access, Status,
Range, Size, Description and more depending on the variable selected. The following table describes each
entry.
Table 6-7 MIB Variable Textual Definitions
6-14
Item
Description
Label
Standard name for MIB variable (as appearing in the MIB tree).
MIB Name
Name of the MIB module to which the variable belongs.
MIB BROWSER
Table 6-7 MIB Variable Textual Definitions
Item
Description
Object ID
Dotted-decimal identifier for current variable, indicating its exact location in the database
structure.
Type
Refers to the way the data can be accessed. This item is only meaningful for real variables.
Acceptable values include “Read Only,” “Read/Write,” or “No Access.” Note that a Read-Only
object does not support the “set” operation.
Status
Can be MANDATORY, OPTIONAL or DEPRECATED. In general, a mandatory object must
be implemented, an optional object may be omitted, and a depreciated object may be taken out of
a definition. However, according to grouping conventions as defined in the standards, objects may
be grouped such that all of them are implemented, or omitted altogether. In such case these
objects may have the status of MANDATORY but not be implemented without violating the
rules.
Index
Index to current table entry. The IP address of the target device is commonly used as an index.
Value
The value of the current variable. Value type depends on the specific variable.
Range
Range of the variable in (x, y) format.
Size
Size of the string data in number of bytes.
Description
Text that briefly describes the use of the corresponding variable.
9. When you execute a Get Request (or double-click on an item
in the MIB tree) or Get Bulk Request, the value of the
selected variable(s) is retrieved from the managed device and
displayed beneath the textual description. However, note
that when the Get Next request is executed, the next variable
actually retrieved may be several nodes away, so the
ObjectID and Index entries are also displayed.
Get Bulk
Request
Get Request
Get Next
Request
6-15
SNMP MIB MANAGEMENT
10. The MIB database contains both simple variables and tables.
For example, the ifEntry uses a single integer to identify each
port (i.e., interface) on a network device. When you expand a
table by double-clicking on the associated node, the Input
Index dialog box will open to query for the required table
index. You can change the table index for the current
variable (provided it is a table) using the Index button.
Much of the object data stored
in the MIBs is organized in
multi-level tables that are
accessed via segmented index
pointers. The Input Index
dialog box allows you to
display the complete index
string either as raw data, or to
display individual index
segments one at a time. Raw
data is generally displayed as a
string of integers or ASCII
text, and is not easy to
interpret for table indexes.
Segmented index entries are
displayed according to the exact data type used for each individual segment, and is generally easier to work
with. The example here shows the segmented index values for a database entry that is accessed with a two-level
pointer.
6-16
MIB BROWSER
11. You can modify the value of variables for which you have write access
(as indicated in MIB definition’s Access field). Once you have located the
required variable, click the Set Request button to open the Input Value
dialog box. The object and object type, as defined in the MIB, are listed in
this box. Input the new value, ensuring that you use the correct type (as
indicated in MIB definition’s Type field). Then click OK to write this value
into the managed device, or Cancel to abort the change.
12. If you need to pause/resume or discontinue a data request, click on the
appropriate buttons in the toolbar.
Pause Resume Abort
13. To open the Log Manager select Log from the SNMP menu from the
menu bar. Then have the Log Manager periodically record values for
device variables or set thresholds to trigger events when conditions are
met. To pass a request to the Log Manager, select the MIB variable from
the SNMP tree you want to log by highlighting it with your mouse. Then
select Log from the SNMP menu to open the Log Information dialog box.
Input the required information to provide precise control over logging
operations. Then Click the Ok button and the Log Manager dialog box
will appear.
6-17
SNMP MIB MANAGEMENT
Using the Output Options
The output options dialog box is designed for outputting selected system data
based on information you fetch from the MIB database. You can insert a wide
range of object information into the output window using the data request
functions provided in the MIB Tree. Click on the check boxes to choose the
data that will be output to the output window.
Viewing Output Data
1. Select Output from the Options menu to
open the Output Options dialog box.
Select the output mode as ASCII or
binary, and select the object information
to display. Then press OK to continue or
Cancel to abort the selected output
options.
2. Select the required variables from the
MIB Tree, and then use Get, GetNext, or
Set requests to insert information into
the output window. The outputted data
appears in the bottom right window of
the main MIBBrowser program.
6-18
CHAPTER 7
COLLECTING DATA WITH LOG MANAGER
The Log Manager is a powerful tool for the network manager. By collecting relevant network statistics periodically
from all SNMP-compliant network devices, the Log Manager can:
•
•
•
Record network characteristics (e.g., utilization, error rate)
Set thresholds to generate events when values are out of range
Provide the basis upon which you can predict future network load based on current usage and plan for future
requirements
The Log Manager is designed with a filtering mechanism that logs only the data you indicate. The Log Manager
works with other EliteView applications such as the Event Manager, Log Database Manager, and the MIB
Browser. Thresholds can be set to generate specific events to warn the network manager of certain unique
conditions. All information can be logged in a database and easily retrieved in numeric or graphic form. You can
pause logging at any time for a selected process or for the entire system, if necessary.
Events specified in the Log Manager are passed to the Event Manager. In response to an event, an audible alarm,
on-screen message, or a user-defined application can be executed.
Overview
To view the Log Manager window, select Log Manager from the Utilities menu of the main EliteView
program, or from the EliteView program group. If needed, the Log Manager can be started
automatically along with the EliteView main program. (See “Customizing EliteView,” Appendix B.)
The Log Manager can also be invoked from other management modules, like the MIB Browser.
7-1
COLLECTING DATA WITH LOG MANAGER
The Log Manager dialog box consists of a menu bar, a toolbar, a list of all
user-defined log processes, and a summary of log parameters for the
currently selected process. Note that the same functions are provided in
both the menu bar and toolbar.
The first step in using the Log Manager is to decide which MIB variables
you should log to solve a specific problem or just to maintain a record of
system performance. If you are not sure about the MIB variables, refer to
their description in the MIB Browser or in the relevant RFC documents.
To display the current log parameters for any process, click on the required
process with your mouse. (The þ and || markers to left of each process
entry indicate whether this process is currently active or paused.)
The toolbar provides access to all functions in the Log Manager. The three
key function groups include data display, process editing, and process
management. To delete, edit, activate, or pause a process, first identify the
concerned process by clicking on it with your mouse, and then select the
appropriate function.
For a description of log parameters listed in the main window, refer to
“Field Description for Log Manager/Information Dialog Boxes” in the
following section.
7-2
Add/Delete/Edit
Process
Numeric Data
Display
Activate/
Pause System
Activate/Pause
Process
EDITING A LOG PROCESS
Editing a Log Process
EliteView’s powerful Log Manager gathers a wide variety of network statistics based
upon rules (i.e., log processes) you define. Using the Log Manager, you can monitor any
MIB variable for a target SNMP device. Each log process defines the parameters under
which data related to the specified MIB variable is collected and placed in the central
database. The Log Manager controls the data collection activity, as well as allowing you to
display and manipulate the data gathered as described in the section on “Viewing Log
Data”
Add/Delete/Edit a
Log Process
Adding a New Log Process
1. Click the Add a new record toolbar button.
2. Fill in the parameters in the Log Information dialog box. Process
parameters are defined in the table on the next page.
Not all parameters are required. Only Protocol, Target Address
and Variable are mandatory.
Protocol – Click the down arrow to choose from UDP (default),
IPX or Ethernet.
Target Address – Use appropriate notation for selected
protocol.
Community – Community strings control access rights to
network resources. Define your own community string to prevent
unauthorized access to critical resources. However, if you do not
have any special security concerns, then retain the default
community string of public. Refer to the description for object
editing in Chapter 4 “Defining the Network Configuration.”
MIB Module – Includes standard MIBs based on the RFCs,
device-specific MIBs, and private MIBs. For variable names not
duplicated in other MIB modules, the default of Any is sufficient.
3. Choose OK to add the new log process or Cancel to abort your
selections.
7-3
COLLECTING DATA WITH LOG MANAGER
Field Description for Log Manager/Information Dialog Boxes
Table 7-1 Field Description for Log Manager/Information Dialog Boxes
Parameter
Description
Example
Log Name2
Process identifier displayed in process list.
Protocol
Network transport protocol used to request data, i.e., UDP/IP, IPX or
Ethernet.
UDP
Target Address
Network address of the target device.
192.168.1.50
Community2
Community string used to access the target device.
public
Version
SNMP version in use by Log Manager (SNMPv1 or SNMPv2c)
SNMPV2c
Target Name1
A user-defined name for this device stored in the Name Database.
MIS Server
MIB Module2
Module to search for variable. Select a specific module or Any module.
RFC1213-MIB
MIB Variable
Name of the variable being polled, (as defined in the MIB database).
hubTotalBytes
Index3
Index to entry in a table variable.
1
Filter
Formula used to filter information.
VALUE > 100)
AND(TIME < 120000)
Threshold
When true, this formula will generate an event and pass it to the Event
Manager.
R>100
Event Name
Name of event enabled by Event Manager when threshold condition
is met.
CRITICAL
Polling Interval
Elapsed time between data requests (sec).
30
Start Time
Time to start log process. (YYYYMMDD)
20040520
Stop Time
Time to stop log process. (YYYYMMDD)
20040521
1 - These variables only appear in the Log Manager dialog box.
2 - These variables only appear in the Log Information dialog box.
3 - If you are unsure if an index is required for a variable, first examine the specification for that variable under the MIB Browser.
Modifying a Log Process
To “fine tune” the parameters for any log process, carry out the steps listed below.
1. Highlight the relevant process in the Log Manager screen.
7-4
LOG CONTROLS
2. Open the Log Information dialog box by pressing the Edit button.
3. Enter a new value for any parameter.
Deleting a Log Process
1. Highlight the relevant log process in the Log Manager.
2. Click the Delete record toolbar button.
Log Controls
•
•
System Activate/Pause toggles all logging activities on/off.
Log Activate/Pause toggles logging for a selected process.
Activate/Pause
System
Activate/
Pause Process
Viewing Log Data
Log data is saved in dBASE-compatible files. EliteView offers several ways to view logged data.
To view a log file:
•
•
•
Open Log Manager and double-click on the required process.
Highlight a process with your mouse, and then press the numeric or graphic
data display icon. (Note that the numeric data display icon is just another entry
point for the Log Database Manager.)
Open the Log Database Manager from the Program Manager.
Log
Manager
Numeric Data
Display
The Log Database
Manager opens a
Log
numeric display
Database
for the selected
Manager
Using the Log Database Manager
The Log Database Manager displays data from the different log processes
listed in the Log Manager window. Information in the log database may be
readily copied and shared with other applications. Open the Log Database
Manager as described above. The numeric display posts information for
data matching the filter criteria up to the current polling interval, including
the date, time and specific data for the selected variable. New Arrival shows
the count for filtered data that have not yet been included in the display.
Refer to “Data Logging and Event Management” on page 3-6 for an
illustration of how the Log Manager works.
7-5
COLLECTING DATA WITH LOG MANAGER
File Menu
The file menu provides functions for retrieving log files, copying selected data to a specified file, or moving
specified data to another file.
To copy selected data to another file, use the Copy To. command. This data is saved in standard dBASE format
(with a dbf extension) and may be accessed using a database program for further processing.
To move selected data to another file, using the Move To. command. Moved data disappears from the database
window. This data is saved in standard dBASE format (*.dbf) and may be accessed using a database program for
further processing.
To load a data file, select Load from the File menu, select the required
process from the Load list and press OK.
Note: The Load option is only enabled when the Log Database Manager
is opened from outside the Log Manager (i.e., from the main
EliteView program or from the EliteView group window). When
using the Log Manager, the Log Database Manager will only load
the process selected from the Log Manager dialog box.
Edit Menu
The edit menu provides functions for deleting selected entries, copying data
to the clipboard, and refreshing the display.
To delete entries from the database, select the required items with your mouse, and then choose Delete from the
Edit menu. Note that deleting all entries will not remove the log file.
To copy entries from the log database to the clipboard, select the required items with your mouse, choose Copy or
Delete from the Edit menu, and then choose Paste from the target application.
Data is logged directly into a log file associated with each process. The Log Database Manager only displays the
data stored in this file. The New Arrival line at the bottom of the dialog box indicates the number of events
recorded into the log file since the last time data was retrieved by the Log Database Manager. To update the display,
use the Refresh command.
7-6
DEFINING FILTER FORMULAS
Defining Filter Formulas
Filters may be defined for any log process. A filter sets the conditions that determine if data received by the Log
Manager will be saved into the log database. A filter is defined in the Filter field of the Log Information dialog box
(i.e., the dialog box opened when you create or edit a log process). If no filter is defined, then all the data received
is automatically logged.
Filter Formula
The filter formula uses Backus-Naur Form (BNF) as follows:
Filter::=
SimpleExpression|
ComplexExpression|
<NULL>
-- Nothing
SimpleExpression::=Variable rel_op Value
Variable::= "VALUE"|
rel_op::=
--Value of the data
"DATE"|
--Date the data arrives
"TIME"|
--Time the data arrives
">"|
--Greater than
"<"|
--Less than
">="|
--Greater than or Equal to
"<="|
--Less than or Equal to
"=="|
--Equal
"!="|
--Unequal
Value::=<INTEGER VALUE>|
--Number represented in decimal digits, within the range
of a 4-byte unsigned integer.
<yymmdd>|
--Eight digits representing a date.
<hhmmss>
--Eight digits representing a time, in 24 hour format
ComplexExpression::=
"(" SimpleExpression ")" |
"(" ComplexExpression ")"|
ComplexExpression logic_op ComplexExpression
logic_op::="AND"|"OR"
7-7
COLLECTING DATA WITH LOG MANAGER
Filter Formula syntax
The filter formula can be a simple or complex expression.
Syntax for Simple Expressions
A simple expression conforms to the following syntax:
Variable Relation Value
Variable - Legal variables include:
VALUE
-- Value of the data
DATE
-- Date the data arrives
TIME
-- Time the data arrives
Relation - Legal relations include:
>
-- Greater than
<
-- Less than
-- Greater than or Equal to
-- Less than or Equal to
-- Equal
-- Unequal
>=
<=
==
!=
Value - Legal values include:
<INTEGER VALUE>
<yyyymmdd>
<hhmmss>
-- An unsigned integer, 0 ~ 4 bytes long.
-- Eight digits representing a date, where yyyy stands for the year, mm the month
and dd the day
-- Six digits representing time in 24-hour format, where hh stands for hour, mm
minutes and ss seconds
Syntax for Complex Expressions
A complex expression combines several simple expressions using logical operators. Each expression must be
enclosed in parentheses. The syntax for a complex expression follows:
(Simple Expression) Logical_Operator (Simple Expression)
As described in the previous section a simple expressions should have three basic elements, namely, a Variable,
Relation, and Value. Legal values for each element are described under the syntax for simple expressions.
7-8
DEFINING FILTER FORMULAS
Logical_Operator – Legal values include:
AND
– Both expressions must be true to meet a given condition
OR
– One true expression is enough to meet a given condition
Elements of Filter Formulas
Table 7-2 Elements of Filter Formulas
Parameter
Example
Description
Variable
VALUE
Value of the data
Date when the value is reached
Time when the value is reached
Relation
Value
Logical_Operator
>
Greater than
<
Less than
>=
Greater than or equal to
==
Less than or equal to
!=
Not equal
256
Positive number (4 byte unsigned integer)
200040520
Date format (YYYYMMDD) for 20 March 2004
132201
Time format (HHMMSS) for 01:55:01pm
AND
Both statements must be true
OR
Either statement may be true
Notes: 1. The equal to (==) and unequal (!=) expressions follow C language syntax.
2. If more than one expression is used to define a filter, first enclose each expression in parentheses and
then combine them with AND or OR. Parentheses are used to maintain the order of evaluation.
Otherwise conditions are evaluated from left to right.
3. If you want to test a log process without saving data into the database, set the filter formula to an
impossible condition; for example, (TIME<000000).
7-9
COLLECTING DATA WITH LOG MANAGER
Example: Filter Formulas
Some possible filter formulas include:
•
•
•
•
VALUE > 10000
(VALUE > 100) AND (VALUE < 10000)
(DATE < 19990701) AND (TIME>120000)) OR
((DATE >=20050701) AND (TIME<120000))
In the last formula, data is filtered on (before 1 May 2004 after 12 noon) or (after 1 May 2004 before 12 noon).
A formula follows this basic syntax:
(Variable Relation Value Logical_Operator)
(Variable Relation Value)
Defining Threshold Formulas
Thresholds are used to trigger events (which are defined in the Event Manager). EliteView’s powerful Event
Manager allows you to define an unlimited number of events corresponding to specific actions. See Chapter 8,
“Managing Events” for more information on defining event response procedures.
EliteView’s Log Manager uses thresholds to trigger an event. For example, a critical event can be handled
whenever CRC errors exceed 5 per minute.
To set thresholds triggering certain events:
1. Define an event using the Event Manager, specifying an Event Name and Event Action.
2. Define threshold limits using the Log Manager. Fill in the Threshold field with the appropriate formula. Also
fill in other necessary fields in the Log Information dialog box.
Threshold vs. Filter Formula
A threshold formula is very similar to the filter formula. In a threshold formula, the value of the data or the data
rate can be used. For example, a threshold formula can monitor value fluctuations based on rates per second, per
minute, or per hour.
Accuracy
Data rates greater than one per second are accurate. In computing data rates per second, the Log Manager
calculates an average between each two consecutive data units.
7-10
DEFINING THRESHOLD FORMULAS
Threshold Formula
The threshold formula uses Backus-Naur Form (BNF) as follows:
Threshold::=
SimpleExpression|
ComplexExpression|
<NULL>
-- Nothing
SimpleExpression::=Variable rel_op Value
Variable::=
rel_op::=
"R"|
-- Value of data
"H"|
-- Changes in data per hour
"M"|
-- Changes in data per minute
"S"
-- Changes in data per second
">"|
-- Greater than
"<"|
-- Less than
">="|
-- Greater than or Equal to
"<="|
-- Less than or Equal to
"=="|
-- Equal
"!="|
-- Unequal
Value::=<INTEGER VALUE>| -- Number represented in decimal digits, within the range of a 4-byte unsigned
integer.
ComplexExpression::=
"(" SimpleExpression ")"|
"(" ComplexExpression ")"|
ComplexExpression logic_op ComplexExpression
logic_op::="AND"|"OR"
Threshold Formula Syntax
The threshold formula can be a simple or complex expression.
7-11
COLLECTING DATA WITH LOG MANAGER
Syntax for Simple Expressions
Variable Relation Value
Variable – Legal variables include:
R
-- Value of data
H
-- Changes in data per hour
M
-- Changes in data per minute
S
-- Changes in data per second
Relation – Legal relations include:
>
-- Greater than
<
-- Less than
>=
-- Greater than or Equal to
<=
-- Less than or Equal to
==
-- Equal
!=
-- Unequal
Value – Legal values include:
<INTEGER VALUE> – An unsigned integer, 0 ~ 4 bytes long.
Syntax for Complex Expressions
Refer to the same section under Filter Formulas Syntax.
7-12
DEFINING THRESHOLD FORMULAS
Elements of Threshold Formulas
Table 7-3 Elements of Threshold Formulas
Parameter
Variable
Relation
Value
Logical_Operator
Example
Description
R
Actual value of the data
H
Data rate per hour
M
Data rate per minute
S
Data rate per second
>
Greater than
<
Less than
>=
Greater than or equal to
<=
Less than or equal to
==
Equal
!=
Not equal
256
Positive number (4 byte unsigned integer)
20040529
Date format (YYYYMMDD) for 29 May 2004
135501
Time format (HHMMSS) for 1:55:01pm
AND
Both statements must be true
OR
Either statement may be true
Example: Threshold Formulas
Some possible threshold formulas include:
• R > 1000
• (M > 5) OR (H > 500)
• (S > 100) AND (R < 10000)
In the last formula, an event is triggered if (the data is changing at the rate greater than 100 per second) or (the
value is less than 10,000).
A formula follows this basic syntax:
(Variable Relation Value) Logical_Operator (Variable Relation Value)
7-13
COLLECTING DATA WITH LOG MANAGER
Chart Manager Utility
Raw data can only provide a rough idea of current system status. More detailed analysis is required to
obtain an accurate picture of your network's overall health. The Chart Manager utility allows you to
readily extract information from the database and generate a wide range of charts that provide a clear
picture of network performance.
Basic Functions of Chart Manager
1. The Chart Manager window displays network statistics from a database of log information.
2. The Chart Manager can find information such as the maximum data flow of the network.
3. This information can be used for network management, resource allocation and to improve network efficiency.
Menu Description
The menus provided for the Chart Manager are briefly introduced below.
Menu Definitions
Table 7-4 Chart Manager Menu Definitions
Menu
7-14
Label
Description
File
File Access – Provides options to open a new log
file. Exit closes the Chart Manager.
Summary
Summary – Summarizes raw data based on a
selected starting date, ending date, and fixed
interval
Graph
Display Function –Displays log data based on
various 2-dimensional and 3- dimensional display
options, and color selections.
Window
Manage Displays –Switches the display between
raw data and summary data.
CHART MANAGER UTILITY
Table 7-4 Chart Manager Menu Definitions
Menu
Label
Description
Help
Help Facility – Access detailed help information
about the Chart Manager.
* Window - indicates the windows for which this menu is active.
Creating Log Charts
Open the Chart Manager utility either from the Utility menu in the main EliteView program or from the Program
Manager. Click on Open under the File menu and select a dBase file (*.dbf) that was generated by the Log Manager.
Names for log files are based on the time the log file was generated, using a format of hhmmss (hh:hour,
mm:minutes, ss:seconds). Information displayed in the log chart includes the following items:
Table 7-5 Log Chart Information
Parameter
Example
Description
Date
20050322
Date this event was recorded. Format for date is
yyyymmdd (yyyy:year, mm:month,dd:day).
Time
165506
Time this event was recorded. Format for time is
hhmmss (hh:hour, mm:minute, ss:second).
Difference
1086
Difference in value for consecutive events.
Interval
5
Time between consecutive events.
Rate
217
Rate of change in recorded value per second
Editing Data
The significant parameter displayed under the data summary chart and graphic display is the rate of change for the
recorded value. If there are inconsistencies or extreme values for the rate that adversely affect your data summary
or log charts, you can easily adjust these values. Using the edit cursor, double-click on any cell under the Rate
column and change the recorded value. Remember that you can only change values for rate.
7-15
COLLECTING DATA WITH LOG MANAGER
Summarizing Data
The amount of data recorded for a process can quickly get out of hand.
However you can easily convert large data files into more manageable form
using the Summary function. Open the Range Selection dialog box by
clicking on Summary in the menu bar. Specify the required range using the
arrow buttons, and then set the data display interval in the edit box to any
integer value. The log charts shown below illustrate the difference between
a chart for raw data and one for summarized data.
7-16
CHART MANAGER UTILITY
Displaying Graphic Charts
Graphic displays are generally more informative than a simple numeric listing. The Chart utility makes it easy for
the user to display either raw or summarized data in various graphic formats. To draw a graph of a specific range,
select the data to be displayed by positioning the cursor over the first entry you want to display, then holding down
the left mouse button, drag the cursor to the last process in the required range. The selected block will be
highlighted. To view the graph of the highlighted range click Graph on the menu bar. The default graph is a bar
chart as shown in the figure below.
7-17
COLLECTING DATA WITH LOG MANAGER
Graph Controls
The Graph Control window gives the user options to change the way
data is displayed in the graph. The user has control over all aspects of
the graphs. Graphs can be displayed in 2D or 3D. The user can change
and add color, style, labels and many more features to the graph. A full
list of these features is detailed in Table 7-6 below.
To open the Graph Control window:
1. Open a graphic chart display. To learn how to display a graphic chart
see “Displaying Graphic Charts” on page 7-17.
2. Click on an icon from the toolbar above the graph. Each icon opens
a different tab on the Graph Control window.
The Graphic Control window will then open. The illustration, right,
shows the 2D tab of the Graphic Control window. To edit different
features click on the respective tab at the top of the Graph Control
window.
Table 7-6 Chart Manager - Graph Control
7-18
Tab Title
Description
2D Gallery
Select the type of 2D graph that will be used to display the data selected in the Chart Manager.
To select a graph type click on the raised box icon that displayed the desired graph (the chosen
option will then be highlighted). Then click the ‘Apply Now’ button to view the selected graph.
The user can change graph types using the same process.
3D Gallery
Select the type of 3D graph that will be used to display the data selected in the Chart Manager.
The same method is used to select 3D graphs and 2D graphs.
Style
Different graphs have different style layout options. The user can choose to have horizontal or
vertical bars in a bar chart graph or have sticks and lines on a 3D scatter graph.
Data
Edit the value of the data in the graph by clicking the ‘Data Values’ button and entering the value
for each column into its respective position in the ‘Data Values’ table. Click the ‘Apply’ button
to confirm the changes.
The intervals along the X and Z axis can also be edited by clicking on the ‘X Position’ button or
‘Z Position’ respectively. then entering in the value of each interval into the ‘X’ or ‘Z’ ‘Position’
table. the Z position can only be edited in 3D graphs.
By selecting ‘Range From’ and ‘Range To’ values graphs can be used to display a specified range
of data from the chart manager.
CHART MANAGER UTILITY
Table 7-6 Chart Manager - Graph Control
Tab Title
Description
Titles
Edit the names and layout of the titles that are used in the graph By typing the name into the
text field available for each title. Each graph may have a graph title, bottom title, left title and
right title. The left and right titles can be set to be read horizontally or vertically up or vertically
down by clicking the respective radio button.
Axis
Set the starting point and end point of each axis to zero, variable or user defined. Zero is the
default setting for all axes.
Select the axis by clicking on the radio button in the ‘Apply to Axis’ group. To set the range
select the ‘User-Defined’ option in the scale group. The range for the axis is set by setting values
for ‘Max’ ‘Min’ in the ‘Range’ group. Set the number for marked intervals along the axis by
setting the ‘Ticks’ value.
3D
3D is only enabled when using a 3D graph. Set the view of the graph to ‘Perspective’ or
‘Isometric’. Isometric used parallel projection to view the graph and perspective uses perspective
projection, i.e. it is projected outward from a center of projection. The angle of view can be
changed by increasing and decreasing the ‘In’ and ‘Out’, ‘Up’ and ‘Down’ and ‘Left’ and ‘Right’
change bars around the graph preview in the ‘Graph Control’ window. ‘In’ and ‘Out’ is disabled
in isometric view.
Turn ‘True3D’ off by selecting the ‘Off’ radio button. This gives a static 3D view of the graph.
Fonts
Set the font for the labels in the graph by selecting an option from the drop-down menu. Select
the style by clicking on the check-boxes ‘Italic’, ‘Bold’ and/or ‘Underline’.
The size can be changed using the ‘Smaller’ ‘Bigger’ change bar. When the ‘Smart Scale’ check
box is checked the size will be made to fit best into the graph.
Markers
Change the pattern and color of each bar in the graph. First Click on the bar in the graph preview
in the ‘Graph Control’ window that you want to edit. The ‘Point’ value will change to the
number of the bar clicked. To change color or pattern select from the ‘Color’ and ‘Pattern’
drop-down menu. When the color of one bar is changed the rest of the bars turn black until they
are all assigned new colors. The pattern will take on the same color as the currently selected bar.
For graphs displaying a set of data the ‘Symbols’ group will be enabled. The symbol used in the
graph can be changed using the drop-down menu.
Trends
Draw statistical lines by clicking on the check-boxes of the desired statistical line. Select a color
for each line from the drop-down menu opposite the check-box.
The ‘Curve Fit’ option can be changed to different types from the ‘Type’ drop-down menu. The
granularity sets the curvature of the line. High granularity means more points were used to plot
the line. Low granularity used less points to plot the line.
Line limits can be set and labeled for both high and low lines.The fill and color for the area
between these limes can also be set using the drop-down menus and clicking the ‘Fill Opposite’
check-box. If this box is unchecked then it will fill the area outside the high and low limit.
7-19
COLLECTING DATA WITH LOG MANAGER
Table 7-6 Chart Manager - Graph Control
7-20
Tab Title
Description
Overlay
Draw an overlay onto the graph by selecting the axis on which to draw the overlay. Selecting
‘Shared Axis’ means that the values in the ‘Overlay Data’ table will be plotted according to the
values on the left vertical axis (y-axis). If the ‘Second Axis’ is used then the overlay will be plotted
along a right vertical axis ranging in value from the lowest to the highest value in the ‘Overlay
Data’ table. To enter values into the ‘Overlay Data’ table click the ‘Data Values’ button. The
values entered in the table determine how the overlay is graphed. There is a column in the table
for each bar in the graph. Each value entered in a column represents the y-axis value for the
overlay point on that bar.
Draw any combination of statistical lines by selecting the adjacent check-box in the ‘Statistical
Lines’ group.
Select the style, color and symbols used to plot the line by selecting an options from the
drop-down menu in the style group. The pattern and line thickness can also be set from the
drop-down menus.
Symbols, connected lines and or sticks can be used to plot the overlay by clicking the respective
check-boxes. ‘Symbols’ appear at each point of the overlay. ‘Lines’ join each point in the overlay
and ‘Sticks’ are vertical lines that join the overlay point and the x-axis.
Error Bar
Add error bars to the graph by selecting the axis and the error source using the radio buttons.
Select the ‘User Defined’ radio button and set specific values for the plus data and minus data
by clicking the ‘Plus’ and ‘Minus Data’ buttons and enter the values in the table.
Background
Set the background of the title labels, legend and graph by selecting a style, text color and
background color. Click the radio button of the item and click on the style to be applied. Select
the background color and text color from the drop-down menus.
Select the color for the whole graph window from the ‘Background Color’ drop-down menu in
the ‘Graph Window’ group.
Legend
Click the ‘Text’ button to set the values for the legend. Enter the values for each column into
the ‘Legend Text’ table.
Use the size change bars to select the size of the legend.
Use the ‘Position’ radio buttons to position the legend. Each button represents a position
around the graph.
Labels
Select an axis using the radio buttons. Change the orientation type and format for the selected
axis using the ‘Vertical’ check-box and the drop-down menus.
Set the intervals along the axis by increasing or decreasing the ‘Every’ value in the text box. Enter
values manually or use the up and down buttons.
If the selected format is ‘Date and Time’ then set the values for the start dare and the increments
for each in the ‘Increment’ text-box below.
Data labels can be placed above each column by clicking the ‘On’ check-box. The color for these
values can be set to the group color or assigned a uniform color by selecting the appropriate
radio button and selecting a color from the ‘Uniform Color’ drop-down menu.
CHART MANAGER UTILITY
Table 7-6 Chart Manager - Graph Control
Tab Title
Description
System
To print the displayed graph select the ‘Mono’ or ‘Color’ radio button and select the layout by
selecting ‘Border’, ‘Landscape’ and or ‘Full page’ check boxes. Click the ‘Apply Now’ button and
then the ‘Print’ button.
Export the graph to file as an image by selecting a image type from the ‘Format’ group, select
to save the file in the clipboard or a specified file by selecting the respective radio button in the
‘Target’ group. If ‘File’ is selected then click browser, select a directory and file name, then click
save. Click the ‘Copy’ button to copy the graph to the file.
Select a format or the image type from the ‘Format’ dropdown menu. Enter a name attribute
for the client side image map in the ‘Tag’ text field.
Click on the ‘Ref Strings’ button to open the ‘Map Reference String’ table. Enter a URL for each
column in the table for use in the image map.
Enter the name of the path, filename and extention to save the map file into the ‘File’ text field.
Click the ‘Browse’ button to select a directory using the windows dialog box. If no directory is
selected it will be saved to the current directory.
The image map is stored in the HTML document that references it.
About
View information about ‘Graph Control’
7-21
COLLECTING DATA WITH LOG MANAGER
7-22
CHAPTER 8
MANAGING EVENTS
Understanding the Event Manager
Events are special conditions which occur during normal operation of network devices, and normally require the
network manager’s attention. Events are generated by the main EliteView program, the Log Manager, and the Trap
Manager.
In response to messages from the main EliteView program, the Trap
Manager or Log Manager, the Event Manager can dispatch actions in any of
five different ways.
• Sound audible signal
• Display on-screen message box
• Log event into an on-screen report window
• Run any user-specified program, e.g., BEEPER, FAX, EMAIL, etc.
• Log events into a database for later analysis
Unlike simplistic network monitoring, EliteView’s Event Manager can accept
input and process the event according to pre-defined rules.
Starting the Event Manager
The Event Manager automatically starts when the main EliteView program is invoked, and when any
system or user-defined event occurs. If the Event Manager is closed or hidden, simply select Event
Manager from the Utilities menu of main EliteView program or click on the Event Manager icon in the
EliteView program group to bring it up.
•
•
•
Record network characteristics (e.g., utilization, error rate)
Set thresholds to generate events when values are out of range
Provide the basis upon which you can predict future network load based on current usage and plan for future
requirements
8-1
MANAGING EVENTS
Defining Events
The Event Manager supports system and user events, as indicated in the Type field for the selected event.
Pre-Defined “System” Events
Pre-defined system events include the following:
• Connection Lost – a device fails to respond after the specified number of retires.
• Device Up – a device which has previously been “down” is now responding.
• TFTP – a device is currently performing file transfer or download.
• Trap – a device has issued a trap message and it has been received by the Trap Manager.
The Trap Manager translates the trap message into a readable text string.
Defining “User” Events
In addition to the pre-defined system events, the Event Manager supports user-definable events.
To add an event to the Event Manager:
1. From the EliteView main program window, choose Event Manager from the Utilities
menu.
2. Click on the Add button.
3. In the Add Event dialog box, enter a descriptive name of the event.
4. Click on the OK button to accept the new event or click on Cancel to abort this action.
Defining Event Actions
In response to any system or user events, the Event Manager can be used to
take specific actions. The five basic actions are:
•
•
•
•
•
Sound audible signal
Display on-screen message box
Log event into an on-screen report window
Run any user-specified program, e.g., BEEPER, FAX, EMAIL.
Log event into a database for later analysis
Press this button to view the event database
8-2
DEFINING EVENT ACTIONS
To define an action:
1. Click on the event name
2. Enter annotation in the Note field (optional)
3. Click on one or more Actions (Beep, Show, Run, Send, Write)
Table 8-1 Event Actions
Action
Description
Beep
Sound an audible signal on the network management station (i.e.,
your local PC).
Show message
box
Display a user-defined message in a text box on the NMS’s screen.
The message box appears on top of all the other windows. When
the message appears, just click on the OK button to dismiss the
message.
Example
CRITICAL: Switch
overheating
This action is recommended for critical events.
Run program
Execute any Windows-based application. This is ideal for sending
a message to a pager, email or FAX.
PAGER 408-555-4742
Send message to
REPORT
Pass a message to the EliteView REPORT module. Report
messages are time stamped and shown in chronological order. In
addition, Report messages are shown in context with one another.
WARNING: Server disk >
90% full
This action is recommended for routine events.
Write into
database
Put a message into the event database
Excessive CRC errors on
device
Example: Displaying a text file
When an important event occurs, you may display instructions for others to follow. For example, a text file named
URGENT.TXT might include information on how to contact key personnel who can fix the problem (telephone
number, pager number, etc.).
To display information with Windows Notepad:
1. Open the Event Manager.
2. Choose an event.
3. Click on the Run Program action and type
NOTEPAD [PATH]URGENT.TXT
4. Use the Windows Notepad program to create the file URGENT.TXT in the indicated directory.
When the specified event occurs, the text file URGENT.TXT will be automatically displayed using Notepad.
8-3
MANAGING EVENTS
The Event Manager supports special text messages using the $$ and ## symbols in the text boxes.
•
$$ is substituted with text provided by the source of the event. For example, Trap Manager will pass a text string
translated from the trap message provided by the device. If no trap messages are available, then $$ will be null.
• ## is substituted with the network address of the device.
Example: Logging detailed messages
To log a detailed message in the database (or message box or report window), use the special text substitutions
(i.e., $$ or ##).
To make an entry in the database like
"192.75.255.32 TEMPERATURE EXCEEDS 85 DEGREES",
1. Choose an event name.
2. Check the box for Write into database.
3. In the adjacent text box, enter – ## $$
Event Data
Event data is stored in a dBASE-compatible file (EVENT_DT.DBF).
To view event data from the Event Manager:
1. Double-click on an event name, or click on the View Data button.
2. The Event Data window will show a listing of events.
8-4
DEFINING EVENT ACTIONS
Table 8-2 Event Data
Parameters
Description
Example
Date
Date when the event occurred
05/16/2004
Time
Time when the event occurred
13:33:48 (1:33 pm)
Device
IP network address of the device
192.9.211.52
.
Description
Text from “Write into database”
Dropped server
connection
3. Click the Close button to close the Event Data window.
To erase some or all event information:
1. From the Event Data window, select the target event line. To delete all event information, click the Select All
button. The selected entries are highlighted.
2. Click on the Delete button to delete highlighted events.
To print information from the event database:
1. From the Event Database window, click on the Print button.
2. Select the required events.
3. To set the print pointer at the beginning of the database, mark the radio button for From Beginning. To set the
pointer at the location where the last print operation terminated, mark the radio button for From Last Printed
Data.
4. Edit the From and To times if required.
5. Use the Print Setup button to verify your printer settings.
6. Press the Print button and then press Close.
Note: Event logs may be viewed by any application that can import a dBASE (.DBF) file, such as FoxPro.
8-5
MANAGING EVENTS
Receiving SNMP Traps with the Trap Manager
Trap is a protocol mechanism defined in SNMP by which managed devices report unique events to the network
management station. Devices can be set up to report specified conditions to EliteView using Trap messages.
Limitations of Trap Messages
Trap messages are designed to report information that requires immediate attention. However, the value of Traps
is limited in SNMP because there is no guarantee these messages will be delivered. Trap messages may be lost en
route or ignored by the network manager.
Trap Types
There are two types of traps defined in the SNMP standard.
•
•
Generic trap is supported by all SNMP-compliant devices. The most common events include cold start, warm
start, link down, link up, SNMP authentication failure, and EGP neighbor loss. (EGP is the Exterior Gateway
Protocol used to exchange routing information.) Generic traps, numbered 0 to 5 in the “generic trap” field of
the trap message, are defined in TRAP.INI.
Specific trap is supported according to the characteristics of the device. Specific traps are numbered 6 in the
“generic trap” field. A “specific trap” field identifies the trap type.
Trap Manager
EliteView’s Trap Manager collects trap messages and converts them into events. The Trap Manager generates a
“trap” event and outputs a text message according to the pattern specified in TRAP.INI. These events are then
handled by the Event Manager.
If the TRAP.INI file is changed, re-boot the Trap Manager by closing it and then starting it again.
The Trap Manager has no tangible user interface. When the main EliteView program is started, if the Trap
Manager is not loaded automatically (as defined in NETMGR.INI), then you can load it from the Utilities menu,
or from the Window’s Program Manager (by clicking on the Trap Manager icon in the EliteView program group).
When EliteView terminates, the Trap Manager is also closed.
8-6
POSTING MESSAGES TO THE REPORT W INDOW
Posting Messages to the Report Window
Both predefined and user-defined system activity may be specified in the Event Manager to be posted
to EliteView’s Report window. If any event criteria have been met, then this window will display a
chronological list of pertinent messages stamped by time and date.
To view the Report window, select Report from the Utilities menu of the main EliteView program, or click on the
Report icon in the EliteView program group.
The Report window shows user-definable messages in chronological order. Entries placed in the Report window
by the Event Manager include connection lost, device up, tftp, and trap messages.
Table 8-3 Report Window Menu Definitions
Menu
Function
File
Open – Opens any previously saved Report file.
Save – Saves the current Report file.
Save As – Save the current Report file under a new name.
Print – Prints the current file.
Exit – Closes the Report window.
Edit
Copy – Copies the selected data into the Windows clipboard.
Clear – Deletes all information from the Report window.
Search
Find – Searches for the specified data.
Find Next – Searches the next occurrence of the specified data.
Find Previous – Searches the previous occurrence of the specified data.
.
To copy from Report window to another Windows application:
1.
2.
3.
4.
Drag the mouse over the target text.
From the Edit menu, choose Copy.
Switch to another Windows application.
From the target application’s main menu, choose Paste from the Edit menu. The highlighted text from
EliteView Report will now appear in the target application.
8-7
MANAGING EVENTS
To load a data file, select Load from the File menu, select the required
process from the Load list and press OK.
Note: The Load option is only enabled when the Log Database Manager
is opened from outside the Log Manager (i.e., from the main
EliteView program or from the EliteView group window). When
using the Log Manager, the Log Database Manager will only load
the process selected from the Log Manager dialog box.
Edit Menu
The edit menu provides functions for deleting selected entries, copying data
to the clipboard, and refreshing the display.
To delete entries from the database, select the required items with your mouse, and then choose Delete from the
Edit menu. Note that deleting all entries will not remove the log file.
To copy entries from the log database to the clipboard, select the required items with your mouse, choose Copy or
Delete from the Edit menu, and then choose Paste from the target application.
8-8
CHAPTER 9
USING RMON
Introduction
This chapter describes how to use Remote Monitoring (RMON) to more effectively monitor your network.
RMON provides a cost-effective way to monitor large networks by placing embedded or external probes on
distributed network equipment (i.e., hubs, switches or routers). EliteView can access the probes embedded in
recent SMC network products to perform traffic analysis, troubleshoot network problems, evaluate historical
trends, or implement proactive management policies. RMON has already become a valuable tool for network
managers faced with a quickly changing network landscape that contains dozens or hundreds of separate segments.
RMON is the only way to retain control of the network and analyze applications running at multi-megabit speeds.
It provides the tools you need to implement either reactive or proactive policies that can keep your network
running based on real-time access to key statistical information.
RMON can be used to perform a wide range of management tasks, including:
•
•
•
Troubleshoot problems
Track down intermittent problems
Locate bottlenecks
•
Plan for network expansion
A Brief Description of RMON
Remote Monitoring allows you to instruct a remote device to collect information or respond to specified events on
an independent basis. An RMON-capable device can independently perform a wide range of tasks, significantly
reducing network management traffic. It can continuously run diagnostics and log network performance. If an
event is triggered, the remote device can automatically notify the network administrator of a failure and provide
historical information about the event. If the remote device cannot connect to the management agent, it will
continue to perform any specified tasks and pass data back to the management station the next time it contacts the
remote device.
9-1
USING RMON
RMON is designed to limit the amount of traffic required by management applications. It consists of an
independent agent that resides on the managed device, and is charged with monitoring and collecting information
about network traffic or the status of the host device. The agent gradually builds up information about the
attached segment or VLAN, storing this information in the relevant RMON database group. The client (or
management agent) then periodically communicates with the various RMON probes using SNMP protocol. It can
then present a numeric or graphic summary of the data collected from a large number of probes. However, if the
probe encounters a critical event (as defined by the management agent), it can automatically send a trap to the
management agent which will then respond to the event as determined by the Event Manager (see Chapter 8).
Starting the RMON Manager
To use the RMON Manager, open any network map and select the RMON program from the menu
bar. You can also run the RMON Manager directly from the Start Menu by selecting the RMON
Manager icon directly from the EliteView program group.
When you start the RMON Manager, a Probe Information window will pop up requesting target information. You
must provide the following information:
1. Enter the Target Address of the device.
2. Define a Community name describing the administrative relationship (i.e., access rights) between SNMP
entities.
Table 9-1 RMON Manager Probe Window
Field
Description
IP Address
The IP Address of the RMON probe
Community
The SNMP community in use by the
RMON Manager
Version
Displays the SNMP Version
If you open the main application for the RMON Manager, the screen will
display a detailed description of the managed device as shown in the
following example for a TigerSwitch SMC6724L3 1.
9-2
INTRODUCTION
Table 9-2 RMON Manger Main Screen
Field
Description
Probe IP Address
The IP Address of the RMON Probe.
Description
Description of the device including manufacturer and model name.
Object Identifier
The object identifier used to identify this device in the MIB tree.
On Since
The time at which the device was turned on.
Contact
The person responsible for managing this device.
Name
Name used for this device; such as a hierarchical network name.
Location
Physical location of the device.
Services
Network services provided by the device, as specified in the
seven-layer network protocol of the Open Systems Interconnection.
Number of
interfaces
Number of ports interfaced by the device.
9-3
USING RMON
RMON Utilities
The RMON Manager currently provides access to all nine RMON groups, as shown in the following table. Most
of SMC’s intelligent products provide support for mini-RMON (which include Statistics, History, Alarms and
Events). This selection covers key information required to manage your network on a regular basis, and also
switches, and especially on all backbone switches. An external RMON probe that supports all nine RMON groups
can then be used for extended troubleshooting when needed.
Table 9-3 RMON Groups
9-4
Group
Description
Statistics
Shows bandwidth utilization, counters for network traffic, errors and collisions, as well as packet size
distribution.
History
Periodically samples and saves information from the statistics group.
Hosts
Maintains statistics on each host attached to the network device monitored by the probe.
Host Top N
Displays a specified subset of statistics for a selected number of top users.
Matrix
Maintains statistics on traffic passing between node pairs.
Alarms
Sets thresholds for RMON variables, which can subsequently trigger response events.
Events
Defines the action to take when an alarm is triggered, including logging the alarm, generating a trap
message, or triggering a capture channel.
Filters
Filters a stream of packets that match the specified criteria.
Capture
Configures the buffers used to store packets generated from the Filter group.
RMON UTILITIES
Statistics Group
The Statistics Group includes all the tools you need to monitor your network for common errors and
overall traffic rates. When you open the Statistics Group the Control Table screen is displayed as
shown below. This table allows you to add, edit and delete items to be monitored, or to select a specific
index entry and then view the statistical data in numeric or graphic form.
Table 9-4 Statistics Group Control Table
Field
Description
Total
The total number of index entries contained in the Control Table.
Read Status
The read status of information in the Statistics Control Table.
Index
Index for the table row; creator can assign a value of 1-65,535.
Owner
Name of the person who created this entry in the Control Table.
Interface
The port number of the interface on the device.
View
Opens a graphical display of statistics for the selected index entry.
Add
Opens a dialog box for creating a new entry in the Control Table.
Edit
Opens a dialog box for editing a selected entry in the Control Table.
Delete
Deletes the selected entry from the Control Table.
9-5
USING RMON
Adding or Editing an Entry in the Control Table
Click on the Add (Edit) button in the Statistics Control Table to add (edit)
an index entry. The dialog box that opens includes three fields (1) entry
index number, (2) system interface number, and (3) owner of this entry. The
system automatically generates an index number, but you can enter any
number from 1 to 65,535 that is not currently in use. Each interface
number equates to a physical media on the device being monitored. This
information can be found under MIB2 as shown to the right. (See “MIB
Browser” on page 6-11.)
The interfaces to the SMC6724L3 1 switch are listed in the tables below.
SMC6724L3 1 Interface Description
Table 9-5 SMC6724L3 1 Interface Description
Interface
Description
1-24
Ports 1-24 (10-100 Mbps port)
39
Port 39 (Console port)
1001
Interface for VLAN 1
Viewing Statistics
The RMON Manager collects statistics that allow you to quickly determine how the network is performing.
Information is provided on bandwidth utilization, packet types, errors and collisions, as well as the distribution of
packet sizes. Information is also included on peak utilization. Statistics are displayed in both a numeric and
graphical format that can be easily interpreted. To display statistics for a specific entry, click on the View button in
the Control Table. The various statistic screens are shown below. The scale for the graphic displays are
automatically adjusted to present the best view possible. (However, note that the smallest increment on the vertical
axis is limited to 0.05.). If necessary, you can reduce the polling interval to focus in a specific problem area, or
increase it to reduce the overall management traffic running on the network.
9-6
RMON UTILITIES
9-7
USING RMON
Statistics are provided for the following areas.
Table 9-6 Statistics Areas
Field
Description
Utilization
Displays the percentage of bandwidth utilized over the sample period. It also shows the total count,
the rate, and the rate of change (delta) for packets and bytes seen on the interface.
Packets
Displays the total count, the rate, and the rate of change (delta) for all packets, broadcasts, multicasts,
and dropped packets.
Errors and
Collisions
Displays the total count, the rate, and the rate of change for CRC/alignment errors, undersize packets,
oversize packets, fragments, jabbers, and collisions.
Packet Size
Displays the distribution of packet sizes, including the total count, the rate, and the rate of change for
each packet size.
The statistics for each area are further described in the following table.
9-8
RMON UTILITIES
Table 9-7 Statistics Parameter Descriptions
Parameters
Description
Utilization
Util%
(Now,Max, Min)
This table displays the current bandwidth utilization, plus the maximum and minimum utilization
since the statistics window was opened.
Packets/Bytes
This table displays packets and bytes.
Packets
Packets
Packets (including bad, broadcast and multicast packets).
Broadcasts
Broadcast packets.
Multicasts
Multicast packets.
Drops
The number of events detected when packets were dropped (due to a lack of resources condition in
the probe.
Errors and Collisions
CRC/Alignment
Packets with a CRC or alignment error.
Undersizes
Undersize packets.
Oversizes
Oversize packets.
Fragments
Packet fragments.
Jabbers
Jabber errors.
Collisions
Packet collisions.
Packet Size Distribution
Size
Packet sizes are divided into six groups, 64 byte packets, 65 to 127, 128 to 255, 256 to 511, 512 to
1023, and 1024 to 1518 bytes. Each size group is indicated as color bar for each polling time.
Note: Value – Total since the Control Table was created.
Delta – The difference in the count since the last poll.
Rate – The rate per second over the last polling interval.
Each of these windows includes a Menu bar and Tool bar with the following items:
9-9
USING RMON
Table 9-8 Statistics Menu and Tool Bar
Field
Description
File
Exit
Polling
Polling Time (5 - 3600 seconds), Pause, Resume.
View
All, Utilization, Packets, Errors and Collisions, or Packet Size Distribution
Control!
Control Table
Help
On-line help
They also include a status bar at the bottom of the window that includes the following items:
Table 9-9 Statistics Status Bar
Field
Description
Control Index
The index for the entry defined in the Statistics Control Table.
Interface
The media interface of the device being monitored.
Polling Time
The interval between polling samples.
Speed
The speed of the media interface being monitored.
Owner
The person who created this entry.
History Group
The History Group can be used to create a record of network utilization, packet types, errors and
collisions. You need a historical record of activity to be able to track down intermittent problems.
Historical data can also be used to establish normal baseline activity, which may reveal problems
associated with high traffic levels, broadcast storms, or other unusual events. Historical information
can also be used to predict network growth and plan for expansion before your network becomes too overloaded.
The History Group includes all the tools you need to monitor your network for common errors and overall traffic
rates. When you open the History Group the Control Table screen is displayed as shown below. This table allows
you to add, edit and delete collection entries, or to select a specific index entry and then view the historical data in
numeric or graphic form.
9-10
RMON UTILITIES
Table 9-10 History Control Table
Field
Description
Total
The number of index entries contained in the Control Table.
Read Status
The read status of information in the Statistics Control Table.
Index
The index for the table row (automatically assigned).
Owner
The name of the person who created this entry in the Control Table.
Interface
The selected interface on this device (as defined in MIB2).
(Buckets) Requested
The number of samples to record. (Default: 50)
(Buckets) Granted
The number of samples allowed by the system.
(Sample) Interval
The interval between taking samples. (Default: 1800 seconds)
Status
The current status of this entry in the Control Table.
9-11
USING RMON
Adding or Editing an Entry in the Control Table
Click on the Add (Edit) button in the History Control Table to add (edit) an index entry as shown on the preceding
page. Each interface equates to a physical media on the device being monitored. This information can be found
under MIB2 (see 6-5). The number of buckets indicates the number of samples to record. You should always be
able to record the default of 50 buckets without overflowing the agent’s memory. However, if more than 50
buckets are requested, the number actually granted will depend on the amount of memory currently available.
Once all the buckets are filled, older data will be discarded. You also need to specify the interval at which to take
samples. For example, using a 30 second interval with 120 buckets will provide one hour of historical samples.
Viewing History
The RMON Manager collects historical information on bandwidth utilization, packet types, errors and collisions,
as well as the distribution of packet sizes for each entry you define. Each sample shows the interval’s start time.
The information collected during the interval is displayed in both numeric and graphical format for easy
interpretation.
To display the history for a specific entry, highlight that entry in the Control Table and click on the View button.
The various history screens are shown below. The scale for the graphic displays are automatically adjusted to
present the best view possible. If necessary, you can reduce the polling interval to focus in a specific problem, or
increase it to reduce overall management traffic running on the network.
9-12
RMON UTILITIES
Alarm and Event Groups
The Alarm and Event Groups allow you to record important events or immediately respond to
critical network problems. The Alarm and Event Control Tables (shown below) are used
together to define specific criteria that will generate response events. (Note that you must use
the scroll bar to display all the columns in the tables.) These tables allow you to add, edit and delete items, or to
select a specific index entry and then view the corresponding response event (from the Alarm Table) or triggered
events (from the Event table).
Adding or Editing an Entry in the Control Table
Alarm Control Table – Alarms can be set to test data over any specified time interval, and can monitor absolute
or changing values (such as a statistical counter reaching a specific value, or a statistic changing by a certain amount
over the set interval). Alarms can be set to respond to either rising or falling thresholds. (However, note that after
an alarm is triggered it will not be triggered again until the statistical value crosses the opposite bounding threshold
as described in the following table.) Click on the Add (Edit) button in the Alarm Control Table to add (edit) an
index entry. The dialog box that opens is described in the following table.
Table 9-11 Alarm Control Table
Field
Description
Index
The system automatically generates an index number.
Owner
The name of the person who configured the entry in the Control Table.
Interval
The time interval in seconds over which data is sampled and compared with the rising or falling
threshold.
9-13
USING RMON
Table 9-11 Alarm Control Table
Field
Description
Variable
The object identifier of the MIB variable to be sampled. Only variables that resolve to an integer value
may be sampled.
Sample Type
The method of sampling data, either Absolute or Delta. For an absolute sample the variable will be
compared directly to the thresholds. For a delta sample the last sample is subtracted from the current
value and the difference is then compared to the thresholds.
Startup Alarm
How the alarm is activated when the variable is compared to the thresholds. This can be set to Rising,
Falling, or Rising or Falling.
Rising Threshold
An alarm threshold for the sampled variable. If the current value is greater than or equal to the
threshold, and the last sample value was less than the threshold, then an alarm will be generated. (After
a rising event has been generated, another such event will not be generated until the sampled value
has fallen below the Rising Threshold and reaches the Falling Threshold.)
Falling Threshold
An alarm threshold for the sampled variable. If the current value is less than or equal to the threshold,
and the last sample value was greater than the threshold, then an alarm will be generated. (After a
falling event has been generated, another such event will not be generated until the sampled value has
risen above the Falling Threshold and reaches the Rising Threshold.)
Rising Event
The index of the Event that will be used if a rising alarm is triggered. If there is no corresponding entry
in the Event Control Table, or if this number is zero, then no event will be generated.
Falling Event
The index of the Event that will be used if a falling alarm is triggered. If there is no corresponding
entry in the Event Control Table, or if this number is zero, then no event will be generated.
Status
The current status of the entry in the Control Table: Valid, Under Creation or Invalid.
Event Control Table – If the response corresponding to the alarm has not yet been defined, click on the Event
button to open the Event Control table. Click on the Add (Edit) button in the Event Control Table to add (edit) an
index entry. The dialog box that opens is described in the following table.
To copy entries from the log database to the clipboard, select the required items with your mouse, choose Copy or
Delete from the Edit menu, and then choose Paste from the target application.
9-14
RMON UTILITIES
Table 9-12 Event Control Table Index Entries
Field
Description
Index
A number that identifies the row in the table.
Description
A text comment that describes the entry in the Control Table.
Type
The type of action that is taken for the alarm. This can be None, Log, Trap, or Log and Trap.
Community
The SNMP community name that a trap manager must use to receive trap messages.
Displaying Events in the RMON Manager – The Event determines the action to take when an alarm is
triggered. The response to an alarm can include logging the alarm or sending a message to a trap manager. To
display each time an event was triggered by an alarm, first highlight an entry in the upper half of the Event Control
Table, and then click on the Log button. The Log Table at the bottom half of the Event Control Table window will
display each time this event was triggered. It shows the log index number, the time of an event, and the description
of the event that activated this entry. (Note that there are no display windows associated with the Alarm and Event
groups other than the control tables.)
Host Group
The Host Group can maintain statistics on all devices found on the network, with the only limitation
being the amount of available buffer space. A full set of statistics, as defined in the Statistics Group, can
be maintained for each unique address. This group is generally used as one of the last steps in
troubleshooting. For example, if a network device has triggered a predefined event, you can configure the RMON
probe to collect host information for the media interface where the problem occurred. After you have collected
the pertinent data, it can be sorted for analysis based on MAC address, creation order, selected statistic, or errors.
9-15
USING RMON
When you open the Host Group the Control Table is displayed as shown below. Use this table to select an
interface on the monitored device, such as a hub’s repeater bus, or a port on a switch used for device management.
Click on the Add (Edit) button to add (edit) an index entry. The dialog box that opens is described in the following
table.
Table 9-13 Host Control Table
Field
Description
Index
A number that identifies the row in the table.
Owner
The person who created this entry.
Interface
A media interface on the monitored device. (MIB-2: 1.3.6.1.2.1.2.2.1.2)
Table Size
The number of host entries added to this table by the RMON probe.
Last Delete Time
The last time data was deleted from this table due to lack of space.
Status
Possible states include “under creation,” “valid,” and “invalid.”
Refresh Time for
Control Table
The refresh interval for this control table. Range: 5-600 seconds
To view the data collected for a specific interface, highlight the concerned entry in the control table and press the
View button. When you open the host table, the RMON Manager will poll the RMON probe for the most current
information. Polling may take a while to complete depending on the number of entries included in the table. Note
that the polling status is displayed in the status bar at the bottom of the screen.
9-16
RMON UTILITIES
By default, the entries are sorted according to address, cumulative values are listed in the numeric table at the top
of the screen, and packets/second are displayed in the graph at the bottom of the screen. The configuration and
display options are listed below.
Table 9-14 Host Control Table Menu and Tool Bar Descriptions
Field
Description
File
Exit
Polling
Polling Time (5 - 3600 seconds), Pause, Resume
View
Table
Graph
–Cumulative, Delta
–Packets, Bytes, Errors
9-17
USING RMON
Table 9-14 Host Control Table Menu and Tool Bar Descriptions
Field
Description
Tool
Find
– Locates a specific MAC address in the host table.
Sort
– Sorts the table based on any of the displayed columns, in ascending or
descending order. (You can also sort the table by clicking on any column
header.)
Control!
Control Table
Help
On-line help
Note: If an entry displays “Lost Track” when you click on it in the table, the record cannot be found either
because polling was stopped before completion, or the entry was deleted due to lack of space.
Host Top N Group
The Host Top N Group can display the hosts with the highest recorded value for a selected statistic.
This group can be used to identify the most active hosts on the network in regard to certain statistics.
The values are displayed as an overall rate for a specified interval for a specific number of top hosts.
The group can be used to quickly identify the most active hosts based on a certain statistic, such as those that are
transmitting the most broadcast messages or those that are reporting the largest number of errors.
Use the control table shown below to configure entries for the Host Top N group, including the device interface,
the statistic to monitor, the duration to monitor, and the number of top hosts to list. Click on the Add (Edit) button
to add (edit) an index entry. The dialog box that opens is described in the following table.
9-18
RMON UTILITIES
The entries are sorted according to the most active hosts, with the change in value (delta) and rate of change shown
by the table at the top of the screen, and the rate shown by the graph at the bottom of the screen. The
configuration and display options are listed below.
Table 9-15 Host Top N Menu and Tool Bar Descriptions
Field
Description
File
Exit
Polling
Automatically resets polling time after each period is
completed.
Control!
Control Table
Help
On-line help
9-19
USING RMON
Matrix Group
The Matrix group can maintain statistics on conversations that occur between each pair of hosts on the
network. This group can display statistics for traffic transmitted from any source address, traffic
received by any destination address, or traffic passing between any host pair. For example, if an alarm is
set off for a high watermark on traffic loading, you can use the Host Top N group to identify the hosts with the
heaviest load, and then use the Matrix group to analyze the conversations taking place. If a host is transmitting a lot
of packets, but not receiving many responses, this may indicate a faulty device. On the other hand, if a host is
receiving a lot of traffic but is not responding, either the host is overloaded and cannot keep up with the requests,
or the network is overloaded and should be segmented.
Use the control table shown below to configure entries for the Matrix group, including the device interface and
owner. Click on the Add (Edit) button to add (edit) an index entry. The dialog box that opens is described in the
following table.
Table 9-16 Matrix Control Table
9-20
Field
Description
Index
A number that identifies the row in the table.
Owner
The person who created this entry.
Interface
A media interface on the monitored device. (MIB-2: 1.3.6.1.2.1.2.2.1.2)
Table Size
The number of host entries added to this table by the RMON probe.
RMON UTILITIES
Table 9-16 Matrix Control Table
Field
Description
Last Delete Time
The last time data was deleted from this table due to lack of space.
Status
Possible states include “under creation,” “valid,” and “invalid.”
Refresh Time for
Control Table
The refresh interval for this control table. Range: 5-600 seconds
To view the matrix data collected for a specific interface, highlight it in the control table and press the View button.
When you open the Matrix table, the RMON probe starts monitoring the interface. The number of entries
downloaded is listed in the status bar at the bottom of the table.
By default, the entries are sorted according to the source address, cumulative values are listed in the numeric table
at the top of the screen, and packets/second are displayed in the graph at the bottom of the screen. Since the graph
displays rate, nothing will be displayed for the highlighted entry if no activity was seen during the last polling
interval. The configuration and display options are listed below.
9-21
USING RMON
Table 9-17 Matrix Menu and Tool Bar Descriptions
Field
Description
File
Exit
Polling
Polling Time (5 - 3600 seconds), Pause, Resume
View
Table
– Cumulative, Delta, Specific Source/Destination
Graph
– Packets, Bytes, Errors
Tool
Find
– Locates a specific MAC address in the matrix table.
Sort
– Sorts the table based on any of the displayed columns, in ascending or
descending order. (You can also sort the table by clicking on any column
header.)
Control!
Control Table
Help
On-line help
Note: When specifying the view for a specific
source-destination pair, you can specify both the source
and destination, just the source or destination (using
Any Address as shown in this example), or all the
transmitted and received traffic for a specific address
pair (using Reverse direction).
Filter and Capture Groups
The Filter Group is used to generate a packet
stream from the frames that match a specified pattern, while the Capture Group is used to manage the
storage buffers for packets captured by the Filter Group. These groups can be used to capture network
traffic associated with precisely defined events. The captured data or trigger events can then be used to
debug application problems or fine-tune network performance. From captured data, you can view the associated
network protocol, summary information for each packet, or a detailed hexadecimal and ASCII breakdown of all
traffic.
Use the control table to configure and activate channels as described below.
9-22
RMON UTILITIES
Table 9-18 Channel and Buffer Control Table
Field
Description
Owner
The person who created this entry.
Interface
A media interface on the monitored device. (MIB-2: 1.3.6.1.2.1.2.2.1.2)
Data Control
Indicates if the capture channel is enabled or not. The capture channel may be manually enabled or
disabled using the On/Off button. Or a Turn-On Event defined for this channel can be used to enable
it. Once enabled, the channel will start capturing packets that pass the filter.
Accepted/
Captured
Indicates the number of times this channel has accepted a packet, and the number of packets currently
in this capture buffer.
Buffer Status
Indicates whether the buffer space is available or full (wrapped or locked).
Channel Index
A number that identifies the channel in the channel table.
9-23
USING RMON
Table 9-18 Channel and Buffer Control Table
Field
Description
Buffer control
Index
A number that identifies this buffer in the buffer control table.
Description
A comment provided by the user describing this channel.
Buffer
Displays the buffer for the selected control entry.
Filter
Displays the filter control table.
On/Off
This button is used to manually enable or disable the capture channel.
Refresh Time for
Control Table
The refresh interval for this control table. Range: 5-600 seconds
Separate Tables
Displays a tabbed window with the channel, filter and buffer tables.
Configuring Filters – You can set up to 20 filters for each channel. Just highlight the concerned channel and then
press the Filter button. If you define more than one filter, they will be OR’ed together and compared against data
crossing the specified interface. To configure filters, click on the Add (Edit) button to add (edit) an entry. The
dialog box that opens is described in the following table.
9-24
RMON UTILITIES
You can filter raw data for any frame type. Or you can filter detailed information from the header fields if you
indicate frame type. When filtering Ethernet II, Ethernet 802.2 or Ethernet SNAP, you can specify the network
protocol (IP, IPX, Unknown), as well as the transport protocol (IP: All, TCP, UDP, Unknown; or IPX: All, RIP,
SAP, Unknown). Also regardless of the frame type, you can choose to filter all packets or just certain error packets
(such as fragments or jabber). Detailed configuration options for filters are shown in the following table.
Table 9-19 Filter Configuration Options
Field
Description
Index
An index that uniquely identifies an entry in the filter table.
Channel
The owner who created the corresponding channel entry, and the channel index.
Frame Type
The frame type to filter. Values: All, Ethernet II, Ethernet 802.2, Ethernet SNAP, Ethernet 802.3 Raw,
Unknown
Protocol
The network protocol to filter. This entry is only available if Ethernet II, Ethernet 802.2, or Ethernet
SNAP is the selected frame type.Values: IP, IPX, Unknown
Upper-Layer
Protocol
The transport protocol to filter. The options available depend on the selected network protocol.IP:
All, TCP, UDP, UnknownIPX: All, RIP, SAP, Unknown
9-25
USING RMON
Table 9-19 Filter Configuration Options
Field
Description
Packet Status
The status of packets to filter: Any Packets, No Errors, Any Errors, CRC/Alignment, Packets < 64
Bytes, Undersize (packets < 64 bytes, with no CRC/alignment errors), Packets > 1518 Bytes, Oversize
(packets >1518 bytes, with no CRC/alignment errors), Fragments, Jabber, Other
Name
A name for this filter expression, consisting of the selected:
Frame Type / Protocol / Upper-Layer Protocol.
Raw Data
Allows you to enter a specific data pattern to filter. Select Data and input the filter pattern, select Mask
to indicate the relevant bits, then select Not Mask to indicate the bits that should match or not match.
You can check for a pattern anywhere within the first 256 bytes of a frame.
Data: The bit pattern to filter.
Mask: The relevant bits within the data.
Not Mask: Those bits in the mask to match (0) or not match (1).
Decoded Details
If the frame and protocol type are specified, then you can filter specific fields directly from the frame
and protocol headers.
Load/Save As
Loads a predefined filter into the filter table, or saves the current filter as a file.
The following example shows a filter expression designed to capture any errors occurring in AppleTalk packets.
While the other example shows filtering for decoded details that is designed to capture any Ethernet II packets
directed to the IP address 10.1.0.23 that have the Don’t Fragment flag set.
9-26
RMON UTILITIES
Configuring Channels – The data and event stream formed by the packets that match the filter (or a group of
combined filters) is referred to as a “channel.” A channel can be based on a single filter or on multiple filter
expressions which are OR’ed together. The channel can be configured to pass packets through if they match or fail
to match the stated expression(s). Events can then be defined to turn the channel on or off, or can also be
triggered when the packets are accepted. From the control table, click on the Add (Edit) button to add (edit) a
channel entry. The dialog box that opens is described in the following table.
Table 9-20 Channel and Buffer Add/Edit Dialog Box
Field
Description
Channel
Controls the flow of data through the channel.
Index
A number that identifies this channel in the channel table.
Interface
A media interface on the monitored device. (MIB-2: 1.3.6.1.2.1.2.2.1.2)
Accept type
Controls how the filters associated with this channel are implemented.
Matched – Packets will be accepted if they match both packet data and packet status entries
defined in the filter.
Failed – Packets will be accepted if they fail either packet data or packet status entries defined
in the filter.
Turn-On Event
Specifies an event that will turn on the channel.
Turn-Off Event
Specifies an event that will turn off the channel.
Accept Event
Specifies an event that will be generated when the channel is on and a packet is accepted.
9-27
USING RMON
Table 9-20 Channel and Buffer Add/Edit Dialog Box
Field
Accept Event Status
Description
Controls the flow of events.
Ready – A single event will be generated, after which the status will be set by the RMON probe
to “Fired.” While in the Fired state, no events will be generated until the status is reset to Ready
or Always Ready.
Always Ready – Disables flow control and allows events to generated at will. Using this setting
runs the risk of generating a high volume of traffic and affecting network performance
Description
Buffer
A comment provided by the user describing this channel.
Configures the buffer used to store packets matched for this control entry.
Index
A number that identifies this buffer in the buffer table.
Full Action
Controls the action of the buffer when it reaches full status.
Lock – The buffer will be locked as soon as it fills.
Wrap – Old data will be overwritten when the buffer fills.
Capture Slice Size
The maximum number of bytes for each packet that will be saved in this capture buffer. Values
include 100, 200, 500, 1000 bytes and Maximum. If set to Maximum, the capture buffer will
save as many bytes as possible.
Download Slice Size
The maximum number of bytes for each packet that will be returned to the management station
in a single retrieve operation. Values include 100, 200 and 500 bytes
Buffer Size Requested
The number of bytes requested for this capture buffer. Values include 10000, 20000, 50000,
100000, 200000, 500000 bytes and Maximum. If set to Maximum, the capture buffer will save
as many bytes as possible.
Buffer Size Granted
The number of bytes granted for this capture buffer.
Viewing Separate Tables – You can quickly display the configuration for channels, filters and buffers using the
tabbed window shown below. The information provided is described in the following tables.
9-28
RMON UTILITIES
Table 9-21 Separate Control Tables: Channels
Field
Description
Channels
Controls the flow of data and events through the channel.
Index
A number that identifies this channel in the channel table.
Owner
The person who created this channel entry.
Interface Index
A media interface on the monitored device. (MIB-2: 1.3.6.1.2.1.2.2.1.2)
Accept Type
Controls how the filters associated with this channel are implemented.
Matched – Packets will be accepted if they match both packet data and packet status entries defined in
the filter.
Failed – Packets will be accepted if they fail either packet data or packet status entries defined in the
filter
Data Control
Controls the flow of data through the channel.
On – Data, Status and Events flow through the channel.
Off – Nothing flows through the channel.
Turn-On Event
Specifies an event that will turn on the channel.
Turn-Off Event
Specifies an event that will turn off the channel.
Event Index
Specifies an event to be generated when the channel is on and a packet is accepted.
9-29
USING RMON
Table 9-21 Separate Control Tables: Channels
Field
Event Status
Description
Controls the flow of events.
Ready – A single event will be generated, after which the status will be set by the RMON probe to
“Fired.” While in the Fired state, no events will be generated until the status is reset to Ready or
Always Ready.
Always Ready – Disables flow control and allows events to generated at will. Using this setting runs the
risk of generating a high volume of traffic and affecting network performance.
Matches
The number of times this channel has accepted a packet.
Description
A comment provided by the user describing this channel.
Status
The current status of the index entry in the Control Table: Valid, Under Creation or Invalid.
Table 9-22 Separate Control Tables: Filters
9-30
Field
Description
Filters
Specifies the filter expressions used to capture data from the interface.
Index
An index that uniquely identifies an entry in the filter table.
Owner
The person who created this filter entry.
Channel Index
The index used to identify the channel entry associated with this filter.
Packet Data Offset
The offset from the beginning of each packet where a match of packet data will be attempted.
Packet Data
The data that are to be matched with the input packet.
Packet Data Mask
The mask that is applied to the match process.
RMON UTILITIES
Table 9-22 Separate Control Tables: Filters
Field
Description
Packet Data Not Mask
The inversion mask that is applied to the match process.
Packet Status
The status that is to be matched with the input packet.
Packet Status Mask
The mask that is applied to the status match process.
Packet Status Not Mask
The inversion mask that is applied to the status match process.
Status
The current status of the index entry in the Control Table: Valid, Under Creation or Invalid.
Displaying Buffer Contents – The capture buffer displays information on packets in three different windows.
The upper window shows summary information on each packet, including source, destination, timestamp, and
protocol type. The middle window decodes information for each layer in the protocol stack. The bottom window
provides raw data in hexadecimal and ASCII format. The configuration options for the buffer display are
described in the following table.
Table 9-23 Separate Control Tables: Buffers
Field
Description
Buffers
The buffer used to store packets matched for this control entry.
Index
A number that identifies this buffer in the buffer table
Owner
The person who created this buffer entry.
Channel Index
The index for the channel entry associated with this buffer.
Full Status
Indicates whether space is still available in the buffer, or if it is full.
9-31
USING RMON
Table 9-23 Separate Control Tables: Buffers
Field
Full Action
Description
Controls the action of the buffer when it reaches full status.
Lock – The buffer will be locked as soon as it fills.
Wrap – Old data will be overwritten when the buffer fills.
9-32
Capture Slice Size
The maximum number of bytes for each packet that will be saved in this capture buffer.
Download Slice Size
The maximum number of bytes for each packet that will be returned to the management station
in a single retrieve operation.
Bytes Requested
The number of bytes requested for this capture buffer.
Bytes Granted
The number of bytes granted for this capture buffer.
Captured Packets
The number of packets currently in this capture buffer.
Turn On Time
The value of sysUpTime when this capture buffer was first tuned on.
Status
The current status of the index entry in the Control Table: Valid, Under Creation or Invalid
RMON UTILITIES
Notes: 1. To display decoded and raw data for a summary item, highlight it with your cursor.
2. To display raw data corresponding to a decoded entry, highlight it with your cursor.
Table 9-24 Buffer Menu and Toolbar Descriptions
Field
Description
File
Load, Save As, Exit
Note that you must pause polling before you can load or save a buffer file.
Polling
Polling Time (5 - 3600 seconds), Pause, Resume
Also includes options to download Next 2000 Packets or Previous 2000 Packets.
Control
Control Table
9-33
USING RMON
Table 9-24 Buffer Menu and Toolbar Descriptions
Field
Description
Options
Time Format includes:
Absolute – Date and local time.
Relative – Time relative to when the first packet was added to the buffer.
Difference – Time difference between capturing last packet and current packet.
Help
9-34
On-line help
APPENDIX A
TYPICAL ELITEVIEW APPLICATIONS
EliteView is a versatile network management software package that supports an open platform architecture. Users
with enough technical knowhow can customize it according to their needs in order to monitor and control SMC or
other third-party SNMP devices. This chapter describes a few useful applications you can adopt to your own
network environment.
Adding a New MIB Using the MIB Compiler
Let’s say that you want to add and compile a new MIB into the EliteView MIB database. The new MIB is from a
third-party SNMP device.
To add a new MIB into the EliteView MIB database
1. Get the MIB text file of the third-party SNMP device. Let’s assume that the filename of the MIB text file is
DEVICE.MIB.
2. Copy the third-party MIB into the EliteView directory. Type:
Copy d:DEVICE.MIB c:\ELITEVIEW
3. Type the full name of the MIB file in the Filename field.
4. Select Load from the MIB Compiler.
DEVICE.MIB is now included in the EliteView MIB database.
Tip:
Now that the third-party MIB has been added to the EliteView MIB database you can do any of the
following things:
1. Use Discovery to search for the third-party device.
2. Drag-and-drop the third-party device icon onto any EliteView submap. Third-party devices are labeled
as an SNMP node on the EliteView map.
3. Double-click on the SNMP node to bring up the MIB Browser. A full knowledge of your third-party
MIB will allow you to input the necessary parameter in each box prompt. This will allow you to view
the status of any MIB variable you wish to monitor.
4. Use Log Manager to gather data from the SNMP device.
A-1
TYPICAL ELITEVIEW APPLICATIONS
5. Use Log and Event Manager to monitor the SNMP device.
6. Customize EliteView to receive third-party traps.
7. Import Logged data into other software for further processing.
Managing a Third-Party Device Using the MIB Browser
Before you can manage any third-party device, you should have a clear understanding of definitions for
the variables in this MIB. Please consult your vendor for details.
Assumption: With the absence of a sample third-party MIB and device, and for purposes of this example, let us
assume that SMC’s EZ Stack-10 system is a third-party SNMP device.
Let’s say that you want to monitor the total number of packets the third-party SNMP device receives.
To manage a third-party SNMP device (i.e., monitor the number of packets received):
1. Compile the third-party MIB into the EliteView MIB database. Refer to the section on “Adding a New MIB
Using the MIB Compiler” for more information. If you have completed this operation, skip to the next step.
2. Create a map that includes the third-party SNMP device (i.e., a device labeled as “SNMP node”) that you wish
to monitor. You can use Discovery to find it; then simply drag and drop the corresponding SNMP node onto
any submap.
3. Determine the MIB variable that represents the total number of packets received by the system. Say
ezRptrTotalFrames is the MIB variable that represents this count.
4. Double-click on the SNMP node (i.e., third-party device) to bring up the MIB Browser.
Tip:
You can also bring up the MIB Browser simply by clicking on its corresponding icon from the EliteView
program group.
5. In the “Node Label” field, type “ezRptrTotalFrames,” and press <Enter>.
Tip:
In the Node Label field, you will find the “iso” entry. This is the root MIB object. Double-clicking on this
entry allows you to move through the MIB tree. Each time you double-click an entry, the list box will
display the corresponding “branch” database.
6. An “Input Index” dialog box will appear on screen, asking you input the index of the variable you have specified
(i.e., ezRptrTotalFrames). For example, in this field type the target SNMP device’s IP address, and then
press <Enter>.
7. Click the Get button and view the result in the Status window.
A-2
USING THE LOG AND EVENT MANAGERS TO MONITOR THE NETWORK
Let’s say that you want to set a variable called hubNMS in a third-party device.
To set a variable in a third party device:
1. Compile the third-party MIB into the EliteView MIB database. Refer to the section on “Adding a New MIB
Using the MIB Compiler” for more information. If you have completed this operation, then skip to the next
step.
2. Create a map that includes the third-party SNMP device (i.e., a device labeled as “SNMP node”) you wish to
monitor. You can use Discovery to find it; then simply drag and drop the corresponding SNMP node onto any
submap.
3. Double-click on the SNMP node (third-party device) to bring up the MIB Browser.
4. Locate the required MIB variable, “hubNMS.”
5. Click the Set Request button.
6. An “Input Value” dialog box will appear on-screen, prompting you for the value you wish to set. Type in the IP
address of your EliteView network management station. Press <Enter> or click <OK> to confirm your choice,
or click <Cancel> to abort this operation.
7. View the result in the Status window.
Using the Log and Event Managers to Monitor the Network
The Log Manager and the Event Manager are two powerful network monitoring modules. Regardless of whether
you are managing SMC or other third-party manageable systems, these two modules work in conjuction with each
other to allow flexible network management.
To use the Log Manager and Event Manager:
1. Fill in the table on the next page. It contains information you should know in order to use the Log Manager
and Event Manager effectively.
2. Bring up the Event Manager and add an event according to the Event Name and actions you have specified.
Refer to Chapter 8, “Managing Events” for more information.
3. Bring up the Log Manager and add a log request. Refer to Chapter 7, “Collecting Data with the Log Manager”
for more information on using the Log Manager and for setting filters and threshold formulas.
The Log Manager will continuously monitor the target SNMP device after you have set the log request.
Tip:
Delete or pause unnecessary log requests to prevent wasting system resources (i.e., disk space, CPU time,
and network traffic). You can use the Log Manager to back up or delete logged data frequently and save
precious disk space.
A-3
TYPICAL ELITEVIEW APPLICATIONS
Table A-1 Log and Event Manager Parameters
Parameter
Description
Example
Target Address
IP address of target SNMP device you wish to monitor.
192.72.24.05
MIB Module
A collection of managed objects.
SMC-MIB
Variable
Name of variable as defined in the MIB.
sysDescr
Index
Value of index as defined in MIB which is used to access a table.
1
Filter
Formula used to filter information.
(VALUE>100) AND
(TIME<120000)
Threshold
Criteria used to generate events when the filter conditions are satisfied.
R>100
Event Name
Name of the event used by the Event Manager to handle the threshold
condition.
CRITICAL
Event Action
Beep – an audible alarm issued by the network management station
Show message box – display a user-defined message in a box on the
network management station’s screen. The message box appears on top of
all other windows. When the message box appears, you must click on the
<OK> button to dismiss the message. This action is recommended for
critical events.
CRITICAL: Hub
overheating
Run program – execute any Windows-based application. This action is
ideal for sending a message via email or FAX.
PAGER 408-555-4742
Send message to REPORT – Insert a message into the Report window.
Alarm messages are time stamped and shown in chronological order. This
action is recommended for routine events.
WARNING: SERVER
DISK > 90% full
Write into database – Put a message into the event database.
CAUTION: Excessive
CRC errors on device
For more detailed information on Log and Event parameters refer to chapters 7 and 8 respectively.
Let’s say that you want to monitor the total packets received by an SNMP device whose IP address is 192.72.24.1.
Then you would like to save this value every 60 seconds between 9:00 AM and 5:00 PM. And if the rate is greater
than 1000 per second, you want to save the value and at the same time be informed of the situation through an
audible alarm, such as a beep. Suppose you consider this as a critical condition and would like to call it “Hot_1.”
A-4
USING THE LOG AND EVENT MANAGERS TO MONITOR THE NETWORK
By checking the target SNMP device’s MIB, you find that the variable ezRptrTotalFrames contains the value
that you need. Further, this variable belongs to the “EZ Stack 10” module. (The term MIB module is
synonymous to the term “MIB Name” in the MIB variable information window of the MIB Browser.) Additional
information you already know includes – index is equal to the IP address of the target SNMP device and the
community is equal to public.
To monitor the total packets received by the target device:
1. Fill in the following table with all available information.
Table A-2 Port Packet Reception Parameters
Parameter
Given Information
Target Address
192.72.24.1
Community
public
MIB Module
SMC3116-MIB
Variable
ifInOctets
Index
192.72.24.1
Polling Interval
60
Filter
(TIME>080000) AND (TIME<170000)
Threshold
S>1000000
Event Name
Hot_1
Event Actions
Beep, Write into database – Value is $$
2. Bring up the Event Manager. It is automatically loaded when you run the main EliteView program. If it is not
visible, bring it up by selecting Event Manager from the Utilities Menu. Add the new Event Name and Event
Actions you have specified in the preceding table.
3. Select Log Manager from the Utilities Menu. Add new log processes according to the information specified in the
preceding table into the Log Information dialog box.
4. Collect all the information you need to establish a threshold appropriate for your system. Then use the Log
Data Manager to save or delete logged data into your hard disk.
Let’s say that you want to monitor the collisions of an SNMP device whose IP address is 192.72.24.2. Then you
would like to check the value for every 60 seconds, but do not want to save the data at all. And if the collision rate
is greater than 100 per second, you need an audible alarm and a message box to warn you of the condition. You
want to name this critical condition as “Hot_2.”
A-5
TYPICAL ELITEVIEW APPLICATIONS
By checking the target SNMP device’s MIB, you find that the variable hubTxCollisions contains the value
that you need. Further, this variable belongs to the “EZ Stack 10” module. Additional information you already
know includes – index is equal to the IP address of the target SNMP device and the community is equal to abc.
To monitor the total packets received by the target device:
1. Fill in the following table with all available information.
Table A-3 Target Device Packet Reception Parameters
Parameter
Given Information
Target Address
192.72.24.2
Community
abc
MIB Module
SMC3116-MIB
Variable
ifInUnknownProtos
Index
192.72.24.2
Polling Interval
60
Filter
TIME<0 (This is an impossible filter because you do
not want to save any data.)
Threshold
S>10
Event Name
Security_2
Event Actions
BeepShow message box – Security_2
2. Bring up the Event Manager. Add the new Event Name and Event Actions that you have specified in the
preceding table.
3. Bring up the Log Manager. Add new log processes according to the information specified in the preceding table
by filling in the Log Information dialog box.
4. Collect all the information needed. Then use the Log Data Manager to save or delete logged data on your hard
disk.
Customizing EliteView to Receive Third-Party Traps
EliteView flexibly manages trap messages through the Trap Manager, which reads necessary information from
TRAP.INI and “listens” to the network for traps.
Once traps are received, the Trap Manager takes the proper action in accordance with instructions in the
TRAP.INI file.
A-6
EXPORTING LOGGED DATA TO OTHER SOFTWARE
Appendix B, “Customizing EliteView” describes the format of the TRAP.INI file. For an advanced user, this
format is not difficult to understand. One important thing that you have to remember is the arrangement of the
events and messages for each trap. You should use the Event Manager to add all the events and responses you
want. Additionally, the trap message specified in the TRAP.INI file is the “value” of the event that will be
substituted for the $$ symbol.
To configure the Trap Manager to receive traps from any third-party SNMP device, you should find
answers to the following questions from the vendor of your third-party device:
1.
2.
3.
4.
5.
What is the enterprise of the device?
How many enterprise (private) traps does the device have?
What does each private trap mean?
What are the corresponding MIB variables used by each private trap?
Finally, use the answers you get for the above questions to edit the corresponding sections in the TRAP.INI
file.
Exporting Logged Data to Other Software
All databases created by EliteView are in dBASE format. Thus any software supporting dBASE files can read
EliteView data.
To export logged data into other software:
1. Bring up the Log Data Manager.
2. Highlight the logged data you wish to copy to another application. Do this by holding down the left button on
the mouse and dragging the mouse over the required lines.
3. Select Copy from the Edit Menu of the Log Data Manager. This will copy the selected data into the Windows
clipboard.
4. Open the application that you want to use. For example, load Microsoft Word if you want to copy the
information to it.
5. Paste the information from the clipboard onto the Microsoft Word file. And then save it if necessary.
A-7
TYPICAL ELITEVIEW APPLICATIONS
A-8
APPENDIX B
CUSTOMIZING ELITEVIEW
EliteView is a powerful network management platform that is designed to meet all your needs. To maximize
system usability and functionality, EliteView takes full advantage of all user and programming interfaces available
in the Microsoft Windows 95, 98, NT, 2000, XP and Vista environments.
You can easily customize EliteView by editing the NETMGR.INI, TRAP.INI and the configuration files found in
the EliteView directory (C:\EV60). These files use the general format of the Windows initialization file. This
chapter describes the contents of these INI files.
EliteView’s Initialization Files
The initial settings for the EliteView program modules are found in several different initialization files. The default
directory for initialization files is C:\EV60. To view these files, use any word processor or text editor
(e.g., NOTEPAD.EXE). Initialization files are also included for the platform program and several other EliteView
modules as described below. You may modify these files to meet your particular needs. (However, be sure to
maintain backup copies of the original initialization files.) Detailed examples of how to modify these files are
provided in the following sections.
Inside the NETMGR.INI File
The initial settings for the main EliteView program are found in NETMGR.INI. The topics included in this file
are listed below.
Description of Sections in NETMGR.INI
Table B-1 Description of Sections in NETMGR.INI
Section
Description
device
Describes each device that can be managed by EliteView.
tools
Items that appear in the Tools menu or the main program.
util
Items that appear in the Utilities menu or the main program.
B-1
CUSTOMIZING ELITEVIEW
Table B-1 Description of Sections in NETMGR.INI
Section
Description
bitmaps
Contains the bitmap graphics used to display managed devices on the network map.
MIB
Directory where device MIBs are stored.
LOG
Directory for storing log files; also includes a flag which enables/disables logging upon startup
tftp
Path for boot files; also includes setting for device connection.
startup
Indicates programs to run when EliteView is invoked.
system
Settings for desktop layout; also includes parameters for device connection.
discover
Includes default settings for Auto Discover; is updated each time Discovery is executed.
MESSAGE.DLL
Governs inter-module communication of messages.
Event Manager
Contains database pointers associated with the print option.
RMON
Contains several polling variables.
Changing Parameters in NETMGR.INI
You may edit any of the sections included in NETMGR.INI to meet the needs of your specific environment.
However, a few of the more common changes include the following items.
•
•
You may add any Windows-based application to the tools and utilities menus. Edit the [tools] section to add
or delete tools; or edit the [util] section to add or delete utilities.
You may change any of the bitmaps provided by EliteView or add additional bitmaps for unlisted devices.
Bitmap graphic images are defined in the [bitmap] section. Each bitmap must be in Windows v3.1 BMP format.
The first bitmap is used to represent the normal state of the device; the second bitmap the down state; and the
third bitmap the “unmonitored” state.
The NETMGR.INI file follows the Windows initialization file format. It is divided into different sections; section
names are indicated by square brackets for easy identification, e.g., [system].
These sections contain different parameters, occupying one line each. Parameters are presented in the following
format:
keyword=value1,value2,...
Parameter format conventions
1.
2.
3.
4.
B-2
Keywords and values may be alphanumeric characters.
No spaces are allowed before or after equal signs or commas.
Some values may use single spaces inside, however, no consecutive spaces are allowed.
Some parameters may mention “EliteView applications,” providing that:
INSIDE THE NETMGR.INI FILE
•
•
•
•
The Windows-based applications are written according to a set of rules required by EliteView
They accept a list of parameters provided by the EliteView main program.
They are able to communicate with each other through the EliteView message center.
All EliteView applications started from the main EliteView program are automatically terminated when the
main EliteView program is terminated. However, non-EliteView applications are not affected when the
main EliteView program is terminated, even if they were started within the main EliteView program.
The [system] Section
The [system] section contains parameters that are used by basic components of EliteView, such as the protocol
stacks. There are two ways to change parameter settings in this section. They are:
•
•
Using the Default Settings command in the Options Menu.
Making changes directly inside the NETMGR.INI file. To do this you should know the meaning of each item.
Description of Parameters in NETMGR.INI
Table B-2 Description of Parameters in NETMGR.INI
Parameter
Description
Example
Community=
The default community string that appears in the Add Object dialog box.
Community=public
Map=
Default map opened by the EliteView main map when it starts. If no default
map is assigned, it opens with an empty map.
Map=SMC
Polling=
Default polling interval, measured in seconds. This appears in the Add
Object dialog box.
Polling=1
Timeout=
Default timeout period that appears in the Add Object dialog box.
Timeout=1
Retries=
The number of default retries that appear in the Add Object dialog box
Retries=3
The [device] Section
The [device] section controls the number of devices EliteView can manage. The Add Object dialog box should
display a complete list. Each device is referred to by a unique name. You can edit this section to add devices.
Tip:
Adding a device will require editing not only the [device] section, but also other sections as well. For
example, you may wish to define the tools that can be applied to the device by editing the [tools] section.
You also need to add names of bitmaps that show the device onscreen in the [bitmap] section.
To add a new device:
Edit the total=n line to specify the number of devices you wish to manage. The variable n is a positive number,
which specifies the number of devices that will appear in the list of objects (i.e., Add Object dialog box).
B-3
CUSTOMIZING ELITEVIEW
Add a line describing the device, using the following format:
Seq=Device_Name,Protocol,Device_Description,Device_Type,Object_ID,Device_Manager
Parameter Definitions for the [device] Section
Table B-3 Parameter Definitions for the [device] Section
Parameter
Description
Seq=
The sequence number of the device runs from 1 to n, where n is the total number of devices you
can add to a map or monitor.
Device_Name
The device name, which is used by EliteView to identify the device.
Protocol
A number representing the transport protocol used for communicating with the target device.
(0) SNMP/UDP/IP, (1) IP Node, (2) SNMP, (3) IPX Node
Device_Description
The name of the device that appears in the Add Object dialog box.
Device_Type
The identifier for the device, which is used by EliteView to identify the device.
5000-5499 – SMC device
1000- 2000 – third-party device
Object_ID
MIB variable “SysObjectID” of SNMP Agent.
Device_Manager
Set to DevMan if this device can be opened by the Device Manager, or NoDevMan if it cannot.
Example: Sample entry for [device] section
[device]
total=12
1=GenNode,0,SNMP Node,1000, NoDevMan
.
.
10=EZ Stack10,0,EZ Stack10,5002,1.3.6.1.4.1.202.10.2
.
.
The following information is listed in this sample:
•
•
•
B-4
These items are included in the Add Object dialog box.
You can monitor these device types, namely, a Generic Node (i.e., third-party SNMP device) also called
an SNMP node, and SMC’s EZ Stack 10.
Both of these devices use the UDP/IP protocol.
INSIDE THE NETMGR.INI FILE
The [tools] Section
The [tools] NETMGR.INI section describes the menu items that appear in the Tools Menu of the main EliteView
program. You can add, delete, or change items in the Tools Menu simply by editing this section in the
NETMGR.INI file.
To edit the [tools] section:
1. Edit the total=n line to specify the number of items listed in the Tools Menu. The variable n specifies the
number of items listed under this menu.
2. Add a line describing each item in the [tools] section using the following format:
Seq=EV_Flag,Menu_Item,Executable,Help_Message,Toolbar_Bitmap
Parameter Definitions for the [tools] Section
Table B-4 Parameter Definitions for the [tools] Section
Parameter
Description
Seq=
The sequence number is from 1 to n, where n is the total number of items in the Tools Menu.
EV_Flag
Difference between EliteView and Non-EliteView Windows applications. Acceptable values
include:
0 Designates the entry as a “Non-EliteView Windows application”; i.e., it cannot work closely with
EliteView, but may be initiated from within some EliteView commands as an independent
process.
1 Designates the entry as an “EliteView Application”; i.e., it follows the set of rules specified by
SMC to allow interaction with other EliteView modules.
Menu_Item
This is the text that appears in the menu. An ampersand “&” before one of the letters in the text
designates a short-cut key sequence (i.e., a single-letter used with the Alt key), which you can press
to invoke the corresponding command. This is normally shown onscreen with an underline.
Executable
The name of the Windows application that is invoked when the corresponding item is selected. This
application program is set as the default application, which means that it is invoked only if no other
definition for individual devices exists.
Help_Message
The message that appears in the status bar when the specified menu item is browsed.
Toolbar_Bitmap
The toolbar bitmap shown in the EliteView platform program.
The above list may be followed by zero or more lines for definitions that apply to individual devices.
3. Identify particular tools for any device, if necessary. Do this by adding or editing the following command line:
Device_ID.Seq=Executable
B-5
CUSTOMIZING ELITEVIEW
The table below describes each item:
Table B-5 Identifying Particular Tools for a Device
Parameter
Description
Device_ID
The device identifier defined in the [device] section.
Seq=
The menu item sequence number the device will override.
Executeable
Filename of the EliteView application that is invoked when the device type and menu items are
selected.
If no application is designated for a device, then the default application listed in the preceding table is invoked
when the corresponding menu item is selected.
Example: Sample entry for [tools] section
[tools]
total=5
1=1,&Zoom,SNMPTREE.EXE,Zoomin the object,zoom
2=1,&Alive Test,ALTEST.EXE,Alive test,altest
3=1,&MIB Browser,SNMPTREE.EXE,MIB browser,tree
4=1,M&IB-2 Viewer,MIB2VIEW.EXE,MIB-2(RFC1213) Viewer, mib2view
5=1,&Telnet,TELNET.EXE,Telnet,telnet
From the [tools] section, one can read the following information:
•
•
•
•
•
Five menu items are listed in the Tools Menu – Zoom, Alive Test, MIB Browser, MIB-2 Viewer, and Telnet.
Run each item by invoking the corresponding executable file. For example, run Zoom by invoking
ZOOM.EXE, etc.
Invoking any command will display the corresponding help message in the status bar. For example, clicking
Zoom will display Zoom in the object.
For the SNMP node, there is no override. This means that when Zoom and MIB Browser are selected,
SNMPTREE.EXE is executed.
For SMC devices, the Zoom command invokes the corresponding EliteView management module; the Alive
Test command invokes ALTEST.EXE; and the MIB Browser command invokes SNMPTREE.EXE.
The [bitmaps] Section
The [bitmaps] NETMGR.INI section lists the filenames of graphic bitmaps that are used to show devices on the
EliteView maps. The graphic bitmaps are in standard *.BMP format. If you want to change any of the bitmaps
EliteView provides, you can create you own and integrate them into EliteView. You can do this simply by copying
a new bitmap into the bitmap directory and editing the [bitmap] section of the NETMGR.INI file.
B-6
INSIDE THE NETMGR.INI FILE
Tip:
If you are going to design your own graphic bitmap for a device, remember to design three kinds of
graphic images
• the device at normal operating condition
• the device when it is “down” or not operating
• the device in the “not monitored” mode
1. Identify the directory where your graphic bitmap file(s) are located by editing the first line in the [bitmap]
section. This parameter identifies the directory where the bitmaps are found. It follows the following syntax:
path=directory
2. Enumerate the graphic bitmaps to include using the following format:
Device_ID=bitmap1,bitmap2,bitmap3
The table below describes each item:
Table B-6 Enumerating Graphic Bitmaps
Parameter
Description
Device_ID
The device identifier defined in the [device] section.
bitmap1
The bitmap used to represent the normal status of the device.
bitmap2
The bitmap used to represent “down” status of the device.
bitmap3
The bitmap used to represent the “not monitored” status of the device.
Any bitmap size is acceptable. When entering the bitmap filename, the BMP filename extension should not be
included.
Example: Sample entry for [bitmap] section
[bitmap]
path=C:\EV60\BITMAP\
Ether1000=ether1,ether2,ether3
GenNode=gen1,gen2,gen3
Bridge1=bri1,bri2,bri3
CompRemote=remote1,remote2,remote3
PC=pc1,pc2,pc3
submap=submap
The following information is included in the [bitmap] section:
•
•
Bitmap files are in the C:\EV60\BITMAP subdirectory.
For example, the Device_ID EZ Stack10 uses:
ether1(bitmap1 file)to represent it at normal status
ether2(bitmap2 file)to represent it at “down” status
ether3(bitmap3 file) to indicate it is “not monitored”
B-7
CUSTOMIZING ELITEVIEW
•
The same explanation follows for the other Device_IDs mentioned, e.g., GenNode, Bridge1, CompRemote
and PC.
The [util] Section
The [util] section controls the menu items that appear in the Utility Menu of the EliteView platform program.
You can add, delete or change items in the Utilities Menu by editing this section in the NETMGR.INI file.
To edit the [util] section:
1. Edit the total=n line to specify the number of items listed in the Utilities Menu. The variable n is a positive
number that specifies the number of items listed under this menu.
2. Add a line describing each item in the [tools] section using the following format:
Seq=EV_Flag,Menu_Item,Executable,Help_Message
Parameter Definitions for the [util] Section
Table B-7 Parameter Definitions for the [util] Section
Parameter
Description
Seq=
The sequence number from 1 to n, where n is the total number of items in the Tools Menu.
EV__Flag
Acceptable EV_Flag values include:
0 Designates entry as a “Non-EliteView Windows application.” It cannot work closely with
EliteView, but may be initiated within some EliteView commands as an independent process.
1 Designates the entry as an “EliteView Application;” and that it follows the set of rules specified by
SMC to allow interaction with other EliteView modules.
Menu_Item
This is the text that appears in the menu. An ampersand “&” before one of the letters in the text
designates an Alt-key short-cut command sequence, which you can press to invoke the corresponding
command. This is normally shown on screen with an underline.
Executable
The name of the Windows application that is to be invoked when the corresponding item is selected.
This application program is set as the default application, which means that it is invoked only if no
other definition for an individual device exists.
Help
The message that appears in the status bar when the specified menu item is browsed.
Message
The toolbar bitmap shown in the EliteView platform program.
Example: Sample entry for [util] section
[util]
total=10
1=1,&Log Manager,LOGMAN.EXE,Log manager,log
2=1,Log &Database Manager,LOGDATA.EXE,Log database manager,data
3=1,&BOOTP Server,BOOTP_DB.EXE,BOOTP server,bootp
4=1,&TFTP Server,TFTPSVR.EXE,TFTP server,tftp
B-8
INSIDE THE NETMGR.INI FILE
5=1,&Report,REPORT.EXE,Report window,report
6=1,Tra&p Manager,TRAPMAN.EXE,Trap manager,trap
7=1,&Event Manager,EVENT.EXE,Event manager,event
8=1,&Name Database Manager,NBMGR.EXE,Name database manager,nbmgr
9=1,D&iscovery,DISCOVER.EXE,Discovery,discover
10=1,&MIB Compiler,MIBCOMP.EXE,MIB compiler,mibcomp
From the [util] section, you can see the following information:
•
•
•
•
There are 10 items or options in the Utilities Menu (total=10).
The first item in the menu is the Log Manager. You can run it by selecting it from the Utilities Menu; or by
simply typing <L> while the Utilities menu (pull-down type) is displayed onscreen.
When your cursor is positioned on the Log Manager option, the status bar at the bottom of your screen will
display “Invoke Log Manager” to describe the Log Manager.
When you run the program you invoke LOGMAN.EXE
The [tftp] Section
The [tftp] section controls the list and settings of the items that appear in the TFTP Server dialog box. You can
add, delete or change these settings.
Example: Sample entry for [tftp] section
[tftp]
public=C:\EV50\PUBLIC
timeout=5
retry=3
From the [tftp] section, you can view the following data:
•
•
•
Section name is [tftp]
All TFTP files are stored in C:\EV50\PUBLIC
The timeout value is 5; and retry value is 3
The [startup] Section
You can customize EliteView to run other programs before loading the EliteView platform program. For example,
notice that when you click on the EliteView icon from the EliteView program group, the Event and the Trap
Manager programs are automatically executed by default. Editing the [startup] section of the NETMGR.INI file
will allow you to include additional startup processes.
To edit the [startup] section:
1. Edit the total=n line to specify the number of processes you wish to start.
2. Add a line describing each item in the [startup] section using the following format:
Seq=EV_Flag,Menu_Item,Executable,Optional parameter
B-9
CUSTOMIZING ELITEVIEW
Parameter Definitions for the [startup] Section
Table B-8 Parameter Definitions for the [startup] Section
Parameter
Given Information
Seq=
The sequence number from 1 to n, where n is a positive number equal to the total number of
startup processes you wish to invoke before running the EliteView platform program.
EV_Flag
Distinguishes between EliteView and non-EliteView applications. Acceptable values include:
0 Designates the entry as a “Non-EliteView Windows application.” This means it cannot work
closely with EliteView, but may be initiated within some EliteView commands as an
independent process.
1 Designates an “EliteView Application;” i.e., it follows the set of rules specified by SMC to allow
interaction with other EliteView modules.
Menu_Item
This is the text that appears in the menu. An ampersand “&” before one of the letters in the text
designates an Alt-key short-cut command sequence, which you can press to invoke the
corresponding command. This is normally shown on screen with an underline.
Executable
The name of the Windows application to be invoked when the corresponding item is selected.
This application program is set as the default application, which means that it is invoked only if
no other definition for an individual device exists.
Optional Parameters
Command line parameters of the program. Optional entry.
Example: Sample entry for [startup] section
[startup]
total=2
1=1,EVENT.EXE
2=1,TRAPMAN.EXE
From the [startup] section, you can view the following data:
•
•
There are two applications that will be loaded with the main EliteView program.
These are the Event Manager and the Trap Manager.
The [discover] Section
This section determines the settings for protocol selection and polling parameters under the Discovery module.
These settings are determined by the choices you make during Configuration and within the Discovery Setup
menu (see “Using Discovery” on page 4-2).
B-10
INSIDE THE TRAP.INI FILE
Parameter Definitions for the [discover] Section
Table B-9 Parameter Definitions for the [discover] Section
Parameter
Given Information
protocol
Determines the initial protocol selected when the Discovery module is opened.Values: UDP, IPX,
Ethernet
autosave1
Saves options including currently selected protocol type and other entries under the Discovery Setup
menu. Refer to the last item in the Discovery Setup menu. If you choose autosave, then all the items
in this table, other than broadcast, are updated.
scanrate2
The search rate at which query messages are transmitted.
repoll2
The number of times to query for device response.
ipnode1
Display IP nodes without an SNMP agent.
ipxnode1
Display IPX nodes without an SNMP agent.
nwserver1
Display Novell servers.
broadcast1
Used to disable the Broadcast button in the Discovery window. Note that if you select the Distint
TCP/IP WINSOCKET platform under Network Setup, the broadcast button will be disabled.
1 – Values: on, off
2 – Values: 1~10
Inside the TRAP.INI File
EliteView’s Trap Manager configuration is described in the TRAP.INI file. The sections included in the TRAP.INI
file are listed below.
Description of Sections in TRAP.INI
Table B-10 Description of Sections in TRAP.INI
Section
Description
generic
Provides the generic template for all traps.
enterprise
Provides trap information for specific devices.
The TRAP.INI file defines how the Trap Manager parses trap messages from SNMP devices and converts them
into events, which are then sent to the Event Manager.
Like the NETMGR.INI file, the TRAP.INI file is divided into different sections, namely, the [generic]
section, the [enterprise] section and the specific trap sections.
B-11
CUSTOMIZING ELITEVIEW
Elements of a Trap Message
Table B-11 Elements of a Trap Message
Element
Description
enterprise
In a generic trap, this is the object identifier of the device that generates the trap (sysObjectID). In a
specific trap, this field contains an identifier used to differentiate the definition domain of the trap.
agent-addr
The network address of the device that issues the trap. If IP protocol is used, the agent-addr is the IP
address of the device.
generic-trap
An integer value that identifies the type of trap. Allowable values:
0 to 5 Identifies common conditions that occur in IP network operations; i.e., indicates that the trap
is a device generic trap.
6
Indicates that the trap is a device-specific trap.
specific-trap
An integer that identifies different device conditions; defined by the device vendor.
time-stamp
The sysUpTime variable. This is the time period from the initialization of the device to the moment
the trap is issued. This time period is expressed in hundredths of a second.
variable-bindings
A list of MIB variables with values related to a particular event.
The [generic] Section
The first section of the TRAP.INI file is the [generic] section. It defines the number of generic traps available and
identifies the events each trap triggers. Entries for this section use the following format:
n=Active_Flag,Event_Name,Message
The following table describes each item:
Table B-12 Parameters of the [generic] Section
Parameter
Description
n=
Number of generic traps. Value ranges from 0 to 5
Active_Flag
Select either 0 or 1, where 1=active; 0=disabled (not processed)
Event_Name
The name of the event you wish to trigger
Message
The message displayed on the message box
Example: Sample entry for [generic] section
[generic]
0=1,Trap,Cold Start!!
1=1,Trap,Warm Start
2=1,Trap,Link Down
3=1,Trap,Link Up
B-12
INSIDE THE TRAP.INI FILE
4=1,Trap, Authentication Failure
5=1,Trap,egpNeighborLoss
From the [generic] section, you can view the following data:
•
•
•
•
Trap number 0
It is active (1)
It triggers the “Trap” event
When invoked the message “Cold Start” will be displayed in the event message box
The [enterprise] Section
This section lists and defines all enterprises used in the program. Enterprises are object identifiers used in generic
and specific traps.
To edit the [enterprise] section:
1. Edit the total=n line to specify the total number of available enterprises. The variable n is a positive number
that specifies the number of items listed under this menu.
2. Add a line describing each item in the [enterprise] section using the following format:
i=Active_Flag,Enterprise_ID,Number_of_Traps
The table below describes each parameter:
Table B-13 Parameters of the [enterprise] Section
Parameter
Description
i=
The sequence number is from 1 to n, where n is the total number of enterprises.
Active_Flag
Select either 0 or 1, where 1=Active and 0=Disabled.
Enterprise_ID
The object identifier of the enterprise.
Number_of_Traps
Number of specific traps defined for this enterprise.
Example: Sample entry for [enterprise] section
[enterprise]
total=1
1=1,1.3.6.1.4.1.259,15
From the [enterprise] section, one can read the following information:
•
•
•
The entry defines a single enterprise (total=1)
The enterprise is active with object identifier equal to 1.3.6.1.4.1.259
This enterprise defines 15 traps
B-13
CUSTOMIZING ELITEVIEW
Specific Trap Sections
Each specific trap is defined in a section of its own. The section name takes the following format:
[Ent(n).(m)]
where:
(n)
is the sequence number of the enterprise
(m)
is the specific trap number
To edit specific traps:
1. Define trap message using the following format:
message=string
The string variable can be any character string with some components generated from the information in the
variable list. You can use variables in the form of %x, where x is any letter from a to z.
2. Define variables generated from trap messages using the following format:
x=Object_name,Symbol
The following table describes each item:
Table B-14 Trap Message Parameters
Parameter
Description
x=
Variable name, any letter from a to z.
Object_name
MIB object name defined in the MIB database.
Symbol
A symbol used to identify the use of a value or index in the object name.
• The variable binding uses the format object.instance (where instance is
the index of a table entry if a table is being referred to); and is equal to “0”
for single value variables.
• You can use the value of the variable, which is represented with “v” or
one of the indices.
• The indices are represented as a list of numbers. Long indices like the IP
address take four numbers. The format for indices is in, where n is a
positive number, e.g., i2
3. Define the event to trigger using the following format:
event=Active_Flag,Event_Name
The following describes each item:
B-14
INSIDE THE TRAP.INI FILE
Table B-15 Trigger Event Parameters
Parameter
Description
event=
The event to trigger.
Active_Flag
Select either 1 or 0; 1=Active, 0=Disabled.
Event_Name
Name of the event or trap to trigger.
Example: Sample of specific trap entry
[Ent1.1]
message=Temperature over 65 degrees
event=1,Trap
[Ent1.2]
message=Port auto-partitioned
event=1,Trap
[Ent1.3]
message=Port bad link
event=1,Trap
[Ent1.4]
message=Hub %b collision count over %a
event=1,Trap
a=groupTotalCollisions,v
b=groupTotalCollisions,i5
[Ent1.5]
message=Hub %b alignment error count over %a
event=1,Trap
a=groupFAEErrors,v
b=groupFAEErrors,i5
[Ent1.6]
message=Hub %b CRC error count over %a
event=1,Trap
a=groupCRCErrors,v
b=portCRCErrors,i5
[Ent1.7]
message=Port(%b,%c)length < 64 bits count over %a
event=1, Trap
a=portPygmys,v
b=portPygmys,i5
c=portPygmys,i6
B-15
CUSTOMIZING ELITEVIEW
[Ent1.8]
message=Port (%b, %c) CRC error count over %a
event=1, Trap
a=portCRCErrors, v
b=portCRCErrors,i5
c=portCRCErrors,i6
From the preceding example, you can view the following data:
•
•
•
•
•
B-16
There are 8 specific traps available for enterprise number 1.
All traps are active (event=1).
When a trap is activated, it will trigger a specified event called “Trap” and display the corresponding message
onscreen. Supposed trap number 4 is triggered [Ent1.4].
Trap number 4 contains the group variable TotalCollisions in its variable-bindings, which has 5 numbers.
Suppose that trap number 4 is triggered and the 5th number in the index of groupTotalCollisions is 2, and the
value of the variable is 20. The Event Manager will display the following message on screen: Hub 2 collision
count over 20.
APPENDIX C
SNMP ENVIRONMENT
EliteView uses Simple Network Management Protocol (SNMP), the most popular network management protocol.
SNMP was developed by the Internet Engineering Task Force (IETF) using the Internet Protocol (IP). SNMP was
originally designed to run on top of the UDP/IP transport protocol. EliteView currently supports transport
protocols including IP and IPX.
SNMP Roles
There are two defined roles in SNMP: manager and managed. The manager (EliteView) sends request messages and
the managed (device) sends responses and alarm messages.
SNMP uses a simple command-response style to request information or action. By sending a command to perform
an action, the manager is able to control the managed device. After the action is performed, the managed device
sends a response to indicate that the requested action has been completed.
Each command-response dialog is independent. The managed device does not maintain a “session” with the
manager.
Managing Data
Data in monitored devices are defined using the Management Information Base (MIB) model. Database
management functions are built into agent software using standard data structures. SNMP is based on the
“Concise MIB Definitions,” which are defined in RFC 1212.
C-1
SNMP ENVIRONMENT
Here is a portion of the EZ Stack 10 MIB:
EZ Stack-10 DEFINITIONS ::= BEGIN
IMPORTS
OBJECT-TYPE, Counter, TimeTicks ,IpAddress
FROM RFC1155-SMI;
IMPORTS
DisplayString
FROM RFC1213-MIB-II;
enterprises
OBJECT IDENTIFIER ::=
{ iso(1) org(3) dod(6) internet(1) private(4) 1}
smc OBJECT IDENTIFIER ::=
{ enterprises 202 }
hmBasicCapability
OBJECT IDENTIFIER ::= { smc 1}
hmSelfTestCapability
OBJECT IDENTIFIER ::= { smc 2}
hmPerfMonCapability
OBJECT IDENTIFIER ::= { smc 3}
hmAddrTrackCapability
OBJECT IDENTIFIER ::= { smc 4}
The MIB itself has a hierarchical structure, defining objects in a tree-like structure. Using this model, the entire
world can be defined from a single origin.
Objects
Real objects in the world of network management are variables that contain values. Data types may be numbers,
character strings or structures. New data types may be created by renaming existing data types, limiting the range of
values or structuring them using pre-defined methods. The SNMP MIB uses only a small portion of the data types
and structuring methods defined in ASN.1. See IETF documents RFC 1212 and 1213 for more information.
table.index notation
Objects are organized into tables. Each table represents a group of objects that may have multiple instances; for
example, the hrDeviceEntry table in the HR MIB contains values for device index, type, description, ID, status,
and errors. Each object has a set of values representing its operating status. While the “dotted” notation for the
hrDeviceEntry table is 1.2.6.1.36.2.1, the notation for the hrDeviceIndex field is 1.2.6.1.36.2.1.1. Multiple
instances in a table are identified by an index number.
C-2
OBJECTS
By definition, all single MIB variables have the index 0. Only numbers are used as indices; if other data types are
used as indices, then they are represented by a list of numbers separated by dots (also referred to as dotted-decimal
notation).
iso origin
All objects in the SNMP world begin with the object ISO, which has a unique identifier of 1. In other network
implementations, objects may begin with CCITT (2) or joint-ISO CCITT (3). Each object can be represented by
an object which can uniquely identify itself on the object tree. The notation starts with the root object and each
level represents its descendants.
Example: MIB-2 Identifier
The MIB-2 identifier is known as:
• iso.org.dod.internet.mgmt.mib2, or
• 1.3.6.1.2.1
All common network variables are defined below this object.
Example: A DOS Filename Analogy
For example, MS-DOS uses a hierarchical file naming structure. Initialization information is stored in the EV60
subdirectory. The full path name is:
C:\EV60\NETMGR.INI
which means that the file is:
•
•
•
Located on drive C
Directory is EV60
File name NETMGR.INI
The .INI extension indicates that the file follows the standard Windows convention for program initialization.
By comparison, the EV60.EXE file is an executable file and EV60.HLP is a help file for the EliteView program.
C-3
SNMP ENVIRONMENT
Branches
Some common branches to the iso origin include:
Table C-1 Branches to the iso Origin
Object Identifier
Numeric Identifier
iso.org.dod.internet.mgmt.mib2
1.3.6.1.1.2.1
iso.org.dod.internet.mgmt.private.enterprises
1.3.6.1.4.1
iso.org.dod.internet.mgmt.private.enterprise.smc
1.3.6.1.4.1.202
For example, SMC is assigned an identifier of 202 under “enterprise.”
C-4
APPENDIX D
TECHNICAL REFERENCES
Information about networking and protocols is available from RFC reports and industry-related documentation.
RFC Reports
The most comprehensive collection of networking information is a series of reports called Request for Comments
(RFC). Each RFC has a title and an RFC number, such as Internet Protocol, RFC-791. RFCs are all listed in an
index, titled rfc-index. The index is not definitive and titles do not always indicate the contents (for example,
RFC-1155 and RFC-1156 define SNMP requirements although SNMP is not mentioned in the title). To obtain one
or more RFCs on paper, contact the Network Information Center (NIC) at:
Government Systems, Inc.
Attn: Network Information Center
4200 Park Meadow Drive - Suite 200
Chantilly, VA 22021
Help desk:
Fax number:
e-mail:
1-800-365-3642 or 1-703-802-4535
(Hours: 7:00am to 7:00pm, Eastern Time)
1-703-802-8376
[email protected]
Managing Data
Data in monitored devices are defined using the Management Information Base (MIB) model. Database
management functions are built into agent software using standard data structures. SNMP is based on the
“Concise MIB Definitions,” which are defined in RFC 1212.
D-1
TECHNICAL REFERENCES
RFC Reports
Table D-1 RFC Reports: Networking Information
RFC Number
D-2
Title
Publisher/Year
RFC-768
User Datagram Protocol
SRI International, 1980
RFC-783
Trivial File Transfer Protocol (TFTP)
SRI International, 1981
RFC-791
Internet Protocol
SRI International, 1982
RFC-792
Internet Control Message Protocol
SRI International, 1980
RFC-793
Transmission Control Protocol
SRI International, 1981
RFC-854
Telnet Protocol
SRI International, 1980
RFC-1060
Assigned Numbers
SRI International, 1980
RFC-1033/103
Domain Name Protocol
SRI International, 1987
RFC-1042
A Standard for Transmission of IP Datagrams over IEEE 802 Networks
SRI International, 1988
RFC-1155
Structure and Identification of Management Information for TCP/
IP-based Internets
SRI International, 1990
RFC-1156
Management Information Base for Network Management of TCP/
IP-based Internets
SRI International, 1990
RFC-1157
SNMP
SRI International, 1990
RFC-1166
Internet Numbers
SRI International, 1990
RFC-1213
MIB-II
SRI International, 1991
RFC-1286
Definitions of Managed Objects for Bridges
SRI International, 1991
RFC-1298
SNMP over IPX
SRI International, 1992
RFC-1350
The TFTP Protocol
SRI International, 1992
RFC-1368
Definitions of Managed Objects for IEEE 802.3 Repeater Devices
SRI International, 1992
RFC-1420
SNMP over IPX
SRI International, 1993
RFC-1493
Definitions of Managed Objects for Bridges
SRI International, 1993
RFC-1514
Host Resource MIB
SRI International, 1993
RFC-1516
Definitions of Managed Objects for IEEE 802.3 Repeater Devices
SRI International, 1993
RFC-1525
Definitions of Managed Objects for Source Routing Bridges
SRI International, 1993
INDUSTRY-RELATED DOCUMENTATION
Industry-Related Documentation
Also refer to these industry-related documents:
•
•
The Ethernet: a Local Area Network, Data Link Layer and Physical Layer Specification Standard
(Digital-Intel-Xerox; also known as the Blue Book)
IEEE Std 802.2 - 1985 (ISO/DIS 8802.2)
IEEE Std 802.3 - 1985 (ISO/DIS 8802.3)
Internetworking with TCP/IP: Principles, Protocols, and Architecture, Vol. 1 (Douglas Comer, Prentice Hall,
1990)
D-3
TECHNICAL REFERENCES
D-4
APPENDIX E
PERFORMANCE TIPS
EliteView is a flexible network management platform that may be easily customized for your needs. Here are some
suggestions that will help your get the best performance from your system.
Optimize Your Computer System
√
Fast, local hard disk (< 8 ms access time).
√
High-resolution color display (minimum 1024x768).
√
Adequate memory (256 MB of memory if EliteView is used with other applications).
Windows works best with lots of memory.
Minimize Unnecessary Resources
√
Build submaps to show only the objects you need to manage.
√
If objects are not responding, stop monitoring them. (Even though a non-existent or non-responsive object
turns “red” on the map, EliteView will still monitor it, unless the Monitor option is turned off under the Add
Object or Modify Object selection under the Edit menu.)
√
Log data only as needed. The Log Manager is very obedient; if you want data reported every second for every
port on your switch, make sure you have a very large capacity hard disk.
Although EliteView is not a resource-intensive program, it can demand enormous amounts of RAM, hard disk
space and processor time if your events and data logs are set improperly.
E-1
PERFORMANCE TIPS
Other Tips
√
If you frequently use a certain map, set it as the default EliteView map.
√
Click on your right mouse button to show a context-sensitive menu of applicable commands. On larger
screens, this means you will not need to jump back-and-forth to the menu bar to access related commands.
√
Set passwords for your network maps. This guards against unauthorized access (turning ports on/off, clearing
counters, etc.).
√
Use an uninterruptible power supply (UPS) for your network switches (including the management unit) and
the network monitoring station. If power fails on the NMS running EliteView, any open data files may be
adversely affected.
√
Backup your EliteView directory on a regular basis.
Be sure to read your EliteView documentation for other tips and suggestions.
Managing Data
Data in monitored devices are defined using the Management Information Base (MIB) model. Database
management functions are built into agent software using standard data structures. SNMP is based on the
“Concise MIB Definitions,” which are defined in RFC 1212.
RFC Reports
Table E-1 RFC Reports: Managing Data
RFC Number
E-2
Title
Publisher/Year
RFC-768
User Datagram Protocol
SRI International, 1980
RFC-783
Trivial File Transfer Protocol (TFTP)
SRI International, 1981
RFC-791
Internet Protocol
SRI International, 1982
RFC-792
Internet Control Message Protocol
SRI International, 1980
RFC-793
Transmission Control Protocol
SRI International, 1981
RFC-854
Telnet Protocol
SRI International, 1980
RFC-1060
Assigned Numbers
SRI International, 1980
RFC-1033/103
Domain Name Protocol
SRI International, 1987
MANAGING DATA
Table E-1 RFC Reports: Managing Data
RFC Number
Title
Publisher/Year
RFC-1042
A Standard for Transmission of IP Datagrams over IEEE 802 Networks
SRI International, 1988
RFC-1155
Structure and Identification of Management Information for TCP/
IP-based Internets
SRI International, 1990
RFC-1156
Management Information Base for Network Management of TCP/
IP-based Internets
SRI International, 1990
RFC-1157
SNMP
SRI International, 1990
RFC-1166
Internet Numbers
SRI International, 1990
RFC-1213
MIB-II
SRI International, 1991
RFC-1286
Definitions of Managed Objects for Bridges
SRI International, 1991
RFC-1298
SNMP over IPX
SRI International, 1992
RFC-1350
The TFTP Protocol
SRI International, 1992
RFC-1368
Definitions of Managed Objects for IEEE 802.3 Repeater Devices
SRI International, 1992
RFC-1420
SNMP over IPX
SRI International, 1993
RFC-1493
Definitions of Managed Objects for Bridges
SRI International, 1993
RFC-1514
Host Resource MIB
SRI International, 1993
RFC-1516
Definitions of Managed Objects for IEEE 802.3 Repeater Devices
SRI International, 1993
RFC-1525
Definitions of Managed Objects for Source Routing Bridges
SRI International, 1993
E-3
PERFORMANCE TIPS
Industry-Related Documentation
Also refer to these industry-related documents:
•
•
E-4
The Ethernet: a Local Area Network, Data Link Layer and Physical Layer Specification Standard
(Digital-Intel-Xerox; also known as the Blue Book)
IEEE Std 802.2 - 1985 (ISO/DIS 8802.2)
IEEE Std 802.3 - 1985 (ISO/DIS 8802.3)
Internetworking with TCP/IP: Principles, Protocols, and Architecture, Vol. 1 (Douglas Comer, Prentice Hall,
1990)
APPENDIX F
SPECIFICATIONS
EliteView is designed to manage any workgroup using the SNMP network management protocol.
Product Overview
•
Event-driven, scalable, modular architecture
•
Heterogeneous device management with discovery
•
Object-oriented, Microsoft® Windows® 95, 98, NT, 2000, XP or Vista application with menus-on-demand,
drag-and-drop icons and MDI (multiple document interface)
•
Share information with Windows Clipboard and dBASE®-compatible files
Table F-1
Product Overview
EliteView
Architecture
Open platform
Permits addition of user-designed management modules
Scalable, modular design
Over 20 modules
User Interface
Microsoft Windows
Windows 95, 98, 2000, XP, Vista
Windows NT 3.5x, 4.0
Menus-on-demand
Brings up floating menus with one click of (secondary) right mouse
button
Drag-and-drop icons
Move icons to any map view (lockable)
Supports MDI (Multiple Document
Interface)
Allows users to open several submaps simultaneously and view individual
numeric or graphic display for processor or network interface statistics
Hot keys
Short cut keystrokes invoke certain actions; Press <INS> to add object;
Press <Del> to delete object; <F1> for on-line help
User-definable icons
Choose any Windows metafile (BMP) graphic images
F-1
SPECIFICATIONS
Table F-1 Product Overview
EliteView
Performance Management
Tune network for optimum performance
Selectable statistical polling intervals
Traffic filters
Data value, date, time with comparison operators (<, >, <=, >=, ==, !=)
and logic operators (AND, OR)
Quantify and graph network throughput
Quantify any MIB value (SNMP or private).Real-time scalable graphics
support for SMC products
Record network activity in database to plan
future growth
View database directly or with third-party application
Fault Management
Network status
Device Up, Connection Lost, and Trap
Detect errors
Isolates problem down to system device
Prioritized error log
User-definable
User-definable events and actions
Any one or more of these actions: Audible Signal, Show Message, Run
Program, Report, and Write Into Database
Record network errors in database to
anticipate future problems
View database directly or with third-party application
ICMP station response diagnostic
Interactive diagnostic
Inventory and Configuration Management
Hierarchical network map
Unlimited levels
Manage heterogeneous devices
Manages all SMC adapters. Also manages non-SMC SNMP products with
SNMP MIB
SNMP MIB tree browser
Interactive browser with SET, GET and GET NEXT commands
Database of network devices
Catalogs any SNMP variable for any device
Resource and Load Management
Print detailed and summary reports
F-2
Interactive compilation of station reports with time stamp.Print or
transfer to any word processor or spreadsheet.
PRODUCT OVERVIEW
Table F-1
Product Overview
EliteView
Data Transfer
Integrated, relational database
Number of records limited only by disk space*
File format compatibility
dBASE IV
Maximum number of nodes
Limited only to disk space*
Transfer with Windows Clipboard
Print or transfer to any word processor or spreadsheet
System Requirements
Software
Microsoft Windows 95, 98, 2000, XP, NT4.0
Hardware (minimum)
PC with Pentium-133 CPU or equivalent and 32 MB memory, 3.5-inch
floppy drive and hard drive, VGA adapter and display, mouse, network
adapter
Hardware (recommended)
PC with 1.6 GHz Pentium IV or better, local hard disk with a minimum
of 40 MB free disk space, SVGA color monitor with accelerated video
adapter, minimum 256 MB of memory (RAM)
* Disk space required to install EliteView is about 30 MB using a local or network hard disk. User files (network map, data logs, etc.) will vary depending
on your network configuration and statistical tracking requirements.
F-3
SPECIFICATIONS
F-4
APPENDIX G
CODEBASE 6.0 DLL
SUB-LICENSE AGREEMENT
This section contains a statement of agreement between Sequiter Software Inc. and the CodeBase 6.0 LICENSEE
(SMC) concerning sub-licensing (specifically for software used in the file C4DLL.DLL). All the terms and
conditions in this agreement are imposed upon the CodeBase 6.0 DLL SUB-LICENSEE (i.e., the party purchasing
the software described in this manual).
This legal document is an agreement between you, the CodeBase 6.0 DLL SUB-LICENSEE, and the CodeBase
6.0 LICENSEE (hereinafter referred to as the “Agreement”).
You are not being “sold” any Sequiter Software Inc. software. Instead, you are being granted the right to use
Sequiter Software Inc. software through this license agreement. Sequiter Software retains all ownership of its
software including all copies of its software.
1. Definitions
Software
This is the Sequiter Software Inc. computer programs contained in the CodeBase 6 software package or any
computer programs containing parts of the computer programs in this package. These programs could be in any
form: in print, as electronic source code, as compiled object modules, as a library file, a dynamic link library, or an
executable program.
Executable Software
This is a form of the Software which can be executed by DOS, Microsoft Windows or OS/2 software packages.
Distributable Software
This is the Executable Software except for the CodeReporter executable program.
DLL Software
This is a dynamic link library form of the Software which is executed indirectly under DOS, Microsoft Windows or
OS/2 software packages. It includes Microsoft Windows and OS/2 dynamic link library forms of the software. For
the purpose of this license agreement, other forms of the Software which are executed indirectly, such as the an
AutoCad “.EXP” form of the Software, are also considered to be DLL Software.
G-1
CODEBASE 6.0 DLL SUB-LICENSE AGREEMENT
2. Sub-License
You may use the DLL Software with, and only with, the Distributable Software provided by the CodeBase 6
LICENSEE. You may not use the DLL Software for any other purpose. Specifically, you agree not to use the DLL
Software for the purposes of developing or creating Executable Software.
3. Transfer Restrictions
The DLL Software is sub-licensed to you, and may not be transferred to anyone without the prior consent of the
CodeBase 6.0 DLL LICENSEE. Any authorized transferee of the sub-license shall be bound by the terms of this
agreement.
4. Disclaimer
The DLL Software is provided “as is” without any kind of warranty. It is your responsibility to determine whether
the DLL Software is suitable for your purpose.
5. Miscellaneous
This agreement is governed by the laws of the Province of Alberta, Canada. The CodeBase DLL SUB-LICENSE
consents to jurisdiction in the province of Alberta, Canada.
G-2
APPENDIX H
TROUBLESHOOTING
This section summarizes the most common error messages generated by EliteView.
EliteView Map: Icon Stays Red
Symptoms
1. When a map is opened, the icon(s) stay red.
2. When an object is added, the icon stays red.
Possible Causes
EliteView cannot communicate with the device. When a device does not respond within the Retries limit, the
device is assumed to be off-line and the “Connection Lost” event is announced. The icon turns red; and EliteView
continues polling for a response. EliteView will continue polling for responses (unless the Monitor option is
turned off in the Add Object or Modify Object selections under the Edit menu).
Suggestions
1. There may be a problem with the device driver or network cabling used on the Network Management Station
(NMS). Use a hardware or software network test utility to verify that the NMS can receive network traffic.
2. Verify the IP address of the object.
3. Probe the concerned device with the Alive Test. If it responds to this query but not to EliteView, check the
community setting for the device.
4. Check the Retries and Timeout values of the object.
H-1
TROUBLESHOOTING
Distributable Software
Symptom
Discovery does not find any devices.
Possible Causes
1. EliteView network management station (NMS) may be using an IP address that is used by another device.
2. There may be a cabling problem.
Suggestions
1. Try changing the address of the EliteView NMS.
2. If EliteView is running, you should see a trap and an alarm indicating that a device has been restarted. From
the Alarm Log, copy the IP address into the search criteria and attempt to discover this node. If the node still
cannot be located, check for cabling or other logical problems.
Trap Manager: MIB Variable Not Found
This agreement is governed by the laws of the Province of Alberta, Canada. The CodeBase DLL SUB-LICENSE
consents to jurisdiction in the province of Alberta, Canada.
Symptom
Running Trap Manager shows this error message.
Possible Causes
1. The specified variable does not exist in the MIB database.
2. The MIB database has been changed.
Suggestions
Verify that the specified variable does exist in the MIB database.
H-2
APPENDIX I
ERROR MESSAGES
The error messages related to the overall EliteView platform are described in this appendix. Error messages
relating to specific network devices are listed in the corresponding EliteView manual. The following error
messages are sorted by program module. First match the error message’s label with the module name in this
appendix, and then look up the error message in alphabetical order.
EliteView
A device should have three bitmap files in [bitmap] section of NETMGR.INI.
Cause: The number of bitmap files for a device is incorrect.
Action: Check the [bitmap] section of NETMGR.INI.
A submap should have two bitmap files in [bitmap] section of NETMGR.INI.
Cause: The number of bitmap files for a submap is incorrect.
Action: Draw two bitmap files for a submap object.
Bitmaps for a device should have the same size.
Cause: Some bitmap files for a device are not the same size.
Action: Redraw the bitmap and make its size equal to other bitmaps.
Cannot find toolbar bitmap.
Cause:Toolbar bitmap does not exist.
Action: Draw a new bitmap for the missing item.
Cannot load xxx file.
Cause: Cannot load xxx file as background bitmap.
Action: Choose another bitmap file.
Cannot move a submap to its child.
Cause: An attempt was made to move a submap to its child map.
Action: This operation not permitted.
I-1
ERROR MESSAGES
Cannot open submap window.
Cause: File may be corrupt.
Action: Recreate a new map file.
Cannot read bitmap file.
Cause: The bitmap file defined in the [bitmap] section of NETMGR.INI may be corrupt.
Action: Recreate the bitmap file.
Cannot read bitmap file for submap.
Cause: The bitmap file of a submap object may be corrupt.
Action: Recreate the bitmap file for the submap.
Cannot run the program (xxx)
Cause: File xxx may be corrupt or does not exist.
Action: Reinstall the concerned file.
Create file error (xxx)
Cause: Create file xxx operation failed.
Action: Check disk space.
[device] section error in NETMGR.INI.
Cause: The format of a device entry in the [device] section of NETMGR.INI is invalid.
Action: Check the [device] section of NETMGR.INI.
Invalid filename.
Cause: The file containing default settings may be corrupt or does not exist.
Action: Change the default setting.
Invalid format for [tools] or [util] in NETMGR.INI.
Cause: Bad format in [tools] or [util] section.
Action: Check the [tools] or [util] section of NETMGR.INI.
Invalid old password.
Cause: Incorrect old password.
Action: Input correct old password.
Invalid or duplicate device name in NETMGR.INI.
Cause: A device name defined in the [device] section of NETMGR.INI is duplicated or invalid.
Action: Check the [device] section of NETMGR.INI.
I-2
ELITEVIEW
Invalid password.
Cause: Incorrect password.
Action: Type correct password.
Invalid polling interval.
Cause: The specified value is out of range.
Action: The value for the polling interval must be greater than 1 and less than 86400.
Invalid retries value.
Cause: The specified value is out of range.
Action: The value for retries must be greater than 1 and less than 1000.
Invalid target address.
Cause: The address format is incorrect for the current protocol.
Action: Change to the correct address format for the current protocol.
Invalid timeout value.
Cause: The specified value is out of range.
Action: The value for timeout must be greater than 1 and less than 86400.
Link file is corrupt.
Cause: The connection information between objects is corrupt.
Action: Recreate the map file.
Map file and link file mismatch.
Cause: File may be corrupt.
Action: Recreate the map file.
Map file is corrupt.
Cause: File is corrupt.
Action: Recreate the map file.
No protocol available, program terminates ....
Cause: None of the protocol drivers can be loaded.
Action: Check the system environment.
The toolbar bitmap size of xxx is not the same as others.
Cause: The size of the bitmap file xxx is not the same as other toolbar bitmap files.
Action: Redraw the bitmap.
I-3
ERROR MESSAGES
The (total) for [tools] or [util] in NETMGR.INI cannot be 0.
Cause: The total value in the [tools] or [util] section is 0
Action: Include at least one item in the [tools] or [util] section.
Write file error (xxx)
Cause: Write file xxx failed.
Action: Check disk space.
BOOTP Server
Create Dialog windows not successful.
Cause: May be out of memory.
Action: Close some applications and try again.
database NULL!!
Cause: The record or variable cannot be found in the database.
Action: Check the database files BOOTP.DBF and BOOTP.DBT; and delete them if necessary.
database MEMO field error!!
Cause: database error.
Action: Check database files.
database Tagname error!!
Cause: database error.
Action: Check database files.
Input parameter invalid!!
Cause: Input parameters are not correct.
Action: Retype the parameters.
Invoke toolbar not successful.
Cause: May be out of memory.
Action: Close some applications and try again.
Open database error!!
Cause: Open database file failed.
Action: See if the database file exists; or check that hard drive is OK.
I-4
BOOTP.DLL
Out of memory!!
Cause: Out of memory.
Action: Close some applications and try again.
Out of Memory for allocation.
Cause: Out of memory.
Action: Close some applications and try again.
Record not Found!!
Cause: The input parameter cannot be found in the database.
Action: Check database files.
Write file error!!
Cause: Write to hard drive error.
Action: Delete some files for more space.
BOOTP.DLL
Bind to UDP socket failed with error code = %d!
Cause: Bind Socket fail. Error code comes from function bind( ) of WinSocket specification.
Action: Check the network subsystem by error code.
Call WSAStartUp( ) function failure!
Cause: Call WsaStartup fail, with unknown error code.
Action: Check the version of winsock.dll.
Cannot allocate callback routine.
Cause: Out of Memory.
Action: Close some applications and retry, or restart windows.
Cannot run BTPIFM.EXE. or Cannot run BTPIFM.EXE with error code %d.
Cause: Initial BOOTP.DLL error; may be out of memory.
Action: Close some applications and retry, or restart windows. The error code comes from the SDK WinExec( )
API function.
I-5
ERROR MESSAGES
Cleanup WinSocket failed with error code %d when exiting BTPIFM.EXE!
Cause:The Unregister operation from winsock.dll failed. The error code should refer to the WSACleanup( )
function in the WinSocket specification.
Action: Check the network subsystem by error code.
Close socket failed with error code %d when exiting BTPIFM.EXE!
Cause: Attempt to close the socket BOOTP failed. This error code comes from the function closesocket( ) in the
WinSocket specification.
Action: Check the network subsystem by error code.
Enable receive broadcast frame error with error code %d.
Cause: ENABLE receive broadcast option error. Assigned error code comes from the function setsockopt( ) in
the WinSocket API.
Action: Check the network subsystem by error code.
Get bootp service info error.
Cause: The error code comes from the function getservbyname( ) of the WinSocket specification.
Action: Check the network subsystem by error code.
Got FD_READ message, but got length error with error code %d.
Cause: Received a packet, but the network subsystem cannot report the length. The error code comes from the
function ioctlsocket( ) of WinSocket API.
Action: Check the network subsystem by error code.
Memory allocation is not successful.
Cause: Out of memory.
Action: Close some applications and retry, or restart windows.
No Usable WinSock.dll found.
Cause: The Call WsaStartup failed with an unknown error code.
Action: Check the version of winsock.dll.
Open UDP Socket failed with error code = %d!
Cause: The Open Socket operation fail. The error code comes from the function socket( ) of the WinSocket API.
Action: Check the network subsystem by error code.
I-6
BOOTP.DLL
Send packet failed with error code %d.
Cause: The network subsystem is unable to send a packet. The error code comes from the function sendto( ) in the
WinSocket specification.
Action: Check the network subsystem by error code
Setup receive message error with error code = %d.
Cause: Cannot setup a Windows message for received frames. The error code comes from the WSASelect( )
function in the WinSocket specification.
Action: Check the network subsystem by error code.
The BOOTP application is installed.
Cause: BOOTP.DLL only supports the BOOTP Server application.
Action: Never use two BOOTP Server applications.
The network subsystem is not ready!
Cause: The TCP/IP stacks for the platform may not be ready.
Action: Check your WinSocket environment setting.
The version of winsock.dll should at least support ver. 1.1
Cause: The version of winsock.dll is too old.
Action: Upgrade the TCP/IP stacks platform.
The windows socket’s version specified by the application is not supported by this winsock.dll!
Cause: The version of winsock.dll did not match the requirement of BOOTP.DLL.
Action: Change TCP/IP stacks and winsock.dll.
Windows socket version %d.%d required, but not supported by winsock.dll.
Cause: The version of winsock.dll did not match the requirement of BOOTP.DLL.
Action: Change the TCP/IP stacks and winsock.dll.
Winsock.dll was not able to support the minimum number of sockets BOOTP module required.
Cause: Too many WinSocket applications are running.
Action: Close some WinSocket applications and retry.
I-7
ERROR MESSAGES
Discovery
Cannot find %%%%%%% or this bitmap file has problem!
Cause: The bitmap file %%%%%%% is missing or the format is not correct.
Action: Get the correct file of %%%%%%%.
Cannot find IP general node in [device] section of NETMGR.INI.
Cause: No IP general node information in NETMGR.INI.
Action: Use a text editor to add it.
Cannot find IPX general node in [device] section of NETMGR.INI.
Cause: No IPX general node information in NETMGR.INI.
Action: Use a text editor to add it.
Cannot find IPX Server device in [device] section of NETMGR.INI.
Cause: No IPX Server general node information in NETMGR.INI.
Action: Use a text editor to add it.
Cannot find SNMP general node in [device] section of NETMGR.INI.
Cause: No SNMP general node information in NETMGR.INI.
Action: Use a text editor to add it.
Create Dialog windows not successful.
Cause: The main windows of discover.exe cannot be successfully created.
Action: Close other applications and try again.
Create status window not successful.
Cause: May be out of memory.
Action: Close some applications and try again.
Dump all ETHERNET objects to namebase failed.
Cause: Write to hard drive failed.
Action: The hard drive space may not be enough.
Dump all IPX objects to namebase failed.
Cause: Write to hard drive failed.
Action: The hard drive space may not be enough.
I-8
DISCOVERY
Dump all UDP objects to namebase failed.
Cause: Write to hard drive fail.
Action: The hard drive space may not be enough.
Dump function cannot work when searching for objects.
Cause: Dump function can only work when Discover is busy.
Action: Wait until the search job is complete.
Initial namebase failure.
Cause: Name database files have a problem.
Action: Use name database manager to verify.
Invoke alive test program failed with error reason code = %d.
Cause: The error code comes from the return code of SDK’s function WinExec.
Action: Refer to the Microsoft SDK function reference.
Invoke MESSAGE.DLL failed!
Cause: This program may not have quit successfully last time.
Action: Quit Windows and test again.
Invoke toolbar not successful.
Cause: Create toolbar window failure.
Action: Close other applications and try again.
IPX Diagnostic Service Socket open failure.
Cause: The network sublayer has a problem.
Action: Use the alive test program to verify.
No bitmap file information in [bitmaps] of NETMGR.INI.
Cause: Cannot find any bitmap file information in NETMGR.INI.
Action: Use a text editor to edit NETMGR.INI.
No device information in [device] of NETMGR.INI.
Cause: Cannot find any device information in NETMGR.INI.
Action: Use a text editor to edit NETMGR.INI.
None of the protocols are enabled, please use network setup to configure again.
Cause: The record in NETMGR.INI is not correct.
Action: You should enable at least one protocol; use the network setup program to configure again.
I-9
ERROR MESSAGES
None of the SNMP/UDP or SNMP/IPX protocols work!
Cause: All protocols supported by discover.exe are not working.
Action: Check to see if your network subsystem is OK.
Not enough memory to allocate channel parameter structure.
Cause: Out of memory.
Action: Close some applications and try again.
Not enough memory to allocate for IPX packet data.
Cause: The memory is not enough.
Action: Close some applications and retry.
Open ICMP channel failure.
Cause: The ICMP network sublayer has failed.
Action: Memory may not be enough. Otherwise, use the alive test program to verify network status.
Open IPX channel failure. IPX protocol will be disabled!
Cause: The IPX network sublayer has a problem or has returned a NULL IPX address.
Action: Restart Windows or start another ELITEVIEW SNMP or IPX application first.
Open SNMP/IPX channel failure.
Cause: The SNMP or IPX network sublayer has failed.
Action: Retstart Windows and retry.
Open SNMP/UDP channel failure.
Cause: UDP/IP network sublayer has failed.
Action: Use the alive test program to verify the ELITEVIEW platform. If based on a third-party vendor’s
platform, make sure it is OK.
Search for MIB object not successful.
Cause: Cannot find the sysObjectID variable in the MIB database.
Action: Make sure the MIB database contains MIB II information.
The autosave= entity of [discover] in NETMGR.INI is not correct!
Cause: The content of autosave= entity is not correct; it should be ON or OFF.
Action: Use a text editor to edit NETMGR.INI.
I-10
DISCOVERY
The ipnode= entity of [discover] in NETMGR.INI is not correct!
Cause: The content of ipnode= entity is not correct; it should be ON or OFF.
Action: Use a text editor to edit NETMGR.INI.
The ipxnode= entity of [discover] in NETMGR.INI is not correct!
Cause: The content of ipxnode= entity is not correct; it should be ON or OFF.
Action: Use a text editor to edit NETMGR.INI.
The nwserver= entity of [discover] in NETMGR.INI is not correct!
Cause: The content of nwserver= entity is not correct; it should be ON or OFF.
Action: Use a text editor to edit NETMGR.INI.
The path= entity of [bitmaps] in NETMGR.INI is not specified.
Cause: Cannot find the path information for bitmap files.
Action: Use a text editor to edit NETMGR.INI.
The protocol= entity of [discover] in NETMGR.INI is not supported.
Cause: The content of protocol= entity is not correct; should be UDP, IPX or ETHERNET.
Action: Use a text editor to edit NETMGR.INI.
The retry value should be in the range of 1 to 10!
Cause: The retry value is out of range.
Action: Use a text editor to edit NETMGR.INI.
The scan value should be in the range of 1 to 10!
Cause: The scan value is out of range.
Action: Use a text editor to edit NETMGR.INI.
The total= entity of [device] in NETMGR.INI is not specified.
Cause: The total= entity must be specified.
Action: Use a text editor to edit NETMGR.INI.
The value of repoll in NETMGR.INI is not in the range of 1 to 10!
Cause: The repoll value is out of range.
Action: Use text editor to edit NETMGR.INI
There are two nodes with the same IP address - %%!
Cause: An IP address has been duplicated.
Action: Write down the MAC addresses for troubleshooting.
I-11
ERROR MESSAGES
Event Manager
Out of memory.
Cause: Not enough memory.
Action: Close some applications and retry.
Write Error! Event disabled
Cause: Disk full.
Action: Free up some disk space and try again
ICMP.DLL
The following error messages may occur when running EliteView under a WinSocket platform.
Bind ICMP.DLL to ICMP socket failed with error code = %d!
Cause: The Bind Socket operation failed. Error code comes from the function bind( ) of the WinSocket
specification.
Action: Check the network subsystem by error code.
Call WSAStartUp of Winsock.dll failed.
Cause: The WSAStartUp operation failed, but with no error code.
Action: Check the network subsystem.
Cannot allocate callback routine.
Cause: Out of memory.
Action: Close some applications and retry, or restart Windows.
Cannot run ICMPIFM.EXE - error code %d.
Cause: An error occurred initializing ICMP.DLL; you may be out of memory. The error code comes from the
WinExec( ) function in the Windows SDK.
Action: If memory is not enough, close some applications and retry, or restart Windows. Otherwise take the action
indicated by the error code.
Cleanup WinSocket failed with error code %d!
Cause: the Unregister operation from winsock.dll failed. The error code refers to the WSACleanup( ) function in
the WinSocket specification.
Action: Check the network subsystem by error code.
I-12
ICMP.DLL
Cleanup WinSocket failed with error code %d when exiting ICMPIFM.EXE!
Cause: The Unregister operation from winsock.dll failed. The error code refers to the WSACleanup( ) function in
the WinSocket specification.
Action: Check the network subsystem by error code.
Close icmp socket failed with error code = %d when exiting ICMPIFM.EXE!
Cause: The Close socket operation failed. This error code comes from function closesocket( ) in the WinSocket
specification.
Action: Check the network subsystem by error code.
Enable receive broadcast frame error - error code %d.
Cause: Enable receive broadcast option error. The assigned error code comes from the function setsockopt( ) in
the WinSocket API.
Action: Check the network subsystem by error code.
Get protocol information failed for icmp.
Cause: The error code comes from the function getservbyname( ) of the WinSocket specification.
Action: Check the network subsystem by error code.
Got FD_READ message, but got length error - error code %d.
Cause: Received a packet, but the network subsystem cannot report the length. The error code comes from the
function ioctlsocket( ) of the WinSocket API.
Action: Check the network subsystem by error code.
ICMP communication channel has terminated.
Cause: This is an internal error of the application program.
Action: Please contact SMC Technical Support for help.
Memory allocation is not successful.
Cause: Out of memory.
Action: Close some applications and retry, or restart Windows.
No Usable WinSock.dll found.
Cause: The WinSocket network subsystem has failed.
Action: Check the network subsystem.
I-13
ERROR MESSAGES
Open RAW Socket failed with error code = %d!;
Cause: The Open Socket operation failed. The error code comes from the function socket( ) of the WinSocket
API.
Action: Check the network subsystem by error code. Make sure your platform supports the optional RAW Socket.
Receive frame for socket %d. Not for ICMP socket %d.
Cause: A Receive process error in winsock.dll.
Action: Check the network subsystem.
Send request failed with error code = %d.
Cause: The network subsystem has failed. The error code comes from the function sendto( ) in the WinSocket
specification.
Action: Check the network subsystem by error code.
Setup receive message error - error code = %d.
Cause: Cannot setup a Windows message for receive frames. The error code comes from the WSASelect( )
function in the WinSocket specification.
Action: Check the network subsystem by error code.
The application of session number does not exist.
So, the program cannot close communication channel.
Cause: This is an internal error of the application program.
Action: Please contact SMC Technical Support for help.
The network subsystem is not ready!
Cause: The network subsystem may not be the correct platform.
Action: Check for errors in platform.
The protocol stack is saturated.
Cause: The ICMP module cannot process applications at a high layer than your setting.
Action: Modify ProtocolStack in the [icmp] section of the network configuration file network.ini.
The session number of application is duplicate.
Cause: Another client application has the same Windows handle registered to ICMP.DLL.
Action: May have a program error; restart Windows and retry.
I-14
IPX.DLL
The slot is saturated.
Cause: Too many client applications of ICMP.DLL are running.
Action: Close some client applications of ICMP.DLL and retry.
The windows socket’s version specified by application is not supported by this winsock.dll!
Cause: The version of winsock.dll did not match the requirements of ICMP.DLL.
Action: Change the TCP/IP stacks and winsock.dll.
The winsock.dll should at lease support version 1.1
Cause: The version of winsock.dll is too old.
Action: Upgrade the TCP/IP stacks platform.
Windows socket version %d.%d required, but not supported by winsock.dll.
Cause: The version of winsock.dll did not match the requirements of ICMP.DLL.
Action: Change the TCP/IP stacks and winsock.dll.
Winsock.dll not able to support the minimum number of sockets required by ICMP module.
Cause: Too many WinSocket applications in use.
Action: Close some WinSocket applications and retry.
IPX.DLL
See ICMP.DLL
Log Manager
Duplicate LOG event.
Cause: Requested LOG event is a duplicate.
Action: Provide a unique key including a MIB variable label, target node address, and index.
Invalid filter.
Cause: Incorrect filter format.
Action: Refer to the filter formula section in Chapter 7 of this User’s Guide.
Invalid threshold.
Cause: Incorrect threshold format.
Action: Refer to threshold formula section in Chapter 7 of this User’s Guide.
I-15
ERROR MESSAGES
Invalid start time.
Cause: The specified time is incorrect.
Action: The format for time is (MMDDYYHHMM) where MM is month, DD is day, YY is year, HH is hour, and
MM is minute.
Invalid stop time.
Cause: The specified time is incorrect.
Action: The format for time is (MMDDYYHHMM) where MM is month, DD is day, YY is year, HH is hour, and
MM is minute.
LOG database is corrupt.
Cause: The database file is corrupt.
Action: Recreate the database file.
MESSAGE.DLL
The following are error messages that may be generated by any module.
Invalid number.
Cause: Invalid number for polling interval, timeout or retry.
Action: Enter a valid number.
Invalid target address.
Cause: You input an invalid target address.
Action: Enter a correct target address.
Number out of range. (1 <= N <= 1000)
Cause: The number is out of range for “retry.”
Action: Enter a valid number.
Number out of range. (1 <= N <= 86400)
Cause: The number out of range for “polling interval” or “timeout.”
Action: Enter a valid number.
I-16
MIB BROWSER
MIB Browser
Cannot create MIB tree window.
Cause: May be out of memory.
Action: Close other windows and create the MIB tree window again
Cannot create new output file.
Cause: The file already exists or the disk is full.
Action: Specify another filename or skip this action.
Cannot create statistics window.
Cause: Cannot create a statistics window.
Action: Close other statistics windows
Cannot create Toolbar.
Cause: Out of memory.
Action: Close other programs and restart the MIB Browser, or continue without using the toolbar.
Cannot load accelerators.
Cause: Out of memory.
Action: Close other programs and restart the MIB Browser, or continue without accelerators.
Cannot open file.
Cause: The file does not exist.
Action: Verify that you have specified the correct path and filename.
Cannot open SNMP session.
Cause: There are too many sessions or a lower layer (SNMPAPI.DLL) crashed.
Action: Close other windows based on SNMPAPI.DLL, or reset the computer and restart Windows.
Cannot read file.
Cause: Cannot read a text file from disk.
Action: Verify that the correct file was specified, or recreate the file.
Cannot write data to output file.
Cause: Disk full.
Action: Free up disk space and try again.
Index variable(%s) listed in the INDEX clause of %s not found in MIB database.
I-17
ERROR MESSAGES
Cause: The index variable(s) listed in the entry variable cannot be found in the MIB database.
Action: Load MIB file which contains the index variable(s) into the MIB database
Invalid object type. It must be COUNTER, INTEGER, GAUGE or TIMETICKS.
Cause: Invalid object type.
Action: Object type must be COUNTER, INTEGER, GAUGE or TIMETICKS.
Line xxx: Bad Record.
Cause: A bad record found in line xxx.
Action: None. (The record will not display in the list box.)
Line xxx: Invalid value will be discarded.
Cause: An object in line xxx has an invalid value.
Action: None. (The invalid value will be discarded and given a default value.)
No SNMP Request.
Cause: Improper command sequence.
Action: Perform SNMP Get, Set or GetNext before action (pause, resume or delete).
Next object not under current subtree.
Cause: The SNMP GetNextRequest cannot display the next subtree in the current window.
Action: Create another subtree (“Tree/Subtree” menu) which contains the object and perform the SNMP
GetNextRequest again.
Object not found.
Cause: Specified object not found in MIB database.
Action: Specify exact object label or object ID again, or load the MIBs file into the MIB database.
Out of memory (UpTree).
Cause: There is not enough memory to expand the MIB tree.
Action: Close other MIB tree windows or collapse some subtrees.
Polling interval must not be less than timeout.
Cause: The polling interval must not be less than the timeout.
Action: Modify the value for the polling interval or timeout.
Root node not found.
Cause: (In MIB tree window) Specified root object not found in the MIB database.
Action: Add a new MIB that contains the required object into the MIB database.
I-18
MIB COMPILER
SNMP GetRequest Error.
Cause: Lower layer (e.g., SNMPAPI.DLL) cannot build the SNMP GetRequest.
Action: Please contact SMC Technical Support for help.
SNMP GetNextRequest Error.
Cause: Lower layer (SNMPAPI.DLL) cannot build the SNMP GetNextRequest.
Action: Please contact SMC Technical Support for help.
SNMP SetRequest Error.
Cause: Lower layer (SNMPAPI.DLL) cannot build the SNMP SetRequest.
Action: Please contact SMC Technical Support for help.
The object has no index.
Cause: Object appended with an invalid index. (i.e., index = “.0”)
Action: None.
MIB Compiler
Cannot open response file: “filename”
Cause: The file cannot be found.
Action: Verify the filename.
Could not initialize virtual memory manager.
Cause: Out of memory.
Action: Close other application(s); or reconfigure system files (e.g., autoexec.bat and config.sys), reboot the system
and try again.
DATABASE corrupted.
Cause: MIB database error.
Action: Rebuild the MIB database.
%s has already been imported.
Cause: A duplicate MIB Name has been found in line xxx of the “mib_file.”
Action: If they are different MIB modules, rename one of the modules, and then compile it into the database. If
they are the same, reload the latest module, and compile the new MIB.
Trap error.
I-19
ERROR MESSAGES
Cause: Trap defined in MIB file is invalid.
Action: Fix trap definition and recompile.
Object list is not a tree.
Cause: You did not define or import some needed nodes.
Action: Check all undefined node or syntax listed in the import list, fix any errors, and recompile.
The parser had an error.
Line: %d
Message: %s
Cause: MIB macro clause has some errors. You may have forgotten to define some mandatory groups.
Action: Check the MIB definition, fix any errors, and recompile.
Node “%s” syntax is undefined in the file and syntax database.
Cause: You defined a node with invalid syntax.
Action: Check the node’s syntax clause, fix it, and then recompile.
%s, %s ... defined in module %s could not be found. Please import this module first.
Cause: The MIB you are compiling is trying to import a node or syntax from another MIB.
Action: Compile the required MIB first.
Error happened in merge tree node.
Cause: MIB Compiler cannot merge the current MIB file into the database.
Action: Check the MIB file definition.
Syntax node “%s” is undefined both in the MIB file and the syntax database.
Cause: You used undefined syntax in the node definition.
Action: Check the syntax in the MIB file, fix any errors, and import it in the import list.
%s near line %d has an invalid subidentifier
Cause: Variable has a bad node subidentifier in line xxx.
Action: Correct the node subidentifier and compile again.
%s near line %d has a duplicated node in the MIB file.
Cause: The variable is duplicated in line xxx.
Action: Rename the variable and compile again.
ACCESS %s in %s near line %d is unknown.
I-20
MIB COMPILER
Cause: The ACCESS clause of a variable has an invalid value in line xxx.
Action: Correct it and compile the MIB file again.
Status “%s” in %s near line %d is unknown
Cause: The STATUS clause of a variable has an invalid value in line xxx.
Action: Correct it and compile the MIB file again.
MIB Compiler cannot decide object identifier of “%s” near line %d.
Cause: Cannot find the parent of a node (variable).
Action: Correct the node definition and compile again.
Merge Tree Error.
Cause: Some ancestor node(s) cannot be found for new_variable in line xxx.
Action: Correct the node definition and compile again.
%s near line %d is a self-defined identifier.
Cause: An improper node definition.
Action: Correct it and compile again.
Error: Peers with the same ID (node1 = node2 = subidentifier)
Cause: The subidentifiers of node1 and node2 are the same.
Action: Correct them and compile again.
%s in MIB database and %s in MIB file have the same object identifier but different name.
Cause: The object identifiers of new_node and old_node are the same.
Action: Correct them and compile again.
The lexical analyzer could not recognize the token.
Line: %d
Message: %s
Cause: Unacceptable character in MIB field.
Action: Check MIB file and fix it.
Warning: MIB Compiler cannot find the import node “%s” in the database. But it found a node with the
same name in the module “%s”. Do you want to continue.
I-21
ERROR MESSAGES
Cause: In an MIB file, an import node is composed by name-module pair. If this warning has happened, it means
the exact (name, import module name) can not be found in the MIB database, but another node with the same
name but a different module name (name, different module name) exists in database.
Action: If you continue to process this MIB file without importing the correct one, errors may occur. You should
import the correct MIB list in the import list first.
Index “%s” is not defined in the database or MIB file.
Cause: The MIB Compiler cannot find the referenced index node in the database.
Action: You should check if the index is defined in other MIBs. If yes, add the MIB in the import list. Otherwise,
you should define the index node first.
MIB.DLL
Cannot find any traps for the MIB module.
Cause: No traps in the MIB database.
Action: None.
Cannot find next node.
Cause: The next MIB variable cannot be found.
Action: None.
Cannot find the node’s parent.
Cause: The MIB variable has no parent.
Action: None.
Cannot find the specific node.
Cause:The MIB variable cannot be found in the MIB database.
Action: Load new MIBs into the MIB database.
Cannot find the specific trap.
Cause: Trap not found.
Action: Load new MIBs into the MIB database.
Cannot locate previous position.
Cause: (Internal error.) The MIB database is inconsistent.
Action: Please contact SMC Technical Support for help.
database is corrupt.
I-22
MIB-2 VIEWER
Cause:The MIB database is corrupt.
Action: Rebuild the MIB database.
Invalid search mode.
Cause: (Internal error.) An application used the wrong search mode.
Action: Please contact Accton Technical Support for help.
MIB database error.
Cause: (General error.)
Action: Please contact Accton Technical Support for help.
Out of memory.
Cause: Out of memory.
Action: Close other programs and retry.
Mib-2 Viewer
Cannot find the text any more!
Cause: The text you specified cannot be found at the other position.
Action: None.
Cannot find this text.
Cause: The text you specified cannot be found.
Action: Verify text.
Cannot open statistics window.
Cause: System may be out of resources.
Action: Close some applications and retry.
Create root window failed.
Cause: System may be out of memory and resource.
Action: Close some applications and retry.
Initial Tree failure.
Cause: System error.
Action: Reset the system and retry. If the same error occurs, contact SMC Technical Support.
Mib2 viewer cannot get any SNMP response from target.
I-23
ERROR MESSAGES
Cause: Have received no SNMP response frame.
Action: Make sure the target address is correct, the network subsystem OK, and the target node supports this
variable group.
Mib2 viewer got no snmp response for variable.
Cause: The objects may be not implemented.
Action: None.
Out of Memory.
Cause: Out of memory.
Action: Close some applications and retry.
Output Window out of space.
Cause: Output window is full.
Action: Save contents, and then clear the window with a New Output command.
SNMPAPI reported allocation memory error.
Cause: The Windows system is out of memory.
Action: Close some applications and invoke again.
Report
Cannot access printer.
Cause: Cannot create device context.
Action: Memory may not be enough.
Cannot find the text specified.
Cause: Report cannot find the specified text.
Action: Check the case, and be sure the text is correct.
File is too large, the content of file will be truncated.
Cause: The file to be opened is too large.
Action: Use another program such as write.exe to open it.
Printer error.
I-24
TFTP SERVER
Cause: Possible reasons may be:
a. General error.
b. Not enough disk space available for spooling, and no more space will become available.
c. Not enough memory is available for spooling.
d. User terminated the job through the printer manager.
Action: Check printer or disk space. If memory not enough, print directly, not through the printer manager.
Reports contents have changed. Save it?
Cause: The contents of report the window have been changed.
Action: Save it if important.
TFTP Server
Cannot open local file.
Cause: The TFTP Server cannot locate the specified file.
Action: Make sure the file exists and that the path in the SETUP dialog box is correct.
Cannot read public directory.
Cause: The public directory is not correct or the directory has too many files.
Action: Modify the public directory setting.
Create TFTP Server main window failed!
Cause: The TFTP Server cannot create the main window.
Action: Close some applications and retry.
Network Setup program cannot run with the other modules!
Please close the other modules first.
Cause: Another EliteView module was open when running the network setup program, or the EliteView program
closed abnormally and left some module resident in memory.
Action: Close all EliteView programs or restart Windows.
Create TFTP Server status window failed!
Cause: The TFTP Server cannot create the status bar.
Action: Close some applications and retry.
Initialize mib database failed, the download function will be disabled.
I-25
ERROR MESSAGES
Cause: The MIB may not contain the SMC MIB.
Action: Use the MIB compiler to add the SMC MIB.
Initialize namebase failed.
Cause: The name database dynamic library failed to initialize.
Action: The Namebase.dbf file may be corrupted, use the namebase manager to check it.
Invalid Retry value.
Cause: The retry value should be between 0 and 2000.
Action: Change it.
Invalid target address.
Cause: The target IP address or name is not correct.
Action: Use the name in the name database or correct the IP address.
Invalid Timeout value.
Cause: The timeout value should be between 0 and 2000.
Action: Change it.
Open SNMP communication channel failed!
Cause: The network subsystem may have failed.
Action: Use the alive test program to make sure the network subsystem is OK.
Open TFTP communication channel failed!
Cause: The network subsystem may have failed.
Action: Use the alive test program to make sure the network subsystem is OK.
Out of memory.
Cause: Memory is not enough.
Action: Add system memory or close some applications and retry.
Run AccInfo failed!
Cause: tftpsvr.exe may have abnormally terminated the last time it was run.
Action: Restart Windows and retry.
TFTP.DLL
Bind to UDP socket failed with error code = %d.
I-26
TFTP.DLL
Cause: The Bind Socket operation failed. The error code comes from the function bind( ) of the WinSocket
specification.
Action: Check the network subsystem by error code.
Cannot allocate callback routine.
Cause: Out of memory.
Action: Close some applications and retry, or restart Windows.
Cannot open IFM window.
Cause: An error occurred initializing TFTP.DLL. May be out of memory.
Action: If memory is not enough, close some applications and retry, or restart Windows. Otherwise take the action
indicated by the error code.
Cleanup WinSocket failed with error code %d when closing IFM window.
Cause: The Unregister operation from the winsock.dll failed. The error code refers to the WSACleanup( ) function
in the WinSocket specification.
Action: Check the network subsystem by error code.
Close socket failed with error code %d when closing IFM window.
Cause: A Close socket operation used by the TFTP.DLL failed. The error code comes from the function
closesocket( ) in the WinSocket specification.
Action: Check the network subsystem by error code.
Enable receive broadcast frame error - error code %d.
Cause: Enable receive broadcast option error. The error code comes from the function setsockopt( ) in the
WinSocket API.
Action: Check the network subsystem by error code.
Get tftp service information error.
Cause: The error code comes from the function getservbyname( ) of the WinSocket specification.
Action: Check the network subsystem by error code.
Got FD_READ message, but got length error - error code %d.
Cause: Have received a packet, but the network subsystem cannot report its length. The error code comes from
the function ioctlsocket( ) of the WinSocket API.
Action: Check the network subsystem by error code.
Memory allocation is not successful.
I-27
ERROR MESSAGES
Cause: Out of memory.
Action: Close some applications and retry, or restart Windows.
No usable WinSock.dll found.
Cause: The WinSocket network subsystem failed. Verify the platform.
Action: Check the network subsystem.
Open UDP socket failed with error code = %d.
Cause: An Open Socket operation failed. The error code comes from the function socket( ) of the WinSocket API.
Action: Check the network subsystem by error code.
Receive frame from wrong socket %d.
Cause: The Receive process in winsock.dll had an error.
Action: Check the network subsystem.
Send packet failed with error code %d.
Cause: The network subsystem has a problem. The error code comes from function sendto( ) in the WinSocket
specification.
Action: Check the network subsystem by error code.
Setup received message error - error code = %d.
Cause: Cannot setup a Windows message for received frames. The error code comes from the WSASelect( )
function in the WinSocket specification.
Action: Check the network subsystem by error code.
The network subsystem is not ready.
Cause: The network subsystem may not be the correct platform.
Action: Verify the platform.
The port number of application is duplicate.
Cause: Two client programs are using the same port number for the IP protocol. Some TFTP application may not
have quit normally.
Action: Check your applications.
The slot is saturated.
Cause: TFTP.DLL can only support 10 sessions.
Action: Never open more than 10 sessions.
The windows socket’s version specified by application is not supported by this winsock.dll.
I-28
TRAP MANAGER
Cause: The version of winsock.dll did not match the requirement for TFTP.DLL.
Action: Change the TCP/IP stacks and winsock.dll.
The winsock.dll should at least support version 1.1
Cause: The version of winsock.dll is too old.
Action: Upgrade the TCP/IP stacks platform.
Action: Check the network subsystem by error code.
Windows socket version %d.%d required, but not supported by winsock.dll.
Cause: The version of winsock.dll did not match the requirement for TFTP.DLL.
Action: Change the TCP/IP stacks and winsock.dll.
Winsock.dll not able to support minimum number of sockets required by TFTP module.
Cause: Too many WinSocket applications are in use.
Action: Close some WinSocket applications and retry.
Trap Manager
Invalid format in section [enterprise] entry xxx.
Cause: An invalid format in TRAP.INI entry xxx.
Action: Correct it and restart Trap Manager. (Refer to Appendix B in this User’s Guide for information on writing
TRAP.INI)
MIB variable (var_label) not found.
Cause: MIB variable(s) for specific Trap(s) not found in the MIB Database.
Action: Load the MIB(s) which contains these variable(s) into the MIB Database, and restart the Trap Manager.
Out of memory.
Cause: Out of memory.
Action: Close other programs and retry.
Trap Manager cannot register trap channel.
Cause: (Internal error.) Cannot register a trap channel.
Action: Contact SMC Technical Support.
I-29
ERROR MESSAGES
I-30
APPENDIX J
PRODUCT SUPPORT SERVICES
SMC is an international corporation that offers worldwide technical support. Many of these services are available
24 hours a day.
To help us serve you more effectively, please have the following information available before calling SMC:
•
•
A list of files in your EliteView directory (C:\EV60)
Detailed information about your network adapter
Technical Support Information
Be prepared to provide the following information:
Table J-1 Technical Support Information
Information
Example
Version of EliteView you are using.
6.20
Network adapter: manufacturer and model.
SMC EZ Card 10/100 (SMC1211TX/WL)
Exact wording of any error messages you may have seen.
Packet Driver not loaded
Step-by-step description of what happened and what you were doing
when the problem occurred.
1. Double-clicked on EliteView icon
2. Saw error message
Description of the actions you have taken to correct the problem
Re-booted computer
Anything else we should know about your computer or installation
Computer soaked by Great Flood of '93
Technical Support
For Technical Support, Call:
From U.S.A. and Canada (24 hours a day, 7 days a week)
(800) SMC-4-YOU; (949) 679-8000; Fax: (949) 679-1481
From Europe - http"//www.smc.com for Technical Support contact information.
J-1
PRODUCT SUPPORT SERVICES
Internet:
E-mail addresses:[email protected]
Driver updates: http://www.smc.com/index.cfm?action=tech_support_drivers_downloads
World Wide Web:http://www.smc.com/
J-2
GLOSSARY
Address
Identification of entities in a communication protocol.
BOOTP (Boot Protocol)
BOOTP is a popular protocol that runs on top of the UDP/IP stack. BOOTP is used by devices to discover their
own IP address. In EliteView, the BOOTP server provides the services of IP addresses and filenames.
Broadcast Packet
A packet transmitted to all nodes attached to the network.
Community
A character string embedded in SNMP messages that is used to authenticate the access rights of the service
requester.
Connection
A logical binding between two or more users of a service.
EliteView
EliteView is a complete network management platform. EliteView is composed of a core program and groups of
related modules. EliteView is a complete network management product with modules for managing SMC and
third-party SNMP devices.
Ethernet
A 10 Mbps baseband LAN that uses a bus configuration and CSMA/CD.
Ethernet Frame
A packaging structure for Ethernet data and control information. It consists of the destination address, source
address, field length, data, pad, and a frame check sequence.
Gateway
A synonym for router in internet protocol (IP). A gateway connects several IP networks. It builds a routing
database by exchanging information with other gateways or with information input by the network administrator.
It relays IP data packets between connected networks.
Glossary-1
GLOSSARY
IP Address
A 32-bit quantity representing a point of attachment to the Internet. It is usually represented by four 8-bit integers
separated by dots. Each decimal integer represents a byte in an IP address. The IP address is divided into a network
part and a host part. For example, 192.9.211.151. See Appendix E for more information on Internet and IP
addresses.
IPX
Internetwork Packet Exchange is a NetWare protocol providing datagram message delivery.
Local Area Network (LAN)
A group of interconnected computers and other devices.
MAC Address
Media Access Control address that represents a unique physical address for each port in a local area network.
Map
A network diagram showing devices managed by EliteView.
MIB
An acronym for Management Information Base. It is a set of objects that contain information about the device.
Note that MIB-2 is simply a subordinate component of the overall MIB.
Multicast Packet
A packet transmitted to a specified set of nodes on the network.
Netmask
The netmask divides a network into logical subnets. This number uses a binary representation to include or
exclude address. For example, these netmasks correspond to various internet classes:
Class A: 255.0.0.0
Class B: 255.255.0.0
Class C: 255.255.255.0
Network Management Station (NMS)
The computer used to run network management software, e.g., EliteView. Messages from EliteView are displayed
on the NMS.
Glossary-2
GLOSSARY
Out-of-Band
A way of communicating with a network device from outside the standard network channels.
Packet
The unit of data transfer over a local area network. For Ethernet, it includes the number of preamble bits, the start
of frame delimiter, the destination and source addresses, the data to be transferred, and the frame check sequence
(CRC) bytes.
Protocol
A set of rules that allows computers to communicate with one another, specifying the format, timing, sequencing,
and error-checking for data transmission.
Retries
The number of times EliteView attempts to communicate with a device before quitting. Also see timeout.
SNMP
Simple Network Management Protocol (SNMP). The application protocol offering network management services
in the Internet suit of protocols.
Software Interrupt
The software interrupt is the communication channel between the device driver (e.g., ODIPD or NWPD) and
other applications (e.g., WINPD or ELITEVIEW). The recommended software interrupt is 0x60 (60 hex).
Subnet
A LAN segment which may be reached through a gateway.
Subnet Mask
A decimal number (four integers) which specifies the logical network subnet of the terminal. A typical subnet mask
is 255.255.255.0. Also see Netmask.
Timeout
The elapsed time (in seconds) that EliteView waits for a response from a device.
TFTP (Trivial File Transfer Protocol)
A file-transfer protocol for downloading files.
Glossary-3
GLOSSARY
Unicast Packet
A packet transmitted to a specific node on the network.
WINSOCKET
Provides a common network programming interface for Microsoft Windows that allows applications using TCP/
IP software from different barriers, and allows users to share information and resources as though located on the
same LAN.
Glossary-4
INDEX
A
F
Alarm Group 9-13
Alive Test 3-2
probing devices 5-5
solving problems 5-7
Filter and Capture Group 9-22
filter formula 7-7
B
Host Top N Group 9-18
BOOTP Server 3-2, 5-2
default information 5-5
setting addresses 5-1
I
C
CodeBase 6.0 DLL G-1
community string 4-5
D
data logging 3-6
device management modules 3-2
Discovery 3-3, 4-2
E
EliteView B-1
customizing B-1
features F-1
main program 3-3, 3-9
menu definitions 3-10
program toolbar 3-11
starting 3-8
error messages I-1
event action 8-2
Event Group 9-13
event management 3-6
Event Manager 3-3
defining events 8-2
event data 8-4
starting 8-1
Event Manger
user event 8-2
exporting logged data A-7
H
initialization files
NETMGR.INI B-1
TRAP.INI B-11
interface
administration 6-8
L
log database
manager 3-3
Log Manager 3-3, 7-1, A-3
editing a log process 7-3
log controls 7-5
viewing data 7-5
M
Matrix Group 9-20
MIB
compiler 6-2
database 6-2
loading a new MIB 6-4
objects C-2
MIB Browser 6-11
fetching devices 6-13
menu definitions 6-12, 7-14
output editor 6-18
MIB Compiler A-1
MIB-2 Directory 6-7
MIB-2 Viewer 3-4, 6-5
interface administration 6-8
interface statistics 6-9
system information 6-7
Index-1
INDEX
N
S
Name Database Manager 3-4, 4-6
network configuration 4-1
network map 4-8
building 4-1
editing map objects 4-11
editing toolbar 4-10
functions 4-9
sample configuration 4-12
SNMP C-1
trap 8-6
Statistics Group 9-5
sub-licence agreement G-1
system
event 8-2
requirements 2-1
P
performance tips E-1
product support J-1
R
Report
module 3-4
window 8-7
RFC reports D-1
RMON 9-1
Alarm and Event Groups 9-13
alarm control table 9-13
channel and buffer control tables 9-23
displaying events 9-15
event control table 9-14
history control table 9-11
History Group 9-10
host control table 9-16
Host Group 9-15
manager 3-4, 9-2
matrix control table 9-20
Matrix Group 9-20
statistics areas 9-8
Statistics Group 9-5
statistics menu 9-10
statistics toolbars 9-10
utilities 9-4
viewing hstory 9-12
viewing statistics 9-6
Index-2
T
TCP/IP 3-1
technical support J-1
Telnet 5-9
TFTP
process list 5-8
TFTP Server 3-5
downloading files 5-7
third party
device A-2
trap A-6
threshold formula 7-10
trap
manager 3-5
type 8-6
troubleshooting H-1
W
WINSOCKET 3-1
TECHNICAL SUPPORT
From U.S.A. and Canada (24 hours a day, 7 days a week)
Phn: 800-SMC-4-YOU / 949-679-8000
Fax: 949-502-3400
ENGLISH
Technical Support information available at www.smc.com
FRENCH
Informations Support Technique sur www.smc.com
DEUTSCH
Technischer Support und weitere Information unter www.smc.com
SPANISH
En www.smc.com Ud. podrá encontrar la información relativa a servicios de
soporte técnico
DUTCH
Technische ondersteuningsinformatie beschikbaar op www.smc.com
PORTUGUES
Informações sobre Suporte Técnico em www.smc.com
SWEDISH
Information om Teknisk Support finns tillgängligt på www.smc.com
INTERNET
E-mail address: [email protected]
Driver updates
http://www.smc.com/index.cfm?action=tech_support_drivers_downloads
World Wide Web
http://www.smc.com/
EliteViewTM 6.20
20 Mason • Irvine, CA 92618 • Phn: 949-679-8000 • www.smc.com