1
J-series™ Services Router
Administration Guide
Release 9.1
Juniper Networks, Inc.
1194 North Mathilda Avenue
Sunnyvale, California 94089
USA
408-745-2000
www.juniper.net
Part Number: 530-023932-01, Revision 1
This product includes the Envoy SNMP Engine, developed by Epilogue Technology, an Integrated Systems Company. Copyright © 1986-1997, Epilogue
Technology Corporation. All rights reserved. This program and its documentation were developed at private expense, and no part of them is in the public
domain.
This product includes memory allocation software developed by Mark Moraes, copyright © 1988, 1989, 1993, University of Toronto.
This product includes FreeBSD software developed by the University of California, Berkeley, and its contributors. All of the documentation and software
included in the 4.4BSD and 4.4BSD-Lite Releases is copyrighted by the Regents of the University of California. Copyright © 1979, 1980, 1983, 1986, 1988,
1989, 1991, 1992, 1993, 1994. The Regents of the University of California. All rights reserved.
GateD software copyright © 1995, the Regents of the University. All rights reserved. Gate Daemon was originated and developed through release 3.0 by
Cornell University and its collaborators. Gated is based on Kirton’s EGP, UC Berkeley’s routing daemon (routed), and DCN’s HELLO routing protocol.
Development of Gated has been supported in part by the National Science Foundation. Portions of the GateD software copyright © 1988, Regents of the
University of California. All rights reserved. Portions of the GateD software copyright © 1991, D. L. S. Associates.
This product includes software developed by Maker Communications, Inc., copyright © 1996, 1997, Maker Communications, Inc.
Juniper Networks, the Juniper Networks logo, NetScreen, and ScreenOS are registered trademarks of Juniper Networks, Inc. in the United States and other
countries. JUNOS and JUNOSe are trademarks of Juniper Networks, Inc. All other trademarks, service marks, registered trademarks, or registered service
marks are the property of their respective owners.
Juniper Networks assumes no responsibility for any inaccuracies in this document. Juniper Networks reserves the right to change, modify, transfer, or
otherwise revise this publication without notice.
Products made or sold by Juniper Networks or components thereof might be covered by one or more of the following patents that are owned by or licensed
to Juniper Networks: U.S. Patent Nos. 5,473,599, 5,905,725, 5,909,440, 6,192,051, 6,333,650, 6,359,479, 6,406,312, 6,429,706, 6,459,579, 6,493,347,
6,538,518, 6,538,899, 6,552,918, 6,567,902, 6,578,186, and 6,590,785.
J-series™ Services Router Administration Guide
Release 9.1
Copyright © 2008, Juniper Networks, Inc.
All rights reserved. Printed in USA.
Revision History
April 2008—Revision 1
The information in this document is current as of the date listed in the revision history.
YEAR 2000 NOTICE
Juniper Networks hardware and software products are Year 2000 compliant. The JUNOS software has no known time-related limitations through the year
2038. However, the NTP application is known to have some difficulty in the year 2036.
SOFTWARE LICENSE
The terms and conditions for using this software are described in the software license contained in the acknowledgment to your purchase order or, to the
extent applicable, to any reseller agreement or end-user purchase agreement executed between you and Juniper Networks. By using this software, you
indicate that you understand and agree to be bound by those terms and conditions. Generally speaking, the software license restricts the manner in which
you are permitted to use the software and may contain prohibitions against certain uses. The software license may state conditions under which the license
is automatically terminated. You should consult the license for further details. For complete product documentation, please see the Juniper Networks Web
site at www.juniper.net/techpubs.
ii
■
End User License Agreement
READ THIS END USER LICENSE AGREEMENT (“AGREEMENT”) BEFORE DOWNLOADING, INSTALLING, OR USING THE SOFTWARE. BY DOWNLOADING,
INSTALLING, OR USING THE SOFTWARE OR OTHERWISE EXPRESSING YOUR AGREEMENT TO THE TERMS CONTAINED HEREIN, YOU (AS CUSTOMER
OR IF YOU ARE NOT THE CUSTOMER, AS A REPRESENTATIVE/AGENT AUTHORIZED TO BIND THE CUSTOMER) CONSENT TO BE BOUND BY THIS
AGREEMENT. IF YOU DO NOT OR CANNOT AGREE TO THE TERMS CONTAINED HEREIN, THEN (A) DO NOT DOWNLOAD, INSTALL, OR USE THE SOFTWARE,
AND (B) YOU MAY CONTACT JUNIPER NETWORKS REGARDING LICENSE TERMS.
1. The Parties. The parties to this Agreement are Juniper Networks, Inc. and its subsidiaries (collectively “Juniper”), and the person or organization that
originally purchased from Juniper or an authorized Juniper reseller the applicable license(s) for use of the Software (“Customer”) (collectively, the “Parties”).
2. The Software. In this Agreement, “Software” means the program modules and features of the Juniper or Juniper-supplied software, and updates and
releases of such software, for which Customer has paid the applicable license or support fees to Juniper or an authorized Juniper reseller. “Embedded
Software” means Software which Juniper has embedded in the Juniper equipment.
3. License Grant. Subject to payment of the applicable fees and the limitations and restrictions set forth herein, Juniper grants to Customer a non-exclusive
and non-transferable license, without right to sublicense, to use the Software, in executable form only, subject to the following use restrictions:
a. Customer shall use the Embedded Software solely as embedded in, and for execution on, Juniper equipment originally purchased by Customer from
Juniper or an authorized Juniper reseller.
b. Customer shall use the Software on a single hardware chassis having a single processing unit, or as many chassis or processing units for which Customer
has paid the applicable license fees; provided, however, with respect to the Steel-Belted Radius or Odyssey Access Client software only, Customer shall use
such Software on a single computer containing a single physical random access memory space and containing any number of processors. Use of the
Steel-Belted Radius software on multiple computers requires multiple licenses, regardless of whether such computers are physically contained on a single
chassis.
c. Product purchase documents, paper or electronic user documentation, and/or the particular licenses purchased by Customer may specify limits to
Customer’s use of the Software. Such limits may restrict use to a maximum number of seats, registered endpoints, concurrent users, sessions, calls,
connections, subscribers, clusters, nodes, realms, devices, links, ports or transactions, or require the purchase of separate licenses to use particular features,
functionalities, services, applications, operations, or capabilities, or provide throughput, performance, configuration, bandwidth, interface, processing,
temporal, or geographical limits. In addition, such limits may restrict the use of the Software to managing certain kinds of networks or require the Software
to be used only in conjunction with other specific Software. Customer’s use of the Software shall be subject to all such limitations and purchase of all applicable
licenses.
d. For any trial copy of the Software, Customer’s right to use the Software expires 30 days after download, installation or use of the Software. Customer
may operate the Software after the 30-day trial period only if Customer pays for a license to do so. Customer may not extend or create an additional trial
period by re-installing the Software after the 30-day trial period.
e. The Global Enterprise Edition of the Steel-Belted Radius software may be used by Customer only to manage access to Customer’s enterprise network.
Specifically, service provider customers are expressly prohibited from using the Global Enterprise Edition of the Steel-Belted Radius software to support any
commercial network access services.
The foregoing license is not transferable or assignable by Customer. No license is granted herein to any user who did not originally purchase the applicable
license(s) for the Software from Juniper or an authorized Juniper reseller.
4. Use Prohibitions. Notwithstanding the foregoing, the license provided herein does not permit the Customer to, and Customer agrees not to and shall
not: (a) modify, unbundle, reverse engineer, or create derivative works based on the Software; (b) make unauthorized copies of the Software (except as
necessary for backup purposes); (c) rent, sell, transfer, or grant any rights in and to any copy of the Software, in any form, to any third party; (d) remove
any proprietary notices, labels, or marks on or in any copy of the Software or any product in which the Software is embedded; (e) distribute any copy of
the Software to any third party, including as may be embedded in Juniper equipment sold in the secondhand market; (f) use any ‘locked’ or key-restricted
feature, function, service, application, operation, or capability without first purchasing the applicable license(s) and obtaining a valid key from Juniper, even
if such feature, function, service, application, operation, or capability is enabled without a key; (g) distribute any key for the Software provided by Juniper
to any third party; (h) use the Software in any manner that extends or is broader than the uses purchased by Customer from Juniper or an authorized Juniper
reseller; (i) use the Embedded Software on non-Juniper equipment; (j) use the Software (or make it available for use) on Juniper equipment that the Customer
did not originally purchase from Juniper or an authorized Juniper reseller; (k) disclose the results of testing or benchmarking of the Software to any third
party without the prior written consent of Juniper; or (l) use the Software in any manner other than as expressly provided herein.
5. Audit. Customer shall maintain accurate records as necessary to verify compliance with this Agreement. Upon request by Juniper, Customer shall furnish
such records to Juniper and certify its compliance with this Agreement.
6. Confidentiality. The Parties agree that aspects of the Software and associated documentation are the confidential property of Juniper. As such, Customer
shall exercise all reasonable commercial efforts to maintain the Software and associated documentation in confidence, which at a minimum includes
restricting access to the Software to Customer employees and contractors having a need to use the Software for Customer’s internal business purposes.
■
iii
7. Ownership. Juniper and Juniper's licensors, respectively, retain ownership of all right, title, and interest (including copyright) in and to the Software,
associated documentation, and all copies of the Software. Nothing in this Agreement constitutes a transfer or conveyance of any right, title, or interest in
the Software or associated documentation, or a sale of the Software, associated documentation, or copies of the Software.
8. Warranty, Limitation of Liability, Disclaimer of Warranty. The warranty applicable to the Software shall be as set forth in the warranty statement that
accompanies the Software (the “Warranty Statement”). Nothing in this Agreement shall give rise to any obligation to support the Software. Support services
may be purchased separately. Any such support shall be governed by a separate, written support services agreement. TO THE MAXIMUM EXTENT PERMITTED
BY LAW, JUNIPER SHALL NOT BE LIABLE FOR ANY LOST PROFITS, LOSS OF DATA, OR COSTS OR PROCUREMENT OF SUBSTITUTE GOODS OR SERVICES,
OR FOR ANY SPECIAL, INDIRECT, OR CONSEQUENTIAL DAMAGES ARISING OUT OF THIS AGREEMENT, THE SOFTWARE, OR ANY JUNIPER OR
JUNIPER-SUPPLIED SOFTWARE. IN NO EVENT SHALL JUNIPER BE LIABLE FOR DAMAGES ARISING FROM UNAUTHORIZED OR IMPROPER USE OF ANY
JUNIPER OR JUNIPER-SUPPLIED SOFTWARE. EXCEPT AS EXPRESSLY PROVIDED IN THE WARRANTY STATEMENT TO THE EXTENT PERMITTED BY LAW,
JUNIPER DISCLAIMS ANY AND ALL WARRANTIES IN AND TO THE SOFTWARE (WHETHER EXPRESS, IMPLIED, STATUTORY, OR OTHERWISE), INCLUDING
ANY IMPLIED WARRANTY OF MERCHANTABILITY, FITNESS FOR A PARTICULAR PURPOSE, OR NONINFRINGEMENT. IN NO EVENT DOES JUNIPER
WARRANT THAT THE SOFTWARE, OR ANY EQUIPMENT OR NETWORK RUNNING THE SOFTWARE, WILL OPERATE WITHOUT ERROR OR INTERRUPTION,
OR WILL BE FREE OF VULNERABILITY TO INTRUSION OR ATTACK. In no event shall Juniper’s or its suppliers’ or licensors’ liability to Customer, whether
in contract, tort (including negligence), breach of warranty, or otherwise, exceed the price paid by Customer for the Software that gave rise to the claim, or
if the Software is embedded in another Juniper product, the price paid by Customer for such other product. Customer acknowledges and agrees that Juniper
has set its prices and entered into this Agreement in reliance upon the disclaimers of warranty and the limitations of liability set forth herein, that the same
reflect an allocation of risk between the Parties (including the risk that a contract remedy may fail of its essential purpose and cause consequential loss),
and that the same form an essential basis of the bargain between the Parties.
9. Termination. Any breach of this Agreement or failure by Customer to pay any applicable fees due shall result in automatic termination of the license
granted herein. Upon such termination, Customer shall destroy or return to Juniper all copies of the Software and related documentation in Customer’s
possession or control.
10. Taxes. All license fees for the Software are exclusive of taxes, withholdings, duties, or levies (collectively “Taxes”). Customer shall be responsible for
paying Taxes arising from the purchase of the license, or importation or use of the Software.
11. Export. Customer agrees to comply with all applicable export laws and restrictions and regulations of any United States and any applicable foreign
agency or authority, and not to export or re-export the Software or any direct product thereof in violation of any such restrictions, laws or regulations, or
without all necessary approvals. Customer shall be liable for any such violations. The version of the Software supplied to Customer may contain encryption
or other capabilities restricting Customer’s ability to export the Software without an export license.
12. Commercial Computer Software. The Software is “commercial computer software” and is provided with restricted rights. Use, duplication, or disclosure
by the United States government is subject to restrictions set forth in this Agreement and as provided in DFARS 227.7201 through 227.7202-4, FAR 12.212,
FAR 27.405(b)(2), FAR 52.227-19, or FAR 52.227-14(ALT III) as applicable.
13. Interface Information. To the extent required by applicable law, and at Customer's written request, Juniper shall provide Customer with the interface
information needed to achieve interoperability between the Software and another independently created program, on payment of applicable fee, if any.
Customer shall observe strict obligations of confidentiality with respect to such information and shall use such information in compliance with any applicable
terms and conditions upon which Juniper makes such information available.
14. Third Party Software. Any licensor of Juniper whose software is embedded in the Software and any supplier of Juniper whose products or technology
are embedded in (or services are accessed by) the Software shall be a third party beneficiary with respect to this Agreement, and such licensor or vendor
shall have the right to enforce this Agreement in its own name as if it were Juniper. In addition, certain third party software may be provided with the
Software and is subject to the accompanying license(s), if any, of its respective owner(s). To the extent portions of the Software are distributed under and
subject to open source licenses obligating Juniper to make the source code for such portions publicly available (such as the GNU General Public License
(“GPL”) or the GNU Library General Public License (“LGPL”)), Juniper will make such source code portions (including Juniper modifications, as appropriate)
available upon request for a period of up to three years from the date of distribution. Such request can be made in writing to Juniper Networks, Inc., 1194
N. Mathilda Ave., Sunnyvale, CA 94089, ATTN: General Counsel. You may obtain a copy of the GPL at http://www.gnu.org/licenses/gpl.html, and a copy of
the LGPL at http://www.gnu.org/licenses/lgpl.html.
15. Miscellaneous. This Agreement shall be governed by the laws of the State of California without reference to its conflicts of laws principles. The provisions
of the U.N. Convention for the International Sale of Goods shall not apply to this Agreement. For any disputes arising under this Agreement, the Parties
hereby consent to the personal and exclusive jurisdiction of, and venue in, the state and federal courts within Santa Clara County, California. This Agreement
constitutes the entire and sole agreement between Juniper and the Customer with respect to the Software, and supersedes all prior and contemporaneous
agreements relating to the Software, whether oral or written (including any inconsistent terms contained in a purchase order), except that the terms of a
separate written agreement executed by an authorized Juniper representative and Customer shall govern to the extent such terms are inconsistent or conflict
with terms contained herein. No modification to this Agreement nor any waiver of any rights hereunder shall be effective unless expressly assented to in
writing by the party to be charged. If any portion of this Agreement is held invalid, the Parties agree that such invalidity shall not affect the validity of the
remainder of this Agreement. This Agreement and associated documentation has been written in the English language, and the Parties agree that the English
version will govern. (For Canada: Les parties aux présentés confirment leur volonté que cette convention de même que tous les documents y compris tout
avis qui s'y rattaché, soient redigés en langue anglaise. (Translation: The parties confirm that this Agreement and all related documentation is and will be
in the English language)).
iv
■
Abbreviated Table of Contents
About This Guide
Part 1
Configuring a Services Router for Administration
Chapter 1
Chapter 2
Chapter 3
Chapter 4
Chapter 5
Chapter 6
Part 2
Managing User Authentication and Access
Setting Up USB Modems for Remote Management
Configuring SNMP for Network Management
Configuring the Router as a DHCP Server
Configuring Autoinstallation
Automating Network Operations and Troubleshooting
3
29
47
63
81
89
Monitoring a Services Router
Chapter 7
Chapter 8
Chapter 9
Part 3
Monitoring the Router and Routing Operations
Monitoring Events and Managing System Log Files
Configuring and Monitoring Alarms
101
155
165
Managing Services Router Software
Chapter 10
Chapter 11
Part 4
Performing Software Upgrades and Reboots
Managing Files
179
199
Diagnosing Performance and Network Problems
Chapter 12
Chapter 13
Chapter 14
Part 5
xv
Using Services Router Diagnostic Tools
Configuring Packet Capture
Configuring RPM Probes
209
253
267
Index
Index
291
Abbreviated Table of Contents
■
v
J-series™ Services Router Administration Guide
vi
■
Table of Contents
About This Guide
xv
Objectives ......................................................................................................xv
Audience .......................................................................................................xv
How to Use This Guide .................................................................................xvi
Document Conventions ...............................................................................xvii
Related Juniper Networks Documentation ..................................................xviii
Documentation Feedback .............................................................................xxi
Requesting Technical Support ......................................................................xxi
Part 1
Configuring a Services Router for Administration
Chapter 1
Managing User Authentication and Access
3
User Authentication Terms ..............................................................................3
User Authentication Overview .........................................................................4
User Authentication ..................................................................................4
User Accounts ...........................................................................................4
Login Classes ............................................................................................5
Permission Bits ...................................................................................5
Denying or Allowing Individual Commands .......................................7
Template Accounts ...................................................................................7
Before You Begin .............................................................................................8
Managing User Authentication with Quick Configuration ................................8
Adding a RADIUS Server for Authentication ..............................................8
Adding a TACACS+ Server for Authentication ..........................................9
Configuring System Authentication .........................................................10
Adding New Users ..................................................................................11
Managing User Authentication with a Configuration Editor ...........................12
Setting Up RADIUS Authentication ..........................................................12
Setting Up TACACS+ Authentication ......................................................13
Configuring Authentication Order ...........................................................15
Controlling User Access ..........................................................................16
Defining Login Classes ......................................................................16
Creating User Accounts ....................................................................17
Setting Up Template Accounts ................................................................18
Creating a Remote Template Account ..............................................19
Creating a Local Template Account ..................................................20
Recovering the Root Password ......................................................................21
Securing the Console Port .............................................................................23
Table of Contents
■
vii
J-series™ Services Router Administration Guide
Accessing Remote Devices with the CLI ........................................................24
Using the telnet Command .....................................................................24
Using the ssh Command .........................................................................25
Configuring Password Retry Limits for Telnet and SSH Access ......................26
Chapter 2
Setting Up USB Modems for Remote Management
29
USB Modem Terms .......................................................................................29
USB Modem Overview ..................................................................................30
USB Modem Interfaces ...........................................................................30
How a Services Router Initializes USB Modems ......................................31
USB Modem Connection and Configuration Overview ............................32
Before You Begin ...........................................................................................33
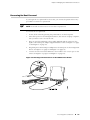
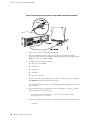
Connecting the USB Modem to the Services Router's USB Port .....................33
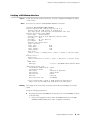
Configuring USB Modem Interfaces with a Configuration Editor ....................33
Configuring a USB Modem Interface (Required) ......................................33
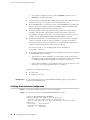
Configuring a Dialer Interface (Required) ................................................35
Configuring Dial-In (Required) ................................................................36
Configuring CHAP on Dialer Interfaces (Optional) ...................................37
Connecting to the Services Router from the User End ...................................39
Configuring a Dial-Up Modem Connection at the User End .....................39
Connecting to the Services Router from the User End .............................40
Administering USB Modems ..........................................................................40
Modifying USB Modem Initialization Commands ....................................41
Resetting USB Modems ...........................................................................42
Verifying the USB Modem Configuration .......................................................42
Verifying a USB Modem Interface ...........................................................43
Verifying Dialer Interface Configuration ..................................................44
Chapter 3
Configuring SNMP for Network Management
47
SNMP Architecture ........................................................................................47
Management Information Base ...............................................................48
SNMP Communities ................................................................................48
SNMP Traps ............................................................................................49
Spoofing SNMP Traps .............................................................................49
SNMP Health Monitor .............................................................................49
Before You Begin ...........................................................................................50
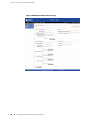
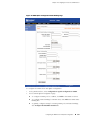
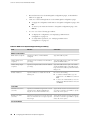
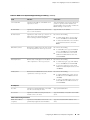
Configuring SNMP with Quick Configuration .................................................50
Configuring SNMP with a Configuration Editor ..............................................54
Defining System Identification Information (Required) ...........................54
Configuring SNMP Agents and Communities (Required) .........................55
Managing SNMP Trap Groups (Required) ................................................56
Controlling Access to MIBs (Optional) .....................................................57
Verifying the SNMP Configuration .................................................................58
Verifying SNMP Agent Configuration ......................................................58
Verifying SNMP Health Monitor Configuration ........................................59
viii
■
Table of Contents
Table of Contents
Chapter 4
Configuring the Router as a DHCP Server
63
DHCP Terms .................................................................................................63
DHCP Overview ............................................................................................64
DHCP Options ........................................................................................65
Compatibility with Autoinstallation .........................................................65
Conflict Detection and Resolution ...........................................................65
Interface Restrictions ..............................................................................65
Before You Begin ...........................................................................................66
Configuring the DHCP Server with Quick Configuration ................................66
Configuring the DHCP Server with a Configuration Editor .............................72
Verifying a DHCP Server Configuration .........................................................75
Displaying a DHCP Server Configuration ................................................75
Verifying the DHCP Binding Database ....................................................76
Verifying DHCP Server Operation ...........................................................77
Displaying DHCP Statistics ......................................................................79
Chapter 5
Configuring Autoinstallation
81
Autoinstallation Terms ..................................................................................81
Autoinstallation Overview .............................................................................82
Supported Autoinstallation Interfaces and Protocols ...............................82
Typical Autoinstallation Process on a New Services Router .....................83
Before You Begin ...........................................................................................84
Configuring Autoinstallation with a Configuration Editor ...............................85
Verifying Autoinstallation ..............................................................................86
Verifying Autoinstallation Status .............................................................86
Chapter 6
Automating Network Operations and Troubleshooting
89
Defining and Enforcing Configuration Rules with Commit Scripts .................89
Commit Script Overview .........................................................................89
Enabling Commit Scripts ........................................................................90
Disabling Commit Scripts ........................................................................91
Automating Network Management and Troubleshooting with Operation
Scripts .....................................................................................................92
Operation Script Overview ......................................................................92
Enabling Operation Scripts .....................................................................93
Executing Operation Scripts ....................................................................93
Disabling Operation Scripts ....................................................................94
Running Self-Diagnostics with Event Policies .................................................94
Event Policy Overview ............................................................................95
Configuring Event Policies ......................................................................95
Table of Contents
■
ix
J-series™ Services Router Administration Guide
Part 2
Monitoring a Services Router
Chapter 7
Monitoring the Router and Routing Operations
101
Monitoring Terms ........................................................................................101
Monitoring Overview ...................................................................................101
Monitoring Tools Overview ...................................................................102
Filtering Command Output ...................................................................105
Before You Begin .........................................................................................106
Using the Monitoring Tools ..........................................................................107
Monitoring System Properties ...............................................................107
Monitoring System Process Information .........................................110
Monitoring the Chassis ..........................................................................111
Monitoring the Interfaces ......................................................................113
Monitoring Routing Information ...........................................................115
Monitoring Route Information ........................................................116
Monitoring BGP Routing Information .............................................117
Monitoring OSPF Routing Information ...........................................119
Monitoring RIP Routing Information ..............................................120
Monitoring DLSw Routing Information ...........................................121
Monitoring Class-of-Service Performance ..............................................123
Monitoring CoS Interfaces ..............................................................123
Monitoring CoS Classifiers ..............................................................124
Monitoring CoS Value Aliases .........................................................125
Monitoring CoS RED Drop Profiles .................................................126
Monitoring CoS Forwarding Classes ...............................................127
Monitoring CoS Rewrite Rules ........................................................128
Monitoring CoS Scheduler Maps .....................................................129
Monitoring MPLS Traffic Engineering Information ................................130
Monitoring MPLS Interfaces ............................................................131
Monitoring MPLS LSP Information ..................................................131
Monitoring MPLS LSP Statistics ......................................................132
Monitoring RSVP Session Information ............................................133
Monitoring MPLS RSVP Interfaces Information ...............................134
Monitoring Service Sets ........................................................................135
Monitoring Firewalls .............................................................................136
Monitoring Stateful Firewall Statistics .............................................137
Monitoring Stateful Firewall Filters .................................................138
Monitoring Firewall Intrusion Detection Services (IDS) ...................139
Monitoring IPSec Tunnels .....................................................................140
Monitoring NAT Pools ...........................................................................142
Monitoring DHCP ..................................................................................143
Monitoring RPM Probes ........................................................................145
Monitoring PPP .....................................................................................147
Monitoring PPPoE .................................................................................148
Monitoring the TGM550 Media Gateway (VoIP) .....................................151
x
■
Table of Contents
Table of Contents
Chapter 8
Monitoring Events and Managing System Log Files
155
System Log Message Terms .........................................................................155
System Log Messages Overview ..................................................................156
System Log Message Destinations .........................................................157
System Log Facilities and Severity Levels ..............................................157
Regular Expressions ..............................................................................158
Before You Begin .........................................................................................159
Configuring System Log Messages with a Configuration Editor ....................160
Sending System Log Messages to a File ................................................160
Sending System Log Messages to a User Terminal ................................161
Archiving System Logs ..........................................................................161
Disabling System Logs ..........................................................................162
Monitoring System Log Messages with the J-Web Event Viewer ..................162
Filtering System Log Messages ..............................................................162
Viewing System Log Messages ..............................................................164
Chapter 9
Configuring and Monitoring Alarms
165
Alarm Terms ...............................................................................................165
Alarm Overview ..........................................................................................166
Alarm Types .........................................................................................166
Alarm Severity ......................................................................................167
Alarm Conditions ..................................................................................167
Interface Alarm Conditions .............................................................167
Chassis Alarm Conditions and Corrective Actions ...........................170
System Alarm Conditions and Corrective Actions ...........................172
Before You Begin .........................................................................................172
Configuring Alarms with a Configuration Editor ..........................................172
Checking Active Alarms ...............................................................................174
Verifying the Alarms Configuration .............................................................175
Displaying Alarm Configurations ...........................................................175
Part 3
Managing Services Router Software
Chapter 10
Performing Software Upgrades and Reboots
179
Upgrade and Downgrade Overview .............................................................179
Upgrade Software Packages ..................................................................180
Recovery Software Packages .................................................................180
Before You Begin .........................................................................................181
Downloading Software Upgrades from Juniper Networks ............................181
Installing Software Upgrades with the J-Web Interface ................................182
Installing Software Upgrades from a Remote Server .............................182
Installing Software Upgrades by Uploading Files ...................................183
Installing Software Upgrades with the CLI ...................................................184
Table of Contents
■
xi
J-series™ Services Router Administration Guide
Downgrading the Software ..........................................................................185
Downgrading the Software with the J-Web Interface .............................185
Downgrading the Software with the CLI ................................................185
Configuring Boot Devices ............................................................................186
Configuring a Boot Device for Backup with the J-Web Interface ............186
Configuring a Boot Device for Backup with the CLI ...............................189
Configuring a Boot Device to Receive Software Failure Memory
Snapshots .......................................................................................190
Recovering Primary Boot Devices ...............................................................191
Why Compact Flash Recovery Might Be Necessary ...............................191
Recommended Recovery Hardware and Software ................................192
Configuring Internal Compact Flash Recovery ......................................192
Rebooting or Halting a Services Router .......................................................194
Rebooting or Halting a Services Router with the J-Web Interface ..........194
Rebooting a Services Router with the CLI .............................................195
Halting a Services Router with the CLI ..................................................196
Chapter 11
Managing Files
199
Before You Begin .........................................................................................199
Managing Files with the J-Web Interface ......................................................199
Cleaning Up Files ..................................................................................199
Downloading Files ................................................................................200
Deleting the Backup Software Image ...........................................................201
Cleaning Up Files with the CLI .....................................................................201
Managing Accounting Files ..........................................................................202
Encrypting and Decrypting Configuration Files ...........................................203
Encrypting Configuration Files ..............................................................204
Decrypting Configuration Files ..............................................................205
Modifying the Encryption Key ..............................................................205
Part 4
Diagnosing Performance and Network Problems
Chapter 12
Using Services Router Diagnostic Tools
209
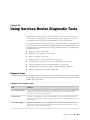
Diagnostic Terms ........................................................................................209
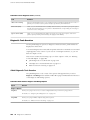
Diagnostic Tools Overview ..........................................................................210
J-Web Diagnostic Tools Overview .........................................................210
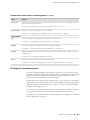
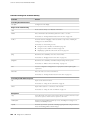
CLI Diagnostic Commands Overview ....................................................211
MPLS Connection Checking ..................................................................213
Before You Begin .........................................................................................215
General Preparation ..............................................................................215
Ping MPLS Preparation .........................................................................215
MPLS Enabled ................................................................................215
Loopback Address ..........................................................................215
Source Address for Probes ..............................................................215
xii
■
Table of Contents
Table of Contents
Pinging Hosts from the J-Web Interface .......................................................216
Using the J-Web Ping Host Tool ............................................................216
Ping Host Results and Output Summary ...............................................218
Checking MPLS Connections from the J-Web Interface ................................219
Using the J-Web Ping MPLS Tool ...........................................................219
Ping MPLS Results and Output ..............................................................222
Tracing Unicast Routes from the J-Web Interface ........................................223
Using the J-Web Traceroute Tool ...........................................................223
Traceroute Results and Output Summary .............................................225
Capturing and Viewing Packets with the J-Web Interface ............................226
Using J-Web Packet Capture ..................................................................226
Packet Capture Results and Output Summary .......................................229
Using CLI Diagnostic Commands ................................................................230
Pinging Hosts from the CLI ...................................................................230
Checking MPLS Connections from the CLI ............................................232
Pinging RSVP-Signaled LSPs and LDP-Signaled LSPs ......................233
Pinging Layer 3 VPNs .....................................................................234
Pinging Layer 2 VPNs .....................................................................235
Pinging Layer 2 Circuits ..................................................................236
Tracing Unicast Routes from the CLI .....................................................237
Using the traceroute Command ......................................................237
Using the traceroute monitor Command ........................................238
Tracing Multicast Routes from the CLI ..................................................240
Using the mtrace from-source Command .......................................241
Using the mtrace monitor Command .............................................243
Displaying Log and Trace Files from the CLI .........................................244
Monitoring Interfaces and Traffic from the CLI .....................................245
Using the monitor interface Command ..........................................245
Using the monitor traffic Command ...............................................246
Chapter 13
Configuring Packet Capture
253
Packet Capture Terms .................................................................................253
Packet Capture Overview ............................................................................254
Packet Capture on Router Interfaces .....................................................255
Firewall Filters for Packet Capture ........................................................255
Packet Capture Files .............................................................................256
Analysis of Packet Capture Files ............................................................256
Before You Begin .........................................................................................257
Configuring Packet Capture with a Configuration Editor ..............................257
Enabling Packet Capture (Required) ......................................................257
Configuring Packet Capture on an Interface (Required) .........................259
Configuring a Firewall Filter for Packet Capture (Optional) ...................259
Disabling Packet Capture ......................................................................261
Deleting Packet Capture Files ................................................................261
Changing Encapsulation on Interfaces with Packet Capture Configured ......262
Verifying Packet Capture .............................................................................263
Displaying a Packet Capture Configuration ...........................................263
Displaying a Firewall Filter for Packet Capture Configuration ................264
Verifying Captured Packets ...................................................................264
Table of Contents
■
xiii
J-series™ Services Router Administration Guide
Chapter 14
Configuring RPM Probes
267
RPM Terms .................................................................................................267
RPM Overview ............................................................................................268
RPM Probes ..........................................................................................268
RPM Tests .............................................................................................269
Probe and Test Intervals .......................................................................269
Jitter Measurement with Hardware Timestamping ................................269
RPM Statistics .......................................................................................270
RPM Thresholds and Traps ...................................................................271
RPM for BGP Monitoring .......................................................................271
Before You Begin .........................................................................................271
Configuring RPM with Quick Configuration .................................................271
Configuring RPM with a Configuration Editor ..............................................276
Configuring Basic RPM Probes ..............................................................276
Configuring TCP and UDP Probes .........................................................279
Tuning RPM Probes ..............................................................................282
Configuring RPM Probes to Monitor BGP Neighbors .............................283
Configuring RPM Probes for BGP Monitoring ..................................283
Directing RPM Probes to Select BGP Routers ..................................285
Verifying an RPM Configuration ..................................................................285
Verifying RPM Services .........................................................................286
Verifying RPM Statistics ........................................................................286
Verifying RPM Probe Servers ................................................................288
Part 5
Index
Index ...........................................................................................................291
xiv
■
Table of Contents
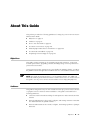
About This Guide
This preface provides the following guidelines for using the J-series™ Services Router
Administration Guide:
■
Objectives on page xv
■
Audience on page xv
■
How to Use This Guide on page xvi
■
Document Conventions on page xvii
■
Related Juniper Networks Documentation on page xviii
■
Documentation Feedback on page xxi
■
Requesting Technical Support on page xxi
Objectives
This guide contains instructions for managing users and operations, monitoring
network performance, upgrading software, and diagnosing common problems on
J-series Services Routers.
J-series Services Router operations are controlled by the JUNOS software. You direct
the JUNOS software through either a Web browser or a command-line interface (CLI).
NOTE: This guide documents Release 9.1 of the JUNOS software. For additional
information about J-series Services Routers—either corrections to or omissions from
this guide—see the J-series Services Router Release Notes at http://www.juniper.net.
Audience
This guide is designed for anyone who installs and sets up a J-series Services Router
or prepares a site for Services Router installation. The guide is intended for the
following audiences:
■
Customers with technical knowledge of and experience with networks and the
Internet
■
Network administrators who install, configure, and manage Internet routers but
are unfamiliar with the JUNOS software
■
Network administrators who install, configure, and manage products of Juniper
Networks
Objectives
■
xv
J-series™ Services Router Administration Guide
Personnel operating the equipment must be trained and competent; must not conduct
themselves in a careless, willfully negligent, or hostile manner; and must abide by
the instructions provided by the documentation.
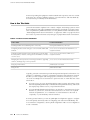
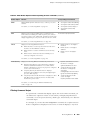
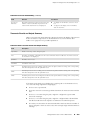
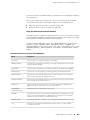
How to Use This Guide
J-series documentation explains how to install, configure, and manage J-series routers
by providing information about JUNOS implementation specifically on J-series routers.
(For comprehensive JUNOS information, see the JUNOS software manuals listed in
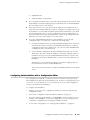
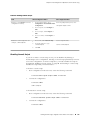
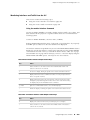
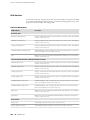
“Related Juniper Networks Documentation” on page xviii.) Table 1 on page xvi shows
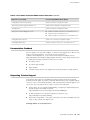
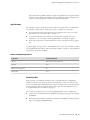
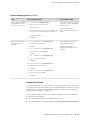
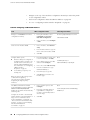
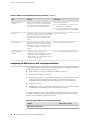
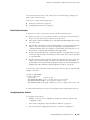
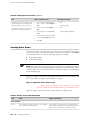
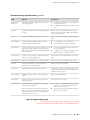
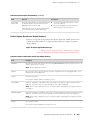
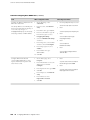
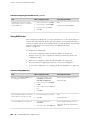
the location of J-series information, by task type, in Juniper Networks documentation.
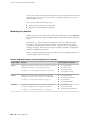
Table 1: Location of J-series Information
J-series Tasks
Location of Instruction
Installing hardware and establishing basic connectivity
Getting Started Guide for your router
Configuring interfaces and routing protocols such as RIP, OSPF, BGP,
and IS-IS
J-series Services Router Basic LAN and WAN Access
Configuration Guide
Configuring advanced features such as virtual private networks (VPNs),
IP Security (IPSec), multicast, routing policies, firewall filters, and class
of service (CoS)
J-series Services Router Advanced WAN Access
Configuration Guide
Managing users and operations, monitoring performance, upgrading
software, and diagnosing common problems
J-series Services Router Administration Guide
Using the J-Web interface
J-Web Interface User Guide
Using the CLI
JUNOS CLI User Guide
Typically, J-series documentation provides both general and specific information—for
example, a configuration overview, configuration examples, and verification methods.
Because you can configure and manage J-series routers in several ways, you can
choose from multiple sets of instructions to perform a task. To make best use of this
information:
■
If you are new to the topic—Read through the initial overview information, keep
the related JUNOS guide handy for details about the JUNOS hierarchy, and follow
the step-by-step instructions for your preferred interface.
■
If you are already familiar with the feature—Go directly to the instructions for the
interface of your choice, and follow the instructions. You can choose a J-Web
method, the JUNOS CLI, or a combination of methods based on the level of
complexity or your familiarity with the interface.
For many J-series features, you can use J-Web Quick Configuration pages to configure
the router quickly and easily without configuring each statement individually. For
more extensive configuration, use the J-Web configuration editor or CLI configuration
mode commands.
xvi
■
How to Use This Guide
About This Guide
To monitor, diagnose, and manage a router, use the J-Web interface or CLI operational
mode commands.
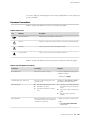
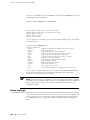
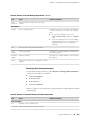
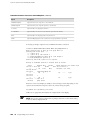
Document Conventions
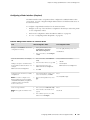
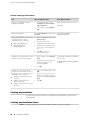
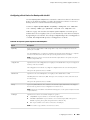
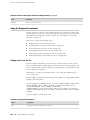
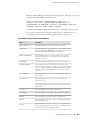
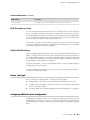
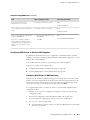
Table 2 on page xvii defines the notice icons used in this guide.
Table 2: Notice Icons
Icon
Meaning
Description
Informational note
Indicates important features or instructions.
Caution
Indicates a situation that might result in loss of data or hardware damage.
Warning
Alerts you to the risk of personal injury or death.
Laser warning
Alerts you to the risk of personal injury from a laser.
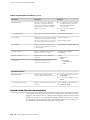
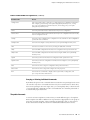
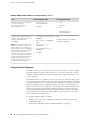
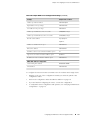
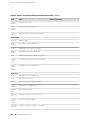
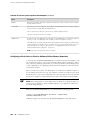
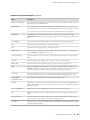
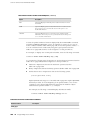
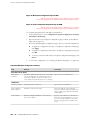
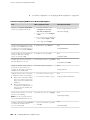
Table 3 on page xvii defines the text and syntax conventions used in this guide.
Table 3: Text and Syntax Conventions
Convention
Description
Examples
Bold text like this
Represents text that you type.
To enter configuration mode, type the
configure command:
user@host> configure
Fixed-width text like this
Represents output that appears on the
terminal screen.
Italic text like this
■
Introduces important new terms.
■
Identifies book names.
■
Identifies RFC and Internet draft
titles.
Italic text like this
Represents variables (options for which
you substitute a value) in commands or
configuration statements.
user@host> show chassis alarms
No alarms currently active
■
A policy term is a named structure
that defines match conditions and
actions.
■
JUNOS System Basics Configuration
Guide
■
RFC 1997, BGP Communities
Attribute
Configure the machine’s domain name:
[edit]
root@# set system domain-name
domain-name
Document Conventions
■
xvii
J-series™ Services Router Administration Guide
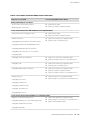
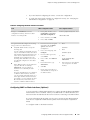
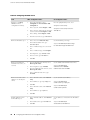
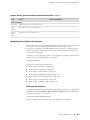
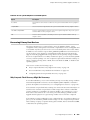
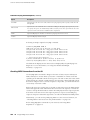
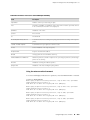
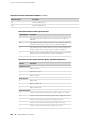
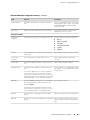
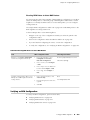
Table 3: Text and Syntax Conventions (continued)
Convention
Description
Examples
Plain text like this
Represents names of configuration
statements, commands, files, and
directories; IP addresses; configuration
hierarchy levels; or labels on routing
platform components.
■
< > (angle brackets)
Enclose optional keywords or variables.
stub <default-metric metric>;
| (pipe symbol)
Indicates a choice between the mutually
exclusive keywords or variables on either
side of the symbol. The set of choices is
often enclosed in parentheses for clarity.
broadcast | multicast
# (pound sign)
Indicates a comment specified on the
same line as the configuration statement
to which it applies.
rsvp { # Required for dynamic MPLS only
[ ] (square brackets)
Enclose a variable for which you can
substitute one or more values.
community name members [
community-ids ]
Indention and braces ( { } )
Identify a level in the configuration
hierarchy.
; (semicolon)
Identifies a leaf statement at a
configuration hierarchy level.
To configure a stub area, include
the stub statement at the [edit
protocols ospf area area-id]
hierarchy level.
■
The console port is labeled
CONSOLE.
(string1 | string2 | string3)
[edit]
routing-options {
static {
route default {
nexthop address;
retain;
}
}
}
J-Web GUI Conventions
Bold text like this
Represents J-Web graphical user
interface (GUI) items you click or select.
> (bold right angle bracket)
Separates levels in a hierarchy of J-Web
selections.
■
In the Logical Interfaces box, select
All Interfaces.
■
To cancel the configuration, click
Cancel.
In the configuration editor hierarchy,
select Protocols>Ospf.
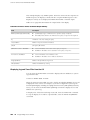
Related Juniper Networks Documentation
J-series Services Routers are documented in multiple guides. Although the J-series
guides provide instructions for configuring and managing a Services Router with the
JUNOS CLI, they are not a comprehensive JUNOS software resource. For complete
documentation of the statements and commands described in J-series guides, see
the JUNOS software manuals listed in Table 4 on page xix.
xviii
■
Related Juniper Networks Documentation
About This Guide
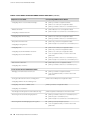
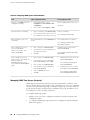
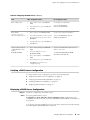
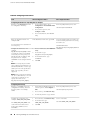
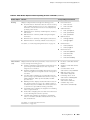
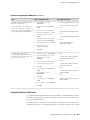
Table 4: J-series Guides and Related JUNOS Software Publications
Chapter in a J-series Guide
Corresponding JUNOS Software Manual
Getting Started Guide for Your Router
“Services Router User Interface Overview”
■
JUNOS CLI User Guide
■
JUNOS System Basics Configuration Guide
“Establishing Basic Connectivity”
J-series Services Router Basic LAN and WAN Access Configuration Guide
“Using Services Router Configuration Tools”
“Interfaces Overview”
■
JUNOS CLI User Guide
■
JUNOS System Basics Configuration Guide
■
JUNOS Network Interfaces Configuration Guide
■
JUNOS Interfaces Command Reference
■
JUNOS Services Interfaces Configuration Guide
■
JUNOS System Basics and Services Command Reference
■
JUNOS Network Interfaces Configuration Guide
■
JUNOS Interfaces Command Reference
■
JUNOS Network Interfaces Configuration Guide
■
JUNOS System Basics Configuration Guide
■
JUNOS System Basics and Services Command Reference
■
JUNOS Routing Protocols Configuration Guide
■
JUNOS Routing Protocols and Policies Command Reference
“Configuring DS1, DS3, Ethernet, and Serial Interfaces”
“Configuring Channelized T1/E1/ISDN PRI Interfaces”
“Configuring Digital Subscriber Line Interfaces
“Configuring Point-to-Point Protocol over Ethernet”
“Configuring ISDN”
“Configuring Link Services Interfaces”
“Configuring VoIP”
“Configuring uPIMs as Ethernet Switches”
“Routing Overview”
“Configuring Static Routes”
“Configuring a RIP Network”
“Configuring an OSPF Network”
“Configuring the IS-IS Protocol”
“Configuring BGP Sessions”
J-series Services Router Advanced WAN Access Configuration Guide
“Multiprotocol Label Switching Overview”
“Configuring Signaling Protocols for Traffic Engineering”
■
JUNOS MPLS Applications Configuration Guide
■
JUNOS Routing Protocols and Policies Command Reference
■
JUNOS VPNs Configuration Guide
“Configuring Virtual Private Networks”
“Configuring CLNS VPNs”
Related Juniper Networks Documentation
■
xix
J-series™ Services Router Administration Guide
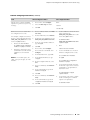
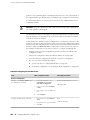
Table 4: J-series Guides and Related JUNOS Software Publications (continued)
Chapter in a J-series Guide
Corresponding JUNOS Software Manual
“Configuring IPSec for Secure Packet Exchange”
■
JUNOS System Basics Configuration Guide
■
JUNOS Services Interfaces Configuration Guide
■
JUNOS System Basics and Services Command Reference
■
JUNOS Multicast Protocols Configuration Guide
■
JUNOS Routing Protocols and Policies Command Reference
■
JUNOS Services Interfaces Configuration Guide
■
JUNOS System Basics and Services Command Reference
■
JUNOS Policy Framework Configuration Guide
■
JUNOS Routing Protocols and Policies Command Reference
■
JUNOS Network Interfaces Configuration Guide
■
JUNOS Policy Framework Configuration Guide
■
JUNOS Services Interfaces Configuration Guide
■
Secure Configuration Guide for Common Criteria and
JUNOS-FIPS
■
JUNOS System Basics and Services Command Reference
■
JUNOS Routing Protocols and Policies Command Reference
■
JUNOS Class of Service Configuration Guide
■
JUNOS System Basics and Services Command Reference
■
JUNOS System Basics Configuration Guide
■
Secure Configuration Guide for Common Criteria and
JUNOS-FIPS
“Multicast Overview”
“Configuring a Multicast Network”
“Configuring Data Link Switching”
“Policy Framework Overview”
“Configuring Routing Policies”
“Configuring NAT”
“Configuring Stateful Firewall Filters and NAT”
“Configuring Stateless Firewall Filters”
“Class-of-Service Overview”
“Configuring Class of Service”
J-series Services Router Administration Guide
“Managing User Authentication and Access”
“Setting Up USB Modems for Remote Management”
JUNOS Network Management Configuration Guide
“Configuring SNMP for Network Management”
“Configuring the Router as a DHCP Server”
JUNOS System Basics Configuration Guide
“Configuring Autoinstallation”
“Automating Network Operations and Troubleshooting”
JUNOS Configuration and Diagnostic Automation Guide
“Monitoring the Router and Routing Operations”
■
JUNOS System Basics and Services Command Reference
■
JUNOS Interfaces Command Reference
■
JUNOS Routing Protocols and Policies Command Reference
■
JUNOS System Log Messages Reference
■
Secure Configuration Guide for Common Criteria and
JUNOS-FIPS
“Monitoring Events and Managing System Log Files”
xx
■
Related Juniper Networks Documentation
About This Guide
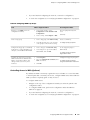
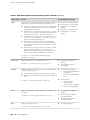
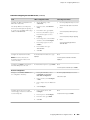
Table 4: J-series Guides and Related JUNOS Software Publications (continued)
Chapter in a J-series Guide
Corresponding JUNOS Software Manual
“Configuring and Monitoring Alarms”
JUNOS System Basics Configuration Guide
“Performing Software Upgrades and Reboots”
JUNOS Software Installation and Upgrade Guide
“Managing Files”
JUNOS System Basics Configuration Guide
“Using Services Router Diagnostic Tools”
■
JUNOS System Basics and Services Command Reference
■
JUNOS Interfaces Command Reference
■
JUNOS Routing Protocols and Policies Command Reference
“Configuring Packet Capture”
JUNOS Services Interfaces Configuration Guide
“Configuring RPM Probes”
JUNOS System Basics and Services Command Reference
Documentation Feedback
We encourage you to provide feedback, comments, and suggestions so that we can
improve the documentation. You can send your comments to
[email protected], or fill out the documentation feedback form at
http://www.juniper.net/techpubs/docbug/docbugreport.html. If you are using e-mail, be sure
to include the following information with your comments:
■
Document name
■
Document part number
■
Page number
■
Software release version (not required for Network Operations Guides [NOGs])
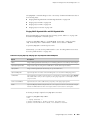
Requesting Technical Support
Technical product support is available through the Juniper Networks Technical
Assistance Center (JTAC). If you are a customer with an active J-Care or JNASC support
contract, or are covered under warranty, and need postsales technical support, you
can access our tools and resources online or open a case with JTAC.
■
JTAC policies—For a complete understanding of our JTAC procedures and policies,
review the JTAC User Guide located at
http://www.juniper.net/customers/support/downloads/710059.pdf.
■
Product warranties—For product warranty information, visit
http://www.juniper.net/support/warranty/.
■
JTAC Hours of Operation —The JTAC centers have resources available 24 hours
a day, 7 days a week, 365 days a year.
Self-Help Online Tools and Resources
Documentation Feedback
■
xxi
J-series™ Services Router Administration Guide
For quick and easy problem resolution, Juniper Networks has designed an online
self-service portal called the Customer Support Center (CSC) that provides you with
the following features:
■
Find CSC offerings: http://www.juniper.net/customers/support/
■
Search for known bugs: http://www2.juniper.net/kb/
■
Find product documentation: http://www.juniper.net/techpubs/
■
Find solutions and answer questions using our Knowledge Base:
http://kb.juniper.net/
■
Download the latest versions of software and review release notes:
http://www.juniper.net/customers/csc/software/
■
Search technical bulletins for relevant hardware and software notifications:
https://www.juniper.net/alerts/
■
Join and participate in the Juniper Networks Community Forum:
http://www.juniper.net/company/communities/
■
Open a case online in the CSC Case Manager: http://www.juniper.net/cm/
To verify service entitlement by product serial number, use our Serial Number
Entitlement (SNE) Tool located at https://tools.juniper.net/SerialNumberEntitlementSearch/.
Opening a Case with JTAC
You can open a case with JTAC on the Web or by telephone.
■
Use the Case Manager tool in the CSC at http://www.juniper.net/cm/ .
■
Call 1-888-314-JTAC (1-888-314-5822 toll-free in the USA, Canada, and Mexico).
For international or direct-dial options in countries without toll-free numbers, visit
us at http://www.juniper.net/support/requesting-support.html.
xxii
■
Requesting Technical Support
Part 1
Configuring a Services Router for
Administration
■
Managing User Authentication and Access on page 3
■
Setting Up USB Modems for Remote Management on page 29
■
Configuring SNMP for Network Management on page 47
■
Configuring the Router as a DHCP Server on page 63
■
Configuring Autoinstallation on page 81
■
Automating Network Operations and Troubleshooting on page 89
Configuring a Services Router for Administration
■
1
J-series™ Services Router Administration Guide
2
■
Configuring a Services Router for Administration
Chapter 1
Managing User Authentication and Access
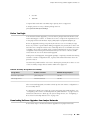
You can use either J-Web Quick Configuration or a configuration editor to manage
system functions, including RADIUS and TACACS+ servers, and user login accounts.
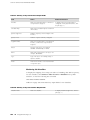
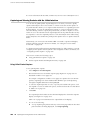
This chapter contains the following topics. For more information about system
management, see the JUNOS System Basics Configuration Guide.
If the router is operating in a Common Criteria environment, see the Secure
Configuration Guide for Common Criteria and JUNOS-FIPS.
■
User Authentication Terms on page 3
■
User Authentication Overview on page 4
■
Before You Begin on page 8
■
Managing User Authentication with Quick Configuration on page 8
■
Managing User Authentication with a Configuration Editor on page 12
■
Recovering the Root Password on page 21
■
Securing the Console Port on page 23
■
Accessing Remote Devices with the CLI on page 24
■
Configuring Password Retry Limits for Telnet and SSH Access on page 26
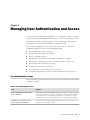
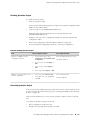
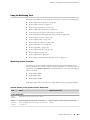
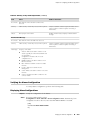
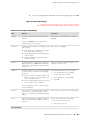
User Authentication Terms
Before performing system management tasks, become familiar with the terms defined
in Table 5 on page 3.
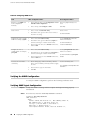
Table 5: System Management Terms
Term
Definition
Remote Authentication Dial-In User
Service (RADIUS)
Authentication method for validating users who attempt to access one or more
Services Routers by means of Telnet. RADIUS is a multivendor IETF standard
whose features are more widely accepted than those of TACACS+ or other
proprietary systems. All one-time-password system vendors support RADIUS.
Terminal Access Controller Access
Control System Plus (TACACS+)
Authentication method for validating users who attempt to access one or more
Services Routers by means of Telnet.
User Authentication Terms
■
3
J-series™ Services Router Administration Guide
User Authentication Overview
This section contains the following topics:
■
User Authentication on page 4
■
User Accounts on page 4
■
Login Classes on page 5
■
Template Accounts on page 7
User Authentication
The JUNOS software supports three methods of user authentication: local password
authentication, Remote Authentication Dial-In User Service (RADIUS), and Terminal
Access Controller Access Control System Plus (TACACS+).
With local password authentication, you configure a password for each user allowed
to log into the Services Router.
RADIUS and TACACS+ are authentication methods for validating users who attempt
to access the router using Telnet. Both are distributed client/server systems—the
RADIUS and TACACS+ clients run on the router, and the server runs on a remote
network system.
You can configure the router to use RADIUS or TACACS+ authentication, or both,
to validate users who attempt to access the router. If you set up both authentication
methods, you also can configure which the router will try first.
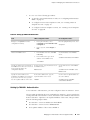
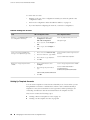
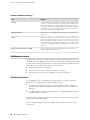
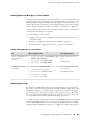
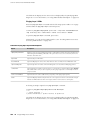
User Accounts
User accounts provide one way for users to access the Services Router. Users can
access the router without accounts if you configured RADIUS or TACACS+ servers,
as described in “Managing User Authentication with Quick Configuration” on page
8 and “Managing User Authentication with a Configuration Editor” on page 12.
After you have created an account, the router creates a home directory for the user.
An account for the user root is always present in the configuration. For information
about configuring the password for the user root, see the Getting Started Guide for
your router. For each user account, you can define the following:
4
■
■
Username—Name that identifies the user. It must be unique within the router.
Do not include spaces, colons, or commas in the username.
■
User's full name—If the full name contains spaces, enclose it in quotation marks
(“ ”). Do not include colons or commas.
■
User identifier (UID)—Numeric identifier that is associated with the user account
name. The identifier must be in the range 100 through 64000 and must be unique
within the router. If you do not assign a UID to a username, the software assigns
one when you commit the configuration, preferring the lowest available number.
■
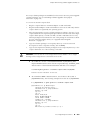
User's access privilege—You can create login classes with specific permission
bits or use one of the default classes listed in Table 6 on page 5.
■
Authentication method or methods and passwords that the user can use to access
the router—You can use SSH or an MD5 password, or you can enter a plain-text
User Authentication Overview
Chapter 1: Managing User Authentication and Access
password that the JUNOS software encrypts using MD5-style encryption before
entering it in the password database. If you configure the plain-text-password
option, you are prompted to enter and confirm the password.
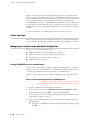
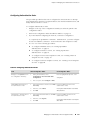
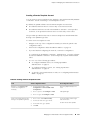
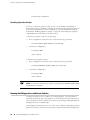
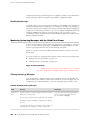
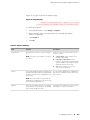
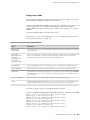
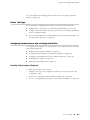
Login Classes
All users who log into the Services Router must be in a login class. You can define
any number of login classes. With login classes, you define the following:
■
Access privileges users have when they are logged into the router. For more
information, see “Permission Bits” on page 5.
■
Commands and statements that users can and cannot specify. For more
information, see “Denying or Allowing Individual Commands” on page 7.
■
How long a login session can be idle before it times out and the user is logged
off.
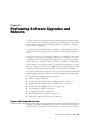
You then apply one login class to an individual user account. The software contains
a few predefined login classes, which are listed in Table 6 on page 5. The predefined
login classes cannot be modified.
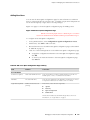
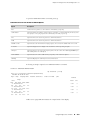
Table 6: Predefined Login Classes
Login Class
Permission Bits Set
operator
clear, network, reset, trace, view
read-only
view
super-user and superuser
all
unauthorized
None
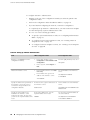
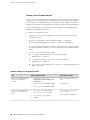
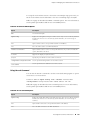
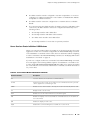
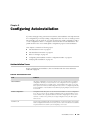
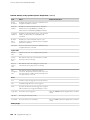
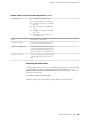
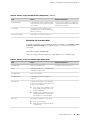
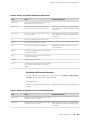
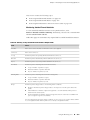
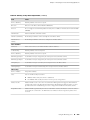
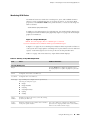
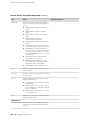
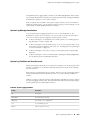
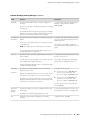
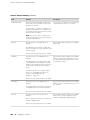
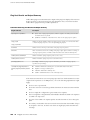
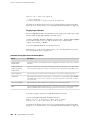
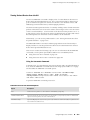
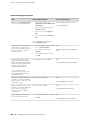
Permission Bits
Each top-level command-line interface (CLI) command and each configuration
statement has an access privilege level associated with it. Users can execute only
those commands and configure and view only those statements for which they have
access privileges. The access privileges for each login class are defined by one or
more permission bits (see Table 7 on page 6).
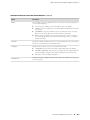
Two forms for the permissions control the individual parts of the configuration:
■
"Plain" form—Provides read-only capability for that permission type. An example
is interface.
■
Form that ends in -control—Provides read and write capability for that permission
type. An example is interface-control.
User Authentication Overview
■
5
J-series™ Services Router Administration Guide
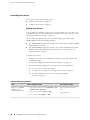
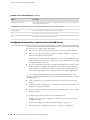
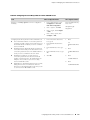
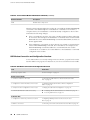
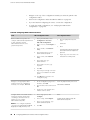
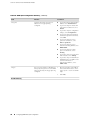
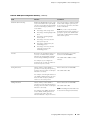
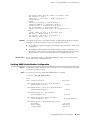
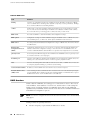
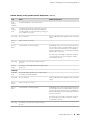
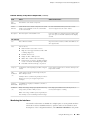
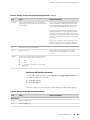
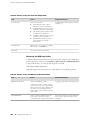
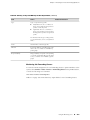
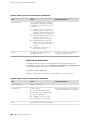
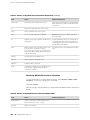
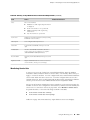
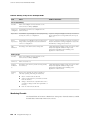
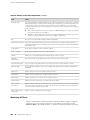
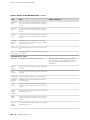
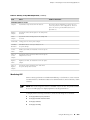
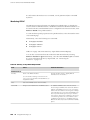
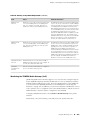
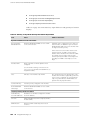
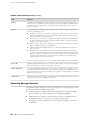
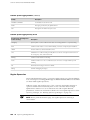
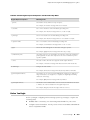
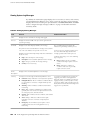
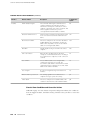
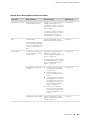
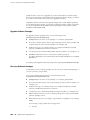
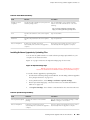
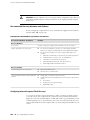
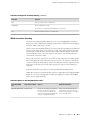
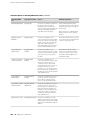
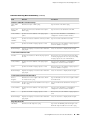
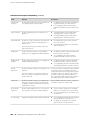
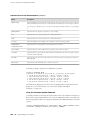
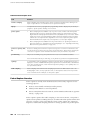
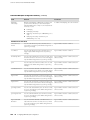
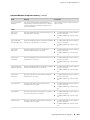
Table 7: Permission Bits for Login Classes
6
Permission Bit
Access
admin
Can view user account information in configuration mode and with the show configuration
command.
admin-control
Can view user accounts and configure them (at the [edit system login] hierarchy level).
access
Can view the access configuration in configuration mode and with the show configuration
operational mode command.
access-control
Can view and configure access information (at the [edit access] hierarchy level).
all
Has all permissions.
clear
Can clear (delete) information learned from the network that is stored in various network
databases (using the clear commands).
configure
Can enter configuration mode (using the configure command) and commit configurations
(using the commit command).
control
Can perform all control-level operations (all operations configured with the -control
permission bits).
field
Reserved for field (debugging) support.
firewall
Can view the firewall filter configuration in configuration mode.
firewall-control
Can view and configure firewall filter information (at the [edit firewall] hierarchy level).
floppy
Can read from and write to the removable media.
interface
Can view the interface configuration in configuration mode and with the show
configuration operational mode command.
interface-control
Can view chassis, class of service, groups, forwarding options, and interfaces
configuration information. Can configure chassis, class of service, groups, forwarding
options, and interfaces (at the [edit] hierarchy).
maintenance
Can perform system maintenance, including starting a local shell on the router and
becoming the superuser in the shell (by issuing the su root command), and can halt and
reboot the router (using the request system commands).
network
Can access the network by entering the ping, ssh, telnet, and traceroute commands.
reset
Can restart software processes using the restart command and can configure whether
software processes are enabled or disabled (at the [edit system processes] hierarchy
level).
rollback
Can use the rollback command to return to a previously committed configuration other
than the most recently committed one.
routing
Can view general routing, routing protocol, and routing policy configuration information
in configuration and operational modes.
■
User Authentication Overview
Chapter 1: Managing User Authentication and Access
Table 7: Permission Bits for Login Classes (continued)
Permission Bit
Access
routing-control
Can view general routing, routing protocol, and routing policy configuration information
and configure general routing (at the [edit routing-options] hierarchy level), routing
protocols (at the [edit protocols] hierarchy level), and routing policy (at the [edit
policy-options] hierarchy level).
secret
Can view passwords and other authentication keys in the configuration.
secret-control
Can view passwords and other authentication keys in the configuration and can modify
them in configuration mode.
security
Can view security configuration in configuration mode and with the show configuration
operational mode command.
security-control
Can view and configure security information (at the [edit security] hierarchy level).
shell
Can start a local shell on the router by entering the start shell command.
snmp
Can view SNMP configuration information in configuration and operational modes.
snmp-control
Can view SNMP configuration information and configure SNMP (at the [edit snmp]
hierarchy level).
system
Can view system-level information in configuration and operational modes.
system-control
Can view system-level configuration information and configure it (at the [edit system]
hierarchy level).
trace
Can view trace file settings in configuration and operational modes.
trace-control
Can view trace file settings and configure trace file properties.
view
Can use various commands to display current systemwide, routing table, and
protocol-specific values and statistics.
Denying or Allowing Individual Commands
By default, all top-level CLI commands have associated access privilege levels. Users
can execute only those commands and view only those statements for which they
have access privileges. For each login class, you can explicitly deny or allow the use
of operational and configuration mode commands that are otherwise permitted or
not allowed by a permission bit.
Template Accounts
You use local user template accounts when you need different types of templates.
Each template can define a different set of permissions appropriate for the group of
users who use that template. These templates are defined locally on the Services
Router and referenced by the TACACS+ and RADIUS authentication servers.
User Authentication Overview
■
7
J-series™ Services Router Administration Guide
When you configure local user templates and a user logs in, the JUNOS software
issues a request to the authentication server to authenticate the user's login name.
If a user is authenticated, the server returns the local username to the router, which
then determines whether a local username is specified for that login name
(local-username for TACACS+, Juniper-Local-User for RADIUS). If so, the router selects
the appropriate local user template locally configured on the router. If a local user
template does not exist for the authenticated user, the router defaults to the remote
template.
For more information, see “Setting Up Template Accounts” on page 18.
Before You Begin
Before you perform any system management tasks, you must perform the initial
Services Router configuration described in the Getting Started Guide for your router.
Managing User Authentication with Quick Configuration
This section contains the following topics:
■
Adding a RADIUS Server for Authentication on page 8
■
Adding a TACACS+ Server for Authentication on page 9
■
Configuring System Authentication on page 10
■
Adding New Users on page 11
Adding a RADIUS Server for Authentication
You can use the Users Quick Configuration page for RADIUS servers to configure a
RADIUS server for system authentication. This Quick Configuration page allows you
to specify the IP address and secret (password) of the RADIUS server.
Figure 1 on page 8 shows the Users Quick Configuration page for RADIUS servers.
Figure 1: Users Quick Configuration Page for RADIUS Servers
ERROR: Unresolved graphic fileref="s020241.gif" not found in
"\\teamsite1\default\main\TechPubsWorkInProgress\STAGING\images\".
To configure a RADIUS server with Quick Configuration:
1.
In the J-Web interface, select Configuration>Quick Configuration>Users.
2.
Under RADIUS servers, click Add to configure a RADIUS server.
3.
Enter information into the Users Quick Configuration page for RADIUS servers,
as described in Table 8 on page 9.
4.
Click one of the following buttons on the Users Quick Configuration page for
RADIUS servers:
■
8
■
Before You Begin
To apply the configuration and return to the Users Quick Configuration page,
click OK.
Chapter 1: Managing User Authentication and Access
■
To cancel your entries and return to the Users Quick Configuration page,
click Cancel.
Table 8: Users Quick Configuration for RADIUS Servers Summary
Field
Function
Your Action
RADIUS Server Address
(required)
Identifies the IP address of the RADIUS
server.
Type the RADIUS server’s 32-bit IP address, in
dotted decimal notation.
RADIUS Server Secret (required)
The secret (password) of the RADIUS
server.
Type the secret (password) of the RADIUS server.
Secrets can contain spaces. The secret used must
match that used by the RADIUS server.
Verify RADIUS Server Secret
(required)
Verifies the secret (password) of the
RADIUS server is entered correctly.
Retype the secret of the RADIUS server.
RADIUS Server
Adding a TACACS+ Server for Authentication
You can use the Users Quick Configuration page for TACACS+ servers to configure
a TACACS+ server for system authentication. This Quick Configuration page allows
you to specify the IP address and secret of the TACACS+ server.
Figure 2 on page 9 shows the Users Quick Configuration page for TACACS+ servers.
Figure 2: Users Quick Configuration Page for TACACS+ Servers
ERROR: Unresolved graphic fileref="s020242.gif" not found in
"\\teamsite1\default\main\TechPubsWorkInProgress\STAGING\images\".
To configure a TACACS+ server with Quick Configuration:
1.
In the J-Web interface, select Configuration>Quick Configuration>Users.
2.
Under TACACS+ servers, click Add to configure a TACACS+ server.
3.
Enter information into the Users Quick Configuration page for TACACS+ servers,
as described in Table 9 on page 10.
4.
Click one of the following buttons on the Users Quick Configuration page for
TACACS+ servers:
■
To apply the configuration and return to the Users Quick Configuration page,
click OK.
■
To cancel your entries and return to the Users Quick Configuration page,
click Cancel.
Managing User Authentication with Quick Configuration
■
9
J-series™ Services Router Administration Guide
Table 9: Users Quick Configuration for TACACS+ Servers Summary
Field
Function
Your Action
TACACS+ Server Address
(required)
Identifies the IP address of the
TACACS+ server.
Type the TACACS+ server’s 32-bit IP address, in
dotted decimal notation.
TACACS+ Server Secret
(required)
The secret (password) of the TACACS+
server.
Type the secret (password) of the TACACS+
server. Secrets can contain spaces. The secret
used must match that used by the TACACS+
server.
Verify TACACS+ Server Secret
(required)
Verifies the secret (password) of the
TACACS+ server is entered correctly.
Retype the secret of the TACACS+ server.
TACACS+ Server
Configuring System Authentication
On the Users Quick Configuration page, you can configure the authentication methods
the Services Router uses to verify that a user can gain access. For each login attempt,
the router tries the authentication methods in order, starting with the first one, until
the password matches.
If you do not configure system authentication, users are verified based on their
configured local passwords.
Figure 3 on page 10 shows the Users Quick Configuration page.
Figure 3: Users Quick Configuration Page
ERROR: Unresolved graphic fileref="s020243.gif" not found in
"\\teamsite1\default\main\TechPubsWorkInProgress\STAGING\images\".
To configure system authentication with Quick Configuration:
1.
In the J-Web interface, select Configuration>Quick Configuration>Users.
2.
Under Authentication Servers, select the check box next to each authentication
method the router must use when users log in:
3.
10
■
■
RADIUS
■
TACACS+
■
Local Password
Click one of the following buttons on the Users Quick Configuration page:
■
To apply the configuration and stay in the Users Quick Configuration page,
click Apply.
■
To apply the configuration and return to the Quick Configuration page, click
OK.
■
To cancel your entries and return to the Quick Configuration page, click
Cancel.
Managing User Authentication with Quick Configuration
Chapter 1: Managing User Authentication and Access
Adding New Users
You can use the Users Quick Configuration page for user information to add new
users to a Services Router. For each account, you define a login name and password
for the user and specify a login class for access privileges.
Figure 4 on page 11 shows the Quick Configuration page for adding a user.
Figure 4: Add a User Quick Configuration Page
ERROR: Unresolved graphic fileref="s020244.gif" not found in
"\\teamsite1\default\main\TechPubsWorkInProgress\STAGING\images\".
To configure users with Quick Configuration:
1.
In the J-Web interface, select Configuration>Quick Configuration>Users.
2.
Under Users, click Add to add a new user.
3.
Enter information into the Add a User Quick Configuration page, as described
in Table 10 on page 11.
4.
Click one of the following buttons on the Add a User Quick Configuration page:
■
To apply the configuration and return to the Users Quick Configuration page,
click OK.
■
To cancel your entries and return to the Users Quick Configuration page,
click Cancel.
Table 10: Add a User Quick Configuration Page Summary
Field
Function
Your Action
Username (required)
Name that identifies the user.
Type the username. It must be unique within the router. Do not
include spaces, colons, or commas in the username.
Full Name
The user's full name.
Type the user's full name. If the full name contains spaces, enclose
it in quotation marks. Do not include colons or commas.
Login Class (required)
Defines the user's access
privilege.
From the list, select the user's login class:
User Information
■
operator
■
read-only
■
super-user/superuser
■
unauthorized
This list also includes any user-defined login classes. For more
information, see “Login Classes” on page 5.
Managing User Authentication with Quick Configuration
■
11
J-series™ Services Router Administration Guide
Table 10: Add a User Quick Configuration Page Summary (continued)
Field
Function
Your Action
Login Password
(required)
The login password for this
user.
Type the login password for this user. The login password must
meet the following criteria:
Verify Login Password
(required)
Verifies the login password
for this user.
■
The password must be at least 6 characters long.
■
You can include most character classes in a password
(alphabetic, numeric, and special characters), except control
characters.
■
The password must contain at least one change of case or
character class.
Retype the login password for this user.
Managing User Authentication with a Configuration Editor
This section contains the following topics:
■
Setting Up RADIUS Authentication on page 12
■
Setting Up TACACS+ Authentication on page 13
■
Configuring Authentication Order on page 15
■
Controlling User Access on page 16
■
Setting Up Template Accounts on page 18
Setting Up RADIUS Authentication
To use RADIUS authentication, you must configure at least one RADIUS server.
The procedure provided in this section identifies the RADIUS server, specifies the
secret (password) of the RADIUS server, and sets the source address of the Services
Router's RADIUS requests to the loopback address of the router. The procedure uses
the following sample values:
■
The RADIUS server's IP address is 172.16.98.1.
■
The RADIUS server's secret is Radiussecret1.
■
The loopback address of the router is 10.0.0.1.
To configure RADIUS authentication:
1.
Navigate to the top of the configuration hierarchy in either the J-Web or CLI
configuration editor.
2.
Perform the configuration tasks described in Table 11 on page 13.
3.
If you are finished configuring the network, commit the configuration.
To completely set up RADIUS authentication, you must create user template
accounts and specify a system authentication order.
12
■
Managing User Authentication with a Configuration Editor
Chapter 1: Managing User Authentication and Access
4.
Go on to one of the following procedures:
■
To specify a system authentication order, see “Configuring Authentication
Order” on page 15.
■
To configure a remote user template account, see “Creating a Remote
Template Account” on page 19.
■
To configure local user template accounts, see “Creating a Local Template
Account” on page 20.
Table 11: Setting Up RADIUS Authentication
Task
J-Web Configuration Editor
Navigate to the System level in the
configuration hierarchy.
1.
Add a new RADIUS server
In the J-Web interface, select
Configuration>View and Edit>Edit
Configuration.
CLI Configuration Editor
From the [edit] hierarchy level, enter
edit system
2.
Next to System, click Configure or
Edit.
1.
In the Radius server box, click Add
new entry.
Set the IP address of the RADIUS
server:
2.
In the Address box, type the IP
address of the RADIUS server:
set radius-server address 172.16.98.1
172.16.98.1
Specify the shared secret (password) of
the RADIUS server. The secret is stored
as an encrypted value in the
configuration database.
In the Secret box, type the shared secret of
the RADIUS server:
Set the shared secret of the RADIUS
server:
Radiussecret1
set radius-server 172.16.98.1 secret
Radiussecret1
Specify the source address to be
included in the RADIUS server requests
by the router. In most cases, you can
use the loopback address of the router.
In the Source address box, type the
loopback address of the router:
Set the router's loopback address as
the source address:
10.0.0.1
set radius-server 172.16.98.1
source-address 10.0.0.1
Setting Up TACACS+ Authentication
To use TACACS+ authentication, you must configure at least one TACACS+ server.
The procedure provided in this section identifies the TACACS+ server, specifies the
secret (password) of the TACACS+ server, and sets the source address of the Services
Router's TACACS+ requests to the loopback address of the router. This procedure
uses the following sample values:
■
The TACACS+ server's IP address is 172.16.98.24.
■
The TACACS+ server's secret is Tacacssecret1.
■
The loopback address of the router is 10.0.0.1.
Managing User Authentication with a Configuration Editor
■
13
J-series™ Services Router Administration Guide
To configure TACACS+ authentication:
1.
Navigate to the top of the configuration hierarchy in either the J-Web or CLI
configuration editor.
2.
Perform the configuration tasks described in Table 12 on page 14.
3.
If you are finished configuring the network, commit the configuration.
To completely set up TACACS+ authentication, you must create user template
accounts and specify a system authentication order.
4.
Go on to one of the following procedures:
■
To specify a system authentication order, see “Configuring Authentication
Order” on page 15.
■
To configure a remote user template account, see “Creating a Remote
Template Account” on page 19.
■
To configure local user template accounts, see “Creating a Local Template
Account” on page 20.
Table 12: Setting Up TACACS+ Authentication
Task
J-Web Configuration Editor
Navigate to the System level in the
configuration hierarchy.
1.
Add a new TACACS+ server
In the J-Web interface, select
Configuration>View and Edit>Edit
Configuration.
2.
Next to System, click Configure or
Edit.
1.
In the Tacplus server box, click Add
new entry.
2.
In the Address box, type the IP
address of the TACACS+ server:
CLI Configuration Editor
From the [edit] hierarchy level, enter
edit system
Set the IP address of the TACACS+
server:
set tacplus-server address
172.16.98.24
172.16.98.24
Specify the shared secret (password) of
the TACACS+ server. The secret is
stored as an encrypted value in the
configuration database.
In the Secret box, type the shared secret of
the TACACS+ server:
Set the shared secret of the TACACS+
server:
Tacacssecret1
set tacplus-server 172.16.98.24 secret
Tacacssecret1
Specify the source address to be
included in the TACACS+ server
requests by the router. In most cases,
you can use the loopback address of the
router.
In the Source address box, type the
loopback address of the router:
Set the router's loopback address as
the source address:
10.0.0.1
set tacplus-server 172.16.98.24
source-address 10.0.0.1
14
■
Managing User Authentication with a Configuration Editor
Chapter 1: Managing User Authentication and Access
Configuring Authentication Order
The procedure provided in this section configures the Services Router to attempt
user authentication with the local password first, then with the RADIUS server, and
finally with the TACACS+ server.
To configure authentication order:
1.
Navigate to the top of the configuration hierarchy in either the J-Web or CLI
configuration editor.
2.
Perform the configuration tasks described in Table 13 on page 15.
3.
If you are finished configuring the network, commit the configuration.
To completely set up RADIUS or TACACS+ authentication, you must configure
at least one RADIUS or TACACS+ server and create user template accounts.
4.
Go on to one of the following procedures:
■
To configure a RADIUS server, see “Setting Up RADIUS
Authentication” on page 12.
■
To configure a TACACS+ server, see “Setting Up TACACS+
Authentication” on page 13.
■
To configure a remote user template account, see “Creating a Remote
Template Account” on page 19.
■
To configure local user template accounts, see “Creating a Local Template
Account” on page 20.
Table 13: Configuring Authentication Order
Task
J-Web Configuration Editor
Navigate to the System level in
the configuration hierarchy.
1.
In the J-Web interface, select
Configuration>View and Edit>Edit
Configuration.
2.
Next to System, click Configure or Edit.
1.
In the Authentication order box, click Add
new entry.
2.
In the list, select radius.
3.
Click OK.
insert system authentication-order radius
after password
1.
In the Authentication Order box, click Add
new entry.
Insert the tacplus statement in the
authentication order:
2.
In the list, select tacplus.
3.
Click OK.
Add RADIUS authentication to
the authentication order.
Add TACACS+ authentication to
the authentication order.
CLI Configuration Editor
From the [edit] hierarchy level, enter
edit system
Insert the radius statement in the
authentication order:
insert system authentication-order tacplus
after radius
Managing User Authentication with a Configuration Editor
■
15
J-series™ Services Router Administration Guide
Controlling User Access
This section contains the following topics:
■
Defining Login Classes on page 16
■
Creating User Accounts on page 17
Defining Login Classes
You can define any number of login classes. You then apply one login class to an
individual user account, as described in “Creating User Accounts” on page 17 and
“Setting Up Template Accounts” on page 18.
The procedure provided in this section creates a sample login class named
operator-and-boot with the following privileges:
■
The operator-and-boot login class can reboot the Services Router using the request
system reboot command.
■
The operator-and-boot login class can also use commands defined in the clear,
network, reset, trace, and view permission bits. For more information, see
“Permission Bits” on page 5.
To define login classes:
1.
Navigate to the top of the configuration hierarchy in either the J-Web or CLI
configuration editor.
2.
Perform the configuration tasks described in Table 14 on page 16.
3.
If you are finished configuring the network, commit the configuration.
4.
Go on to one of the following procedures:
■
To create user accounts, see “Creating User Accounts” on page 17.
■
To create shared user accounts, see “Setting Up Template
Accounts” on page 18.
Table 14: Defining Login Classes
Task
J-Web Configuration Editor
Navigate to the System
Login level in the
configuration hierarchy.
1.
In the J-Web interface, select Configuration>View
and Edit>Edit Configuration.
2.
Next to System, click Configure or Edit.
3.
Next to Login, click Configure or Edit.
16
■
Managing User Authentication with a Configuration Editor
CLI Configuration Editor
From the [edit] hierarchy level,
enter
edit system login
Chapter 1: Managing User Authentication and Access
Table 14: Defining Login Classes (continued)
Task
J-Web Configuration Editor
CLI Configuration Editor
Create a login class named
operator-and-boot with the
ability to reboot the router.
1.
Next to Class, click Add new entry.
2.
Type the name of the login class:
Set the name of the login class and
the ability to use the request system
reboot command:
operator-and-boot
3.
In the Allow commands box, type the request system
reboot command enclosed in quotation marks:
set class operator-and-boot
allow-commands “request system
reboot”
“request system reboot”
Give the operator-and-boot
login class operator
privileges.
4.
Click OK.
1.
Next to Permissions, click Add new entry.
2.
In the Value list, select clear.
3.
Click OK.
4.
Next to Permissions, click Add new entry.
5.
In the Value list, select network.
6.
Click OK.
7.
Next to Permissions, click Add new entry.
8.
In the Value list, select reset.
9.
Click OK.
Set the permission bits for the
operator-and-boot login class:
set class operator-and-boot
permissions [clear network reset
trace view]
10. Next to Permissions, click Add new entry.
11. In the Value list, select trace.
12. Click OK.
13. Next to Permissions, click Add new entry.
14. In the Value list, select view.
15. Click OK.
Creating User Accounts
User accounts provide one way for users to access the Services Router. (Users can
access the router without accounts if you configured RADIUS or TACACS+ servers,
as described in “Setting Up RADIUS Authentication” on page 12 and “Setting Up
TACACS+ Authentication” on page 13.)
The procedure provided in this section creates a sample user named cmartin with
the following characteristics:
■
The user cmartin belongs to the superuser login class.
■
The user cmartin uses an encrypted password, $1$14c5.$sBopasdFFdssdfFFdsdfs0.
Managing User Authentication with a Configuration Editor
■
17
J-series™ Services Router Administration Guide
To create user accounts:
1.
Navigate to the top of the configuration hierarchy in either the J-Web or CLI
configuration editor.
2.
Perform the configuration tasks described in Table 15 on page 18.
3.
If you are finished configuring the network, commit the configuration.
Table 15: Creating User Accounts
Task
J-Web Configuration Editor
CLI Configuration Editor
Navigate to the System Login level in
the configuration hierarchy.
1.
From the [edit] hierarchy level, enter
Create a user named cmartin who
belongs to the superuser login class.
Define the encrypted password for
cmartin.
In the J-Web interface, select
Configuration>View and
Edit>Edit Configuration.
2.
Next to System, click Configure or
Edit.
3.
Next to Login, click Configure or
Edit.
1.
Next to User, click Add new entry.
2.
In the User name box, type cmartin.
3.
In the Class box, type superuser.
4.
Click OK.
1.
Next to Authentication, click
Configure.
2.
In the Encrypted password box,
type
edit system login
Set the username and the login class for
the user:
set user cmartin class superuser
Set the encrypted password for cmartin.
set user cmartin authentication
encrypted-password
$1$14c5.$sBopasdFFdssdfFFdsdfs0
$1$14c5.$sBopasdFFdssdfFFdsdfs0
3.
Click OK.
Setting Up Template Accounts
You can create template accounts that are shared by a set of users when you are
using RADIUS or TACACS+ authentication. When a user is authenticated by a
template account, the CLI username is the login name, and the privileges, file
ownership, and effective user ID are inherited from the template account.
This section contains the following topics:
18
■
■
Creating a Remote Template Account on page 19
■
Creating a Local Template Account on page 20
Managing User Authentication with a Configuration Editor
Chapter 1: Managing User Authentication and Access
Creating a Remote Template Account
You can create a remote template that is applied to users authenticated by RADIUS
or TACACS+ that do not belong to a local template account.
By default, the JUNOS software uses the remote template account when
■
The authenticated user does not exist locally on the Services Router.
■
The authenticated user's record in the RADIUS or TACACS+ server specifies
local user, or the specified local user does not exist locally on the router.
The procedure provided in this section creates a sample user named remote that
belongs to the operator login class.
To create a remote template account:
1.
Navigate to the top of the configuration hierarchy in either the J-Web or CLI
configuration editor.
2.
Perform the configuration tasks described in Table 16 on page 19.
3.
If you are finished configuring the network, commit the configuration.
To completely set up RADIUS or TACACS+ authentication, you must configure
at least one RADIUS or TACACS+ server and specify a system authentication
order.
4.
Go on to one of the following procedures:
■
To configure a RADIUS server, see “Setting Up RADIUS
Authentication” on page 12.
■
To configure a TACACS+ server, see “Setting Up TACACS+
Authentication” on page 13.
■
To specify a system authentication order, see “Configuring Authentication
Order” on page 15.
Table 16: Creating a Remote Template Account
Task
J-Web Configuration Editor
CLI Configuration Editor
Navigate to the System Login
level in the configuration
hierarchy.
1.
In the J-Web interface, select
Configuration>View and Edit>Edit
Configuration.
From the [edit] hierarchy level,
enter
2.
Next to System, click Configure or Edit.
3.
Next to Login, click Configure or Edit.
1.
Next to User, click Add new entry.
2.
In the User name box, type remote.
3.
In the Class box, type operator.
4.
Click OK.
Create a user named remote who
belongs to the operator login class.
edit system login
Set the username and the login
class for the user:
set user remote class operator
Managing User Authentication with a Configuration Editor
■
19
J-series™ Services Router Administration Guide
Creating a Local Template Account
You can create a local template that is applied to users authenticated by RADIUS or
TACACS+ that are assigned to the local template account. You use local template
accounts when you need different types of templates. Each template can define a
different set of permissions appropriate for the group of users who use that template.
The procedure provided in this section creates a sample user named admin that
belongs to the superuser login class.
To create a local template account:
1.
Navigate to the top of the configuration hierarchy in either the J-Web or CLI
configuration editor.
2.
Perform the configuration tasks described in Table 17 on page 20.
3.
If you are finished configuring the network, commit the configuration.
To completely set up RADIUS or TACACS+ authentication, you must configure
at least one RADIUS or TACACS+ server and specify a system authentication
order
4.
Go on to one of the following procedures:
■
To configure a RADIUS server, see “Setting Up RADIUS
Authentication” on page 12.
■
To configure a TACACS+ server, see “Setting Up TACACS+
Authentication” on page 13.
■
To configure a system authentication order, see “Configuring Authentication
Order” on page 15.
Table 17: Creating a Local Template Account
Task
J-Web Configuration Editor
CLI Configuration Editor
Navigate to the System Login
level in the configuration
hierarchy.
1.
In the J-Web interface, select
Configuration>View and Edit>Edit
Configuration.
From the [edit] hierarchy level,
enter
2.
Next to System, click Configure or Edit.
3.
Next to Login, click Configure or Edit.
1.
Next to User, click Add new entry.
2.
In the User name box, type admin.
3.
In the Class box, type superuser.
4.
Click OK.
Create a user named admin who
belongs to the superuser login
class.
20
■
Managing User Authentication with a Configuration Editor
edit system login
Set the username and the login
class for the user:
set user admin class superuser
Chapter 1: Managing User Authentication and Access
Recovering the Root Password
If you forget the root password for the router, you can use the password recovery
procedure to reset the root password.
NOTE: You need console access to recover the root password.
To recover the root password:
1.
Power off the router by pressing the power button on the front panel.
2.
Turn off the power to the management device, such as a PC or laptop computer,
that you want to use to access the CLI.
3.
Plug one end of the Ethernet rollover cable supplied with the router into the
RJ-45 to DB-9 serial port adapter supplied with the router (see Figure 5 on page
21 and Figure 6 on page 22).
4.
Plug the RJ-45 to DB-9 serial port adapter into the serial port on the management
device (see Figure 5 on page 21 and Figure 6 on page 22).
5.
Connect the other end of the Ethernet rollover cable to the console port on the
router (see Figure 5 on page 21 and Figure 6 on page 22).
Figure 5: Connecting to the Console Port on the J2300 Services Router
Recovering the Root Password
■
21
J-series™ Services Router Administration Guide
Figure 6: Connecting to the Console Port on the J4350 or J6350 Services Router
6.
Turn on the power to the management device.
7.
On the management device, start your asynchronous terminal emulation
application (such as Microsoft Windows Hyperterminal) and select the appropriate
COM port to use (for example, COM1).
8.
Configure the port settings as follows:
9.
■
Bits per second: 9600
■
Data bits: 8
■
Parity: None
■
Stop bits: 1
■
Flow control: None
Power on the router by pressing the power button on the front panel. Verify that
the POWER LED on the front panel turns green.
The terminal emulation screen on your management device displays the router's
boot sequence.
10. When the following prompt appears, press the Spacebar to access the router's
bootstrap loader command prompt:
Hit [Enter] to boot immediately, or space bar for command prompt.
Booting [kernel] in 9 seconds...
11. At the following prompt, enter boot -s to start up the system in single-user mode.
ok boot -s
22
■
Recovering the Root Password
Chapter 1: Managing User Authentication and Access
12. At the following prompt, enter recovery to start the root password recovery
procedure.
Enter full pathname of shell or 'recovery' for root password recovery or
RETURN for /bin/sh: recovery
13. Enter configuration mode in the CLI.
14. Set the root password. For example:
user@host# set system root-authentication plain-text-password
For more information about configuring the root password, see the JUNOS System
Basics Configuration Guide.
15. At the following prompt, enter the new root password. For example:
New password: juniper1
Retype new password:
16. At the second prompt, reenter the new root password.
17. If you are finished configuring the network, commit the configuration.
root@host# commit
commit complete
18. Exit configuration mode in the CLI.
19. Exit operational mode in the CLI.
20. At the prompt, enter y to reboot the router.
Reboot the system? [y/n] y
Securing the Console Port
You can use the console port on the Services Router to connect to the Routing Engine
through an RJ-45 serial cable. From the console port, you can use the CLI to configure
the router. By default, the console port is enabled. To secure the console port, you
can configure the Services Router to do the following:
■
Log out the console session when you unplug the serial cable connected to the
console port.
■
Disable root login connections to the console.
■
Disable the console port. We recommend disabling the console port to prevent
unauthorized access to the Services Router, especially when the router is used
as customer premises equipment (CPE).
Securing the Console Port
■
23
J-series™ Services Router Administration Guide
In a Common Criteria environment, you must disable the console port. For more
information, see the Secure Configuration Guide for Common Criteria and
JUNOS-FIPS.
To secure the console port:
1.
Navigate to the top of the configuration hierarchy in either the J-Web or CLI
configuration editor.
2.
Perform the configuration tasks described in Table 18 on page 24.
3.
If you are finished configuring the network, commit the configuration.
Table 18: Securing the Console Port
Task
J-Web Configuration Editor
Navigate to the
Console level in the
configuration
hierarchy.
1.
In the J-Web interface, select Configuration>View
and Edit>Edit Configuration.
2.
Next to System, click Configure or Edit.
3.
Next to Ports, click Configure or Edit.
4.
Next to Console, click Configure or Edit.
1.
Select one of the following check boxes:
Secure the console
port.
From the [edit] hierarchy level, enter
edit system ports console
Do one of the following:
■
Disable—Console port is disabled.
■
■
Insecure—Root login connections to the
console are disabled.
■
Log out on disconnect—Logs out the console
session when the serial cable connected to
the console port is unplugged.
■
■
2.
CLI Configuration Editor
Click OK.
To disable the console port, enter
set disable
To disable root login connections to the
console, enter
set insecure
To log out the console session when the
serial cable connected to the console
port is unplugged, enter
set log-out-on-disconnect
Accessing Remote Devices with the CLI
This section contains the following topics:
■
Using the telnet Command on page 24
■
Using the ssh Command on page 25
Using the telnet Command
You can use the CLI telnet command to open a Telnet session to a remote device:
user@host> telnet host <8bit> <bypass-routing> <inet> <interface interface-name>
<no-resolve> <port port> <routing-instance routing-instance-name> <source address>
24
■
Accessing Remote Devices with the CLI
Chapter 1: Managing User Authentication and Access
To escape from the Telnet session to the Telnet command prompt, press Ctrl-]. To
exit from the Telnet session and return to the CLI command prompt, enter quit.
Table 19 on page 25 describes the telnet command options. For more information,
see the JUNOS System Basics and Services Command Reference.
Table 19: CLI telnet Command Options
Option
Description
8bit
Use an 8-bit data path.
bypass-routing
Bypass the routing tables and open a Telnet session only to hosts on directly attached
interfaces. If the host is not on a directly attached interface, an error message is
returned.
host
Open a Telnet session to the specified hostname or IP address.
inet
Force the Telnet session to an IPv4 destination.
interface source-interface
Open a Telnet session to a host on the specified interface. If you do not include this
option, all interfaces are used.
no-resolve
Suppress the display of symbolic names.
port port
Specify the port number or service name on the host.
routing-instance routing-instance-name
Use the specified routing instance for the Telnet session.
source address
Use the specified source address for the Telnet session.
Using the ssh Command
You can use the CLI ssh command to use the secure shell (SSH) program to open a
connection to a remote device:
user@host> ssh host <bypass-routing> <inet> <interface interface-name>
<routing-instance routing-instance-name> <source address> <v1> <v2>
Table 20 on page 25 describes the ssh command options. For more information,
see the JUNOS System Basics and Services Command Reference.
Table 20: CLI ssh Command Options
Option
Description
bypass-routing
Bypass the routing tables and open an SSH connection only to hosts on directly attached
interfaces. If the host is not on a directly attached interface, an error message is
returned.
host
Open an SSH connection to the specified hostname or IP address.
inet
Force the SSH connection to an IPv4 destination.
Accessing Remote Devices with the CLI
■
25
J-series™ Services Router Administration Guide
Table 20: CLI ssh Command Options (continued)
Option
Description
interface source-interface
Open an SSH connection to a host on the specified interface. If you do not include this
option, all interfaces are used.
routing-instance routing-instance-name
Use the specified routing instance for the SSH connection.
source address
Use the specified source address for the SSH connection.
v1
Force SSH to use version 1 for the connection.
v2
Force SSH to use version 2 for the connection.
Configuring Password Retry Limits for Telnet and SSH Access
To prevent brute force and dictionary attacks, the Services Router takes the following
actions for Telnet or SSH sessions by default:
■
Disconnects a session after a maximum of 10 consecutive password retries.
■
After the second password retry, introduces a delay in multiples of 5 seconds
between subsequent password retries.
For example, the Services Router introduces a delay of 5 seconds between the
third and fourth password retry, a delay of 10 seconds between the fourth and
fifth password retry, and so on.
■
Enforces a minimum session time of 20 seconds during which a session cannot
be disconnected. Configuring the minimum session time prevents malicious
users from disconnecting sessions before the password retry delay goes into
effect, and attempting brute force and dictionary attacks with multiple logins.
You can configure the password retry limits for Telnet and SSH access. In this
example, you configure the Services Router to take the following actions for Telnet
and SSH sessions:
■
Allow a maximum of 4 consecutive password retries before disconnecting a
session.
■
Introduce a delay in multiples of 5 seconds between password retries that occur
after the second password retry.
■
Enforce a minimum session time of 40 seconds during which a session cannot
be disconnected.
To configure password retry limits for Telnet and SSH access:
26
■
1.
Navigate to the top of the configuration hierarchy in either the J-Web or CLI
configuration editor.
2.
Perform the configuration tasks described in Table 21 on page 27.
3.
If you are finished configuring the network, commit the configuration.
Configuring Password Retry Limits for Telnet and SSH Access
Chapter 1: Managing User Authentication and Access
Table 21: Configuring Password Retry Limits for Telnet and SSH Access
Task
J-Web Configuration Editor
CLI Configuration Editor
Navigate to the Retry options level in the configuration
hierarchy.
1.
In the J-Web interface, select
Configuration>View and
Edit>Edit Configuration.
From the [edit] hierarchy
level, enter
2.
Next to System, click Edit.
3.
Next to Login, click Configure
or Edit.
4.
Next to Retry options, click
Configure or Edit.
1.
In the Tries before disconnect
box, type 4.
2.
In the Backoff threshold box,
type 2.
3.
In the Backoff factor box, type
5.
4.
In the Minimum time box, type
40.
5.
Click OK.
Configure password retry limits for Telnet and SSH access.
■
■
■
■
Tries—Maximum number of consecutive password
retries before a SSH or Telnet sessions is disconnected.
The default number is 10, but you can set a number
between 1 and 10.
Backoff threshold—Threshold number of password
retries after which a delay is introduced between two
consecutive password retries. The default number is
2, but you can set a number between 1 and 3.
Backoff factor—Delay (in seconds) between
consecutive password retries after the threshold
number of password retries. The default delay is in
multiples of 5 seconds, but you can set a delay
between 5 and 10 seconds.
edit system login
retry-options
1.
Enter
set
tries-before-disconnect
4
2.
Enter
set backoff-threshold
2
3.
Enter
set backoff-factor 5
4.
Minimum time—Minimum length of time (in seconds)
during which a Telnet or SSH session cannot be
disconnected. The default is 20 seconds, but you can
set a time between 20 and 60 seconds.
Enter
set minimum-time 40
Configuring Password Retry Limits for Telnet and SSH Access
■
27
J-series™ Services Router Administration Guide
28
■
Configuring Password Retry Limits for Telnet and SSH Access
Chapter 2
Setting Up USB Modems for Remote
Management
J-series Services Routers support the use of USB modems for remote management.
You can use Telnet or SSH to connect to the router from a remote location through
two modems over a telephone network. The USB modem is connected to the USB
port on the Services Router, and a second modem is connected to a remote
management device such as a PC or laptop computer.
NOTE: We recommend using a Multi-Tech MultiModem MT5634ZBA-USB-V92 USB
modem with J-series Services Routers.
You use either the J-Web configuration editor or CLI configuration editor to configure
the USB modem and its supporting dialer interfaces.
This chapter contains the following topics:
■
USB Modem Terms on page 29
■
USB Modem Overview on page 30
■
Before You Begin on page 33
■
Connecting the USB Modem to the Services Router's USB Port on page 33
■
Configuring USB Modem Interfaces with a Configuration Editor on page 33
■
Connecting to the Services Router from the User End on page 39
■
Administering USB Modems on page 40
■
Verifying the USB Modem Configuration on page 42
USB Modem Terms
Before configuring USB modems and their supporting dialer interfaces, become
familiar with the terms defined in Table 22 on page 30.
USB Modem Terms
■
29
J-series™ Services Router Administration Guide
Table 22: USB Modem Terminology
Term
Definition
caller ID
Telephone number of the caller on the remote end of a USB modem
connection, used to dial in and also to identify the caller. Multiple caller
IDs can be configured on a dialer interface. During dial-in, the router
matches the incoming call's caller ID against the caller IDs configured
on its dialer interfaces. Each dialer interface accepts calls from only
callers whose caller IDs are configured on it.
dialer interface (dl)
Logical interface for configuring dialing properties for a USB modem
connection.
dial-in
Feature that enables J-series Services Routers to receive calls from the
remote end of a USB modem connection. The remote end of the USB
modem call might be a service provider, a corporate central location,
or a customer premises equipment (CPE) branch office. All incoming
calls can be verified against caller IDs configured on the router's dialer
interface.
Microcom Networking Protocol (MNP)
Protocol that provides error correction and data compression for
asynchronous modem transmission.
USB Modem Overview
A USB modem connects to a Services Router through modem interfaces that you
configure. The router applies its own modem AT commands to initialize the attached
modem. Modem setup requires that you connect and configure the USB modem at
the router and the modem at the user end of the network.
■
USB Modem Interfaces on page 30
■
How a Services Router Initializes USB Modems on page 31
■
USB Modem Connection and Configuration Overview on page 32
USB Modem Interfaces
You configure two types of interfaces for USB modem connectivity: a physical
interface and a logical interface called the dialer interface:
■
The USB modem physical interface uses the naming convention umd0. The
Services Router creates this interface when a USB modem is connected to the
USB port.
■
The dialer interface, dln, is a logical interface for configuring dialing properties
for USB modem connections.
See the interface naming conventions in the J-series Services Router Basic LAN and
WAN Access Configuration Guide.
The following rules apply when you configure dialer interfaces for USB modem
connections:
30
■
USB Modem Overview
Chapter 2: Setting Up USB Modems for Remote Management
■
The dialer interface must be configured to use PPP encapsulation. You cannot
configure Cisco High-Level Data Link Control (HDLC) or Multilink PPP (MLPPP)
encapsulation on dialer interfaces.
■
The dialer interface cannot be configured as a constituent link in a multilink
bundle.
■
If you are using the same dialer interface for ISDN connections and USB modem
connections, the dialer interface cannot be configured simultaneously in the
following modes:
■
As a backup interface and a dialer filter
■
As a backup interface and dialer watch interface
■
As a dialer watch interface and a dialer filter
■
As a backup interface for more than one primary interface
How a Services Router Initializes USB Modems
When you connect the USB modem to the USB port on the Services Router, the router
applies the modem AT commands configured in the init-command-string command
to the initialization commands on the modem. For more information about configuring
modem commands for the init-command-string command, see “Modifying USB Modem
Initialization Commands” on page 41.
If you do not configure modem AT commands for the init-command-string command,
the router applies the following default sequence of initialization commands to the
modem: AT S7=45 S0=0 V1 X4 &C1 E0 Q0 &Q8 %C0. Table 23 on page 31 describes
the commands. For more information about these commands, see the documentation
for your modem.
Table 23: J-series Default Modem Initialization Commands
Modem Command
Description
AT
Attention. Informs the modem that a command follows.
S7=45
Instructs the modem to wait 45 seconds for a telecommunications service provider
(carrier) signal before terminating the call.
S0=0
Disables the auto answer feature, whereby the modem automatically answers calls.
V1
Displays result codes as words.
&C1
Disables reset of the modem when it loses the carrier signal.
E0
Disables the display on the local terminal of commands issued to the modem from
the local terminal.
Q0
Enables the display of result codes.
&Q8
Enables Microcom Networking Protocol (MNP) error control mode.
USB Modem Overview
■
31
J-series™ Services Router Administration Guide
Table 23: J-series Default Modem Initialization Commands (continued)
Modem Command
Description
%C0
Disables data compression.
When the Services Router applies the modem AT commands in the init-command-string
command or the default sequence of initialization commands to the modem, it
compares them to the initialization commands already configured on the modem
and makes the following changes:
■
If the commands are the same, the router overrides existing modem values that
do not match. For example, if the initialization commands on the modem include
S0=0 and the router’s init-command-string command includes S0=2, the Services
Router applies S0=2.
■
If the initialization commands on the modem do not include a command in the
router’s init-command-string command, the router adds it. For example, if the
init-command-string command includes the command L2, but the modem
commands do not include it, the router adds L2 to the initialization commands
configured on the modem.
USB Modem Connection and Configuration Overview
To use USB modems to remotely manage a Services Router, you perform the tasks
listed in Table 24 on page 32. For instructions, see the cross-references in the table.
Table 24: USB Modem Connection and Configuration Overview
Task
Instructions
Perform prerequisite tasks.
“Before You Begin” on page 33
On the Services Router
1. Connect a modem to the router.
“Connecting the USB Modem to the Services Router's USB
Port” on page 33
2. Configure the modem interfaces on the router.
“Configuring USB Modem Interfaces with a Configuration
Editor” on page 33
3. Verify the modem configuration on the router.
“Verifying the USB Modem Configuration” on page 42
4. Perform administrative tasks as necessary.
■
Modifying USB Modem Initialization Commands on page 41
■
Resetting USB Modems on page 42
At the User End
1. Configure the modem at your remote location.
“Configuring a Dial-Up Modem Connection at the User
End” on page 39
2. Dial in to the router.
“Connecting to the Services Router from the User End” on page 40
32
■
USB Modem Overview
Chapter 2: Setting Up USB Modems for Remote Management
Before You Begin
Before you configure USB modems, you need to perform the following tasks:
■
Install Services Router hardware. For more information, see the Getting Started
Guide for your router.
■
Establish basic connectivity. For more information, see the Getting Started Guide
for your router.
■
Order a Multi-Tech MultiModem MT5634ZBA-USB-V92 USB modem from
Multi-Tech Systems (http://www.multitech.com/).
■
Order a dial-up modem for the PC or laptop computer at the remote location
from where you want to connect to the Services Router.
■
Order a public switched telephone network (PSTN) line from your
telecommunications service provider. Contact your service provider for more
information.
■
If you do not already have a basic understanding of physical and logical interfaces
and Juniper Networks interface conventions, see the J-series Services Router Basic
LAN and WAN Access Configuration Guide.
Connecting the USB Modem to the Services Router's USB Port
NOTE: J4350 and J6350 Services Routers have two USB ports. However, you can
connect only one USB modem to the USB ports on these routers. If you connect USB
modems to both ports, the router detects only the first modem connected.
To connect the USB modem to the USB port on the router:
1.
Plug the modem into the USB port.
2.
Connect the modem to your telephone network.
Configuring USB Modem Interfaces with a Configuration Editor
To configure USB modem interfaces, perform the following tasks marked (Required).
Perform other tasks if needed on your network.
■
Configuring a USB Modem Interface (Required) on page 33
■
Configuring a Dialer Interface (Required) on page 35
■
Configuring Dial-In (Required) on page 36
■
Configuring CHAP on Dialer Interfaces (Optional) on page 37
Configuring a USB Modem Interface (Required)
To configure a USB modem interface for the Services Router:
Before You Begin
■
33
J-series™ Services Router Administration Guide
1.
Navigate to the top of the interfaces configuration hierarchy in either the J-Web
or CLI configuration editor.
2.
Perform the configuration tasks described in Table 25 on page 34.
3.
Go on to “Configuring a Dialer Interface (Required)” on page 35.
Table 25: Configuring a USB Modem Interface
Task
J-Web Configuration Editor
CLI Configuration Editor
Navigate to the Interfaces level in the
configuration hierarchy.
1.
In the J-Web interface, select
Configuration>View and
Edit>Edit Configuration.
From the [edit] hierarchy level, enter
2.
Next to Interfaces, click Configure
or Edit.
1.
Next to Interface, click Add new
entry.
2.
In the Interface name box, type the
name of the new interface, umd0.
3.
Click OK.
1.
In the Encapsulation column, next
to the new interface, click Edit.
2.
Next to Dialer options, select Yes,
and then click Configure.
3.
Next to Pool, click Add new entry.
4.
In the Pool identifier box, type
usb-modem-dialer-pool.
5.
In the Priority box, type 25.
6.
Click OK until you return to the
Interface page.
1.
Next to Modem options, click
Configure.
2.
In the Init command string box,
type ATS0=2 to configure the
modem to automatically answer
after two rings.
3.
Click OK.
Create the new interface umd0.
Configure dialer options.
■
■
Name the dialer pool configured on
the dialer interface you want to use
for USB modem connectivity—for
example, usb-modem-dialer-pool. For
more information, see “Configuring
a Dialer Interface
(Required)” on page 35.
Set the dialer pool priority—for
example, 25.
Dialer pool priority has a range from 1
to 255, with 1 designating
lowest-priority interfaces and 255
designating the highest-priority
interfaces.
The S0=0 command in the default
modem initialization sequence AT S7=45
S0=0 V1 X4 &C1 E0 Q0 &Q8 %C0,
disables the modem from automatically
answering calls.
Configure the modem to automatically
answer calls after a specified number of
rings. For more information about
modem initialization commands, see
“How a Services Router Initializes USB
Modems” on page 31 and “Modifying
USB Modem Initialization
Commands” on page 41.
34
■
Configuring USB Modem Interfaces with a Configuration Editor
edit interfaces umd0
Enter
set dialer-options pool
usb-modem-dialer-pool priority 25
Enter
set modem-options init-command-string
"ATS0=2 \n"
Chapter 2: Setting Up USB Modems for Remote Management
Configuring a Dialer Interface (Required)
The dialer interface (dl) is a logical interface configured to establish USB modem
connectivity. You can configure multiple dialer interfaces for different functions on
the Services Router.
To configure a logical dialer interface for the Services Router:
1.
Navigate to the top of the interfaces configuration hierarchy in either the J-Web
or CLI configuration editor.
2.
Perform the configuration tasks described in Table 26 on page 35.
3.
Go on to “Configuring Dial-In (Required)” on page 36.
Table 26: Adding a Dialer Interface to a Services Router
Task
J-Web Configuration Editor
Navigate to the Interfaces level in the
configuration hierarchy.
1.
In the J-Web interface, select
Configuration>View and
Edit>Edit Configuration.
2.
Next to Interfaces, click Configure
or Edit.
1.
Next to Interface, click Add new
entry.
2.
In the Interface name box, type dl0.
3.
In the Description box, type
Create the new interface—for example,
dl0.
Adding a description can differentiate
between different dialer interfaces—for
example,
USB-modem-remote-management.
CLI Configuration Editor
From the [edit] hierarchy level, enter
edit interfaces
Create and name the interface:
1.
edit dl0
2.
set description
USB-modem-remote-management
USB-modem-remote-management.
4.
Click OK.
Configure Point-to-Point Protocol (PPP)
encapsulation.
1.
In the Encapsulation column, next
to the new interface, click Edit.
NOTE: You cannot configure Cisco
High-Level Data Link Control (HDLC)
or Multilink PPP (MLPPP) encapsulation
on dialer interfaces used in USB
modem connections.
2.
From the Encapsulation list, select
ppp.
Create the logical unit 0.
1.
Next to Unit, click Add new entry.
Enter
NOTE: The logical unit number must
be 0.
2.
In the Interface unit number box,
type 0.
set unit 0
3.
Next to Dialer options, select Yes,
and then click Configure.
Enter
set encapsulation ppp
Configuring USB Modem Interfaces with a Configuration Editor
■
35
J-series™ Services Router Administration Guide
Table 26: Adding a Dialer Interface to a Services Router (continued)
Task
J-Web Configuration Editor
CLI Configuration Editor
Configure the name of the dialer pool
to use for USB modem
connectivity—for example,
usb-modem-dialer-pool.
1.
1.
In the Pool box, type
Enter
usb-modem-dialer-pool.
2.
edit unit 0
Click OK.
2.
Enter
set dialer-options pool
usb-modem-dialer-pool
Configure source and destination IP
addresses for the dialer interface—for
example, 172.20.10.2 and
172.20.10.1.
1.
Select Inet under Family, and click
Configure.
2.
Next to Address, click Add new
entry.
NOTE: If you configure multiple dialer
interfaces, ensure that the same IP
subnet address is not configured on
different dialer interfaces. Configuring
the same IP subnet address on multiple
dialer interfaces can result in
inconsistency in the route and packet
loss. The router might route packets
through another dialer interface with
the IP subnet address instead of
through the dialer interface to which
the USB modem call is mapped.
3.
In the Source box, type
172.20.10.2.
4.
In the Destination box, type
172.20.10.1.
5.
Click OK.
Enter
set family inet address 172.20.10.2
destination 172.20.10.1
Configuring Dial-In (Required)
To enable connections to the USB modem from a remote location, you must configure
the dialer interfaces set up for USB modem use to accept incoming calls. You can
configure a dialer interface to accept all incoming calls or accept only calls from one
or more caller IDs.
If the dialer interface is configured to accept only calls from a specific caller ID, the
Services Router matches the incoming call's caller ID against the caller IDs configured
on its dialer interfaces. If an exact match is not found and the incoming call's caller
ID has more digits than the configured caller IDs, the Services Router performs a
right-to-left match of the incoming call's caller ID with the configured caller IDs and
accepts the incoming call if a match is found. For example, if the incoming call's
caller ID is 4085550115 and the caller ID configured on a dialer interface is 5550115,
the incoming call is accepted. Each dialer interface accepts calls from only callers
whose caller IDs are configured on it.
To configure a dialer interface for dial-in:
36
■
1.
Navigate to the top of the configuration hierarchy in either the J-Web or CLI
configuration editor.
2.
Perform the configuration tasks described in Table 27 on page 37.
Configuring USB Modem Interfaces with a Configuration Editor
Chapter 2: Setting Up USB Modems for Remote Management
3.
If you are finished configuring the router, commit the configuration.
4.
To verify that the network interface is configured correctly, see “Verifying the
USB Modem Configuration” on page 42.
Table 27: Configuring the Dialer Interface for Dial-In
Task
J-Web Configuration Editor
CLI Configuration Editor
Navigate to the Interfaces level in the
configuration hierarchy, and select a dialer
interface—for example, dl0.
1.
From the [edit] hierarchy level, enter
On logical interface 0 configure the incoming
map options for the dialer interface.
■
2.
Next to Interfaces, click Edit.
3.
Next to dl0, click Edit.
1.
In the Unit section, for logical
unit number 0, click Dialer
options under Nested
Configuration.
accept-all—Dialer interface accepts all
incoming calls.
You can configure the accept-all option for
only one of the dialer interfaces associated
with a USB modem physical interface. The
router uses the dialer interface with the
accept-all option configured only if the
incoming call's caller ID does not match
the caller IDs configured on other dialer
interfaces.
■
2.
Next to Incoming map, click
Configure.
3.
From the Caller type menu,
select Caller.
4.
Next to Caller, click Add new
entry.
5.
In the Caller id box, type
4085550115.
6.
Click OK.
7.
Repeat Steps 4 through 6 for
each caller ID to be accepted on
the dialer interface.
caller—Dialer interface accepts calls from
a specific caller ID—for example,
4085550115. You can configure a
maximum of 15 caller IDs per dialer
interface.
The same caller ID must not be configured
on different dialer interfaces. However,
you can configure caller IDs with more or
fewer digits on different dialer interfaces.
For example, you can configure the caller
IDs 14085550115, 4085550115, and
5550115 on different dialer interfaces.
In the J-Web interface, select
Configuration>View and
Edit>Edit Configuration.
edit interfaces dl0
1.
Enter
edit unit 0
2.
Enter
edit dialer-options
3.
Enter
set incoming-map caller
4085550115
4.
Repeat Step 3 for each caller ID
to be accepted on the dialer
interface.
Configuring CHAP on Dialer Interfaces (Optional)
You can optionally configure dialer interfaces to support the PPP Challenge Handshake
Authentication Protocol (CHAP). When you enable CHAP on a dialer interface, the
Services Router can authenticate the remote locations connecting to the USB modem.
For more information about CHAP, see the J-series Services Router Basic LAN and
WAN Access Configuration Guide and the JUNOS Network Interfaces Configuration
Guide.
To configure CHAP on the dialer interface:
Configuring USB Modem Interfaces with a Configuration Editor
■
37
J-series™ Services Router Administration Guide
1.
Navigate to the top of the configuration hierarchy in either the J-Web or CLI
configuration editor.
2.
Perform the configuration tasks described in Table 28 on page 38.
3.
If you are finished configuring the router, commit the configuration.
4.
To verify the CHAP configuration, see “Verifying the USB Modem
Configuration” on page 42.
Table 28: Configuring CHAP on Dialer Interfaces
Task
J-Web Configuration Editor
CLI Configuration Editor
Define a CHAP access profile—for
example, usb-modem-access-profile with
a client (username) named
usb-modem-user and the secret
(password) my-secret.
1.
In the J-Web interface, select
Configuration>View and
Edit>Edit Configuration.
1.
2.
Next to Access, click Configure or
Edit.
3.
Next to Profile, click Add new
entry.
4.
In the Profile name box, type
usb-modem-access-profile.
5.
Next to Client, click Add new
entry.
6.
In the Name box, type
usb-modem-user.
7.
In the Chap secret box, type
my-secret.
8.
Click OK.
9.
Repeat Steps 5 through 8 for each
client to be included in the CHAP
profile.
From the [edit] hierarchy level,
enter
edit access
2.
Enter
set profile usb-modem-access-profile
client usb-modem-user chap-secret
my-secret
3.
Repeat Step 2 for each client to be
included in the CHAP profile.
10. Click OK until you return to the
Configuration page.
Navigate to the appropriate dialer
interface level in the configuration
hierarchy—for example, dl0 unit 0.
Configure CHAP on the dialer interface
and specify a unique profile name
containing a client list and access
parameters—for example,
usb-modem-access-profile.
NOTE: Do not configure the passive
option from the [edit interfaces dl0 unit
0 ppp-options chap] hierarchy level.
38
■
1.
On the Configuration page next to
Interfaces, click Edit.
2.
In the Interface name column, click
dl0.
3.
Under Unit, in the Interface unit
number column, click 0.
1.
Next to Ppp options, click
Configure.
2.
Next to Chap, click Configure.
3.
In the Access profile box, type
usb-modem-access-profile.
4.
Click OK.
Configuring USB Modem Interfaces with a Configuration Editor
From the [edit] hierarchy level, enter
edit interfaces dl0 unit 0
Enter
set ppp-options chap access-profile
usb-modem-access-profile
Chapter 2: Setting Up USB Modems for Remote Management
Connecting to the Services Router from the User End
NOTE: These instructions describe connecting to the Services Router from a remote
PC or laptop computer running Microsoft Windows XP. If your remote PC or laptop
computer does not run Microsoft Windows XP, see the documentation for your
operating system and enter equivalent commands.
This section contains the following topics:
■
Configuring a Dial-Up Modem Connection at the User End on page 39
■
Connecting to the Services Router from the User End on page 40
Configuring a Dial-Up Modem Connection at the User End
To remotely connect to the USB modem connected to the USB port on the Services
Router, you must configure a dial-up modem connection on the PC or laptop computer
at your remote location. Configure the dial-up modem connection properties to
disable IP header compression.
To configure a dial-up modem connection at the user end:
1.
At your remote location, connect a modem to a management device such as a
PC or laptop computer.
2.
Connect the modem to your telephone network.
3.
On the PC or laptop computer, select Start>Settings>Control Panel>Network
Connections.
The Network Connections page is displayed.
4.
Click Create a new connection.
The New Connection Wizard is displayed.
5.
Click Next.
The New Connection Wizard: Network Connection Type page is displayed.
6.
Select Connect to the network at my workplace, and then click Next.
The New Connection Wizard: Network Connection page is displayed.
7.
Select Dial-up connection, and then click Next.
The New Connection Wizard: Connection Name page is displayed.
8.
In the Company Name box, type the dial-up connection name—for example,
USB-modem-connect—and then click Next.
The New Connection Wizard: Phone Number to Dial page is displayed.
9.
In the Phone number box, type the telephone number of the PSTN line connected
to the USB modem at the router end.
10. Click Next twice, and then click Finish.
Connecting to the Services Router from the User End
■
39
J-series™ Services Router Administration Guide
The Connect USB-modem-connect page is displayed.
11. If CHAP is configured on the dialer interface used for the USB modem interface
at the router end, type the username and password configured in the CHAP
configuration in the User name and Password boxes. For information about
configuring CHAP on dialer interfaces, see “Configuring CHAP on Dialer Interfaces
(Optional)” on page 37.
12. Click Properties.
The USB-modem-connect Properties page is displayed.
13. In the Networking tab, select Internet Protocol (TCP/IP), and then click
Properties.
The Internet Protocol (TCP/IP) Properties page is displayed.
14. Click Advanced.
The Advanced TCP/IP Settings page appears.
15. Clear the Use IP header compression check box.
Connecting to the Services Router from the User End
To remotely connect to the Services Router through a USB modem connected to the
USB port on the router:
1.
On the PC or laptop computer at your remote location, select
Start>Settings>Control Panel>Network Connections.
The Network Connections page is displayed.
2.
Double-click the USB-modem-connect dial-up connection configured in
“Configuring a Dial-Up Modem Connection at the User End” on page 39.
The Connect USB-modem-connect page is displayed.
3.
Click Dial to connect to the Services Router.
When the connection is complete, you can use Telnet or SSH to connect to the
router.
Administering USB Modems
This section contains the following topics:
40
■
■
Modifying USB Modem Initialization Commands on page 41
■
Resetting USB Modems on page 42
Administering USB Modems
Chapter 2: Setting Up USB Modems for Remote Management
Modifying USB Modem Initialization Commands
NOTE: These instructions use Hayes-compatible modem commands to configure the
modem. If your modem is not Hayes-compatible, see the documentation for your
modem and enter equivalent modem commands.
You can use the J-Web or CLI configuration editor to override the value of an
initialization command configured on the USB modem or configure additional
commands for initializing USB modems.
NOTE: If you modify modem initialization commands when a call is in progress, the
new initialization sequence is applied on the modem only when the call ends.
In this example, you override the value of the S0=0 command in the initialization
sequence configured on the modem and add the L2 command.
To modify the initialization commands on a USB modem:
1.
Navigate to the top of the interfaces configuration hierarchy in either the J-Web
or CLI configuration editor.
2.
Perform the configuration tasks described in Table 29 on page 41.
3.
If you are finished configuring the router, commit the configuration.
4.
To verify that the initialization commands are configured correctly, see “Verifying
the USB Modem Configuration” on page 42.
Table 29: Modifying USB Modem Initialization Commands
Task
J-Web Configuration Editor
Navigate to the Interfaces level in the
configuration hierarchy.
1.
2.
In the J-Web interface, select
Configuration>View and
Edit>Edit Configuration.
CLI Configuration Editor
From the [edit] hierarchy level, enter
edit interfaces umd0
Next to Interfaces, click Configure
or Edit.
Administering USB Modems
■
41
J-series™ Services Router Administration Guide
Table 29: Modifying USB Modem Initialization Commands (continued)
Task
J-Web Configuration Editor
CLI Configuration Editor
Configure the modem AT commands to
initialize the USB modem. For example:
1.
Next to Modem options, click
Configure.
From the [edit interfaces umd0] hierarchy,
enter
■
The command S0=2 configures the
modem to automatically answer
calls on the second ring.
2.
In the Init command string box,
type AT S0=2 L2.
The command L2 configures
medium speaker volume on the
modem.
3.
Click OK.
■
set modem-options init-command-string
"AT S0=2 L2 \n"
You can insert spaces between
commands.
When you configure modem commands
in the CLI configuration editor, you must
follow these conventions:
■
Use the newline character \n to
indicate the end of a command
sequence.
■
Enclose the command string in
double quotation marks.
Resetting USB Modems
If the USB modem does not respond, you can reset the modem.
CAUTION: If you reset the modem when a call is in progress, the call is terminated.
To reset the USB modem:
1.
Enter operational mode in the CLI.
2.
To reset the USB modem, enter the following command:
user@host> request interface modem reset umd0
Verifying the USB Modem Configuration
To verify a USB modem configuration, perform the following tasks:
42
■
■
Verifying a USB Modem Interface on page 43
■
Verifying Dialer Interface Configuration on page 44
Verifying the USB Modem Configuration
Chapter 2: Setting Up USB Modems for Remote Management
Verifying a USB Modem Interface
Purpose
Action
Verify that the USB modem interface is correctly configured and display the status
of the modem.
From the CLI, enter the show interfaces extensive command.
user@host> show interfaces umd0 extensive
Physical interface: umd0, Enabled, Physical link is Up
Interface index: 64, SNMP ifIndex: 33, Generation: 1
Type: Async-Serial, Link-level type: PPP-Subordinate, MTU: 1504,
Clocking: Unspecified, Speed: MODEM
Device flags
: Present Running
Interface flags: Point-To-Point SNMP-Traps Internal: 0x4000
Link flags
: None
Hold-times
: Up 0 ms, Down 0 ms
Last flapped
: Never
Statistics last cleared: Never
Traffic statistics:
Input bytes :
21672
Output bytes :
22558
Input packets:
1782
Output packets:
1832
Input errors:
Errors: 0, Drops: 0, Framing errors: 0, Runts: 0, Giants: 0, Policed discards:
0,
Resource errors: 0
Output errors:
Carrier transitions: 63, Errors: 0, Drops: 0, MTU errors: 0, Resource errors:
0
MODEM status:
Modem type
: LT V.92 1.0 MT5634ZBA-USB-V92 Data/Fax Modem
(Dual Config) Version 2.27m
Initialization command string
Initialization status
Call status
Call duration
Call direction
Baud rate
Most recent error code
:
:
:
:
:
:
:
ATS0=2
Ok
Connected to 4085551515
13429 seconds
Dialin
33600 bps
NO CARRIER
Logical interface umd0.0 (Index 2) (SNMP ifIndex 34) (Generation 1)
Flags: Point-To-Point SNMP-Traps Encapsulation: PPP-Subordinate
Meaning
The output shows a summary of interface information and displays the modem
status.
Verify the following information:
■
The physical interface is Enabled. If the interface is shown as Disabled, do either
of the following:
■
In the CLI configuration editor, delete the disable statement at the [edit
interfaces interface-name] level of the configuration hierarchy.
Verifying a USB Modem Interface
■
43
J-series™ Services Router Administration Guide
■
In the J-Web configuration editor, clear the Disable check box on the
Interfaces>interface-name page.
■
The physical link is Up. A link state of Down indicates a problem with the interface
module, interface port, or physical connection (link-layer errors).
■
The Last Flapped time is an expected value. The Last Flapped time indicates the
last time the physical interface became unavailable and then available again.
Unexpected flapping indicates likely link-layer errors.
■
The traffic statistics reflect expected input and output rates. Verify that the
number of inbound and outbound bytes and packets matches expected
throughput for the physical interface. To clear the statistics and see only new
changes, use the clear interfaces statistics interface-name command.
■
The modem initialization command string has a nonzero value for the S0=n
modem command. A nonzero value is required to configure the modem to
automatically answer calls. For example, the command S0=2 configures the
modem to automatically answer calls on the second ring.
For more information, see “Modifying USB Modem Initialization
Commands” on page 41.
■
The modem initialization status is Ok. If the initialization status is shown as Error
or Not Initialized, do the following:
1.
Verify that the modem initialization commands are valid. If the modem
initialization sequence includes invalid commands, correct them, as described
in “Modifying USB Modem Initialization Commands” on page 41.
2.
If the modem initialization commands are valid, reset the modem. For more
information, see “Resetting USB Modems” on page 42.
Determine the following information:
Related Topics
■
The call status
■
The duration of the call
For a complete description of show interfaces extensive output, see the JUNOS
Interfaces Command Reference.
Verifying Dialer Interface Configuration
Purpose
Action
Verify that the dialer interface is correctly configured.
From the CLI, enter the show interfaces extensive command.
user@host> show interfaces dl0 extensive
Physical interface: dl0, Enabled, Physical link is Up
Interface index: 128, SNMP ifIndex: 24, Generation: 129
Type: 27, Link-level type: PPP, MTU: 1504, Clocking: Unspecified, Speed:
Unspecified
Device flags
: Present Running
Interface flags: SNMP-Traps
Link type
: Full-Duplex
44
■
Verifying Dialer Interface Configuration
Chapter 2: Setting Up USB Modems for Remote Management
Link flags
: Keepalives
Physical info : Unspecified
Hold-times
: Up 0 ms, Down 0 ms
Current address: Unspecified, Hardware address: Unspecified
Alternate link address: Unspecified
Last flapped
: Never
Statistics last cleared: Never
Traffic statistics:
Input bytes :
13859
0 bps
Output bytes :
0
0 bps
Input packets:
317
0 pps
Output packets:
0
0 pps
Input errors:
Errors: 0, Drops: 0, Framing errors: 0, Runts: 0, Giants: 0, Policed discards:
0,
Resource errors: 0
Output errors:
Carrier transitions: 0, Errors: 0, Drops: 0, MTU errors: 0, Resource errors:
0
Logical interface dl0.0 (Index 70) (SNMP ifIndex 75) (Generation 146)
Description: USB-modem-remote-management
Flags: Point-To-Point SNMP-Traps 0x4000 LinkAddress 23-0 Encapsulation: PPP
Dialer:
State: Active, Dial pool: usb-modem-dialer-pool
Dial strings: 220
Subordinate interfaces: umd0 (Index 64)
Activation delay: 0, Deactivation delay: 0
Initial route check delay: 120
Redial delay: 3
Callback wait period: 5
Load threshold: 0, Load interval: 60
Bandwidth: 115200
Traffic statistics:
Input bytes :
24839
Output bytes :
17792
Input packets:
489
Output packets:
340
Local statistics:
Input bytes :
10980
Output bytes :
17792
Input packets:
172
Output packets:
340
Transit statistics:
Input bytes :
13859
0 bps
Output bytes :
0
0 bps
Input packets:
317
0 pps
Output packets:
0
0 pps
LCP state: Opened
NCP state: inet: Opened, inet6: Not-configured, iso: Not-configured,
mpls: Not-configured
CHAP state: Success
Protocol inet, MTU: 1500, Generation: 136, Route table: 0
Flags: None
Addresses, Flags: Is-Preferred Is-Primary
Destination: 172.20.10.1, Local: 172.20.10.2, Broadcast: Unspecified,
Generation: 134
Meaning
The output shows a summary of dialer interface information. Verify the following
information:
Verifying Dialer Interface Configuration
■
45
J-series™ Services Router Administration Guide
■
Related Topics
46
■
The physical interface is Enabled. If the interface is shown as Disabled, do either
of the following:
■
In the CLI configuration editor, delete the disable statement at the [edit
interfaces interface-name] level of the configuration hierarchy.
■
In the J-Web configuration editor, clear the Disable check box on the
Interfaces>interface-name page.
■
The physical link is Up. A link state of Down indicates a problem with the interface
module, interface port, or physical connection (link-layer errors).
■
The Last Flapped time is an expected value. The Last Flapped time indicates the
last time the physical interface became unavailable and then available again.
Unexpected flapping indicates possible link-layer errors.
■
The traffic statistics reflect expected input and output rates. Verify that the
number of inbound and outbound bytes and packets matches expected
throughput for the physical interface. To clear the statistics and see only new
changes, use the clear interfaces statistics interface-name command.
■
The dialer state is Active when a USB modem call is in progress.
■
The LCP state is Opened when a USB modem call is in progress. An LCP state of
Closed or Not Configured indicates a problem with the dialer configuration that
needs to be debugged with the monitor traffic interface interface-name command.
For information about the monitor traffic command, see “Using the monitor traffic
Command” on page 246.
For a complete description of show interfaces dl0 extensive output, see the JUNOS
Interfaces Command Reference.
Verifying Dialer Interface Configuration
Chapter 3
Configuring SNMP for Network
Management
The Simple Network Management Protocol (SNMP) enables the monitoring of network
devices from a central location.
You can use either J-Web Quick Configuration or a configuration editor to configure
SNMP.
NOTE: SNMP is not supported on Gigabit Ethernet interfaces on J-series Services
Routers.
This chapter contains the following topics. For more information about SNMP, see
the JUNOS Network Management Configuration Guide.
■
SNMP Architecture on page 47
■
Before You Begin on page 50
■
Configuring SNMP with Quick Configuration on page 50
■
Configuring SNMP with a Configuration Editor on page 54
■
Verifying the SNMP Configuration on page 58
SNMP Architecture
Use SNMP to determine where and when a network failure is occurring, and to gather
statistics about network performance in order to evaluate the overall health of the
network and identify bottlenecks.
Because SNMP is a client/server protocol, SNMP nodes can be classified as either
clients (SNMP managers) or servers (SNMP agents). SNMP managers, also called
network management systems (NMSs), occupy central points in the network and
actively query and collect messages from SNMP agents in the network. SNMP agents
are individual processes running on network nodes that gather information for a
particular node and transfer the information to SNMP managers as queries are
processed. The agent also controls access to the agent’s Management Information
Base (MIB), the collection of objects that can be viewed or changed by the SNMP
manager. Because SNMP agents are individual SNMP processes running on a host,
multiple agents can be active on a single network node at any given time.
SNMP Architecture
■
47
J-series™ Services Router Administration Guide
Communication between the agent and the manager occurs in one of the following
forms:
■
Get, GetBulk, and GetNext requests—The manager requests information from
the agent, and the agent returns the information in a Get response message.
■
Set requests—The manager changes the value of a MIB object controlled by the
agent, and the agent indicates status in a Set response message.
■
Traps notification—The agent sends traps to notify the manager of significant
events that occur on the network device.
Management Information Base
Agents store information in a hierarchical database called the Structure of
Management Information (SMI). The SMI resembles a file system. Information is
stored in individual files that are hierarchically arranged in the database. The individual
files that store the information are known as Management Information Bases (MIBs).
Each MIB contains nodes of information that are stored in a tree structure. Information
branches down from a root node to individual leaves in the tree, and the individual
leaves comprise the information that is queried by managers for a given MIB. The
nodes of information are identified by an object ID (OID). The OID is a dotted integer
identifier (1.3.6.1.2.1.2, for instance) or a subtree name (such as interfaces) that
corresponds to an indivisible piece of information in the MIB.
MIBs are either standard or enterprise-specific. Standard MIBs are created by the
Internet Engineering Task Force (IETF) and documented in various RFCs. Depending
on the vendor, many standard MIBs are delivered with the NMS software. You can
also download the standard MIBs from the IETF Web site, http://www.ietf.org, and
compile them into your NMS, if necessary.
For a list of standard and enterprise-specific supported MIBS, see the JUNOS Network
Management Configuration Guide.
Enterprise-specific MIBs are developed and supported by a specific equipment
manufacturer. If your network contains devices that have enterprise-specific MIBs,
you must obtain them from the manufacturer and compile them into your network
management software.
To download enterprise MIBs for a Services Router, go to
http://www.juniper.net/techpubs/software/index_mibs.html.
SNMP Communities
You can grant access to only specific SNMP managers for particular SNMP agents by
creating SNMP communities. The community is assigned a name that is unique on
the host. All SNMP requests that are sent to the agent must be configured with the
same community name. When multiple agents are configured on a particular host,
the community name process ensures that SNMP requests are sorted to only those
agents configured to handle the requests.
Additionally, communities allow you to specify one or more addresses or address
prefixes to which you want to either allow or deny access. By specifying a list of
48
■
SNMP Architecture
Chapter 3: Configuring SNMP for Network Management
clients, you can control exactly which SNMP managers have access to a particular
agent.
SNMP Traps
The get and set commands that SNMP uses are useful for querying hosts within a
network. However, the commands do not provide a means by which events can
trigger a notification. For instance, if a link fails, the health of the link is unknown
until an SNMP manager next queries that agent.
SNMP traps are unsolicited notifications that are triggered by events on the host.
When you configure a trap, you specify the types of events that can trigger trap
messages, and you configure a set of targets to receive the generated messages.
SNMP traps enable an agent to notify a network management system (NMS) of
significant events. You can configure an event policy action that uses system log
messages to initiate traps for events. The traps enable an SNMP trap-based application
to be notified when an important event occurs. You can convert any system log
message that has no corresponding traps into a trap. This feature helps you to use
NMS traps rather than system log messages to monitor the network.
Spoofing SNMP Traps
You can use the request snmp spoof-trap operational mode command to mimic SNMP
trap behavior. The contents of the traps (the values and instances of the objects
carried in the trap) can be specified on the command line or they can be spoofed
automatically. This feature is useful if you want to trigger SNMP traps from routers
and ensure they are processed correctly within your existing network management
infrastructure, but find it difficult to simulate the error conditions that trigger many
of the traps on the router. For more information, see the JUNOS System Basics and
Services Command Reference.
SNMP Health Monitor
The SNMP health monitor feature uses existing SNMP remote monitoring (RMON)
alarms and traps to monitor a select set of Services Router characteristics (object
instances) like the CPU usage, memory usage, and file system usage. The health
monitor feature also monitors the CPU usage of the J-series Services Router forwarding
process (also called a daemon)—for example, the chassis process and forwarding
process microkernel. You can configure the SNMP health monitor options rising
threshold, falling threshold, and interval using the SNMP Quick Configuration page.
A threshold is a test of some SNMP variable against some value, with a report when
the threshold value is exceeded. The rising threshold is the upper threshold for a
monitored variable. When the current sampled value is greater than or equal to this
threshold, and the value at the last sampling interval is less than this threshold, the
SNMP health monitor generates an alarm. After the rising alarm, the health monitor
cannot generate another alarm until the sampled value falls below the rising threshold
and reaches the falling threshold.
The falling threshold is the lower threshold for the monitored variable. When the
current sampled value is less than or equal to this threshold, and the value at the last
SNMP Architecture
■
49
J-series™ Services Router Administration Guide
sampling interval is greater than this threshold, the SNMP health monitor generates
an alarm. After the falling alarm, the health monitor cannot generate another alarm
until the sampled value rises above the falling threshold and reaches the rising
threshold.
The interval represents the period of time, in seconds, over which the object instance
is sampled and compared with the rising and falling thresholds.
At present, you do not have to configure a separate trap for the SNMP health monitor,
because it uses the already existing RMON traps. For more information about RMON
events and alarms, see the JUNOS Network Management Configuration Guide.
To display the information collected by the SNMP health monitor, use the following
CLI show snmp health-monitor commands:
■
show snmp health-monitor
■
show snmp health-monitor alarms
■
show snmp health-monitor alarms detail
■
show snmp health-monitor logs
For more information, see the JUNOS System Basics and Services Command Reference.
Before You Begin
Before you begin configuring SNMP, complete the following tasks:
■
Establish basic connectivity. See the Getting Started Guide for your router.
■
Configure network interfaces. See the J-series Services Router Basic LAN and WAN
Access Configuration Guide.
Configuring SNMP with Quick Configuration
J-Web Quick Configuration allows you to define system identification information,
create SNMP communities, create SNMP trap groups, and configure health monitor
options. Figure 7 on page 50 shows the Quick Configuration page for SNMP.
Figure 7: Quick Configuration Page for SNMP
ERROR: Unresolved graphic fileref="s020248.gif" not found in
"\\teamsite1\default\main\TechPubsWorkInProgress\STAGING\images\".
To configure SNMP features with Quick Configuration:
50
■
Before You Begin
1.
In the J-Web user interface, select Configuration>Quick Configuration>SNMP.
2.
Enter information into the Quick Configuration page for SNMP, as described in
Table 30 on page 51.
3.
From the SNMP Quick Configuration page, click one of the following buttons:
Chapter 3: Configuring SNMP for Network Management
4.
■
To apply the configuration and stay on the Quick Configuration page for
SNMP, click Apply.
■
To apply the configuration and return to the Quick Configuration SNMP page,
click OK.
■
To cancel your entries and return to the Quick Configuration for SNMP page,
click Cancel.
To check the configuration, see “Verifying the SNMP Configuration” on page 58.
Table 30: SNMP Quick Configuration Summary
Field
Function
Your Action
Contact Information
Free-form text string that specifies an
administrative contact for the system.
Type any contact information for the
administrator of the system (such as
name and phone number).
System Description
Free-form text string that specifies a
description for the system.
Type any system information that
describes the system (J4300 with 4 PIMs,
for example).
Local Engine ID
Provides an administratively unique
identifier of an SNMPv3 engine for
system identification.
Type the MAC address of Ethernet
management port 0.
Identification
The local engine ID contains a prefix and
a suffix. The prefix is formatted
according to specifications defined in
RFC 3411. The suffix is defined by the
local engine ID. Generally, the local
engine ID suffix is the MAC address of
Ethernet management port 0.
System Location
Free-form text string that specifies the
location of the system.
Type any location information for the
system (lab name or rack name, for
example).
System Name Override
Free-form text string that overrides the
system hostname.
Type the name of the system.
Click Add.
Communities
Community Name
Specifies the name of the SNMP
community.
Type the name of the community being
added.
Authorization
Specifies the type of authorization (either
read-only or read-write) for the SNMP
community being configured.
Select the desired authorization (either
read-only or read-write) from the list.
Click Add.
Traps
Trap Group Name
Specifies the name of the SNMP trap
group being configured.
Type the name of the SNMP trap group
being configured.
Configuring SNMP with Quick Configuration
■
51
J-series™ Services Router Administration Guide
Table 30: SNMP Quick Configuration Summary (continued)
Field
Function
Your Action
Categories
Specifies which trap categories are
added to the trap group being
configured.
■
To generate traps for authentication
failures, select Authentication.
■
To generate traps for chassis and
environment notifications, select
Chassis.
■
To generate traps for configuration
changes, select Configuration.
■
To generate traps for link-related
notifications (up-down transitions),
select Link.
■
To generate traps for remote
operation notifications, select
Remote operations.
■
To generate traps for remote
network monitoring (RMON), select
RMON alarm.
■
To generate traps for routing
protocol notifications, select
Routing.
■
To generate traps on system warm
and cold starts, select Startup.
■
To generate traps on Virtual Router
Redundancy Protocol (VRRP) events
(such as new-master or
authentication failures), select
VRRP events.
1.
Enter the hostname or IP address,
in dotted decimal notation, of the
target system to receive the SNMP
traps.
2.
Click Add.
Targets
One or more hostnames or IP addresses
that specify the systems to receive SNMP
traps generated by the trap group being
configured.
Health Monitoring
52
■
Configuring SNMP with Quick Configuration
Chapter 3: Configuring SNMP for Network Management
Table 30: SNMP Quick Configuration Summary (continued)
Field
Function
Your Action
Enable Health Monitoring
Enables the SNMP health monitor on the
router. The health monitor periodically
(the time you specify in the interval field)
checks the following key indicators of
router health:
Select the check box to enable the health
monitor and configure options. If you
do not select the check box, the health
monitor is disabled.
Interval
■
Percentage of file storage used
■
Percentage of Routing Engine CPU
used
■
Percentage of Routing Engine
memory used
■
Percentage of memory used for
each system process
■
Percentage of CPU used by the
forwarding process
■
Percentage of memory used for
temporary storage by the
forwarding process
Determines the sampling frequency, in
seconds, over which the key health
indicators are sampled and compared
with the rising and falling thresholds.
NOTE: If you select only the Enable
Health Monitoring check box and do not
specify the options, then SNMP health
monitoring is enabled with the default
values for the options.
Enter an interval time, in seconds,
between 1 and 2147483647.
The default value is 300 seconds (5
minutes).
For example, if you configure the
interval as 100 seconds, the values are
checked every 100 seconds.
Rising Threshold
Value at which you want SNMP to
generate an event (trap and system log
message) when the value of a sampled
indicator is increasing.
Enter a value between 0 and 100.
The default value is 90.
For example, if the rising threshold is 90
(the default), SNMP generates an event
when the value of any key indicator
reaches or exceeds 90 percent.
Falling Threshold
Value at which you want SNMP to
generate an event (trap and system log
message) when the value of a sampled
indicator is decreasing.
For example, if the falling threshold is
80 (the default), SNMP generates an
event when the value of any key
indicator falls back to 80 percent or less.
Enter a value between 0 and 100.
The default value is 80.
NOTE: The falling threshold value must
be less than the rising threshold value.
Configuring SNMP with Quick Configuration
■
53
J-series™ Services Router Administration Guide
Configuring SNMP with a Configuration Editor
To configure SNMP on a Services Router, you must perform the following tasks
marked (Required). For information about using the J-Web and CLI configuration
editors, see the J-series Services Router Basic LAN and WAN Access Configuration Guide.
■
Defining System Identification Information (Required) on page 54
■
Configuring SNMP Agents and Communities (Required) on page 55
■
Managing SNMP Trap Groups (Required) on page 56
■
Controlling Access to MIBs (Optional) on page 57
Defining System Identification Information (Required)
Basic system identification information for a Services Router can be configured with
SNMP and stored in various MIBs. This information can be accessed through SNMP
requests and either queried or reset. Table 31 on page 54 identifies types of basic
system identification and the MIB object into which each type is stored.
Table 31: System Identification Information and Corresponding MIB Objects
System Information
MIB
Contact
sysContact
System location
sysLocation
System description
sysDescr
System name override
sysName
To configure basic system identification for SNMP:
1.
Navigate to the top of the configuration hierarchy in either the J-Web or CLI
configuration editor.
2.
To configure basic system information using SNMP, perform the configuration
tasks described in Table 32 on page 54.
3.
If you are finished configuring the network, commit the configuration.
4.
To check the configuration, see “Verifying the SNMP Configuration” on page 58.
Table 32: Configuring Basic System Identification
Task
J-Web Configuration Editor
Navigate to the SNMP level in the
configuration hierarchy.
1.
In the J-Web interface, select
Configuration>View and Edit>Edit
Configuration.
2.
Next to Snmp, click Configure or Edit.
54
■
Configuring SNMP with a Configuration Editor
CLI Configuration Editor
From the [edit] hierarchy level,
enter
edit snmp
Chapter 3: Configuring SNMP for Network Management
Table 32: Configuring Basic System Identification (continued)
Task
J-Web Configuration Editor
CLI Configuration Editor
Configure the system contact information
(such as a name and phone number).
In the Contact box, type the contact
information as a free-form text string.
Set the contact information:
set contact “contact-information”
Configure the system location information
(such as a lab name and a rack name).
In the Location box, type the location
information as a free-form text string.
Set the location information:
set location “location-information”
Configure the system description (J4300
with 4 PIMs, for example).
In the Description box, type the description
information as a free-form text string.
Set the description information:
set description
“description-information”
Configure a system name to override the
system hostname defined in the Getting
Started Guide for your router.
In the System Name box, type the system
name as a free-form text string.
Configure the local engine ID to use the
MAC address of Ethernet management
port 0 as the engine ID suffix.
1.
Select Engine id.
2.
In the Engine id choice box, select Use
mac address from the list.
3.
Click OK.
Set the system name:
set name name
Set the engine ID to use the MAC
address:
set engine-id use-mac-address
Configuring SNMP Agents and Communities (Required)
To configure the SNMP agent, you must enable and authorize the network
management system access to the Services Router, by configuring one or more
communities. Each community has a community name, an authorization, which
determines the kind of access the network management system has to the router,
and, when applicable, a list of valid clients that can access the router.
To configure SNMP communities:
1.
Navigate to the top of the configuration hierarchy in either the J-Web or CLI
configuration editor.
2.
To configure SNMP communities, perform the configuration tasks described in
Table 33 on page 56.
3.
If you are finished configuring the network, commit the configuration.
4.
To check the configuration, see “Verifying the SNMP Configuration” on page 58.
Configuring SNMP with a Configuration Editor
■
55
J-series™ Services Router Administration Guide
Table 33: Configuring SNMP Agents and Communities
Task
J-Web Configuration Editor
CLI Configuration Editor
Navigate to the SNMP level in the
configuration hierarchy.
1.
From the [edit] hierarchy level, enter
Create and name a community.
Grant read-write access to the
community.
In the J-Web interface, select
Configuration>View and Edit>Edit
Configuration.
edit snmp
2.
Next to Snmp, click Configure or Edit.
1.
Next to Community, click Add new entry.
Create a community:
2.
In the Community box, type the name of
the community as a free-form text string.
set community community-name
In the Authorization box, select read-write from
the list.
Set the authorization to read-write:
set community community-name
authorization read-write
Allow community access to a
client at a particular IP
address—for example, at IP
address 10.10.10.10.
Allow community access to a
group of clients—for example, all
addresses within the
10.10.10.0/24 prefix, except
those within the 10.10.10.10/29
prefix.
1.
Next to Clients, click Add new entry.
Configure client access for the IP
address 10.10.10.10:
2.
In the Prefix box, type the IP address, in
dotted decimal notation.
3.
Click OK.
set community community-name clients
10.10.10.10
1.
Next to Clients, click Add new entry.
1.
2.
In the Prefix box, type the IP address
prefix 10.10.10.0/24, and click OK.
3.
Next to Clients, click Add new entry.
4.
In the Prefix box, type the IP address
prefix 10.10.10.10/29.
5.
Select the Restrict check box.
6.
Click OK.
Configure client access for the IP
address 10.10.10.0/24:
set community community-name
clients 10.10.10.0/24
2.
Configure client access to restrict
the IP addresses 10.10.10.10/29:
set community community-name
clients 10.10.10.10/29 restrict
Managing SNMP Trap Groups (Required)
SNMP traps are unsolicited notifications that are generated by conditions on the
Services Router. When events trigger a trap, a notification is sent to the configured
clients for that particular trap group. To manage a trap group, you must create the
group, specify the types of traps that are included in the group, and define one or
more targets to receive the trap notifications.
To configure SNMP trap groups:
56
■
1.
Navigate to the top of the configuration hierarchy in either the J-Web or CLI
configuration editor.
2.
To configure SNMP trap groups, perform the configuration tasks described in
Table 34 on page 57.
Configuring SNMP with a Configuration Editor
Chapter 3: Configuring SNMP for Network Management
3.
If you are finished configuring the network, commit the configuration.
4.
To check the configuration, see “Verifying the SNMP Configuration” on page 58.
Table 34: Configuring SNMP Trap Groups
Task
J-Web Configuration Editor
CLI Configuration Editor
Navigate to the SNMP level in the
configuration hierarchy.
1.
In the J-Web interface, select
Configuration>View and Edit>Edit
Configuration.
From the [edit] hierarchy level,
enter
2.
Next to Snmp, click Configure or Edit.
1.
Next to Trap group, click Add new entry.
Create a community:
2.
In the Group name box, type the name
of the group as a free-form text string.
set trap-group trap-group-name
1.
Next to Targets, click Add new entry.
2.
In the Target box, type the IP address
192.174.6.6, and click OK.
Create a trap group.
Configure the trap group to send all trap
notifications to a target IP address—for
example, to the IP address 192.174.6.6.
Configure the trap group to generate
SNMP notifications on authentication
failures, environment alarms, and
changes in link state for any of the
interfaces.
1.
Click Categories.
2.
Select the Authentication, Chassis, and
Link check boxes.
3.
Click OK.
edit snmp
Set the trap-group target to
192.174.6.6:
set trap-group trap-group-name
targets 192.174.6.6
Configure the trap group categories:
set trap-group trap-group-name
categories authentication chassis link
Controlling Access to MIBs (Optional)
By default, an SNMP community is granted access to all MIBs. To control the MIBs
to which a particular community has access, configure SNMP views that include the
MIBs you want to explicitly grant or deny access to.
To configure SNMP views:
1.
Navigate to the top of the configuration hierarchy in either the J-Web or CLI
configuration editor.
2.
To configure SNMP views, perform the configuration tasks described in
Table 35 on page 58.
3.
If you are finished configuring the network, commit the configuration.
4.
To check the configuration, see “Verifying the SNMP Configuration” on page 58.
Configuring SNMP with a Configuration Editor
■
57
J-series™ Services Router Administration Guide
Table 35: Configuring SNMP Views
Task
J-Web Configuration Editor
CLI Configuration Editor
Navigate to the SNMP level
in the configuration
hierarchy.
1.
In the J-Web interface, select Configuration>View
and Edit>Edit Configuration.
From the [edit] hierarchy level,
enter
2.
Next to Snmp, click Configure or Edit.
1.
Next to View, click Add new entry.
Create a view:
2.
In the Name box, type the name of the view as a
free-form text string.
set view view-name
1.
Next to Oid, click Add new entry.
2.
In the Name box, type the OID of the pingMIB, in
either dotted integer or subtree name format.
3.
In the View action box, select include from the list,
and click OK.
1.
Next to Oid, click Add new entry.
2.
In the Name box, type the OID of the jnxPingMIB, in
either dotted integer or subtree name format.
3.
In the View action box, select exclude from the list,
and click OK twice.
1.
On the Snmp page, under Community, click the
name of the community to which you want to apply
the view.
Create a view.
Configure the view to include
a MIB—for example, pingMIB.
Configure the view to
exclude a MIB—for example,
jnxPingMIB.
Associate the view with a
community.
2.
In the View box, type the view name.
3.
Click OK.
edit snmp
Set the pingMIB OID value and
mark it for inclusion:
set view view-name oid
1.3.6.1.2.1.80 include
Set the jnxPingMIB OID value and
mark it for exclusion:
set view view-name oid jnxPingMIB
exclude
Set the community view:
set community community-name view
view-name
Verifying the SNMP Configuration
To verify the SNMP configuration, perform the following verification task.
Verifying SNMP Agent Configuration
Purpose
Action
Verify that SNMP is running and that requests and traps are being properly
transmitted.
From the CLI, enter the show snmp statistics command.
user@host> show snmp statistics
SNMP statistics:
Input:
Packets: 246213, Bad versions: 12 , Bad community names: 12,
Bad community uses: 0, ASN parse errors: 96,
Too bigs: 0, No such names: 0, Bad values: 0,
Read onlys: 0, General errors: 0,
Total request varbinds: 227084, Total set varbinds: 67,
58
■
Verifying the SNMP Configuration
Chapter 3: Configuring SNMP for Network Management
Get requests: 44942, Get nexts: 190371, Set requests: 10712,
Get responses: 0, Traps: 0,
Silent drops: 0, Proxy drops: 0, Commit pending drops: 0,
Throttle drops: 0,
V3 Input:
Unknown security models: 0, Invalid messages: 0
Unknown pdu handlers: 0, Unavailable contexts: 0
Unknown contexts: 0, Unsupported security levels: 1
Not in time windows: 0, Unknown user names: 0
Unknown engine ids: 44, Wrong digests: 23, Decryption errors: 0
Output:
Packets: 246093, Too bigs: 0, No such names: 31561,
Bad values: 0, General errors: 2,
Get requests: 0, Get nexts: 0, Set requests: 0,
Get responses: 246025, Traps: 0
Meaning
Related Topics
The output shows a list of the SNMP statistics, including details about the number
and types of packets transmitted. Verify the following information:
■
The number of requests and traps is increasing as expected with the SNMP client
configuration.
■
Under Bad community names, the number of bad (invalid) communities is not
increasing. A sharp increase in the number of invalid community names generally
means that one or more community strings are configured incorrectly.
For a complete description of show snmp statistics output, see the JUNOS System
Basics and Services Command Reference.
Verifying SNMP Health Monitor Configuration
Purpose
Action
Verify that the SNMP health monitor thresholds are set correctly and that the health
monitor is operating properly.
From the CLI, enter the show snmp health-monitor command.
user@host>
Alarm
Index
show snmp health-monitor
Variable description
Value State
32768 Health Monitor: root file system utilization
jnxHrStoragePercentUsed.1
32769 Health Monitor: /config file system utilization
jnxHrStoragePercentUsed.2
70 active
0 active
32770 Health Monitor: RE 0 CPU utilization
jnxOperatingCPU.9.1.0.0
20 active
32772 Health Monitor: RE 0 memory utilization
jnxOperatingBuffer.9.1.0.0
95 rising threshold
32774 Health Monitor: jkernel daemon memory usage
Init daemon
Chassis daemon
Firewall daemon
912 active
93356 active
2244 active
Verifying SNMP Health Monitor Configuration
■
59
J-series™ Services Router Administration Guide
Interface daemon
SNMP daemon
MIB2 daemon
VRRP daemon
Alarm daemon
PFE daemon
CRAFT daemon
Traffic sampling control daemon
Remote operations daemon
CoS daemon
Inet daemon
Syslog daemon
Web management daemon
USB Supervise Daemon
PPP daemon
DLSWD daemon
32775 Health Monitor: jroute daemon memory usage
Routing protocol daemon
Management daemon
Management daemon
Management daemon
Command line interface
Command line interface
Periodic Packet Management daemon
Bidirectional Forwarding Detection daemon
L2 Address Learning daemon
32776 Health Monitor: jcrypto daemon memory usage
IPSec Key Management daemon
3340
4412
3920
2724
1868
2656
2064
3320
3020
3044
1304
1344
3264
1100
2076
10240
active
active
active
active
active
active
active
active
active
active
active
active
active
active
active
active
8952
14516
14556
14556
10312
10312
1640
1912
2080
active
active
active
active
active
active
active
active
active
5672 active
32778 Health Monitor: FWDD Micro-Kernel threads total CPU Utilization
jnxFwddMicroKernelCPUUsage.0
0 active
32779 Health Monitor: FWDD Real-Time threads total CPU Utilization
jnxFwddRtThreadsCPUUsage.0
15 active
32780 Health Monitor: FWDD DMA Memory utilization
jnxFwddDmaMemUsage.0
16 active
32781 Health Monitor: FWDD Heap utilization
jnxFwddHeapUsage.0
54 active
---(more)---
Meaning
The output shows a summary of SNMP health monitor alarms and corresponding
log entries:
■
Alarm Index—Alarm identifier.
■
Variable description—Object instance being monitored.
■
Value—Current value of the monitored variable in the most recent sample interval.
■
State—Status of the alarm. For example:
■
active—Entry is fully configured and activated.
■
falling threshold crossed—Variable value has crossed the lower threshold
limit.
60
■
Verifying SNMP Health Monitor Configuration
Chapter 3: Configuring SNMP for Network Management
■
rising threshold crossed—Variable value has crossed the upper threshold
limit.
Verify that any rising threshold values are greater than the configured rising threshold,
and that any falling threshold values are less than the configured falling threshold.
Related Topics
For a complete description of show snmp health-monitor output, see the JUNOS System
Basics and Services Command Reference.
Verifying SNMP Health Monitor Configuration
■
61
J-series™ Services Router Administration Guide
62
■
Verifying SNMP Health Monitor Configuration
Chapter 4
Configuring the Router as a DHCP Server
A Dynamic Host Configuration Protocol (DHCP) server can automatically allocate IP
addresses and also deliver configuration settings to client hosts on a subnet. DHCP
is particularly useful for managing a pool of IP addresses among hosts. An IP address
can be leased to a host for a limited period of time, allowing the DHCP server to
share a limited number of IP addresses among a group of hosts that do not need
permanent IP addresses.
The Services Router acts as the DHCP server, providing IP addresses and settings to
hosts, such as PCs, that are connected to router interfaces. The DHCP server is
compatible with the DHCP servers of other vendors on the network.
NOTE: Currently, the DHCP server does not support IPv6 address assignment, user
class-specific configuration, DHCP failover protocol, or dynamic Domain Name
System (DNS) updates. You cannot use DHCP for virtual private network (VPN)
connections.
You can use either J-Web Quick Configuration or a configuration editor to configure
the DHCP server.
This chapter contains the following topics. For more information about DHCP, see
the JUNOS System Basics Configuration Guide.
■
DHCP Terms on page 63
■
DHCP Overview on page 64
■
Before You Begin on page 66
■
Configuring the DHCP Server with Quick Configuration on page 66
■
Configuring the DHCP Server with a Configuration Editor on page 72
■
Verifying a DHCP Server Configuration on page 75
DHCP Terms
Before configuring the DHCP server on J-series Services Routers, become familiar
with the terms defined in Table 36 on page 64.
DHCP Terms
■
63
J-series™ Services Router Administration Guide
Table 36: DHCP Terms
Term
Definition
binding
Collection of configuration parameters, including at least an IP address, assigned by a DHCP
server to a DHCP client. A binding can be dynamic (temporary) or static (permanent). Bindings
are stored in the DHCP server's binding database.
conflict
Problem that occurs when an address within the IP address pool is being used by a host that
does not have an associated binding in the DHCP server's database. Addresses with conflicts
are removed from the pool and logged in a conflicts list until you clear the list.
DHCP client
Host that uses DHCP to obtain an IP address and configuration settings.
DHCP options
Configuration settings sent within a DHCP message from a DHCP server to a DHCP client. For
a list of DHCP options, see RFC 2132, DHCP Options and BOOTP Vendor Extensions.
DHCP server
Host that provides an IP address and configuration settings to a DHCP client. The Services Router
is a DHCP server.
Dynamic Host
Configuration Protocol
(DHCP)
Configuration management protocol you can use to supervise and automatically distribute IP
addresses and deliver configuration settings to client hosts from a central DHCP server. An
extension of BOOTP, DHCP is defined in RFC 2131, Dynamic Host Configuration Protocol (DHCP).
gateway router
Router that passes DHCP messages between DHCP clients and DHCP servers. A gateway router
is sometimes referred to as a relay agent.
IP address pool
Collection of IP addresses maintained by the DHCP server for assignment to DHCP clients. The
address pool is associated with a subnet on either a logical or physical interface.
lease
Period of time during which an IP address is allocated, or bound, to a DHCP client. A lease can
be temporary (dynamic binding) or permanent (static binding).
router solicitation address
IP address to which a DHCP client can transmit router solicitation requests.
Windows Name Service
(WINS) server
Server running the Microsoft Windows name resolution service for network basic input/output
system (NetBIOS) names. WINS is used by hosts running NetBIOS over TCP/IP (NetBT) to register
NetBIOS names and to resolve NetBIOS names to IP addresses.
DHCP Overview
DHCP is based on BOOTP, a bootstrap protocol that allows a client to discover its
own IP address, the IP address of a server host, and the name of a bootstrap file.
DHCP servers can handle requests from BOOTP clients, but provide additional
capabilities beyond BOOTP, such as the automatic allocation of reusable IP addresses
and additional configuration options.
NOTE: You cannot configure the Services Router as both a DHCP server and a BOOTP
relay agent.
DHCP provides two primary functions:
■
64
■
DHCP Overview
Allocate temporary or permanent IP addresses to clients.
Chapter 4: Configuring the Router as a DHCP Server
■
Store, manage, and provide client configuration parameters.
As a DHCP server, a Services Router can provide temporary IP addresses from an
IP address pool to all clients on a specified subnet, a process known as dynamic
binding. Services Routers can also perform static binding, assigning permanent IP
addresses to specific clients based on their media access control (MAC) addresses.
Static bindings take precedence over dynamic bindings.
DHCP Options
In addition to its primary DHCP functions, you can also configure the Services Router
to send configuration settings like the following to clients through DHCP:
■
IP address of the DHCP server (Services Router).
■
List of Domain Name System (DNS) and NetBIOS servers
■
List of gateway routers
■
IP address of the boot server and the filename of the boot file to use
■
DHCP options defined in RFC 2132, DHCP Options and BOOTP Vendor Extensions
Compatibility with Autoinstallation
Services Router DHCP server functions are compatible with the autoinstallation
feature. The DHCP server automatically checks any autoinstallation settings for
conflicts and gives the autoinstallation settings priority over corresponding DHCP
settings. For example, an IP address set by autoinstallation takes precedence over
an IP address set by the DHCP server.
(To configure autoinstallation, see “Configuring Autoinstallation” on page 81.)
Conflict Detection and Resolution
A client that receives an IP address from the Services Router operating as a DHCP
server performs a series of Address Resolution Protocol (ARP) tests to verify that the
address is available and no conflicts exist. If the client detects an address conflict, it
informs the DHCP server about the conflict and can request another IP address from
the DHCP server.
The Services Router maintains a log of all client-detected conflicts and removes
addresses with conflicts from the DHCP address pool. To display the conflicts list,
you use the show system services dhcp conflict command. The addresses in the
conflicts list remain excluded until you use the clear system services dhcp conflict
command to manually clear the list.
Interface Restrictions
The Services Router supports DHCP client requests received on Fast Ethernet
interfaces only. However, DHCP requests received from a relay agent are supported
on all interface types.
DHCP Overview
■
65
J-series™ Services Router Administration Guide
DHCP is not supported on interfaces that are part of a virtual private network (VPN).
Before You Begin
Before you begin configuring the Services Router as a DHCP server, complete the
following tasks:
■
Determine the IP address pools and the lease durations to use for each subnet.
■
Obtain the MAC addresses of the clients that require permanent IP addresses.
Determine the IP addresses to use for these clients.
■
List the IP addresses that are available for the servers and routers on your
network—DNS, NetBIOS servers, boot servers, and gateway routers, for example.
■
Determine the DHCP options required by the subnets and clients in your network.
Configuring the DHCP Server with Quick Configuration
The DHCP Quick Configuration pages allow you to configure DHCP pools for subnets
and static bindings for DHCP clients. If DHCP pools or static bindings are already
configured, you can use the Configure Global DHCP Parameters Quick Configuration
page to add settings for these pools and static bindings. Settings that have been
previously configured for DHCP pools or static bindings are not overridden when
you use the Configure Global DHCP Parameters Quick Configuration page.
Figure 8 on page 67 through Figure 10 on page 69 show the DHCP Quick
Configuration pages.
66
■
Before You Begin
Chapter 4: Configuring the Router as a DHCP Server
Figure 8: DHCP Quick Configuration Main Page
Configuring the DHCP Server with Quick Configuration
■
67
J-series™ Services Router Administration Guide
Figure 9: DHCP Quick Configuration Pool Page
68
■
Configuring the DHCP Server with Quick Configuration
Chapter 4: Configuring the Router as a DHCP Server
Figure 10: DHCP Quick Configuration Static Binding Page
To configure the DHCP server with Quick Configuration:
1.
In the J-Web interface, select Configuration>Quick Configuration>DHCP.
2.
Access a DHCP Quick Configuration page:
■
To configure a DHCP pool for a subnet, click Add in the DHCP Pools box.
■
To configure a static binding for a DHCP client, click Add in the DHCP Static
Binding box.
■
To globally configure settings for existing DHCP pools and static bindings,
click Configure Global DHCP Parameters.
Configuring the DHCP Server with Quick Configuration
■
69
J-series™ Services Router Administration Guide
3.
Enter information into the DHCP Quick Configuration pages, as described in
Table 37 on page 70.
4.
Click one of the following buttons on the DHCP Quick Configuration page:
5.
■
To apply the configuration and return to the Quick Configuration page, click
OK.
■
To cancel your entries and return to the Quick Configuration page, click
Cancel.
Go on to one of the following procedures:
■
To display the configuration, see Displaying a DHCP Server
Configuration on page 75.
■
To verify DHCP operation, see “Verifying a DHCP Server
Configuration” on page 75.
Table 37: DHCP Server Quick Configuration Pages Summary
Field
Function
Your Action
DHCP Subnet (required)
Specifies the subnet on which DHCP is
configured.
Type an IP address prefix.
Address Range (Low)
(required)
Specifies the lowest address in the IP address
pool range.
Type an IP address that is part of the subnet
specified in DHCP Subnet.
Address Range (High)
(required)
Specifies the highest address in the IP address
pool range.
Type an IP address that is part of the subnet
specified in DHCP Subnet. This address must
be greater than the address specified in Address
Range (Low).
Exclude Addresses
Specifies addresses to exclude from the IP
address pool.
Do either of the following:
DHCP Pool Information
■
To add an excluded address, type the
address next to the Add button, and click
Add.
■
To delete an excluded address, select the
address in the Exclude Addresses box, and
click Delete.
Lease Time
Maximum Lease Time
(Seconds)
Specifies the maximum length of time a client
can hold a lease. (Dynamic BOOTP lease
lengths can exceed this maximum time.)
Type a number between 60 and 4,294,967,295
(seconds). You can also type infinite to specify
a least that never expires.
Default Lease Time
(Seconds)
Specifies the length of time a client can hold a
lease, for clients that do not request a specific
lease length.
Type a number between 60 and 2,147,483,647
(seconds). You can also type infinite to specify
a least that never expires.
Server Information
70
■
Configuring the DHCP Server with Quick Configuration
Chapter 4: Configuring the Router as a DHCP Server
Table 37: DHCP Server Quick Configuration Pages Summary (continued)
Field
Function
Your Action
Server Identifier
Specifies the IP address of the DHCP server
reported to a client.
Type the IP address of the Services Router. If
you do not specify a server identifier, the
primary address of the interface on which the
DHCP exchange occurs is used.
Domain Name
Specifies the domain name that clients must
use to resolve hostnames.
Type the name of the domain.
Domain Search
Specifies the order—from top to bottom—in
which clients must append domain names
when resolving hostnames using DNS.
Do either of the following:
DNS Name Servers
Gateway Routers
WINS Servers
Defines a list of DNS servers the client can use,
in order of preference—from top to bottom.
Defines a list of relay agents on the subnet, in
order of preference—from top to bottom.
Defines a list of NetBIOS name servers, in order
of preference—from top to bottom.
■
To add a domain name, type the name
next to the Add button, and click Add.
■
To delete a domain name, select the name
in the Domain Search box, and click
Delete.
Do either of the following:
■
To add a DNS server, type an IP address
next to the Add button, and click Add.
■
To remove a DNS server, select the IP
address in the DNS Name Servers box,
and click Delete.
Do either of the following:
■
To add a relay agent, type an IP address
next to the Add button, and click Add.
■
To remove a relay agent, select the IP
address in the Gateway Routers box, and
click Delete.
Do either of the following:
■
To add a NetBIOS name server, type an
IP address next to the Add button, and
click Add.
■
To remove a NetBIOS name server, select
the IP address in the WINS Servers box,
and click Delete.
Boot Options
Boot File
Specifies the path and filename of the initial
boot file to be used by the client.
Type a path and filename.
Boot Server
Specifies the TFTP server that provides the
initial boot file to the client.
Type the IP address or hostname of the TFTP
server.
DHCP Static Binding Information
DHCP MAC Address
(required)
Specifies the MAC address of the client to be
permanently assigned a static IP address.
Type the hexadecimal MAC address of the
client.
Configuring the DHCP Server with Quick Configuration
■
71
J-series™ Services Router Administration Guide
Table 37: DHCP Server Quick Configuration Pages Summary (continued)
Field
Function
Your Action
Fixed IP Addresses
(required)
Defines a list of IP addresses permanently
assigned to the client. A static binding must
have at least one fixed address assigned to it,
but multiple addresses are also allowed.
Do either of the following:
■
To add an IP address, type it next to the
Add button, and click Add.
■
To remove an IP address, select it in the
Fixed IP Addresses box, and click Delete.
Host Name
Specifies the name of the client used in DHCP
messages exchanged between the server and
the client. The name must be unique to the
client within the subnet on which the client
resides.
Type a client hostname.
Client Identifier
Specifies the name of the client used by the
DHCP server to index its database of address
bindings. The name must be unique to the
client within the subnet on which the client
resides.
Type a client identifier in string form.
Hexadecimal Client
Identifier
Specifies the name of the client, in
hexadecimal, used by the DHCP server to index
its database of address bindings. The name
must be unique to the client within the subnet
on which the client resides.
Type a client identifier in hexadecimal form.
Configuring the DHCP Server with a Configuration Editor
A typical DHCP server configuration provides the following configuration settings for
a particular subnet on a Services Router interface:
■
An IP address pool, with one address excluded from the pool.
■
Default and maximum lease times.
■
Domain search suffixes. These suffixes specify the domain search list used by a
client when resolving hostnames with DNS. See RFC 3397, Dynamic Host
Configuration Protocol (DHCP) Domain Search Option, for more information.
■
A DNS name server.
■
A DHCP option—Router solicitation address option (option 32). The IP address
excluded from the IP address pool is reserved for this option.
In addition, the DHCP server might assign a static address to at least one client on
the subnet. Table 38 on page 72 provides the settings and values for the sample
DHCP server configuration used in this section.
Table 38: Sample DHCP Server Configuration Settings
Settings
DHCP Subnet Configuration
72
■
Configuring the DHCP Server with a Configuration Editor
Sample Value or Values
Chapter 4: Configuring the Router as a DHCP Server
Table 38: Sample DHCP Server Configuration Settings (continued)
Settings
Sample Value or Values
Address pool subnet address
192.168.2.0/24
High address in the pool range
192.168.2.254
Low address in the pool range
192.168.2.2
Address pool default lease time, in seconds
1,209,600 (14 days)
Address pool maximum lease time, in seconds
2,419,200 (28 days)
Domain search suffixes
mycompany.net
mylab.net
Address to exclude from the pool
192.168.2.33
DNS server address
192.168.10.2
Identifier code for router solicitation address option
32
Type choice for router solicitation address option
Ip address
IP address for router solicitation address option
192.168.2.33
DHCP MAC Address Configuration
Static binding MAC address
01:03:05:07:09:0B
Fixed address
192.168.2.50
To configure the Services Router as a DHCP server for a subnet and a single client:
1.
Navigate to the top of the configuration hierarchy in either the J-Web or CLI
configuration editor.
2.
Perform the configuration tasks described in Table 39 on page 74.
3.
If you are finished configuring the router, commit the configuration.
4.
To verify DHCP server configuration and operation, see “Verifying a DHCP Server
Configuration” on page 75.
Configuring the DHCP Server with a Configuration Editor
■
73
J-series™ Services Router Administration Guide
Table 39: Configuring the DHCP Server
Task
J-Web Configuration Editor
CLI Configuration Editor
Navigate to the Dhcp
server level in the
configuration hierarchy.
1.
From the [edit] hierarchy level, enter
Define the IP address pool.
Define the default and
maximum lease times, in
seconds.
Define the domain search
suffixes to be used by the
clients.
Exclude addresses from
the IP address pool.
74
■
In the J-Web interface, select
Configuration>View and Edit>Edit
Configuration.
2.
Next to System, click Configure or Edit.
3.
Next to Services, make sure the check box
is selected, and click Configure or Edit.
4.
Next to Dhcp, click Configure or Edit.
5.
In the Next server box, type 192.168.2.5.
1.
Next to Pool, click Add new entry.
2.
In the Subnet address box, type
192.168.2.0/24.
3.
Next to Address range, select the check
box.
4.
Next to Address range, click Configure.
5.
In the High box, type 192.168.2.254.
6.
In the Low box, type 192.168.2.2.
7.
Click OK.
1.
From the Default lease time list, select
Enter Specific Value.
2.
In the Length box, type 1209600.
3.
From the Maximum lease time list, select
Enter Specific Value.
4.
Next to Maximum lease time, type
2419200.
1.
Next to Domain search, click Add new
entry.
2.
In the Suffix box, type mycompany.net.
3.
Click OK.
4.
Next to Domain search, click Add new
entry.
5.
In the Suffix box, type mylab.net.
6.
Click OK.
1.
Next to Exclude address, click Add new
entry.
2.
In the Address box, type 192.168.2.33.
3.
Click OK.
Configuring the DHCP Server with a Configuration Editor
edit system services dhcp
edit system services dhcp next-server
192.168.2.5
Set the IP address pool range:
set pool 192.168.2.0/24 address-range
low 192.168.2.2 high 192.168.2.254
Set the default and maximum lease times:
set pool 192.168.2.0/24
default-lease-time 1209600
maximum-lease-time 2419200
Set the domain search suffixes:
set pool 192.168.2.0/24
domain-search mycompany.net
set pool 192.168.2.0/24
domain-search mylab.net
Set the address to exclude from the IP address
pool:
set pool 192.168.2.0/24
exclude-address 192.168.2.33
Chapter 4: Configuring the Router as a DHCP Server
Table 39: Configuring the DHCP Server (continued)
Task
J-Web Configuration Editor
CLI Configuration Editor
Define a DNS server.
1.
Next to Name server, click Add new
entry.
Set the DNS server IP address:
2.
In the Address box, type 192.168.10.2.
3.
Click OK.
1.
Next to Option, click Add new entry.
2.
In the Option identifier code box, type 32.
3.
From the Option type choice list, select
Ip address.
4.
In the Ip address box, type 192.168.2.33.
5.
Click OK twice.
1.
Next to Static binding, click Add new
entry.
2.
In the Mac address box, type
01:03:05:07:09:0B.
3.
Next to Fixed address, click Add new
entry.
4.
In the Address box, type 192.168.2.50.
5.
Click OK until you return to the
Configuration page.
Define DHCP
option 32—the router
solicitation address option.
Assign a static IP address
of 192.168.2.50 to MAC
address
01:03:05:07:09:0B.
set pool 192.168.2.0/24
name-server 192.168.10.2
Set the router solicitation IP address:
set pool 192.168.2.0/24 option 32
ip-address 192.168.2.33
Associate a fixed IP address with the MAC
address of the client:
set static-binding 01:03:05:07:09:0B
fixed-address 192.168.2.50
Verifying a DHCP Server Configuration
To verify a DHCP server configuration, perform the following tasks:
■
Displaying a DHCP Server Configuration on page 75
■
Verifying the DHCP Binding Database on page 76
■
Verifying DHCP Server Operation on page 77
■
Displaying DHCP Statistics on page 79
Displaying a DHCP Server Configuration
Purpose
Action
Verify the configuration of a DHCP server.
From the J-Web interface, select
Configuration>View and Edit>View Configuration Text. Alternatively, from
configuration mode in the CLI, enter the show system services dhcp command from
the top level.
You can also view the IP address pool from the CLI in operational mode by entering
the show system services dhcp pool command.
Verifying a DHCP Server Configuration
■
75
J-series™ Services Router Administration Guide
[edit]
user@host# show system services dhcp
pool 192.168.2.0/24 {
address-range low 192.168.2.2 high 192.168.2.254;
exclude-address {
192.168.2.33;
}
maximum-lease-time 2419200;
default-lease-time 1209600;
name-server {
192.168.10.2;
}
domain-search {
mycompany.net;
mylab.net;
}
option 16 ip-address 192.168.2.33;
}
static-binding 01.03.05.07.09.0b {
fixed-address {
192.168.2.50;
}
}
Meaning
Related Topics
Verify that the output shows the intended configuration of the DHCP server.
For more information about the format of a configuration file, see the J-series Services
Router Basic LAN and WAN Access Configuration Guide.
Verifying the DHCP Binding Database
Purpose
Action
Verify that the DHCP binding database reflects your DHCP server configuration.
From operational mode in the CLI, to display all active bindings in the database,
enter the show system services dhcp binding command. To display all bindings in the
database, including their current binding state, enter the show system services dhcp
binding detail command. To display more information about a client, including its
DHCP options, enter the show system services dhcp binding ip-address detail command,
replacing ip-address with the IP address of the client.
The DHCP binding database resulting from the configuration defined in “Configuring
the DHCP Server with a Configuration Editor” on page 72 is displayed in the following
sample output.
To clear the DHCP binding database, enter the clear system services dhcp binding
command. To remove a specific entry from the DHCP binding database, enter the
clear system services dhcp binding ip-address command, replacing ip-address with the
IP address of the client.
You can also use the J-Web interface to view information in the DHCP binding
database. For more information, see “Monitoring DHCP” on page 143.
user@host> show system services dhcp binding
76
■
Verifying the DHCP Binding Database
Chapter 4: Configuring the Router as a DHCP Server
IP Address
Hardware Address
192.168.2.2 02:04:06:08:0A:0C
192.168.2.50 01:03:05:07:09:0B
Type
dynamic
static
Lease expires at
2005-02-07 8:48:59 PDT
never
user@host> show system services dhcp binding 192.168.2.2 detail
IP address
192.168.2.2
Hardware address
02:04:06:08:0A:0C
Pool
192.168.2.0/24
Request received on fe-0/0/0
Lease information:
Type
Obtained at
Expires at
State
DHCP
2005-01-24 8:48:59 PDT
2005-02-07 8:48:59 PDT
active
DHCP options:
Name: domain-name, Value: mycompany.net mylab.net
Name: name-server, Value: 192.168.10.2
Code: 16, Type: ip-address, Value: 192.168.2.33
user@host> show system services dhcp conflict
Meaning
Related Topics
Verify the following information:
■
For each dynamic binding, verify that the IP address is within the range of the
configured IP address pool. Under Lease Expires, verify that the difference
between the date and time when the lease expires and the current date and time
is less than the maximum configured lease time.
■
For each static binding, verify that the IP address corresponds to the MAC address
displayed under Hardware Address (as defined in the static-binding statement in
the configuration). Under Lease Expires, verify that the lease expiration is never.
■
In the output displayed by the show system services dhcp binding ip-address detail
command, verify that the options under DHCP options are correct for the subnet.
■
Verify that the show system services dhcp conflict command does not display
any conflicts.
For complete descriptions of show system services dhcp binding and show system
services dhcp conflict commands and output, see the JUNOS System Basics and Services
Command Reference.
Verifying DHCP Server Operation
Purpose
Action
Verify that the DHCP server is operating as configured.
Take the following actions:
■
Use the ping command to verify that a client responds to ping packets containing
the destination IP address assigned by the Services Router.
■
Display the IP configuration on the client. For example, on a PC running Microsoft
Windows, enter ipconfig /all at the command prompt to display the PC's IP
configuration.
Verifying DHCP Server Operation
■
77
J-series™ Services Router Administration Guide
user@host> ping 192.168.2.2
PING 192.168.2.2 (192.168.2.2): 56 data bytes
64 bytes from 192.168.2.2: icmp_seq=0 ttl=255 time=8.856 ms
64 bytes from 192.168.2.2: icmp_seq=1 ttl=255 time=11.543 ms
64 bytes from 192.168.2.2: icmp_seq=2 ttl=255 time=10.315 ms
...
C:\Documents and Settings\user> ipconfig /all
Windows 2000 IP Configuration
Host Name . . . . . . .
Primary DNS Suffix . .
Node Type . . . . . . .
IP Routing Enabled. . .
WINS Proxy Enabled. . .
DNS Suffix Search List.
.
.
.
.
.
.
.
.
.
.
.
.
.
.
.
.
.
.
.
.
.
.
.
.
.
.
.
.
.
.
:
:
:
:
:
:
my-pc
mycompany.net
Hybrid
No
No
mycompany.net
mylab.net
:
:
:
:
:
:
:
:
:
:
:
:
:
:
mycompany.net mylab.net
10/100 LAN Fast Ethernet Card
02-04-06-08-0A-0C
Yes
Yes
192.168.2.2
255.255.254.0
192.168.10.3
192.168.2.1
192.168.10.2
192.168.10.4
192.168.10.5
Monday, January 24, 2005 8:48:59 AM
Monday, February 7, 2005 8:48:59 AM
Ethernet adapter Local Area Connection 2:
Connection-specific DNS Suffix
Description . . . . . . . . . .
Physical Address. . . . . . . .
DHCP Enabled. . . . . . . . . .
Autoconfiguration Enabled . . .
IP Address. . . . . . . . . . .
Subnet Mask . . . . . . . . . .
Default Gateway . . . . . . . .
DHCP Server . . . . . . . . . .
DNS Servers . . . . . . . . . .
Primary WINS Server . . . . . .
Secondary WINS Server . . . . .
Lease Obtained. . . . . . . . .
Lease Expires . . . . . . . . .
Meaning
.
.
.
.
.
.
.
.
.
.
.
.
.
.
Verify the following:
■
The client returns a ping response.
■
The client IP configuration displayed contains the configured values. For example,
for the DHCP configuration in “Configuring the DHCP Server with a Configuration
Editor” on page 72, you can verify the following settings:
■
DNS Suffix Search List is correct.
■
IP address is within the IP address pool you configured.
■
DHCP Server is the primary IP address of the Services Router interface on
which the DHCP message exchange occurs. If you include the server-identifier
statement in your configuration, the DHCP server IP address specified in
this statement is displayed.
■
Lease Obtained and Lease Expires times are correct.
The ipconfig command also displays other DHCP client settings that can be
configured on the Services Router, including the client's hostname, default
gateways, and WINS servers.
78
■
Verifying DHCP Server Operation
Chapter 4: Configuring the Router as a DHCP Server
Related Topics
To use the J-Web interface to ping a host, see “Using the J-Web Ping Host
Tool” on page 216. For more information about the ping command, see “Pinging Hosts
from the CLI” on page 230 or the JUNOS System Basics and Services Command Reference.
Displaying DHCP Statistics
Purpose
Action
Display DHCP statistics, including lease times, packets dropped, and DHCP and
BOOTP messages received and sent, to verify normal operation.
Enter the show system services dhcp statistics command to display the DHCP statistics.
user@host> show system services dhcp statistics
Packets dropped:
Total
0
Meaning
Related Topics
Messages received:
BOOTREQUEST
DHCPDECLINE
DHCPDISCOVER
DHCPINFORM
DHCPRELEASE
DHCPREQUEST
0
0
0
0
0
78
Messages sent:
BOOTREPLY
DHCPOFFER
DHCPACK
DHCPNAK
0
0
78
0
Verify the following:
■
The default settings displayed are consistent with your DHCP server configuration.
■
The number of dropped packets and errors is small.
■
DHCPREQUEST messages have been received and DHCPACK messages have
been sent.
For complete descriptions of the show system services dhcp statistics command and
output, see the JUNOS System Basics and Services Command Reference.
Displaying DHCP Statistics
■
79
J-series™ Services Router Administration Guide
80
■
Displaying DHCP Statistics
Chapter 5
Configuring Autoinstallation
If you are setting up many J-series Services Routers, autoinstallation can help automate
the configuration process by loading configuration files onto new or existing routers
automatically over the network. You can use either the J-Web configuration editor
or CLI configuration editor to configure a Services Router for autoinstallation. The
J-Web interface does not include Quick Configuration pages for autoinstallation.
This chapter contains the following topics:
■
Autoinstallation Terms on page 81
■
Autoinstallation Overview on page 82
■
Before You Begin on page 84
■
Configuring Autoinstallation with a Configuration Editor on page 85
■
Verifying Autoinstallation on page 86
Autoinstallation Terms
Before configuring autoinstallation, become familiar with the terms defined in
Table 40 on page 81.
Table 40: Autoinstallation Terms
Term
Definition
autoinstallation
Automatic configuration of a Services Router over the network from a preexisting
configuration file that you create and store on a configuration server—typically a
Trivial File Transfer Protocol (TFTP) server. Autoinstallation takes place on a router
that is powered on without a valid configuration (boot) file or is configured specifically
for autoinstallation. Autoinstallation is useful for deploying multiple Services Routers
in a network.
default configuration
Configuration that takes place on a Services Router unable to locate a configuration
(boot) file. You can set up two default configuration files for autoinstallation on the
router: network.conf to specify IP address-to-hostname mappings for routers on the
network, or router.conf to provide just enough configuration for your subsequent
Telnet access.
hostname.conf
Host-specific configuration file for autoinstallation on a Services Router that contains
all the configuration information necessary for the router. In the filename, hostname
is replaced with the hostname you are assigning to the router.
Autoinstallation Terms
■
81
J-series™ Services Router Administration Guide
Table 40: Autoinstallation Terms (continued)
Term
Definition
host-specific configuration
Configuration that takes place on a Services Router for which you have created a
host-specific configuration file for autoinstallation called hostname.conf. The
hostname.conf file contains all the information necessary to configure the router. For
the router to use hostname.conf, it must be able to determine its own hostname from
the network.
network.conf
Default configuration file for autoinstallation, in which you specify IP addresses and
associated hostnames for Services Routers on the network.
router.conf
Default configuration file for autoinstallation with a minimum configuration sufficient
for you to telnet to the Services Router and configure it manually.
Autoinstallation Overview
Autoinstallation provides automatic configuration for a new Services Router that you
connect to the network and turn on, or for a Services Router configured for
autoinstallation. The autoinstallation process begins anytime a Services Router is
powered on and cannot locate a valid configuration file in the compact flash. Typically,
a configuration file is unavailable when a Services Router is powered on for the first
time, or if the configuration file is deleted from the compact flash. The autoinstallation
feature enables you to deploy multiple Services Routers from a central location in
the network.
For the autoinstallation process to work, you must store one or more host-specific
or default configuration files on a configuration server in the network and have a
service available—typically Dynamic Host Configuration Protocol (DHCP)—to assign
an IP address to the Services Router.
Autoinstallation takes place automatically when you connect an Ethernet or serial
port on a new router to the network and power on the router. To simplify the process,
you can explicitly enable autoinstallation on a router and specify a configuration
server, an autoinstallation interface, and a protocol for IP address acquisition.
This overview contains the following topics:
■
Supported Autoinstallation Interfaces and Protocols on page 82
■
Typical Autoinstallation Process on a New Services Router on page 83
Supported Autoinstallation Interfaces and Protocols
Before autoinstallation on a Services Router can take place, the router must acquire
an IP address. The protocol or protocols you choose for IP address acquisition
determine the router interface to connect to the network for autoinstallation. The
router detects the connected interface and requests an IP address with a protocol
appropriate for the interface. Autoinstallation is supported over an Ethernet LAN
interface or a serial LAN or WAN interface. Table 41 on page 83 lists the protocols
that the router can use on these interfaces for IP address acquisition.
82
■
Autoinstallation Overview
Chapter 5: Configuring Autoinstallation
Table 41: Interfaces and Protocols for IP Address Acqusition During Autoinstallation
Interface and Encapsulation Type
Protocol for Autoinstallation
Ethernet LAN interface with High-level Data Link Control (HDLC)
DHCP, BOOTP, or Reverse Address Resolution Protocol
(RARP)
Serial WAN interface with HDLC
Serial Line Address Resolution Protocol (SLARP)
Serial WAN interface with Frame Relay
BOOTP
If the server with the autoinstallation configuration file is not on the same LAN
segment as the new Services Router, or if a specific router is required by the network,
you must configure an intermediate router directly attached to the new router, through
which the new router can send Trivial File Transfer Protocol (TFTP), BOOTP, and
Domain Name System (DNS) requests. In this case, you specify the IP address of the
intermediate router as the location to receive TFTP requests for autoinstallation.
Typical Autoinstallation Process on a New Services Router
When a Services Router is powered on for the first time, it performs the following
autoinstallation tasks:
1.
The new Services Router sends out DHCP, BOOTP, RARP, or SLARP requests on
each connected interface simultaneously to obtain an IP address.
If a DHCP server responds, it provides the router with some or all of the following
information:
■
An IP address and subnet mask for the autoinstallation interface.
■
The location of the TFTP (typically), Hypertext Transfer Protocol (HTTP), or
FTP server on which the configuration file is stored.
■
The name of the configuration file to be requested from the TFTP server.
■
The IP address or hostname of the TFTP server.
If the DHCP server provides only the hostname, a DNS server must be
available on the network to resolve the name to an IP address.
■
The IP address of an intermediate router if the configuration server is on a
different LAN segment from the new router.
Autoinstallation Overview
■
83
J-series™ Services Router Administration Guide
2.
3.
After the new Services Router acquires an IP address, the autoinstallation process
on the router attempts to download a configuration file in the following ways:
a.
If the DHCP server specifies the host-specific configuration file (boot file)
hostname.conf, the router uses that filename in the TFTP server request. (In
the filename, hostname is the hostname of the new router.) The
autoinstallation process on the new router makes three unicast TFTP requests
for hostname.conf. If these attempts fail, the router broadcasts three requests
to any available TFTP server for the file.
b.
If the new router cannot locate hostname.conf, the autoinstallation process
unicasts or broadcasts TFTP requests for a default router configuration file
called network.conf, which contains hostname-to-IP address mapping
information, to attempt to find its hostname.
c.
If network.conf contains no hostname entry for the new Services Router, the
autoinstallation process sends out a DNS request and attempts to resolve
the new router's IP address to a hostname.
d.
If the new Services Router can determine its hostname, it sends a TFTP
request for the hostname.conf file.
e.
If the new Services Router is unable to map its IP address to a hostname, it
sends TFTP requests for the default configuration file router.conf.
After the new Services Router locates a configuration file on a TFTP server,
autoinstallation downloads the file, installs the file on the router, and commits
the configuration.
Before You Begin
To configure a network for Services Router autoinstallation, complete the following
tasks:
■
Configure a DHCP server on your network to meet your network requirements.
You can configure a Services Router to operate as a DHCP server. For more
information, see “Configuring the Router as a DHCP Server” on page 63.
■
■
Create one of the following configuration files, and store it on a TFTP server in
the network:
■
A host-specific file with the name hostname.conf for each Services Router
undergoing autoinstallation. Replace hostname with the name of a Services
Router. The hostname.conf file typically contains all the configuration
information necessary for the router with this hostname.
■
A default configuration file named router.conf with the minimum configuration
necessary to enable you to telnet into the new Services Router for further
configuration.
Physically attach the Services Router to the network using one or more of the
following interface types:
■
84
■
Before You Begin
Fast Ethernet
Chapter 5: Configuring Autoinstallation
■
Gigabit Ethernet
■
Serial with HDLC encapsulation
■
If you configure the DHCP server to provide only the TFTP server hostname, add
an IP address-to-hostname mapping entry for the TFTP server to the DNS database
file on the DNS server in the network.
■
If the new router is not on the same network segment as the DHCP server (or
other device providing IP address resolution), configure an existing router as an
intermediate to receive TFTP and DNS requests and forward them to the TFTP
server and the DNS server. You must configure the LAN or serial interface on
the intermediate router with the IP addresses of the hosts providing TFTP and
DNS service. Connect this interface to the new router.
■
If you are using hostname.conf files for autoinstallation of host-specific
configuration files, you must also complete the following tasks:
■
Configure the DHCP server to provide a hostname.conf filename to each new
Services Router. Each router uses its hostname.conf filename to request a
configuration file from the TFTP server. Copy the necessary hostname.conf
configuration files to the TFTP server.
■
Create a default configuration file named network.conf, and copy it to the
TFTP server. This file contains IP address-to-hostname mapping entries. If
the DHCP server does not send a hostname.conf filename to a new router,
the Services Router uses network.conf to resolve its hostname based on its
IP address.
Alternatively, you can add the IP address-to-hostname mapping entry for
the new Services Router to a DNS database file.
The router uses the hostname to request a hostname.conf file from the TFTP
server.
Configuring Autoinstallation with a Configuration Editor
No configuration is required on a Services Router on which you are performing
autoinstallation, because it is an automated process. However, to simplify the process
on a router, you can specify one or more interfaces, protocols, and configuration
servers to be used for autoinstallation.
To configure autoinstallation:
1.
Navigate to the top of the configuration hierarchy in either the J-Web or CLI
configuration editor.
2.
Perform the configuration tasks described in Table 42 on page 86.
3.
If you are using the J-Web interface, click Commit to view a summary of your
changes, then click OK to commit the configuration. If you are using the CLI,
commit the configuration by entering the commit command.
4.
To check the configuration, see “Verifying Autoinstallation” on page 86.
Configuring Autoinstallation with a Configuration Editor
■
85
J-series™ Services Router Administration Guide
Table 42: Configuring Autoinstallation
Task
J-Web Configuration Editor
CLI Configuration Editor
Navigate to the System level in the
configuration hierarchy.
1.
From the [edit] hierarchy level, enter
2.
Enable autoinstallation.
In the J-Web interface, select
Configuration>View and Edit>
Edit Configuration.
Next to System, click Configure or
Edit.
Select Autoinstallation, and then click
Configure.
Specify the URL address of one or more
servers from which to obtain
configuration files. For example:
■
tftp://tftpconfig.sp.com
■
ftp://user:password
@sftpconfig.sp.com
Configure one or more Ethernet or serial
interfaces to perform autoinstallation.
Configure one or two procurement
protocols for each interface. The router
uses the protocols to send a request for
an IP address for the interface.
■
BOOTP—Sends requests over all
interfaces.
■
RARP—Sends requests over
Ethernet interfaces.
■
SLARP—Sends requests over serial
interfaces.
edit system
Enter set autoinstallation
configuration-servers url
1.
Next to Configuration servers, click
Add new entry.
2.
Type the location of the
configuration server in the Url box.
3.
If a password is required for server
access, type it into the Password
box.
4.
Click OK to return to the
Autoinstallation page.
1.
Next to Interfaces, click Add new
entry.
To set BOOTP and RARP on an Ethernet
interface, enter
2.
Type the name of the interface into
the Interface name box—for
example, ge-0/0/0.
set autoinstallation interfaces ge-0/0/0
bootp rarp
3.
Click OK.
1.
Next to the interface name, click
Edit.
2.
Select one or two protocols to be
used by autoinstallation over the
interface—for example, Bootp and
Rarp.
3.
Click OK.
Verifying Autoinstallation
To verify that a Services Router is configured for autoinstallation, perform the
following task.
Verifying Autoinstallation Status
Purpose
86
■
Display the status of the autoinstallation feature on a Services Router.
Verifying Autoinstallation
Chapter 5: Configuring Autoinstallation
Action
From the CLI, enter the show system autoinstallation status command.
user@host> show system autoinstallation status
Autoinstallation status:
Master state: Active
Last committed file: None
Configuration server of last committed file: 10.25.100.1
Interface:
Name: ge-0/0/0
State: Configuration Acquisition
Acquired:
Address: 192.168.124.75
Hostname: host-ge-000
Hostname source: DNS
Configuration filename: router-ge-000.conf
Configuration filename server: 10.25.100.3
Address acquisition:
Protocol: DHCP Client
Acquired address: None
Protocol: RARP Client
Acquired address: None
Interface:
Name: ge-0/0/1
State: None
Address acquisition:
Protocol: DHCP Client
Acquired address: None
Protocol: RARP Client
Acquired address: None
Meaning
The output shows the settings configured for autoinstallation. Verify that the values
displayed are correct for the Services Router when it is deployed on the network.
Verifying Autoinstallation Status
■
87
J-series™ Services Router Administration Guide
88
■
Verifying Autoinstallation Status
Chapter 6
Automating Network Operations and
Troubleshooting
J-series Services Routers support automation of network operations and
troubleshooting tasks using commit scripts, operation scripts, and event policies.
You can use commit scripts to enforce custom configuration rules. Operation scripts
allow you to automate network management and troubleshooting tasks. You can
configure event policies that initiate self-diagnostic actions on the occurrence of
specific events.
This chapter contains the following topics. For more information about using commit
scripts and operation scripts and configuring event policies, see the JUNOS
Configuration and Diagnostic Automation Guide.
If the router is operating in a Common Criteria environment, see the Secure
Configuration Guide for Common Criteria and JUNOS-FIPS.
■
Defining and Enforcing Configuration Rules with Commit Scripts on page 89
■
Automating Network Management and Troubleshooting with Operation
Scripts on page 92
■
Running Self-Diagnostics with Event Policies on page 94
Defining and Enforcing Configuration Rules with Commit Scripts
Being able to restrict network configurations in accordance with custom configuration
rules can reduce human error and improve network uptime and reliability. Commit
scripts allow you to enforce custom configuration rules.
This section contains the following topics:
■
Commit Script Overview on page 89
■
Enabling Commit Scripts on page 90
■
Disabling Commit Scripts on page 91
Commit Script Overview
Commit scripts run each time a new candidate configuration is committed and inspect
the configuration. If a candidate configuration does not adhere to your design rules,
a commit script can instruct the Services Router to perform various actions, including
the following:
Defining and Enforcing Configuration Rules with Commit Scripts
■
89
J-series™ Services Router Administration Guide
■
Generate custom warning messages, system log messages, or error messages.
If error messages are generated, the commit operation fails and the candidate
configuration remains unchanged.
■
Change the configuration in accordance with your rules and then proceed with
the commit operation.
Consider the following examples of actions you can perform with commit scripts:
■
Run a basic sanity test. Ensure that the [edit interfaces] and [edit protocols]
hierarchies have not been accidentally deleted.
■
Check configuration consistency. Ensure that every T1 interface configured at
the [edit interfaces] hierarchy level is also configured at the [edit protocols rip]
hierarchy level.
■
Enforce network design rules. For example, suppose your network design requires
every interface on which the International Organization for Standardization (ISO)
family of protocols is enabled to also have Multiprotocol Label Switching (MPLS)
enabled. At commit time, a commit script inspects the configuration and issues
an error if this requirement is not met. This error causes the commit operation
to fail and forces the user to update the configuration to comply.
Instead of an error, the commit script can issue a warning about the configuration
problem and then automatically correct it, by changing the configuration to
enable MPLS on all interfaces. A system log message can also be generated
indicating that corrective action was taken.
The scripting language you use for writing commit scripts is Extensible Stylesheet
Language Transformations (XSLT). XSLT commit scripts are based on JUNOScript
Extensible Markup Language (XML).
Enabling Commit Scripts
To enable commit scripts:
1.
Write a commit script.
For information about writing commit scripts, see the JUNOS Configuration and
Diagnostic Automation Guide.
2.
Copy the script to the /var/db/scripts/commit directory.
Only users with superuser privileges can access and edit files in the
/var/db/scripts/commit directory.
90
■
3.
Navigate to the top of the configuration hierarchy in either the J-Web or CLI
configuration editor.
4.
Perform the configuration tasks described in Table 43 on page 91.
5.
If you are finished configuring the network, commit the configuration.
Defining and Enforcing Configuration Rules with Commit Scripts
Chapter 6: Automating Network Operations and Troubleshooting
Table 43: Enabling Commit Scripts
Task
J-Web Configuration Editor
CLI Configuration Editor
Navigate to the Commit level in the
configuration hierarchy.
1.
From the [edit] hierarchy level, enter
Enable the commit script file—for
example, commit-script.xsl.
In the J-Web interface, select
Configuration>View and Edit>Edit
Configuration.
edit system scripts commit
2.
Next to System, click Configure or
Edit.
3.
Next to Scripts, click Configure or
Edit.
4.
Next to Commit, click Configure or
Edit.
1.
Next to File, click Add new entry.
Set the script file name:
2.
In the File name box, type
commit-script.xsl.
set file commit-script.xsl
3.
Click OK.
Disabling Commit Scripts
If you do not want a commit script to run, you can disable it by deleting or
deactivating it in the configuration. Deleting a commit script permanently removes
it from the configuration. To run the script later, you must reenable the script as
described in “Enabling Commit Scripts” on page 90. Deactivating a commit script
disables the script until you activate it later.
To delete a commit script:
1.
From configuration mode in the CLI, enter the following command:
user@host# delete system scripts commit filename.xsl
2.
Commit the configuration:
user@host# commit
commit complete
To deactivate a commit script:
1.
From configuration mode in the CLI, enter the following command:
user@host# deactivate system scripts commit filename.xsl
2.
Commit the configuration:
user@host# commit
Defining and Enforcing Configuration Rules with Commit Scripts
■
91
J-series™ Services Router Administration Guide
commit complete
NOTE: You can later reactivate the commit script using the activate system scripts
commit filename.xsl command.
Automating Network Management and Troubleshooting with Operation Scripts
Operation scripts are scripts that you write to automate network management and
troubleshooting tasks. They can perform any function available through JUNOScript
remote procedure calls (RPCs).
This section contains the following topics:
■
Operation Script Overview on page 92
■
Enabling Operation Scripts on page 93
■
Executing Operation Scripts on page 93
■
Disabling Operation Scripts on page 94
Operation Script Overview
You can execute operation scripts from the JUNOS CLI or from within an event policy.
For information about event policies, see “Running Self-Diagnostics with Event
Policies” on page 94.
Operation scripts allow you to perform various actions, including the following:
■
Automatically diagnose and fix problems in your network by building and running
an operational mode command, receiving the command output, inspecting the
output, and determining the next appropriate action. This process can be repeated
until the source of the problem is determined and reported to the CLI.
■
Monitor the overall status of the router by creating a general operation script
that periodically checks network warning parameters, such as high CPU usage.
The general operation script can be overridden by user-defined scripts.
■
Customize the output of CLI operational mode commands using printf statements.
■
If there is a known problem in the JUNOS software, an operation script can
ensure your router is configured to avoid or work around the problem.
■
Change your router's configuration in response to a problem.
The scripting language you use for writing operation scripts is Extensible Stylesheet
Language Transformations (XSLT). XSLT operation scripts are based on JUNOScript
Extensible Markup Language (XML).
92
■
Automating Network Management and Troubleshooting with Operation Scripts
Chapter 6: Automating Network Operations and Troubleshooting
Enabling Operation Scripts
To enable operation scripts:
1.
Write an operation script.
For information about writing operation scripts, see the JUNOS Configuration and
Diagnostic Automation Guide.
2.
Copy the script to the /var/db/scripts/op directory.
Only users with superuser privileges can access and edit files in the
/var/db/scripts/op directory.
3.
Navigate to the top of the configuration hierarchy in either the J-Web or CLI
configuration editor.
4.
Perform the configuration tasks described in Table 44 on page 93.
5.
If you are finished configuring the network, commit the configuration.
Table 44: Enabling Operation Scripts
Task
J-Web Configuration Editor
CLI Configuration Editor
Navigate to the Op level in the
configuration hierarchy.
1.
From the [edit] hierarchy level, enter
Enable the operation script file—for
example, op-script.xsl.
In the J-Web interface, select
Configuration>View and Edit>Edit
Configuration.
2.
Next to System, click Configure or
Edit.
3.
Next to Scripts, click Configure or
Edit.
4.
Next to Op, click Configure or Edit.
1.
Next to File, click Add new entry.
2.
In the Name box, type op-script.xsl.
3.
Click OK.
edit system scripts op
Set the script file name:
set file op-script.xsl
Executing Operation Scripts
You can execute the enabled operation scripts from the CLI or from within an event
policy. For information about event policy, see “Running Self-Diagnostics with Event
Policies” on page 94.
This section describes how you can execute operation scripts from the command
line.
To execute an operation script from the CLI:
1.
Enter configuration mode in the CLI.
2.
Execute the script with the following command:
Automating Network Management and Troubleshooting with Operation Scripts
■
93
J-series™ Services Router Administration Guide
user@host# op filename.xsl
Disabling Operation Scripts
If you do not want an operation script to run, you can disable it by deleting or
deactivating it in the configuration. Deleting an operation script permanently removes
it from the configuration. To run the script later, you must reenable the script as
described in “Enabling Operation Scripts” on page 93. Deactivating an operation
script disables the script until you activate it later.
To delete an operation script, do the following:
1.
From configuration mode in the CLI, enter the following command:
user@host# delete system scripts op filename.xsl
2.
Commit the configuration:
user@host# commit
commit complete
To deactivate an operation script:
1.
From configuration mode in the CLI, enter the following command:
user@host# deactivate system scripts op filename.xsl
2.
Commit the configuration:
user@host# commit
commit complete
NOTE: You can later reactivate the operation script using the activate system scripts
op filename.xsl command.
Running Self-Diagnostics with Event Policies
To diagnose a fault or error condition on a routing platform, you need relevant
information about the state of the platform. You can derive state information from
event notifications. Event notifications are system log messages and Simple Network
Management Protocol (SNMP) traps.
Timely diagnosis and intervention can correct error conditions and keep the routing
platform in operation. Event policies allow you to automatically initiate self-diagnostic
94
■
Running Self-Diagnostics with Event Policies
Chapter 6: Automating Network Operations and Troubleshooting
actions when specific events occur. These actions can either help you diagnose a
fault or take corrective action.
This section contains the following topics:
■
Event Policy Overview on page 95
■
Configuring Event Policies on page 95
Event Policy Overview
In response to events, event policies can execute the following actions:
■
Ignore the event—Do not generate a system log message for this event and do
not process any further policy instructions for this event.
■
Raise a trap—Initiate an SNMP trap to notify SNMP trap-based applications when
the event occurs.
■
Upload a file—Upload a file to a specified destination. You can specify a transfer
delay, so that, on receipt of an event, the upload process begins after the
configured transfer delay. For example, a transfer delay can ensure that a core
file has been completely generated before being uploaded.
■
Execute CLI operational mode commands—Execute commands when an event
occurs. The output of these commands is stored in a file, which is then uploaded
to a specified URL.
■
Execute operation scripts—Execute operation scripts when an event occurs. The
output of the operation scripts is stored in a file, which is then uploaded to a
specified URL. For information about operation scripts, see “Automating Network
Management and Troubleshooting with Operation Scripts” on page 92.
To view a list of the events that can be referenced in an event policy, issue the help
syslog ? command:
user@host> help syslog ?
Possible completions:
<syslog-tag>
System log tag
ACCT_ACCOUNTING_FERROR Error occurred during file processing
ACCT_ACCOUNTING_FOPEN_ERROR Open operation failed on file
ACCT_ACCOUNTING_SMALL_FILE_SIZE Maximum file size is smaller than record size
...
For information about these events, see the JUNOS System Log Messages Reference.
Configuring Event Policies
To configure event policies:
1.
Navigate to the top of the configuration hierarchy in either the J-Web or CLI
configuration editor.
2.
Perform the configuration tasks described in Table 45 on page 96.
3.
If you are finished configuring the network, commit the configuration.
Running Self-Diagnostics with Event Policies
■
95
J-series™ Services Router Administration Guide
Table 45: Configuring Event Policies
Task
J-Web Configuration Editor
CLI Configuration Editor
Configuring Destination for Uploading Files for Analysis
Navigate to the Destinations level in
the configuration hierarchy.
Enter the destination name—for
example, bsd2.
1.
In the J-Web interface, select
Configuration>View and Edit>Edit
Configuration.
2.
Next to Event options, click
Configure or Edit.
3.
Next to Destinations, click Add new
entry.
In the Destination name box, type bsd2.
You can reference the destination in
an event policy.
Configure the archive site—for
example,
ftp://ftp.robot.net/event_analyze—where
you want the output of commands
executed by the event policy to be
uploaded in a file for analysis, and
the password—for example,
eventadmin—for accessing the archive
site.
1.
Next to Archive sites, click Add new
entry.
2.
In the Url box, type
From the [edit] hierarchy level, enter
edit event-options destinations
Set the destination name, the archive site
location, and the password for accessing
the archive site:
set bsd2 archive-sites
ftp://ftp.robot.net/event_analyze password
eventadmin
ftp://ftp.robot.net/event_analyze.
3.
In the Password box, type
eventadmin.
4.
Click OK.
1.
On the main Configuration page next
to Event options, click Configure or
Edit.
NOTE: You can specify the archive
site as a Hypertext Transfer Protocol
(HTTP) URL, FTP URL, or secure copy
(SCP)-style remote file specification.
URLs of the type file:// are also
supported.
NOTE: When you specify the archive
site, do not add a slash (/) to the end
of the URL. For example, do not
specify the archive site as
ftp://ftp.robot.net/event_analyze/.
Configuring Event Policy
Navigate to the Policy level in the
configuration hierarchy, and enter
the policy name—for example,
event1.
Configure the event name—for
example, SNMP_TRAP_LINK_DOWN.
The SNMP_TRAP_LINK_DOWN event
occurs when an interface that is
monitored by SNMP becomes
unavailable.
96
■
2.
Next to Policy, click Add new entry.
3.
In the Policy name box, type event1.
1.
Next to Events, click Add new entry.
2.
In the Event box, type
SNMP_TRAP_LINK_DOWN.
3.
Click OK.
Running Self-Diagnostics with Event Policies
From the [edit] hierarchy level, enter
edit event-options policy event1
Set the event name:
set events SNMP_TRAP_LINK_DOWN
Chapter 6: Automating Network Operations and Troubleshooting
Table 45: Configuring Event Policies (continued)
Task
J-Web Configuration Editor
CLI Configuration Editor
Flag the event to initiate an SNMP
trap when it generates a system log
message.
1.
Next to Then, click Configure.
Enter
2.
Select the Raise trap checkbox.
3.
Click OK.
set then
set raise-trap
Define the action to be taken when
the configured event occurs.
For example, configure the Services
Router to do the following when the
SNMP_TRAP_LINK_DOWN event occurs
for the t1–3/0/0 interface:
1.
2.
Execute the show interfaces
t1–3/0/0 and show configuration
interfaces t1–3/0/0 commands.
Upload the output of the show
commands in a text file named
config.txt to a server named
bsd2.
NOTE: Do not include spaces, the
slash, or the percent sign (%) in the
filename.
1.
Next to Attributes match, click Add
new entry.
2.
In the Condition list, select matches.
3.
In the From event attribute box, type
SNMP_TRAP_LINK_DOWN.interface-name.
4.
In the To event attribute value box,
type t1–3/0/0.
5.
Click OK.
6.
Next to Then, click Configure.
7.
Next to Execute commands, click
Configure.
8.
In the Destination box, type bsd2.
9.
In the Output filename box, type
config.txt.
1.
set attributes-match
SNMP_TRAP_LINK_DOWN.interface-name
equals t1–3/0/0
2.
Enter
edit then execute-commands
3.
Set the commands to be executed
when the configured event occurs:
set commands show interfaces
t1–3/0/0
set commands show configuration
interfaces t1–3/0/0
10. From the Output format list, select
text.
11. Next to Commands, click Add new
Set the condition to execute the event
policy only when the
SNMP_TRAP_LINK_DOWN event occurs
for the t1–3/0/0 interface:
4.
entry.
12. In the Command box, type show
Set the name and format of the file
in which the output of the executed
commands is to be uploaded to a
destination server:
interfaces t1–3/0/0.
set output-filename config.txt
output-format text
13. Click OK.
14. Next to Commands, click Add new
entry.
15. In the Command box, type show
configuration interfaces t1–3/0/0.
5.
Set the name of the server to which
the file containing the command
output is to be uploaded:
set destination bsd2
16. Click OK.
Running Self-Diagnostics with Event Policies
■
97
J-series™ Services Router Administration Guide
98
■
Running Self-Diagnostics with Event Policies
Part 2
Monitoring a Services Router
■
Monitoring the Router and Routing Operations on page 101
■
Monitoring Events and Managing System Log Files on page 155
■
Configuring and Monitoring Alarms on page 165
Monitoring a Services Router
■
99
J-series™ Services Router Administration Guide
100
■
Monitoring a Services Router
Chapter 7
Monitoring the Router and Routing
Operations
J-series Services Routers support a suite of J-Web tools and CLI operational mode
commands for monitoring system health and performance. Monitoring tools and
commands display the current state of the router.
This chapter contains the following topics. For complete descriptions of CLI operational
mode commands, see the JUNOS System Basics and Services Command Reference, the
JUNOS Interfaces Command Reference, and the JUNOS Routing Protocols and Policies
Command Reference.
■
Monitoring Terms on page 101
■
Monitoring Overview on page 101
■
Before You Begin on page 106
■
Using the Monitoring Tools on page 107
Monitoring Terms
Before monitoring J-series Services Routers, become familiar with the terms defined
in Table 46 on page 101.
Table 46: J-series Monitoring Terms
Term
Definition
autonomous system (AS)
Network of nodes that route packets based on a shared map of the network topology stored in
their local databases.
Internet Control Message
Protocol (ICMP)
TCP/IP protocol used to send error and information messages.
routing table
Database of routes learned from one or more protocols.
Monitoring Overview
Use the J-Web Monitor and Manage options to monitor a Services Router. J-Web
results are displayed in the browser.
Monitoring Terms
■
101
J-series™ Services Router Administration Guide
You can also monitor the router with CLI operational mode commands. CLI command
output appears on the screen of your console or management device, or you can
filter the output to a file.
This section contains the following topics:
■
Monitoring Tools Overview on page 102
■
Filtering Command Output on page 105
Monitoring Tools Overview
J-Web monitoring tools consist of the options that appear when you select Monitor
in the task bar. The Monitor options display diagnostic information about the Services
Router.
Alternatively, you can enter show commands from the CLI to display the same
information, and often greater detail. CLI show commands display the current
configuration and information about interfaces, routing protocols, routing tables,
routing policy filters, and the chassis. Use the CLI clear command to clear statistics
and protocol database information.
Table 47 on page 102 explains what each J-Web Monitor option displays and lists the
corresponding CLI show commands.
Table 47: J-Web Monitor Options and Corresponding CLI show Commands
Monitor Option
Function
Corresponding CLI Commands
System
Displays Services Router system properties, such as the system
identification and uptime, users, and resource usage.
■
show system uptime
■
show system users
■
show system storage
■
show system processes
■
show chassis alarms
■
show chassis environment
■
show chassis fpc
■
show chassis hardware
■
show interfaces terse
■
show interfaces detail
■
show interfaces interface-name
For details, see “Monitoring System Properties” on page 107.
Chassis
Displays active chassis alarms, environment and hardware
information, and status of Physical Interface Modules (PIMs).
For details, see “Monitoring the Chassis” on page 111.
Interfaces
Hierarchically displays all Services Router physical and logical
interfaces, including state and configuration information.
For details, see “Monitoring the Interfaces” on page 113.
102
■
Monitoring Overview
Chapter 7: Monitoring the Router and Routing Operations
Table 47: J-Web Monitor Options and Corresponding CLI show Commands (continued)
Monitor Option
Function
Corresponding CLI Commands
Routing
Displays routing information through the following options:
■
■
Route Information—Information about the routes in a routing
table, including destination, protocol, state, and parameter
information. You can narrow the list of routes displayed by
specifying search criteria.
■
■
show route terse
■
show route detail
OSPF information
OSPF Information—Summary of OSPF neighbors, interfaces,
and statistics.
■
show ospf neighbors
■
show ospf interfaces
■
BGP Information—Summary of BGP routing and neighbor
information.
■
show ospf statistics
■
RIP Information—Summary of RIP neighbors and statistics.
■
DLSw Information—Summary of DLSw circuits and peers.
■
For details, see “Monitoring Routing Information” on page 115.
■
■
■
Class of Service
(CoS)
Route information
Displays information about the performance of class of service on
a router through the following options:
■
Interfaces—Displays the physical and logical interfaces in the
system and provides details about the CoS components
assigned to these interfaces.
■
■
■
■
■
Classifiers—Displays the forwarding classes and loss priorities
that incoming packets are assigned to based on the packet's
CoS values.
CoS Value Aliases—Displays the CoS value aliases that the
system is using to represent Differentiated Services code point
(DSCP), DSCP IPv6, MPLS experimental (EXP), and IPv4
precedence bits.
RED Drop Profiles—Displays detailed information about the
drop profiles used by the system. Also, displays a graph of
the random early detection (RED) curve that the system uses
to determine the queue fullness and drop probability.
■
Forwarding Classes—Displays the assignment of forwarding
classes to queue numbers.
■
Rewrite Rules—Displays packet CoS value rewrite rules based
on the forwarding classes and loss priorities.
■
Scheduler Maps—Displays the assignment of forwarding
classes to schedulers. Schedulers include transmit rate, rate
limit, and buffer size.
BGP information
■
show bgp summary
■
show bgp neighbor
RIP information
■
show rip statistics
■
show rip neighbors
DLSw information
■
show dlsw capabilities
■
show dlsw circuits
■
show dlsw peers
■
show dlsw reachability
Interfaces—show class-of-service
interface
Classifiers—show class-of-service
classifier
■
CoS value aliases—show
class-of-service code-point-aliases
■
RED drop profiles—show
class-of-service drop-profile
■
Forwarding classes—show
class-of-service forwarding-class
■
Rewrite rules—show
class-of-service rewrite-rule
■
Scheduler maps—show
class-of-service scheduler-map
For details, see “Monitoring Class-of-Service
Performance” on page 123.
Monitoring Overview
■
103
J-series™ Services Router Administration Guide
Table 47: J-Web Monitor Options and Corresponding CLI show Commands (continued)
Monitor Option
Function
Corresponding CLI Commands
MPLS
Displays information about MPLS label-switched paths (LSPs) and
virtual private networks (VPNs) through the following options:
■
Interfaces—show mpls interface
■
LSP information—show mpls lsp
Interfaces—Information about the interfaces on which MPLS
is enabled, including operational state and any administrative
groups applied to an interface.
■
LSP Statistics—show mpls lsp
■
■
LSP Information—Information about LSP sessions currently
active on the Services Router, including inbound (ingress) and
outbound (egress) addresses, LSP state, and LSP name.
■
LSP Statistics—Statistics for LSP sessions currently active on
the Services Router, including the total number of packets
and bytes forwarded through an LSP.
■
RSVP Sessions—Information about RSVP-signaled LSP
sessions currently active on the Services Router, including
inbound (ingress) and outbound (egress) addresses, LSP state,
and LSP name.
■
RSVP Interfaces—Information about the interfaces on which
RSVP is enabled, including the interface name, total
bandwidth through the interface, and total current reserved
and reservable (available) bandwidth on the interface.
statistics
■
RSVP Sessions—show rsvp session
■
RSVP Interfaces—show rsvp
interface
For details, see “Monitoring MPLS Traffic Engineering
Information” on page 130.
Service Sets
Firewall
Displays information about configured service sets.
■
show services service-sets
summary
For details, see “Monitoring Service Sets” on page 135.
■
show services service-sets
memory-usage
■
Stateful firewall information
Displays firewall and intrusion detection service (IDS) information
through the following options:
■
Stateful Firewall—Displays the stateful firewall configuration.
■
IDS Information—Displays information about the configured
IDS.
For details, see “Monitoring Firewalls” on page 136.
IPSec
Displays configured IPSec tunnels and statistics, and IKE security
associations.
■
Displays configured NAT pools.
For details, see “Monitoring NAT Pools” on page 142.
104
■
Monitoring Overview
show services stateful-firewall
conversations
■
show services stateful-firewall
flows
IDS information
■
show services ids
destination-table
■
show services ids source-table
■
show services ids pair-table
■
show services ipsec-vpn ipsec
statistics
■
show services ipsec-vpn ipsec
security-associations
■
show services ipsec-vpn ike
security-associations
■
show services nat pool
For details, see “Monitoring IPSec Tunnels” on page 140.
NAT
■
Chapter 7: Monitoring the Router and Routing Operations
Table 47: J-Web Monitor Options and Corresponding CLI show Commands (continued)
Monitor Option
Function
Corresponding CLI Commands
DHCP
Displays DHCP dynamic and static leases, conflicts, pools, and
statistics.
■
show system services dhcp binding
■
show system services dhcp conflict
■
show system services dhcp pool
■
show system services dhcp
statistics
For details, see “Monitoring DHCP” on page 143.
RPM
Displays probe results for all RPM probes configured on the
Services Router, including the round–trip times, jitter, and loss
percentage of probes sent. Additionally, the RPM monitoring page
displays a graph that plots the probe results as a function of time.
show services rpm probe-results
For details, see “Monitoring RPM Probes” on page 145.
PPPoE
Displays the following PPPoE information:
■
■
■
PPPoE Interfaces—Session-specific information about the
interfaces on which PPPoE is enabled.
PPPoE Statistics—Statistics for PPPoE sessions currently
active.
■
PPPoE interfaces—show pppoe
interfaces
■
PPPoE statistics—show pppoe
statistics
■
PPPoE version—show pppoe
version
PPPoE Version—Information about the PPPoE protocol
currently configured on the router.
For details, see “Monitoring PPPoE” on page 148.
Media Gateway
Displays the following TGM550 Media Gateway information:
■
Dynamic Call Admission Control Information—Displays
maximum bandwidth available for voice traffic and the
dynamic call admission control (CAC) properties configured
on the router WAN interfaces.
■
Telephony Gateway Module Information—Displays
information about TGM550 connectivity and digital signal
processor (DSP) capacity.
■
Telephony Interface Module Information—Displays the online
and offline status of telephony interface modules (TIMs)
installed in a J-series router.
■
Dynamic call admission control
information—show tgm
dynamic-call-admission-control
■
Telephony Gateway Module
information—show tgm fpc
slot-number
media-gateway-controller and show
tgm fpc slot-number dsp-capacity
■
Telephony Gateway Module
status—show tgm
telephony-interface-module status
For details, see “Monitoring the TGM550 Media Gateway
(VoIP)” on page 151.
Filtering Command Output
For operational commands that display output, such as the show commands, you
can redirect the output into a filter or a file. When you display help about these
commands, one of the options listed is |, called a pipe, which allows you to filter the
command output.
For example, if you enter the show configuration command, the complete Services
Router configuration is displayed on the screen. To limit the display to only those
Monitoring Overview
■
105
J-series™ Services Router Administration Guide
lines of the configuration that contain address, issue the show configuration command
using a pipe into the match filter:
user@host> show configuration | match address
address-range low 192.168.3.2 high 192.168.3.254;
address-range low 192.168.71.71 high 192.168.71.254;
address 192.168.71.70/21;
address 192.168.2.1/24;
address 127.0.0.1/32;
For a complete list of the filters, type a command, followed by the pipe, followed by
a question mark (?):
user@host> show configuration | ?
Possible completions:
compare
Compare configuration changes with prior version
count
Count occurrences
display
Show additional kinds of information
except
Show only text that does not match a pattern
find
Search for first occurrence of pattern
hold
Hold text without exiting the --More-- prompt
last
Display end of output only
match
Show only text that matches a pattern
no-more
Don't paginate output
request
Make system-level requests
resolve
Resolve IP addresses
save
Save output text to file
trim
Trim specified number of columns from start of line
You can specify complex expressions as an option for the match and except filters.
For more information about command output filtering and creating match
expressions, see the JUNOS CLI User Guide.
NOTE: To filter the output of configuration mode commands, use the filter commands
provided for the operational mode commands. In configuration mode, an additional
filter is supported. See the J-series Services Router Basic LAN and WAN Access
Configuration Guide.
Before You Begin
To use the J-Web interface and CLI operational tools, you must have the appropriate
access privileges. For more information about configuring access privilege levels,
see “Adding New Users” on page 11 and the JUNOS System Basics Configuration
Guide.
106
■
Before You Begin
Chapter 7: Monitoring the Router and Routing Operations
Using the Monitoring Tools
This section describes the monitoring tools in detail. It contains the following topics:
■
Monitoring System Properties on page 107
■
Monitoring the Chassis on page 111
■
Monitoring the Interfaces on page 113
■
Monitoring Routing Information on page 115
■
Monitoring Class-of-Service Performance on page 123
■
Monitoring MPLS Traffic Engineering Information on page 130
■
Monitoring Service Sets on page 135
■
Monitoring Firewalls on page 136
■
Monitoring IPSec Tunnels on page 140
■
Monitoring NAT Pools on page 142
■
Monitoring DHCP on page 143
■
Monitoring RPM Probes on page 145
■
Monitoring PPP on page 147
■
Monitoring PPPoE on page 148
■
Monitoring the TGM550 Media Gateway (VoIP) on page 151
Monitoring System Properties
The system properties include everything from the name and IP address of the
Services Router to the resource usage on the Routing Engine. To view these system
properties, select Monitor>System in the J-Web interface, or enter the following CLI
show commands:
■
show system uptime
■
show system users
■
show system storage
Table 48 on page 107 summarizes key output fields in system properties displays.
Table 48: Summary of Key System Properties Output Fields
Field
Values
Additional Information
System Identification
Serial
Number
Serial number for the J-series Services Router.
JUNOS
Software
Version
Version of JUNOS software active on the Services
Router, including whether the software is for domestic
or export use.
Export software is for use outside of the U.S. and
Canada.
Using the Monitoring Tools
■
107
J-series™ Services Router Administration Guide
Table 48: Summary of Key System Properties Output Fields (continued)
Field
Values
Router
Hostname
Hostname of the Services Router, as defined with the
set system hostname command.
Router IP
Address
IP address, in dotted decimal notation, of Ethernet
management port 0 (ge-0/0/0, for example), as
defined with the set interfaces ge-0/0/0 command.
Loopback
Addresses
IP address, in dotted decimal notation, of the loopback
address, as defined with the set interfaces lo0
command.
Domain
Name
Servers
IP addresses, in dotted decimal notation, of the
domain name servers, as defined with the set system
name-server command.
Time Zone
Time zone of the Services Router, as defined with the
set system time-zone command.
Additional Information
System Time
Current
Time
Current system time, in Coordinated Universal Time
(UTC).
System
Booted
Time
Date and time when the router was last booted and
how long it has been running.
Protocol
Started
Time
Date and time when the routing protocols were last
started and how long they have been running.
Last
Configured
Time
Date and time when a configuration was last
committed. This field also shows the name of the user
who issued the last commit command, through either
the J-Web interface or the CLI.
Users
User
Username of any user logged in to the Services Router.
TTY
Terminal through which the user is logged in.
From
System from which the user has logged in. A hyphen
indicates that the user is logged in through the console.
Login Time
Time when the user logged in.
Idle Time
How long the user has been idle.
Command
Processes that the user is running.
Memory Usage
108
■
Using the Monitoring Tools
This is the LOGIN@ field in show system users command
output.
This is the WHAT field in show system users command
output.
Chapter 7: Monitoring the Router and Routing Operations
Table 48: Summary of Key System Properties Output Fields (continued)
Field
Values
Total
Memory
Available
Total RAM available on the Services Router.
Total
Memory
Used
Total RAM currently being consumed by processes
actively running on the Services Router, displayed
both as a quantity of memory and as a percentage of
the total RAM on the router.
Process ID
Process identifier.
Process
Owner
Name of the process owner.
Process
Name
Command that is currently running.
Additional Information
This is the PID field in show system processes command
output.
Individual processes on the Services Router are listed
here. Because each process within JUNOS operates in
a protected memory environment, you can diagnose
whether a particular process is consuming abnormally
high amounts of resources.
If a software process is using too much CPU or memory,
you can restart the process by entering the restart
command from the CLI.
CPU Usage
Percentage of the CPU that is being used by the
process.
Memory
Usage
Percentage of the installed RAM that is being used by
the process.
CPU Usage
Total CPU
Used
Sum of CPU usages by all processes, expressed as a
percentage of total CPU available.
Process ID
Process identifier.
Process
Owner
Name of the process' owner.
Process
Name
Command that is currently running.
This is the PID field in show system processes command
output.
Individual processes on the Services Router are listed
here. Because each process within JUNOS operates in
a protected memory environment, you can diagnose
whether a particular process is consuming an abnormal
amount of resources.
If a software process is using too much CPU or memory,
you can restart the process by entering the restart
command from the CLI.
CPU Usage
Percentage of the CPU that is being used by the
process.
Using the Monitoring Tools
■
109
J-series™ Services Router Administration Guide
Table 48: Summary of Key System Properties Output Fields (continued)
Field
Values
Additional Information
Memory
Usage
Percentage of the installed RAM that is being used by
the process.
System Storage
Total Flash
Size
Total size, in megabytes, of the primary flash device.
Usable
Flash Size
Total usable memory, in megabytes, of the primary
flash device.
Flash Used
Total flash memory used, in megabytes and as a
percentage of the total usable flash size, of the primary
flash device.
Log Files
Total size, in kilobytes, of the log files on the Services
Router.
This is the sum of file sizes in the /var/log directory.
Temporary
Files
Total size, in kilobytes, of the temporary files on the
Services Router.
This is the sum of the file sizes in the /var/tmp directory.
Crash
(Core) Files
Total size, in kilobytes, of the core files on the Services
Router.
This is the sum of the file sizes in the /var/crash
directory.
Database
Files
Total size, in kilobytes, of the configuration database
files on the Services Router.
This is the sum of the file sizes in the /var/db directory.
The total usable flash memory is the total memory
minus the size of the JUNOS image installed on the
Services Router.
Monitoring System Process Information
To view the software processes running on the router, select
Monitor>System>Process Information in the J-Web interface, or enter the CLI
show system processes commands.
Table 49 on page 110 summarizes the output fields in the system process information
display.
Table 49: Summary of System Process Information Output Fields
Field
Values
Process ID
Identifier of the process.
Effective
User
Owner of the process.
Command
Command that is currently running.
Terminal
Terminal that is currently running.
Status
Current status of the process.
110
■
Using the Monitoring Tools
Additional Information
Chapter 7: Monitoring the Router and Routing Operations
Table 49: Summary of System Process Information Output Fields (continued)
Field
Values
Additional Information
Sleep state
Sleep state of the process.
Start time
Time of day when the process started.
Monitoring the Chassis
The chassis properties include the status of active chassis alarms on the Services
Router, environment measurements, a summary of the field-replaceable units (FRUs),
and the status of Physical Interface Modules (PIMs) on the router. To view these
chassis properties, select Monitor>Chassis in the J-Web interface, or enter the
following CLI show commands:
■
show chassis alarms
■
show chassis environment
■
show chassis fpc
■
show chassis hardware
CAUTION: Do not install a combination of PIMs in a single chassis that exceeds the
maximum power and heat capacity of the chassis. If J-series power management is
enabled, PIMs that exceed the maximum power and heat limits remain offline when
the chassis is powered on. To check PIM power and heat status, use the show chassis
fpc and show chassis power-ratings commands. For more information, see the Getting
Started Guide for your router.
Table 50 on page 111 summarizes key output fields in chassis displays.
Table 50: Summary of Key Chassis Output Fields
Field
Values
Additional Information
Alarm Summary
Alarm Time
Date and time the alarm was first recorded.
Using the Monitoring Tools
■
111
J-series™ Services Router Administration Guide
Table 50: Summary of Key Chassis Output Fields (continued)
Field
Values
Additional Information
Alarm Class
Severity class for this alarm: Minor or Major.
JUNOS has system-defined alarms and configurable
alarms. System-defined alarms include FRU detection
alarms (power supplies removed, for instance) and
environmental alarms. The values for these alarms are
defined within JUNOS.
Configurable alarms are set in either of the following
ways:
■
In the J-Web configuration editor, on the
Chassis>Alarm>interface-type page
■
In the CLI configuration editor, with the alarm
statement at the [edit chassis] level of the
configuration hierarchy
For details, see “Configuring and Monitoring
Alarms” on page 165.
Alarm
Description
A brief synopsis of the alarm.
Environment Information
Name
Chassis component. For J-series Services Routers,
the chassis components are the Routing Engine and
the fans.
Gauge
Status
Status of the temperature gauge on the specified
hardware component.
Temperature
Temperature of the air flowing past the hardware
component.
Fan Status
Status of the fans that are regulated by the JUNOS
software:
Fan Speed
■
OK
■
Testing (when the router is powered on)
■
Failed
■
Absent
Speed of the fans: normal or high speed.
Speed is adjusted automatically according to the current
temperature.
Hardware Summary
Name
Chassis component. For J-series Services Routers,
the chassis components are the Routing Engine, the
Physical Interface Module (PIM) slot number
(identified in the display as an FPC), and the PIM
number (identified in the display as a PIC).
On J-series Services Routers, an FPC and a PIM are the
same physical unit. The PIM number is always 0.
Version
Revision level of the specified hardware component.
Supply the version number when reporting any hardware
problems to customer support.
112
■
Using the Monitoring Tools
Chapter 7: Monitoring the Router and Routing Operations
Table 50: Summary of Key Chassis Output Fields (continued)
Field
Values
Additional Information
Part
Number
Part number of the chassis component.
Serial
Number
Serial number of the chassis component. The serial
number of the backplane is also the serial number
of the router chassis.
Use this serial number when you need to contact
customer support about the router chassis.
Description
Brief description of the hardware item.
For J-series PIMs, the description lists the number and
type of the ports on the PIM—identified in the display
as a PIC.
FPC Summary
Slot
FPC or PIM slot number.
State
State of the slot:
■
Dead—Held in reset because of errors.
■
Diag—Slot is being ignored while the FPC or PIM
On J-series Services Routers, an FPC and a PIM are the
same physical unit.
is running diagnostics.
■
Dormant—Held in reset.
■
Empty—No FPC or PIM is present.
■
Online—FPC or PIM is online and running.
■
Probed—Probe is complete. The FPC is awaiting
restart of the Packet Forwarding Engine (PFE).
■
Probe-wait—The FPC is waiting to be probed.
Temp (C)
Temperature of the air passing by the FPC, in degrees
Celsius.
CPU
Utilization
(%)
Total—Total percentage of CPU being used by the
J-series Services Routers do not monitor and report the
temperature of PIMs.
FPC or PIM processor.
Interrupt—Of the total CPU being used by the FPC or
PIM processor, the percentage being used for
interrupts.
Memory
DRAM (MB)
Total DRAM, in megabytes, available to the FPC or
PIM processor.
Utilization
(%)
Heap—Percentage of heap space (dynamic memory)
being used by the FPC or PIM processor.
If the heap space utilization exceeds 80 percent, a
memory leak might be occurring.
Buffer—Percentage of buffer space being used by the
FPC or PIM processor for buffering internal messages.
Monitoring the Interfaces
The interface information is divided into multiple parts. To view general interface
information such as available interfaces, operation states of the interfaces, and
descriptions of the configured interfaces, select Monitor>Interfaces in the J-Web
Using the Monitoring Tools
■
113
J-series™ Services Router Administration Guide
interface. To view interface-specific properties such as administrative state or traffic
statistics in the J-Web interface, select the interface name on the Interfaces page.
Alternatively, enter the following CLI show commands:
■
show interfaces terse
■
show interfaces detail
■
show interfaces interface-name
Table 51 on page 114 summarizes key output fields in interfaces displays.
Table 51: Summary of Key Interfaces Output Fields
Field
Values
Additional Information
Interface Summary
Interface
Name
Name of interface.
(See the interface naming conventions in the J-series
Services Router Basic LAN and WAN Access
Configuration Guide.)
Click an interface name to see more information about
the interface.
Channelized interfaces appear as two interfaces, which
can both be monitored. For example:
■
If ce1-3/0/0 is configured as a clear channel, you
can monitor ce1-3/0/0 and e1-3/0/0.
■
If ct1-3/0/1 is channelized, you can monitor
ct1-3/0/1 and ds-3/0/1:1.
Oper State
Link state of the interface: Up or Down.
The operational state is the physical state of the
interface. If the interface is physically operational, even
if it is not configured, the operational state is Up. An
operational state of Down indicates a problem with the
physical interface.
Admin
State
Whether the interface is enabled up (Up) or disabled
(Down).
Interfaces are enabled by default. To disable an
interface:
Description
■
In the J-Web configuration editor, select the
Disable check box on the
Interfaces>interfaces-name page.
■
In the CLI configuration editor, add the disable
statement at the [edit interfaces interfaces-name]
level of the configuration hierarchy
Configured description for the interface.
Interface: interface-name
State
114
Link state of the interface: Up or Down.
■
Using the Monitoring Tools
The operational state is the physical state of the
interface. If the interface is physically operational, even
if it is not configured, the operational state is Up. An
operational state of Down indicates a problem with the
physical interface.
Chapter 7: Monitoring the Router and Routing Operations
Table 51: Summary of Key Interfaces Output Fields (continued)
Field
Values
Additional Information
Admin
State
Whether the interface is enabled up (Up) or disabled
(Down).
Interfaces are enabled by default. To disable an
interface:
MTU
Maximum transmission unit (MTU) size on the physical
interface.
Speed
Speed at which the interface is running.
Current
Address
Configured media access control (MAC) address.
Hardware
Address
Hardware MAC address.
Last
Flapped
Date, time, and how long ago the interface changed
state from Down to Up.
Active
Alarms
List of any active alarms on the interface.
Traffic
Statistics
Number of packets and bytes received and transmitted
on the physical interface.
Input Errors
Input errors on the interface. (See the following rows
of this table for specific error types.)
Drops
Number of packets dropped by the output queue.
Framing
errors
Sum of ATM Adaptation Layer (AAL5) packets that
have frame check sequence (FCS) errors, AAL5 packets
that have reassembly timeout errors, and AAL5
packets that have length errors.
Policed
discards
Number of packets dropped as a result of routing
policies configured on the interface.
■
In the J-Web configuration editor, select the
Disable check box on the
Interfaces>interfaces-name page.
■
In the CLI configuration editor, add the disable
statement at the [edit interfaces interfaces-name]
level of the configuration hierarchy
Configure alarms on interfaces as follows:
■
In the J-Web configuration editor, on the
Chassis>Alarm>interface-type page
■
In the CLI configuration editor, with the alarm
statement at the [edit chassis] level of the
configuration hierarchy
If the interface is saturated, this number increments
once for every packet that is dropped by the Services
Router's random early detection (RED) mechanism.
Monitoring Routing Information
The J-Web interface provides information about routing tables and routing protocols.
Using the Monitoring Tools
■
115
J-series™ Services Router Administration Guide
This section contains the following topics:
■
Monitoring Route Information on page 116
■
Monitoring BGP Routing Information on page 117
■
Monitoring OSPF Routing Information on page 119
■
Monitoring RIP Routing Information on page 120
■
Monitoring DLSw Routing Information on page 121
Monitoring Route Information
To view the inet.0 (IPv4) routing table in the J-Web interface, select
Monitor>Routing>Route Information, or enter the following CLI commands:
■
show route terse
■
show route detail
Table 52 on page 116 summarizes key output fields in the routing information display.
Table 52: Summary of Key Routing Information Output Fields
Field
Values
n
destinations
Number of destinations for which there are routes in
the routing table.
n routes
Number of routes in the routing table:
■
active—Number of routes that are active.
■
holddown—Number of routes that are in hold-down
Additional Information
state (neither advertised nor updated) before being
declared inactive.
■
hidden—Number of routes not used because of
routing policies configured on the Services Router.
Destination
Destination address of the route.
Protocol/
Preference
Protocol from which the route was learned: Static,
Direct, Local, or the name of a particular protocol.
The preference is the individual preference value for
the route.
116
■
Using the Monitoring Tools
The route preference is used as one of the route
selection criteria.
Chapter 7: Monitoring the Router and Routing Operations
Table 52: Summary of Key Routing Information Output Fields (continued)
Field
Values
Additional Information
Next-Hop
Network layer address of the directly reachable
neighboring system (if applicable) and the interface
used to reach it.
If a next hop is listed as Discard, all traffic with that
destination address is discarded rather than routed.
This value generally means that the route is a static
route for which the discard attribute has been set.
If a next hop is listed as Reject, all traffic with that
destination address is rejected. This value generally
means that the address is unreachable. For example,
if the address is a configured interface address and the
interface is unavailable, traffic bound for that address
is rejected.
If a next hop is listed as Local, the destination is an
address on the host (either the loopback address or
Ethernet management port 0 address, for example).
Age
How long the route has been known.
State
Flags for this route.
AS Path
AS path through which the route was learned. The
letters of the AS path indicate the path origin:
■
I — IGP.
■
E — EGP.
■
? — Incomplete. Typically, the AS path was
aggregated.
There are many possible flags. For a complete
description, see the JUNOS Interfaces Command
Reference.
Monitoring BGP Routing Information
To view BGP routing information, select Monitor>Routing>BGP Information, or
enter the following CLI commands:
■
show bgp summary
■
show bgp neighbor
Table 53 on page 117 summarizes key output fields in the BGP routing display.
Table 53: Summary of Key BGP Routing Output Fields
Field
Values
Additional Information
BGP Summary
Groups
Number of BGP groups.
Peers
Number of BGP peers.
Using the Monitoring Tools
■
117
J-series™ Services Router Administration Guide
Table 53: Summary of Key BGP Routing Output Fields (continued)
Field
Values
Down
Peers
Number of unavailable BGP peers.
Peer
Address of each BGP peer.
InPkt
Number of packets received from the peer,
OutPkt
Number of packets sent to the peer.
Flaps
Number of times a BGP session has changed state from
Down to Up.
A high number of flaps might indicate a problem with
the interface on which the BGP session is enabled.
Last
Up/Down
Last time that a session became available or
unavailable, since the neighbor transitioned to or from
the established state.
If the BGP session is unavailable, this time might be
useful in determining when the problem occurred.
State
A multipurpose field that displays information about
BGP peer sessions. The contents of this field depend
upon whether a session is established.
■
If a peer is not established, the field shows the
state of the peer session: Active, Connect, or Idle.
■
If a BGP session is established, the field shows the
number of active, received, and damped routes
that are received from a neighbor. For example,
2/4/0 indicates two active routes, four received
routes, and no damped routes.
Additional Information
BGP Neighbors
Peer
Address of the BGP neighbor.
AS
AS number of the peer.
Type
Type of peer: Internal or External.
State
Current state of the BGP session:
■
Active—BGP is initiating a TCP connection in an
attempt to connect to a peer. If the connection is
successful, BGP sends an open message.
■
Connect—BGP is waiting for the TCP connection
to become complete.
■
Established—The BGP session has been
established, and the peers are exchanging BGP
update messages.
■
Idle—This is the first stage of a connection. BGP
is waiting for a Start event.
■
OpenConfirm—BGP has acknowledged receipt of
an open message from the peer and is waiting to
receive a keepalive or notification message.
■
OpenSent—BGP has sent an open message and is
waiting to receive an open message from the peer.
118
■
Using the Monitoring Tools
Generally, the most common states are Active, which
indicates a problem establishing the BGP conenction,
and Established, which indicates a successful session
setup. The other states are transition states, and BGP
sessions normally do not stay in those states for
extended periods of time.
Chapter 7: Monitoring the Router and Routing Operations
Table 53: Summary of Key BGP Routing Output Fields (continued)
Field
Values
Additional Information
Export
Names of any export policies configured on the peer.
Import
Names of any import policies configured on the peer.
Number of
flaps
Number of times the BGP sessions has changed state
from Down to Up.
A high number of flaps might indicate a problem with
the interface on which the session is established.
Monitoring OSPF Routing Information
To view OSPF routing information, select Monitor>Routing>OSPF Information,
or enter the following CLI commands:
■
show ospf neighbors
■
show ospf interfaces
■
show ospf statistics
Table 54 on page 119 summarizes key output fields in the OSPF routing display.
Table 54: Summary of Key OSPF Routing Output Fields
Field
Values
Additional Information
OSPF Neighbors
Address
Address of the neighbor.
Interface
Interface through which the neighbor is reachable.
State
State of the neighbor: Attempt, Down, Exchange, ExStart,
Full, Init, Loading, or 2way.
ID
Router ID of the neighbor.
Priority
Priority of the neighbor to become the designated
router.
Dead
Number of seconds until the neighbor becomes
unreachable.
Generally, only the Down state, indicating a failed OSPF
adjacency, and the Full state, indicating a functional
adjacency, are maintained for more than a few
seconds. The other states are transitional states that a
neighbor is in only briefly while an OSPF adjacency is
being established.
OSPF Interfaces
Interface
Name of the interface running OSPF.
State
State of the interface: BDR, Down, DR, DRother, Loop,
PtToPt, or Waiting.
The Down state, indicating that the interface is not
functioning, and PtToPt state, indicating that a
point-to-point connection has been established, are the
most common states.
Using the Monitoring Tools
■
119
J-series™ Services Router Administration Guide
Table 54: Summary of Key OSPF Routing Output Fields (continued)
Field
Values
Additional Information
Area
Number of the area that the interface is in.
DR ID
Address of the area's designated router.
BDR ID
Address of the area's backup designated router.
Nbrs
Number of neighbors on this interface.
OSPF Statistics
Packet
Type
Type of OSPF packet.
Total
Sent/Total
Received
Total number of packets sent and received.
Last 5
seconds
Sent/Last 5
seconds
Received
Total number of packets sent and received in the last
5 seconds.
Receive
errors
Number and type of receive errors.
Monitoring RIP Routing Information
To view RIP routing information, select Monitor>Routing>RIP Information, or
enter the following CLI commands:
■
show rip statistics
■
show rip neighbors
Table 55 on page 120 summarizes key output fields in the RIP routing display.
Table 55: Summary of Key RIP Routing Output Fields
Field
Values
RIP Statistics
Rip info
Information about RIP on the specified interface,
including UDP port number, hold-down interval (during
which routes are neither advertised nor updated), and
timeout interval.
Logical
interface
Name of the logical interface on which RIP is
configured.
Routes
learned
Number of RIP routes learned on the logical interface.
120
■
Using the Monitoring Tools
Additional Information
Chapter 7: Monitoring the Router and Routing Operations
Table 55: Summary of Key RIP Routing Output Fields (continued)
Field
Values
Additional Information
Routes
advertised
Number of RIP routes advertised on the logical
interface.
RIP Neighbors
Neighbor
Name of the RIP neighbor.
This value is the name of the interface on which RIP
is enabled. The name is set in either of the following
ways:
■
In the J-Web configuration editor, on the
Protocols>RIP>Group> group-name>Neighbor
page
■
In the CLI configuration editor, with the neighbor
neighbor-name statement at the [edit protocols rip
group group-name] level of the configuration
hierarchy
State
State of the RIP connection: Up or Dn (Down).
Source
Address
Local source address.
This value is the configured address of the interface on
which RIP is enabled.
Destination
Address
Destination address.
This value is the configured address of the immediate
RIP adjacency.
In Met
Value of the incoming metric configured for the RIP
neighbor.
Monitoring DLSw Routing Information
To view DLSw routing information, select Monitor>Routing>DLSw Information,
or enter the following CLI commands:
■
show dlsw capabilities
■
show dlsw circuits
■
show dlsw peers
■
show dlsw reachability
Table 56 on page 121 summarizes key routing information output fields in the DLSw
routing display.
Table 56: Summary of Key DLSw Routing Information Output Fields
Field
Values
Additional Information
DLSw Capabilities
Peer
IP address of the peer DLSw router
Vendor ID
Numerical value assigned to Juniper Networks.
Using the Monitoring Tools
■
121
J-series™ Services Router Administration Guide
Table 56: Summary of Key DLSw Routing Information Output Fields (continued)
Field
Values
Version
number
DLSw protocol version.
Initial
pacing
window
Frequency at which packets are sent.
Version
string
Juniper Networks software version information.
DLSw Circuits
Circuit id
DLSw circuit ID
Local
Address
MAC address of the local DLSw peer.
LSAP
Number of the local service access point.
Remote
address
MAC address of the remote DLSw peer,
DSAP
Number of the destination service access point.
State (or
circuit
state)
Connectivity status; disconnected or connected.
Peer (or
remote
peer
address)
IP address of the remote DLSw peer.
DLSw Peers
Peer
IP address of the remote DLSw peer.
State
Status of the connection.
Circuits
Number of circuits on the DLSw network.
Local
address
IP address of the local DLSw peer.
Created
time
Time of circuit creation.
Connected
time
Length of time that the connection is active.
Receive
initial
pacing
Size of the inital pacing frame.
No circuits
timeout
Length of time before a circuit becomes inactive.
122
■
Using the Monitoring Tools
Additional Information
Chapter 7: Monitoring the Router and Routing Operations
Table 56: Summary of Key DLSw Routing Information Output Fields (continued)
Field
Values
Additional Information
DLSw Reachability
MAC index
Number assigned to the remote DLSw peer.
MAC
address
MAC address of the remote DLSw peer.
Remote
DLSw
address
IP address of the remote DLSw peer.
Monitoring Class-of-Service Performance
The J-Web interface provides information about the class-of-service (CoS) performance
on a router. You can view information about the current status of CoS
components—classifiers, CoS value aliases, red drop profiles, forwarding classes,
rewrite rules and scheduler maps. You can also see the interfaces to which these
components are assigned.
In addition, you can display the entire CoS configuration, including system-chosen
defaults, by entering the following CLI command:
show class-of-service
This section contains the following topics:
■
Monitoring CoS Interfaces on page 123
■
Monitoring CoS Classifiers on page 124
■
Monitoring CoS Value Aliases on page 125
■
Monitoring CoS RED Drop Profiles on page 126
■
Monitoring CoS Forwarding Classes on page 127
■
Monitoring CoS Rewrite Rules on page 128
■
Monitoring CoS Scheduler Maps on page 129
Monitoring CoS Interfaces
To display details about the physical and logical interfaces and the CoS components
assigned to them, select Monitor>Class of Service>Interfaces in the J-Web interface,
or enter the following CLI command:
show class-of-service interface interface
Table 57 on page 124 summarizes key output fields for CoS interfaces.
Using the Monitoring Tools
■
123
J-series™ Services Router Administration Guide
Table 57: Summary of Key CoS Interfaces Output Fields
Field
Values
Additional Information
Interface
Name of a physical interface to which CoS
components are assigned.
To display names of logical interfaces
configured on this physical interface, click
the plus sign (+).
Scheduler Map
Name of the scheduler map associated with
this interface.
Queues Supported
Number of queues you can configure on the
interface.
Queues in Use
Number of queues currently configured.
Logical Interface
Name of a logical interface on the physical
interface, to which CoS components are
assigned.
Object
Category of an object—for example,
classifier, scheduler-map, or rewrite.
Name
Name that you have given to an object—for
example, ba-classifier.
Type
Type of an object—for example, dscp, or
exp for a classifier.
Index
Index of this interface or the internal index
of a specific object.
Monitoring CoS Classifiers
To display the mapping of incoming CoS value to forwarding class and loss priority,
for each classifier, select Monitor>Class of Service>Classifiers in the J-Web
interface, or enter the following CLI command:
show class-of-service classifier
Table 58 on page 124 summarizes key output fields for CoS classifiers.
Table 58: Summary of Key CoS Classifier Output Fields
Classifier Name
124
■
Name of a classifier.
Using the Monitoring Tools
To display classifier assignments, click the
plus sign (+).
Chapter 7: Monitoring the Router and Routing Operations
Table 58: Summary of Key CoS Classifier Output Fields (continued)
CoS Value Type
The classifiers are displayed by type:
■
dscp—All classifiers of the DSCP type.
■
dscp ipv6—All classifiers of the DSCP
IPv6 type.
■
exp—All classifiers of the MPLS EXP
type.
■
ieee-802.1—All classifiers of the IEEE
802.1 type.
■
inet-precedence—All classifiers of the
IP precedence type.
Index
Internal index of the classifier.
Incoming CoS Value
CoS value of the incoming packets, in bits.
These values are used for classification.
Assign to Forwarding Class
Forwarding class that the classifier assigns
to an incoming packet. This class affects the
forwarding and scheduling policies that are
applied to the packet as it transits the router.
Assign to Loss Priority
Loss priority value that the classifier assigns
to the incoming packet based on its CoS
value.
Monitoring CoS Value Aliases
To display information about the CoS value aliases that the system is currently using
to represent DSCP, DSCP IPv6, MPLS EXP, and IPv4 precedence bits, select
Monitor>Class of Service>CoS Value Aliases in the J-Web interface, or enter the
following CLI command:
show class-of-service code-point-aliases
Table 59 on page 126 summarizes key output fields for CoS value aliases.
Using the Monitoring Tools
■
125
J-series™ Services Router Administration Guide
Table 59: Summary of Key CoS Value Alias Output Fields
Field
Values
Additional Information
CoS Value Type
Type of the CoS value:
To display aliases and bit patterns, click the
plus sign (+).
■
dscp—Examines Layer 3 packet
headers for IP packet classification.
■
dscp ipv6—Examines Layer 3 packet
headers for IPv6 packet classification.
■
exp—Examines Layer 2 packet headers
for MPLS packet classification.
■
ieee-802.1—Examines Layer 2 packet
header for packet classification.
■
inet-precedence—Examines Layer 3
packet headers for IP packet
classification.
CoS Value Alias
Name given to a set of bits—for example,
af11 is a name for 001010 bits.
Bit Pattern
Set of bits associated with an alias.
Monitoring CoS RED Drop Profiles
To display data point information for each CoS random early detection (RED) drop
profile currently on a system, select Monitor>Class of Service>RED Drop Profiles
in the J-Web interface, or enter the following CLI command:
show class-of-service drop-profile
Table 60 on page 126 summarizes key output fields for CoS RED drop profiles.
Table 60: Summary of Key CoS RED Drop Profile Output Fields
Field
Values
Additional Information
RED Drop Profile Name
Name of the RED drop profile.
To display profile values, click the plus sign
(+).
A drop profile consists of pairs of values
between 0 and 100, one for queue buffer
fill level and one for drop probability, that
determine the relationship between a
buffer's fullness and the likelihood it will
drop packets.
Graph RED Profile
126
■
Link to a graph of a RED curve that the
system uses to determine the drop
probability based on queue buffer fullness.
Using the Monitoring Tools
The x axis represents the queue buffer fill
level, and the y axis represents the drop
probability.
Chapter 7: Monitoring the Router and Routing Operations
Table 60: Summary of Key CoS RED Drop Profile Output Fields (continued)
Field
Values
Type
Type of a specific drop profile:
■
Additional Information
interpolated—The two coordinates (x
and y) of the graph are interpolated to
produce a smooth profile.
■
segmented—The two coordinates (x
and y) of the graph are represented by
line fragments to produce a segmented
profile.
For information about types of drop profiles,
see the JUNOS Class of Service Configuration
Guide.
Index
Internal index of this drop profile.
Fill Level
Percentage fullness of a buffer queue. This
value is the x coordinate of the RED drop
profile graph.
Drop Probability
Drop probability of a packet corresponding
to a specific queue buffer fill level. This value
is the y coordinate of the RED drop profile
graph.
Monitoring CoS Forwarding Classes
To view the current assignment of CoS forwarding classes to queue numbers on the
system, select Monitor>Class of Service>Forwarding Classes in the J-Web interface,
or enter the following CLI command:
show class-of-service forwarding-class
Table 61 on page 128 summarizes key output fields for CoS forwarding classes.
Using the Monitoring Tools
■
127
J-series™ Services Router Administration Guide
Table 61: Summary of Key CoS Forwarding Class Output Fields
Field
Values
Forwarding Class
Names of forwarding classes assigned to
queue numbers. By default, the following
forwarding classes are assigned to queues
0 through 3:
■
Additional Information
best-effort—Provides no special CoS
handling of packets. Loss priority is
typically not carried in a CoS value, and
RED drop profiles are more aggressive.
■
expedited-forwarding—Provides low loss,
low delay, low jitter, assured
bandwidth, and end-to-end service.
■
assured-forwarding—Provides high
assurance for packets within specified
service profile. Excess packets are
dropped.
■
network-control—Packets can be
delayed but not dropped.
Queue
Queue number corresponding to the
forwarding class name.
By default, four queues, 0 through 3, are
assigned to forwarding classes.
Monitoring CoS Rewrite Rules
To display information about CoS value rewrite rules, which are based on the
forwarding class and loss priority, select Monitor>Class of Service>Rewrite Rules
in the J-Web interface, or enter the following CLI command:
show class-of-service rewrite-rules
Table 62 on page 128 summarizes key output fields for CoS rewrite rules.
Table 62: Summary of Key CoS Rewrite Rules Output Fields
Field
Values
Rewrite Rule Name
Names of rewrite rules.
CoS Value Type
Rewrite rule type:
Index
128
■
dscp—For IPv4 DiffServ traffic.
■
dscp-ipv6—For IPv6 DiffServ traffic.
■
exp—For MPLS traffic.
■
ieee-802.1—For Layer 2 traffic.
■
inet-precedence—For IPv4 traffic.
Internal index for this particular rewrite rule.
■
Using the Monitoring Tools
Additional Information
To display forwarding classes, loss priorities,
and rewritten CoS values, click the plus sign
(+).
Chapter 7: Monitoring the Router and Routing Operations
Table 62: Summary of Key CoS Rewrite Rules Output Fields (continued)
Field
Values
Additional Information
Forwarding Class
Forwarding class that in combination with
loss priority is used to determine CoS values
for rewriting.
Rewrite rules are applied to CoS values in
outgoing packets based on forwarding class
and loss priority setting.
Loss Priority
Loss priority that in combination with
forwarding class is used to determine CoS
values for rewriting.
Rewrite CoS Value To
Value that the CoS value is rewritten to.
Monitoring CoS Scheduler Maps
To display assignments of CoS forwarding classes to schedulers, select Monitor>Class
of Service>Scheduler Maps in the J-Web interface, or enter the following CLI
command:
show class-of-service scheduler-map
Table 63 on page 129 summarizes key output fields for CoS scheduler maps.
Table 63: Summary of Key CoS Scheduler Maps Output Fields
Field
Values
Additional Information
Scheduler Map
Name of a scheduler map.
For details, click the plus sign (+).
Index
Index of a specific object—scheduler maps,
schedulers, or drop profiles.
Scheduler Name
Name of a scheduler.
Forwarding Class
Forwarding classes this scheduler is
assigned to.
Transmit Rate
Configured transmit rate of the scheduler
in bits per second (bps). The rate value can
be either of the following:
■
A percentage—The scheduler receives
the specified percentage of the total
interface bandwidth.
■
remainder—The scheduler receives the
remaining bandwidth of the interface
after allocation to other schedulers.
Rate Limit
Rate limiting configuration of the queue:
■
none—No rate limiting.
■
exact—The queue transmits at only the
configured rate.
Using the Monitoring Tools
■
129
J-series™ Services Router Administration Guide
Table 63: Summary of Key CoS Scheduler Maps Output Fields (continued)
Field
Values
Buffer Size
Delay buffer size in the queue or the amount
of transmit delay (in milliseconds). The
buffer size can be either of the following:
■
A percentage—The buffer is a
percentage of the total buffer
allocation.
■
remainder—The buffer is sized
Additional Information
according to what remains after other
scheduler buffer allocations.
Priority
Scheduling priority of a queue:
■
high—Packets in this queue are
transmitted first.
■
low—Packets in this queue are
transmitted last.
■
medium-high—Packets in this queue are
transmitted after high-priority packets.
■
medium-low—Packets in this queue are
transmitted before low-priority packets.
Drop Profiles
Name and index of a drop profile that is
assigned to a specific loss priority and
protocol pair.
Loss Priority
Packet loss priority corresponding to a drop
profile:
■
low—Packet has a low loss priority.
■
high—Packet has a high loss priority.
■
medium-low—Packet has a medium-low
loss priority.
■
medium-high—Packet has a
medium-high loss priority.
Protocol
Transport protocol corresponding to a drop
profile.
Drop Profile Name
Name of the drop profile.
Monitoring MPLS Traffic Engineering Information
The J-Web interface provides information about Multiprotocol Label Switching (MPLS)
traffic engineering.
This section contains the following topics:
130
■
■
Monitoring MPLS Interfaces on page 131
■
Monitoring MPLS LSP Information on page 131
■
Monitoring MPLS LSP Statistics on page 132
Using the Monitoring Tools
Chapter 7: Monitoring the Router and Routing Operations
■
Monitoring RSVP Session Information on page 133
■
Monitoring MPLS RSVP Interfaces Information on page 134
Monitoring MPLS Interfaces
To view the interfaces on which MPLS is configured, select
Monitor>MPLS>Interfaces, or enter the following CLI command:
show mpls interface
Table 64 on page 131 summarizes key output fields in the MPLS interface information
display.
Table 64: Summary of Key MPLS Interface Information Output Fields
Field
Values
Interface
Name of the interface on which MPLS is
configured.
State
State of the specified interface: Up or Dn (down).
Administrative groups
Administratively assigned colors of the MPLS link
configured on the interface.
Additional Information
Monitoring MPLS LSP Information
To view all label-switched paths (LSPs) configured on the Services Router, including
all inbound (ingress), outbound (egress), and transit LSP information, select
Monitor>MPLS>LSP Information, or enter the following CLI command:
show mpls lsp
Table 65 on page 131 summarizes key output fields in the MPLS LSP information
display.
Table 65: Summary of Key MPLS LSP Information Output Fields
Field
Values
Additional Information
Ingress LSP
Information about LSPs on the inbound router.
Each session has one line of output.
Egress LSP
Information about the LSPs on the outbound
router. Each session has one line of output.
MPLS learns this information by querying RSVP,
which holds all the transit and outbound session
information.
Transit LSP
Number of LSPs on the transit routers and the
state of these paths.
MPLS learns this information by querying RSVP,
which holds all the transit and outbound session
information.
To
Destination (outbound router) of the session.
Using the Monitoring Tools
■
131
J-series™ Services Router Administration Guide
Table 65: Summary of Key MPLS LSP Information Output Fields (continued)
Field
Values
From
Source (inbound router) of the session.
State
State of the path. It can be Up, Down, or AdminDn.
Additional Information
AdminDn indicates that the LSP is being taken
down gracefully.
Rt
Number of active routes (prefixes) installed in the
routing table.
For inbound RSVP sessions, the routing table is
the primary IPv4 table (inet.0). For transit and
outbound RSVP sessions, the routing table is the
primary MPLS table (mpls.0).
Active Path
Name of the active path: Primary or Secondary.
This field is used for inbound LSPs only.
P
An asterisk (*) in this column indicates that the
LSP is a primary path.
This field is used for inbound LSPs only.
LSPname
Configured name of the LSP.
Style
RSVP reservation style. This field consists of two
parts. The first is the number of active
reservations. The second is the reservation style,
which can be FF (fixed filter), SE (shared explicit),
or WF (wildcard filter).
Labelin
Incoming label for this LSP.
Labelout
Outgoing label for this LSP.
Total
Total number of LSPs displayed for the particular
type—ingress (inbound), egress (outbound), or
transit.
This field is used for outbound and transit LSPs
only.
Monitoring MPLS LSP Statistics
To display accounting information about LSPs, select Monitor>MPLS>LSP Statistics,
or enter the following CLI command:
show mpls lsp statistics
NOTE: \Statistics are not available for LSPs on the outbound router, because the
penultimate router in the LSP sets the label to 0. Also, as the packet arrives at the
outbound router, the hardware removes its MPLS header and the packet reverts to
being an IPv4 packet. Therefore, it is counted as an IPv4 packet, not an MPLS packet.
Table 66 on page 133 summarizes key output fields in the MPLS LSP statistics display.
132
■
Using the Monitoring Tools
Chapter 7: Monitoring the Router and Routing Operations
Table 66: Summary of Key MPLS LSP Statistics Output Fields
Field
Values
Additional Information
Ingress LSP
Information about LSPs on the inbound router.
Each session has one line of output.
Egress LSP
Information about the LSPs on the outbound
router. Each session has one line of output.
MPLS learns this information by querying RSVP,
which holds all the transit and outbound session
information.
Transit LSP
Number of LSPs on the transit routers and the
state of these paths.
MPLS learns this information by querying RSVP,
which holds all the transit and outbound session
information.
To
Destination (outbound router) of the session.
From
Source (inbound router) of the session.
State
State of the path: Up, Down, or AdminDn.
AdminDn indicates that the LSP is being taken
down gracefully.
Packets
Total number of packets received on the LSP from
the upstream neighbor.
Bytes
Total number of bytes received on the LSP from
the upstream neighbor.
LSPname
Configured name of the LSP.
Total
Total number of LSPs displayed for the particular
type—ingress (inbound), egress (outbound), or
transit.
Monitoring RSVP Session Information
To view currently active RSVP session information, select Monitor>MPLS>RSVP
Sessions, or enter the following CLI command:
show rsvp session
Table 67 on page 133 summarizes key output fields in the RSVP session information
display.
Table 67: Summary of Key RSVP Session Information Output Fields
Field
Values
Ingress LSP
Information about inbound RSVP sessions. Each
session has one line of output.
Egress LSP
Information about outbound RSVP sessions. Each
session has one line of output.
Additional Information
MPLS learns this information by querying RSVP,
which holds all the transit and outbound session
information.
Using the Monitoring Tools
■
133
J-series™ Services Router Administration Guide
Table 67: Summary of Key RSVP Session Information Output Fields (continued)
Field
Values
Additional Information
Transit LSP
Information about transit RSVP sessions.
MPLS learns this information by querying RSVP,
which holds all the transit and outbound session
information.
To
Destination (outbound router) of the session.
From
Source (inbound router) of the session.
State
State of the path: Up, Down, or AdminDn.
AdminDn indicates that the LSP is being taken
down gracefully.
Rt
Number of active routes (prefixes) installed in the
routing table.
For inbound RSVP sessions, the routing table is
the primary IPv4 table (inet.0). For transit and
outbound RSVP sessions, the routing table is the
primary MPLS table (mpls.0).
Style
RSVP reservation style. This field consists of two
parts. The first is the number of active
reservations. The second is the reservation style,
which can be FF (fixed filter), SE (shared explicit),
or WF (wildcard filter).
This field is used for outbound and transit LSPs
only.
Labelin
Incoming label for this RSVP session.
Labelout
Outgoing label for this RSVP session.
LSPname
Configured name of the LSP.
Total
Total number of RSVP sessions displayed for the
particular type—ingress (inbound), egress
(outbound), or transit).
Monitoring MPLS RSVP Interfaces Information
To view the interfaces on which RSVP is running, select Monitor>MPLS>RSVP
Interfaces, or enter the following CLI command:
show rsvp interface
Table 68 on page 134 summarizes key output fields in the RSVP interfaces information
display.
Table 68: Summary of Key RSVP Interfaces Information Output Fields
Field
Values
RSVP Interface
Number of interfaces on which RSVP is active.
Each interface has one line of output.
Interface
Name of the interface.
134
■
Using the Monitoring Tools
Additional Information
Chapter 7: Monitoring the Router and Routing Operations
Table 68: Summary of Key RSVP Interfaces Information Output Fields (continued)
Field
Values
Additional Information
State
State of the interface:
Disabled—No traffic engineering information
■
is displayed.
■
Down—The interface is not operational.
■
Enabled—Displays traffic engineering
information.
Up—The interface is operational.
■
Active resv
Number of reservations that are actively reserving
bandwidth on the interface.
Subscription
User-configured subscription factor.
Static BW
Total interface bandwidth, in bits per second
(bps).
Available BW
Amount of bandwidth that RSVP is allowed to
reserve, in bits per second (bps). It is equal to
(static bandwidth X subscription factor).
Reserved BW
Currently reserved bandwidth, in bits per second
(bps).
Highwater mark
Highest bandwidth that has ever been reserved
on this interface, in bits per second (bps).
Monitoring Service Sets
A service set is a group of rules from a stateful firewall filter, Network Address
Translation (NAT), intrusion detection service (IDS), or IP Security (IPSec) that you
apply to a services interface. You can configure IDS, NAT, and stateful firewall filter
service rules within the same service set. You must configure IPSec services in a
separate service set. For more information about using service sets with these features,
see the J-series Services Router Advanced WAN Access Configuration Guide.
Service set information includes the services interfaces on the Services Router, the
number of services sets configured on the interfaces, and the total CPU used by the
service sets. To view these service set properties, select Monitor>Service Sets in
the J-Web interface, or enter the following CLI show commands:
■
show services service-sets summary
■
show services service-sets memory-usage
Table 69 on page 136 summarizes key output fields in service sets displays.
Using the Monitoring Tools
■
135
J-series™ Services Router Administration Guide
Table 69: Summary of Key Service Set Output Fields
Field
Values
Additional Information
Service Set Summary
Interface
Name of the adaptive services interface on the
Services Router—always sp-0/0/0.
Service sets
configured
Total number of service sets configured on the
Services Router.
Bytes used
Total number of general-purpose memory bytes being
used by the service set configuration.
A portion of the general-purpose memory on a Services
Router is allocated for storing traffic flows, NAT pools,
and so on.
Policy
bytes used
Total number of configuration-object memory bytes
being used by routing policies associated with the
service set configuration.
A portion of the general-purpose memory on a Services
Router is allocated for storing configuration objects like
firewall rules, routing policies, and so on.
CPU
utilization
Percentage of the CPU resources being used.
A high CPU utilization indicates that the router is under
heavy load. High CPU utilization might cause
performance degradation in forwarding or the
application of other services.
Memory Usage
Interface
Name of the adaptive services interface on the
Services Router—always sp-0/0/0.
Service set
Name of a service set.
Memory
Utilization
%
Percentage of the memory resources being used by
the service set.
Memory
zone
Memory zone in which the services interface is
currently operating. Following are valid zones:
■
Green—All new flows are allowed.
■
Yellow—Unused memory is reclaimed. All new
flows are allowed.
■
Orange—New flows are only allowed for service
sets that are using less than their equal share of
memory.
■
Red—No new flows are allowed.
A high CPU utilization indicates that the router is under
heavy load. High CPU utilization might cause
performance degradation in forwarding or the
application of other services.
Monitoring Firewalls
The firewall filter information is divided into three parts—firewall statistics, stateful
firewall filters and intrusion detection services.
136
■
Using the Monitoring Tools
Chapter 7: Monitoring the Router and Routing Operations
This section contains the following topics:
■
Monitoring Stateful Firewall Statistics on page 137
■
Monitoring Stateful Firewall Filters on page 138
■
Monitoring Firewall Intrusion Detection Services (IDS) on page 139
Monitoring Stateful Firewall Statistics
To view stateful firewall filter statistics in the J-Web interface, select
Monitor>Firewall>Statistics Summary. Alternatively, enter the CLI command show
services stateful-firewall statistics.
Table 70 on page 137 summarizes key output fields for stateful firewall filter statistics.
Table 70: Summary of Key Stateful Firewall Statistics Output Fields
Field
Values
Interface
Name of the services interface on which the service set is applied.
Service Set
Name of the service set.
Accept
Number of packets accepted by all rules defined in the service set.
Discard
Number of packets discarded by all rules defined in the service set.
Reject
Number of packets rejected by all rules defined in the service set.
New flows
Number of packets matching rules defined in new flows:
Existing flows
Drops
■
Accept—Number of packets accepted.
■
Discards—Number of packets discarded.
■
Rejects—Number of packets rejected.
Number of packets matching rules defined in existing flows:
■
Accept—Number of packets accepted.
■
Discards—Number of packets discarded.
■
Rejects—Number of packets rejected.
Number of packets dropped due to the following match conditions:
■
IP Option—Number of packets dropped due to the inspection of the IP options field of the
packet.
■
TCP SYN Defense—Number of packets dropped due to the SYN defender, which prevents
denial-of-service (DoS) attacks.
■
NAT Ports Exhausted—Number of packets dropped because the router has no available NAT
ports to assign for a given source address.
For more information about these match conditions, see the J-series Services Router Advanced WAN
Access Configuration Guide and the JUNOS Services Interfaces Configuration Guide.
Using the Monitoring Tools
■
137
J-series™ Services Router Administration Guide
Table 70: Summary of Key Stateful Firewall Statistics Output Fields (continued)
Field
Values
Errors
Number of protocol errors detected:
■
IP—Number of IPv4 errors (for example, Minimum IP header length check failures).
■
TCP—Number of TCP errors (for example, Source or destination port number is zero).
■
UDP—Number of UDP errors (for example, IP data length less than minimum UDP header length
(8 bytes)).
■
ICMP—Number of ICMP errors (for example, Duplicate ping sequence number).
■
Non-IP Packets—Number of errors in packets that are not IPv4 packets.
■
ALG—Number of application-level gateway (ALG) errors.
For a complete list of protocol errors that are counted, see the description of the show services
stateful-firewall statistics command in the JUNOS System Basics and Services Command Reference.
Monitoring Stateful Firewall Filters
To view stateful firewall filter information in the J-Web interface, select
Monitor>Firewall>Stateful Firewall. To display stateful firewall filter information
for a particular address prefix, port, or other characteristic, type or select information
in one or more of the Narrow Search boxes, and click OK.
Alternatively, enter the following CLI show commands:
■
show services stateful-firewall conversations
■
show services stateful-firewall flows
Table 71 on page 138 summarizes key output fields for stateful firewall filters.
Table 71: Summary of Key Stateful Firewall Filters Output Fields
Field
Values
Protocol
Protocol used for the specified stateful firewall flow.
Source IP
Source prefix of the stateful firewall flow.
Source Port
Source port number of stateful firewall flow.
Destination IP
Destination prefix of the stateful firewall flow.
Destination Port
Destination port number of the stateful firewall flow.
Flow State
Status of the stateful firewall flow:
138
■
■
Drop—Drop all packets in the flow without response.
■
Forward—Forward the packet in the flow without inspecting it.
■
Reject—Drop all packets in the flow with response.
■
Watch—Inspect packets in the flow.
Using the Monitoring Tools
Chapter 7: Monitoring the Router and Routing Operations
Table 71: Summary of Key Stateful Firewall Filters Output Fields (continued)
Field
Values
Direction
Direction of the flow: I (input) or O (output).
Frames
Number of frames in the flow.
Monitoring Firewall Intrusion Detection Services (IDS)
To view intrusion detection service (IDS) information for stateful firewall filters, select
Monitor>Firewall>IDS Information. Click one of the following criteria to order the
display accordingly:
■
Bytes (received bytes)
■
Packets (received packets)
■
Flows
■
Anomalies
To limit the display of IDS information, type or select information in one or more of
the Narrow Search boxes listed in Table 72 on page 139, and click OK.
Table 72: IDS Search-Narrowing Characteristics
Narrow Search Box
Entry or Selection
Destination Address
Type a destination address prefix to display IDS information for only that prefix.
IDS Table
Select one of the following:
■
Destination—Displays information for an address under attack.
■
Pair—Displays information for a suspected attack source and destination pair.
■
Source—Displays information for an address that is a suspected attacker.
Number of IDS Entries to
Display
Select a number between 25 and 500 to display only a particular number of entries.
Threshold
Type a number to display events with only that number of bytes, packets, flows, or
anomalies—whichever you selected to order the display. For example, to display all events
with more than 100 flows, click Flows and then type 100 in the Threshold box.
Service Set
Select a service set to display information for only the set.
Alternatively, enter the following CLI show commands:
■
show services ids destination-table
■
show services ids source-table
■
show services ids pair-table
Using the Monitoring Tools
■
139
J-series™ Services Router Administration Guide
Table 73 on page 140 summarizes key output fields for stateful firewall filter intrusion
detection.
Table 73: Summary of Key Firewall IDS Output Fields
Field
Values
Source Address
Source address for the event.
Destination address
Destination address for the event.
Time
Total time the information has been in the IDS table.
Bytes
Total number of bytes sent from the source to the destination address, in thousands (k) or millions
(m).
Packets
Total number of packets sent from the source to the destination address, in thousands (k) or millions
(m).
Flows
Total number of flows of packets sent from the source to the destination address, in thousands (k)
or millions (m).
Anomalies
Total number of anomalies in the anomaly table, in thousands (k) or millions (m).
Application
Configured application, such as FTP or Telnet.
Monitoring IPSec Tunnels
IPSec tunnel information includes information about active IPSec tunnels configured
on the Services Router, as well as traffic statistics through the tunnels. To view IPSec
tunnel information, select Monitor>IPSec in the J-Web interface, or enter the
following CLI show commands:
■
show services ipsec-vpn ipsec statistics
■
show services ipsec-vpn ipsec security-associations
■
show services ipsec-vpn ike security-associations
Table 74 on page 140 summarizes key output fields in IPSec displays.
Table 74: Summary of Key IPSec Output Fields
Field
Values
IPSec Tunnels
Service Set
Name of the service set for which the IPSec tunnel is defined.
Rule
Name of the rule set applied to the IPSec tunnel.
Term
Name of the IPSec term applied to the IPSec tunnel.
Local Gateway
Gateway address of the local system.
140
■
Using the Monitoring Tools
Chapter 7: Monitoring the Router and Routing Operations
Table 74: Summary of Key IPSec Output Fields (continued)
Field
Values
Remote Gateway
Gateway address of the remote system.
Direction
Direction of the IPSec tunnel: Inbound or Outbound.
Protocol
Protocol supported: either Encapsulation Security Protocol (ESP) or Authentication Header and ESP
(AH+ESP).
Tunnel Index
Numeric identifier of the IPSec tunnel.
Tunnel Local Identity
Prefix and port number of the local endpoint of the IPSec tunnel.
Tunnel Remote
Identity
Prefix and port number of the remote endpoint of the IPSec tunnel.
IPSec Statistics
Service Set
Name of the service set for which the IPSec tunnel is defined.
Local Gateway
Gateway address of the local system.
Remote Gateway
Gateway address of the remote system.
ESP Encrypted Bytes
Total number of bytes encrypted by the local system across the IPSec tunnel.
ESP Decrypted Bytes
Total number of bytes decrypted by the local system across the IPSec tunnel.
AH Input Bytes
Total number of bytes received by the local system across the IPSec tunnel.
AH Output Bytes
Total number of bytes transmitted by the local system across the IPSec tunnel.
IKE Security
Remote Address
Responder's address.
State
State of the IKE security association:
■
Matured—IKE security association is established.
■
Not matured—IKE security association is in the process of negotiation.
Initiator Cookie
Random number sent to the remote node when the IKE negotiation is triggered. This number is
generated by means of an algorithm and information shared during the IKE negotiation. Cookies
provide a basic form of authenticity protection to help prevent denial-of-service (DoS) attacks.
Responder Cookie
Random number generated by the remote node when it receives the initiator cookie. The remote
node sends the cookie back to the IKE initiator as verification that the negotiation packets were
received.
Using the Monitoring Tools
■
141
J-series™ Services Router Administration Guide
Table 74: Summary of Key IPSec Output Fields (continued)
Field
Values
Exchange Type
Type of IKE exchange. The IKE exchange type determines the number of messages in the exchange
and the payload types contained in each message. Each exchange type provides a particular set of
security services, such as anonymity of the participants, perfect forward secrecy of the keying
material, and authentication of the participants. J-series Services Routers support the following types
of IKE exchanges:
Main—IKE exchange is done with six messages. The Main exchange type encrypts the payload,
■
protecting the identity of the neighbor.
Aggressive—IKE exchange is done with three messages. The Aggressive exchange type does not
■
encrypt the payload, leaving the identity of the neighbor unprotected.
Role
Role of the router in the IKE exchange: Initiator or Responder.
Authentication Method
Method used for IKE authentication. The type of authentication determines which payloads are
exchanged and when they are exchanged. J-series Services Routers support only the pre-shared keys
authentication type.
Local Address
Prefix and port number of the local tunnel endpoint.
Remote Address
Prefix and port number of the remote tunnel endpoint.
Lifetime
Number of seconds remaining until the IKE security association expires.
Algorithm
Authentication
Type of authentication algorithm used for the security association: md5 or sha1.
Algorithm Encryption
Type of encryption algorithm used for the security association: des-cbc, 3des-cbc, or None.
Algorithm PRF
The pseudorandom function that generates highly unpredictable random numbers: hmac-md5 or
hmac-sha1.
Input Bytes
Number of bytes received on the IKE security association.
Output Bytes
Number of bytes transmitted on the IKE security association.
Input Packets
Number of packets received on the IKE security association.
Output Packets
Number of packets transmitted on the IKE security association.
IPSec Security
Associations
Number of IPSec security associations that have been created and deleted on the router. Only security
associations whose negotiations are complete are listed. When a security association is taken down,
it is listed as a deleted security association.
Phase 2 Negotiations
in Progress
Number of phase 2 IKE negotiations in progress.
Monitoring NAT Pools
NAT pool information includes information about the address ranges configured
within the pool on the Services Router. To view NAT pool information, select
Monitor>NAT in the J-Web interface, or enter the following CLI show command:
142
■
Using the Monitoring Tools
Chapter 7: Monitoring the Router and Routing Operations
show services nat pool
Table 75 on page 143 summarizes key output fields in NAT displays.
Table 75: Summary of Key NAT Output Fields
Field
Values
NAT Pools
NAT Pool
Name of the NAT pool.
Pool Start Address
Lower address in the NAT pool address range.
Pool Address End
Upper address in the NAT pool address range.
Port High
Upper port in the NAT pool port range.
Port Low
Lower port in the NAT pool port range.
Ports In Use
Number of ports allocated in this NAT pool.
Monitoring DHCP
A Services Router can operate as a DHCP server. To view information about dynamic
and static DHCP leases, conflicts, pools, and statistics, select Monitor>DHCP in the
J-Web interface or enter the following CLI commands:
■
show system services dhcp binding
■
show system services dhcp conflict
■
show system services dhcp pool
■
show system services dhcp statistics
In addition, you can display the globally configured DHCP settings by using the show
system services global command from the CLI.
Table 76 on page 143 summarizes the output fields in DHCP displays.
Table 76: Summary of DHCP Output Fields
Field
Values
Additional Information
DHCP Leases
Allocated
Address
List of IP addresses the DHCP server has assigned to
clients.
MAC
Address
Corresponding media access control (MAC) address
of the client.
Using the Monitoring Tools
■
143
J-series™ Services Router Administration Guide
Table 76: Summary of DHCP Output Fields (continued)
Field
Values
Additional Information
Binding
Type
Type of binding assigned to the client: dynamic or
static.
DHCP servers can assign a dynamic binding from a pool
of IP addresses or a static binding to one or more
specific IP addresses.
Lease
Expires
Date and time the lease expires, or never for leases
that do not expire.
DHCP Conflicts
Detection
Time
Date and time the client detected the conflict.
Detection
Method
How the conflict was detected.
Only client-detected conflicts are displayed.
Address
IP address where the conflict occurs.
The addresses in the conflicts list remain excluded until
you use the clear system services dhcp conflict command
to manually clear the list.
DHCP Pools
Pool Name
Subnet on which the IP address pool is defined.
Low
Address
Lowest address in the IP address pool.
High
Address
Highest address in the IP address pool.
Excluded
Addresses
Addresses excluded from the address pool.
DHCP Statistics
Default
lease time
Lease time assigned to clients that do not request a
specific lease time.
Minimum
lease time
Minimum time a client can retain an IP address lease
on the server.
Maximum
lease time
Maximum time a client can retain an IP address lease
on the server.
Packets
dropped
Total number of packets dropped and the number of
packets dropped due to a particular condition.
Messages
received
Number of BOOTREQUEST, DHCPDECLINE,
DHCPDISCOVER, DHCPINFORM, DHCPRELEASE,
and DHCPREQUEST messages sent from DHCP clients
and received by the DHCP server.
Messages
sent
Number of BOOTREPLY, DHCPACK, DHCPOFFER,
and DHCPNAK messages sent from the DHCP server
to DHCP clients.
144
■
Using the Monitoring Tools
Chapter 7: Monitoring the Router and Routing Operations
Monitoring RPM Probes
The RPM information includes the round-trip time, jitter, and standard deviation
values for each configured RPM test on the Services Router. To view these RPM
properties, select Monitor>RPM in the J-Web interface, or enter the following CLI
show command:
show services rpm probe-results
In addition to the RPM statistics for each RPM test, the J-Web interface displays the
round-trip times and cumulative jitter graphically. Figure 11 on page 145 shows sample
graphs for an RPM test.
Figure 11: Sample RPM Graphs
ERROR: Unresolved graphic fileref="s020039.gif" not found in
"\\teamsite1\default\main\TechPubsWorkInProgress\STAGING\images\".
In Figure 11 on page 145, the round-trip time and jitter values are plotted as a function
of the system time. Large spikes in round-trip time or jitter indicate a slower outbound
(egress) or inbound (ingress) time for the probe sent at that particular time.
Table 77 on page 145 summarizes key output fields in RPM displays.
Table 77: Summary of Key RPM Output Fields
Field
Values
Additional Information
Currently Running Tests
Graph
Click the Graph link to display the graph (if it is not
already displayed) or to update the graph for a particular
test.
Owner
Configured owner name of the RPM test.
Test Name
Configured name of the RPM test.
Probe Type
Type of RPM probe configured for the specified test.
Following are valid probe types:
■
http-get
■
http-get-metadata
■
icmp-ping
■
icmp-ping-timestamp
■
tcp-ping
■
udp-ping
Target
Address
IP address or URL of the remote server that is being
probed by the RPM test.
Source
Address
Explicitly configured source address that is included
in the probe packet headers.
If no source address is configured, the RPM probe
packets use the outgoing interface as the source address,
and the Source Address field is empty.
Using the Monitoring Tools
■
145
J-series™ Services Router Administration Guide
Table 77: Summary of Key RPM Output Fields (continued)
Field
Values
Minimum
RTT
Shortest round-trip time from the Services Router to
the remote server, as measured over the course of
the test.
Maximum
RTT
Longest round-trip time from the Services Router to
the remote server, as measured over the course of
the test.
Average
RTT
Average round-trip time from the Services Router to
the remote server, as measured over the course of
the test.
Standard
Deviation
RTT
Standard deviation of round-trip times from the
Services Router to the remote server, as measured
over the course of the test.
Probes Sent
Total number of probes sent over the course of the
test.
Loss
Percentage
Percentage of probes sent for which a response was
not received.
Additional Information
Round-Trip Time for a Probe
Samples
Total number of probes used for the data set.
Earliest
Sample
System time when the first probe in the sample was
received.
Latest
Sample
System time when the last probe in the sample was
received.
Mean Value
Average round-trip time for the 50–probe sample.
Standard
Deviation
Standard deviation of the round-trip times for the
50–probe sample.
Lowest
Value
Shortest round-trip time from the Services Router to
the remote server, as measured over the 50–probe
sample.
Time of
Lowest
Sample
System time when the lowest value in the 50–probe
sample was received.
Highest
Value
Longest round-trip time from the Services Router to
the remote server, as measured over the 50–probe
sample.
Time of
Highest
Sample
System time when the highest value in the 50–probe
sample was received.
146
■
Using the Monitoring Tools
The Services Router maintains records of the most
recent 50 probes for each configured test. These 50
probes are used to generate RPM statistics for a
particular test.
Chapter 7: Monitoring the Router and Routing Operations
Table 77: Summary of Key RPM Output Fields (continued)
Field
Values
Additional Information
Cumulative Jitter for a Probe
Samples
Total number of probes used for the data set.
Earliest
Sample
System time when the first probe in the sample was
received.
Latest
Sample
System time when the last probe in the sample was
received.
Mean Value
Average jitter for the 50–probe sample.
Standard
Deviation
Standard deviation of the jitter values for the
50–probe sample.
Lowest
Value
Smallest jitter value, as measured over the 50–probe
sample.
Time of
Lowest
Sample
System time when the lowest value in the 50–probe
sample was received.
Highest
Value
Highest jitter value, as measured over the 50–probe
sample.
Time of
Highest
Sample
System time when the highest jitter value in the
50–probe sample was received.
The Services Router maintains records of the most
recent 50 probes for each configured test. These 50
probes are used to generate RPM statistics for a
particular test.
Monitoring PPP
PPP monitoring information includes PPP address pool information, session status
for PPP interfaces, cumulative statistics for all PPP interfaces, and a summary of PPP
sessions.
NOTE: PPP monitoring information is available only in the CLI. The J-Web interface
does not include pages for displaying PPP monitoring information.
To display PPP monitoring information, enter the following CLI commands:
■
show ppp address-pool pool-name
■
show ppp interface interface-name
■
show ppp statistics
■
show ppp summary
Using the Monitoring Tools
■
147
J-series™ Services Router Administration Guide
For information about these CLI commands, see the JUNOS Interfaces Command
Reference.
Monitoring PPPoE
The PPPoE monitoring information is displayed in multiple parts. To display the
session status for PPPoE interfaces, cumulative statistics for all PPPoE interfaces on
the Services Router, and the PPPoE version configured on the Services Router, select
Monitor>PPPoE in the J-Web interface.
To view interface-specific properties in the J-Web interface, select the interface name
on the PPPoE page.
Alternatively, enter the following CLI commands:
■
show pppoe interfaces
■
show pppoe statistics
■
show pppoe version
Table 78 on page 148 summarizes key output fields in PPPoE displays.
You can also view status information about the PPPoE interface by selecting
Monitor>Interfaces>pp0. Alternatively, enter the show interfaces pp0 command.
For more information about key output fields, see “Monitoring the
Interfaces” on page 113.
Table 78: Summary of Key PPPoE Output Fields
Field
Values
Additional Information
Name of the PPPoE interface.
Click the interface name to display PPPoE
information for the interface.
PPPoE Interfaces
Interface
(See the interface naming conventions in the
J-series Services Router Basic LAN and WAN Access
Configuration Guide.)
State
State of the PPPoE session on the interface.
Session ID
Unique session identifier for the PPPoE session.
148
■
Using the Monitoring Tools
To establish a PPPoE session, first the Services
Router acting as a PPPoE client obtains the Ethernet
address of the PPPoE server or access concentrator,
and then the client and the server negotiate a unique
session ID. This process is refereed as PPPoE active
discovery and is made up of four steps: initiation,
offer, request, and session confirmation. The access
concentrator generates the session ID for session
confirmation and sends it to the PPPoE client in a
PPPoE Active Discovery Session-Confirmation (PADS)
packet.
Chapter 7: Monitoring the Router and Routing Operations
Table 78: Summary of Key PPPoE Output Fields (continued)
Field
Values
Additional Information
Service Name
Type of service required from the access
concentrator.
Service Name identifies the type of service provided
by the access concentrator, such as the name of the
Internet service provider (ISP), class, or quality of
service.
Configured AC
Name
Configured access concentrator name.
Session AC Names
Name of the access concentrator.
AC MAC Address
Media access control (MAC) address of the access
concentrator.
Session Uptime
Number of seconds the current PPPoE session has
been running.
Auto-Reconnect
Timeout
Number of seconds to wait before reconnecting
after a PPPoE session is terminated.
Idle Timeout
Number of seconds a PPPoE session can be idle
without disconnecting.
Underlying
Interface
Name of the underlying logical Ethernet or ATM
interface on which PPPoE is running—for
example, ge-0/0/0.1.
PPPoE Statistics
Active PPPoE
Sessions
Total number of active PPPoE sessions.
Using the Monitoring Tools
■
149
J-series™ Services Router Administration Guide
Table 78: Summary of Key PPPoE Output Fields (continued)
Field
Values
Packet Type
Packets sent and received during the PPPoE
session, categorized by packet type and packet
error:
■
PADI—PPPoE Active Discovery Initiation
packets.
■
PADO—PPPoE Active Discovery Offer
packets.
■
PADR—PPPoE Active Discovery Request
packets.
■
PADS—PPPoE Active Discovery
Session-Confirmation packets.
■
PADT—PPPoE Active Discovery Terminate
packets.
■
Service Name Error—Packets for which the
Service-Name request could not be honored.
■
AC System Error—Packets for which the
access concentrator experienced an error in
processing the host request. For example,
the host had insufficient resources to create
a virtual circuit.
■
Generic Error—Packets that indicate an
unrecoverable error occurred.
■
Malformed Packet—Malformed or short
packets that caused the packet handler to
disregard the frame as unreadable.
■
Unknown Packet—Unrecognized packets.
Sent
Number of the specific type of packet sent from
the PPPoE client.
Received
Number of the specific type of packet received by
the PPPoE client.
Timeout
Information about the timeouts that occurred
during the PPPoE session.
Sent
■
PADI—Number of timeouts that occurred for
the PADI packet.
■
PADO—Number of timeouts that occurred
for the PADO packet. (This value is always 0
and is not supported.
■
PADR—Number of timeouts that occurred
for the PADR packet.
Number of the timeouts that occurred for PADI,
PADO, and PADR packets.
PPPoE Version
Maximum Sessions
150
■
Maximum number of active PPPoE sessions the
Services Router can support. The default is 256
sessions.
Using the Monitoring Tools
Additional Information
Chapter 7: Monitoring the Router and Routing Operations
Table 78: Summary of Key PPPoE Output Fields (continued)
Field
Values
Additional Information
PADI Resend
Timeout
Initial time, (in seconds) the Services Router waits
to receive a PADO packet for the PADI packet
sent—for example, 2 seconds. This timeout
doubles for each successive PADI packet sent.
The PPPoE Active Discovery Initiation (PADI) packet
is sent to the access concentrator to initiate a PPPoE
session. Typically, the access concentrator responds
to a PADI packet with a PPPoE Active Discovery
Offer (PADO) packet. If the access concentrator does
not send a PADO packet, the Services Router sends
the PADI packet again after timeout period is
elapsed. The PADI Resend Timeout doubles for each
successive PADI packet sent. For example, if the
PADI Resend Timeout is 2 seconds, the second PADI
packet is sent after 2 seconds, the third after 4
seconds, the fourth after 8 seconds, and so on.
PADR Resend
Timeout
Initial time (in seconds) the Services Router waits
to receive a PADS packet for the PADR packet
sent. This timeout doubles for each successive
PADR packet sent.
The PPPoE Active Discovery Request (PADR) packet
is sent to the access concentrator in response to a
PADO packet, and to obtain the PPPoE session ID.
Typically, the access concentrator responds to a
PADR packet with a PPPoE Active Discovery
Session-Confirmation (PADS) packet, which contains
the session ID. If the access concentrator does not
send a PADS packet, the Services Router sends the
PADR packet again after the PADR Resend Timeout
period is elapsed. The PADR Resend Timeout
doubles for each successive PADR packet sent.
Maximum Resend
Timeout
Maximum value (in seconds) that the PADI or
PADR resend timer can accept—for example, 64
seconds. The maximum value is 64.
Maximum
Configured AC
Timeout
Time (in seconds), within which the configured
access concentrator must respond.
Monitoring the TGM550 Media Gateway (VoIP)
J4350 and J6350 Services Routers support voice over IP (VoIP) routing through an
Avaya TGM550 Telephony Gateway Module and one or more Telephony Interface
Modules (TIMs) installed in the router. From the J-Web interface or the JUNOS CLI,
you can monitor the vp-pim/0/0 interface to the TGM550 (see “Monitoring the
Interfaces” on page 113). In addition, you can monitor dynamic call admission control
(CAC) operation, if it is configured on the router WAN interfaces, and also the list of
Media Gateway Controllers (MGCs) configured on the TGM550.
To display TGM550 information, select Monitor>Media Gateway in the J-Web
interface.
Alternatively, enter the following commands in the CLI operational mode:
Using the Monitoring Tools
■
151
J-series™ Services Router Administration Guide
■
show tgm dynamic-call-admission-control
■
show tgm fpc slot-number media-gateway-controller
■
show tgm fpc slot-number dsp-capacity
■
show tgm telephony-interace-module status
Table 79 on page 152 summarizes key output fields in media gateway information
displays.
Table 79: Summary of Key Media Gateway Information Output Fields
Field
Values
Additional Information
Dynamic Call Admission Control Information
Reported Bearer
Bandwidth Limit
Maximum bandwidth available for voice traffic
on the Services Router.
If dynamic CAC is configured on more than one
active interface, the TGM550 reports the bearer
bandwidth limit (BBL) of the active interface with
the highest activation priority.
If more than one active interface has the same
activation priority, the BBL is reported as the
number of those interfaces times their lowest BBL.
For example if two interfaces with the same
activation priority have BBLs of 2000 Kbps and
1500 Kbps, the RBBL is 3000 Kbps (2 x 1500
Kbps).
Interface Name
Name of interface on which dynamic CAC is
configured.
(See the interface naming conventions in the
J-series Services Router Basic LAN and WAN Access
Configuration Guide.)
State
Link state of the interface: Up or Down.
Activation Priority
Activation priority configured on the interface.
Bearer Bandwidth
Limit (Kbps)
Maximum bandwidth available for voice traffic
on the interface.
Telephony Gateway Module Information
Media Gateway
Controller (MGC) List
IP addresses of the MGCs configured in the MGC
list for the TGM550.
Slot state
Online and offline status of the telephony interface
modules (TIMS).
Offline Reason
Reason for offline status: Busy Out or Out of
resources.
152
■
Using the Monitoring Tools
The operational state is the physical state of the
interface. If the interface is physically operational,
even if it is not configured, the operational state
is Up. An operational state of Down indicates a
problem with the physical interface.
Chapter 7: Monitoring the Router and Routing Operations
Table 79: Summary of Key Media Gateway Information Output Fields (continued)
Field
Values
DSP Capacity
Number of voice channels in the low-capacity
DSP.
Additional Information
Using the Monitoring Tools
■
153
J-series™ Services Router Administration Guide
154
■
Using the Monitoring Tools
Chapter 8
Monitoring Events and Managing System
Log Files
J-series Services Routers support configuring and monitoring of system log messages
(also called syslog messages). You can configure files to log system messages and
also assign attributes, such as severity levels, to messages. The View Events page on
the J-Web interface enables you to filter and view system log messages.
This chapter contains the following topics. For more information about system log
messages, see the JUNOS System Log Messages Reference.
If the router is operating in a Common Criteria environment, see the Secure
Configuration Guide for Common Criteria and JUNOS-FIPS.
■
System Log Message Terms on page 155
■
System Log Messages Overview on page 156
■
Before You Begin on page 159
■
Configuring System Log Messages with a Configuration Editor on page 160
■
Monitoring System Log Messages with the J-Web Event Viewer on page 162
System Log Message Terms
Before configuring and monitoring system log messages on Services Routers, become
familiar with the terms defined in Table 80 on page 155.
Table 80: System Log Message Terms
Term
Definition
event
Condition that occurs on a Services Router at a particular time. An event can include routine,
failure, error, emergency or critical conditions.
event ID
System log message code that uniquely identifies a system log message. The code begins with
a prefix indicating the software process or library that generates the event.
facility
Group of messages that either are generated by the same software process (such as accounting
statistics) or concern a similar condition or activity (such as authentication attempts). For a list
of system logging facilities, see Table 81 on page 157.
System Log Message Terms
■
155
J-series™ Services Router Administration Guide
Table 80: System Log Message Terms (continued)
Term
Definition
priority
Combination of the facility and severity level of a system log message. By default, priority
information is not included in system log messages, but you can configure the JUNOS software
to include it. For more information, see the JUNOS System Log Messages Reference. See also
facility; severity level.
process
Software program, also known as a daemon, that controls router functionality. The following
are some key JUNOS processes:
■
Routing protocol process—Controls the routing protocols that run on a Services Router. It
starts the configured routing protocols, handles all routing messages, maintains routing
tables and implements the routing policy.
■
Interface process—Allows you to configure and control the physical and logical interfaces
present in a Services Router. It also enables the JUNOS software to track the status and
condition of the router’s interfaces.
■
Chassis process—Allows you to configure and control the physical properties of a Services
Router, including conditions that trigger alarms.
■
SNMP—Simple Network Management Protocol, which helps administrators monitor the
state of a router.
■
Management process—Controls processes that start and monitor all the other software
processes. The management process starts the command-line interface (CLI), which is the
primary tool used to control and monitor the JUNOS software. It also starts all the software
processes and the CLI when the router starts up. If a software process terminates, the
management process attempts to restart it.
For more information about processes, see the JUNOS Software Installation and Upgrade Guide.
process ID
Identifier uniquely identifying a process. The process ID is displayed in a system log message
along with the name of the process that generates the event.
regular expressions
Set of key combinations that allow you to have control over what you are searching. You can
use regular expressions to filter system log messages by specifying a text string that must (or
must not) appear in a message for the message to be logged. For more information, see “Regular
Expressions” on page 158.
severity level
Measure of how seriously a triggering event affects Services Router functions. For a list of severity
levels that you can specify, see Table 82 on page 158.
System Log Messages Overview
The JUNOS software generates system log messages to record events that occur on
the Services Router, including the following:
156
■
■
Routine operations, such as creation of an Open Shortest Path First (OSPF)
protocol adjacency or a user login into the configuration database
■
Failure and error conditions, such as failure to access a configuration file or
unexpected closure of a connection to a child or peer process
■
Emergency or critical conditions, such as router power-off due to excessive
temperature
System Log Messages Overview
Chapter 8: Monitoring Events and Managing System Log Files
The JUNOS system logging utility is similar to the UNIX syslogd utility. Each system
log message identifies the software process that generated the message and briefly
describes the operation or error that occurred.
Reboot requests are recorded to the system log files, which you can view with the
show log command. Also, you can view the names of any processes running on your
system with the show system processes command.
System Log Message Destinations
You can send system logging information to one or more destinations. The
destinations can be one or more files, one or more remote hosts, the terminals of
one or more users if they are logged in, and the system console.
■
To direct messages to a named file in a local file system, see “Sending System
Log Messages to a File” on page 160.
■
To direct messages to the terminal session of one or more specific users (or all
users) when they are logged into the router, see “Sending System Log Messages
to a User Terminal” on page 161.
■
To direct messages to the router console, see the JUNOS System Log Messages
Reference.
■
To direct messages to a remote machine that is running the UNIX syslogd utility,
see the JUNOS System Log Messages Reference.
System Log Facilities and Severity Levels
When specifying the destination for system log messages, you can specify the class
(facility) of messages to log and the minimum severity level (level) of the message
for each location.
Each system log message belongs to a facility, which is a group of messages that are
either generated by the same software process or concern a similar condition or
activity.
Table 81 on page 157 lists the system logging facilities, and Table 82 on page 158 lists
the system logging severity levels. For more information about system log messages,
see the JUNOS System Log Messages Reference.
Table 81: System Logging Facilities
Facility
Description
any
Any facility
authorization
Any authorization attempt
change-log
Any change to the configuration
cron
Cron scheduling process
daemon
Various system processes
System Log Messages Overview
■
157
J-series™ Services Router Administration Guide
Table 81: System Logging Facilities (continued)
Facility
Description
interactive-commands
Commands executed in the CLI
kernel
Messages generated by the JUNOS kernel
user
Messages from random user processes
Table 82: System Logging Severity Levels
Severity Level (from Highest to
Lowest Severity)
Description
emergency
System panic or other conditions that cause the routing platform to stop functioning.
alert
Conditions that must be corrected immediately, such as a corrupted system database.
critical
Critical conditions, such as hard drive errors.
error
Standard error conditions that generally have less serious consequences than errors in
the emergency, alert, and critical levels.
warning
Conditions that warrant monitoring.
notice
Conditions that are not error conditions but are of interest or might warrant special
handling.
info
Informational messages. This is the default.
debug
Software debugging messages.
Regular Expressions
On the J-Web View Events page, you can use regular expressions to filter and display
a set of messages for viewing. JUNOS supports POSIX Standard 1003.2 for extended
(modern) UNIX regular expressions.
Table 83 on page 159 specifies some of the commonly used regular expression
operators and the terms matched by them. A term can match either a single
alphanumeric character or a set of characters enclosed in square brackets,
parentheses, or braces. For information about how to use regular expression to filter
sytem log messages, see “Filtering System Log Messages” on page 162.
NOTE: On the J-Web View Events page, the regular expression matching is
case-sensitive.
158
■
System Log Messages Overview
Chapter 8: Monitoring Events and Managing System Log Files
Table 83: Common Regular Expression Operators and the Terms They Match
Regular Expression Operator
Matching Terms
. (period)
One instance of any character except the space.
For example, .in matches messages with win or windows.
Zero or more instances of the immediately preceding term.
* (asterisk)
For example, tre* matches messages with tree, tread or trough.
One or more instances of the immediately preceding term.
+ (plus sign)
For example, tre+ matches messages with tree or tread but not trough.
Zero or one instance of the immediately preceding term.
? (question mark)
For example, colou?r matches messages with or color or colour.
One of the terms that appear on either side of the pipe operator.
| (pipe)
For example, gre|ay matches messages with either grey or gray.
! (exclamation point)
Any string except the one specified by the expression, when the exclamation
point appears at the start of the expression. Use of the exclamation point is
specific to JUNOS.
^ (caret)
The start of a line, when the caret appears outside square brackets.
For example, ^T matches messages with This line and not with On this line.
Strings at the end of a line.
$ (dollar sign)
For example, :$ matches messages with the following: and not with 2:00.
One instance of one of the enclosed alphanumeric characters. To indicate a
range of characters, use a hyphen (-) to separate the beginning and ending
characters of the range.
[] (paired square brackets)
For example, [0-9] matches messages with any number.
One instance of the evaluated value of the enclosed term. Parentheses are used
to indicate the order of evaluation in the regular expression.
() (paired parentheses)
For example, dev(/|ice) matches messages with dev/ or device.
Before You Begin
Before you begin configuring and monitoring system log messages, complete the
following tasks:
■
Establish basic connectivity. See the Getting Started Guide for your router.
■
Configure network interfaces. See the J-series Services Router Basic LAN and WAN
Access Configuration Guide.
Before You Begin
■
159
J-series™ Services Router Administration Guide
Configuring System Log Messages with a Configuration Editor
This section contains the following topics:
■
Sending System Log Messages to a File on page 160
■
Sending System Log Messages to a User Terminal on page 161
■
Archiving System Logs on page 161
■
Disabling System Logs on page 162
Sending System Log Messages to a File
You can direct system log messages to a file on the compact flash. The default
directory for log files is /var/log. To specify a different directory on the compact
flash, include the complete pathname. For the list of logging facilities and severity
levels, see Table 81 on page 157 and Table 82 on page 158.
For information about archiving log files, see “Archiving System Logs” on page 161.
The procedure provided in this section sends all security-related information to the
sample file named security.
To send messages to a file:
1.
Navigate to the top of the configuration hierarchy in either the J-Web or CLI
configuration editor.
2.
Perform the configuration tasks described in Table 84 on page 160.
3.
If you are finished configuring the network, commit the configuration.
Table 84: Sending System Log Messages to a File
Task
J-Web Configuration Editor
CLI Configuration Editor
Navigate to the Syslog level in the
configuration hierarchy.
1.
In the J-Web interface, select
Configuration>View and Edit>Edit
Configuration.
From the [edit] hierarchy level,
enter
2.
Next to System, click Configure or Edit.
3.
Next to Syslog, click Configure or Edit.
1.
Next to File, click Add new entry.
2.
In the File name box, type security.
3.
Next to Contents, click Add new entry.
4.
In the Facility list, select authorization.
5.
In the Level list, select info.
Create a file named security, and
send log messages of the
authorization class at the severity
level info to the file.
160
■
Configuring System Log Messages with a Configuration Editor
edit system syslog
Set the filename and the facility
and severity level:
set file security authorization info
Chapter 8: Monitoring Events and Managing System Log Files
Sending System Log Messages to a User Terminal
To direct system log messages to the terminal session of one or more specific users
(or all users) when they are logged into the local Routing Engine, specify one or more
JUNOS usernames. Separate multiple values with spaces, or use the asterisk (*) to
indicate all users who are logged into the local Routing Engine. For the list of logging
facilities and severity levels, see Table 81 on page 157 and Table 82 on page 158.
The procedure provided in this section sends any critical messages to the terminal
of the sample user frank, if he is logged in.
To send messages to a user terminal:
1.
Navigate to the top of the configuration hierarchy in either the J-Web or CLI
configuration editor.
2.
Perform the configuration tasks described in Table 85 on page 161.
3.
If you are finished configuring the network, commit the configuration.
Table 85: Sending Messages to a User Terminal
Task
J-Web Configuration Editor
Navigate to the Syslog level
in the configuration
hierarchy.
1.
In the J-Web interface, select Configuration>View
and Edit>Edit Configuration.
2.
Next to System, click Configure or Edit.
3.
Next to Syslog, click Configure or Edit.
1.
Next to User, click Add new entry.
2.
In the User name box, type frank.
3.
Next to Contents, click Add new entry.
4.
In the Facility list, select any.
5.
In the Level list, select critical.
Send all critical messages to
the user frank.
CLI Configuration Editor
From the [edit] hierarchy level,
enter
edit system syslog
Set the filename and the facility
and severity level:
set user frank any critical
Archiving System Logs
By default, the JUNOS logging utility stops writing messages to a log file when the
file reaches 128 KB in size. It closes the file and adds a numerical suffix, then opens
and directs messages to a new file with the original name. By default, the logging
utility creates up to 10 files before it begins overwriting the contents of the oldest
file. The logging utility by default also limits the users who can read log files to the
root user and users who have the JUNOS maintenance permission.
To enable all users to read log files, include the world-readable statement at the [edit
system syslog archive] hierarchy level. To restore the default permissions, include
the no-world-readable statement. You can include the archive statement at the [edit
system syslog file filename] hierarchy level to configure the number of files, file size,
Configuring System Log Messages with a Configuration Editor
■
161
J-series™ Services Router Administration Guide
and permissions for the specified log file. For configuration details, see the information
about archiving log files in the JUNOS System Basics Configuration Guide.
Disabling System Logs
To disable logging of the messages from a facility, use the facility none configuration
statement. This statement is useful when, for example, you want to log messages of
the same severity level from all but a few facilities. Instead of including a configuration
statement for each facility you want to log, you can configure the any level statement
and then a facility none statement for each facility you do not want to log. For
configuration details, see the information about disabling logging in the JUNOS System
Basics Configuration Guide.
Monitoring System Log Messages with the J-Web Event Viewer
You can use the J-Web interface to filter and view system log messages on a Services
Router. To view system log messages, click Events in the J-Web taskbar. (To view
system log messages with the CLI, use the show log command.)
Figure 12 on page 162 shows the Filter and Event Summary sections in the View
Events page.
To monitor system log messages with an Event Viewer, perform the following tasks:
■
Filtering System Log Messages on page 162
■
Viewing System Log Messages on page 164
Figure 12: View Events Page
ERROR: Unresolved graphic fileref="s020265.gif" not found in
"\\teamsite1\default\main\TechPubsWorkInProgress\STAGING\images\".
Filtering System Log Messages
You can use filters to display relevant events. Table 86 on page 162 describes the
different filters, their functions, and the associated actions. You can apply any or a
combination of the described filters to view the messages that you want to view.
Table 86: Filtering System Log Messages
Field
Function
Your Action
System Log
File
Specifies the name of a system log file for which you want to
display the recorded events.
To specify events recorded in a particular file,
select the system log filename from the
list—for example, messages.
Lists the names of all the system log files that you configure.
By default, a log file, messages, is included in the /var/log/
directory.
For information about how to configure system log files, see
“Sending System Log Messages to a File” on page 160.
162
■
Monitoring System Log Messages with the J-Web Event Viewer
Chapter 8: Monitoring Events and Managing System Log Files
Table 86: Filtering System Log Messages (continued)
Field
Function
Your Action
Event ID
Specifies the Event ID for which you want to display the
messages.
To specify events with a specific ID, type its
partial or complete ID—for example,
TFTPD_AF_ERR.
Allows you to type part of the ID and completes the remaining
automatically.
An event ID, also known as system log message code, uniquely
identifies a system log message. It begins with a prefix that
indicates the generating software process or library.
Text in Event
Description
Specifies text from the description of events that you want to
display.
Allows you to use regular expression to match text from the
event description.
NOTE: The regular expression matching is case sensitive.
To specify events with a specific description,
type a text string from the description with
regular expression.
For example, type ^Initial* to display all
messages with lines beginning with the term
Initial.
For more information about using regular expressions, see
“Regular Expressions” on page 158.
Process
Specifies the name of the process generating the events you
want to display.
To specify events generated by a process, type
the name of the process.
To view all the processes running on your system, enter the
CLI command—show system processes.
For example, type mgd to list all messages
generated by the management process.
For more information about processes, see the JUNOS Software
Installation and Upgrade Guide.
Start Time
Specifies the time period in which the events you want
displayed are generated.
End Time
To specify the time period:
■
Click the box next to Start Time and
select the year, month, date, and
time—for example, 02/10/2006 11:32.
■
Click the box next to End Time and
select the year, month, date, and
time—for example, 02/10/2006 3:32.
Displays a calendar that allows you to select the year, month,
day, and time. It also allows you to select the local time.
By default, the messages generated in the last one hour are
displayed—End Time shows the current time and Start Time
shows the time one hour before end time.
To select the current time as the start time,
select local time.
Number of
Events to
Display
Specifies the number of events to be displayed on the View
Events page.
To view a specified number of events, select
the number from the list—for example, 50.
By default, the View Events page displays 25 events.
OK
Applies the specified filter and displays the matching
messages.
To apply the filter, click OK.
Monitoring System Log Messages with the J-Web Event Viewer
■
163
J-series™ Services Router Administration Guide
Viewing System Log Messages
By default, the View Events page displays the most recent 25 events, with severity
levels highlighted in different colors. After you specify the filters, Event Summary
displays the events matching the specified filters. Click First, Next, Prev, and Last
links to navigate through messages. Table 87 on page 164 describes the Event
Summary fields.
Table 87: Viewing System Log Messages
Field
Function
Time
Displays the time at which the message was logged.
Process
Displays the name and ID of the process that generated the
system log message.
Event ID
Displays a code that uniquely identifies the message.
The prefix on each code identifies the message source, and the
rest of the code indicates the specific event or error.
Displays context-sensitive help that provides more information
about the event:
■
Help—Short description of the message.
■
Description—More detailed explanation of the message.
■
Type—Category to which the message belongs.
■
Severity—Level of severity.
Event
Description
Displays a more detailed explanation of the message.
Severity
Severity level of a message is indicated by different colors.
164
■
■
Unknown—Gray—Indicates no severity level is specified.
■
Debug/Info/Notice—Green— Indicates conditions that are
not errors but are of interest or might warrant special
handling.
■
Warning—Yellow—Indicates conditions that warrant
monitoring.
■
Error—Blue— Indicates standard error conditions that
generally have less serious consequences than errors in
the emergency, alert, and critical levels.
■
Critical—Pink—Indicates critical conditions, such as hard
drive errors.
■
Alert—Orange—Indicates conditions that require
immediate correction, such as a corrupted system
database.
■
Emergency—Red—Indicates system panic or other
conditions that cause the routing platform to stop
functioning.
Monitoring System Log Messages with the J-Web Event Viewer
Additional Information
The event ID begins with a prefix that
indicates the generating software process.
Some processes on a Services Router do not
use codes. This field might be blank in a
message generated from such a process.
An Event can belong to one of the following
Type categories:
■
Error—Indicates an error or failure
condition that might require corrective
action.
■
Event—Indicates a condition or
occurrence that does not generally
require corrective action.
A severity level indicates how seriously the
triggering event affects routing platform
functions. When you configure a location for
logging a facility, you also specify a severity
level for the facility. Only messages from the
facility that are rated at that level or higher are
logged to the specified file.
Chapter 9
Configuring and Monitoring Alarms
Alarms on a J-series Services Router alert you to conditions on a network interface,
on the router chassis, or in the system software that might prevent the router from
operating normally. You can set the conditions that trigger alarms on an interface.
Chassis and system alarm conditions are preset.
An active alarm lights the ALARM LED on the front panel of the router. You can
monitor active alarms from the J-Web interface or the CLI.
This chapter contains the following topics. For more information about alarms, see
the JUNOS System Basics Configuration Guide.
■
Alarm Terms on page 165
■
Alarm Overview on page 166
■
Before You Begin on page 172
■
Configuring Alarms with a Configuration Editor on page 172
■
Checking Active Alarms on page 174
■
Verifying the Alarms Configuration on page 175
Alarm Terms
Before configuring and monitoring alarms on Services Routers, become familiar with
the terms defined in Table 88 on page 165.
Table 88: Alarm Terms
Term
Definition
alarm
Signal alerting you to conditions that might prevent normal operation. On a Services Router, the
alarm signal is the yellow ALARM LED lit on the front of the chassis.
alarm condition
Failure event that triggers an alarm.
alarm severity
Seriousness of the alarm. The level of severity can be either major (red) or minor (yellow).
chassis alarm
Predefined alarm triggered by a physical condition on the router such as a power supply failure,
excessive component temperature, or media failure.
Alarm Terms
■
165
J-series™ Services Router Administration Guide
Table 88: Alarm Terms (continued)
Term
Definition
interface alarm
Alarm triggered by the state of a physical link on a fixed or installed Physical Interface Module
(PIM), such as a link failure or a missing signal.
Interface alarms are triggered by conditions on a T1 (DS1), Fast Ethernet, serial, or T3 (DS3)
physical interface or by conditions on the sp-0/0/0 adaptive services interface for stateful firewall
filter, Network Address Translation (NAT), intrusion detection service (IDS), or IP Security (IPSec)
services.
To enable an interface alarm, you must explicitly set an alarm condition.
system alarm
Predefined alarm triggered by a missing rescue configuration or failure to install a license for a
licensed software feature.
Alarm Overview
Services Router alarms warn you about conditions that can prevent the router from
operating normally.
When an alarm condition triggers an alarm, the Services Router lights the yellow
(amber) ALARM LED on the front panel. When the condition is corrected, the light
turns off.
NOTE: The ALARM LED on the Services Router lights yellow whether the alarm
condition is major (red) or minor (yellow).
This section contains the following topics:
■
Alarm Types on page 166
■
Alarm Severity on page 167
■
Alarm Conditions on page 167
Alarm Types
The Services Router supports three types of alarms:
166
■
Alarm Overview
■
Interface alarms indicate a problem in the state of the physical links on fixed or
installed PIMs. To enable interface alarms, you must configure them.
■
Chassis alarms indicate a failure on the router or one of its component. Chassis
alarms are preset and cannot be modified.
■
System alarms indicate a missing rescue configuration or software license, where
valid. System alarms are preset and cannot be modified, although you can
configure them to appear automatically in the J-Web or CLI display.
Chapter 9: Configuring and Monitoring Alarms
Alarm Severity
Alarms on a Services Router have two severity levels:
■
■
Major (red)—Indicates a critical situation on the router that has resulted from
one of the following conditions. A red alarm condition requires immediate action.
■
One or more hardware components have failed.
■
One or more hardware components have exceeded temperature thresholds.
■
An alarm condition configured on an interface has triggered a critical warning.
Minor (yellow)—Indicates a noncritical condition on the router that, if left
unchecked, might cause an interruption in service or degradation in performance.
A yellow alarm condition requires monitoring or maintenance.
A missing rescue configuration or software license generates a yellow system
alarm.
Alarm Conditions
To enable alarms on a Services Router interface, you must select an alarm condition
and an alarm severity. In contrast, alarm conditions and severity are preconfigured
for chassis alarms and system alarms.
This section contains the following topics:
■
Interface Alarm Conditions on page 167
■
Chassis Alarm Conditions and Corrective Actions on page 170
■
System Alarm Conditions and Corrective Actions on page 172
Interface Alarm Conditions
Table 89 on page 168 lists the interface conditions, sorted by interface type, that you
can configure for an alarm. Each alarm condition can be configured to trigger either
a major (red) alarm or minor a (yellow) alarm. The corresponding configuration
option is included.
For the services stateful firewall filters, NAT, IDS, and IPSec, which operate on an
internal adaptive services module within a Services Router, you can configure alarm
conditions on the integrated services and services interfaces.
Alarm Overview
■
167
J-series™ Services Router Administration Guide
Table 89: Interface Alarm Conditions
Interface
Alarm Condition
Description
Configuration
Option
DS1 (T1)
Alarm indication signal
The normal T1 traffic signal contained a defect
condition and has been replaced by the AIS. A
transmission interruption occurred at the remote
endpoint or upstream of the remote endpoint. This
all-ones signal is transmitted to prevent
consequential downstream failures or alarms.
ais
Yellow alarm
The remote endpoint is in red alarm failure. This
condition is also known as a far end alarm failure.
ylw
Ethernet
Link is down
The physical link is unavailable.
link-down
Integrated
services
Hardware or software failure
On the adaptive services module, either the
hardware associated with the module, or the
software that drives the module, has failed.
failure
Serial
Clear-to-Send signal absent
The remote endpoint of the serial link is not
transmitting a CTS signal. The CTS signal must be
present before data can be transmitted across a
serial link.
cts-absent
Data Carrier Detect signal
absent
The remote endpoint of the serial link is not
transmitting a DCD signal. Because the DCD signal
transmits the state of the router, no signal probably
indicates that the remote endpoint of the serial link
is unavailable.
dcd-absent
Data Set Ready signal absent
The remote endpoint of the serial link is not
transmitting a DSR signal. The DSR signal indicates
that the remote endpoint is ready to receive and
transmit data across the serial link.
dsr-absent
Loss of receive clock
The clock signal from the remote endpoint is not
present. Serial connections require clock signals to
be transmitted from one endpoint and received by
the other endpoint of the link.
loss-of-rx-clock
Loss of transmit clock
The local clock signal is not present. Serial
connections require clock signals to be transmitted
from one endpoint and received by the other
endpoint of the link.
loss-of-tx-clock
168
■
Alarm Overview
Chapter 9: Configuring and Monitoring Alarms
Table 89: Interface Alarm Conditions (continued)
Interface
Alarm Condition
Description
Configuration
Option
Services
Services module hardware
down
A hardware problem has occurred on the Services
Router's services module. This error typically means
that one or more of the CPUs on the module has
failed.
hw-down
Services link down
The link between the Services Router and its services
module is unavailable.
linkdown
Services module held in reset
The Services Router's services module is stuck in
reset mode. If the services module fails to start up
five or more times in a row, the services module is
held in reset mode. Startup fails when the amount
of time from CPU release to CPU halt is less than
300 seconds.
pic-hold-reset
Services module reset
The Services Router's services module is resetting.
The module resets after it crashes or is reset from
the CLI, or when it takes longer than 60 seconds to
start up.
pic-reset
Services module software down
A software problem has occurred on the Services
Router's services module.
sw-down
Alarm indication signal
The normal E3 traffic signal contained a defect
condition and has been replaced by the AIS. A
transmission interruption occurred at the remote
endpoint or upstream of the remote endpoint. This
all-ones signal is transmitted to prevent
consequential downstream failures or alarms.
ais
Loss of signal
No remote E3 signal is being received at the E3
interface.
los
Out of frame
An out-of-frame (OOF) condition has existed for
10 seconds. This alarm applies only to E3 interfaces
configured in frame mode. The OOF failure is cleared
when no OOF or LOS defects have occurred for
20 seconds.
oof
Remote defect indication
An AIS, LOS, or OOF condition exists. This alarm
applies only to E3 interfaces configured in frame
mode.
rdi
E3
Alarm Overview
■
169
J-series™ Services Router Administration Guide
Table 89: Interface Alarm Conditions (continued)
Interface
Alarm Condition
Description
Configuration
Option
T3 (DS3)
Alarm indication signal
The normal T3 traffic signal contained a defect
condition and has been replaced by the AIS. A
transmission interruption occurred at the remote
endpoint or upstream of the remote endpoint. This
all-ones signal is transmitted to prevent
consequential downstream failures or alarms.
ais
Excessive number of zeros
The bit stream received from the upstream host has
more consecutive zeros than are allowed in a T3
frame.
exz
Far-end receive failure
The remote endpoint of the connection has failed.
A FERF differs from a yellow alarm, because the
failure can be any failure, not just an out-of-frame
(OOF) or loss-of-signal (LOS) failure.
ferf
Idle alarm
The Idle signal is being received from the remote
endpoint.
idle
Line code violation
Either the line encoding along the T3 link is
corrupted, or a mismatch between the encoding at
the local and remote endpoints of a T3 connection
occurred.
lcv
Loss of frame
An out-of-frame (OOF) or loss-of-signal (LOS)
condition has existed for 10 seconds. The
loss-of-frame (LOF) failure is cleared when no OOF
or LOS defects have occurred for 20 seconds. A LOF
failure is also called a red failure.
lof
Loss of signal
No remote T3 signal is being received at the T3
interface.
los
Phase-locked loop out of lock
The clocking signals for the local and remote
endpoints no longer operate in lock-step.
pll
Yellow alarm
The remote endpoint is in red alarm failure. This
condition is also known as a far end alarm failure.
ylw
Chassis Alarm Conditions and Corrective Actions
Table 90 on page 171 lists chassis components with preset alarms, the conditions
that can trigger an alarm, the alarm severity, and the action you take to correct the
condition.
170
■
Alarm Overview
Chapter 9: Configuring and Monitoring Alarms
Table 90: Chassis Alarm Conditions and Corrective Actions
Component
Alarm Conditions
Corrective Action
Alarm Severity
Alternative boot media
The Services Router boots from
an alternative boot device.
Typically, the router boots from the
internal compact flash. If you
configured your router to boot from
an alternative boot device, ignore this
alarm condition.
Yellow (minor)
If you did not configure the router to
boot from an alternative boot device,
contact JTAC. (See “Requesting
Technical Support” on page xxi.)
PIM
A PIM has failed.
Replace the failed PIM. (See the
Getting Started Guide for your router.)
Red (major)
Reformat the compact flash and
install a bootable image. (See
“Performing Software Upgrades and
Reboots” on page 179.)
Yellow (minor)
When a PIM fails, it attempts
to reboot. If the Routing Engine
detects that a PIM is rebooting
too often, it shuts down the
PIM.
Routing Engine
An error occurred during the
process of reading or writing
compact flash.
If this remedy fails, you must replace
the failed Routing Engine. To contact
JTAC, see “Requesting Technical
Support” on page xxi.
Routing Engine temperature is
too warm.
Routing Engine fan has failed.
■
Check the room temperature.
(See the Getting Started Guide
for your router.)
■
Check the air flow. (See the
Getting Started Guide for your
router.)
■
Check the fans. (See the Getting
Started Guide for your router.)
If you must replace a fan or the
Routing Engine, contact JTAC.
(See “Requesting Technical
Support” on page xxi.)
■
If the router has an air filter,
check the air filter and replace
it if it appears clogged. (See the
Getting Started Guide for your
router.)
Replace the failed fan. To contact
JTAC, see “Requesting Technical
Support” on page xxi.
Yellow (minor)
Red (major)
Alarm Overview
■
171
J-series™ Services Router Administration Guide
System Alarm Conditions and Corrective Actions
Table 91 on page 172 lists the two preset system alarms, the condition that triggers
each alarm, and the action you take to correct the condition.
Table 91: System Alarm Conditions and Corrective Actions
Alarm Type
Alarm Condition
Corrective Action
Configuration
The rescue configuration is not set.
Set the rescue configuration. For instructions,
see the J-series Services Router Basic LAN and
WAN Access Configuration Guide.
License
You have configured at least one software
feature that requires a feature license, but
no valid license for the feature is currently
installed.
Install a valid license key. For instructions,
see the Getting Started Guide for your router.
NOTE: This alarm indicates that you are in
violation of the software license agreement.
You must install a valid license key to be in
compliance with all agreements.
Before You Begin
Before you begin configuring and monitoring alarms, complete the following tasks:
■
Establish basic connectivity. See the Getting Started Guide for your router.
■
Configure network interfaces. See the J-series Services Router Basic LAN and WAN
Access Configuration Guide.
Configuring Alarms with a Configuration Editor
To configure interface alarms on a Services Router, you must select the network
interface on which to apply an alarm and the condition you to trigger the alarm. For
a list of conditions, see “Interface Alarm Conditions” on page 167.
To configure interface alarms:
172
■
Before You Begin
1.
Navigate to the top of the configuration hierarchy in either the J-Web or CLI
configuration editor.
2.
Perform the configuration tasks described in Table 92 on page 173.
3.
If you are finished configuring the network, commit the configuration.
4.
To verify the alarms configuration, see Displaying Alarm
Configurations on page 175.
5.
To check the status of active alarms, see “Checking Active Alarms” on page 174.
Chapter 9: Configuring and Monitoring Alarms
Table 92: Configuring Interface Alarms
Task
J-Web Configuration Editor
CLI Configuration Editor
Navigate to the Alarm level in the
configuration hierarchy.
1.
From the [edit] hierarchy level, enter
Configure the system to generate a red
interface alarm when a Yellow alarm is
detected on a T1 (DS1) link.
Configure the system to generate a red
interface alarm when a link down failure
is detected on an Ethernet link.
Configure the system to generate the
following interface alarms on a serial
link:
In the J-Web interface, select
Configuration>View and
Edit>Edit Configuration.
2.
Next to Chassis, click Configure or
Edit.
3.
Next to Alarm, click Configure or
Edit.
1.
In the Ds1 field, click Configure.
2.
From the the Ylw list, select red.
3.
Click OK.
1.
In the Ethernet field, click
Configure.
2.
From the Link down list, select red.
3.
Click OK.
1.
In the Serial field, click Configure.
2.
From the Cts absent list, select
yellow.
■
Yellow alarm when no CTS signal
is detected
3.
■
Yellow alarm when no DCD signal
is detected
From the Dcd absent list, select
yellow.
4.
■
Red alarm when the receiver clock
is not detected
From the Loss of rx clock list, select
red.
5.
■
Red alarm when the transmission
clock is not detected
From the Loss of tx clock list, select
red.
6.
Click OK.
edit chassis alarm
Enter
set ds1 ylw red
Enter
set ethernet link–down red
1.
Enter
set serial cts–absent yellow
2.
Enter
set serial dcd–absent yellow
3.
Enter
set serial loss–of–rx–clock red
4.
Enter
set serial loss–of–tx–clock red
Configure the system to generate the
following interface alarms on a T3 link:
■
■
■
Red alarm when the remote
endpoint is experiencing a Red
failure
Yellow alarm when the upstream
bit stream has more consecutive
zeros than are permitted
Red alarm when there is a loss of
signal on the interface
1.
In the T3 field, click Configure.
2.
From the Ylw list, select red.
3.
From the Exz list, select yellow.
4.
From the Los list, select red.
5.
Click OK.
1.
Enter
set t3 ylw red
2.
Enter
set t3 exz yellow
3.
Enter
set t3 los red
Configuring Alarms with a Configuration Editor
■
173
J-series™ Services Router Administration Guide
Table 92: Configuring Interface Alarms (continued)
Task
J-Web Configuration Editor
CLI Configuration Editor
Configure the system to display active
system alarms whenever a user with the
login class admin logs in to the router.
1.
On the main Configuration page
next to System, click Configure or
Edit.
1.
2.
Next to Login, click Configure or
Edit.
2.
3.
In the Class field, click Add new
entry.
4.
In the Class name field, type admin.
5.
Select the Login alarms check box.
6.
Click OK.
To define login classes, see the JUNOS
System Basics Configuration Guide.
Enter
edit system login
Enter
set class admin login-alarms
Checking Active Alarms
The alarm information includes alarm type, alarm severity, and a brief description
for each active alarm on the Services Router. To view the active alarms, select Alarms
in the J-Web interface, or enter the following CLI show commands:
■
show chassis alarms
■
show system alarms
NOTE: If a Services Router has active alarms and you have not displayed the View
Alarms page, Alarms in the taskbar appears in red. After you view the alarms, Alarms
returns to white. If new alarms become active, Alarms is red until you again display
the View Alarms page.
Figure 13 on page 174 shows the View Alarms summary page. Click an alarm in the
list of active alarms to display a detailed alarm message.
Figure 13: J-Web View Alarms Summary Page
ERROR: Unresolved graphic fileref="s020252.gif" not found in
"\\teamsite1\default\main\TechPubsWorkInProgress\STAGING\images\".
Table 93 on page 174 summarizes the output fields on the alarms page.
Table 93: Summary of Key Alarm Output Fields
Field
Values
Additional Information
Alarm Summary
New?
174
Viewed status of the alarm—either Yes (a new alarm)
or No (a previously viewed alarm).
■
Checking Active Alarms
After you have once displayed the View Alarms page,
any new alarms that appear on the page during the same
J-Web session are identified as previously viewed.
Chapter 9: Configuring and Monitoring Alarms
Table 93: Summary of Key Alarm Output Fields (continued)
Field
Values
Additional Information
Received at
Date and time when the alarm condition was
detected.
Severity
Alarm severity—either major (red) or minor (yellow).
A major (red) alarm condition requires immediate action.
A minor (yellow) condition requires monitoring or
maintenance.
Subject
Brief synopsis of the alarm.
Clicking the alarm subject displays a detailed alarm
message.
Detailed Alarm Message
Received at
Date and time when the failure was detected.
Severity
Alarm severity—either major (red) or minor (yellow).
Alarm Type
Category of the alarm:
■
Chassis—Indicates an alarm condition on the
chassis (typically an environmental alarm such
as temperature)
■
Configuration—Indicates that no rescue
configuration is set
■
ETHER—Indicates an alarm condition on an
Ethernet interface
■
DS3—Indicates an alarm condition on a DS3
interface
■
License—Indicates a software license
infringement
■
Serial—Indicates an alarm condition on a serial
interface
■
Services—Indicates an alarm condition on the
services module
A major (red) alarm condition requires immediate action.
A minor (yellow) condition requires monitoring or
maintenance.
Verifying the Alarms Configuration
To verify alarms configuration, perform the following task.
Displaying Alarm Configurations
Purpose
Action
Verify the configuration of the alarms.
From the J-Web interface, select
Configuration>View and Edit>View Configuration Text. Alternatively, from
configuration mode in the CLI, enter the show chassis alarms command.
[edit]
user@host# show chassis alarms
t3 {
Verifying the Alarms Configuration
■
175
J-series™ Services Router Administration Guide
exz yellow;
los red;
ylw red;
}
ds1 {
ylw red;
}
ethernet {
link-down red;
}
serial {
loss-of-rx-clock red;
loss-of-tx-clock red;
dcd-absent yellow;
cts-absent yellow;
}
Meaning
Related Topics
176
■
The sample output in this section displays the following alarm settings (in order).
Verify that the output shows the intended configuration of the alarms.
■
T3 alarms
■
DS1 alarms
■
Ethernet alarms
■
Serial alarms
For more information about the format of a configuration file, see the J-series Services
Router Basic LAN and WAN Access Configuration Guide.
Displaying Alarm Configurations
Part 3
Managing Services Router Software
■
Performing Software Upgrades and Reboots on page 179
■
Managing Files on page 199
Managing Services Router Software
■
177
J-series™ Services Router Administration Guide
178
■
Managing Services Router Software
Chapter 10
Performing Software Upgrades and
Reboots
A J-series Services Router is delivered with the JUNOS software preinstalled. When
you power on the router, it starts (boots) up using its primary boot device. All Services
Routers support a secondary boot device that allows you to back up your primary
boot device and configuration.
As new features and software fixes become available, you must upgrade your software
to use them. Before an upgrade, we recommend that you back up your primary boot
device.
On a Services Router, you can initialize the primary or secondary boot device with
a “snapshot” of the running configuration, default factory configuration, or rescue
configuration. You can also replicate the configuration for use on another J-series
Services Router, or configure the device to receive core dumps for troubleshooting.
If the router has no secondary boot device configured and the primary boot device
becomes corrupted, you can reload the JUNOS recovery software package onto the
corrupted compact flash with either a UNIX or Microsoft Windows computer.
This chapter contains the following topics. For more information about installing and
upgrading JUNOS software, see the JUNOS Software Installation and Upgrade Guide.
■
Upgrade and Downgrade Overview on page 179
■
Before You Begin on page 181
■
Downloading Software Upgrades from Juniper Networks on page 181
■
Installing Software Upgrades with the J-Web Interface on page 182
■
Installing Software Upgrades with the CLI on page 184
■
Downgrading the Software on page 185
■
Configuring Boot Devices on page 186
■
Recovering Primary Boot Devices on page 191
■
Rebooting or Halting a Services Router on page 194
Upgrade and Downgrade Overview
Typically, you upgrade the JUNOS software on a Services Router by downloading a
software image to your router from another system on your local network. Using the
Upgrade and Downgrade Overview
■
179
J-series™ Services Router Administration Guide
J-Web interface or the CLI to upgrade, the router downloads the software image,
decompresses the image, and installs the decompressed software. Finally, you reboot
the router, at which time it boots from the upgraded software.
All JUNOS software is delivered in signed packages that contain digital signatures,
Secure Hash Algorithm (SHA-1) checksums, and Message Digest 5 (MD5) checksums.
For more information about JUNOS software packages, see the JUNOS Software
Installation and Upgrade Guide.
Upgrade Software Packages
An upgrade software package name is in the following format:
package-name-m.nZx.y-distribution.tgz.
■
package-name is the name of the package—for example, junos-jseries.
■
m.n is the software release, with m representing the major release number and
n representing the minor release number—for example, 9.0.
■
Z indicates the type of software release. For example, R indicates released
software, and B indicates beta-level software.
■
x.y represents the software build number and spin number—for example, 1.1.
■
distribution indicates the area for which the software package is
provided—domestic for the United States and Canada and export for worldwide
distribution.
A sample J-series upgrade software package name is junos-jseries-9.0R1-domestic.tgz.
Recovery Software Packages
Download a recovery software package, also known as an install media package, to
recover a primary compact flash.
A recovery software package name is in the following format:
package-name-m.nZxy-export-cfnnn.gz.
■
package-name is the name of the package—for example, junos-jseries.
■
m.n is the software release, with m representing the major release number—for
example, 7.5.
■
Z indicates the type of software release. For example, R indicates released
software, and B indicates beta-level software.
■
x.y represents the software build number and spin number—for example, 1.1.
■
export indicates that the recovery software package is the exported worldwide
software package version.
■
cfnnn indicates the size of the target compact flash in megabytes—for example,
cf256.
The following compact flash sizes are supported:
■
180
■
256 MB
Upgrade and Downgrade Overview
Chapter 10: Performing Software Upgrades and Reboots
■
512 MB
■
1024 MB
Compact flash cards with 128 MB storage capacity are not supported.
A sample J-series recovery software package name is
junos-jseries-9.0R1-export-cf256.gz.
Before You Begin
To download software upgrades, you must have a Juniper Networks Web account
and a valid support contract. To obtain an account, complete the registration form
at the Juniper Networks Web site: https://www.juniper.net/registration/Register.jsp.
Before an upgrade, back up your primary boot device onto a secondary storage
device. If you have a power failure during an upgrade, the primary boot device can
fail or become corrupted. In either case, if a backup device is not available, the router
is unable to boot and come back online. Creating a backup also stores your active
configuration files and log files and ensures that you recover to a known, stable
environment in case of an unsuccessful upgrade.
During a successful upgrade, the upgrade package completely reinstalls the existing
software. It retains configuration files, log files, and similar information from the
previous version.
Use either the J-Web interface or the CLI to back up the primary boot device on one
of the secondary storage devices listed in Table 94 on page 181.
Table 94: Secondary Storage Devices for Backup
Storage Device
Available on Routers
Minimum Storage Required
External compact flash
J4300 and J6300
256 MB
USB storage device
All Services Routers
256 MB
After a successful upgrade, remember to back up the new current configuration to
the secondary device.
For instructions about how to back up your system using the J-Web Interface, see
“Configuring a Boot Device for Backup with the J-Web Interface” on page 186. For
instructions about how to back up your system using the CLI, see “Configuring a
Boot Device for Backup with the CLI” on page 189.
Downloading Software Upgrades from Juniper Networks
Follow these steps to download software upgrades from Juniper Networks:
Before You Begin
■
181
J-series™ Services Router Administration Guide
1.
Using a Web browser, follow the links to the download URL on the Juniper
Networks Web page. Depending on your location, select either Canada and U.S.
Version or Worldwide Version:
■
https://www.juniper.net/support/csc/swdist-domestic/
■
https://www.juniper.net/support/csc/swdist-ww/
2.
Log in to the Juniper Networks Web site using the username (generally your
e-mail address) and password supplied by Juniper Networks representatives.
3.
Using the J-Web interface or the CLI, select the appropriate junos-j-series software
package for your application. For information about JUNOS software packages,
see “Upgrade and Downgrade Overview” on page 179.
4.
Download the software to a local host or to an internal software distribution site.
NOTE: For downloads to J-series Services Routers with 256 MB of flash memory, see
the J-series Services Router Release Notes for special instructions and ensure that you
download the package to your router's /var/tmp/upgrade directory.
Installing Software Upgrades with the J-Web Interface
You can use the J-Web interface to install software upgrades from a remote server
using FTP or HTTP, or by uploading the file to the router. This section contains the
following topics:
■
Installing Software Upgrades from a Remote Server on page 182
■
Installing Software Upgrades by Uploading Files on page 183
Installing Software Upgrades from a Remote Server
You can use the J-Web interface to install software packages on the Services Router
that are retrieved with FTP or HTTP from the location specified.
Figure 14 on page 182 shows the Install Remote page for the router.
Figure 14: Install Remote Page
ERROR: Unresolved graphic fileref="s020259.gif" not found in
"\\teamsite1\default\main\TechPubsWorkInProgress\STAGING\images\".
To install software upgrades from a remote server:
182
■
1.
Download the software package as described in “Downloading Software Upgrades
from Juniper Networks” on page 181.
2.
In the J-Web interface, select Manage>Software>Install Package.
3.
On the Install Remote page, enter information into the fields described in
Table 95 on page 183.
4.
Click Fetch and Install Package. The software is activated after the router has
rebooted.
Installing Software Upgrades with the J-Web Interface
Chapter 10: Performing Software Upgrades and Reboots
Table 95: Install Remote Summary
Field
Function
Your Action
Package Location
(required)
Specifies the FTP or HTTP server, file path, and
software package name.
Type the full address of the software package
location on the FTP or HTTP server—one of the
following:
ftp://hostname/pathname/package-name
http://hostname/pathname/package-name
User
Specifies the username, if the server requires
one.
Type the username.
Password
Specifies the password, if the server requires
one.
Type the password.
Reboot If Required
If this box is checked, the router is
automatically rebooted when the upgrade is
complete.
Check the box if you want the router to reboot
automatically when the upgrade is complete.
Installing Software Upgrades by Uploading Files
You can use the J-Web interface to install software packages uploaded from your
computer to the Services Router.
Figure 15 on page 183 shows the Upload Package page for the router.
Figure 15: Upload Package Page
ERROR: Unresolved graphic fileref="s020260.gif" not found in
"\\teamsite1\default\main\TechPubsWorkInProgress\STAGING\images\".
To install software upgrades by uploading files:
1.
Download the software package as described in “Downloading Software Upgrades
from Juniper Networks” on page 181.
2.
In the J-Web interface, select Manage>Software>Upload Package.
3.
On the Upload Package page, enter information into the fields described in
Table 96 on page 183.
4.
Click Upload Package. The software is activated after the router has rebooted.
Table 96: Upload Package Summary
Field
Function
Your Action
File to Upload (required)
Specifies the location of the software
package.
Type the location of the software package, or click
Browse to navigate to the location.
Reboot If Required
If this box is checked the router is
automatically rebooted when the upgrade is
complete.
Select the check box if you want the router to reboot
automatically when the upgrade is complete.
Installing Software Upgrades with the J-Web Interface
■
183
J-series™ Services Router Administration Guide
Installing Software Upgrades with the CLI
To install software upgrades on a router with the CLI:
1.
If your router has 256 MB of flash memory and 256 MB of RAM, see the special
instructions in the J-series Services Router Release Notes.
2.
Download the software package as described in “Downloading Software Upgrades
from Juniper Networks” on page 181.
3.
If you are installing the software package from a local directory on the router,
copy the JUNOS software package to the router. We recommend that you copy
it to the /var/tmp directory.
4.
Install the new package on the Services Router, entering the following command
in operational mode in the CLI:
user@host> request system software add unlink no-copy source
Replace source with one of the following paths:
■
For a software package that is installed from a local directory on the router,
use /pathname/package-name (for example,
/var/tmp/junos-j-series8.5R2.1.tar.gz)
■
For software packages that are downloaded and installed from a remote
location, use one of the following paths:
■
ftp://hostname/pathname/package-name
or
■
http://hostname/pathname/package-name
By default, the request system software add command uses the validate option
to validate the software package against the current configuration as a prerequisite
to adding the software package. This validation ensures that the router can reboot
successfully after the software package is installed. This is the default behavior
when you are adding a software package.
The unlink option removes the package at the earliest opportunity so that the
router has enough room to complete the installation.
(Optional) The no-copy option specifies that a software package is installed, but
a copy of the package is not saved. Include this option if you do not have enough
space on the compact flash to perform an upgrade that keeps a copy of the
package on the router.
5.
After the software package is installed, reboot the router:
user@host> request system reboot
When the reboot is complete, the router displays the login prompt.
184
■
Installing Software Upgrades with the CLI
Chapter 10: Performing Software Upgrades and Reboots
Downgrading the Software
When you upgrade the JUNOS software, the router creates a backup image of the
software that was previously installed, as well as installs the requested software
upgrade.
To downgrade the software, you can use the backup image of the software that was
previously installed, which is saved on the router. If you revert to the previous image,
this backup image is used, and the image of the running software is deleted. You
can downgrade to only the software release that was installed on the router before
the current release with this method.
Use the procedures as described in “Installing Software Upgrades with the J-Web
Interface” on page 182 and “Installing Software Upgrades with the CLI” on page 184
and specify an older software image as the source image to be upgraded.
Downgrade the JUNOS software on the Services Router with either the J-Web interface
or the CLI.
This section contains the following topics:
■
Downgrading the Software with the J-Web Interface on page 185
■
Downgrading the Software with the CLI on page 185
Downgrading the Software with the J-Web Interface
You can downgrade the software from the J-Web interface. For the changes to take
effect, you must reboot the router.
To downgrade software:
1.
In the J-Web interface, select Manage>Software>Downgrade. The image of
the previous software version (if any) is displayed on this page.
NOTE: After you perform this operation, you cannot undo it.
2.
Select Downgrade to downgrade to the previous version of the software or Cancel
to cancel the downgrade process.
3.
When the downgrade process is complete, for the new software to take effect,
select Manage>Reboot from the J-Web interface to reboot the router.
After you downgrade the software, the previous release is loaded, and you cannot
reload the running version of software again. To downgrade to an earlier version of
software, follow the procedure for upgrading, using the JUNOS software image labeled
with the appropriate release.
Downgrading the Software with the CLI
You can revert to the previous version of software using the request system software
rollback command in the CLI. For the changes to take effect, you must reboot the
Downgrading the Software
■
185
J-series™ Services Router Administration Guide
router. To downgrade to an earlier version of software, follow the procedure for
upgrading, using the JUNOS software image labeled with the appropriate release.
To downgrade software with the CLI:
1.
Enter the request system software rollback command to return to the previous
JUNOS software version:
user@host> request system software rollback
The previous software version is now ready to become active when you next
reboot the router.
2.
Reboot the router:
user@host> request system reboot
The router is now running the previous version of the software.
Configuring Boot Devices
You can configure a boot device to replace the primary boot device on your Services
Router, or to act as a backup boot device. The backup device must have a storage
capacity of at least 256 MB. Use either the J-Web interface or the CLI to take a snapshot
of the configuration currently running on the router, or of the original factory
configuration and a rescue configuration, and save it to an alternate medium.
NOTE: For media redundancy, we recommend that you keep a secondary storage
medium attached to the Services Router and updated at all times.
If the primary storage medium becomes corrupted and no backup medium is in
place, you can recover the primary compact flash from a special JUNOS software
image. You can also configure a boot device to store snapshots of software failures,
for use in troubleshooting.
For information about installing boot devices, see the Getting Started Guide for your
router.
This section contains the following topics:
■
Configuring a Boot Device for Backup with the J-Web Interface on page 186
■
Configuring a Boot Device for Backup with the CLI on page 189
■
Configuring a Boot Device to Receive Software Failure Memory
Snapshots on page 190
Configuring a Boot Device for Backup with the J-Web Interface
You can use the J-Web interface to create a boot device for the Services Router on
an alternate medium, to replace the primary boot device or serve as a backup.
186
■
Configuring Boot Devices
Chapter 10: Performing Software Upgrades and Reboots
Figure 16 on page 187 shows the Snapshot page.
Figure 16: Snapshot Page
ERROR: Unresolved graphic fileref="s020261.gif" not found in
"\\teamsite1\default\main\TechPubsWorkInProgress\STAGING\images\".
To create a boot device:
1.
In the J-Web interface, select Manage>Snapshot.
2.
On the Snapshot page, enter information into the fields described in
Table 97 on page 187.
3.
Click Snapshot.
4.
Click OK.
Table 97: Snapshot Summary
Field
Function
Your Action
Target Media
Specifies the boot device to copy the snapshot
to.
In the list, select a boot device that is not the
active boot device:
NOTE: You cannot copy software to the active
boot device.
■
compact-flash—Copies software to the
internal compact flash.
■
removable-compact-flash—Copies
software to the external compact flash. This
option is available on J2320, J2350, J4300,
and J6300 Services Routers only.
■
usb—Copies software to the device
connected to the USB port.
Factory
Copies only default files that were loaded on the
internal compact flash when it was shipped from
the factory, plus the rescue configuration, if one
has been set.
To copy only the default factory configuration,
plus a rescue configuration if one exists, select
the check box.
NOTE: After a boot device is created with the
default factory configuration, it can operate only
in an internal compact flash slot.
Partition
Partitions the medium. This process is usually
necessary for boot devices that do not already
have software installed on them.
To partition the medium that you are copying
the snapshot to, select the check box.
Configuring Boot Devices
■
187
J-series™ Services Router Administration Guide
Table 97: Snapshot Summary (continued)
Field
Function
Your Action
As Primary Media
On an external compact flash or USB storage
device only, creates a snapshot for use as the
primary boot medium.
To create a boot medium to use in the internal
compact flash only, select the check box.
Use this feature to replace the medium in the
internal compact flash slot or to replicate it for
use in another Services Router. This process also
partitions the boot medium.
NOTE: After the boot device is created as an
internal compact flash, it can operate only in an
internal compact flash slot.
Data Size
Specifies the size of the data partition, in
kilobytes.
Type a numeric value, in kilobytes. The default
value is 0 KB.
The data partition is mounted on /data. This
space is not used by the router, and can be used
for extra storage.
This selection also partitions the boot medium.
Swap Size
Specifies the size of the swap partition, in
kilobytes.
The swap partition is used for swap files and
software failure memory snapshots. Software
failure memory snapshots are saved to the boot
medium only if it is specified as the dump
device.
Type a numeric value, in kilobytes. The default
value is one-third of the physical memory on a
boot medium larger than 128,000 KB, or 0 KB
on a smaller boot device.
For information about the setting the dump
device, see “Configuring a Boot Device to
Receive Software Failure Memory
Snapshots” on page 190.
This selection also partitions the boot medium.
Config Size
Specifies the size of the config partition, in
kilobytes.
Type a numeric value, in kilobytes. The default
value is 10 percent of physical memory on the
boot medium.
The config partition is mounted on /config. The
configuration files are stored in this partition.
This selection also partitions the boot medium.
Root Size
Specifies the size of the root partition, in
kilobytes.
The root partition is mounted on / and does not
include configuration files.
This selection also partitions the boot medium.
188
■
Configuring Boot Devices
Type a numeric value, in kilobytes. The default
value is the boot device's physical memory
minus the config, data, and swap partitions.
Chapter 10: Performing Software Upgrades and Reboots
Configuring a Boot Device for Backup with the CLI
Use the request system snapshot CLI command to create a boot device for the Services
Router on an alternate medium, to replace the primary boot device or serve as a
backup. Enter the command with the following syntax:
user@host> request system snapshot <as-primary> <config-size size> <data-size
size> <factory> <media type> <partition> <root-size size> <swap-size size>
Table 98 on page 189 describes the request system snapshot command options.
Default values are in megabytes, but you can alternatively enter values in kilobytes
by appending k to the number. For example, config-size 10 specifies a config partition
of 10 MB, but config-size 10k specifies a config partition of 10 KB.
Table 98: CLI request system snapshot Command Options
Option
Description
as-primary
On an external compact flash or USB storage device only, creates a snapshot for use as the
primary boot medium.
Use the as-primary option to replace the medium in the internal compact flash slot or to replicate
it for use in another Services Router. This process also partitions the boot medium.
NOTE: After the boot device is created as an internal compact flash, it can operate only in an
internal compact flash slot.
config-size size
Specifies the size of the config partition, in megabytes. The default value is 10 percent of physical
memory on the boot medium.
The config partition is mounted on /config. The configuration files are stored in this partition.
This option also partitions the boot medium.
data-size size
Specifies the size of the data partition, in megabytes. The default value is 0 MB.
The data partition is mounted on /data. This space is not used by the router, and can be used
for extra storage.
This option also partitions the boot medium.
factory
Copies only default files that were loaded on the internal compact flash when it was shipped
from the factory, plus the rescue configuration if one has been set.
NOTE: After the boot medium is created with the factory option, it can operate in only the internal
compact flash slot.
media type
Specifies the boot device the software snapshot is copied to:
■
compact-flash—Copies software to the internal compact flash.
■
removable-compact-flash—Copies software to the external compact flash. This option is
available on J2320, J2350, J4300, and J6300 Services Routers only.
■
usb—Copies software to the device connected to the USB port.
NOTE: You cannot copy software to the active boot device.
Configuring Boot Devices
■
189
J-series™ Services Router Administration Guide
Table 98: CLI request system snapshot Command Options (continued)
Option
Description
partition
Partitions the medium. This option is usually necessary for boot devices that do not have software
already installed on them.
root-size size
Specifies the size of the root partition, in megabytes. The default value is the boot device's physical
memory minus the config, data, and swap partitions.
The root partition is mounted on / and does not include configuration files.
This option also partitions the boot medium.
swap-size size
Specifies the size of the swap partition, in megabytes. The default value is one-third of the physical
memory on a boot medium larger than 128 MB, or 0 MB on a smaller boot device.
The swap partition is used for swap files and software failure memory snapshots. Software failure
memory snapshots are saved to the boot medium only if it is specified as the dump device. For
information about the setting the dump device, see “Configuring a Boot Device to Receive
Software Failure Memory Snapshots” on page 190.
NOTE: This option also partitions the boot medium.
Configuring a Boot Device to Receive Software Failure Memory Snapshots
You can use the set system dump-device CLI command to specify the medium to use
for the Services Router to store system software failure memory snapshots. In this
way, when the operating system fails, if you have specified a system dump device
in the configuration, the operating system preserves a snapshot of the state of the
router when it failed.
After you reboot the system, the dump device is checked for a snapshot as part of
the operating system boot process. If a snapshot is found, it is written to the crash
dump directory on the router (/var/crash). The customer support team can examine
this memory snapshot to help determine the cause of the system software failure.
NOTE: If the swap partition on the dump device medium is not large enough for a
system memory snapshot, either a partial snapshot or no snapshot is written into
the crash dump directory.
Enter the set system dump-device CLI command with the following syntax:
user@host> set system dump-device boot-device | compact-flash |
removable-compact-flash | usb
Table 99 on page 191 describes the set system dump-device command options.
190
■
Configuring Boot Devices
Chapter 10: Performing Software Upgrades and Reboots
Table 99: CLI set system dump-device Command Options
Option
Description
boot-device
Uses whatever device was booted from as the system software failure memory snapshot
device.
compact-flash
Uses the internal compact flash as the system software failure memory snapshot device.
removable-compact-flash
Uses the compact flash on the front of the router (J4300 and J6300 only) as the system
software failure memory snapshot device.
usb
Uses the device attached to the USB port as the system software failure memory
snapshot device.
Recovering Primary Boot Devices
All Services Routers use a compact flash to store the JUNOS software, router
configuration files, and log files. The internal compact flash is not hot-swappable and
is accessible only after you remove the cover on the back panel of the router chassis.
In addition to the internal compact flash, J4300 and J6300 Services Routers have a
slot in the front of the chassis for external flash media. All Services Routers also
support externally pluggable USB storage devices. If the primary storage medium
becomes corrupted and no secondary medium is in place, you can reload the JUNOS
recovery software package onto the corrupted compact flash card with a desktop or
laptop computer running either a UNIX, Microsoft Windows 2000, or Windows XP
operating system.
This section contains the following topics:
■
Why Compact Flash Recovery Might Be Necessary on page 191
■
Recommended Recovery Hardware and Software on page 192
■
Configuring Internal Compact Flash Recovery on page 192
Why Compact Flash Recovery Might Be Necessary
For media redundancy, we recommend that you keep a secondary storage medium
attached and updated at all times. Use the request system snapshot command to
perform the update. (For instructions, see “Configuring Boot Devices” on page 186.)
If the internal compact flash fails at startup, the Services Router automatically boots
itself from the external compact flash or USB storage device. When a redundant
storage medium is not available, the router is unable to boot and does not come
back online. This situation can occur if the power fails during a JUNOS software
upgrade and the physical or logical storage media on the router are corrupted.
If the primary storage medium becomes corrupted and no secondary medium is in
place, you can reload the JUNOS software image onto the corrupted compact flash
with a desktop or laptop computer running either a UNIX, Microsoft Windows 2000,
or Windows XP operating system.
Recovering Primary Boot Devices
■
191
J-series™ Services Router Administration Guide
CAUTION: This procedure does not recover any router configuration files. After you
reinstall the JUNOS software, all the information on the original internal compact
flash is lost.
Recommended Recovery Hardware and Software
Before configuring compact flash recovery, assemble the equipment and software
listed in Table 100 on page 192.
Table 100: Recommended Recovery Hardware and Software
Recommended Hardware and Software
Examples
Recovery Hardware
Host system
Desktop or laptop PC equipped with a PCMCIA controller or USB port
Adapter appropriate for your system
■
For systems with PCMCIA controllers, a compact-flash-to-PCMCIA
adapter—for example, a Macally PCM-CF compact flash PCMCIA adapter.
■
For systems with a USB port, a USB-to-compact-flash adapter. For
example:
■
SIIG USB 2.0 Card Reader, model US2274, part number JU-CF0122
■
MediaGear USB 2.0 Combo 9-in-4, model MGTR100
■
AVP USB 8-in-1 Card Reader, model UC-28
■
Inland Multi-Plus Card Reader, part number 08310
■
HummingBird Multi Card Reader, HCR 81
Recovery Software
Software appropriate for your system
Systems running Windows require additional
software.
■
UNIX with PCMCIA drivers
■
Windows 2000, or Windows XP
■
WinZip, gzip, or a similar compression utility
■
A utility such as the following that allows you to write files to unformatted
devices:
■
Norton Ghost
■
dd utility from the Cygwin package
■
physdiskwrite utility
Configuring Internal Compact Flash Recovery
To recover an internal compact flash with a corrupt or missing operating system,
you must remove the corrupt internal compact from the J-series Services Router,
plug it into a PC with a PCMIA adapter or USB card reader, copy the JUNOS recovery
software package onto it, and reinstall on the router. For instructions about how to
remove and install an internal compact flash, see the Getting Started Guide for your
router.
192
■
Recovering Primary Boot Devices
Chapter 10: Performing Software Upgrades and Reboots
Recovery software packages are available from the same location as J-series upgrade
software packages. (See “Downloading Software Upgrades from Juniper
Networks” on page 181.)
To recover an internal compact flash:
1.
Plug the compact flash into a PCMCIA adapter or USB card reader.
2.
Plug the PCMCIA adapter or USB card reader into the host PC and verify that the
compact flash is recognized by the operating system.
3.
Select the appropriate recovery software package according to the size of your
compact flash. The uncompressed package must have the same size as the target
compact flash capacity: 128 MB, 256 MB, 512 MB or 1024 MB. The recovery
software package name indicates the size of the package. For information about
recovery software package names, see “Upgrade and Downgrade
Overview” on page 179.
4.
Copy the software package to a temporary directory on the host PC and
uncompress it with a compression utility, such as WinZip.
5.
Copy the uncompressed software package from the temporary directory to the
compact flash with one of the following commands:
CAUTION: You must use the correct target device name. Failure to do so might
damage other storage devices connected to the host PC.
■
On a UNIX PC, use the command dd if=filename of=/dev/device_name.
Replace filename with the name of the uncompressed image, and device_name
with the name of the unformatted PCMCIA card device. For example:
root# dd if=junos-jseries-7.0–20041028.0–export-cf128 of=/dev/hde
250368+0 records in250368+0 records out
■
On a Windows 2000 or Windows XP PC, use the Norton Ghost, dd, or
physdiskwrite utility. The following example shows the use of physdiskwrite:
C:\> physdiskwrite —u junos-jseries-7.0–20041028.0–export-cf512
physdiskwrite v0.5 by Manuel Kasper
Searching for physical drives...
Information for \\.\PhysicalDrive0:
Windows: cyl: 2432
tpc: 255
spt: 63
C/H/S: 16383/16/63
Model: HITACHI_DK23DA-20
Serial number: 123ABC
Firmware rev.: 00J2A0G0
Information for \\.\PhysicalDrive1:
Windows: cyl: 125
tpc: 255
spt: 63
Which disk do you want to write? (0..1) 1
Recovering Primary Boot Devices
■
193
J-series™ Services Router Administration Guide
WARNING: that disk is larger than 800 MB! Make sure you're
not accidentally overwriting your primary hard disk!
Proceeding on your own risk...
About to overwrite the contents of disk 1 with new data.
Proceed? (y/n) y
511451136/511451136 bytes written in total
NOTE: The copy process can take several minutes.
After copying the software package to the compact flash, you can use it as the internal
compact flash in any J-series Services Router. For installation instructions, see the
Getting Started Guide for your router.
Rebooting or Halting a Services Router
Reboot or halt a Services Router with either the J-Web interface or the CLI. This
section contains the following topics:
■
Rebooting or Halting a Services Router with the J-Web Interface on page 194
■
Rebooting a Services Router with the CLI on page 195
■
Halting a Services Router with the CLI on page 196
Rebooting or Halting a Services Router with the J-Web Interface
You can use the J-Web interface to schedule a reboot or halt the Services Router.
Figure 17 on page 194 shows the Reboot page for the router.
Figure 17: Reboot Page
ERROR: Unresolved graphic fileref="s020262.gif" not found in
"\\teamsite1\default\main\TechPubsWorkInProgress\STAGING\images\".
To reboot or halt the router with the J-Web interface:
194
■
1.
In the J-Web interface, select Manage>Reboot.
2.
Select one of the following options:
■
Reboot Immediately—Reboots the router immediately.
■
Reboot in number of minutes—Reboots the router in the number of minutes
from now that you specify.
■
Reboot when the system time is hour:minute—Reboots the router at the
absolute time that you specify, on the current day. You must select a 2-digit
hour in 24-hour format, and a 2-digit minute.
■
Halt Immediately—Stops the router software immediately. After the router
software has stopped, you can access the router through the console port
only.
Rebooting or Halting a Services Router
Chapter 10: Performing Software Upgrades and Reboots
3.
Choose the boot device from the Reboot from media list:
■
compact-flash—Reboots from the internal compact flash. This selection is
the default choice.
■
removable-compact-flash—Reboots from the optional external compact
flash. This selection is available on J2320, J2350, J4300, and J6300 Services
Routers only.
■
usb—Reboots from the USB storage device.
4.
(Optional) In the Message box, type a message to be displayed to any users on
the router before the reboot occurs.
5.
Click Schedule. The J-Web interface requests confirmation to perform the reboot
or halt.
6.
Click OK to confirm the operation.
■
If the reboot is scheduled to occur immediately, the router reboots. You
cannot access the J-Web interface until the router has restarted and the boot
sequence is complete. After the reboot is complete, refresh the browser
window to display the J-Web interface login page.
■
If the reboot is scheduled to occur in the future, the Reboot page displays
the time until reboot. You have the option to cancel the request by clicking
Cancel Reboot on the J-Web interface Reboot page.
■
If the router is halted, all software processes stop and you can access the
router through the console port only. Reboot the router by pressing any key
on the keyboard.
NOTE: If you cannot connect to the router through the console port, shut down the
router by pressing and holding the power button on the front panel until the POWER
LED turns off. After the router has shut down, you can power on the router by pressing
the power button again. The POWER LED lights during startup and remains steadily
green when the router is operating normally.
Rebooting a Services Router with the CLI
You can use the request system reboot CLI command to schedule a reboot of the
Services Router:
user@host> request system reboot <at time> <in minutes> <media type> <message
“text”>
Table 101 on page 195 describes the request system reboot command options.
Table 101: CLI Request System Reboot Command Options
Option
Description
none
Same as at now (reboots the router immediately).
Rebooting or Halting a Services Router
■
195
J-series™ Services Router Administration Guide
Table 101: CLI Request System Reboot Command Options (continued)
Option
Description
at time
Specifies the time at which to reboot the router. You can specify time in one of the
following ways:
■
now—Reboots the router immediately. This is the default.
■
+minutes—Reboots the router in the number of minutes from now that you specify.
■
yymmddhhmm—Reboots the router at the absolute time on the date you specify.
Enter the year, month, day, hour (in 24-hour format), and minute.
■
hh:mm—Reboots the router at the absolute time you specify, on the current day.
Enter the time in 24-hour format, using a colon (:) to separate hours from minutes.
in minutes
Specifies the number of minutes from now to reboot the router. This option is a
synonym for the at +minutes option.
media type
Specifies the boot device to boot the router from:
■
compact-flash—Reboots from the internal compact flash. This is the default.
■
removable-compact-flash—Reboots from the optional external compact flash. This
option is available on J2320, J2350, J4300, and J6300 Services Routers only.
■
message "text"
usb—Reboots from the USB storage device.
Provides a message to display to all system users before the router reboots.
Halting a Services Router with the CLI
You can use the request system halt CLI command to halt the Services Router:
user@host> request system halt <at time> <in minutes> <media type> <message “text”>
When the router is halted, all software processes stop and you can access the router
through the console port only. Reboot the router by pressing any key on the keyboard.
NOTE: If you cannot connect to the router through the console port, shut down the
router by pressing and holding the power button on the front panel until the POWER
LED turns off. After the router has shut down, you can power on the router by pressing
the power button again. The POWER LED lights during startup and remains steadily
green when the router is operating normally.
Table 102 on page 196 describes the request system halt command options.
Table 102: CLI Request System Halt Command Options
Option
Description
none
Same as at now (stops software processes on the router immediately).
196
■
Rebooting or Halting a Services Router
Chapter 10: Performing Software Upgrades and Reboots
Table 102: CLI Request System Halt Command Options (continued)
Option
Description
at time
Time at which to stop the software processes on the router. You can specify time in
one of the following ways:
■
now—Stops the software processes immediately. This is the default.
■
+minutes—Stops the software processes in the number of minutes from now that
you specify.
■
yymmddhhmm—Stops the software processes at the absolute time you specify.
Enter the year, month, day, hour (in 24-hour format), and minute.
■
hh:mm—Stops the software processes at the absolute time that you specify, on
the current day. Enter the time in 24-hour format, using a colon (:) to separate
hours from minutes.
in minutes
Specifies the number of minutes from now to stop the software processes on the router.
This option is a synonym for the at +minutes option.
media type
Specifies the boot device to boot the router from after the halt:
■
compact-flash—Reboots from the internal compact flash. This is the default.
■
removable-compact-flash—Reboots from the optional external compact flash. This
option is available on J2320, J2350, J4300, and J6300 Services Routers only.
■
message "text"
usb—Reboots from the USB storage device.
Provides a message to display to all system users before the software processes on the
router are stopped.
Rebooting or Halting a Services Router
■
197
J-series™ Services Router Administration Guide
198
■
Rebooting or Halting a Services Router
Chapter 11
Managing Files
You can use the J-Web interface to perform routine file management operations such
as archiving log files and deleting unused log files, cleaning up temporary files and
crash files, and downloading log files from the routing platform to your computer.
You can also encrypt the configuration files with the CLI configuration editor to
prevent unauthorized users from viewing sensitive configuration information.
This chapter contains the following topics. For more information about system
management, see the JUNOS System Basics Configuration Guide.
■
Before You Begin on page 199
■
Managing Files with the J-Web Interface on page 199
■
Deleting the Backup Software Image on page 201
■
Cleaning Up Files with the CLI on page 201
■
Managing Accounting Files on page 202
■
Encrypting and Decrypting Configuration Files on page 203
Before You Begin
Before you perform any file management tasks, you must perform the initial Services
Router configuration described in the Getting Started Guide for your router.
Managing Files with the J-Web Interface
This section contains the following topics:
■
Cleaning Up Files on page 199
■
Downloading Files on page 200
Cleaning Up Files
You can use the J-Web interface to rotate log files and delete unnecessary files on
the Services Router. If you are running low on storage space, the file cleanup
procedure quickly identifies files that can be deleted.
The file cleanup procedure performs the following tasks:
Before You Begin
■
199
J-series™ Services Router Administration Guide
■
Rotates log files—All information in the current log files is archived, old archives
are deleted, and fresh log files are created.
■
Deletes log files in /var/log—Any files that are not currently being written to are
deleted.
■
Deletes temporary files in /var/tmp—Any files that have not been accessed within
two days are deleted.
■
Deletes all crash files in /var/crash—Any core files that the router has written
during an error are deleted.
■
Deletes all software images (*.tgz files) in /var/sw/pkg—Any software images
copied to this directory during software upgrades are deleted.
Figure 18 on page 200 shows the Clean Up Files page.
Figure 18: Clean Up Files Page
ERROR: Unresolved graphic fileref="s020245.gif" not found in
"\\teamsite1\default\main\TechPubsWorkInProgress\STAGING\images\".
To rotate log files and delete unnecessary files with the J-Web interface:
1.
In the J-Web interface, select Manage>Files.
2.
In the Clean Up Files section, click Clean Up Files. The router rotates log files
and identifies the files that can be safely deleted.
The J-Web interface displays the files that you can delete and the amount of
space that will be freed on the file system.
3.
Click one of the following buttons on the confirmation page:
■
To delete the files and return to the Files page, click OK.
■
To cancel your entries and return to the list of files in the directory, click
Cancel.
Downloading Files
You can use the J-Web interface to download a copy of an individual file from the
Services Router. When you download a file, it is not deleted from the file system.
Figure 19 on page 200 shows the J-Web page from which you can download log files.
Figure 19: Log Files Page (Download)
ERROR: Unresolved graphic fileref="s020246.gif" not found in
"\\teamsite1\default\main\TechPubsWorkInProgress\STAGING\images\".
To download files with the J-Web interface:
200
■
1.
In the J-Web interface, select Manage>Files.
2.
In the Download and Delete Files section, click one of the following file types:
Managing Files with the J-Web Interface
Chapter 11: Managing Files
■
Log Files—Lists the log files located in the /var/log directory on the router.
■
Temporary Files—Lists the temporary files located in the /var/tmp directory
on the router.
■
Old JUNOS Software—Lists the software images (*.tgz files) in the
/var/sw/pkg directory on the router.
■
Crash (Core) Files—Lists the core files located in the /var/crash directory
on the router.
The J-Web interface displays the files located in the directory.
3.
To download an individual file, click Download.
4.
Choose a location for the browser to save the file.
The file is downloaded.
Deleting the Backup Software Image
J-series software keeps a backup image of the software that was previously installed
so that you can downgrade to that version of the software if necessary. You can use
the J-Web interface to delete this backup image. If you delete this image, you cannot
downgrade to this particular version of the software.
To delete the backup software image:
1.
In the J-Web interface, select Manage>Files.
2.
In the Delete Backup JUNOS Package section, review the backup image
information listed.
3.
To delete the backup image, click the Delete backup JUNOS package link.
4.
Click one of the following buttons on the confirmation page:
■
To delete the backup image and return to the Files page, click OK.
■
To cancel the deletion of the backup image and return to the Files page, click
Cancel.
Cleaning Up Files with the CLI
You can use the request system storage cleanup command to rotate log files and
delete unnecessary files on the Services Router. If you are running low on storage
space, the file cleanup procedure quickly identifies files that can be deleted.
The file cleanup procedure performs the following tasks:
Deleting the Backup Software Image
■
201
J-series™ Services Router Administration Guide
■
Rotates log files—All information in the current log files is archived, old archives
are deleted, and fresh log files are created.
■
Deletes log files in /var/log—Any files that are not currently being written to are
deleted.
■
Deletes temporary files in /var/tmp—Any files that have not been accessed within
two days are deleted.
■
Deletes all crash files in /var/crash—Any core files that the router has written
during an error are deleted.
■
Deletes all software images (*.tgz files) in /var/sw/pkg—Any software images
copied to this directory during software upgrades are deleted.
To rotate log files and delete unnecessary files with the CLI:
1.
Enter operational mode in the CLI.
2.
To rotate log files and identify the files that can be safely deleted, enter the
following command:
user@host> request system storage cleanup
The router rotates log files and displays the files that you can delete.
3.
Enter yes at the prompt to delete the files.
NOTE: You can issue the request system storage cleanup dry-run command to review
the list of files that can be deleted with the request system storage cleanup command,
without actually deleting the files.
Managing Accounting Files
If you configure your system to capture accounting data in log files, set the location
for accounting files to the DRAM.
The default location for accounting files is the cfs/var/log directory on the compact
flash. The nonpersistent option minimizes the read/write traffic to your compact
flash. We recommend that you use the nonpersistent option for all accounting files
configured on your system.
To store accounting log files in DRAM instead of the compact flash:
1.
Enter the configuration mode in the CLI.
2.
To create an accounting data log file in DRAM, enter the following command,
replacing filename with the name of the file:
user@host> edit accounting-options file filename
3.
202
■
To store accounting log files in the DRAM file, enter the following command:
Managing Accounting Files
Chapter 11: Managing Files
user@host> set file filename nonpersistent
For more information about the nonpersistent option, see the JUNOS Network
Management Configuration Guide.
CAUTION: If log files for accounting data are stored on DRAM, these files are lost
when the router reboots. Therefore, we recommend that you back up these files
periodically.
Encrypting and Decrypting Configuration Files
Configuration files contain sensitive information such as IP addresses. By default,
the Services Router stores configuration files in unencrypted format on an external
compact flash. This storage method is considered a security risk because the compact
flash can easily be removed from the Services Router. To prevent unauthorized users
from viewing sensitive information in configuration files, you can encrypt them.
If your router runs the Canada and U.S. version of the JUNOS software, the
configuration files can be encrypted with the Advanced Encryption Standard (AES)
or Data Encryption Standard (DES) encryption algorithms. If your router runs the
international version of the JUNOS software, the files can be encrypted only with
DES.
To prevent unauthorized access, the encryption key is stored in the Services Router's
EEPROM. You can copy the encrypted configuration files to another router and
decrypt them if that router has the same encryption key. To prevent encrypted
configuration files from being copied to another router and decrypted, you can set
a unique encryption key that contains the chassis serial number of your router.
Configuration files that are encrypted with a unique encryption key cannot be
decrypted on any other router.
The encryption process encrypts only the configuration files in the /config and
/var/db/config directories. Files in subdirectories under these directories are not
encrypted. The filenames of encrypted configuration files have the extension
.gz.jc—for example, juniper.conf.gz.jc.
NOTE: You must have superuser privileges to encrypt or decrypt configuration files.
This section contains the following topics:
■
Encrypting Configuration Files on page 204
■
Decrypting Configuration Files on page 205
■
Modifying the Encryption Key on page 205
Encrypting and Decrypting Configuration Files
■
203
J-series™ Services Router Administration Guide
Encrypting Configuration Files
To encrypt configuration files on a Services Router:
1.
Enter operational mode in the CLI.
2.
To configure an encryption key in EEPROM and determine the encryption
process, enter one of the request system set-encryption-key commands described
in Table 103 on page 204.
Table 103: request system set-encryption-key Commands
CLI Command
Description
request system set-encryption-key
Sets the encryption key and enables default configuration file encryption as follows:
■
AES encryption for the Canada and U.S. version of the JUNOS software
■
DES encryption for the international version of the JUNOS software
request system set-encryption-key
algorithm des
Sets the encryption key and specifies configuration file encryption by DES.
request system set-encryption-key
unique
Sets the encryption key and enables default configuration file encryption with a unique
encryption key that includes the chassis serial number of the Services Router.
Configuration files encrypted with the unique key can be decrypted only on the current
router. You cannot copy such configuration files to another router and decrypt them.
request system set-encryption-key des
unique
Sets the encryption key and specifies configuration file encryption by DES with a
unique encryption key.
For example:
user@host> request system set-encryption-key
Enter EEPROM stored encryption key:
3.
At the prompt, enter the encryption key. The encryption key must have at least
6 characters.
Enter EEPROM stored encryption key:juniper1
Verifying EEPROM stored encryption key:
4.
At the second prompt, reenter the encryption key.
5.
Enter configuration mode in the CLI.
6.
To enable configuration file encryption to take place, enter the following
commands:
user@host# edit system
204
■
Encrypting and Decrypting Configuration Files
Chapter 11: Managing Files
user@host# set encrypt-configuration-files
7.
To begin the encryption process, commit the configuration.
user@host# commit
commit complete
Decrypting Configuration Files
To disable the encryption of configuration files on a Services Router and make them
readable to all:
1.
Enter operational mode in the CLI.
2.
To verify your permission to decrypt configuration files on this router, enter the
following command and the encryption key for the router:
user@host> request system set-encryption-key
Enter EEPROM stored encryption key:
Verifying EEPROM stored encryption key:
3.
At the second prompt, reenter the encryption key.
4.
Enter configuration mode in the CLI.
5.
To enable configuration file decryption, enter the following commands:
user@host# edit system
user@host# set no-encrypt-configuration-files
6.
To begin the decryption process, commit the configuration.
user@host# commit
commit complete
Modifying the Encryption Key
When you modify the encryption key, the configuration files are decrypted and then
reencrypted with the new encryption key.
Encrypting and Decrypting Configuration Files
■
205
J-series™ Services Router Administration Guide
To modify the encryption key:
1.
Enter operational mode in the CLI.
2.
To configure a new encryption key in EEPROM and determine the encryption
process, enter one of the request system set-encryption-key commands described
in Table 103 on page 204. For example:
user@host> request system set-encryption-key
Enter EEPROM stored encryption key:
3.
At the prompt, enter the new encryption key. The encryption key must have at
least 6 characters.
Enter EEPROM stored encryption key:juniperone
Verifying EEPROM stored encryption key:
4.
206
■
At the second prompt, reenter the new encryption key.
Encrypting and Decrypting Configuration Files
Part 4
Diagnosing Performance and Network
Problems
■
Using Services Router Diagnostic Tools on page 209
■
Configuring Packet Capture on page 253
■
Configuring RPM Probes on page 267
Diagnosing Performance and Network Problems
■
207
J-series™ Services Router Administration Guide
208
■
Diagnosing Performance and Network Problems
Chapter 12
Using Services Router Diagnostic Tools
J-series Services Routers support a suite of J-Web tools and CLI operational mode
commands for evaluating system health and performance. Diagnostic tools and
commands test the connectivity and reachability of hosts in the network.
This chapter contains the following topics. For complete descriptions of CLI operational
mode commands, see the JUNOS System Basics and Services Command Reference, the
JUNOS Interfaces Command Reference, and the JUNOS Routing Protocols and Policies
Command Reference.
■
Diagnostic Terms on page 209
■
Diagnostic Tools Overview on page 210
■
Before You Begin on page 215
■
Pinging Hosts from the J-Web Interface on page 216
■
Checking MPLS Connections from the J-Web Interface on page 219
■
Tracing Unicast Routes from the J-Web Interface on page 223
■
Capturing and Viewing Packets with the J-Web Interface on page 226
■
Using CLI Diagnostic Commands on page 230
Diagnostic Terms
Before diagnosing J-series Services Routers, become familiar with the terms defined
in Table 104 on page 209.
Table 104: J-series Diagnostic Terms
Term
Definition
Don't Fragment (DF) bit
Bit in the IP header that instructs routers not to fragment a packet. You might set this bit if the
destination host cannot reassemble the packet or if you want to test the path maximum
transmission unit (MTU) for a destination host.
routing instance
Collection of routing tables, interfaces, and routing protocol interfaces. The set of interfaces
belongs to the routing tables, and the routing protocol parameters control the information in the
routing tables.
loose source routing
Option in the IP header used to route a packet based on information supplied by the source. A
gateway or host must route the packet using the routers specified by this information, but the
packet can use other routers along the way.
Diagnostic Terms
■
209
J-series™ Services Router Administration Guide
Table 104: J-series Diagnostic Terms (continued)
Term
Definition
strict source routing
Option in the IP header used to route a packet based on information supplied by the source. A
gateway or host must route the packet exactly as specified by this information.
time to live (TTL)
Value (octet) in the IP header that is (usually) decremented by 1 for each hop the packet passes
through. If the field reaches zero, the packet is discarded and a corresponding error message is
sent to the source of the packet.
type of service (TOS)
Value (octet) in the IP header that defines the service the source host requests, such as the
packet's priority and the preferred delay, throughput, and reliability.
Diagnostic Tools Overview
Use the J-Web Diagnose options to diagnose a Services Router. J-Web results are
displayed in the browser.
You can also diagnose the router with CLI operational mode commands. CLI command
output appears on the screen of your console or management device, or you can
filter the output to a file.
This section contains the following topics. To filter output to a file, see “Filtering
Command Output” on page 105.
■
J-Web Diagnostic Tools Overview on page 210
■
CLI Diagnostic Commands Overview on page 211
■
MPLS Connection Checking on page 213
J-Web Diagnostic Tools Overview
The J-Web diagnostic tools consist of the options that appear when you select
Diagnose and Manage in the task bar. Table 105 on page 210 describes the functions
of the Diagnose and Manage options.
Table 105: J-Web Interface Diagnose and Manage Options
Option
Function
Diagnose Options
Ping Host
Allows you to ping a remote host. You can configure advanced options for the ping operation.
For details, see “Using the J-Web Ping Host Tool” on page 216.
Ping MPLS
Allows you to ping an MPLS endpoint using various options.
For details, see “MPLS Connection Checking” on page 213.
210
■
Diagnostic Tools Overview
Chapter 12: Using Services Router Diagnostic Tools
Table 105: J-Web Interface Diagnose and Manage Options (continued)
Option
Function
Traceroute
Allows you to trace a route between the Services Router and a remote host. You can configure advanced
options for the traceroute operation.
For details, see “Tracing Unicast Routes from the J-Web Interface” on page 223.
Packet Capture
Allows you to capture and analyze router control traffic.
For details, see “Capturing and Viewing Packets with the J-Web Interface” on page 226.
Manage Options
Files
Allows you manage log, temporary, and core files on the Services Router.
For details, see “Managing Files with the J-Web Interface” on page 199.
Upgrade
Allows you to upgrade and manage Services Router software packages.
For details, see “Performing Software Upgrades and Reboots” on page 179.
Licenses
Displays a summary of the licenses needed and used for each feature that requires a license. Allows you
to add licenses.
For details, see the Getting Started Guide for your router.
Reboot
Allows you to reboot the Services Router at a specified time.
For details, see “Rebooting or Halting a Services Router with the J-Web Interface” on page 194.
CLI Diagnostic Commands Overview
The CLI commands available in operational mode allow you to perform the same
monitoring, troubleshooting, and management tasks you can perform with the J-Web
interface. Instead of invoking the tools through a graphical interface, you use
operational mode commands to perform the tasks.
Because the CLI is a superset of the J-Web interface, you can perform certain tasks
only through the CLI. For example, you can use the mtrace command to display trace
information about a multicast path from a source to a receiver, which is a feature
available only through the CLI.
To view a list of top-level operational mode commands, type a question mark (?) at
the command-line prompt. (See the Getting Started Guide for your router.)
At the top level of operational mode are the broad groups of CLI diagnostic commands
listed in Table 106 on page 212.
Diagnostic Tools Overview
■
211
J-series™ Services Router Administration Guide
Table 106: CLI Diagnostic Command Summary
Command
Function
Controlling the CLI Environment
Configures the CLI display.
set option
Diagnosis and Troubleshooting
clear
Clears statistics and protocol database information.
mtrace
Traces information about multicast paths from source to receiver.
For details, see “Tracing Multicast Routes from the CLI” on page 240.
Performs real-time debugging of various software components, including the
routing protocols and interfaces.
monitor
For details, see the following sections:
■
Using the monitor interface Command on page 245
■
Using the monitor traffic Command on page 246
■
Displaying Log and Trace Files from the CLI on page 244
Determines the reachability of a remote network host.
ping
For details, see “Pinging Hosts from the CLI” on page 230.
Determines the reachability of an MPLS endpoint using various options.
ping mpls
For details, see “MPLS Connection Checking” on page 213.
test
Tests the configuration and application of policy filters and AS path regular
expressions.
traceroute
Traces the route to a remote network host.
For details, see “Tracing Unicast Routes from the CLI” on page 237.
Connecting to Other Network Systems
Opens secure shell connections.
ssh
For details, see “Using the ssh Command” on page 25.
Opens Telnet sessions to other hosts on the network.
telnet
For details, see “Using the telnet Command” on page 24.
Management
copy
Copies files from one location on the Services Router to another, from the router
to a remote system, or from a remote system to the router.
restart option
Restarts the various JUNOS software processes, including the routing protocol,
interface, and SNMP processes.
request
Performs system-level operations, including stopping and rebooting the Services
Router and loading JUNOS software images.
212
■
Diagnostic Tools Overview
Chapter 12: Using Services Router Diagnostic Tools
Table 106: CLI Diagnostic Command Summary (continued)
Command
Function
start
Exits the CLI and starts a UNIX shell.
configuration
Enters configuration mode.
For details, see the Getting Started Guide for your router.
Exits the CLI and returns to the UNIX shell.
quit
MPLS Connection Checking
Use either the J-Web ping MPLS diagnostic tool or the CLI ping mpls command to
diagnose the state of label-switched paths (LSPs), Layer 2 and Layer 3 virtual private
networks (VPNs), and Layer 2 circuits.
When you use the ping MPLS feature from a Services Router operating as the inbound
(ingress) node at the entry point of an LSP or VPN, the router sends probe packets
into the LSP or VPN. Based on how the LSP or VPN outbound (egress) node at the
remote endpoint of the connection replies to the probes, you can determine the
connectivity of the LSP or VPN.
Each probe is an echo request sent to the LSP or VPN exit point as an MPLS packet
with a UDP payload. If the outbound node receives the echo request, it checks the
contents of the probe and returns a value in the UDP payload of the response packet.
If the Services Router receives the response packet, it reports a successful ping
response.
Responses that take longer than 2 seconds are identified as failed probes.
Table 107 on page 213 summarizes the options for using either the J-Web ping MPLS
diagnostic tool or the CLI ping mpls command to display information about MPLS
connections in VPNs and LSPs.
Table 107: Options for Checking MPLS Connections
J-Web Ping MPLS
Tool
ping mpls Command
Purpose
Additional Information
Ping RSVP-signaled LSP
ping mpls rsvp
Checks the operability of an LSP that
has been set up by the Resource
Reservation Protocol (RSVP). The
Services Router pings a particular LSP
using the configured LSP name.
When an RSVP-signaled LSP has
several paths, the Services Router
sends the ping requests on the path
that is currently active.
Diagnostic Tools Overview
■
213
J-series™ Services Router Administration Guide
Table 107: Options for Checking MPLS Connections (continued)
J-Web Ping MPLS
Tool
ping mpls Command
Purpose
Additional Information
Ping LDP-signaled LSP
ping mpls ldp
Checks the operability of an LSP that
has been set up by the Label
Distribution Protocol (LDP). The
Services Router pings a particular LSP
using the forwarding equivalence
class (FEC) prefix and length.
When an LDP-signaled LSP has
several gateways, the Services Router
sends the ping requests through the
first gateway.
Ping requests sent to LDP-signaled
LSPs use only the master routing
instance.
Ping LSP to Layer 3
VPN prefix
ping mpls l3vpn
Checks the operability of the
connections related to a Layer 3 VPN.
The Services Router tests whether a
prefix is present in a provider edge
(PE) router's VPN routing and
forwarding (VRF) table, by means of
a Layer 3 VPN destination prefix.
The Services Router does not test the
connection between a PE router and
a customer edge (CE) router.
Locate LSP using
interface name
ping mpls l2vpn
interface
Checks the operability of the
connections related to a Layer 2 VPN.
The Services Router directs outgoing
request probes out the specified
interface.
For information about interface
names, See the interface naming
conventions in the J-series Services
Router Basic LAN and WAN Access
Configuration Guide.
Instance to which this
connection belongs
ping mpls l2vpn
instance
Checks the operability of the
connections related to a Layer 2 VPN.
The Services Router pings on a
combination of the Layer 2 VPN
routing instance name, the local site
identifier, and the remote site
identifier, to test the integrity of the
Layer 2 VPN circuit (specified by the
identifiers) between the inbound and
outbound PE routers.
Locate LSP from
interface name
ping mpls l2circuit
interface
Checks the operability of the Layer 2
circuit connections. The Services
Router directs outgoing request
probes out the specified interface.
Locate LSP from virtual
circuit information
ping mpls l2circuit
virtual-circuit
Checks the operability of the Layer 2
circuit connections. The Services
Router pings on a combination of the
IPv4 prefix and the virtual circuit
identifier on the outbound PE router,
testing the integrity of the Layer 2
circuit between the inbound and
outbound PE routers.
Ping end point of LSP
ping mpls lsp-end-point
Checks the operability of an LSP
endpoint. The Services Router pings
an LSP endpoint using either an LDP
FEC prefix or an RSVP LSP endpoint
address.
214
■
Diagnostic Tools Overview
Chapter 12: Using Services Router Diagnostic Tools
Before You Begin
This section includes the following topics:
■
General Preparation on page 215
■
Ping MPLS Preparation on page 215
General Preparation
To use the J-Web interface and CLI operational tools, you must have the appropriate
access privileges. For more information about configuring access privilege levels,
see “Adding New Users” on page 11 and the JUNOS System Basics Configuration
Guide.
Ping MPLS Preparation
Before using the ping MPLS feature, make sure that the receiving interface on the
VPN or LSP remote endpoint has MPLS enabled, and that the loopback interface on
the outbound node is configured as 127.0.0.1. The source address for MPLS probes
must be a valid address on the Services Router.
MPLS Enabled
To process ping MPLS requests, the remote endpoint of the VPN or LSP must be
configured appropriately. You must enable MPLS on the receiving interface of the
outbound node for the VPN or LSP. If MPLS is not enabled, the remote endpoint
drops the incoming request packets and returns an “ICMP host unreachable” message
to the Services Router. To enable MPLS on an interface, see the J-series Services
Router Advanced WAN Access Configuration Guide.
Loopback Address
The loopback address (lo0) on the outbound node must be configured as 127.0.0.1.
If this interface address is not configured correctly, the outbound node does not have
this forwarding entry. It drops the incoming request packets and returns a “host
unreachable” message to the Services Router. If the outbound node is a Services
Router, see the J-series Services Router Advanced WAN Access Configuration Guide to
configure the loopback address.
Source Address for Probes
The source IP address you specify for a set of probes must be an address configured
on one of the Services Router interfaces. If it is not a valid Services Router address,
the ping request fails with the error message “Can't assign requested address.”
Before You Begin
■
215
J-series™ Services Router Administration Guide
Pinging Hosts from the J-Web Interface
This section contains the following topics:
■
Using the J-Web Ping Host Tool on page 216
■
Ping Host Results and Output Summary on page 218
Using the J-Web Ping Host Tool
You can ping a host to verify that the host can be reached over the network. The
output is useful for diagnosing host and network connectivity problems. The Services
Router sends a series of ICMP echo (ping) requests to a specified host and receives
ICMP echo responses.
Alternatively, you can use the CLI ping command. (See “Pinging Hosts from the
CLI” on page 230.)
To use the ping host tool:
1.
Select Diagnose>Ping Host from the task bar.
2.
Next to Advanced options, click the expand icon (see Figure 20 on page 216).
3.
Enter information into the Ping Host page, as described in Table 108 on page 216.
The Remote Host field is the only required field.
4.
Click Start.
The results of the ping operation are displayed in the main pane (see
Figure 21 on page 217). If no options are specified, each ping response is in the
following format:
bytes bytes from ip-address: icmp_seq=number ttl=number time=time
Table 109 on page 218 summarizes the output fields of the display.
5.
To stop the ping operation before it is complete, click OK.
Figure 20: Ping Host Page
ERROR: Unresolved graphic fileref="s020253.gif" not found in
"\\teamsite1\default\main\TechPubsWorkInProgress\STAGING\images\".
Table 108: J-Web Ping Host Field Summary
Field
Function
Your Action
Remote Host
Identifies the host to ping.
Type the hostname or IP address of the host to ping.
Advanced Options
216
■
Pinging Hosts from the J-Web Interface
Chapter 12: Using Services Router Diagnostic Tools
Table 108: J-Web Ping Host Field Summary (continued)
Field
Function
Your Action
Don't Resolve
Addresses
Determines whether to display hostnames of the
hops along the path.
■
To suppress the display of the hop hostnames,
select the check box.
■
To display the hop hostnames, clear the check
box.
Interface
Specifies the interface on which the ping requests
are sent.
From the list, select the interface on which ping
requests are sent. If you select any, the ping requests
are sent on all interfaces.
Count
Specifies the number of ping requests to send.
From the list, select the number of ping requests to
send.
Don't Fragment
Specifies the Don't Fragment (DF) bit in the IP
header of the ping request packet.
■
To set the DF bit, select the check box.
■
To clear the DF bit, clear the check box.
Sets the record route option in the IP header of the
ping request packet. The path of the ping request
packet is recorded within the packet and displayed
in the main pane.
■
To record and display the path of the packet,
select the check box.
■
To suppress the recording and display of the
path of the packet, clear the check box.
Type-of-Service
Specifies the type-of-service (TOS) value in the IP
header of the ping request packet.
From the list, select the decimal value of the TOS
field.
Routing Instance
Name of the routing instance for the ping attempt.
From the list, select the routing instance name.
Interval
Specifies the interval, in seconds, between the
transmission of each ping request.
From the list, select the interval.
Packet Size
Specifies the size of the ping request packet.
Type the size, in bytes, of the packet. The size can
be from 0 through 65468. The router adds 8 bytes
of ICMP header to the size.
Source Address
Specifies the source address of the ping request
packet.
Type the source IP address.
Time-to-Live
Specifies the time-to-live (TTL) hop count for the
ping request packet.
From the list, select the TTL.
Bypass Routing
Determines whether ping requests are routed by
means of the routing table.
■
To bypass the routing table and send the ping
requests to hosts on the specified interface
only, select the check box.
■
To route the ping requests using the routing
table, clear the check box.
Record Route
If the routing table is not used, ping requests are
sent only to hosts on the interface specified in the
Interface box. If the host is not on that interface,
ping responses are not sent.
Figure 21: Ping Host Results Page
ERROR: Unresolved graphic fileref="s020254.gif" not found in
"\\teamsite1\default\main\TechPubsWorkInProgress\STAGING\images\".
Pinging Hosts from the J-Web Interface
■
217
J-series™ Services Router Administration Guide
Ping Host Results and Output Summary
Table 109 on page 218 summarizes the output in the ping host display. If the Services
Router receives no ping responses from the destination host, review the list after
Table 109 on page 218 for a possible explanation.
Table 109: J-Web Ping Host Results and Output Summary
Ping Host Result
Description
bytes bytes from ip-address
■
bytes—Size of ping response packet, which is equal to the value you entered in
the Packet Size box, plus 8.
■
ip-address—IP address of destination host that sent the ping response packet.
number—Sequence Number field of the ping response packet. You can use this value
icmp_seq=0
to match the ping response to the corresponding ping request.
icmp_seq=number
ttl=number
number—Time-to-live hop-count value of the ping response packet.
time=time
time—Total time between the sending of the ping request packet and the receiving of
the ping response packet, in milliseconds. This value is also called round-trip time.
number packets transmitted
number—Number of ping requests (probes) sent to host.
number packets received
number—Number of ping responses received from host.
percentage packet loss
percentage—Number of ping responses divided by the number of ping requests,
specified as a percentage.
round-trip min/avg/max/stddev =
min-time/avg-time/max-time/std-dev
ms
■
min-time—Minimum round-trip time (see time=time field in this table).
■
avg-time—Average round-trip time.
■
max-time—Maximum round-trip time.
■
std-dev—Standard deviation of the round-trip times.
If the Services Router does not receive ping responses from the destination host (the
output shows a packet loss of 100 percent), one of the following explanations might
apply:
218
■
■
The host is not operational.
■
There are network connectivity problems between the Services Router and the
host.
■
The host might be configured to ignore ICMP echo requests.
■
The host might be configured with a firewall filter that blocks ICMP echo requests
or ICMP echo responses.
■
The size of the ICMP echo request packet exceeds the MTU of a host along the
path.
■
The value you selected in the Time-to-Live box was less than the number of hops
in the path to the host, in which case the host might reply with an ICMP error
message.
Pinging Hosts from the J-Web Interface
Chapter 12: Using Services Router Diagnostic Tools
For more information about ICMP, see RFC 792, Internet Control Message Protocol.
Checking MPLS Connections from the J-Web Interface
Use the J-Web ping MPLS diagnostic tool to diagnose the state of label-switched paths
(LSPs), Layer 2 and Layer 3 VPNs, and Layer 2 circuits.
Alternatively, you can use the CLI commands ping mpls, ping mpls l2circuit, ping mpls
l2vpn, and ping mpls l3vpn. For more information, see “Pinging Hosts from the
CLI” on page 230.
Before using the J-Web ping MPLS tool in your network, read “Ping MPLS
Preparation” on page 215.
This section contains the following topics:
■
Using the J-Web Ping MPLS Tool on page 219
■
Ping MPLS Results and Output on page 222
Using the J-Web Ping MPLS Tool
Before using the ping MPLS feature, make sure that the receiving interface on the
VPN or LSP remote endpoint has MPLS enabled, and that the loopback interface on
the outbound node is configured as 127.0.0.1. The source address for MPLS probes
must be a valid address on the Services Router.
To use the ping MPLS tool:
1.
Select Diagnose>Ping MPLS from the task bar.
2.
Next to the ping MPLS option you want to use, click the expand icon (see
Figure 22 on page 219).
3.
Enter information into the Ping MPLS page, as described in Table 110 on page 219.
4.
Click Start.
Table 111 on page 222 summarizes the output fields of the display.
5.
To stop the ping operation before it is complete, click OK.
Figure 22: Ping MPLS Page
ERROR: Unresolved graphic fileref="s020255.gif" not found in
"\\teamsite1\default\main\TechPubsWorkInProgress\STAGING\images\".
Table 110: J-Web Ping MPLS Field Summary
Field
Function
Your Action
Ping RSVP-signaled LSP
LSP Name
Identifies the LSP to ping.
Type the name of the LSP to ping.
Checking MPLS Connections from the J-Web Interface
■
219
J-series™ Services Router Administration Guide
Table 110: J-Web Ping MPLS Field Summary (continued)
Field
Function
Your Action
Source Address
Specifies the source address of the ping request
packet.
Type the source IP address—a valid address
configured on a Services Router interface.
Count
Specifies the number of ping requests to send.
From the list, select the number of ping requests to
send. The default is 5 requests.
Detailed Output
Requests the display of extensive rather than brief
ping output.
Select the check box to display detailed output.
Ping LDP-signaled LSP
FEC Prefix
Identifies the LSP to ping.
Type the forwarding equivalence class (FEC) prefix
and length of the LSP to ping.
Source Address
Specifies the source address of the ping request
packet.
Type the source IP address—a valid address
configured on a Services Router interface.
Count
Specifies the number of ping requests to send.
From the list, select the number of ping requests to
send. The default is 5 requests.
Detailed Output
Requests the display of extensive rather than brief
ping output.
Select the check box to display detailed output.
Ping LSP to Layer 3 VPN prefix
Layer 3 VPN
Name
Identifies the Layer 3 VPN to ping.
Type the name of the VPN to ping.
Count
Specifies the number of ping requests to send.
From the list, select the number of ping requests to
send. The default is 5 requests.
Detailed Output
Requests the display of extensive rather than brief
ping output.
Select the check box to display detailed output.
VPN Prefix
Identifies the IP address prefix and length of the
Layer 3 VPN to ping.
Type the IP address prefix and length of the VPN to
ping.
Source Address
Specifies the source address of the ping request
packet.
Type the source IP address—a valid address
configured on a Services Router interface.
Locate LSP using interface name
Interface
Specifies the interface on which the ping requests
are sent.
From the list, select the Services Router interface
on which ping requests are sent. If you select any,
the ping requests are sent on all interfaces.
(See the interface naming conventions in the J-series
Services Router Basic LAN and WAN Access
Configuration Guide.)
Source Address
Specifies the source address of the ping request
packet.
Type the source IP address—a valid address
configured on a Services Router interface.
Count
Specifies the number of ping requests to send.
From the list, select the number of ping requests to
send. The default is 5 requests.
Detailed Output
Requests the display of extensive rather than brief
ping output.
Select the check box to display detailed output.
220
■
Checking MPLS Connections from the J-Web Interface
Chapter 12: Using Services Router Diagnostic Tools
Table 110: J-Web Ping MPLS Field Summary (continued)
Field
Function
Your Action
Instance to which this connection belongs
Layer 2VPN
Name
Identifies the Layer 2 VPN to ping.
Type the name of the VPN to ping.
Remote Site
Identifier
Specifies the remote site identifier of the Layer 2
VPN to ping.
Type the remote site identifier for the VPN.
Source Address
Specifies the source address of the ping request
packet.
Type the source IP address—a valid address
configured on a Services Router interface.
Local Site
Identifier
Specifies the local site identifier of the Layer 2 VPN
to ping.
Type the local site identifier for the VPN.
Count
Specifies the number of ping requests to send.
From the list, select the number of ping requests to
send. The default is 5 requests.
Detailed Output
Requests the display of extensive rather than brief
ping output.
Select the check box to display detailed output.
Locate LSP from interface name
Interface
Specifies the interface on which the ping requests
are sent.
From the list, select the Services Router interface
on which ping requests are sent. If you select any,
the ping requests are sent on all interfaces.
Source Address
Specifies the source address of the ping request
packet.
Type the source IP address—a valid address
configured on a Services Router interface.
Count
Specifies the number of ping requests to send.
From the list, select the number of ping requests to
send. The default is 5 requests.
Detailed Output
Requests the display of extensive rather than brief
ping output.
Select the check box to display detailed output.
Locate LSP from virtual circuit information
Remote
Neighbor
Identifies the remote neighbor (PE router) within
the virtual circuit to ping.
Type the IP address of the remote neighbor within
the virtual circuit.
Circuit Identifier
Specifies the virtual circuit identifier for the Layer 2
circuit to ping.
Type the virtual circuit identifier for the Layer 2
circuit.
Source Address
Specifies the source address of the ping request
packet.
Type the source IP address—a valid address
configured on a Services Router interface.
Count
Specifies the number of ping requests to send.
From the list, select the number of ping requests to
send.
Detailed Output
Requests the display of extensive rather than brief
ping output.
Select the check box to display detailed output.
Ping end point of LSP
VPN Prefix
Identifies the LSP endpoint to ping.
Type either the LDP FEC prefix and length or the
RSVP LSP endpoint address for the LSP to ping.
Checking MPLS Connections from the J-Web Interface
■
221
J-series™ Services Router Administration Guide
Table 110: J-Web Ping MPLS Field Summary (continued)
Field
Function
Your Action
Source Address
Specifies the source address of the ping request
packet.
Type the source IP address—a valid address
configured on a Services Router interface.
Count
Specifies the number of ping requests to send.
From the list, select the number of ping requests to
send.
Detailed Output
Requests the display of extensive rather than brief
ping output.
Select the check box to display detailed output.
Ping MPLS Results and Output
Table 111 on page 222 summarizes the output in the ping MPLS display. If the Services
Router receives no responses from the destination host, review the list after
Table 111 on page 222 for a possible explanation.
Table 111: J-Web Ping MPLS Results and Output Summary
Field
Description
Exclamation point (!)
Echo reply was received.
Period (.)
Echo reply was not received within the timeout period.
x
Echo reply was received with an error code. Errored packets are not counted in the
received packets count and are accounted for separately.
number packets transmitted
number—Number of ping requests (probes) sent to a host.
number packets received
number—Number of ping responses received from a host.
percentage packet loss
percentage—Number of ping responses divided by the number of ping requests,
specified as a percentage.
For Layer 2 circuits only, the number of milliseconds required for the ping packet to
reach the destination. This value is approximate, because the packet has to reach the
Routing Engine.
time
If the Services Router does not receive ping responses from the destination host (the
output shows a packet loss of 100 percent), one of the following explanations might
apply:
222
■
Checking MPLS Connections from the J-Web Interface
Chapter 12: Using Services Router Diagnostic Tools
■
The host is not operational.
■
There are network connectivity problems between the Services Router and the
host.
■
The host might be configured to ignore echo requests.
■
The host might be configured with a firewall filter that blocks echo requests or
echo responses.
■
The size of the echo request packet exceeds the MTU of a host along the path.
■
The outbound node at the remote endpoint is not configured to handle MPLS
packets.
■
The remote endpoint's loopback address is not configured to 127.0.0.1.
Tracing Unicast Routes from the J-Web Interface
You can use the traceroute diagnostic tool to display a list of routers between the
Services Router and a specified destination host. The output is useful for diagnosing
a point of failure in the path from the Services Router to the destination host, and
addressing network traffic latency and throughput problems.
The Services Router generates the list of routers by sending a series of ICMP traceroute
packets in which the time-to-live (TTL) value in the messages sent to each successive
router is incremented by 1. (The TTL value of the first traceroute packet is set to 1.)
In this manner, each router along the path to the destination host replies with a Time
Exceeded packet from which the source IP address can be obtained.
Alternatively, you can use the CLI traceroute command to generate the list.
This section contains the following topics:
■
Using the J-Web Traceroute Tool on page 223
■
Traceroute Results and Output Summary on page 225
Using the J-Web Traceroute Tool
To use the traceroute tool:
1.
Select Diagnose>Traceroute.
2.
Next to Advanced options, click the expand icon (see Figure 23 on page 224).
3.
Enter information into the Traceroute page, as described in Table 112 on page 224.
The Remote Host field is the only required field.
4.
Click Start.
The results of the traceroute operation are displayed in the main pane. If no
options are specified, each line of the traceroute display is in the following format:
hop-number host (ip-address) [as-number]time1 time2 time3
Tracing Unicast Routes from the J-Web Interface
■
223
J-series™ Services Router Administration Guide
The Services Router sends a total of three traceroute packets to each router along
the path and displays the round-trip time for each traceroute operation. If the
Services Router times out before receiving a Time Exceeded message, an asterisk
(*) is displayed for that round-trip time.
Table 113 on page 225 summarizes the output fields of the display.
5.
To stop the traceroute operation before it is complete, click OK while the results
of the traceroute operation are being displayed.
Figure 23: Traceroute Page
ERROR: Unresolved graphic fileref="s020256.gif" not found in
"\\teamsite1\default\main\TechPubsWorkInProgress\STAGING\images\".
Table 112: Traceroute Field Summary
Field
Function
Your Action
Remote Host
Identifies the destination host of the traceroute.
Type the hostname or IP address of the destination
host.
Determines whether hostnames of the hops along
the path are displayed, in addition to IP addresses.
■
To suppress the display of the hop hostnames,
select the check box.
■
To display the hop hostnames, clear the check
box.
Advanced Options
Don't Resolve
Addresses
Gateway
Specifies the IP address of the gateway to route
through.
Type the gateway IP address.
Source Address
Specifies the source address of the outgoing
traceroute packets.
Type the source IP address.
Bypass Routing
Determines whether traceroute packets are routed
by means of the routing table.
■
To bypass the routing table and send the
traceroute packets to hosts on the specified
interface only, select the check box.
■
To route the traceroute packets by means of
the routing table, clear the check box.
If the routing table is not used, traceroute packets
are sent only to hosts on the interface specified in
the Interface box. If the host is not on that interface,
traceroute responses are not sent.
Interface
Specifies the interface on which the traceroute
packets are sent.
From the list, select the interface on which
traceroute packets are sent. If you select any, the
traceroute requests are sent on all interfaces.
Time-to-Live
Specifies the maximum time-to-live (TTL) hop count
for the traceroute request packet.
From the list, select the TTL.
Type-of-Service
Specifies the type-of-service (TOS) value to include
in the IP header of the traceroute request packet.
From the list, select the decimal value of the TOS
field.
224
■
Tracing Unicast Routes from the J-Web Interface
Chapter 12: Using Services Router Diagnostic Tools
Table 112: Traceroute Field Summary (continued)
Field
Function
Your Action
Resolve AS
Numbers
Determines whether the autonomous system (AS)
number of each intermediate hop between the
router and the destination host is displayed.
■
To display the AS numbers, select the check
box.
■
To suppress the display of the AS numbers,
clear the check box.
Traceroute Results and Output Summary
Table 113 on page 225 summarizes the output in the traceroute display. If the Services
Router receives no responses from the destination host, review the list after
Table 113 on page 225 for a possible explanation.
Table 113: J-Web Traceroute Results and Output Summary
Field
Description
hop-number
Number of the hop (router) along the path.
host
Hostname, if available, or IP address of the router. If the Don't Resolve Addresses check box is selected,
the hostname is not displayed.
ip-address
IP address of the router.
as-number
AS number of the router.
time1
Round-trip time between the sending of the first traceroute packet and the receiving of the corresponding
Time Exceeded packet from that particular router.
time2
Round-trip time between the sending of the second traceroute packet and the receiving of the corresponding
Time Exceeded packet from that particular router.
time3
Round-trip time between the sending of the third traceroute packet and the receiving of the corresponding
Time Exceeded packet from that particular router.
If the Services Router does not display the complete path to the destination host,
one of the following explanations might apply:
■
The host is not operational.
■
There are network connectivity problems between the Services Router and the
host.
■
The host, or a router along the path, might be configured to ignore ICMP
traceroute messages.
■
The host, or a router along the path, might be configured with a firewall filter
that blocks ICMP traceroute requests or ICMP time exceeded responses.
■
The value you selected in the Time Exceeded box was less than the number of
hops in the path to the host. In this case, the host might reply with an ICMP error
message.
Tracing Unicast Routes from the J-Web Interface
■
225
J-series™ Services Router Administration Guide
For more information about ICMP, see RFC 792, Internet Control Message Protocol.
Capturing and Viewing Packets with the J-Web Interface
You can use the J-Web packet capture diagnostic tool when you need to quickly
capture and analyze router control traffic on a Services Router. Packet capture on
the J-Web interface allows you to capture traffic destined for or originating from the
Routing Engine. You can use J-Web packet capture to compose expressions with
various matching criteria to specify the packets that you want to capture. You can
either choose to decode and view the captured packets in the J-Web interface as they
are captured, or save the captured packets to a file and analyze them offline using
packet analyzers such as Ethereal. J-Web packet capture does not capture transient
traffic.
Alternatively you can use the CLI monitor traffic command to capture and display
packets matching a specific criteria. For details, see “Using the monitor traffic
Command” on page 246.
To capture transient traffic and entire IPv4 data packets for offline analysis, you must
configure packet capture with the J-Web or CLI configuration editor. For details, see
“Configuring Packet Capture” on page 253.
This section contains the following topics:
■
Using J-Web Packet Capture on page 226
■
Packet Capture Results and Output Summary on page 229
Using J-Web Packet Capture
To use J-Web packet capture:
1.
Select Diagnose>Packet Capture.
2.
Enter information into the Packet Capture page (Figure 24 on page 227) as
described in Table 114 on page 227.
The sample configuration in Table 114 on page 227 captures the next 10 TCP
packets originating from the IP address 10.1.40.48 on port 23 and passing
through the Gigabit Ethernet interface ge-0/0/0.
3.
To save the captured packets to a file, or specify other advanced options, click
the expand icon next to Advanced options, and enter information as described
in Table 114 on page 227.
4.
Click Start.
The captured packet headers are decoded and displayed in the Packet Capture
display (see Figure 25 on page 229).
Table 115 on page 229 summarizes the output fields of the display.
5.
Do one of the following:
■
226
■
To stop capturing the packets and stay on the same page while the decoded
packet headers are being displayed, click Stop Capturing.
Capturing and Viewing Packets with the J-Web Interface
Chapter 12: Using Services Router Diagnostic Tools
■
To stop capturing packets and return to the Packet Capture page, click OK.
Figure 24: Packet Capture Page
ERROR: Unresolved graphic fileref="s020267.gif" not found in
"\\teamsite1\default\main\TechPubsWorkInProgress\STAGING\images\".
Table 114: Packet Capture Field Summary
Field
Function
Your Action
Interface
Specifies the interface on which the packets are
captured.
From the list, select an interface—for example,
ge-0/0/0.
If you select default, packets on the Ethernet
management port 0, are captured.
Detail level
Specifies the extent of details to be displayed for the
packet headers.
■
Brief—Displays the minimum packet header
information. This is the default.
■
Detail—Displays packet header information in
moderate detail.
■
Extensive—Displays the maximum packet
header information.
From the list, select Detail.
Packets
Specifies the number of packets to be captured.
Values range from 1 to 1000. Default is 10. Packet
capture stops capturing packets after this number
is reached.
From the list, select the number of packets to be
captured—for example, 10.
Addresses
Specifies the addresses to be matched for capturing
the packets using a combination of the following
parameters:
Select address-matching criteria. For example:
■
■
Direction—Matches the packet headers for IP
address, hostname, or network address of the
source, destination or both.
Type—Specifies if packet headers are matched
for host address or network address.
1.
From the Direction list, select source.
2.
From the Type list, select host.
3.
In the Address box, type 10.1.40.48.
4.
Click Add.
You can add multiple entries to refine the match
criteria for addresses.
Protocols
Matches the protocol for which packets are captured.
You can choose to capture TCP, UDP, or ICMP
packets or a combination of TCP, UDP, and ICMP
packets.
From the list, select a protocol—for example, tcp.
Ports
Matches packet headers containing the specified
source or destination TCP or UDP port number or
port name.
Select a direction and a port. For example:
1.
From the Type list, select src.
2.
In the Port box, type 23.
Advanced Options
Capturing and Viewing Packets with the J-Web Interface
■
227
J-series™ Services Router Administration Guide
Table 114: Packet Capture Field Summary (continued)
Field
Function
Your Action
Absolute TCP
Sequence
Specifies that absolute TCP sequence numbers are
to be displayed for the packet headers.
■
To display absolute TCP sequence numbers in
the packet headers, select this check box.
■
To stop displaying absolute TCP sequence
numbers in the packet headers, clear this check
box.
■
To include link-layer packet headers while
capturing packets, select this check box.
■
To exclude link-layer packet headers while
capturing packets, clear this check box.
■
To read all packets that reach the interface,
select this check box.
■
To read only packets addressed to the interface,
clear this check box.
■
To display the packet headers in hexadecimal
format, select this check box.
■
To stop displaying the packet headers in
hexadecimal format, clear this check box.
■
To display the packet headers in ASCII and
hexadecimal formats, select this check box.
■
To stop displaying the packet headers in ASCII
and hexadecimal formats, clear this check box.
Layer 2 Headers
Non-Promiscuous
Specifies that link-layer packet headers are to be
displayed.
Specifies not to place the interface in promiscuous
mode, so that the interface reads only packets
addressed to it.
In promiscuous mode, the interface reads every
packet that reaches it.
Display Hex
Display ASCII
and Hex
Header
Expression
Specifies that packet headers, except link-layer
headers, are to be displayed in hexadecimal format.
Specifies that packet headers are to be displayed in
hexadecimal and ASCII format.
Specifies the match condition for the packets to be
captured.
The match conditions you specify for Addresses,
Protocols, and Ports are displayed in expression
format in this field.
You can enter match conditions directly in this field
in expression format or modify the expression
composed from the match conditions you specified
for Addresses, Protocols, and Ports. If you change
the match conditions specified for Addresses,
Protocols, and Ports again, packet capture overwrites
your changes with the new match conditions.
Packet Size
Specifies the number of bytes to be displayed for
each packet. If a packet header exceeds this size,
the display is truncated for the packet header. The
default value is 96 bytes.
Type the number of bytes you want to capture for
each packet header—for example, 256.
Don't Resolve
Addresses
Specifies that IP addresses are not to be resolved
into hostnames in the packet headers displayed.
■
To prevent packet capture from resolving IP
addresses to hostnames, select this check box.
■
To resolve IP addresses into hostnames, clear
this check box.
■
To stop displaying timestamps in the captured
packet headers, select this check box.
■
To display the timestamp in the captured
packet headers, clear this check box.
No Timestamp
228
■
Suppresses the display of packet header timestamps.
Capturing and Viewing Packets with the J-Web Interface
Chapter 12: Using Services Router Diagnostic Tools
Table 114: Packet Capture Field Summary (continued)
Field
Function
Your Action
Write Packet
Capture File
Writes the captured packets to a file in PCAP format
in /var/tmp. The files are named with the prefix
jweb-pcap and the extension .pcap.
■
To save the captured packet headers to a file,
select this check box.
■
To decode and display the packet headers on
the J-Web page, clear this check box.
If you select this option, the decoded packet headers
are not displayed on the packet capture page.
Packet Capture Results and Output Summary
Figure 25 on page 229 shows J-Web packet capture output from router1, with the level
of detail set to brief. Table 115 on page 229 summarizes the output in the packet
capture display.
Figure 25: Packet Capture Results Page
ERROR: Unresolved graphic fileref="s020268.gif" not found in
"\\teamsite1\default\main\TechPubsWorkInProgress\STAGING\images\".
Table 115: J-Web Packet Capture Results and Output Summary
Field
Description
timestamp
Time when the packet was captured. The timestamp 00:45:40.823971 means 00 hours (12.00 a.m.), 45
minutes, and 40.823971 seconds.
NOTE: The time displayed is local time.
direction
Direction of the packet. Specifies whether the packet originated from the Routing Engine (Out), or was
destined for the Routing Engine (In).
protocol
Protocol for the packet.
In the sample output, IP indicates the Layer 3 protocol.
source address
Hostname, if available, or IP address and the port number of the packet's origin. If the Don't Resolve
Addresses check box is selected, only the IP address of the source is displayed.
NOTE: When a string is defined for the port, the packet capture output displays the string instead of the
port number.
destination address
Hostname, if available, or IP address of the packet's destination with the port number. If the Don't Resolve
Addresses check box is selected, only the IP address of the destination and the port are displayed.
NOTE: When a string is defined for the port, the packet capture output displays the string instead of the
port number.
protocol
Protocol for the packet.
In the sample output, TCP indicates the Layer 4 protocol.
Capturing and Viewing Packets with the J-Web Interface
■
229
J-series™ Services Router Administration Guide
Table 115: J-Web Packet Capture Results and Output Summary (continued)
Field
Description
data size
Size of the packet (in bytes).
Using CLI Diagnostic Commands
Because the CLI is a superset of the J-Web interface, you can perform certain tasks
only through the CLI. For an overview of the CLI operational mode commands, along
with instructions for filtering command output, see “CLI Diagnostic Commands
Overview” on page 211.
This section contains the following topics:
■
Pinging Hosts from the CLI on page 230
■
Checking MPLS Connections from the CLI on page 232
■
Tracing Unicast Routes from the CLI on page 237
■
Tracing Multicast Routes from the CLI on page 240
■
Displaying Log and Trace Files from the CLI on page 244
■
Monitoring Interfaces and Traffic from the CLI on page 245
Pinging Hosts from the CLI
Use the CLI ping command to verify that a host can be reached over the network.
This command is useful for diagnosing host and network connectivity problems. The
Services Router sends a series of ICMP echo (ping) requests to a specified host and
receives ICMP echo responses.
Alternatively, you can use the J-Web interface. (See “Using the J-Web Ping Host
Tool” on page 216.)
Enter the ping command with the following syntax. Table 116 on page 230 describes
the ping command options.
user@host> ping host <interface source-interface> <bypass-routing> <count number>
<do-not-fragment> <inet | inet6> <interval seconds> <loose-source [hosts]>
<no-resolve> <pattern string> <rapid> <record-route>
<routing-instance routing-instance-name> <size bytes> <source source-address>
<strict> <strict-source [hosts]> <tos number> <ttl number> <wait seconds> <detail>
<verbose>
To quit the ping command, press Ctrl-C.
Table 116: CLI ping Command Options
Option
Description
host
Pings the hostname or IP address you specify.
230
■
Using CLI Diagnostic Commands
Chapter 12: Using Services Router Diagnostic Tools
Table 116: CLI ping Command Options (continued)
Option
Description
interface source-interface
(Optional) Sends the ping requests on the interface you specify. If you do not include this option,
ping requests are sent on all interfaces.
bypass-routing
(Optional) Bypasses the routing tables and sends the ping requests only to hosts on directly
attached interfaces. If the host is not on a directly attached interface, an error message is returned.
Use this option to ping a local system through an interface that has no route through it.
countnumber
(Optional) Limits the number of ping requests to send. Specify a count from 1 through
2,000,000,000. If you do not specify a count, ping requests are continuously sent until you press
Ctrl-C.
do-not-fragment
(Optional) Sets the Don't Fragment (DF) bit in the IP header of the ping request packet.
inet
(Optional) Forces the ping requests to an IPv4 destination.
inet6
(Optional) Forces the ping requests to an IPv6 destination.
interval seconds
(Optional) Sets the interval between ping requests, in seconds. Specify an interval from 0.1
through 10,000. The default value is 1 second.
loose-source [hosts]
(Optional) For IPv4, sets the loose source routing option in the IP header of the ping request
packet.
no-resolve
(Optional) Suppresses the display of the hostnames of the hops along the path.
pattern string
(Optional) Includes the hexadecimal string you specify, in the ping request packet.
rapid
(Optional) Sends ping requests rapidly. The results are reported in a single message, not in
individual messages for each ping request. By default, five ping requests are sent before the
results are reported. To change the number of requests, include the count option.
record-route
(Optional) For IPv4, sets the record route option in the IP header of the ping request packet. The
path of the ping request packet is recorded within the packet and displayed on the screen.
routing-instance
routing-instance-name
(Optional) Uses the routing instance you specify for the ping request.
size bytes
(Optional) Sets the size of the ping request packet. Specify a size from 0 through 65,468. The
default value is 56 bytes, which is effectively 64 bytes because 8 bytes of ICMP header data are
added to the packet.
source source-address
(Optional) Uses the source address that you specify, in the ping request packet.
strict
(Optional) For IPv4, sets the strict source routing option in the IP header of the ping request
packet.
strict-source [hosts]
(Optional) For IPv4, sets the strict source routing option in the IP header of the ping request
packet, and uses the list of hosts you specify for routing the packet.
tos number
(Optional) Sets the type-of-service (TOS) value in the IP header of the ping request packet. Specify
a value from 0 through 255.
Using CLI Diagnostic Commands
■
231
J-series™ Services Router Administration Guide
Table 116: CLI ping Command Options (continued)
Option
Description
ttl number
(Optional) Sets the time-to-live (TTL) value for the ping request packet. Specify a value from 0
through 255.
wait seconds
(Optional) Sets the maximum time to wait after sending the last ping request packet. If you do
not specify this option, the default delay is 10 seconds. If you use this option without the count
option, the Services Router uses a default count of 5 packets.
detail
(Optional) Displays the interface on which the ping response was received.
verbose
(Optional) Displays detailed output.
Following is sample output from a ping command:
user@host> ping host3 count 4
PING host3.site.net (176.26.232.111): 56
64 bytes from 176.26.232.111: icmp_seq=0
64 bytes from 176.26.232.111: icmp_seq=1
64 bytes from 176.26.232.111: icmp_seq=2
64 bytes from 176.26.232.111: icmp_seq=3
data bytes
ttl=122 time=0.661
ttl=122 time=0.619
ttl=122 time=0.621
ttl=122 time=0.634
ms
ms
ms
ms
--- host3.site.net ping statistics --4 packets transmitted, 4 packets received, 0% packet loss
round-trip min/avg/max/stddev = 0.619/0.634/0.661/0.017 ms
The fields in the display are the same as those displayed by the J-Web ping host
diagnostic tool. For information, see “Ping Host Results and Output
Summary” on page 218.
Checking MPLS Connections from the CLI
Use the ping mpls commands to diagnose the state of LSPs, Layer 2 and Layer 3
VPNs, and Layer 2 circuits. When you issue a command from a Services Router
operating as the inbound node at the entry point of an LSP or VPN, the router sends
probe packets into the LSP or VPN. Based on how the LSP or VPN outbound node at
the remote endpoint of the connection replies to the probes, you can determine the
connectivity of the LSP or VPN.
Each probe is an echo request sent to the LSP or VPN exit point as an MPLS packet
with a UDP payload. If the outbound node receives the echo request, it checks the
contents of the probe and returns a value in the UDP payload of the response packet.
If the Services Router receives the response packet, it reports a successful ping
response. Responses that take longer than 2 seconds are identified as failed probes.
Alternatively, you can use the J-Web ping MPLS tool. For more information, see
“Checking MPLS Connections from the J-Web Interface” on page 219.
Before using ping mpls commands in your network, read “Ping MPLS
Preparation” on page 215.
232
■
Using CLI Diagnostic Commands
Chapter 12: Using Services Router Diagnostic Tools
The ping mpls commands diagnose the connectivity of MPLS and VPN networks in
the following ways:
■
Pinging RSVP-Signaled LSPs and LDP-Signaled LSPs on page 233
■
Pinging Layer 3 VPNs on page 234
■
Pinging Layer 2 VPNs on page 235
■
Pinging Layer 2 Circuits on page 236
Pinging RSVP-Signaled LSPs and LDP-Signaled LSPs
Enter the ping mpls command with the following syntax. Table 117 on page 233
describes the ping mpls command options.
user@host> ping mpls (ldp fec | lsp-end-point prefix-name | rsvp lsp-name)
<exp forwarding-class> <count number> <source source-address> <detail>
To quit the ping mpls command, press Ctrl-C.
Alternatively, you can use the J-Web interface. (See “Checking MPLS Connections
from the J-Web Interface” on page 219.)
Table 117: CLI ping mpls ldp and ping mpls lsp-end-point Command Options
Option
Description
ldp fec
Pings an LDP-signaled LSP identified by the forwarding equivalence class (FEC) prefix and length.
lsp-end-point prefix-name
Pings an LSP endpoint using either an LDP FEC or a RSVP LSP endpoint address.
rsvp lsp-name
Pings an RSVP-signaled LSP identified by the specified LSP name.
exp forwarding-class
(Optional) Specifies the value of the forwarding class to be used in the MPLS ping packets.
countnumber
(Optional) Limits the number of ping requests to send. Specify a count from 0 through 1,000,000.
The default value is 5. If you do not specify a count, ping requests are continuously sent until
you press Ctrl-C.
source source-address
(Optional) Uses the source address that you specify, in the ping request packet.
detail
(Optional) Displays detailed output about the echo requests sent and received. Detailed output
includes the MPLS labels used for each request and the return codes for each request.
Following is sample output from a ping mpls command:
user@host> ping mpls rsvp count 5
!!xxx
--- lsping statistics --5 packets transmitted, 2 packets received, 60% packet loss
3 packets received with error status, not counted as received.
Using CLI Diagnostic Commands
■
233
J-series™ Services Router Administration Guide
The fields in the display are the same as those displayed by the J-Web ping MPLS
diagnostic tool. For information, see “Ping MPLS Results and Output” on page 222.
Pinging Layer 3 VPNs
Enter the ping mpls l3vpn command with the following syntax. Table 118 on page
234 describes the ping mpls l3vpn command options.
user@host> ping mpls l3vpn prefix prefix-name <l3vpn-name> <bottom-label-ttl>
<exp forwarding-class> <count number> <source source-address> <detail>
To quit the ping mpls l3vpn command, press Ctrl-C.
Alternatively, you can use the J-Web interface. (See “Checking MPLS Connections
from the J-Web Interface” on page 219.)
Table 118: CLI ping mpls l3vpn Command Options
Option
Description
l3vpn prefix prefix-name
Pings the remote host specified by the prefix to verify that the prefix is present in the PE router's
VPN routing and forwarding (VRF) table. This option does not test the connectivity between a
PE router and a CE router.
l3vpn-name
(Optional) Layer 3 VPN name.
bottom-label-ttl
(Optional) Displays the time-to-live (TTL) value for the bottom label in the MPLS label stack.
exp forwarding-class
(Optional) Specifies the value of the forwarding class to be used in the MPLS ping packets.
countnumber
(Optional) Limits the number of ping requests to send. Specify a count from 0 through 1,000,000.
The default value is 5. If you do not specify a count, ping requests are continuously sent until
you press Ctrl-C.
source source-address
(Optional) Uses the source address that you specify, in the ping request packet.
detail
(Optional) Displays detailed output about the echo requests sent and received. Detailed output
includes the MPLS labels used for each request and the return codes for each request.
Following is sample output from a ping mpls l3vpn command:
user@host> ping mpls l3vpn vpn1 prefix 10.255.245.122/32
!!!!!
--- lsping statistics --5 packets transmitted, 5 packets received, 0% packet loss
The fields in the display are the same as those displayed by the J-Web ping MPLS
diagnostic tool. For information, see “Ping MPLS Results and Output” on page 222.
234
■
Using CLI Diagnostic Commands
Chapter 12: Using Services Router Diagnostic Tools
Pinging Layer 2 VPNs
Enter the ping mpls l2vpn command with the following syntax. Table 119 on page
235 describes the ping mpls l2vpn command options.
user@host> ping mpls l2vpn interface interface-name | instance l2vpn-instance-name
local-site-id local-site-id-number remote-site-id remote-site-id-number
<bottom-label-ttl> <exp forwarding-class> <count number> <source source-address>
<detail>
To quit the ping mpls l2vpn command, press Ctrl-C.
Alternatively, you can use the J-Web interface. (See “Checking MPLS Connections
from the J-Web Interface” on page 219.)
Table 119: CLI ping mpls l2vpn Command Options
Option
Description
l2vpn interface
interface-name
Sends ping requests out the specified interface configured for the Layer 2 VPN on the outbound
(egress) PE router.
l2vpn instance
l2vpn-instance-name
local-site-id
local-site-id-number
remote-site-id
remote-site-id-number
Pings on a combination of the Layer 2 VPN routing instance name, the local site identifier, and
the remote site identifier, testing the integrity of the Layer 2 VPN circuit (specified by the
identifiers) between the inbound (ingress) and outbound PE routers.
bottom-label-ttl
(Optional) Displays the time-to-live (TTL) value for the bottom label in the MPLS label stack.
exp forwarding-class
(Optional) Specifies the value of the forwarding class to be used in the MPLS ping packets.
countnumber
(Optional) Limits the number of ping requests to send. Specify a count from 0 through 1,000,000.
The default value is 5. If you do not specify a count, ping requests are continuously sent until
you press Ctrl-C.
source source-address
(Optional) Uses the source address that you specify, in the ping request packet.
detail
(Optional) Displays detailed output about the echo requests sent and received. Detailed output
includes the MPLS labels used for each request and the return codes for each request.
Following is sample output from a ping mpls l2vpn command:
user@host> ping mpls l2vpn instance vpn1 remote-site-id 1 local-site-id 2 detail
Request for seq 1, to interface 68, labels <800001, 100176>
Reply for seq 1, return code: Egress-ok
Request for seq 2, to interface 68, labels <800001, 100176>
Reply for seq 2, return code: Egress-ok
Request for seq 3, to interface 68, labels <800001, 100176>
Reply for seq 3, return code: Egress-ok
Request for seq 4, to interface 68, labels <800001, 100176>
Reply for seq 4, return code: Egress-ok
Request for seq 5, to interface 68, labels <800001, 100176>
Using CLI Diagnostic Commands
■
235
J-series™ Services Router Administration Guide
Reply for seq 5, return code: Egress-ok
--- lsping statistics --5 packets transmitted, 5 packets received, 0% packet loss
The fields in the display are the same as those displayed by the J-Web ping MPLS
diagnostic tool. For information, see “Ping MPLS Results and Output” on page 222.
Pinging Layer 2 Circuits
Enter the ping mpls l2circuit command with the following syntax. Table 120 on page
236 describes the ping mpls l2circuit command options.
user@host> ping mpls l2circuit (interface interface-name | virtual-circuit neighbor
prefix-name virtual-circuit-id) <exp forwarding-class> <count number>
<source source-address> <detail>
To quit the ping mpls l2circuit command, press Ctrl-C.
Alternatively, you can use the J-Web interface. (See “Checking MPLS Connections
from the J-Web Interface” on page 219.)
Table 120: CLI ping mpls l2circuit Command Options
Option
Description
l2circuit interface
interface-name
Sends ping requests out the specified interface configured for the Layer 2 circuit on the outbound
PE router.
l2circuit virtual-circuit
neighbor prefix-name
virtual-circuit-id
Pings on a combination of the IPv4 prefix and the virtual circuit identifier on the outbound PE
router, testing the integrity of the Layer 2 circuit between the inbound and outbound PE routers.
exp forwarding-class
(Optional) Specifies the value of the forwarding class to be used in the MPLS ping packets.
countnumber
(Optional) Limits the number of ping requests to send. Specify a count from 0 through 1,000,000.
The default value is 5. If you do not specify a count, ping requests are continuously sent until
you press Ctrl-C.
source source-address
(Optional) Uses the source address that you specify, in the ping request packet.
detail
(Optional) Displays detailed output about the echo requests sent and received. Detailed output
includes the MPLS labels used for each request and the return codes for each request.
Following is sample output from a ping mpls l2circuit command:
user@host> ping mpls l2circuit interface fe-1/0/0.0
Request for seq 1, to interface 69, labels <100000, 100208>
Reply for seq 1, return code: Egress-ok, time: 0.439 ms
The fields in the display are the same as those displayed by the J-Web ping MPLS
diagnostic tool. For information, see “Ping MPLS Results and Output” on page 222.
236
■
Using CLI Diagnostic Commands
Chapter 12: Using Services Router Diagnostic Tools
Tracing Unicast Routes from the CLI
Use the CLI traceroute command to display a list of routers between the Services
Router and a specified destination host. This command is useful for diagnosing a
point of failure in the path from the Services Router to the destination host, and
addressing network traffic latency and throughput problems.
The Services Router generates the list of routers by sending a series of ICMP traceroute
packets in which the time-to-live (TTL) value in the messages sent to each successive
router is incremented by 1. (The TTL value of the first traceroute packet is set to 1.)
In this manner, each router along the path to the destination host replies with a Time
Exceeded packet from which the source IP address can be obtained.
Alternatively, you can use the J-Web interface. (See “Tracing Unicast Routes from
the J-Web Interface” on page 223.)
The traceroute monitor command combines ping and traceroute functionality to
display real-time monitoring information about each router between the Services
Router and a specified destination host.
This section contains the following topics. For more information about traceroute
commands, see the JUNOS System Basics and Services Command Reference.
■
Using the traceroute Command on page 237
■
Using the traceroute monitor Command on page 238
Using the traceroute Command
To display a list of routers between the Services Router and a specified destination
host, enter the traceroute command with the following syntax. Table 121 on page
237 describes the traceroute command options.
user@host> traceroute host <interface interface-name> <as-number-lookup>
<bypass-routing> <gateway address> <inet | inet6> <no-resolve>
<routing-instance routing-instance-name> <source source-address> <tos number>
<ttl number> <wait seconds>
To quit the traceroute command, press Ctrl-C.
Table 121: CLI traceroute Command Options
Option
Description
host
Sends traceroute packets to the hostname or IP address you specify.
interface interface-name
(Optional) Sends the traceroute packets on the interface you specify. If you do not include this
option, traceroute packets are sent on all interfaces.
as-number-lookup
(Optional) Displays the autonomous system (AS) number of each intermediate hop between the
router and the destination host.
Using CLI Diagnostic Commands
■
237
J-series™ Services Router Administration Guide
Table 121: CLI traceroute Command Options (continued)
Option
Description
bypass-routing
(Optional) Bypasses the routing tables and sends the traceroute packets only to hosts on directly
attached interfaces. If the host is not on a directly attached interface, an error message is returned.
Use this option to display a route to a local system through an interface that has no route through
it.
gateway address
(Optional) Uses the gateway you specify to route through.
inet
(Optional) Forces the traceroute packets to an IPv4 destination.
inet6
(Optional) Forces the traceroute packets to an IPv6 destination.
no-resolve
(Optional) Suppresses the display of the hostnames of the hops along the path.
routing-instance
routing-instance-name
(Optional) Uses the routing instance you specify for the traceroute.
source address
(Optional) Uses the source address that you specify, in the traceroute packet.
tos number
(Optional) Sets the type-of-service (TOS) value in the IP header of the traceroute packet. Specify
a value from 0 through 255.
ttl number
(Optional) Sets the time-to-live (TTL) value for the traceroute packet. Specify a hop count from
0 through 128.
wait seconds
(Optional) Sets the maximum time to wait for a response.
Following is sample output from a traceroute command:
user@host> traceroute host2
traceroute to 173.24.232.66 (172.24.230.41),
1 173.18.42.253 (173.18.42.253) 0.482 ms
2 host4.site1.net (173.18.253.5) 0.401 ms
3 host5.site1.net (173.18.253.5) 0.401 ms
4 173.24.232.65 (173.24.232.65) 0.420 ms
5 173.24.232.66 (173.24.232.66) 0.830 ms
30 hops max, 40 byte packets
0.346 ms 0.318 ms
0.435 ms 0.359 ms
0.360 ms 0.357 ms
0.456 ms 0.378 ms
0.779 ms 0.834 ms
The fields in the display are the same as those displayed by the J-Web traceroute
diagnostic tool. For information, see “Traceroute Results and Output
Summary” on page 225.
Using the traceroute monitor Command
To display real-time monitoring information about each router between the Services
Router and a specified destination host, enter the traceroute monitor command with
the following syntax. Table 122 on page 239 describes the traceroute monitor command
options.
user@host> traceroute monitor host <count number> <inet | inet6> <interval seconds>
<no-resolve> <size bytes><source source-address> <summary>
238
■
Using CLI Diagnostic Commands
Chapter 12: Using Services Router Diagnostic Tools
To quit the traceroute monitor command, press Q.
Table 122: CLI traceroute monitor Command Options
Option
Description
host
Sends traceroute packets to the hostname or IP address you specify.
count number
(Optional) Limits the number of ping requests, in packets, to send in summary mode. If you do
not specify a count, ping requests are continuously sent until you press Q.
inet
(Optional) Forces the traceroute packets to an IPv4 destination.
inet6
(Optional) Forces the traceroute packets to an IPv6 destination.
interval seconds
(Optional) Sets the interval between ping requests, in seconds. The default value is 1 second.
no-resolve
(Optional) Suppresses the display of the hostnames of the hops along the path.
size bytes
(Optional) Sets the size of the ping request packet. The size can be from 0 through 65468 bytes.
The default packet size is 64 bytes.
source address
(Optional) Uses the source address that you specify, in the traceroute packet.
summary
(Optional) Displays the summary traceroute information.
Following is sample output from a traceroute monitor command:
user@host> traceroute monitor host2
My traceroute
host (0.0.0.0)(tos=0x0 psize=64 bitpattern=0x00)
Wed Mar 14 23:14:11 2007
Keys: Help
Display mode
Restart statistics
Order of fields
[v0.69]
quit
Packets
Pings
Host
Last
Avg Best Wrst StDev
1. 173.24.232.66
9.4
8.6
4.8
9.9
2.1
2. 173.24.232.66
7.9 17.2
7.9 29.4 11.0
3. 173.24.232.66
9.9
9.3
8.7
9.9
0.5
4. 173.24.232.66
9.9
9.8
9.5 10.0
0.2
Loss%
Snt
0.0%
5
0.0%
5
0.0%
5
0.0%
5
Table 123 on page 240 summarizes the output fields of the display.
Using CLI Diagnostic Commands
■
239
J-series™ Services Router Administration Guide
Table 123: CLI traceroute monitor Command Output Summary
Field
Description
host
Hostname or IP address of the Services Router issuing the traceroute monitor command.
psizesize
Size of ping request packet, in bytes.
Keys
Displays the help for the CLI commands.
Help
Press H to display the help.
Display mode
Toggles the display mode.
Press D to toggle the display mode
Restart statistics
Restarts the traceroute monitor command.
Press R to restart the traceroute monitor command.
Order of fields
Sets the order of the displayed fields.
Press O to set the order of the displayed fields.
Quits the traceroute monitor command.
quit
Press Q to quit the traceroute monitor command.
Packets
number
Number of the hop (router) along the route to the final destination host.
Host
Hostname or IP address of the router at each hop.
Loss%
Percent of packet loss. The number of ping responses divided by the number of ping
requests, specified as a percentage.
Pings
Snt
Number of ping requests sent to the router at this hop.
Last
Most recent round-trip time, in milliseconds, to the router at this hop.
Avg
Average round-trip time, in milliseconds, to the router at this hop.
Best
Shortest round-trip time, in milliseconds, to the router at this hop.
Wrst
Longest round-trip time, in milliseconds, to the router at this hop.
StDev
Standard deviation of round-trip times, in milliseconds, to the router at this hop.
Tracing Multicast Routes from the CLI
Use CLI mtrace commands to trace information about multicast paths. The mtrace
from-source command displays information about a multicast path from a source to
240
■
Using CLI Diagnostic Commands
Chapter 12: Using Services Router Diagnostic Tools
the Services Router. The mtrace monitor command monitors and displays multicast
trace operations.
This section contains the following topics. For more information about mtrace
commands, see the JUNOS System Basics and Services Command Reference.
■
Using the mtrace from-source Command on page 241
■
Using the mtrace monitor Command on page 243
Using the mtrace from-source Command
To display information about a multicast path from a source to the Services Router,
enter the mtrace from-source command with the following syntax. Table 124 on page
241 describes the mtrace from-source command options.
user@host> mtrace from-source source host <extra-hops number> <group address>
<interval seconds> <max-hops number> <max-queries number> <response host>
<routing-instance routing-instance-name> <ttl number> <wait-time seconds> <loop>
<multicast-response | unicast-response> <no-resolve> <no-router-alert> <brief |
detail>
Table 124: CLI mtrace from-source Command Options
Option
Description
source host
Traces the path to the specified hostname or IP address.
extra-hops number
(Optional) Sets the number of extra hops to trace past nonresponsive routers. Specify
a value from 0 through 255.
group address
(Optional) Traces the path for the specified group address. The default value is 0.0.0.0.
interval seconds
(Optional) Sets the interval between statistics gathering. The default value is 10.
max-hops number
(Optional) Sets the maximum number of hops to trace toward the source. Specify a
value from 0 through 255. The default value is 32.
max-queries number
(Optional) Sets the maximum number of query attempts for any hop. Specify a value
from 1 through 32. The default value is 3.
response host
(Optional) Sends the response packets to the specified hostname or IP address. By
default, the response packets are sent to the Services Router.
routing-instance
routing-instance-name
(Optional) Traces the routing instance you specify.
ttl number
(Optional) Sets the time-to-live (TTL) value in the IP header of the query packets. Specify
a hop count from 0 through 255. The default value for local queries to the all routers
multicast group is 1. Otherwise, the default value is 127.
wait-time seconds
(Optional) Sets the time to wait for a response packet. The default value is 3 seconds.
loop
(Optional) Loops indefinitely, displaying rate and loss statistics. To quit the mtrace
command, press Ctrl-C.
Using CLI Diagnostic Commands
■
241
J-series™ Services Router Administration Guide
Table 124: CLI mtrace from-source Command Options (continued)
Option
Description
multicast-response
(Optional) Forces the responses to use multicast.
unicast-response
(Optional) Forces the response packets to use unicast.
no-resolve
(Optional) Does not display hostnames.
no-router-alert
(Optional) Does not use the router alert IP option in the IP header.
brief
(Optional) Does not display packet rates and losses.
detail
(Optional) Displays packet rates and losses if a group address is specified.
Following is sample output from the mtrace from-source command:
user@host> mtrace from-source source 192.1.4.1 group 224.1.1.1
Mtrace from 192.1.4.1 to 192.1.30.2 via group 224.1.1.1
Querying full reverse path... * *
0 ? (192.1.30.2)
-1 ? (192.1.30.1) PIM thresh^ 1
-2 routerC.mycompany.net (192.1.40.2) PIM thresh^ 1
-3 hostA.mycompany.net (192.1.4.1)
Round trip time 22 ms; total ttl of 2 required.
Waiting to accumulate statistics...Results after 10 seconds:
Source
Response Dest
Overall
Packet Statistics For Traffic From
192.1.4.1 192.1.30.2
Packet
192.1.4.1 To 224.1.1.1
v
__/ rtt
16 ms
Rate
Lost/Sent = Pct Rate
192.168.195.37
192.1.40.2
routerC.mycompany.net
v
^
ttl
2
0/0
= -0 pps
192.1.40.1
192.1.30.1
?
v
\__
ttl
3
?/0
0 pps
192.1.30.2
192.1.30.2
Receiver
Query Source
Each line of the trace display is usually in the following format (depending on the
options selected and the responses from the routers along the path):
hop-number host (ip-address) protocolttl
Table 125 on page 243 summarizes the output fields of the display.
NOTE: The packet statistics gathered from Juniper Networks routers and routing
nodes are always displayed as 0.
242
■
Using CLI Diagnostic Commands
Chapter 12: Using Services Router Diagnostic Tools
Table 125: CLI mtrace from-source Command Output Summary
Field
Description
hop-number
Number of the hop (router) along the path.
host
Hostname, if available, or IP address of the router. If the no-resolve option was entered
in the command, the hostname is not displayed.
ip-address
IP address of the router.
protocol
Protocol used.
ttl
TTL threshold.
Round trip time milliseconds ms
Total time between the sending of the query packet and the receiving of the response
packet.
total ttl of number required
Total number of hops required to reach the source.
Source
Source IP address of the response packet.
Response Dest
Response destination IP address.
Overall
Average packet rate for all traffic at each hop.
Packet Statistics For Traffic From
Number of packets lost, number of packets sent, percentage of packets lost, and average
packet rate at each hop.
Receiver
IP address receiving the multicast packets.
Query Source
IP address of the host sending the query packets.
Using the mtrace monitor Command
To monitor and display multicast trace operations, enter the mtrace monitor command:
user@host> mtrace monitor
Mtrace query at Apr 21 16:00:54 by 192.1.30.2, resp to 224.0.1.32, qid 2a83aa
packet from 192.1.30.2 to 224.0.0.2
from 192.1.30.2 to 192.1.4.1 via group 224.1.1.1 (mxhop=60)
Mtrace query at Apr 21 16:00:57 by 192.1.30.2, resp to 224.0.1.32, qid 25dc17
packet from 192.1.30.2 to 224.0.0.2
from 192.1.30.2 to 192.1.4.1 via group 224.1.1.1 (mxhop=60)
Mtrace query at Apr 21 16:01:00 by 192.1.30.2, resp to same, qid 20e046
packet from 192.1.30.2 to 224.0.0.2
from 192.1.30.2 to 192.1.4.1 via group 224.1.1.1 (mxhop=60)
Mtrace query at Apr 21 16:01:10 by 192.1.30.2, resp to same, qid 1d25ad
packet from 192.1.30.2 to 224.0.0.2
from 192.1.30.2 to 192.1.4.1 via group 224.1.1.1 (mxhop=60)
Using CLI Diagnostic Commands
■
243
J-series™ Services Router Administration Guide
This example displays only mtrace queries. When the Services Router captures an
mtrace response, the display is similar, but the complete mtrace response is also
displayed—exactly as it is displayed in mtrace from-source command output.
Table 126 on page 244 summarizes the output fields of the display.
Table 126: CLI mtrace monitor Command Output Summary
Field
Description
Mtrace operation-type at time-of-day
■
operation-type—Type of multicast trace operation: query or response.
■
time-of-day—Date and time the multicast trace query or response was captured.
by
IP address of the host issuing the query.
resp to address
address—Response destination address.
qid qid
qid—Query ID number.
packet from source to destination
■
source—IP address of the source of the query or response.
■
destination—IP address of the destination of the query or response.
■
source—IP address of the multicast source.
■
destination—IP address of the multicast destination.
from source to destination
via group address
address—Group address being traced.
mxhop=number
number—Maximum hop setting.
Displaying Log and Trace Files from the CLI
You can enter the monitor start command to display real-time additions to system
logs and trace files:
user@host> monitor start filename
When the Services Router adds a record to the file specified by filename, the record
is displayed on the screen. For example, if you have configured a system log file
named system-log (by including the syslog statement at the [edit system] hierarchy
level), you can enter the monitor start system-log command to display the records
added to the system log.
To display a list of files that are being monitored, enter the monitor list command.
To stop the display of records for a specified file, enter the monitor stop filename
command.
244
■
Using CLI Diagnostic Commands
Chapter 12: Using Services Router Diagnostic Tools
Monitoring Interfaces and Traffic from the CLI
This section contains the following topics:
■
Using the monitor interface Command on page 245
■
Using the monitor traffic Command on page 246
Using the monitor interface Command
Use the CLI monitor interface command to display real-time traffic, error, alarm, and
filter statistics about a physical or logical interface. Enter the command with the
following syntax:
user@host> monitor interface (interface-name | traffic)
Replace interface-name with the name of a physical or logical interface. If you specify
the traffic option, statistics for all active interfaces are displayed.
The real-time statistics are updated every second. The Current delta and Delta columns
display the amount the statistics counters have changed since the monitor interface
command was entered or since you cleared the delta counters. Table 127 on page
245 and Table 128 on page 245 list the keys you use to control the display using the
interface-name and traffic options. (The keys are not case sensitive.)
Table 127: CLI monitor interface Output Control Keys
Key
Action
c
Clears (returns to 0) the delta counters in the Current delta column. The
statistics counters are not cleared.
f
Freezes the display, halting the update of the statistics and delta counters.
i
Displays information about a different interface. You are prompted for the
name of a specific interface.
n
Displays information about the next interface. The Services Router scrolls
through the physical and logical interfaces in the same order in which they
are displayed by the show interfaces terse command.
q or ESC
Quits the command and returns to the command prompt.
t
Thaws the display, resuming the update of the statistics and delta counters.
Table 128: CLI monitor interface traffic Output Control Keys
Key
Action
b
Displays the statistics in units of bytes and bytes per second (bps).
c
Clears (returns to 0) the delta counters in the Delta column. The statistics
counters are not cleared.
Using CLI Diagnostic Commands
■
245
J-series™ Services Router Administration Guide
Table 128: CLI monitor interface traffic Output Control Keys (continued)
Key
Action
d
Displays the Delta column instead of the rate column—in bps or packets per
second (pps).
p
Displays the statistics in units of packets and packets per second (pps).
q or ESC
Quits the command and returns to the command prompt.
r
Displays the rate column—in bps and pps—instead of the Delta column.
Following are sample displays from the monitor interface command:
user@host> monitor interface fe-0/0/0
host1
Seconds: 11
Interface: fe-0/0/0, Enabled, Link is Up
Encapsulation: Ethernet, Speed: 100mbps
Traffic statistics:
Input bytes:
381588589
Output bytes:
9707279
Input packets:
4064553
Output packets:
66683
Error statistics:
Input errors:
0
Input drops:
0
Input framing errors:
0
Carrier transitions:
0
Output errors:
0
Output drops:
0
Time: 16:47:49
Delay: 0/0/0
Current delta
[11583]
[6542]
[145]
[25]
[0]
[0]
[0]
[0]
[0]
[0]
NOTE: The output fields displayed when you enter the monitor interface interface-name
command are determined by the interface you specify.
user@host> monitor interface traffic
Interface
Link Input packets
fe-0/0/0
Up
42334
fe-0/0/1
Up
587525876
(pps)
(5)
(12252)
Output packets
23306
589621478
(pps)
(3)
(12891)
Using the monitor traffic Command
Use the CLI monitor traffic command to display packet headers transmitted through
network interfaces.
NOTE: Using the monitor traffic command can degrade Services Router performance.
We recommend that you use filtering options—such as count and matching—to
minimize the impact to packet throughput on the Services Router.
246
■
Using CLI Diagnostic Commands
Chapter 12: Using Services Router Diagnostic Tools
Enter the monitor traffic command with the following syntax. Table 129 on page 247
describes the monitor traffic command options.
user@host> monitor traffic <absolute-sequence> <count number>
<interface interface-name> <layer2-headers> <matching "expression">
<no-domain-names> <no-promiscuous> <no-resolve> <no-timestamp> <print-ascii>
<print-hex> <size bytes> <brief | detail | extensive>
To quit the monitor traffic command and return to the command prompt, press Ctrl-C.
If you want to capture and view packet headers using the J-Web interface, see
“Capturing and Viewing Packets with the J-Web Interface” on page 226.
Table 129: CLI monitor traffic Command Options
Option
Description
absolute-sequence
(Optional) Displays the absolute TCP sequence numbers.
count number
(Optional) Displays the specified number of packet headers. Specify
a value from 0 through 100,000. The command quits and exits to
the command prompt after this number is reached.
interface interface-name
(Optional) Displays packet headers for traffic on the specified
interface. If an interface is not specified, the lowest numbered
interface is monitored.
layer2-headers
(Optional) Displays the link-layer packet header on each line.
matching "expression"
(Optional) Displays packet headers that match an expression
enclosed in quotation marks (" "). Table 130 on page 248 through
Table 132 on page 250 list match conditions, logical operators, and
arithmetic, binary, and relational operators you can use in the
expression.
no-domain-names
(Optional) Suppresses the display of the domain name portion of
the hostname.
no-promiscuous
(Optional) Specifies not to place the monitored interface in
promiscuous mode.
In promiscuous mode, the interface reads every packet that reaches
it. In nonpromiscuous mode, the interface reads only the packets
addressed to it.
no-resolve
(Optional) Suppresses the display of hostnames.
no-timestamp
(Optional) Suppresses the display of packet header timestamps.
print-ascii
(Optional) Displays each packet header in ASCII format.
print-hex
(Optional) Displays each packet header, except link-layer headers,
in hexadecimal format.
size bytes
(Optional) Displays the number of bytes for each packet that you
specify. If a packet header exceeds this size, the displayed packet
header is truncated. The default value is 96.
Using CLI Diagnostic Commands
■
247
J-series™ Services Router Administration Guide
Table 129: CLI monitor traffic Command Options (continued)
Option
Description
brief
(Optional) Displays minimum packet header information. This is
the default.
detail
(Optional) Displays packet header information in moderate detail.
For some protocols, you must also use the size option to see
detailed information.
extensive
(Optional) Displays the most extensive level of packet header
information. For some protocols, you must also use the size option
to see extensive information.
To limit the packet header information displayed by the monitor traffic command,
include the matching "expression" option. An expression consists of one or more
match conditions listed in Table 130 on page 248, enclosed in quotation marks (" ").
You can combine match conditions by using the logical operators listed in
Table 131 on page 250 (shown in order of highest to lowest precedence).
For example, to display TCP or UDP packet headers, enter the following command:
user@host> monitor traffic matching “tcp || udp”
To compare the following types of expressions, use the relational operators listed in
Table 132 on page 250 (listed from highest to lowest precedence):
■
Arithmetic—Expressions that use the arithmetic operators listed in
Table 132 on page 250.
■
Binary—Expressions that use the binary operators listed in Table 132 on page 250.
■
Packet data accessor—Expressions that use the following syntax:
protocol [byte-offset <size>]
Replace protocol with any protocol in Table 130 on page 248. Replace byte-offset
with the byte offset, from the beginning of the packet header, to use for the
comparison. The optional size parameter represents the number of bytes
examined in the packet header—1, 2, or 4 bytes.
For example, the following command displays all multicast traffic:
user@host> monitor traffic matching “ether[0] & 1 !=0”
Table 130: CLI monitor traffic Match Conditions
Match Condition
Description
Entity Type
248
■
Using CLI Diagnostic Commands
Chapter 12: Using Services Router Diagnostic Tools
Table 130: CLI monitor traffic Match Conditions (continued)
Match Condition
Description
host [address | hostname]
Matches packet headers that contain the specified address or hostname. You can
preprend any of the following protocol match conditions, followed by a space, to host:
arp, ip, rarp, or any of the Directional match conditions.
network address
Matches packet headers with source or destination addresses containing the specified
network address.
network address mask mask
Matches packet headers containing the specified network address and subnet mask.
port [port-number | port-name]
Matches packet headers containing the specified source or destination TCP or UDP
port number or port name.
Directional
Directional match conditions can be prepended to any Entity Type match conditions,
followed by a space.
destination
Matches packet headers containing the specified destination.
source
Matches packet headers containing the specified source.
source and destination
Matches packet headers containing the specified source and destination.
source or destination
Matches packet headers containing the specified source or destination.
Packet Length
less bytes
Matches packets with lengths less than or equal to the specified value, in bytes.
greater bytes
Matches packets with lengths greater than or equal to the specified value, in bytes.
Protocol
arp
Matches all ARP packets.
ether
Matches all Ethernet frames.
ether [broadcast | multicast]
Matches broadcast or multicast Ethernet frames. This match condition can be prepended
with source or destination.
ether protocol [address | (\arp | \ip |
\rarp)
Matches Ethernet frames with the specified address or protocol type. The arguments
arp, ip, and rarp are also independent match conditions, so they must be preceded with
a backslash (\) when used in the ether protocol match condition.
icmp
Matches all ICMP packets.
ip
Matches all IP packets.
ip [broadcast | multicast]
Matches broadcast or multicast IP packets.
ip protocol [address | (\icmp | igrp |
\tcp | \udp)]
Matches IP packets with the specified address or protocol type. The arguments icmp,
tcp, and udp are also independent match conditions, so they must be preceded with
a backslash (\) when used in the ip protocol match condition.
isis
Matches all IS-IS routing messages.
rarp
Matches all RARP packets.
Using CLI Diagnostic Commands
■
249
J-series™ Services Router Administration Guide
Table 130: CLI monitor traffic Match Conditions (continued)
Match Condition
Description
tcp
Matches all TCP packets.
udp
Matches all UDP packets.
Table 131: CLI monitor traffic Logical Operators
Logical Operator
Description
!
Logical NOT. If the first condition does not match, the next condition is
evaluated.
&&
Logical AND. If the first condition matches, the next condition is evaluated.
If the first condition does not match, the next condition is skipped.
||
Logical OR. If the first condition matches, the next condition is skipped. If
the first condition does not match, the next condition is evaluated.
()
Group operators to override default precedence order. Parentheses are special
characters, each of which must be preceded by a backslash (\).
Table 132: CLI monitor traffic Arithmetic, Binary, and Relational Operators
Operator
Description
Arithmetic Operator
+
Addition operator.
–
Subtraction operator.
/
Division operator.
Binary Operator
&
Bitwise AND.
*
Bitwise exclusive OR.
|
Bitwise inclusive OR.
Relational Operator
250
■
<=
A match occurs if the first expression is less than or equal to the second.
>=
A match occurs if the first expression is greater than or equal to the second.
<
A match occurs if the first expression is less than the second.
>
A match occurs if the first expression is greater than the second.
=
A match occurs if the first expression is equal to the second.
Using CLI Diagnostic Commands
Chapter 12: Using Services Router Diagnostic Tools
Table 132: CLI monitor traffic Arithmetic, Binary, and Relational Operators (continued)
Operator
Description
!=
A match occurs if the first expression is not equal to the second.
Following is sample output from the monitor traffic command:
user@host> monitor traffic count 4 matching “arp” detail
Listening on fe-0/0/0, capture size 96 bytes
15:04:16.276780
15:04:16.376848
15:04:16.376887
15:04:16.601923
In
In
In
In
arp
arp
arp
arp
who-has
who-has
who-has
who-has
193.1.1.1 tell host1.site2.net
host2.site2.net tell host1.site2.net
193.1.1.2 tell host1.site2.net
193.1.1.3 tell host1.site2.net
Using CLI Diagnostic Commands
■
251
J-series™ Services Router Administration Guide
252
■
Using CLI Diagnostic Commands
Chapter 13
Configuring Packet Capture
Packet capture is a tool that helps you to analyze network traffic and troubleshoot
network problems. On a J-series Services Router, the packet capture tool captures
real-time data packets traveling over the network, for monitoring and logging.
Packets are captured as binary data, without modification. You can read the packet
information offline with a packet analyzer such as Ethereal or tcpdump.
If you need to quickly capture packets destined for or originating from the Routing
Engine and analyze them online, you can use the J-Web packet capture diagnostic
tool. For more information, see “Capturing and Viewing Packets with the J-Web
Interface” on page 226.
NOTE: J-series Services Routers can capture IPv4 packets only. The packet capture
tool does not support IPv6 packet capture.
You can use either the J-Web configuration editor or CLI configuration editor to
configure packet capture. For more information about packet capture, see the JUNOS
Policy Framework Configuration Guide.
This chapter contains the following topics.
■
Packet Capture Terms on page 253
■
Packet Capture Overview on page 254
■
Before You Begin on page 257
■
Configuring Packet Capture with a Configuration Editor on page 257
■
Changing Encapsulation on Interfaces with Packet Capture Configured on page 262
■
Verifying Packet Capture on page 263
Packet Capture Terms
Before configuring packet capture on a Services Router, become familiar with the
terms defined in Table 133 on page 254.
Packet Capture Terms
■
253
J-series™ Services Router Administration Guide
Table 133: Packet Capture Terms
Term
Definition
interface sampling
Packet sampling method used by packet capture, in which entire IPv4 packets flowing in the
input or output direction, or both directions, are captured for analysis.
libpcap
An implementation of the pcap application programming interface. libpcap may be used by a
program to capture packets traveling over a network.
packet capture
1.
Packet sampling method available only on J-series routers, in which entire IPv4 packets
flowing through a router are captured for analysis. Packets are captured in the Routing
Engine and stored as libpcap-formatted files in the /var/tmp directory on the router. Packet
capture files can be opened and analyzed offline with packet analyzers such as tcpdump
or Ethereal. To avoid performance degradation on the router, implement packet capture
with firewall filters that capture only selected packets. See also traffic sampling.
2.
Packet sampling method available from the J-Web interface, for capturing the headers of
packets destined for or originating from the Routing Engine. (See “Capturing and Viewing
Packets with the J-Web Interface” on page 226).
packet loss priority (PLP)
bit
Bit used to identify packets that have experienced congestion or are from a transmission that
exceeded a service provider's customer service license agreement. This bit can be used as part
of a router's congestion control mechanism and can be set by the interface or by a filter.
port mirroring
The process of sending a copy of a packet from the router to an external host address.
For more information about port mirroring, see the JUNOS Policy Framework Configuration Guide.
tcpdump
A command line utility for debugging computer network problems. tcpdump allows the user to
display the contents of TCP/IP and other packets captured on a network interface. On UNIX and
most other operating systems, a user must have superuser privileges to use tcpdump due to its
use of promiscuous mode.
traffic sampling
Packet sampling method in which the sampling key based on the IPv4 header is sent to the
Routing Engine. There, the key is placed in a file, or cflowd packets based on the key and are
sent to a cflowd server for analysis. See also packet capture.
Packet Capture Overview
Packet capture is used by network administrators and security engineers for the
following purposes:
■
Monitor network traffic and analyze traffic patterns.
■
Identify and troubleshoot network problems.
■
Detect security breaches in the network, such as unauthorized intrusions, spyware
activity, or ping scans.
Packet capture operates like traffic sampling on the Services Router, except that it
captures entire packets including the Layer 2 header rather than packet headers and
saves the contents to a file in the libpcap format. Packet capture also captures IP
fragments. Unlike traffic sampling, there are no tracing operations for packet capture.
254
■
Packet Capture Overview
Chapter 13: Configuring Packet Capture
NOTE: You can enable packet capture and port mirroring simultaneously on a Services
Router.
For more information about traffic sampling, see the JUNOS Policy Framework
Configuration Guide.
This overview contains the following topics:
■
Packet Capture on Router Interfaces on page 255
■
Firewall Filters for Packet Capture on page 255
■
Packet Capture Files on page 256
■
Analysis of Packet Capture Files on page 256
Packet Capture on Router Interfaces
Packet capture is supported on the T1, T3, E1, E3, serial, Fast Ethernet, ADSL,
G.SHDSL, PPPoE, and ISDN interfaces.
To capture packets on an ISDN interface, configure packet capture on the dialer
interface. To capture packets on a PPPoE interface, configure packet capture on the
PPPoE logical interface.
Packet capture supports PPP, Cisco HDLC, Frame Relay, and other ATM
encapsulations. Packet capture also supports Multilink PPP (MLPPP), Multilink Frame
Relay end-to-end (MLFR), and Multilink Frame Relay UNI/NNI (MFR) encapsulations.
You can capture all IPv4 packets flowing on an interface in the inbound (ingress) or
outbound (egress) direction or in both directions. Tunnel interfaces can support
packet capture in the outbound direction only.
Use the J-Web configuration editor or CLI configuration editor to specify maximum
packet size, the filename to be used for storing the captured packets, maximum file
size, maximum number of packet capture files, and the file permissions. See
“Configuring Packet Capture on an Interface (Required)” on page 259.
NOTE: For packets captured on T1, T3, E1, E3, serial, and ISDN interfaces in the
outbound (egress) direction, the size of the packet captured might be 1 byte less than
the maximum packet size configured because of the packet loss priority (PLP) bit.
To modify encapsulation on an interface that has packet capture configured, you
must first disable packet capture. For more information, see “Changing Encapsulation
on Interfaces with Packet Capture Configured” on page 262.
Firewall Filters for Packet Capture
When you enable packet capture on a Services Router, all packets flowing in the
direction specified in packet capture configuration (inbound, outbound, or both) are
captured and stored. Configuring an interface to capture all packets might degrade
Packet Capture Overview
■
255
J-series™ Services Router Administration Guide
the performance of the Services Router. You can control the number of packets
captured on an interface with firewall filters and specify various criteria to capture
packets for specific traffic flows.
You must also configure and apply appropriate firewall filters on the interface if you
need to capture packets generated by the host router, because interface sampling
does not capture packets originating from the host router.
To configure firewall filters for packet capture, see “Configuring a Firewall Filter for
Packet Capture (Optional)” on page 259.
For more information about firewall filters, see the J-series Services Router Advanced
WAN Access Configuration Guide.
Packet Capture Files
When packet capture is enabled on an interface, the entire packet including the
Layer 2 header is captured and stored in a file. You can specify the maximum size
of the packet to be captured, up to 1500 bytes. Packet capture creates one file for
each physical interface. You can specify the target filename, maximum size of the
file, and maximum number of files.
File creation and storage take place in the following way. Suppose you name the
packet capture file pcap-file. Packet capture creates multiple files (one per physical
interface), suffixing each file with the name of the physical interface—for example,
pcap-file.fe–0.0.1 for the Fast Ethernet interface fe–0.0.1. When the file named
pcap-file.fe-0.0.1 reaches the maximum size, the file is renamed pcap-file.fe-0.0.1.0.
When the file named pcap-file.fe-0.0.1 reaches the maximum size again, the file
named pcap-file.fe-0.0.1.0 is renamed pcap-file.fe-0.0.1.1 and pcap-file.fe-0.0.1 is
renamed pcap-file.fe-0.0.1.0. This process continues until the maximum number of
files is exceeded and the oldest file is overwritten. The pcap-file.fe-0.0.1 file is always
the latest file.
Packet capture files are not removed even after you disable packet capture on an
interface.
Analysis of Packet Capture Files
Packet capture files are stored in libpcap format in the /var/tmp directory. You can
specify user or administrator privileges for the files.
Packet capture files can be opened and analyzed offline with tcpdump or any packet
analyzer that recognizes the libpcap format. You can also use FTP or the Session
Control Protocol (SCP) to transfer the packet capture files to an external device.
NOTE: Disable packet capture before opening the file for analysis or transferring the
file to an external device with FTP or SCP. Disabling packet capture ensures that the
internal file buffer is flushed and all the captured packets are written to the file. To
disable packet capture on an interface, see “Disabling Packet Capture” on page 261.
256
■
Packet Capture Overview
Chapter 13: Configuring Packet Capture
For more details about analyzing packet capture files, see Verifying Captured
Packets on page 264.
Before You Begin
Before you begin configuring packet capture, complete the following tasks:
■
Establish basic connectivity. See the Getting Started Guide for your router.
■
Configure network interfaces. See the J-series Services Router Basic LAN and WAN
Access Configuration Guide.
■
If you do not already have an understanding of the packet capture feature, see
“Packet Capture Overview” on page 254.
Configuring Packet Capture with a Configuration Editor
To configure packet capture on a Services Router, you must perform the following
tasks marked (Required):
■
Enabling Packet Capture (Required) on page 257
■
Configuring Packet Capture on an Interface (Required) on page 259
■
Configuring a Firewall Filter for Packet Capture (Optional) on page 259
■
Disabling Packet Capture on page 261
■
Deleting Packet Capture Files on page 261
Enabling Packet Capture (Required)
To enable packet capture on the router:
1.
Navigate to the top of the configuration hierarchy in either the J-Web or CLI
configuration editor.
2.
Perform the configuration tasks described in Table 134 on page 258.
3.
Go on to “Configuring Packet Capture on an Interface (Required)” on page 259.
Before You Begin
■
257
J-series™ Services Router Administration Guide
Table 134: Enabling Packet Capture
Task
J-Web Configuration Editor
CLI Configuration Editor
Navigate to the Forwarding options
level in the configuration hierarchy.
1.
From the [edit] hierarchy level, enter
In the J-Web interface, select
Configuration>View and Edit>Edit
Configuration.
2.
Next to Forwarding options, click
Configure or Edit.
3.
Next to Scripts, click Configure or
Edit.
4.
Next to Commits, click Configure or
Edit.
edit forwarding-options
In the configuration editor hierarchy,
select Forwarding options.
Specify in bytes the maximum size
of each packet to capture in each
file—for example, 500. The range is
between 68 and 1500, and the
default is 68 bytes.
Specify the target filename for the
packet capture file—for example,
pcap-file. For each physical interface,
the interface name is automatically
suffixed to the filename—for
example, pcap-file.fe-0.0.1.
1.
From the Sampling or packet capture
list, select Packet capture.
2.
Next to Packet capture, click
Configure.
3.
In the Maximum capture size box,
type 500.
In the Filename box, type pcap-file.
Enter
set packet-capture maximum-capture-size
500
Enter
set packet-capture file filename pcap-file
(See the interface naming
conventions in the J-series Services
Router Basic LAN and WAN Access
Configuration Guide.)
Specify the maximum number of files
to capture—for example, 100. The
range is between 2 and 10,000, and
the default is 10 files.
In the Files box, type 100.
Specify the maximum size of each
file in bytes—for example, 1024. The
range is between 1,024 and
104,857,600, and the default is
512,000 bytes.
In the Size box, type 1024.
Specify if all users have permission
to read the packet capture files.
1.
Next to World readable, select Yes.
2.
Click OK.
258
■
Enter
set packet-capture file files 100
Enter
set packet-capture file size 1024
Configuring Packet Capture with a Configuration Editor
Enter
set packet-capture file world-readable
Chapter 13: Configuring Packet Capture
Configuring Packet Capture on an Interface (Required)
To capture all transit and host-bound packets on an interface and specify the direction
of the traffic to capture—inbound, outbound, or both:
1.
Navigate to the top of the configuration hierarchy in either the J-Web or CLI
configuration editor.
2.
Perform the configuration tasks described in Table 135 on page 259.
3.
If you are finished configuring the router, commit the configuration.
4.
Go on to one of the following procedures:
■
To configure a firewall filter, see “Configuring a Firewall Filter for Packet
Capture (Optional)” on page 259.
■
To check the configuration, see “Verifying Packet Capture” on page 263.
Table 135: Configuring Packet Capture on an Interface
Task
J-Web Configuration Editor
Navigate to the Interfaces level in the
configuration hierarchy, and select
an interface for packet capture—for
example, fe-0/0/1.
1.
In the J-Web interface, select
Configuration>View and Edit>Edit
Configuration.
2.
Next to Interfaces, click Configure or
Edit.
3.
In the Interface name box, click
fe-0/0/1.
1.
In the Interface unit number box,
click 0.
2.
Next to Inet, select Yes, and click
Edit.
3.
Next to Sampling, click Configure.
4.
Next to Input, select Yes.
5.
Next to Output, select Yes.
6.
Click OK until you return to the
Interface page.
(See the interface naming
conventions in the J-series Services
Router Basic LAN and WAN Access
Configuration Guide.)
Configure the direction of the traffic
for which you are enabling packet
capture on the logical interface—for
example, inbound and outbound.
CLI Configuration Editor
From the [edit] hierarchy level, enter
edit interfaces fe-0/0/1
Enter
set unit 0 family inet sampling input output
NOTE: Packets originating from the host router are not captured unless you have
configured and applied a firewall filter on the interface in the output direction.
Configuring a Firewall Filter for Packet Capture (Optional)
To configure a firewall filter and apply it to the logical interface:
Configuring Packet Capture with a Configuration Editor
■
259
J-series™ Services Router Administration Guide
1.
Navigate to the top of the configuration hierarchy in either the J-Web or CLI
configuration editor.
2.
Perform the configuration tasks described in Table 136 on page 260.
3.
If you are finished configuring the router, commit the configuration.
4.
To check the configuration, see “Verifying Packet Capture” on page 263.
Table 136: Configuring a Firewall Filter for Packet Capture
Task
J-Web Configuration Editor
CLI Configuration Editor
Navigate to the Firewall level in the
configuration hierarchy.
1.
From the [edit] hierarchy level, enter
Define a firewall filter dest-all and a
filter term—for example,
dest-term—to capture packets with a
particular destination address—for
example, 192.168.1.1/32.
In the J-Web interface, select
Configuration>View and Edit>Edit
Configuration.
2.
Next to Firewall, click Configure or
Edit.
1.
Next to Filter, click Add new entry.
2.
In the filter name box, type dest-all.
3.
Next to Term, click Add new entry.
4.
In the Rule name box, type dest-term.
5.
Next to From, click Configure.
6.
Next to Destination address, click
Add new entry.
7.
In the Address box, type
192.168.1.1/32.
8.
Click OK until you return to the
Configuration page.
Navigate to the Interfaces level in
the configuration hierarchy.
In the configuration editor hierarchy,
select Interfaces.
Apply the dest-all filter to all the
outgoing packets on the
interface—for example, fe-0/0/1.0.
1.
In the Interface name box, click
fe-0/0/1.
2.
In the Interface unit number box,
click 0.
3.
Next to Inet, select Yes, and click
Edit.
4.
Next to Filter, click Configure.
5.
In the Output box, type dest-all.
6.
Click OK until you return to the
Interfaces page.
(See the interface naming
conventions in the J-series Services
Router Basic LAN and WAN Access
Configuration Guide.)
260
■
Configuring Packet Capture with a Configuration Editor
edit firewall
Set the filter and term name, and define
the match condition and its action.
set firewall filter dest-all term dest-term from
destination-address 192.168.1.1/32
set firewall filter dest-all term dest-term then
sample accept
Enter
set interfaces fe-0/0/1 unit 0 family inet
filter output dest-all
Chapter 13: Configuring Packet Capture
NOTE: If you apply a firewall filter on the loopback interface, it affects all traffic to
and from the Routing Engine. If the firewall filter has a sample action, packets to and
from the Routing Engine are sampled. If packet capture is enabled, then packets to
and from the Routing Engine are captured in the files created for the input and output
interfaces.
Disabling Packet Capture
You must disable packet capture before opening the packet capture file for analysis
or transferring the file to an external device. Disabling packet capture ensures that
the internal file buffer is flushed and all the captured packets are written to the file.
To disable packet capture:
1.
Navigate to the top of the configuration hierarchy in either the J-Web or CLI
configuration editor.
2.
Perform the configuration tasks described in Table 137 on page 261.
3.
If you are finished configuring the router, commit the configuration.
Table 137: Disabling Packet Capture
Task
J-Web Configuration Editor
Navigate to the Forwarding options
level in the configuration hierarchy.
1.
In the J-Web interface, select
Configuration>View and Edit>Edit
Configuration.
2.
Next to Forwarding options, click
Configure or Edit.
1.
Next to Packet capture, click Edit.
2.
Next to Disable, select Yes.
3.
Click OK until you return to the
Configuration page.
Disable packet capture.
CLI Configuration Editor
From the [edit] hierarchy level, enter
edit forwarding-options
Enter set packet-capture disable.
Deleting Packet Capture Files
Deleting packet capture files from the /var/tmp directory only temporarily removes
the packet capture files. Packet capture files for the interface are automatically created
again the next time a packet capture configuration change is committed. You must
follow the procedure given in this section to delete packet capture files.
Configuring Packet Capture with a Configuration Editor
■
261
J-series™ Services Router Administration Guide
To delete a packet capture file:
1.
Disable packet capture following the steps in “Disabling Packet
Capture” on page 261.
2.
Using the CLI, delete the packet capture file for the interface:
a.
From CLI operational mode, access the local UNIX shell:
user@host> start shell
%
b.
Navigate to the directory where packet capture files are stored:
% cd /var/tmp
%
c.
Delete the packet capture file for the interface—for example, pcap-file.fe.0.0.0:
% rm pcap-file.fe.0.0.0
%
d.
Return to the CLI operational mode:
% exit
user@host>
3.
Reenable packet capture following the steps in “Enabling Packet Capture
(Required)” on page 257.
4.
Commit the configuration.
Changing Encapsulation on Interfaces with Packet Capture Configured
Before modifying the encapsulation on a Services Router interface that is configured
for packet capture, you must disable packet capture and rename the latest packet
capture file. Otherwise, packet capture saves the packets with different encapsulations
in the same packet capture file. Packet files containing packets with different
encapsulations are not useful, because packet analyzer tools like tcpdump cannot
analyze such files.
After modifying the encapsulation, you can safely reenable packet capture on the
router.
To change the encapsulation on packet capture-configured interfaces:
1.
Disable packet capture following the steps in “Disabling Packet
Capture” on page 261.
2.
Commit the configuration.
3.
Using the CLI, rename the latest packet capture file on which you are changing
the encapsulation, with the .chdsl extension:
a.
262
■
From CLI operational mode, access the local UNIX shell:
Changing Encapsulation on Interfaces with Packet Capture Configured
Chapter 13: Configuring Packet Capture
user@host> start shell
%
b.
Navigate to the directory where packet capture files are stored:
% cd /var/tmp
%
c.
Rename the latest packet capture file for the interface on which you are
changing the encapsulation—for example, fe.0.0.0:
% mv pcap-file.fe.0.0.0 pcap-file.fe.0.0.0.chdsl
%
d.
Return to the CLI operational mode:
% exit
user@host>
4.
Change the encapsulation on the interface using the J-Web or CLI configuration
editor.
See instructions for configuring interfaces in the J-series Services Router Basic
LAN and WAN Access Configuration Guide.
5.
Commit the configuration.
6.
Reenable packet capture following the steps in “Enabling Packet Capture
(Required)” on page 257.
7.
Commit the configuration.
Verifying Packet Capture
To verify packet capture, perform these tasks:
■
Displaying a Packet Capture Configuration on page 263
■
Displaying a Firewall Filter for Packet Capture Configuration on page 264
■
Verifying Captured Packets on page 264
Displaying a Packet Capture Configuration
Purpose
Action
Verify the packet capture configuration.
From the J-Web interface, select
Configuration>View and Edit>View Configuration Text. Alternatively, from
configuration mode in the CLI, enter the show forwarding-options command.
[edit]
user@host# show forwarding-options
packet-capture {
file filename pcap-file files 100 size 1024;
maximum-capture-size 500;
Verifying Packet Capture
■
263
J-series™ Services Router Administration Guide
}
Meaning
Verify that the output shows the intended file configuration for capturing packets.
Related Topics
For more information about the format of a configuration file, see the information
about viewing configuration text in the J-series Services Router Basic LAN and WAN
Access Configuration Guide.
Displaying a Firewall Filter for Packet Capture Configuration
Purpose
Action
Verify the firewall filter for packet capture configuration.
From the J-Web interface, select
Configuration>View and Edit>View Configuration Text. Alternatively, from
configuration mode in the CLI, enter the show firewall filter dest-all command.
[edit]
user@host# show firewall filter dest-all
term dest-term {
from {
destination-address 192.168.1.1/32;
}
then {
sample;
accept;
}
}
Meaning
Related Topics
Verify that the output shows the intended configuration of the firewall filter for
capturing packets sent to the destination address 192.168.1.1/32.
For more information about the format of a configuration file, see the information
about viewing configuration text in the J-series Services Router Basic LAN and WAN
Access Configuration Guide.
Verifying Captured Packets
Purpose
Action
Verify that the packet capture file is stored under the /var/tmp directory and the
packets can be analyzed offline.
Take the following actions:
■
Disable packet capture. See “Disabling Packet Capture” on page 261.
■
Perform these steps to transfer a packet capture file (for example, 126b.fe-0.0.1),
to a server where you have installed packet analyzer tools (for example,
tools-server), using FTP.
1.
From the CLI configuration mode, connect to tools-server using FTP:
user@host# run ftp tools-server
Connected to tools-server.mydomain.net
220 tools-server.mydomain.net FTP server (Version 6.00LS) ready
264
■
Displaying a Firewall Filter for Packet Capture Configuration
Chapter 13: Configuring Packet Capture
Name (tools-server:user):remoteuser
331 Password required for remoteuser.
Password:
230 User remoteuser logged in.
Remote system type is UNIX.
Using binary mode to transfer files.
ftp>
2.
Navigate to the directory where packet capture files are stored on the router:
ftp> lcd /var/tmp
Local directory now /cf/var/tmp
3.
Copy the packet capture file that you want to analyze—for example,
126b.fe-0.0.1, to the server:
ftp> put 126b.fe-0.0.1
local: 126b.fe-0.0.1 remote: 126b.fe-0.0.1
200 PORT command successful.
150 Opening BINARY mode data connection for '126b.fe-0.0.1'.
100% 1476 00:00 ETA
226 Transfer complete.
1476 bytes sent in 0.01 seconds (142.42 KB/s)
4.
Return to the CLI configuration mode:
ftp> bye
221 Goodbye.
[edit]
user@host#
■
Open the packet capture file on the server with tcpdump or any packet analyzer
that supports libpcap format.
root@server% tcpdump -r 126b.fe-0.0.1 -xevvvv
01:12:36.279769 Out 0:5:85:c4:e3:d1 > 0:5:85:c8:f6:d1, ethertype IPv4 (0x0800),
length 98: (tos 0x0, ttl 64, id 33133, offset 0, flags [none], proto: ICMP (1),
length: 84) 14.1.1.1 > 15.1.1.1: ICMP echo request seq 0, length 64
0005 85c8 f6d1 0005 85c4 e3d1 0800 4500
0054 816d 0000 4001 da38 0e01 0101 0f01
0101 0800 3c5a 981e 0000 8b5d 4543 51e6
0100 aaaa aaaa aaaa aaaa aaaa aaaa aaaa
aaaa aaaa 0000 0000 0000 0000 0000 0000
0000 0000 0000 0000 0000 0000 0000 0000
0000
01:12:36.279793 Out 0:5:85:c8:f6:d1 > 0:5:85:c4:e3:d1, ethertype IPv4 (0x0800),
length 98: (tos 0x0, ttl 63, id 41227, offset 0, flags [none], proto: ICMP (1),
length: 84) 15.1.1.1 > 14.1.1.1: ICMP echo reply seq 0, length 64
0005 85c4 e3d1 0005 85c8 f6d1 0800 4500
0054 a10b 0000 3f01 bb9a 0f01 0101 0e01
0101 0000 445a 981e 0000 8b5d 4543 51e6
0100 aaaa aaaa aaaa aaaa aaaa aaaa aaaa
aaaa aaaa 0000 0000 0000 0000 0000 0000
0000 0000 0000 0000 0000 0000 0000 0000
0000
root@server%
Verifying Captured Packets
■
265
J-series™ Services Router Administration Guide
Meaning
266
■
Verify that the output shows the intended packets.
Verifying Captured Packets
Chapter 14
Configuring RPM Probes
J-series Services Routers support a tool that allows network operators and their
customers to accurately measure the performance between two network endpoints.
With the real-time performance monitoring (RPM) feature, you configure and send
probes to a specified target and monitor the analyzed results to determine packet
loss, round-trip time, and jitter.
This chapter contains the following topics. For more information about RPM, see the
JUNOS Services Interfaces Configuration Guide.
■
RPM Terms on page 267
■
RPM Overview on page 268
■
Before You Begin on page 271
■
Configuring RPM with Quick Configuration on page 271
■
Configuring RPM with a Configuration Editor on page 276
■
Verifying an RPM Configuration on page 285
RPM Terms
Before configuring and monitoring RPM on J-series Services Routers, become familiar
with the terms defined in Table 138 on page 267.
Table 138: RPM Terms
Term
Definition
egress
Outbound. Characterizing packets exiting a Services Router.
ingress
Inbound. Characterizing packets entering a Services Router.
jitter
Difference in relative transmit time between two consecutive packets in a stream, which can
cause quality degradation in some real-time applications such as voice over IP (VoIP) and video.
probe
An action taken or an object used to learn something about the state of the network. Real-time
performance monitoring (RPM) uses several types of requests to probe a network.
probe interval
Time, in seconds, between probe packets.
real-time performance
monitoring (RPM)
Monitoring tool that measures the performance of a network between two endpoints by collecting
statistics on packet loss, round-trip time, and jitter.
RPM Terms
■
267
J-series™ Services Router Administration Guide
Table 138: RPM Terms (continued)
Term
Definition
RPM target
Remote network endpoint, identified by an IP address or URL, to which the Services Router
sends a real-time performance monitoring (RPM) probe.
RPM test
A collection of real-time performance monitoring (RPM) probes sent out at regular intervals.
test interval
Time, in seconds, between RPM tests.
RPM Overview
Real-time performance monitoring (RPM) allows you to perform service-level
monitoring. When RPM is configured on a Services Router, the router calculates
network performance based on packet response time, jitter, and packet loss. These
values are gathered by Hypertext Transfer Protocol (HTTP) GET requests, Internet
Control Message Protocol (ICMP) requests, and TCP and UDP requests, depending
on the configuration.
This section contains the following topics:
■
RPM Probes on page 268
■
RPM Tests on page 269
■
Probe and Test Intervals on page 269
■
Jitter Measurement with Hardware Timestamping on page 269
■
RPM Statistics on page 270
■
RPM Thresholds and Traps on page 271
■
RPM for BGP Monitoring on page 271
RPM Probes
You gather RPM statistics by sending out probes to a specified probe target, identified
by an IP address or URL. When the target receives the probe, it generates responses,
which are received by the Services Router. By analyzing the transit times to and from
the remote server, the Services Router can determine network performance statistics.
The Services Router sends out the following probe types:
268
■
RPM Overview
■
HTTP GET request at a target URL
■
HTTP GET request for metadata at a target URL
■
ICMP echo request to a target address (the default)
■
ICMP timestamp request to a target address
■
UDP ping packets to a target device
■
UDP timestamp requests to a target address
■
TCP ping packets to a target device
Chapter 14: Configuring RPM Probes
UDP and TCP probe types require that the remote server be configured as an RPM
receiver so that it generates responses to the probes.
RPM Tests
Each probed target is monitored over the course of a test. A test represents a collection
of probes, sent out at regular intervals, as defined in the configuration. Statistics are
then returned for each test. Because a test is a collection of probes that have been
monitored over some amount of time, test statistics such as standard deviation and
jitter can be calculated and included with the average probe statistics.
Probe and Test Intervals
Within a test, RPM probes are sent at regular intervals, configured in seconds. When
the total number of probes has been sent and the corresponding responses received,
the test is complete. You can manually set the probe interval for each test to control
how the RPM test is conducted.
After all the probes for a particular test have been sent, the test begins again. The
time between tests is the test interval. You can manually set the test interval to tune
RPM performance.
Jitter Measurement with Hardware Timestamping
Jitter is the difference in relative transit time between two consecutive probes.
You can timestamp the following RPM probes to improve the measurement of latency
or jitter:
■
ICMP ping
■
ICMP ping timestamp
■
UDP ping
■
UDP ping timestamp
NOTE: The Services Router supports hardware timestamping of UDP ping and UDP
ping timestamp RPM probes only if the destination port is UDP-ECHO (port 7).
Timestamping takes place during the forwarding process of the Services Router
originating the probe (the RPM client), but not on the remote router that is the target
of the probe (the RPM server).
The supported encapsulations on a Services Router for timestamping are Ethernet
including VLAN, synchronous PPP, and Frame Relay. The only logical interface
supported is an lt services interface.
RPM Overview
■
269
J-series™ Services Router Administration Guide
RPM Statistics
At the end of each test, the Services Router collects the statistics for packet round-trip
time, packet inbound and outbound times (for ICMP timestamp probes only), and
probe loss shown in Table 139 on page 270.
Table 139: RPM Statistics
RPM Statistics
Description
Round-Trip Times
Minimum round-trip time
Shortest round-trip time from the Services Router to the remote server, as measured
over the course of the test
Maximum round-trip time
Longest round-trip time from the Services Router to the remote server, as measured
over the course of the test
Average round-trip time
Average round-trip time from the Services Router to the remote server, as measured
over the course of the test
Standard deviation round-trip time
Standard deviation of the round-trip times from the Services Router to the remote
server, as measured over the course of the test
Jitter
Difference between the maximum and minimum round-trip times, as measured
over the course of the test
Inbound and Outbound Times (ICMP Timestamp Probes Only)
Minimum egress time
Shortest one-way time from the Services Router to the remote server, as measured
over the course of the test
Maximum ingress time
Shortest one-way time from the remote server to the Services Router, as measured
over the course of the test
Average egress time
Average one-way time from the Services Router to the remote server, as measured
over the course of the test
Average ingress time
Average one-way time from the remote server to the Services Router, as measured
over the course of the test
Standard deviation egress time
Standard deviation of the one-way times from the Services Router to the remote
server, as measured over the course of the test
Standard deviation ingress time
Standard deviation of the one-way times from the remote server to the Services
Router, as measured over the course of the test
Egress jitter
Difference between the maximum and minimum outbound times, as measured
over the course of the test
Ingress jitter
Difference between the maximum and minimum inbound times, as measured
over the course of the test
Probe Counts
Probes sent
Total number of probes sent over the course of the test
Probe responses received
Total number of probe responses received over the course of the test
270
■
RPM Overview
Chapter 14: Configuring RPM Probes
Table 139: RPM Statistics (continued)
RPM Statistics
Description
Loss percentage
Percentage of probes sent for which a response was not received
RPM Thresholds and Traps
You can configure RPM threshold values for the round-trip times, ingress (inbound)
times, and egress (outbound) times that are measured for each probe, as well as for
the standard deviation and jitter values that are measured for each test. Additionally,
you can configure threshold values for the number of successive lost probes within
a test and the total number of lost probes within a test.
If the result of a probe or test exceeds any threshold, the Services Router generates
a system log message and sends any Simple Network Management Protocol (SNMP)
notifications (traps) that you have configured.
RPM for BGP Monitoring
When managing peering networks that are connected using Border Gateway Protocol
(BGP), you might need to find out if a path exists between the Services Router and
its configured BGP neighbors. You can ping each BGP neighbor manually to determine
the connection status, but this method is not practical when the Services Router has
a large number of BGP neighbors configured.
In the Services Router, you can configure RPM probes to monitor the BGP neighbors
and determine if they are active.
For BGP configuration information, see the J-series Services Router Basic LAN and
WAN Access Configuration Guide.
Before You Begin
Before you begin configuring RPM, complete the following tasks:
■
Establish basic connectivity. See the Getting Started Guide for your router.
■
Configure network interfaces. See the J-series Services Router Basic LAN and WAN
Access Configuration Guide.
■
Configure SNMP. See “Configuring SNMP for Network Management” on page 47.
Configuring RPM with Quick Configuration
J-Web Quick Configuration allows you to configure real-time performance monitoring
(RPM) parameters. Figure 26 on page 272 shows the main Quick Configuration page
for RPM. Figure 27 on page 272 shows the probe test Quick Configuration page for
RPM.
Before You Begin
■
271
J-series™ Services Router Administration Guide
Figure 26: Main Quick Configuration Page for RPM
ERROR: Unresolved graphic fileref="s020257.gif" not found in
"\\teamsite1\default\main\TechPubsWorkInProgress\STAGING\images\".
Figure 27: Probe Test Quick Configuration Page for RPM
ERROR: Unresolved graphic fileref="s020258.gif" not found in
"\\teamsite1\default\main\TechPubsWorkInProgress\STAGING\images\".
To configure RPM parameters with Quick Configuration:
1.
In the J-Web interface, select Configuration>Quick Configuration>Realtime
Performance Monitoring.
2.
Enter information into the Quick Configuration page for RPM, as described in
Table 140 on page 272.
3.
From the main RPM Quick Configuration page, click one of the following buttons:
4.
■
To apply the configuration and stay on the Quick Configuration RPM page,
click Apply.
■
To apply the configuration and return to the Quick Configuration main page,
click OK.
■
To cancel your entries and return to the Quick Configuration RPM page, click
Cancel.
To check the configuration, see “Verifying an RPM Configuration” on page 285.
Table 140: RPM Quick Configuration Summary
Field
Function
Your Action
Performance Probe Owners
Owner Name
(required)
Identifies an RPM owner for which one or more RPM
tests are configured. In most implementations, the
owner name identifies a network on which a set of
tests is being run (a particular customer, for example).
Type the name of the RPM owner.
Test name (required)
Uniquely identifies the RPM test
Type the name of the RPM test.
Target (Address or
URL) (required)
IP address or URL of probe target
Type the IP address, in dotted decimal
notation, or the URL of the probe target. If the
target is a URL, type a fully formed URL that
includes http://.
Source Address
Explicitly configured IP address to be used as the
probe source address
Type the source address to be used for the
probe. If the source IP address is not one of
the router's assigned addresses, the packet
uses the outgoing interface's address as its
source.
Identification
272
■
Configuring RPM with Quick Configuration
Chapter 14: Configuring RPM Probes
Table 140: RPM Quick Configuration Summary (continued)
Field
Function
Your Action
Routing Instance
Particular routing instance over which the probe is
sent
Type the routing instance name. The routing
instance applies only to probes of type icmp
and icmp-timestamp. The default routing
instance is inet.0.
History Size
Number of probe results saved in the probe history
Type a number between 0 and 255. The
default history size is 50 probes.
Specifies the type of probe to send as part of the test.
Select the desired probe type from the list:
Request Information
Probe Type
(required)
■
http-get
■
http-get-metadata
■
icmp-ping
■
icmp-ping-timestamp
■
tcp-ping
■
udp-ping
Interval
Sets the wait time (in seconds) between each probe
transmission
Type a number between 1 and 255 (seconds).
Test Interval
(required)
Sets the wait time (in seconds) between tests.
Type a number between 0 and 86400
(seconds).
Probe Count
Sets the total number of probes to be sent for each
test.
Type a number between 1 and 15.
Destination Port
Specifies the TCP or UDP port to which probes are
sent.
Type the number 7—a standard TCP or UDP
port number—or a port number from 49152
through 65535.
To use TCP or UDP probes, you must configure the
remote server as a probe receiver. Both the probe
server (Services Router) and the remote server must
be Juniper Networks routers configured to receive and
transmit RPM probes on the same TCP or UDP port.
DSCP Bits
Specifies the Differentiated Services code point (DSCP)
bits. This value must be a valid 6–bit pattern. The
default is 000000.
Type a valid 6–bit pattern.
For information about DSCPs and their use within
class-of-service (CoS) features, see the J-series Services
Router Advanced WAN Access Configuration Guide.
Data Size
Specifies the size of the data portion of the ICMP
probes.
Type a size (in bytes) between 0 and 65507.
Data Fill
Specifies the contents of the data portion of the ICMP
probes.
Type a hexadecimal value between 1 and
800h to use as the contents of the ICMP probe
data.
Configuring RPM with Quick Configuration
■
273
J-series™ Services Router Administration Guide
Table 140: RPM Quick Configuration Summary (continued)
Field
Function
Your Action
Hardware
Timestamp
Enables timestamping of RPM probe messages. On
J-series Services Routers you can timestamp the
following RPM probes to improve the measurement
of latency or jitter:
To enable timestamping, select the check box.
■
ICMP ping
■
ICMP ping timestamp
■
UDP ping—destination port UDP-ECHO (port 7)
only
■
UDP ping timestamp—destination port
UDP-ECHO (port 7) only
Maximum Probe Thresholds
Successive Lost
Probes
Sets the total number of probes that must be lost
successively to trigger a probe failure and generate a
system log message.
Type a number between 0 and 15.
Lost Probes
Sets the total number of probes that must be lost to
trigger a probe failure and generate a system log
message.
Type a number between 0 and 15.
Round Trip Time
Sets the total round-trip time (in microseconds), from
the Services Router to the remote server, that triggers
a probe failure and generates a system log message.
Type a number between 0 and 60,000,000
(microseconds).
Jitter
Sets the total jitter (in microseconds), for a test, that
triggers a probe failure and generates a system log
message.
Type a number between 0 and 60,000,000
(microseconds).
Standard Deviation
Sets the maximum allowable standard deviation (in
microseconds) for a test, which, if exceeded, triggers
a probe failure and generates a system log message.
Type a number between 0 and 60,000,000
(microseconds).
Egress Time
Sets the total one-way time (in microseconds), from
the Services Router to the remote server, that triggers
a probe failure and generates a system log message.
Type a number between 0 and 60,000,000
(microseconds).
Ingress Time
Sets the total one-way time (in microseconds), from
the remote server to the Services Router, that triggers
a probe failure and generates a system log message.
Type a number between 0 and 60,000,000
(microseconds)
Jitter Egress Time
Sets the total outbound-time jitter (in microseconds),
for a test, that triggers a probe failure and generates
a system log message.
Type a number between 0 and 60,000,000
(microseconds)
Jitter Ingress Time
Sets the total inbound-time jitter (in microseconds),
for a test, that triggers a probe failure and generates
a system log message.
Type a number between 0 and 60,000,000
(microseconds).
Egress Standard
Deviation
Sets the maximum allowable standard deviation of
outbound times (in microseconds) for a test, which,
if exceeded, triggers a probe failure and generates a
system log message.
Type a number between 0 and 60,000,000
(microseconds).
274
■
Configuring RPM with Quick Configuration
Chapter 14: Configuring RPM Probes
Table 140: RPM Quick Configuration Summary (continued)
Field
Function
Your Action
Ingress Standard
Deviation
Sets the maximum allowable standard deviation of
inbound times (in microseconds) for a test, which, if
exceeded, triggers a probe failure and generates a
system log message.
Type a number between 0 and 60,000,000
(microseconds).
Generates SNMP traps when the threshold for jitter in
outbound time is exceeded.
■
To enable SNMP traps for this condition,
select the check box.
■
To disable SNMP traps, clear the check
box.
■
To enable SNMP traps for this condition,
select the check box.
■
To disable SNMP traps, clear the check
box.
■
To enable SNMP traps for this condition,
select the check box.
■
To disable SNMP traps, clear the check
box.
■
To enable SNMP traps for this condition,
select the check box.
■
To disable SNMP traps, clear the check
box.
■
To enable SNMP traps for this condition,
select the check box.
■
To disable SNMP traps, clear the check
box.
■
To enable SNMP traps for this condition,
select the check box.
■
To disable SNMP traps, clear the check
box.
■
To enable SNMP traps for this condition,
select the check box.
■
To disable SNMP traps, clear the check
box.
■
To enable SNMP traps for this condition,
select the check box.
■
To disable SNMP traps, clear the check
box.
■
To enable SNMP traps for this condition,
select the check box.
■
To disable SNMP traps, clear the check
box.
Traps
Egress Jitter
Exceeded
Egress Standard
Deviation Exceeded
Egress Time
Exceeded
Ingress Jitter
Exceeded
Ingress Standard
Deviation Exceeded
Ingress Time
Exceeded
Jitter Exceeded
Probe Failure
RTT Exceeded
Generates SNMP traps when the threshold for standard
deviation in outbound times is exceeded.
Generates SNMP traps when the threshold for
maximum outbound time is exceeded.
Generates SNMP traps when the threshold for jitter in
inbound time is exceeded.
Generates SNMP traps when the threshold for standard
deviation in inbound times is exceeded.
Generates traps when the threshold for maximum
inbound time is exceeded.
Generates traps when the threshold for jitter in
round-trip time is exceeded.
Generates traps when the threshold for the number
of successive lost probes is reached.
Generates traps when the threshold for maximum
round-trip time is exceeded.
Configuring RPM with Quick Configuration
■
275
J-series™ Services Router Administration Guide
Table 140: RPM Quick Configuration Summary (continued)
Field
Function
Your Action
Standard Deviation
Exceeded
Generates traps when the threshold for standard
deviation in round-trip times is exceeded.
■
To enable SNMP traps for this condition,
select the check box.
■
To disable SNMP traps, clear the check
box.
■
To enable SNMP traps for this condition,
select the check box.
■
To disable SNMP traps, clear the check
box.
■
To enable SNMP traps for this condition,
select the check box.
■
To disable SNMP traps, clear the check
box.
Test Completion
Test Failure
Generates traps when a test is completed.
Generates traps when the threshold for the total
number of lost probes is reached.
Performance Probe Server
TCP Probe Server
Specifies the port on which the Services Router is to
receive and transmit TCP probes.
Type the number 7—a standard TCP or UDP
port number—or a port number from 49152
through 65535.
UDP Probe Server
Specifies the port on which the Services Router is to
receive and transmit UDP probes.
Type the number 7—a standard TCP or UDP
port number—or a port number from 49152
through 65535.
Configuring RPM with a Configuration Editor
To configure the Services Router to perform real-time performance tests, you perform
the following tasks. For information about using the J-Web and CLI configuration
editors, see the J-series Services Router Basic LAN and WAN Access Configuration Guide.
■
Configuring Basic RPM Probes on page 276
■
Configuring TCP and UDP Probes on page 279
■
Tuning RPM Probes on page 282
■
Configuring RPM Probes to Monitor BGP Neighbors on page 283
Configuring Basic RPM Probes
To configure basic RPM probes, you must configure the probe owner, the test, and
the specific parameters of the RPM probe.
For ICMP ping, ICMP ping timestamp, UDP ping, and UDP ping timestamp probes,
you can also set a timestamp to improve the measurement of latency or jitter. The
probe is timestamped by the router originating the probe (the RPM client).
In this sample use of RPM, basic probes are configured for two customers: Customer A
and Customer B. The probe for Customer A uses ICMP timestamp packets and sets
RPM thresholds and corresponding SNMP traps to catch lengthy inbound times. The
276
■
Configuring RPM with a Configuration Editor
Chapter 14: Configuring RPM Probes
probe for Customer B uses HTTP packets and sets thresholds and corresponding
SNMP traps to catch excessive lost probes. To configure these RPM probes:
1.
Navigate to the top of the configuration hierarchy in either the J-Web or CLI
configuration editor.
2.
Perform the configuration tasks described in Table 141 on page 277.
3.
If you are finished configuring the network, commit the configuration.
4.
Go on to one of the following procedures:
■
To configure a TCP or UDP probe, see “Configuring TCP and UDP
Probes” on page 279.
■
To tune a probe, see “Tuning RPM Probes” on page 282.
■
To check the configuration, see “Verifying an RPM Configuration” on page 285.
Table 141: Configuring Basic RPM Probes
Task
J-Web Configuration Editor
Navigate to the Services>RPM level in
the configuration hierarchy.
1.
In the J-Web interface, select
Configuration>View and
Edit>Edit Configuration.
2.
Next to Services, click Configure
or Edit.
3.
Next to Rpm, select the Yes check
box.
4.
Click Configure.
1.
In the Probe box, click Add new
entry.
2.
In the Owner box, type customerA.
3.
Click OK.
4.
Repeat the previous steps and add
an RPM probe owner for
customerB.
Configure the RPM owners customerA
and customerB.
CLI Configuration Editor
From the [edit] hierarchy level, enter
edit services rpm
1.
Enter
set probe customerA
2.
Enter
set probe customerB
Configuring RPM with a Configuration Editor
■
277
J-series™ Services Router Administration Guide
Table 141: Configuring Basic RPM Probes (continued)
Task
J-Web Configuration Editor
CLI Configuration Editor
Configure the RPM test icmp-test for the
RPM owner customerA.
1.
On the Rpm page, select
customerA.
1.
2.
In the Test box, click Add new
entry
The sample RPM test is an ICMP probe
with a test interval (probe frequency) of
15 seconds, a probe type of
icmp-ping-timestamp, a probe timestamp,
and a target address of 192.178.16.5.
3.
In the Name box, type icmp-test.
4.
In the Test interval box, type 15.
5.
In the Probe type box, select
icmp-ping-timestamp.
6.
Select the Hardware timestamp
check box.
7.
In the Target box, select the Yes
check box, and click Configure.
8.
In the Target type box, select
Address.
9.
In the Address box, type
192.178.16.5.
From the [edit] hierarchy level, enter
edit services rpm probe customerA
2.
Enter
set test icmp-test probe-frequency 15
3.
Enter
set test icmp-test probe-type
icmp-ping-timestamp
4.
Enter
set test icmp-test
hardware-timestamp
5.
Enter
set test icmp-test target address
192.178.16.5
10. Click OK.
Configure RPM thresholds and
corresponding SNMP traps to catch
ingress (inbound) times greater than
3000 microseconds.
278
■
1.
On the Probe page, select
icmp-test.
2.
In the Thresholds box, select the
Yes check box, and click
Configure.
3.
In the Ingress time box, type 3000.
4.
Click OK.
5.
In the Traps box, click Add new
entry.
6.
In the Value box, select
ingress-time-exceeded.
7.
Click OK.
Configuring RPM with a Configuration Editor
1.
Enter
set probe customerA test icmp-test
thresholds ingress-time 3000
2.
Enter
set probe customerA test icmp-test
traps ingress-time-exceeded
Chapter 14: Configuring RPM Probes
Table 141: Configuring Basic RPM Probes (continued)
Task
J-Web Configuration Editor
CLI Configuration Editor
Configure the RPM test http-test for the
RPM owner customerB.
1.
On the Rpm page, select
customerB.
1.
2.
In the Test box, click Add new
entry.
The sample RPM test is an HTTP probe
with a test interval (probe frequency) of
30 seconds, a probe type of http-get, and
a target URL of http://customerB.net.
3.
In the Name box, type http-test.
4.
In the Test interval box, type 30.
5.
In the Probe type box, select
http-get.
6.
In the Target box, select the Yes
check box, and click Configure.
7.
In the Target type box, select Url.
8.
In the Url box, type
From the [edit] hierarchy level, enter
edit services rpm probe customerB
2.
Enter
set test http-test probe-frequency 30
3.
Enter
set test http-test probe-type http-get
4.
Enter
set test http-test target url
http://customerB.net
http://customerB.net.
Configure RPM thresholds and
corresponding SNMP traps to catch 3 or
more successive lost probes and total
lost probes of 10 or more.
9.
Click OK.
1.
On the Probe page, select http-test.
2.
In the Thresholds box, select the
Yes check box, and click
Configure.
3.
In the Successive loss box, type 3.
4.
In the Total loss box, type 10.
5.
Click OK.
6.
In the Traps box, click Add new
entry.
7.
In the Value box, select
probe-failure.
8.
Click OK.
9.
In the Traps box, click Add new
entry.
1.
Enter
set probe customerB test icmp-test
thresholds successive-loss 3
2.
Enter
set probe customerB test icmp-test
thresholds total-loss 10
3.
Enter
set probe customerB test icmp-test
traps probe-failure
4.
Enter
set probe customerB test icmp-test
traps test-failure
10. In the Value box, select test-failure.
11. Click OK.
Configuring TCP and UDP Probes
To configure RPM using TCP and UDP probes, in addition to the basic RPM properties,
you must configure both the host Services Router and the remote Services Router to
act as TCP and UDP servers.
If you are using class of service (CoS) and want to classify probes, you must also set
a destination interface. The destination interface is the output interface for sending
Configuring RPM with a Configuration Editor
■
279
J-series™ Services Router Administration Guide
packets to the forwarding plane. Classified packets are sent to the output queue on
the output interface specified by the CoS scheduler map configured on the interface.
For information about CoS, see the J-series Services Router Advanced WAN Access
Configuration Guide.
CAUTION: Use probe classification with caution, because improper configuration
can cause packets to be dropped.
The destination interface must support looping of probe packets to an input interface
without adding any encapsulation. On a Services Router, the destination interface
must be an lt services interface.
In this sample use of RPM, a probe is configured for one customer: Customer C. The
probe for Customer C uses TCP packets. The remote router is configured as an RPM
server for both TCP and UDP packets, using an lt services interface as the destination
interface, and ports 50000 and 50037, respectively. Router A is the host router in
this example, and Router B is the remote router. To configure this RPM probe:
1.
Navigate to the top of the configuration hierarchy in either the J-Web or CLI
configuration editor.
2.
Perform the configuration tasks described in Table 142 on page 280.
3.
If you are finished configuring the network, commit the configuration.
4.
Go on to one of the following procedures:
■
To tune a probe, see “Tuning RPM Probes” on page 282.
■
To check the configuration, see “Verifying an RPM Configuration” on page 285.
Table 142: Configuring TCP and UDP Probes
Task
J-Web Configuration Editor
CLI Configuration Editor
1.
From the [edit] hierarchy level, enter
Router A Configuration
Navigate to the Services>RPM level in
the configuration hierarchy.
Configure the RPM owner customerC.
280
■
In the J-Web interface, select
Configuration>View and
Edit>Edit Configuration.
2.
Next to Services, click Configure
or Edit.
3.
Next to Rpm, select the Yes check
box.
4.
Click Configure.
1.
In the Probe box, click Add new
entry.
2.
In the Owner box, type customerC.
3.
Click OK.
Configuring RPM with a Configuration Editor
edit services rpm
Enter
set probe customerC
Chapter 14: Configuring RPM Probes
Table 142: Configuring TCP and UDP Probes (continued)
Task
J-Web Configuration Editor
CLI Configuration Editor
Configure the RPM test tcp-test for the
RPM owner customerC.
1.
On the Rpm page, select
customerC.
1.
2.
In the Test box, click Add new
entry.
The sample RPM test is a TCP probe
with a test interval (probe frequency) of
5, a probe type of tcp-ping, and a target
address of 192.162.45.6.
Configure the destination interface.
3.
In the Name box, type tcp-test.
4.
In the Test interval box, type 5.
5.
In the Probe type box, select
tcp-ping.
6.
In the Target box, select the Yes
check box, and click Configure.
7.
In the Target type box, select
Address.
8.
In the Address box, type
192.162.45.6.
9.
Click OK.
In the Destination interface box, type
From the [edit] hierarchy level, enter
edit services rpm probe customerC
2.
Enter
set test tcp-test probe-frequency 5
3.
Enter
set test tcp-test probe-type tcp-ping
4.
Enter
set test tcp-test target address
192.162.45.6
Enter
lt-0/0/0
NOTE: On Services Routers the
destination interface must be an lt
services interface.
Configure port 50000 as the TCP port to
which the RPM probes are sent.
set test tcp-test destination-interface
lt-0/0/0
In the Destination port box, type 50000.
Enter
set test tcp-test destination-port 50000
Router B Configuration
Navigate to the Services>RPM level in
the configuration hierarchy.
Configure Router B to act as a TCP
server, using port 50000 to send and
receive TCP probes.
1.
In the J-Web interface, select
Configuration>View and
Edit>Edit Configuration.
2.
Next to Services, click Configure
or Edit.
3.
Next to Rpm, select the Yes check
box.
4.
Click Configure.
1.
Next to Probe server, click
Configure.
2.
In the Tcp box, click Configure.
3.
In the Port box, type 50000.
4.
Click OK.
From the [edit] hierarchy level, enter
edit services rpm
Enter
set probe-server tcp port 50000
Configuring RPM with a Configuration Editor
■
281
J-series™ Services Router Administration Guide
Table 142: Configuring TCP and UDP Probes (continued)
Task
J-Web Configuration Editor
CLI Configuration Editor
Configure Router B to act as a UDP
server, using port 50037 to send and
receive UDP probes.
1.
Next to Probe server, click Edit.
Enter
2.
In the Udp box, click Configure.
3.
In the Port box, type 50037.
4.
Click OK.
set probe-server udp port 50037
Tuning RPM Probes
After configuring an RPM probe, you can set parameters to control probe functions,
such as the interval between probes, the total number of concurrent probes that a
system can handle, and the source address used for each probe packet. This example
tunes the ICMP probe set for customer A in “Configuring Basic RPM
Probes” on page 276.
To configure tune RPM probes:
1.
Perform the configuration tasks described in Table 141 on page 277.
2.
Navigate to the top of the configuration hierarchy in either the J-Web or CLI
configuration editor.
3.
Perform the configuration tasks described in Table 143 on page 282.
4.
If you are finished configuring the network, commit the configuration.
5.
To check the configuration, see “Verifying an RPM Configuration” on page 285.
Table 143: Tuning RPM Probes
Task
J-Web Configuration Editor
CLI Configuration Editor
Navigate to the Services>RPM level in
the configuration hierarchy.
1.
From the [edit] hierarchy level, enter
Set the maximum number of concurrent
probes allowed on the system to 10.
Access the ICMP probe of customer A.
282
■
In the J-Web interface, select
Configuration>View and
Edit>Edit Configuration.
2.
Next to Services, click Configure
or Edit.
3.
Next to Rpm, select the Yes check
box.
4.
Click Edit.
1.
In the Probe limit box, type 10.
2.
Click OK.
1.
In the Owner box, click
CustomerA.
2.
In the Name box, click icmp-test.
Configuring RPM with a Configuration Editor
edit services rpm
Enter
set probe-limit 10
From the [edit] hierarchy level, enter
edit services rpm probe customerA test
icmp-test
Chapter 14: Configuring RPM Probes
Table 143: Tuning RPM Probes (continued)
Task
J-Web Configuration Editor
CLI Configuration Editor
Set the time between probe
transmissions to 15 seconds.
In the Probe interval box, type 15.
Enter
set probe-interval 15
Set the number of probes within a test
to 10.
In the Probe count box, type 10.
Enter
set probe-count 10
Set the source address for each probe
packet to 192.168.2.9.
If you do not explicitly configure a
source address, the address on the
outgoing interface through which the
probe is sent is used as the source
address.
1.
In the Source address box, type
192.168.2.9.
2.
Click OK.
Enter
set source-address 192.168.2.9
Configuring RPM Probes to Monitor BGP Neighbors
By default, the Services Router is not configured to send RPM probes to its BGP
neighbors. You must configure the BGP parameters under RPM configuration to send
RPM probes to BGP neighbors.
You can also direct the probes to a particular group of BGP neighbors.
This section contains the following topics:
■
Configuring RPM Probes for BGP Monitoring on page 283
■
Directing RPM Probes to Select BGP Routers on page 285
Configuring RPM Probes for BGP Monitoring
This sample use of RPM for BGP monitoring uses a TCP probe. To use TCP or UDP
probes, you must configure both the probe server (Services Router) and the probe
receiver (the remote Services Router) to transmit and receive RPM probes on the
same TCP or UDP port. The sample probe uses TCP port 50000.
To configure RPM probes on a Services Router to monitor BGP neighbors with a
configuration editor:
1.
Navigate to the top of the configuration hierarchy in either the J-Web or CLI
configuration editor.
2.
Perform the configuration tasks described in Table 144 on page 284.
3.
If you are finished configuring the router, commit the configuration.
4.
Go on to one of the following tasks:
■
To send probes to specific routers, see “Directing RPM Probes to Select BGP
Routers” on page 285.
Configuring RPM with a Configuration Editor
■
283
J-series™ Services Router Administration Guide
■
To check the configuration, see “Verifying an RPM Configuration” on page 285.
Table 144: Configuring RPM Probes to Monitor BGP Neighbors
Task
J-Web Configuration Editor
CLI Configuration Editor
Navigate to the Services>RPM>BGP
level in the configuration hierarchy.
1.
In the J-Web interface, select
Configuration>View and
Edit>Edit Configuration.
From the [edit] hierarchy level, enter
2.
Next to Services, click Configure
or Edit.
3.
Next to Rpm, select the Yes check
box and click Configure or Edit.
4.
Next to Bgp, click Configure.
Specify a hexadecimal value (the range
is between 1 and 2048 characters) that
you want to use for the data portion of
the RPM probe—for example, ABCD123.
In the Data fill box, type ABCD123.
Specify the data size of the RPM probe
in bytes, a value from 0 through
65507—for example, 1024.
In the Data size box, type 1024.
Configure port 50000 as the TCP port to
which the RPM probes are sent.
In the Destination port box, type 50000.
edit services rpm bgp
Enter
set data-fill ABCD123
Enter
set data-size 1024
Enter
set destination-port 50000
Specify the number of probe results to
be saved in the probe history—for
example, 25. The range is between 0
and 255, and the default is 50.
In the History size box, type 25.
Configure the probe count—for example,
5—and probe interval—for example, 1.
1.
In the Probe count box, type 5.
Enter
2.
In the Probe interval box, type 1.
set probe-count 5 probe-interval 1
■
Probe count—Total number of RPM
probes to be sent for each test. The
range is between 1 and 15 and the
default is 1.
■
Probe interval—Wait time (in
seconds) between RPM probes. The
range is between 1 and 255, and
the default is 3.
Specify the type of probe to be sent as
part of the test—tcp-ping.
Enter
set history-size 25
In the Probe type box, select tcp-ping.
Enter
set probe-type tcp-ping
NOTE: If you do not specify the probe
type the default ICMP probes are sent.
Configure a value between 0 and 86400
seconds for the interval between
tests—for example, 60.
284
■
1.
In the Test interval box, type 60.
2.
Click OK.
Configuring RPM with a Configuration Editor
Enter
set test-interval 60
Chapter 14: Configuring RPM Probes
Directing RPM Probes to Select BGP Routers
If a Services Router has a large number of BGP neighbors configured, you can direct
(filter) the RPM probes to a selected group of BGP neighbors rather than to all the
neighbors. To identify the BGP routers to receive RPM probes, you can configure
routing instances.
The sample RPM configuration in Table 145 on page 285 sends RPM probes to the
BGP neighbors in routing instance R1.
To direct RPM probes to select BGP neighbors:
1.
Navigate to the top of the configuration hierarchy in either the J-Web or CLI
configuration editor.
2.
Perform the configuration tasks described in Table 145 on page 285.
3.
If you are finished configuring the router, commit the configuration.
4.
To verify the configuration, see “Verifying an RPM Configuration” on page 285.
Table 145: Directing RPM Probes to Select BGP Routers
Task
J-Web Configuration Editor
Navigate to the Services>RPM>BGP
level in the configuration hierarchy.
1.
Configure routing instance RI1 to send
RPM probes to BGP neighbors within the
routing instance.
In the J-Web interface, select
Configuration>View and
Edit>Edit Configuration.
2.
Next to Services, click Configure
or Edit.
3.
Next to Rpm, select the Yes check
box and click Configure or Edit.
4.
Next to Bgp, click Configure or
Edit.
1.
Next to Routing instances, click
Add new entry.
2.
In the Routing instance name box,
type RI1.
3.
Click OK.
CLI Configuration Editor
From the [edit] hierarchy level, enter
edit services rpm bgp
Enter
set routing-instances RI1
Verifying an RPM Configuration
To verify an RPM configuration, perform these tasks:
■
Verifying RPM Services on page 286
■
Verifying RPM Statistics on page 286
■
Verifying RPM Probe Servers on page 288
Verifying an RPM Configuration
■
285
J-series™ Services Router Administration Guide
Verifying RPM Services
Purpose
Action
Verify that the RPM configuration is within the expected values.
From configuration mode in the CLI, enter the show services rpm command.
user@host# show services rpm
probe test {
test customerA {
probe-type icmp-ping;
target address 192.178.16.5;
probe-count 15;
probe-interval 1;
hardware-timestamp;
}
test customerB {
probe-type icmp-ping-timestamp;
target address 192.178.16.5;
probe-count 15;
probe-interval 1;
hardware-timestamp;
}
test customerC {
probe-type udp-ping;
target address 192.178.16.5;
probe-count 15;
probe-interval 1;
destination-port 50000;
hardware-timestamp;
}
}
Meaning
The output shows the values that are configured for RPM on the Services Router.
Verifying RPM Statistics
Purpose
Action
Verify that the RPM probes are functioning and that the RPM statistics are within
expected values.
From the J-Web interface, select Monitor>RPM. From the CLI, enter the show services
rpm probe-results command.
user@host> show services rpm probe-results
Owner: customerA, Test: icmp-test
Probe type: icmp-ping-timestamp
Minimum Rtt: 312 usec, Maximum Rtt: 385 usec, Average Rtt: 331 usec,
Jitter Rtt: 73 usec, Stddev Rtt: 27 usec
Minimum egress time: 0 usec, Maximum egress time: 0 usec,
Average egress time: 0 usec, Jitter egress time: 0 usec,
Stddev egress time: 0 usec
Minimum ingress time: 0 usec, Maximum ingress time: 0 usec,
Average ingress time: 0 usec, Jitter ingress time: 0 usec,
Stddev ingress time: 0 usec
Probes sent: 5, Probes received: 5, Loss percentage: 0
Owner: customerB, Test: http-test
Target address: 192.176.17.4, Target URL: http://customerB.net,
Probe type: http-get
286
■
Verifying RPM Services
Chapter 14: Configuring RPM Probes
Minimum Rtt: 1093 usec, Maximum Rtt: 1372 usec, Average Rtt: 1231 usec,
Jitter Rtt: 279 usec, Stddev Rtt: 114 usec
Probes sent: 3, Probes received: 3, Loss percentage: 0
Owner: Rpm-Bgp-Owner, Test: Rpm-Bgp-Test-1
Target address: 10.209.152.37, Probe type: icmp-ping, Test size: 5 probes
Routing Instance Name: LR1/RI1
Probe results:
Response received, Fri Oct 28 05:20:23 2005
Rtt: 662 usec
Results over current test:
Probes sent: 5, Probes received: 5, Loss percentage: 0
Measurement: Round trip time
Minimum: 529 usec, Maximum: 662 usec, Average: 585 usec,
Jitter: 133 usec, Stddev: 53 usec
Results over all tests:
Probes sent: 5, Probes received: 5, Loss percentage: 0
Measurement: Round trip time
Minimum: 529 usec, Maximum: 662 usec, Average: 585 usec,
Jitter: 133 usec, Stddev: 53 usec
Meaning
The output shows the probe results for the RPM tests configured on the Services
Router. Verify the following information:
■
Each configured test is displayed. Results are displayed in alphabetical order,
sorted first by owner name and then by test name.
■
The round-trip times fall within the expected values for the particular test. The
minimum round-trip time is displayed as Minimum Rtt, the maximum round-trip
time is displayed as Maximum Rtt, and the average round-trip time is displayed
as Average Rtt.
A high average round-trip time might mean that performances problems exist
within the network. A high maximum round-trip time might result in high jitter
values.
■
The egress (outbound) trip times fall within the expected values for the particular
test. The minimum outbound time is displayed as Minimum egress time, the
maximum outbound time is displayed as Maximum egress time, and the average
outbound time is displayed as Average egress time.
■
The ingress (inbound) trip times fall within the expected values for the particular
test. The minimum inbound time is displayed as Minimum ingress time, the
maximum inbound time is displayed as Maximum ingress time, and the average
inbound time is displayed as Average ingress time.
■
The number of probes sent and received is expected.
Lost probes might indicate packet loss through the network. Packet losses can
occur if the remote server is flapping. If the RPM probe type is TCP or UDP,
complete probe loss might indicate a mismatch in TCP or UDP RPM port number.
■
Related Topics
For Type, each peer is configured as the correct type (either internal or external).
For a complete description of show services rpm probe-results output, see the JUNOS
System Basics and Services Command Reference.
Verifying RPM Statistics
■
287
J-series™ Services Router Administration Guide
Verifying RPM Probe Servers
Purpose
Action
Verify that the Services Router is configured to receive and transmit TCP and UDP
RPM probes on the correct ports.
From the CLI, enter the show services rpm active-servers command.
user@host> show services rpm active-servers
Protocol: TCP, Port: 50000
Protocol: UDP, Port: 50037
288
■
Meaning
The output shows a list of the protocols and corresponding ports for which the Services
Router is configured as an RPM server.
Related Topics
For a complete description of show services rpm active-servers output, see the JUNOS
System Basics and Services Command Reference.
Verifying RPM Probe Servers
Part 5
Index
■
Index on page 291
Index
■
289
J-series™ Services Router Administration Guide
290
■
Index
Index
Symbols
#, comments in configuration statements.................xviii
( ), in syntax descriptions..........................................xviii
.gz.jc file extension See file encryption
/cf/var/crash directory See crash files
/config directory
file encryption See file encryption
snapshots for boot directories (CLI).....................189
snapshots for boot directories (J-Web)................188
/var/crash directory See crash files
/var/db/config directory See file encryption
/var/db/scripts/commit directory See commit scripts
/var/db/scripts/op directory See operation scripts
/var/log directory See system log messages See system
logs
/var/sw/pkg directory
temporary files...................................................200
/var/tmp directory See temporary files
< >, in syntax descriptions......................................xviii
[ ], in configuration statements..................................xviii
{ }, in configuration statements................................xviii
| (pipe) command......................................................105
| (pipe), in syntax descriptions...................................xviii
A
access privileges
denying and allowing commands...........................7
permission bits for..................................................5
predefined..............................................................5
specifying (Quick Configuration)...........................11
accounts See template accounts; user accounts
activate system scripts commit command...................92
activate system scripts op command...........................94
active alarms See alarms, active
active routes, displaying.............................................116
adapters, for compact flash recovery.........................192
adaptive services interfaces
alarm conditions and configuration options........168
monitoring..........................................................135
Add a RADIUS Server page............................................8
field summary........................................................9
Add a TACACS+ Server page.........................................9
field summary......................................................10
Add a User Quick Configuration page...........................11
field summary......................................................11
addresses
attacking, displaying with IDS.............................139
destination, displaying........................................116
under attack, displaying with IDS........................139
Advanced Encryption Standard (AES) See AES
encryption
AES encryption
for Canada and U.S JUNOS.................................203
setting.................................................................204
agents, SNMP See SNMP agents
air filter
clogged...............................................................171
alarm class See alarm severity
ALARM LED, color......................................................166
alarm severity
action required...................................................175
configuring for an interface.................................172
displaying...........................................................175
major (red) .........................................................167
See also major alarms
minor (yellow)....................................................167
See also minor alarms
alarms
active, checking..................................................174
active, displaying at login....................................174
conditions, in chassis components......................171
conditions, on an interface.................................168
configurable........................................................168
configuration requirements for interface
alarms.............................................................172
displaying for chassis..........................................111
displaying for interfaces......................................115
licenses...............................................................172
major See major alarms
minor See minor alarms
monitoring..........................................................174
overview.............................................................166
red See major alarms
red J-Web indicator.............................................174
rescue configuration...........................................172
severity See alarm severity
types...................................................................166
verifying.............................................................175
yellow See minor alarms
Index
■
291
J-series™ Services Router Administration Guide
Alarms Summary page...............................................174
alert logging severity..................................................158
alias, CoS value..........................................................125
alternative boot media See boot devices; USB
ambient temperature, monitoring..............................112
any level statement....................................................162
any logging facility.....................................................157
archiving system logs.................................................161
arithmetic operators, for multicast traffic...................250
AS path, displaying....................................................117
AT commands, for modem initialization
description............................................................31
modifying.............................................................41
attacks
brute force, preventing.........................................26
detecting with IDS...............................................139
dictionary, preventing...........................................26
authentication
adding a RADIUS server (Quick Configuration).......8
adding a TACACS+ server (Quick
Configuration).....................................................9
local password, by default.....................................10
login classes......................................................5, 16
methods.................................................................4
order of user authentication (configuration
editor)...............................................................15
RADIUS authentication (configuration editor).......12
specifying a method (Quick Configuration)...........10
specifying access privileges (Quick
Configuration)...................................................11
TACACS+ authentication (configuration
editor)...............................................................13
user accounts....................................................4, 17
authorization logging facility......................................157
autoinstallation
automatic configuration process...........................84
CLI configuration editor........................................85
default configuration file.......................................84
establishing...........................................................81
host-specific configuration file..............................84
interfaces..............................................................82
IP address procurement process...........................83
J-Web configuration editor....................................85
overview...............................................................82
protocols for procuring an IP address...................82
requirements........................................................84
status....................................................................87
TFTP server..........................................................83
verifying...............................................................86
autoinstallation, compatibility with the DHCP
server.......................................................................65
automatic configuration See autoinstallation
Avaya VoIP, monitoring.............................................151
292
■
Index
B
BBL (bearer bandwidth limit)
available.............................................................152
reported..............................................................152
bearer bandwidth limit See BBL
BGP (Border Gateway Protocol)
monitoring..........................................................117
peers, probes to See BGP RPM probes
RPM probes to BGP neighbors See BGP RPM
probes
statistics..............................................................117
status..................................................................118
BGP groups, displaying..............................................117
BGP neighbors
directing RPM probes to......................................285
displaying...........................................................118
monitoring with RPM probes..............................283
BGP peers See BGP neighbors
BGP routing information............................................117
BGP RPM probes
directing to select BGP neighbors (configuration
editor).............................................................285
overview.............................................................271
setting up on local and remote Services Router
(configuration editor).......................................283
BGP sessions, status...................................................118
binary operators, for multicast traffic.........................250
boot devices...............................................................186
configuring (CLI).................................................189
configuring (J-Web).............................................186
selecting (CLI).............................................196, 197
selecting (J-Web).................................................195
storing memory snapshots..................................190
See also compact flash; USB
boot operations, DHCP.................................................71
BOOTP, for autoinstallation..........................................86
braces, in configuration statements...........................xviii
brackets
angle, in syntax descriptions..............................xviii
square, in configuration statements...................xviii
brute force attacks, preventing.....................................26
buffer space, for PIM (in FPC summary).....................113
built-in Ethernet ports See Ethernet ports; management
interfaces
bytes transmitted.......................................................115
C
cables
console port, connecting.......................................21
Ethernet rollover, connecting................................21
caller ID, for dial-in over USB modems........................36
See also dialer interface, for USB modem
capturing packets See packet capture
Challenge Handshake Authentication Protocol, enabling
on dialer interfaces...................................................37
Index
change-log logging facility..........................................157
CHAP (Challenge Handshake Authentication Protocol),
enabling on dialer interfaces....................................37
chassis
alarm condition indicator....................................175
alarm conditions and remedies...........................171
alarms, displaying...............................................111
component part numbers ..................................113
component serial numbers.................................113
environment, displaying.....................................112
FPC (PIM) summary, displaying..........................113
identifiers, displaying..........................................112
monitoring..........................................................111
PIM (FPC) summary, displaying..........................113
power management............................................111
temperature, monitoring.....................................112
circuits, DLSw............................................................122
classifiers, CoS...........................................................124
Clean Up Files page....................................................200
cleaning up files.................................................199, 201
clear system services dhcp binding command.............77
clear system services dhcp conflicts command............65
CLI configuration editor
autoinstallation.....................................................85
CHAP on dialer interfaces.....................................37
controlling user access..........................................16
DHCP server.........................................................72
enabling commit scripts........................................90
enabling operation scripts.....................................93
event policies........................................................95
interface alarms..................................................172
RADIUS authentication.........................................12
RPM....................................................................276
SNMP....................................................................54
system log messages, sending to a file................160
system log messages, sending to a terminal.......161
TACACS+ authentication......................................13
USB modem connections......................................33
code point aliases, CoS...............................................125
comments, in configuration statements....................xviii
commit scripts
/var/db/scripts/commit directory...........................90
disabling...............................................................91
enabling................................................................90
overview...............................................................89
superuser privileges required for...........................90
Common Criteria
disabling the console port.....................................24
event logging information...................................155
event policy information.......................................89
user account information........................................3
communities, SNMP See SNMP communities
compact flash
configuring..........................................................189
configuring for failure snapshot storage..............190
corrupted............................................................179
displaying size....................................................110
displaying usage.................................................110
internal, recovering.............................................191
minor (yellow) alarm..........................................171
recovering...........................................................191
See also compact flash recovery
compact flash recovery
adapter for..........................................................192
copying the JUNOS image...................................192
reasons for..........................................................191
requirements......................................................192
components
part numbers......................................................113
serial numbers....................................................113
configuration
alarm condition indicator....................................175
autoinstallation of.................................................81
consistency checking, with commit scripts...........89
downgrading software (CLI)................................185
downgrading software (J-Web)............................185
installation on multiple Services Routers...............81
interfaces, displaying..........................................114
modification and checking with operation
scripts...............................................................92
rule enforcement, with commit scripts.................89
upgrading (CLI)...................................................184
upgrading (J-Web)...............................................182
configuration database, displaying size......................110
configuration files
decrypting..........................................................199
encrypting..........................................................199
configuration management, automating......................89
See also commit scripts; operation scripts
console port
adapter.................................................................21
disabling...............................................................24
in a Common Criteria environment......................24
securing................................................................23
controlling user access.................................................16
conventions
how to use this guide...........................................xvi
notice icons.........................................................xvii
text and syntax...................................................xvii
CoS (class of service)
classifiers............................................................124
CoS value aliases.................................................125
forwarding classes..............................................127
interfaces............................................................123
loss priority.........................................................130
packet loss priority..............................................130
RED drop profiles...............................................126
rewrite rules........................................................128
RPM probe classification.....................................279
See also TCP RPM probes; UDP RPM probes
scheduler maps...................................................129
Index
■
293
J-series™ Services Router Administration Guide
CPU usage
PIM (in FPC summary)........................................113
CPU usage, displaying................................................109
crash files
cleaning up (CLI).................................................201
cleaning up (J-Web).............................................199
displaying size....................................................110
downloading (J-Web)...........................................200
critical logging severity...............................................158
cron logging facility....................................................157
curly braces, in configuration statements..................xviii
customer support........................................................xxi
contacting JTAC....................................................xxi
hardware information for...................................112
Cygwin, for compact flash recovery...........................192
D
daemon logging facility..............................................157
Data Encryption Standard (DES) See DES encryption
dd utility, for compact flash recovery.........................192
deactivate system scripts commit command...............91
deactivate system scripts op command.......................94
debug logging severity...............................................158
decryption, configuration files See file encryption
default configuration file, for autoinstallation...............84
delete system scripts commit command......................91
delete system scripts op command..............................94
deleting
crash files (CLI)...................................................202
crash files (J-Web)...............................................200
log files (CLI).......................................................202
log files (J-Web)...................................................200
software images (CLI).........................................202
temporary files (CLI)...........................................202
temporary files (J-Web).......................................200
deleting backup software image.................................201
DES encryption
for international JUNOS......................................203
setting.................................................................204
destination address, displaying..................................116
DHCP (Dynamic Host Configuration Protocol)
autoinstallation, compatibility with.......................65
configuring the server (configuration editor).........72
conflict detection and resolution...........................65
conflicts..............................................................144
DHCP binding database, verifying........................76
interface restrictions.............................................65
limitations.............................................................63
monitoring..........................................................143
options..................................................................65
overview...............................................................64
See also DHCP leases; DHCP pages; DHCP
pools; DHCP server
Quick Configuration..............................................66
294
■
Index
server function......................................................63
verification............................................................75
DHCP leases
configuring (Quick Configuration).........................70
monitoring..........................................................143
DHCP pages
field summary......................................................70
main.....................................................................67
pool information...................................................68
static binding page................................................69
DHCP pools
configuring (Quick Configuration).........................70
monitoring..........................................................144
DHCP server
boot operations (Quick Configuration)..................71
configuring (configuration editor)..........................72
displaying configurations......................................75
information (Quick Configuration)........................70
monitoring operations........................................143
preparation...........................................................66
Quick Configuration..............................................66
sample configuration............................................72
static bindings (Quick Configuration)....................71
statistics................................................................79
subnet and single client........................................74
subnet for configuration (Quick
Configuration)...................................................70
verifying a configuration.......................................75
verifying operation................................................77
verifying the DHCP binding database....................76
diagnosis
alarm configurations...........................................175
automating with event policies.............................94
See also event policies
chassis................................................................171
CLI command summary.....................................211
DHCP conflicts....................................................144
DHCP statistics.....................................................79
displaying DHCP server configurations.................75
displaying firewall filter for.................................264
displaying packet capture configurations............263
hardware............................................................171
interfaces....................................................168, 245
J-Web tools overview..........................................210
license infringement...........................................172
monitoring network performance.......................267
MPLS connections (J-Web)..................................219
multicast paths...................................................240
network traffic....................................................246
packet capture....................................................253
packet capture (J-Web)........................................226
ping command...................................................230
ping host (J-Web)................................................216
ping MPLS (J-Web)..............................................219
ports...................................................................168
preparation.................................................106, 215
Index
SNMP health monitor............................................49
system logs.........................................................155
system operation................................................244
traceroute (J-Web)...............................................223
traceroute command..........................................237
traceroute monitor command.............................237
traffic analysis with packet capture.....................253
verifying captured packets..................................264
verifying DHCP binding database.........................76
verifying DHCP server operation...........................77
verifying dialer interfaces......................................44
verifying RPM probe servers...............................288
verifying RPM statistics.......................................286
verifying USB modem interfaces...........................43
viewing active alarms.........................................174
diagnostic commands................................................211
dial-in, USB modem (configuration editor)...................36
See also dialer interface, for USB modem
dial-up modem connection
configuring router end..........................................33
configuring user end.............................................39
connecting router end...........................................33
connecting user end..............................................40
dialer interface, for USB modem
adding (configuration editor).................................35
See also USB modem connections
CHAP for PPP (configuration editor)......................37
dial-in (configuration editor)..................................36
limitations.............................................................30
naming convention...............................................30
restrictions............................................................30
verifying...............................................................44
dialer pools, for USB modems .....................................34
See also dialer interface, for USB modem
dictionary attacks, preventing......................................26
DiffServ code points, bits for RPM probes..................273
disabling
commit scripts......................................................91
console port..........................................................24
operation scripts...................................................94
packet capture....................................................261
root login to console port......................................24
system logs.........................................................162
discarded packets......................................................115
disconnection of console cable for console logout........24
dl0...............................................................................30
DLSw (data link switching)
circuits................................................................122
initial pacing window..........................................122
monitoring..........................................................121
peer information.................................................122
peer IP address...................................................121
protocol version..................................................122
reachability.........................................................123
software version.................................................122
vendor ID............................................................121
DLSw routing information..........................................121
DNS (Domain Name System) server address,
displaying...............................................................108
documentation set
comments on.......................................................xxi
Domain Name System address, displaying................108
downgrading
software, with J-Web...........................................185
software, with the CLI ........................................185
download URL...........................................................181
downloading
configuration, with autoinstallation.......................84
crash files (J-Web)...............................................200
log files (J-Web)...................................................200
software images (J-Web).....................................200
software upgrades...............................................181
temporary files (J-Web).......................................200
DRAM, for PIM (in FPC summary)..............................113
drop probabilities, CoS...............................................126
drop profiles, CoS......................................................126
dropped packets........................................................115
DS1 ports See T1 ports
DS3 ports See E3 ports; T3 ports
DSCPs (DiffServ code points), bits for RPM
probes....................................................................273
dynamic binding, DHCP See DHCP; DHCP leases; DHCP
server
dynamic call admission control (CAC) information,
TGM550 (VoIP).......................................................152
Dynamic Host Configuration Protocol See DHCP
E
E3 ports, alarm conditions and configuration
options...................................................................169
egress See RPM probes, outbound times
emergency logging severity........................................158
encapsulation, modifying on packet capture-enabled
interfaces...............................................................262
encryption, configuration files See file encryption
enforcement of configuration rules..............................89
error logging severity.................................................158
Ethernet ports
alarm condition indicator....................................175
alarm conditions and configuration options........168
autoinstallation on................................................82
configuring alarms on.........................................172
Gigabit Ethernet ports, SNMP suppport.................47
Ethernet rollover cable, connecting the router to a
management device.................................................21
event notifications, automating response to with event
policies.....................................................................94
See also SNMP traps; system log messages
Index
■
295
J-series™ Services Router Administration Guide
event policies
Common Criteria information...............................89
configuration editor..............................................95
overview...............................................................95
event viewer, J-Web
Common Criteria information.............................155
overview.............................................................162
See also system log messages
Extensible Stylesheet Language Transformations (XSLT)
See commit scripts; operation scripts
F
facility none statement...............................................162
failures
PIM, troubleshooting...........................................171
Routing Engine fan, troubleshooting...................171
fans
failure, troubleshooting.......................................171
speed, monitoring...............................................112
status, monitoring...............................................112
file encryption
.gz.jc file extension.............................................203
decrypting configuration files..............................205
directories...........................................................203
encrypting configuration files..............................204
encryption algorithms required for JUNOS
versions...........................................................203
encryption key....................................................203
overview.............................................................203
superuser privileges required for.........................203
file management
backup software image.......................................201
configuration files...............................................199
crash files (CLI)...................................................201
crash files (J-Web)...............................................199
encryption-decryption See file encryption
log files...............................................................199
log files (CLI).......................................................201
log files (J-Web)...................................................199
packet capture file creation.................................256
software images (CLI).........................................201
software images (J-Web).....................................199
temporary files (CLI)...........................................201
temporary files (J-Web).......................................199
filtering
command output................................................105
system log messages..........................................162
system log messages, regular expressions
for...................................................................158
filters See firewall filters; stateful firewall filters
firewall filters
for packet capture, configuring...........................259
for packet capture, overview...............................255
stateful See stateful firewall filters
firewalls See firewall filters; stateful firewall filters
296
■
Index
flapping......................................................................115
font conventions.........................................................xvii
forwarding classes, CoS..............................................127
FPC summary See PIMs
framing errors............................................................115
frequency, test See RPM probes, test intervals
G
get requests.................................................................48
glossary
alarms.................................................................165
autoinstallation.....................................................81
DHCP....................................................................63
diagnostic...........................................................209
monitoring..........................................................101
packet capture....................................................253
RPM....................................................................267
system logs.........................................................155
USB modems........................................................29
user authentication.................................................3
groups
BGP, displaying...................................................117
for SNMP traps......................................................56
gzip utility, for compact flash recovery......................192
H
halting a Services Router
with J-Web..........................................................194
with the CLI........................................................196
halting a Services Router immediately
with J-Web .........................................................194
with the CLI........................................................196
hardware
alarm conditions and remedies...........................171
MAC address, displaying.....................................115
major (red) alarm conditions on..........................167
recommended for compact flash recovery..........192
timestamp See RPM probe timestamps
version, displaying..............................................112
Hayes-compatible modem commands, USB modem
initialization..............................................................41
health monitor See SNMP health monitor
heap space, for PIM (in FPC summary)......................113
heat status, checking..................................................111
help syslog ? command................................................95
host reachability
ping command...................................................230
ping host (J-Web)................................................216
host-specific configuration file, for autoinstallation......84
hostname
displaying (J-Web)...............................................108
monitoring traffic by matching...........................249
opening an SSH session to....................................25
overriding for SNMP (configuration editor)............55
Index
overriding for SNMP (Quick Configuration)...........51
pinging (CLI).......................................................230
pinging (J-Web)...................................................216
resolving...............................................................72
SNMP trap target (Quick Configuration)................52
telnetting to..........................................................25
tracing a route to (CLI)................................237, 239
tracing a route to (J-Web)....................................224
hostname.conf file, for autoinstallation........................84
how to use this guide...................................................xvi
HTTP (Hypertext Transfer Protocol), RPM probes......268
Hypertext Transfer Protocol, RPM probes..................268
I
ICMP (Internet Control Message Protocol)
RPM probes, description.....................................268
RPM probes, inbound and outbound times.........270
RPM probes, setting............................................276
idle time, displaying...................................................108
IDS (intrusion detection service)
information, displaying.......................................140
monitoring..........................................................139
search-narrowing characteristics.........................139
IKE security associations, monitoring.........................141
inbound time See RPM probes
info logging severity...................................................158
ingress See RPM probes, inbound times
init-command-string command....................................31
initial pacing window, DLSw......................................122
Install Remote page...................................................182
field summary............................................183, 187
installation
software upgrades (CLI)......................................184
software upgrades, from a remote server...........182
software upgrades, uploading.............................183
Instance to which this connection belongs
description..........................................................214
using...................................................................221
interactive-commands logging facility........................158
interfaces See management interfaces; network
interfaces; ports
internal compact flash See compact flash
Internet Key Exchange (IKE) security associations,
monitoring.............................................................141
intervals, probe and test See RPM probes
intrusion detection service See IDS
ipconfig command.......................................................77
explanation...........................................................78
IPSec (IP Security)
monitoring..........................................................140
statistics..............................................................141
tunnels, displaying..............................................140
J
J-series.......................................................................199
alarms.................................................................165
autoinstallation.....................................................81
automating operations with scripts.......................89
automating troubleshooting with scripts and event
policies..............................................................89
DHCP server.........................................................63
diagnosis.............................................................209
managing access.....................................................3
managing user authentication.................................3
monitoring .........................................................101
network management...........................................47
packet capture....................................................253
performance monitoring.....................................267
release notes, URL.................................................xv
software upgrades...............................................179
system log messages..........................................155
USB modems for remote management.................29
J-Web configuration editor
autoinstallation.....................................................85
CHAP on dialer interfaces.....................................37
controlling user access..........................................16
DHCP server.........................................................72
enabling commit scripts........................................90
enabling operation scripts.....................................93
event policies........................................................95
interface alarms..................................................172
RADIUS authentication.........................................12
RPM....................................................................276
SNMP....................................................................54
system log messages, sending to a file................160
system log messages, sending to a terminal.......161
TACACS+ authentication......................................13
USB modem connections......................................33
J-Web interface
Diagnose options................................................210
event viewer.......................................................162
managing files....................................................199
Monitor options..................................................102
jitter
description..........................................................270
See also RPM probes
in RPM probes, improving with timestamps.......269
monitoring..........................................................147
threshold, setting................................................274
JTAC (Juniper Networks Technical Assistance Center)
hardware information for...................................112
JUNOS CLI
access privilege levels.............................................5
automatic command execution with event
policies..............................................................95
denying and allowing commands...........................7
diagnostic command summary...........................212
filtering command output...................................105
monitoring (show) commands summary............102
Index
■
297
J-series™ Services Router Administration Guide
JUNOS Internet software
release notes, URL.................................................xv
JUNOS software
autoinstallation.....................................................81
encryption See file encryption
known problems, operation scripts as
workarounds.....................................................92
upgrading...........................................................179
USB modems for remote management.................29
version, displaying..............................................107
junos-jseries package See upgrades
JUNOScript Extensible Markup Language (XML) See
commit scripts; operation scripts
K
kernel logging facility.................................................158
L
label-switched paths See LSPs
laptop See management device
latency, in RPM probes, improving with
timestamps............................................................269
Layer 2 circuits, monitoring.......................................219
Layer 2 VPNs, monitoring..........................................219
Layer 3 VPNs, monitoring..........................................219
libpcap format, for packet capture files......................265
license infringement, alarm condition indicator.........175
licenses, alarm conditions and remedies....................172
limitations
ALARM LED lights yellow whether alarm is minor
or major..........................................................166
compact flash recovery does not recover
configuration files............................................192
DHCP, BOOTP agent and DHCP server cannot
coexist in router................................................64
DHCP, no support for IPv6 addresses, DNS
updates, DHCP failover, class
configuration.....................................................63
DHCP, no support on VPN interfaces....................66
MPLS, no LSP statistics on outbound router........132
mtrace from-source packet statistics always
0.....................................................................242
performance degradation with monitor traffic
command........................................................246
PPP, no J-Web monitoring information
available..........................................................147
SNMP not supported on Gigabit Ethernet
interfaces..........................................................47
software downgrade cannot be undone..............185
link states
network interfaces..............................................114
TGM550 (VoIP)...................................................152
298
■
Index
local password
default authentication method for system.............10
method for user authentication (Quick
Configuration)...................................................10
order of user authentication (configuration
editor)...............................................................15
overview.................................................................4
local template accounts................................................20
Locate LSP from interface name
description..........................................................214
using...................................................................221
Locate LSP from virtual circuit information
description..........................................................214
using...................................................................221
Locate LSP using interface name
description..........................................................214
using...................................................................220
log files
archiving.............................................................199
deleting unused files...........................................199
rotating...............................................................199
Log Files page (Download).........................................200
log messages See system log messages
logging facilities.........................................................157
logging severity levels................................................158
logical interfaces, CoS................................................123
logical operators, for multicast traffic.........................250
login classes
Common Criteria information.................................3
defining (configuration editor)..............................16
permission bits for..................................................6
predefined permissions..........................................5
specifying (Quick Configuration)...........................11
login retry limits, setting..............................................26
login time, displaying.................................................108
logs See system logs
loopback address, displaying.....................................108
loss priority, CoS........................................................130
LSPs (label-switched paths)
information about...............................................132
monitoring, with ping MPLS................................219
statistics..............................................................133
M
MAC (media access control) addresses
configured, displaying.........................................115
hardware, displaying...........................................115
major (red) alarms
action required...................................................175
description..........................................................167
PIMs...................................................................171
Routing Engine...................................................171
management device
connecting through the CLI.............................21, 22
connecting to console port..............................21, 22
Index
diagnosing problems from..................................210
monitoring from.................................................102
recovering root password from.............................21
Management Information Bases See MIBs
management interface address, displaying................108
management interfaces
active alarms......................................................115
administrative states...........................................114
alarm conditions and configuration options........168
configuration, displaying.....................................114
configuring alarms on.........................................172
monitoring..................................................113, 245
statistics..............................................................245
managing
files.....................................................................199
reboots...............................................................194
snapshots............................................................186
software..............................................................179
user authentication and access...............................3
manuals
comments on.......................................................xxi
match conditions, for multicast traffic........................248
maximum transmission unit (MTU), displaying..........115
media access control See MAC addresses
Media Gateway Controller (MGC) list, TGM550...........152
memory usage
for service sets....................................................136
general................................................................108
monitoring, PIM DRAM available........................113
monitoring, PIM heap and buffer space
used................................................................113
monitoring, SNMP See SNMP health monitor
messages See system log messages
MGC list, TGM550......................................................152
MIBs (Management Information Bases)
controlling access (configuration editor)................57
enterprise.............................................................48
standard...............................................................48
system identification (configuration editor)...........54
URLs for download...............................................48
views (configuration editor)..................................57
Microsoft Windows XP commands, connecting to
router from a management device...........................39
minor (yellow) alarms
action required...................................................175
alternative boot device........................................171
description..........................................................167
internal compact flash........................................171
Routing Engine...................................................171
modem connection to router USB port See USB modem
connections
modem connection to user management device See
USB modem connections
monitor interface command......................................245
controlling output...............................................245
monitor interface traffic command............................245
controlling output...............................................245
monitor list command...............................................244
monitor start command.............................................244
monitor stop command.............................................244
monitor traffic command...........................................247
options................................................................247
performance impact...........................................246
monitor traffic matching command...........................248
arithmetic, binary, and relational operators........250
logical operators.................................................250
match conditions................................................248
monitoring
alarms.................................................................174
Avaya VoIP.........................................................151
BGP.....................................................................117
BGP neighbors, with RPM probes........................283
chassis................................................................111
CLI commands and corresponding J-Web
options............................................................102
DHCP..................................................................143
DLSw..................................................................121
health of the router See SNMP health monitor
IDS information..................................................139
IKE security........................................................140
IKE security associations.....................................141
interfaces....................................................113, 245
IPSec tunnels......................................................140
J-Web options and corresponding CLI
commands......................................................102
Layer 2 circuits...................................................219
Layer 2 VPNs......................................................219
Layer 3 VPNs......................................................219
MPLS traffic
engineering.....................130, 131, 132, 133, 134
multicast paths...................................................240
NAT pools...........................................................142
network interface traffic.....................................246
network traffic with packet capture....................253
OSPF...................................................................119
overview.............................................................102
See also diagnosis; statistics; status
ports...................................................................113
PPP (CLI).............................................................147
PPPoE.................................................................148
preparation.................................................106, 215
RIP......................................................................120
router health See SNMP health monitor
routing information.............................................115
routing tables......................................................116
RPM probes........................................................145
service sets.........................................................135
services interfaces...............................................135
SNMP health monitor See SNMP health monitor
stateful firewall filters..........................................136
system log messages..........................................155
Index
■
299
J-series™ Services Router Administration Guide
system logs.........................................................244
system process information................................110
system properties...............................................107
TGM550..............................................................151
trace files............................................................244
VoIP....................................................................151
MPLS (Multiprotocol Label Switching)
connections, checking.........................................219
LSPs....................................................................132
monitoring interfaces..........................................131
monitoring LSP information................................131
monitoring LSP statistics.............................132, 133
monitoring MPLS interfaces................................131
monitoring RSVP interfaces................................134
monitoring RSVP sessions...........................133, 134
monitoring traffic engineering............................130
mtrace monitor command.........................................243
results.................................................................244
mtrace-from-source command...................................241
options................................................................241
results.................................................................243
MTU (maximum transmission unit), displaying..........115
multicast
trace operations, displaying................................243
tracing paths.......................................................241
MultiModem, recommended for USB modem
connections..............................................................29
multiple routers
deploying See autoinstallation
multiple routers, using snapshots to replicate
configurations
CLI......................................................................189
J-Web..................................................................188
Multiprotocol Label Switching See MPLS
N
name of network interfaces, displaying......................114
NAT (Network Address Translation)
displaying pools..................................................143
monitoring pools.................................................142
neighbors, BGP See BGP neighbors; BGP RPM probes
network interfaces
active alarms......................................................115
administrative states...........................................114
alarm conditions and configuration options........168
configuration, displaying.....................................114
configuring alarms on.........................................172
integrated services, alarm conditions and
configuration options......................................168
monitoring..................................................113, 245
monitoring MPLS traffic engineering...................131
monitoring traffic................................................246
monitoring, CoS..................................................123
monitoring, PPPoE..............................................148
monitoring, RSVP...............................................135
300
■
Index
packet capture, configuring on............................259
packet capture, disabling before changing
encapsulation..................................................262
packet capture, supported on..............................255
services, alarm conditions and configuration
options............................................................169
statistics..............................................................245
network management..................................................47
automating with operation scripts.........................92
diagnosis and problem-solving with scripts...........92
See also SNMP
network management system (NMS)...........................49
network performance See RPM
network.conf file, default for autoinstallation.........84, 85
next hop, displaying...................................................117
NMS (network management system)...........................49
no-world-readable statement.....................................161
Norton Ghost utility, for compact flash recovery........192
notice icons................................................................xvii
notice logging severity...............................................158
notifications See event policies; system log messages;
SNMP traps
O
object identifiers (OIDs)...............................................48
OIDs (object identifiers)...............................................48
op command...............................................................93
Open Shortest Path First See OSPF
operation scripts
/var/db/scripts/op directory...................................93
disabling...............................................................94
enabling................................................................93
executing from the CLI.........................................93
executing within an event policy...........................94
overview...............................................................92
superuser privileges required for...........................93
operational mode, filtering command output.............105
operator login class permissions....................................5
operators
arithmetic, binary, and relational operators........250
logical.................................................................250
OSPF (Open Shortest Path First)
monitoring..........................................................119
statistics..............................................................120
OSPF interfaces
displaying...........................................................119
status..................................................................119
OSPF neighbors
displaying...........................................................119
status..................................................................119
OSPF routing information..........................................119
outbound time See RPM probes
Index
P
packet capture
configuring..........................................................259
configuring (J-Web).............................................226
configuring on an interface.................................259
disabling.............................................................261
disabling before changing encapsulation on
interfaces........................................................262
displaying configurations....................................263
displaying firewall filter for.................................264
enabling..............................................................257
encapsulation on interfaces, disabling before
modifying........................................................262
files See packet capture files
firewall filters, configuring..................................259
firewall filters, overview......................................255
J-Web tool...........................................................226
overview.............................................................254
overview (J-Web).................................................226
preparation.........................................................257
router interfaces supported.................................255
verifying captured packets..................................264
verifying configuration........................................263
verifying firewall filter for...................................264
packet capture files
analyzing............................................................256
libpcap format....................................................265
overview.............................................................256
renaming before modifying encapsulation on
interfaces........................................................262
Packet Capture page
field summary....................................................227
results.................................................................229
packet loss priority, CoS.............................................130
packets
capturing............................................................253
capturing with J-Web packet capture..................226
discarded............................................................115
dropped..............................................................115
monitoring jitter..................................................147
monitoring packet loss........................................146
monitoring round-trip times................................146
multicast, tracking .............................................241
packet capture....................................................253
packet capture (J-Web)........................................226
tracking MPLS.....................................................222
tracking with J-Web traceroute............................223
tracking with the traceroute command...............237
parentheses, in syntax descriptions...........................xviii
part numbers.............................................................113
partitioning a boot medium.......................................189
password retry limits, setting.......................................27
passwords
for downloading software upgrades....................182
local password method for user authentication
(Quick Configuration)........................................10
See also local password
RADIUS secret........................................................9
retry limits............................................................26
root password, recovering....................................21
setting login retry limits........................................26
TACACS+ secret...................................................10
paths, multicast, tracing.............................................240
PC See management device
PCAP See packet capture
peers, BGP See BGP neighbors; BGP RPM probes
peers, DLSw
connection information......................................122
IP address...........................................................121
reachability information......................................123
performance, monitoring See RPM
permission bits, for login classes....................................6
permissions
denying and allowing commands...........................7
predefined..............................................................5
physdiskwrite utility, for compact flash recovery.......192
physical interfaces, CoS.............................................123
PIC See PIMs
PIMs (Physical Interface Modules)
checking power and heat status..........................111
CPU usage (in FPC summary).............................113
DRAM available (in FPC summary).....................113
failure.................................................................171
heap and buffer space used (in FPC
summary)........................................................113
major (red) alarm................................................171
PIM number (always 0).......................................112
slot number (in FPC summary)...........................113
slot status (in FPC summary)..............................113
temperature (in FPC summary)...........................113
ping
host reachability (CLI).........................................230
host reachability (J-Web).....................................216
ICMP probes.......................................................276
indications..........................................................218
RPM probes See RPM probes
TCP and UDP probes..........................................279
ping command...........................................................230
DHCP server operation.........................................77
DHCP server operation, explanation.....................78
options................................................................230
Ping end point of LSP
description..........................................................214
using...................................................................221
ping host
results.................................................................218
Index
■
301
J-series™ Services Router Administration Guide
Ping Host page...........................................................216
field summary....................................................216
results.................................................................217
Ping LDP-signaled LSP
description..........................................................214
using...................................................................220
Ping LSP to Layer 3 VPN prefix
description..........................................................214
using...................................................................220
ping MPLS (J-Web)
indications..........................................................222
Layer 2 circuits...................................................219
Layer 2 VPNs......................................................219
Layer 3 VPNs......................................................219
LSP state.............................................................219
options................................................................213
requirements......................................................215
results.................................................................222
ping mpls l2circuit command.....................................236
results.................................................................222
ping mpls l2vpn command........................................235
results.................................................................222
ping mpls l3vpn command........................................234
results.................................................................222
ping mpls ldp command............................................233
results.................................................................222
ping mpls lsp-end-point command.............................233
results.................................................................222
Ping MPLS page.........................................................219
field summary....................................................219
results.................................................................222
ping mpls rsvp command..........................................233
results.................................................................222
Ping RSVP-signaled LSP
description..........................................................213
using...................................................................219
pipe (|) command, to filter output..............................105
Point-to-Point Protocol See PPP
Point-to-Point Protocol over Ethernet See PPPoE
ports
alarm conditions and configuration options........168
configuration, displaying.....................................114
configuring alarms on.........................................172
console port, securing...........................................23
DHCP interface restrictions...................................65
individual port types...........................................168
monitoring..........................................................113
power management, chassis......................................111
PPP (Point-to-Point Protocol)
CHAP on dialer interfaces.....................................37
monitoring (CLI)..................................................147
PPPoE (Point-to-Point Protocol over Ethernet)
interfaces............................................................148
monitoring..........................................................148
session status......................................................148
302
■
Index
statistics..............................................................149
version information............................................150
printf statements..........................................................92
probe loss
monitoring..........................................................146
threshold, setting................................................274
probes, monitoring............................................145, 148
See also RPM probes
process command, displaying....................................110
process ID, displaying................................................110
process information, system, monitoring...................110
process owner, displaying..........................................110
process sleep state, displaying...................................111
process start time, displaying.....................................111
process status, displaying...........................................110
process terminal, displaying.......................................110
properties, system, monitoring..................................107
protocol version, DLSw..............................................122
protocols
DHCP See DHCP
DLSw, monitoring...............................................121
originating, displaying.........................................116
OSPF, monitoring...............................................119
PPP, monitoring..................................................147
RIP, monitoring..................................................120
routing protocols, monitoring.....................115, 117
Q
Quick Configuration
Add a RADIUS Server page.....................................8
Add a TACACS+ Server page.................................9
Add a User page....................................................11
adding users.........................................................11
authentication method..........................................10
DHCP main page..................................................67
DHCP pool page....................................................68
DHCP static binding page.....................................69
Packet Capture page...........................................227
Packet Capture results page................................229
RADIUS server........................................................8
RPM pages..........................................................272
SNMP page...........................................................50
TACACS+ server....................................................9
user management...................................................8
Users page............................................................10
View Events page................................................162
R
RADIUS
adding a server (Quick Configuration).....................8
authentication (configuration editor).....................12
Common Criteria information.................................3
order of user authentication (configuration
editor)...............................................................15
Index
secret (configuration editor)..................................13
secret (Quick Configuration)...................................9
specifying for authentication (Quick
Configuration)...................................................10
random early detection (RED) drop profiles, CoS.......126
RARP, for autoinstallation............................................86
RBBL (reported BBL)..................................................152
reachability, DLSw.....................................................123
See also host reachability
read or write error, Routing Engine............................171
read-only login class permissions...................................5
real-time performance monitoring See RPM
reboot immediately
with J-Web..........................................................194
with the CLI........................................................195
rebooting
with J-Web .........................................................194
with the CLI........................................................195
recovering compact flash See compact flash recovery
red alarms See major alarms
red Alarms indicator, in J-Web...................................174
RED drop profiles, CoS...............................................126
registration form, for software upgrades............179, 181
regular expressions for filtering system logs..............158
relational operators, for multicast traffic....................250
release notes, URL........................................................xv
remote accounts
accessing with SSH (CLI).......................................25
accessing with Telnet (CLI)....................................24
remote template accounts....................................19
remote connection to router
connecting USB modem to router.........................33
See also USB modem connections
connecting USB modem to user management
device...............................................................39
See also USB modem connections
remote management, with USB modems.....................29
See also USB modem connections; USB modems
remote monitoring (RMON) See SNMP health monitor
remote server, upgrading from..................................182
remote template accounts............................................19
reported BBL (RBBL)..................................................152
request interface modem reset umd0 command.........42
request system halt command...................................196
options................................................................196
request system reboot command...............................195
options................................................................195
request system set-encryption-key algorithm des
command...............................................................204
request system set-encryption-key command............204
request system set-encryption-key des unique...........204
request system set-encryption-key unique.................204
request system snapshot command...........................189
options................................................................189
request system software add no-validate unlink reboot
command...............................................................184
request system storage cleanup command................202
request system storage cleanup dry-run
command...............................................................202
rescue configuration, alarm about..............................172
Resource Reservation Protocol See RSVP
retry limits for passwords............................................26
Reverse Address Resolution Protocol (RARP), for
autoinstallation.........................................................86
reverting to a previous configuration file (J-Web).......185
rewrite rules, CoS.......................................................128
RIP (Routing Information Protocol)
monitoring..........................................................120
statistics..............................................................120
RIP neighbors
displaying...........................................................121
status..................................................................121
RIP routing information.............................................120
RJ-45 to DB-9 serial port adapter..................................21
RMON (remote monitoring) See SNMP health monitor
rolling back a configuration file, to downgrade software
(CLI).......................................................................185
rollover cable, connecting the console port..................21
root login to the console, disabling...............................24
root password recovery................................................21
rotating files.......................................................200, 202
round-trip time
description..........................................................270
See also RPM probes
threshold, setting................................................274
router.conf file, for autoinstallation..............................84
routing
monitoring..........................................................115
traceroute (J-Web)...............................................223
traceroute command..........................................237
traceroute monitor command.............................237
Routing Engine
clogged air filter..................................................171
fan failure...........................................................171
major (red) alarm................................................171
minor (yellow) alarm..........................................171
read or write error..............................................171
temperature........................................................112
too warm............................................................171
routing policies
export, displaying...............................................119
import, displaying...............................................119
routing table
displaying...........................................................116
monitoring..........................................................116
RPM (real-time performance monitoring)
basic probes (configuration editor)......................276
BGP monitoring See BGP RPM probes
inbound and outbound times..............................270
jitter, viewing......................................................147
monitoring probes..............................................145
Index
■
303
J-series™ Services Router Administration Guide
overview.............................................................268
See also RPM probes
preparation.........................................................271
probe and test intervals......................................269
probe counts.......................................................270
Quick Configuration............................................271
round-trip times, description...............................270
round-trip times, viewing....................................146
sample configuration..........................................286
sample graphs....................................................145
statistics..............................................................270
statistics, verifying..............................................286
TCP probes (configuration editor).......................279
See also TCP RPM probes
tests....................................................................269
tests, viewing......................................................145
threshold values..................................................271
tuning probes......................................................282
UDP probes (configuration editor).......................279
See also UDP RPM probes
verifying probe servers.......................................288
RPM pages.................................................................272
field summary....................................................272
RPM probe timestamps
overview.............................................................269
setting (configuration editor)...............................276
RPM probes
basic (configuration editor).................................276
BGP neighbors See BGP RPM probes
cumulative jitter..................................................147
current tests........................................................145
DSCP bits (Quick Configuration).........................273
graph results.......................................................145
ICMP (configuration editor).................................276
inbound times.....................................................270
jitter threshold....................................................274
monitoring..........................................................145
outbound times...................................................270
probe count, setting (Quick Configuration)..........273
probe count, tuning............................................283
probe counts.......................................................270
probe intervals....................................................269
probe intervals, setting (Quick
Configuration).................................................273
probe intervals, tuning........................................283
probe loss count.................................................274
probe owner.......................................................272
probe type, setting (Quick Configuration)...........273
probe types.........................................................268
round-trip time threshold....................................274
round-trip times, description...............................270
round-trip times, viewing....................................146
SNMP traps (Quick Configuration).......................275
source address, setting........................................283
TCP (configuration editor)...................................279
See also TCP RPM probes
304
■
Index
TCP server port...................................................276
test intervals.......................................................269
test intervals, setting (Quick Configuration)........273
test target...........................................................272
threshold values, description..............................271
threshold values, setting (Quick
Configuration).................................................274
timestamps See RPM probe timestamps
tuning.................................................................282
UDP (configuration editor)..................................279
See also UDP RPM probes
UDP server port..................................................276
verifying TCP and UDP probe servers.................288
RSVP (Resource Reservation Protocol)
interfaces, monitoring.........................................135
sessions, monitoring...........................................134
RTT See RPM probes, round-trip times
S
samples
alarm configuration............................................175
basic RPM probes...............................................276
DHCP server configuration....................................75
local template account..........................................20
RPM probes........................................................286
RPM test graphs..................................................145
TCP and UDP probes..........................................279
user account.........................................................17
scheduler maps, CoS..................................................129
scheduling a reboot
with J-Web..........................................................194
with the CLI........................................................196
scripts See commit scripts; operation scripts
search, IDS.................................................................139
secret
RADIUS (configuration editor)...............................13
RADIUS (Quick Configuration)................................9
TACACS+ (configuration editor)...........................14
TACACS+ (Quick Configuration)..........................10
security
access privileges...............................................5, 16
configuration file encryption...............................203
See also file encryption
console port security.............................................23
IDS intrusion detection.......................................139
IKE, monitoring security associations.................141
packet capture for intrusion detection................254
password retry limits............................................26
user accounts....................................................4, 17
user authentication.................................................4
serial cable, disconnection for console logout..............24
Serial Line Address Resolution Protocol (SLARP), for
autoinstallation.........................................................86
Index
serial number
chassis components............................................113
Services Router...................................................107
serial ports
alarm condition indicator....................................175
alarm conditions and configuration options........168
autoinstallation on................................................82
configuring alarms on.........................................172
service sets, monitoring.............................................135
services interfaces See adaptive services interfaces
services module
alarm condition indicator....................................175
alarm conditions and configuration options........169
Services Router
as a DHCP server..................................................63
autoinstallation.....................................................81
automating operations and troubleshooting..........89
diagnosis.............................................................209
halting (CLI)........................................................196
halting (J-Web)....................................................194
monitoring .........................................................101
multiple, deploying See autoinstallation
network management...........................................47
packet capture....................................................253
performance monitoring.....................................267
rebooting (CLI)....................................................195
rebooting (J-Web)................................................194
serial number, displaying....................................107
software upgrades...............................................179
USB modems for remote management.................29
sessions
BGP peer, status details.......................................118
BGP peer, status summary..................................118
RSVP, monitoring...............................................134
Telnet...................................................................25
set no-encrypt-configuration-files command..............205
set requests..................................................................48
set system dump-device command............................190
options................................................................191
severity levels
for alarms See alarm severity
for system logs...................................................158
show bgp neighbor command....................................117
show bgp summary command...................................117
show chassis alarms command..................111, 174, 175
show chassis environment command........................111
show chassis fpc command.......................................111
show chassis hardware command.............................111
show chassis power-ratings command.......................111
show class-of-service classifier command..................124
show class-of-service code-point-aliases
command...............................................................125
show class-of-service command.................................123
show class-of-service drop-profile command..............126
show class-of-service forwarding-class command......127
show class-of-service rewrite-rules command............128
show class-of-service scheduler-map command.........129
show dlsw capabilities command...............................121
show dlsw circuits command.....................................121
show dlsw peers command........................................121
show dlsw reachability command..............................121
show firewall filter dest-all command.........................264
show interfaces detail command................................114
show interfaces dl0 extensive command.....................44
show interfaces interface-name command.................114
show interfaces pp0 command..................................148
show interfaces terse command................................114
show interfaces umd0 extensive command.................43
explanation, for USB modem interfaces................43
show log command....................................................157
show mpls interface command..................................131
show mpls lsp command...........................................131
show mpls statistics command..................................132
show ospf interfaces command.................................119
show ospf neighbors command.................................119
show ospf statistics command...................................119
show ppp address-pool command..............................147
show ppp interface command....................................147
show ppp statistics command....................................147
show ppp summary command..................................147
show pppoe interfaces command..............................148
show pppoe statistics command................................148
show pppoe version command..................................148
show rip neighbors command....................................120
show rip statistics command......................................120
show route detail command.......................................116
show route terse command........................................116
show services ids destination-table command...........139
show services ids pair-table command.......................139
show services ids source-table command...................139
show services ipsec-vpn ike command......................140
show services ipsec-vpn ipsec command...................140
show services ipsec-vpn ipsec security-associations
command...............................................................140
show services nat pool command..............................142
show services rpm active-servers command..............288
explanation.........................................................288
show services rpm probe-results command.......145, 286
explanation.........................................................287
show services service-sets memory-usage
command...............................................................135
show services service-sets summary command.........135
show services stateful-firewall conversations
command...............................................................138
show services stateful-firewall flows command..........138
show snmp health-monitor command.........................59
show snmp statistics command...................................58
show system alarms command..................................174
show system autoinstallation status command............87
show system processes command.....................110, 157
Index
■
305
J-series™ Services Router Administration Guide
show system services dhcp binding
command.........................................................76, 143
explanation...........................................................77
show system services dhcp binding detail
command.................................................................76
explanation...........................................................77
show system services dhcp command.........................75
show system services dhcp conflict
command...................................................65, 76, 143
explanation...........................................................77
show system services dhcp pool command.........75, 143
show system services dhcp statistics
command.........................................................79, 143
explanation...........................................................79
show system storage command.................................107
show system uptime command.................................107
show system users command....................................107
show tgm fpc command............................................151
show tgm telephony—interface—module status
command...............................................................151
show forwarding-options command...........................263
Simple Network Management Protocol See SNMP
SLARP, for autoinstallation...........................................86
slots, PIM, monitoring (in FPC summary)...................113
SMI (Structure of Management Information)................48
Snapshot page............................................................187
snapshots
configuring for failure snapshot storage..............190
to replace internal compact flash, for multiple
routers (CLI)....................................................189
to replace primary compact flash, for multiple
routers (J-Web)................................................188
SNMP (Simple Network Management Protocol)
agents See SNMP agents
architecture...........................................................47
communities See SNMP communities
controlling access (configuration editor)..........57, 58
get requests..........................................................48
health monitor See SNMP health monitor
managers..............................................................47
MIBs See MIBs
on Gigabit Ethernet interfaces...............................47
overview...............................................................47
preparation...........................................................50
Quick Configuration..............................................50
set requests...........................................................48
spoofed traps........................................................49
system identification (configuration editor)...........54
traps See SNMP traps
views (configuration editor)..................................57
SNMP agents................................................................47
configuring (configuration editor)..........................55
verifying...............................................................58
306
■
Index
SNMP communities
creating (configuration editor)...............................55
description............................................................48
Quick Configuration..............................................51
SNMP health monitor
description............................................................49
Quick Configuration..............................................50
verifying...............................................................59
SNMP managers...........................................................47
SNMP page...................................................................50
SNMP traps
automating response to with event policies..........94
creating groups for (configuration editor)..............56
initiation by event policy, overview......................95
initiation by event policy, setting (configuration
editor)...............................................................97
overview...............................................................49
performance monitoring See RPM probes
Quick Configuration..............................................51
spoofed traps........................................................49
software
halting immediately (CLI) ...................................196
halting immediately (J-Web) ...............................194
upgrades See upgrades
version, displaying..............................................107
version, DLSw.....................................................122
software images
cleaning up (CLI).................................................201
cleaning up (J-Web).............................................199
downloading (J-Web)...........................................200
speed, fans, monitoring.............................................112
spoofed SNMP traps.....................................................49
SSH
accessing remote accounts (CLI)...........................25
setting login retry limits........................................26
ssh command..............................................................25
options..................................................................25
stateful firewall filters
displaying...........................................................138
flow status..........................................................138
monitoring..........................................................136
static binding, DHCP See DHCP; DHCP leases; DHCP
server
statistics
BGP.....................................................................117
DHCP..................................................................144
DHCP server.........................................................79
interfaces............................................................245
IPSec...................................................................141
LSP.....................................................................133
OSPF...................................................................120
performance monitoring.....................................270
PPPoE.................................................................149
RIP......................................................................120
RPM, description.................................................270
Index
RPM, monitoring.................................................145
RPM, verifying....................................................286
status
administrative link state......................................114
autoinstallation.....................................................87
BGP.....................................................................118
fans.....................................................................112
link states, network interfaces............................114
link states, TGM550 (VoIP)..................................152
OSPF interfaces..................................................119
OSPF neighbors..................................................119
RIP neighbors.....................................................121
slot (in FPC summary)........................................113
stateful firewall filters..........................................138
storage media
configuring boot devices.....................................186
recovering internal compact flash.......................191
Structure of Management Information (SMI)................48
super-user login class permissions.................................5
superuser login class permissions..................................5
support, technical See technical support
syntax conventions....................................................xvii
syslog See system logs
system identification, displaying................................107
system log messages
/var/log directory.................................................160
capturing in a file (configuration editor)..............160
Common Criteria information.............................155
destinations........................................................157
displaying at a terminal (configuration
editor).....................................................159, 161
event viewer.......................................................162
facilities..............................................................157
filtering (Quick Configuration).............................162
monitoring (Quick Configuration).......................162
overview.............................................................156
preparation.........................................................159
regular expressions for filtering..........................158
sending messages to a file (configuration
editor).............................................................160
sending messages to a terminal (configuration
editor).............................................................161
severity levels.....................................................158
viewing (Quick Configuration).............................164
system logs
archiving.............................................................161
Common Criteria information.............................155
destinations for log files......................................157
disabling.............................................................162
displaying size....................................................110
event triggers for SNMP traps, setting in event
policies..............................................................97
file cleanup (CLI).................................................201
file cleanup (J-Web).............................................199
functions.............................................................156
logging facilities..................................................157
logging severity levels.........................................158
messages See system log messages
monitoring..........................................................244
overview.............................................................156
regular expressions for filtering..........................158
system management......................................................3
automating...........................................................89
See also commit scripts; event policies;
operation scripts
displaying log and trace file contents..................244
login classes......................................................5, 16
preparation.............................................................8
Quick Configuration................................................8
system logs.........................................................155
template accounts.............................................7, 18
user accounts....................................................4, 17
user authentication.................................................4
system process information, displaying.....................111
system storage, displaying.........................................110
system time, displaying.............................................108
T
T1 ports
alarm conditions and configuration options........168
configuring alarms on.........................................172
T3 ports
alarm condition indicator....................................175
alarm conditions and configuration options........170
configuring alarms on.........................................172
TACACS+
adding a server (Quick Configuration).....................9
authentication (configuration editor).....................13
Common Criteria information.................................3
order of user authentication (configuration
editor)...............................................................15
secret (configuration editor)..................................14
secret (Quick Configuration).................................10
specifying for authentication (Quick
Configuration)...................................................10
TCP RPM probes
CoS classification, destination interface
requirement....................................................279
CoS classification, use with caution.....................280
description..........................................................269
server port..........................................................276
setting.................................................................279
verifying servers.................................................288
technical support
contacting JTAC....................................................xxi
hardware information for...................................112
Telephony Gateway Module See TGM550
Telephony Interface Module See TGM550
Telnet
accessing remote accounts (CLI)...........................24
setting login retry limits........................................26
Index
■
307
J-series™ Services Router Administration Guide
telnet command...........................................................25
options..................................................................25
Telnet session..............................................................25
temperature
chassis, monitoring.............................................112
PIM (in FPC summary)........................................113
Routing Engine, too warm..................................171
template accounts
description..............................................................7
local accounts (configuration editor).....................20
remote accounts (configuration editor).................19
temporary files
cleaning up (CLI).................................................201
cleaning up (J-Web).............................................199
displaying size....................................................110
downloading (J-Web)...........................................200
for packet capture...............................................256
terminal session, sending system log messages
to............................................................................161
terminology
alarms.................................................................165
autoinstallation.....................................................81
DHCP....................................................................63
diagnostic...........................................................209
monitoring..........................................................101
packet capture....................................................253
RPM....................................................................267
system logs.........................................................155
USB modems........................................................29
user authentication.................................................3
tests See RPM
TFTP, for autoinstallation.............................................83
TGM550
dynamic call admission control (CAC)
information.....................................................152
Media Gateway Controller (MGC) list...................152
monitoring..........................................................151
threshold
falling....................................................................49
rising....................................................................49
SNMP health monitor............................................49
threshold values, for RPM probes See RPM probes
time to live See TTL
time zone, displaying.................................................108
timestamps
for RPM probes See RPM probe timestamps
suppressing in packet headers, in captured
packets............................................................228
suppressing in packet headers, in traffic
monitoring......................................................247
trace files
monitoring..........................................................244
multicast, monitoring..........................................243
traceroute
CLI command.....................................................237
indications..........................................................225
308
■
Index
J-Web tool...........................................................223
results.................................................................225
TTL increments...................................................223
traceroute command..................................................237
options................................................................237
traceroute monitor
CLI command.....................................................238
traceroute monitor command....................................238
options................................................................239
results.................................................................240
Traceroute page.........................................................224
field summary....................................................224
traffic
analyzing with packet capture.............................253
multicast, tracking..............................................241
tracking with J-Web traceroute............................223
tracking with the traceroute command...............237
transmission speed, displaying..................................115
traps See SNMP traps
triggers for SNMP traps, setting in event policies.........97
Trivial File Transfer Protocol (TFTP), for
autoinstallation.........................................................83
troubleshooting
automating with event policies.............................94
operation scripts...................................................92
See also diagnosis; operation scripts
packet capture for analysis.................................253
See also diagnosis; packet capture
root password recovery........................................21
SNMP health monitor............................................49
troubleshooting a Services Router, hardware
components
chassis alarm conditions.....................................171
TTL (time to live)
default, in multicast path-tracking queries..........241
in ping requests..................................................218
increments, in traceroute packets.......................223
threshold, in multicast trace results....................243
total, in multicast trace results............................243
TTY, displaying..........................................................108
U
UDP RPM probes
CoS classification, destination interface
requirement....................................................279
CoS classification, use with caution.....................280
description..........................................................269
server port..........................................................276
setting.................................................................279
verifying servers.................................................288
umd0...........................................................................30
unauthorized login class permissions.............................5
universal serial bus See USB
Index
upgrades
downloading.......................................................181
installing (CLI).....................................................184
installing by uploading........................................183
installing from remote server..............................182
overview.............................................................179
requirements..............................................179, 181
Upload package page.................................................183
field summary....................................................183
URLs
Juniper Networks enterprise MIBs.........................48
release notes.........................................................xv
software downloads............................................181
standard MIBs.......................................................48
USB (universal serial bus)
configuring..........................................................189
configuring for failure snapshot storage..............190
USB modem connections
adding an interface...............................................33
CHAP on dialer interfaces (configuration
editor)...............................................................37
configuring dial-up modem at user end................39
configuring router end..........................................33
connecting dial-up modem at user end.................40
connecting router end...........................................33
connecting to user end.........................................39
dial-in (configuration editor)..................................36
dialer interface See dialer interface, USB modem
interface naming conventions...............................30
overview...............................................................32
requirements........................................................33
USB modem interface types..................................30
verifying dialer interfaces......................................44
verifying USB modem interfaces...........................43
USB modem interfaces
CHAP on dialer interfaces (configuration
editor)...............................................................37
dial-in (configuration editor)..................................36
dialer interface See dialer interface, USB modem
interface types......................................................30
verifying USB modem interfaces...........................43
USB modems
administering........................................................40
AT commands......................................................31
AT commands, modifying.....................................41
configuration overview.........................................32
connecting at router end.......................................33
connecting at user end..........................................39
default modem initialization commands...............31
default modem initialization commands,
modifying..........................................................41
initialization by router...........................................31
MultiModem.........................................................29
overview...............................................................30
See also dialer interface, for USB modem; USB
modem connections
recommended modem.........................................29
resetting................................................................42
verifying...............................................................42
user accounts
authentication order (configuration editor)...........15
contents..................................................................4
creating (configuration editor)...............................18
for local users.......................................................20
for remote users...................................................19
predefined login classes..........................................5
templates for....................................................7, 18
See also template accounts
user logging facility....................................................158
username
description..............................................................4
displaying...........................................................108
specifying (Quick Configuration)...........................11
users
access privileges...............................................5, 16
accounts See user accounts
adding (Quick Configuration)................................11
displaying...........................................................108
login classes......................................................5, 16
predefined login classes..........................................5
template accounts See template accounts
usernames..............................................................4
Users Quick Configuration page...................................10
utilities, for compact flash recovery...........................192
V
vendor ID, DLSw........................................................121
verification
alarm configurations...........................................175
autoinstallation.....................................................86
captured packets.................................................264
destination path (J-Web).....................................223
DHCP binding database........................................76
DHCP server configuration....................................75
DHCP server operation.........................................77
DHCP statistics.....................................................79
dialer interfaces....................................................44
firewall filter for packet capture..........................264
host reachability (CLI).........................................230
host reachability (J-Web).....................................216
LSPs (J-Web).......................................................219
packet capture....................................................263
RPM configuration..............................................286
RPM probe servers..............................................288
RPM statistics.....................................................286
SNMP....................................................................58
SNMP health monitor............................................59
traceroute command..........................................237
traceroute monitor command.............................237
tracing multicast paths........................................241
USB modem interfaces.........................................43
Index
■
309
J-series™ Services Router Administration Guide
version
hardware, displaying...........................................112
PPPoE, information about...................................150
software, displaying............................................107
View Events page.......................................................162
field summary (filtering log messages)................162
field summary (viewing log messages)................164
views, SNMP................................................................58
VoIP (voice over IP), monitoring................................151
VPNs (virtual private networks), DHCP support on
interfaces.................................................................66
W
warning logging severity............................................158
WinZip utility, for compact flash recovery..................192
world-readable statement..........................................161
X
XML See commit scripts; operation scripts
XSLT See commit scripts; operation scripts
Y
yellow alarms See minor alarms
310
■
Index