1
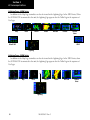
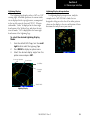
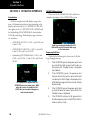
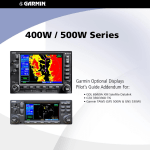
400W / 500W Series
Display Interfaces
Pilot’s Guide Addendum
• L-3 STORMSCOPE® WX-500 Weather Mapping
Sensor
• L-3 SKYWATCH® Traffic Advisory System
(Model SKY497)
• L-3 SKYWATCH® HP Traffic Advisory System
(Model SKY899)
• Bendix/King® KTA870 TAS/KMH880
Multi-Hazard Awareness System
• Ryan TCAD 9900B and 9900BX
This Pilot’s Guide Addendum is written for:
• Garmin GPS 400W, GNC 420W/420AW, and GNS 430W/430AW Main System Software Versions 2.00, 3.00, and
later
• Garmin GPS 500W & GNS 530W/530AW Main System Software Versions 2.00, 3.00, and later
Some differences in operation may be observed when comparing the information in this manual to earlier or later software versions.
© 2008 Garmin Ltd. or its subsidiaries. All Rights Reserved.
Garmin International, Inc., 1200 East 151st Street, Olathe, KS 66062, U.S.A.
Tel. 913/397.8200 or 800/800.1020 Fax 913/397.8282
Garmin AT, Inc., 2345 Turner Rd., S.E., Salem, Oregon 97302, U.S.A.
Tel: 503/581.8101
Fax: 503/364.2138
Garmin (Europe) Ltd., Liberty House, Bulls Copse Road, Hounsdown Business Park, Southhampton, SO40 9RB, U.K.
Tel. +44 (0) 870 850 1243 Fax +44 (0) 238 052 4004
Garmin Corporation, No. 68, Jangshu 2nd Road, Shijr, Taipei County, Taiwan
Tel. 886/2.2642.9199
Fax 886/2.2642.9099
Except as expressly provided herein, no part of this addendum may be reproduced, copied, transmitted, disseminated,
downloaded or stored in any storage medium, for any purpose without the express prior written consent of Garmin. Garmin
hereby grants permission to download a single copy of this manual and of any revision to this manual onto a hard drive
or other electronic storage medium to be viewed and to print one copy of this manual or of any revision hereto, provided
that such electronic or printed copy of this manual or revision must contain the complete text of this copyright notice and
provided further that any unauthorized commercial distribution of this manual or any revision hereto is strictly prohibited.
Information in this document is subject to change without notice. Garmin reserves the right to change or improve its
products and to make changes in the content without obligation to notify any person or organization of such changes or
improvements.
March 2008
Part Number 190-00356-31 Rev. C Garmin® is a registered trademark of Garmin Ltd. or its subsidiaries and may not
be used without the express permission of Garmin Ltd. or its subsidiaries. STORMSCOPE® and SKYWATCH® are registered trademarks of L-3 Avionics Systems, Inc.
Bendix/King® is a registered trademark of Honeywell International, Inc.
Printed in U.S.A.
Foreward
Warnings and Cautions
CAUTION: The Global Positioning System is operated by the United States government, which is solely responsible for its
accuracy and maintenance. The system is subject to changes that could affect the accuracy and performance of all GPS equipment. Although the Garmin 400W/500W Series units are precision electronic NAVigation AIDs (NAVAIDs), any NAVAID can be
misused or misinterpreted and therefore become unsafe.
CAUTION: Use the 400W/500W Series units at your own risk. To reduce the risk of unsafe operation, carefully review and
understand all aspects of the Owner’s Manual and the Flight Manual Supplement, and thoroughly practice basic operation
prior to actual use. When in actual use, carefully compare indications from the unit with all available navigation sources,
including the information from other NAVAIDs, visual sightings, charts, etc. For safety, always resolve any discrepancies before
continuing navigation.
CAUTION: Use the Garmin 400W/500W Series units and the Traffic/Weather Interface at your own risk. To reduce the risk of
unsafe operation, thoroughly practice basic operation prior to actual use. When in actual use, carefully compare indications
from the Garmin 400W/500W Series Unit with all available navigation sources, including the information from other NAVAIDs,
visual sightings, charts, etc. For safety, always resolve any discrepancies before continuing navigation. The altitude calculated
by the Garmin 400W/500W Series Unit is the geometric height above mean sea level and could vary significantly from the
altitude displayed by pressure altimeters in the aircraft.
CAUTION: The Jeppesen database incorporated in the Garmin 400W/500W Series units must be updated regularly in order to
ensure that its information is current. Updates are released every 28 days. A database information packet is included in your
Garmin 400W/500W Series unit package. Pilots using an out-of-date database do so entirely at their own risk.
CAUTION: The Traffic and Weather information contained in this Pilot’s Guide Addendum is not intended to replace the documentation that is supplied with the applicable Garmin 400W/500W Series unit. The user of the Traffic and Weather Interface
should know how to operate the 400W/500W series unit and be knowledgeable about the information in the 400W/500W
Pilot’s Guides.
NOTE: This Pilot’s Guide Addendum is not intended to replace the documentation that is supplied with the Garmin
400W/500W Series unit and the applicable weather/traffic system.
190-00356-31 Rev. C
1
Forward
Table of Contents
Table of Contents
SECTION 1: INTRODUCTION............................................3
SECTION 2: L-3 STORMSCOPE INTERFACE.....................4
L-3 STORMSCOPE Description......................................... 4
Power-Up Self-Test ......................................................... 4
User-Initiated Test........................................................... 4
Displaying Storm Data on the Map Page.......................... 5
Clearing the Map Page.................................................... 7
Lightning Page—400W Series......................................... 8
Lightning Page—500W Series......................................... 8
Lightning Display............................................................ 9
Lightning Display Interpretation....................................... 9
SECTION 3: SKYWATCH INTERFACE..............................10
Introduction.................................................................. 10
SKYWATCH Description................................................. 10
Power-up Self-Test......................................................... 10
User-initiated Test.......................................................... 11
Voice Announcements................................................... 11
Switching Between Standby and Operating Modes......... 11
Altitude Display Mode................................................... 12
Traffic Page................................................................... 12
Traffic Warning Window................................................. 12
Traffic Page Display Range............................................. 13
Configuring Traffic Data on the Map Page...................... 13
Highlighting Traffic Data Using Map Panning................. 14
Monitoring Traffic.......................................................... 14
Failure Response........................................................... 15
Description of Traffic Advisory Criteria............................ 15
SECTION 4: RYAN TCAD INTERFACE.............................16
Ryan TCAD Description.................................................. 16
Operator Controls and Basic Displays............................. 16
Configuring TCAD Data on the Map Page...................... 17
Monitoring Traffic.......................................................... 18
Highlighting Traffic Data Using Map Panning................. 18
TCAD Setup Page.......................................................... 18
Traffic Page Fields.......................................................... 19
Air Shield...................................................................... 19
Traffic Warning Window................................................. 20
Threat Acquisition......................................................... 20
Audible and Visible Alerts.............................................. 20
Fault Displays................................................................ 20
L-3 STORMSCOPE®
WX-500 Weather Mapping Sensor
L-3 SKYWATCH®
Traffic Advisory System (Model SKY497)
HP Traffic Advisory System (Model SKY899)
Bendix/King
KTA870 TAS/KMH880 Multi-Hazard Awareness System
RYAN TCAD
Model 9900B
Model 9900BX)
Limitations.........................................................20
2
190-00356-31 Rev. C
Section 1
Introduction
SECTION 1: INTRODUCTION
The Garmin 400W/500W Series units provide the display interface and control for the following traffic and
weather devices/systems:
• L-3 STORMSCOPE® WX-500 Weather Mapping Sensor
• L-3 SKYWATCH® Traffic Advisory System (Model SKY497)
• L-3 SKYWATCH® HP Traffic Advisory System (Model SKY899)
• Bendix/King® KTA870 TAS/KMH880 Multi-Hazard Awareness System
• Ryan TCAD 9900B and 9900BX
The interface capability allows traffic and weather data to be shown on the 400W/500W series color display,
which gives you the ability to quickly identify traffic and weather hazards relative to your aircraft.
190-00356-31 Rev. C
3
Section 2
L-3 Stormscope Interface
SECTION 2: L-3 STORMSCOPE INTERFACE
L-3 STORMSCOPE Description
NOTE: Refer to the WX-500 Pilot’s Guide for a detailed
description of the WX-500 STORMSCOPE.
The L-3 STORMSCOPE WX-500 Weather Mapping Sensor is a passive weather avoidance system
that detects electrical discharges associated with
thunderstorms within a 200-NM radius of the aircraft.
The STORMSCOPE measures relative bearing and
distance of thunderstorm-related electrical activity and
reports the information to the display. Interfaces are
currently only available for the WX-500 STORMSCOPE System.
User-Initiated Test
In addition to the power-up test, the WX-500 performs a continuous self-test. This continuous self-test
is performed several times per minute. A user-initiated
test can also be performed. The WX-500 Pilot’s Guide
lists all of the possible faults, probable causes, and
recommended actions if system failures are noted.
In addition to the power-up test, the user can
perform a self-test that is executed through
the 400W/500W Series unit display.
To perform a user-initiated test:
The 400W/500W Series units perform a selftest during power-up to ensure proper operation of the applicable interface components.
1.
From the default Nav Page, turn the small
right knob to select the Lightning (LTNG)
Page.
2.
Press MENU to display the Page Menu.
3.
Turn the small right knob to select “SelfTest?” and press ENT.
Power-Up Self-Test
The power-up self-test ensures that the WX-500
functions are operating properly. An error message
is displayed on the Message Page if data is no longer
being received.
4
190-00356-31 Rev. C
Section 2
L-3 Stormscope Interface
Displaying Storm Data on the Map Page
The Map Page displays cell or strike information
using yellow lightning strike symbology overlaid
on a moving map. This added capability improves
situational awareness, which in turn makes it much
easier for the pilot to relate storm activity to airports,
navaids, obstacles and other ground references.
NOTE: Storm data is displayed on the Map Page only if
aircraft heading is available.
In normal operation, the current mode and rate
are displayed in the top right corner of the Map Page
and the bottom right corner of the Lightning Page.
The mode is described by the word “STRIKE” when in
strike mode, or “CELL” when in cell mode.
NOTE: Cell mode uses a clustering program to identify clusters of electrical activity that indicate cells.
Cell mode is most useful during periods of heavy
storm activity. Displaying cell data during these periods frees the user from sifting through a screen full
of discharge points and helps to better determine
where the storm cells are located.
Cell Mode
Storm Activity
Strike Rate
Storm Data Displayed on the Map Page
190-00356-31 Rev. C
5
Section 2
L-3 Stormscope Interface
The strike data display phases are:
Return to the Map Page by pressing CLR.
6.
1.
Lightning Symbol (latest strikes; less than one
minute; a black guard band is placed around
the strike symbol during the first six seconds
of display).
2.
Large Plus “+” sign (more than one minute
old).
3.
Small Plus “+” sign (more than two minutes
old).
4.
Strike Data is no longer displayed (after three
minutes).
To configure storm data on the Map Page:
6
1.
From the default Nav Page, turn the small
right knob to select the Map Page.
2.
Press MENU to display the Page Menu.
3.
Turn the small right knob to select ‘Setup
Map?’ and press ENT.
4.
The flashing cursor highlights the GROUP field.
Turn the small right knob to display the Map
Setup Options Menu. Turn the small right
knob to select “Weather” and press ENT.
5.
The flashing cursor highlights “Weather” in
the GROUP field. Turn the large right knob to
select the desired lighting mode field. Turn the
small right knob to select the desired mode
and press ENT. Repeat for the remaining fields
and options.
190-00356-31 Rev. C
NOTE: Only the data that is viewable on the screen is
included in the strike rate. Therefore, you can zoom in
and see what the strike rate is locally, or you can zoom
out for a bigger picture.
Also, when panning with the cursor on the Map Page,
you can zoom in and isolate individual cells. Please
note, however, that strike data is not typically updated
on the Map Page while the panning cursor is on.
Therefore, when the panned map is first displayed, the
data is only a “snapshot” of conditions (as mentioned
above, the strike rate will reflect viewable data only).
Section 2
L-3 Stormscope Interface
Clearing the Map Page
Routinely clearing the Map Page of all discharge
points is a good way to determine if a storm is building or dissipating. In a building storm discharge points
reappear faster and in larger numbers. In a dissipating
storm discharge points appear slower and in smaller
numbers.
Changing the storm data display range on
the Map Page.
To select a storm data display range:
1.
From the default Nav Page, turn the small
right knob to select the Map Page. Press
MENU to display the Page Menu.
2.
Turn the small right knob to select “Setup
Map?” and press ENT. Turn the small right
knob to select the Weather Group and press
ENT. Turn the large right knob to select the
desired lightning symbol option. Turn the small
right knob to select the desired range and
press ENT.
Clearing discharge points from the Map Page.
To clear the Map Page of all discharge
points:
1.
From the default Nav Page, turn the small
right knob to select the Map Page.
2.
Press MENU to display the Page Menu. Turn
the small right knob to select “Clear Storm
Data?” and press ENT.
Changing the Storm Data Display Range
Storm data can be displayed on the 2000 NM
zoom scale, but the data only goes out as far as the
STORMSCOPE can report (200 nm). The 500 NM
zoom scale will display all lightning data. Scales
greater than 500 NM do not display any additional
STORMSCOPE data.
190-00356-31 Rev. C
7
Section 2
L-3 Stormscope Interface
Lightning Page—400W Series
In addition to the Map Page, storm data can also be viewed on the Lightning Page. In the 400W Series, When
the STORMSCOPE is connected to the unit, the Lightning Page appears after the Traffic Page in the sequence of
Nav Pages.
Traffic
Map
XM Wx
Terrain
NAVCOM
Position
Default NAV
Satellite
Status
VNAV
Lightning
Lightning Page—500W Series
In addition to the Map Page, storm data can also be viewed on the Lightning Page. In the 500W Series, when
the STORMSCOPE is connected to the unit, the Lightning Page appears after the Traffic Page in the sequence of
Nav Pages.
Default Nav
Map
Traffic
XM Wx
Lightning
8
190-00356-31 Rev. C
Terrain
Navcom
Satellite
Status
Section 2
L-3 Stormscope Interface
Lightning Display
Lightning Display Interpretation
The Lightning Page displays either a 360° or a 120°
viewing angle. In normal operation, the current strike
rate is displayed in the top right corner, accompanied
in the top left corner by the word “LTNG”. When in
strike mode, “Strike” is displayed in the lower right
hand corner of the Weather Page and when the unit
is in cell mode, “Cell” is displayed in the lower right
hand corner of the Lightning Page.
For lightning display interpretation, study the
examples in the WX-500 Pilot's Guide that are
designed to help you relate the cell or strike patterns
shown on the display to the size and location of thunderstorms that may be near your aircraft.
To select the desired Lightning Display
Mode:
1.
From the default NAV Page, turn the small
right knob to select the Lightning Page.
2.
Press MENU to display an options menu.
3.
Select the desired display angle from the
options menu and press ENT.
Stormscope Operation
Storm Activity
Strike Rate
Orientation
Method
Weather Mode
Lightning Display
190-00356-31 Rev. C
9
Section 3
Skywatch Interface
SECTION 3: SKYWATCH INTERFACE
SKYWATCH Description
Please refer to the SKYWATCH Pilot’s Guide for a
complete description of the SKYWATCH system.
Introduction
With the exception of traffic display range selections, all information in this section pertaining to the
display and control of the L-3 SKYWATCH (SKY 497)
also applies to the L-3 SKYWATCH HP (SKY 899) and
the Bendix/King KTA 870/KMH 880—this includes
TCAS-like symbology. Traffic display range selections
are as follows:
• SKYWATCH (SKY 497)—2 NM, 2 and 6 NM, and
6 and 12 NM.
• SKYWATCH HP (SKY 899)—2 NM, 2 and 6 NM,
6 and 12 NM, and 12 and 24 NM. • Bendix/King KTA 870/KMH 880—2 NM, 2 and
6 NM, 6 and 12 NM, 12 and 24 NM, and 20 and
40 NM.
The Standby Screen appears when the
SKYWATCH passes the power-up test. NOTE:
when the system is in standby, the SKYWATCH does not transmit, interrogate, or
track intruders aircraft.
10
Traffic Page showing Bendix/King KTA 870/
KMH traffic near the 40 nautical mile range,
at 10 o’clock above.
Power-up Self-Test
Check for the following test criteria on the Traffic
Page during power-up:
1. If the SKYWATCH passes the power-up test and
your aircraft has both a squat switch and is on
the ground, the Standby Screen is displayed
(see sidebar).
2. If the SKYWATCH passes the power-up test
and your aircraft has both a squat switch and
is airborne, the Traffic Page is displayed on the
6-NM display range and in the normal altitude
display mode.
3. If the SKYWATCH passes the power-up test and
your aircraft does not have a squat switch, the
Standby Screen is displayed.
4. If the SKYWATCH continues to fail, please refer to
the failure response section in the SKYWATCH Pilot’s
Guide on actions to take.
190-00356-31 Rev. C
Section 3
Skywatch Interface
To begin tracking intruder aircraft
Voice Announcements
1.
Turn the cursor on and highlight STBY.
2.
Turn the small right knob to select OPER.
3.
Press ENT to confirm operating mode and
begin tracking intruder aircraft.
Switching Between Standby and Operating Modes
The unit must be in operating mode for traffic
to be displayed. The ability to switch out of standby
into operating mode on the ground is especially useful
for scanning the airspace around the airport before
takeoff.
To switch into Operating Mode from
Standby Mode:
Operating Mode is confirmed by the display
of “OPER” in the upper right-hand corner of
the Traffic Page.
See the SKYWATCH Pilot’s Guide for information
on voice announcements.
NOTE: The FAILED message occurs when the system
detects an error and prohibits further traffic display
operation as long as this message stays on the screen.
1.
Press the cursor knob and highlight
“STBY”. Turn the small right knob to select
“OPER?”.
2.
Press ENT to confirm and place the SKYWATCH
in operating mode.
User-initiated Test
NOTE: A user-initiated test can only be performed
when in standby or failed mode.
In addition to the power-up test, the SKYWATCH
performs a continuous self-test. This continuous selftest is performed several times per minute. A userinitiated test of the SKYWATCH interface can also be
performed.
To perform a user-initiated test:
1.
Turn the small right knob to select the Traffic
Page.
2.
From the Traffic Page, press MENU to display
the Page Menu.
3.
Turn the small right knob to select “Self
Test?” and press ENT.
NOTE: The SKYWATCH switches out of standby into the
6-NM display range. If your aircraft has a squat switch
and you do not manually switch out of standby, the
SKYWATCH will automatically switch out of standby 8
to 10 seconds after takeoff.
To switch into Standby Mode from the Traffic Page:
1.
Turn the cursor on and highlight “OPER”.
2.
Turn the small right knob to select
“STBY?”.
3.
Press ENT to confirm and place the SKYWATCH
in standby mode.
190-00356-31 Rev. C
NOTE: If your aircraft has a squat switch, STBY is
not displayed while you are airborne but will go into
standby 24 seconds after landing. This delay allows the
SKYWATCH to remain in the operating mode during a
touch-and-go maneuver.
11
Section 3
Skywatch Interface
Altitude Display Mode
Traffic Page
Traffic can be displayed both on the Map Page
(only if heading is available) and on the Traffic Page.
Traffic
Altitude Display Mode
The name of the selected altitude display
mode (ABV: look up, NRM: normal, BLW: look
down, or UNR: unrestricted) is displayed
in the upper left-hand corner of the Traffic
Screen. The SKY 497 continues to track up
to 30 intruder aircraft within its maximum
surveillance range, regardless of the altitude
display mode selected.
To change the Altitude Display Mode:
1.
From the Traffic Page, turn the cursor on,
highlight the current mode and turn the small
right knob to cycle through the options.
2.
With each turn of the knob, the screen changes
to display the traffic detected within the selected
altitude display range. The 400W/500W Series
screen also displays unrestricted traffic (UNR)
having a range of maximum specified by the
SKYWATCH Pilot’s Guide. Please refer to the
SKYWATCH Pilot’s Guide for information
regarding altitude display ranges.
3.
Note that confirmation is not required. The
mode is changed immediately when using the
small right knob. Turn the cursor off when
selection is made.
12
Operating Mode
Display Range
Traffic Advisory
(with no bearing information)
Traffic Page
Traffic Warning Window
When the unit is not on the traffic page and a traffic threat is imminent, the Traffic Warning Window is
displayed. The Warning Window shows a small map
and can display the Traffic Page (if the user presses
ENT) or return to the previous page (if the user presses
CLR).
Traffic Warning Window
190-00356-31 Rev. C
NOTE: The Traffic Warning Window is disabled when
the aircraft ground speed is less than 30 knots or when
an approach is active.
Section 3
Skywatch Interface
NOTE: SKYWATCH data is only displayed on the Map
Page if suitable aircraft heading data is available. See the
Garmin 400W or 500W Series Installation Manuals available at your authorized Garmin service center for details.
To configure traffic on the Map Page:
1.
Turn the small right knob to select the Map
Page.
2.
You can change the display range on the Traffic
Page at any time.
1. Press the RNG Key to cycle through the following range options:
Press MENU to display the Page Menu. Turn
the small right knob to select “Setup Map?”
and press ENT.
3.
• SKYWATCH (SKY 497)—2 NM, 2 and 6 NM, and
6 and 12 NM.
The flashing cursor highlights the GROUP field.
Turn the small right knob to select Traffic and
press ENT.
4.
Turn the large right knob to select the desired
Traffic Mode option. Turn the small right knob
to select the desired option and press ENT.
Repeat the step for Traffic Symbol and Traffic
Label.
5.
Return to the Map Page by pressing CLR.
Traffic Page Display Range
• SKYWATCH HP (SKY 899)—2 NM, 2 and 6 NM,
6 and 12 NM, and 12 and 24 NM. • Bendix/King KTA 870/KMH 880—2 NM, 2 and
6 NM, 6 and 12 NM, 12 and 24 NM, and 20 and
40 NM.
Configuring Traffic Data on the Map Page
The display of traffic information is designed to
closely resemble the display symbology used by L-3
on the SKYWATCH. Traffic is only displayed on
the Map Page if aircraft heading data is available.
When heading is not available, Traffic Advisories
are displayed as non-bearing banners on the Map
Page.
Traffic mode allows the operator to choose which
traffic is displayed (all traffic, traffic and proximity advisories, or traffic advisories only). The traffic symbol is the
symbol used to depict the type of traffic (400W/500W
Series and L-3 use the same symbology):
• Traffic Advisories (TA)—Yellow
• Proximity Advisories (PA)—White
• Other—White
Selections for configuring traffic data are
made from the Map Setup Menu on the Map
Page.
NOTE: Proximity Advisories (PA) are displayed as
solid white diamonds. SKYWATCH shows these PAs
as hollow diamonds since the SKYWATCH display is
monochrome. PAs are defined as traffic within the
4.0-NM range, with ± 1200 feet of altitude separation,
and not a traffic advisory (TA).
The traffic label is the altitude separation above or
below the symbol and the vertical speed sense arrow
to the right of the symbol. From the Map Page, you
can display traffic in a thumbnail format in any of
190-00356-31 Rev. C
13
Section 3
Skywatch Interface
the top three data fields (top four fields on the 500W
Series) on the right side of the Map Page.
When a Traffic Advisory is active, the “Traffic”
banner is displayed in the lower right corner
of the Map Page.
To display Thumbnail Traffic on the Map Page
When the target pointer is placed on traffic,
the traffic range and altitude separation are
displayed.
To select the panning function and pan the
map display:
1.
Turn the small right knob to select the Map
Page.
1.
2.
Press MENU to display the Page Menu.
Press the small right knob to activate the
panning target pointer.
3.
Turn the small right knob to select ‘Change
Fields?’ and press ENT.
2.
Turn the small right knob clockwise to
move up, or turn it counterclockwise to move
down.
4.
Select one of the top three fields (top four
fields on the 500W Series). Select TRFC from
the Select Field Type List and press ENT. Note
that the thumbnail range defaults to 6 NM and
cannot be changed.
3.
Turn the large right knob clockwise to move
right, or turn it counterclockwise to move left.
4.
To cancel the panning function and return to
your present position, press the small right
knob.
Highlighting Traffic Data Using Map Panning
Another map page function is panning, which
allows you to move the map beyond its current limits
without adjusting the map scale. When you select
the panning function—by pressing the small right
knob—a target pointer flashes on the map display. A
window also appears at the top of the map display
showing the latitude/longitude position of the pointer,
plus the bearing and distance to the pointer from your
present position.
14
When the target pointer is placed on traffic, the
traffic range and altitude separation are displayed. The
traffic is identified as:
TA: Traffic Advisory, PA: Proximity Advisory,
TRFC: Other Traffic
Monitoring Traffic
See the information in the SKYWATCH Pilot’s
Guide regarding monitoring traffic on the display and
the corresponding actions to take.
190-00356-31 Rev. C
Section 3
Skywatch Interface
Failure Response
Errors indicated by a “FAILED” message on the
screen prevent continued use of the SKYWATCH.
Please see the L-3 SKYWATCH Pilot’s Guide for
detailed information on Failure Response.
Description of Traffic Advisory Criteria
For a description of Traffic Advisory criteria and
display interpretation, please see the SKYWATCH
Pilot’s Guide.
The SKYWATCH Pilot’s Guide contains
detailed information on traffic advisory and
display interpretation.
190-00356-31 Rev. C
15
Section 4
Ryan TCAD Interface
SECTION 4: RYAN TCAD INTERFACE
All information in this section pertaining to the display and control of the Ryan 9900B TCAD also applies
to the Ryan 9900BX TCAD except for the following:
• TCAS-like symbols are used in the 9900BX.
TCAD symbols are used with the 9900B (see the
table on page 17).
• Altitude modes are available (normal, look up,
look down, unrestricted).
• Ranges are manually controlled instead of being
automatically re-sized to the current shield.
• Traffic display range selections are different:
- Ryan 9900B—range is slaved to current shield
size.
- Ryan 9900BX—1 NM, 1 and 2 NM, 2 and
6 NM, 6 and 12 NM, and 12 and 24 NM.
Ryan TCAD Description
NOTE: Refer to the Ryan TCAD Pilot’s Guide for a
detailed description of the Ryan TCAD System.
The Ryan TCAD (Traffic and Collision Alert
Device) is an on-board air traffic display used to
identify potential collision threats. TCAD computes
relative altitude and range of threats from nearby
Mode C and Mode S-equipped aircraft. TCAD will not
detect aircraft without operating transponders or those
that are beyond radar coverage. TCAD, within defined
limits, creates a “shield” of airspace around the aircraft
that detected traffic cannot penetrate without triggering an alert.
Operator Controls and Basic Displays
If there is no communication between the
400W/500W Series unit display and the TCAD unit, a
message will appear, notifying the user. After initialization, proceed with operation of the 400W/500W
Series unit in a normal manner. TCAD data can be
shown in a “thumbnail” view on the Map Page.
The Map Page can display TCAD traffic in any
of the top three fields (or top four fields on a
500W Series unit) located on the right-hand
side of the display.
See the Ryan TCAD Pilot’s Handbook for a
description of the traffic symbols.
TCAD data also displays on the Traffic Page and
Map Pages, if heading data is available. The symbols
for closing and opening traffic shown on both the Map
Page and the Traffic Page are identical to those shown
on the Ryan TCAD:
16
190-00356-31 Rev. C
Section 4
Ryan TCAD Interface
9900B (TCAD) Symbols
TRFC (White)—Altitude separation >500 feet, steady altitude
separation
TA (Yellow)—Altitude separation £500 feet, steady altitude
separation
TRFC (White)—Altitude separation >500 feet, closing
PA (White)—Altitude separation £500 feet, opening
TRFC (White)—Altitude separation >500 feet, opening
TA (Yellow)—Altitude separation £500 feet, closing
Configuring TCAD Data on the Map Page
The display of traffic information closely resembles
the display symbology used by the Ryan TCAD. Traffic data is only displayed on the Map Page if heading data is available.
You can configure TCAD data on the Map
Page using the Map Setup Menu.
To configure Traffic on the Map Page:
9900BX (TCAS) Symbols
Traffic Advisory
Proximity Advisory
1.
Turn the small right knob to select the Map
Page.
2.
Press MENU to display the Page Menu.
3.
Use the small right knob to select “Setup
Map?” and press ENT.
4.
The flashing cursor highlights the GROUP field.
Turn the small right knob to display the Map
Setup Options Menu. Turn the small right
knob to select Traffic and press ENT.
5.
Turn the large right knob to select the desired
Traffic Mode option. Turn the small right knob
to select the desired option and press. Repeat
the step for Traffic Symbol and Traffic Label.
6.
Return to the Map Page by pressing CLR.
Other Traffic
Out-of-Range Traffic Advisory
The Map Page has the ability to display traffic in
a thumbnail format in any of the top three fields (top
four fields on a 500W Series unit) on the right-hand
190-00356-31 Rev. C
17
Section 4
Ryan TCAD Interface
side of the Map Page.
To display Thumbnail Traffic on the Map
Page:
1. Turn the small right knob to select the Map
Page.
2. Press MENU to display the Page Menu.
3. Use the small right knob to select “Change
Fields?” and press ENT.
4.
Select one of the top three fields (top four
fields on a 500W Series unit). Select TRFC
from the Select Field Type List and press ENT.
Note that the thumbnail range defaults to 6
NM and cannot be changed for TCAD 9900BX
and slaves to the current shield size for TCAD
9900B.
Monitoring Traffic
Refer to the information in the TCAD Pilot’s Guide
regarding monitoring traffic on the display and the
corresponding actions to take.
Highlighting Traffic Data Using Map Panning
Panning is another map page function, which
allows you to move the map beyond its current limits
without adjusting the map scale. When you select
the panning function—by pressing the small right
knob—a target pointer flashes on the map display. A
window also appears at the top of the map display
showing the latitude/longitude position of the pointer,
plus the bearing and distance to the pointer from your
present position.
When the target pointer is placed on traffic,
the traffic range, squawk code (if available),
and tail number (if available) are displayed.
To use the map panning feature:
1. Press the small right knob to activate the
panning target pointer.
2. Turn the small right knob to move up (turn
clockwise), or down (turn counterclockwise).
3. Turn the large right knob to move right (turn
clockwise), or left (turn counterclockwise).
4. To cancel map panning and return to your present position, press the small right knob.
When the target pointer is placed on traffic, the
traffic range, altitude separation, squawk code (if available), and tail number (if available) are displayed. The
traffic is identified as follows:
TA: Traffic Advisory. This is traffic with 500 feet, or
less, of altitude separation that is converging or
maintaining altitude separation.
PA: Proximity Advisory. This is traffic with 500 feet
of altitude separation that is not a TA.
TRFC: Other traffic.
TCAD Setup Page
The Ryan TCAD Setup Page is accessed from the
Traffic Page. The TCAD Setup Page allows you to
configure traffic data. The definitions of the available
options are listed in the TCAD Pilot’s Handbook.
18
190-00356-31 Rev. C
Section 4
Ryan TCAD Interface
TCAD 9900B Operating Modes:
GND: ground mode
TML: terminal mode
STD: standard mode
ENR: en route mode
UNR: unrestricted mode
The modes APR (approach) and DEP (departure), are displayed when in that mode, but
are not manually selectable.
Ryan TCAD Setup Page (9900B only)
To change a TCAD setup option:
1.
Turn the small right knob to select the Traffic
Page. Press MENU to display the Page Menu.
Turn the small right knob to select “Setup?”
and press ENT.
2.
The flashing cursor highlights the Mode field.
Turn the small right knob to select the mode
and press ENT. The mode selection determines
which shield definition to display and change.
Turn the large right knob to select the desired
remaining options fields. Turn the small right
knob to select the desired option and press
ENT.
3.
Return to the Traffic Page by pressing CLR.
Traffic Page Fields
There are two selectable fields on the Traffic Page:
the Operating Mode Field and the Barometric Pressure Field. The Operating Mode Field selects the
TCAD operating mode. Please refer to the TCAD Pilot’s
Handbook for a complete description of all modes of
operation. For the 9900BX model, this field is replaced
with the SKYWATCH style altitude mode.
To select the Operating Mode:
1. From the Traffic Page, press CRSR to highlight
the operating mode field. Turn the small right
knob to select the desired operating mode and
press ENT.
NOTE: The traffic display range is automatically set to
the shield size and cannot be changed (9900B only).
The second selectable field, located in the upper
right-hand corner of the display, is the Barometric
Pressure field, which displays the Barometric Pressure
in inches of mercury. The Barometric Pressure field
on the Traffic Page allows you to set the barometric
pressure in the Ryan TCAD unit. Please refer to the
TCAD Pilot’s Handbook for a detailed description of
this feature.
The Barometric Pressure field is located in
the upper right-hand corner of the Traffic
Page.
190-00356-31 Rev. C
19
Section 4
Ryan TCAD Interface
To change the Barometric Pressure:
1.
2.
From the Traffic Page, press the cursor to
highlight the Operating Mode field. Turn the
large right knob to select the Barometric
Pressure Field. Use the small right knob to
select the desired value and press ENT. Note:
When editing the value, use the large right
knob to select the digit to edit.
Exit the field by pressing the CRSR button.
When the TCAD 9900BX model is interfaced
there is an additional annunciation in the lower left
hand corner of the Traffic Page. This indicates when
the TCAD unit is in approach mode (APR), or if the
approach is armed (APR ARM).
Air Shield
Please refer to the TCAD Pilot’s Handbook for a
detailed description of the Air Shield.
Threat Acquisition
Please, see the TCAD Pilot’s Handbook.
Audible and Visible Alerts
Voice and tones are used to alert the pilot. The alert
descriptions used by TCAD are listed in the TCAD
Pilot’s Handbook. Voice is used only during the highest level of alerting; otherwise, tone is used. The voice
alerting can be turned on or off either on the TCAD
Setup Page or on the configuration pages. See the
Garmin 400W/500W Series Installation Manual available at your authorized Garmin Service Center (only
for the 9900 model).
Fault Displays
Traffic Warning Window
When the Traffic page is not displayed and a
traffic threat becomes imminent, the Traffic Warning
Window will be displayed. The Warning Window
shows a small map and can display the Traffic Page (if
the user presses ENT) or return to the previous page
(if the user presses CLR).
If the 400W/500W Series unit fails to detect the
Ryan TCAD or if it detects invalid data from the
TCAD, the traffic screen will display the message, “NO
DATA”.
Limitations
Please see the TCAD Pilot’s Handbook for limitations of the TCAD system.
Ryan TCAD Traffic Warning Window
20
NOTE: The Traffic Warning Window is disabled when
the aircraft ground speed is less than 30 knots or when
an approach is active.
190-00356-31 Rev. C
© 2008 Garmin Ltd. or its subsidiaries
Garmin International, Inc.
1200 East 151st Street, Olathe, Kansas 66062, U.S.A.
Garmin AT, Inc.
2345 Turner Rd., S.E., Salem, Oregon 97302, U.S.A.
Garmin (Europe) Ltd.
Liberty House, Bulls Copse Road, Hounsdown Business Park,
Southhampton, SO40 9RB, U.K.
Garmin Corporation
No. 68, Jangshu 2nd Road, Shijr, Taipei County, Taiwan
www.garmin.com
Part Number 190-00356-31 Rev. C