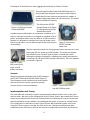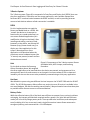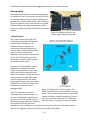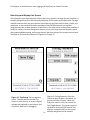
1
Report Number PSC-‐2012-‐002 Final Report November 15, 2012 Contract SF-‐2012-‐1-‐8 At-‐Sea Electronic Data Logging and Data Entry for Salmon Fisheries Prepared by Advanced Research Corp., 541-‐265-‐9690 John Lavrakas, Wil Black, and Alex Lawson With support from Pete Lawson, National Oceanic and Atmospheric Administration Advanced Research Corporation PO Box 930 111 SE Douglas Street, Suite A Newport, OR 97365 Final Report: At-‐Sea Electronic Data Logging and Data Entry for Salmon Fisheries Contract SF-‐2012-‐1-‐8 September 14, 2012 Final Report TASK NAME: At-‐Sea Electronic Data Logging and Data Entry for Salmon Fisheries This final report summarizes the results of the Project. Introduction and Background At-‐sea data collection by commercial salmon trollers has been demonstrated by Project CROOS (Collaborative Research on Oregon Ocean Salmon) to provide a fine-‐scale (space and time) picture of salmon harvest. When combined with technologies such as genetic stock identification (GSI) and satellite remote sensing, there are opportunities for near-‐real-‐time management, weak-‐stock avoidance, improved understanding of migration patterns and ocean ecology, and product tracking and marketing. Facilitating the collection of data directly by fishermen simultaneously reduces costs of data acquisition and provides supplemental income to a struggling economic sector. Collecting this data using electronic devices is particularly desirable for a variety of reasons including the elimination of manual transcription, immediate access via long-‐range communications, and the opportunity to validate data at the point of entry for increased accuracy. In Project CROOS fishermen at sea record the time and location of each fish caught along with data such as species, length, depth of catch, sexual maturity, and external marks. In addition, they collect tissue and scale samples for GSI and aging, and attach a bar-‐code tag to each fish for tracking. Currently, data are collected on paper envelopes and a handheld GPS, then entered in a database when the fisherman returns to port. The Fish Trax™ relational database was developed specifically for Project CROOS. It holds records for each fish sampled, including data for catch location, biology, and genetics, as well as basic information identifying the fishing vessel, captain, and port of landing. It also holds a record of boat locations (track points) recorded at five minute intervals, used for determining areas sampled and calculating total fishing effort and catch per unit effort. Data are entered into the database by a port liaison using a web-‐based interface. The liaison transfers data from the paper envelopes, downloads a file from the GPS, and manually relates waypoints entered by the fisherman to samples. Enabling fishermen to enter data at sea on a system that is automatically recording track points and transmitting data shore-‐side to the Fish Trax™ database would potentially increase project efficiency and data security. The goal of this project was to develop a new hardware and software system to support Project CROOS and the West Coast Salmon GSI (WCS-‐GSI) Collaboration’s ongoing data collection 2 Final Report: At-‐Sea Electronic Data Logging and Data Entry for Salmon Fisheries efforts. Such a system must enable the fisherman to enter data with a minimum of disruption to his normal fishing activities and should be adaptable for other small-‐boat operations typical of many fisheries world-‐wide. At-‐sea electronic data entry should reduce data entry errors, allow real-‐time tracking of fishing activities, and ultimately enable fishermen to receive data summaries and analysis based on current catch while at sea. Project CROOS has been developing systems for at-‐sea data collection in small boats since 2005, has evaluated several prototype systems in the lab and at sea, and conducted workshops and a symposium to investigate implementations of similar systems worldwide. Through our accumulated research and operational experience we have learned first-‐hand the issues associated with fielding equipment for use on small fishing vessels. Furthermore, technologies have matured which make powerful computing capabilities and advanced user interfaces available in small, consumer-‐grade devices. Challenges and Goals The implementation of an at-‐sea electronic data logging and data entry system presents a wide variety of operational challenges. The greatest of these is the operational environment on the back deck of a small boat which introduces direct physical hazards such as impact to or immersion of the device. In addition, the high humidity and salt spray cause rapid degradation and frequent malfunction of electronic components. Devices must also remain operational in a wide range of temperatures. Furthermore, the bright outdoor lighting renders standard backlit LCD screens unreadable due to their low contrast ratio and the high reflectivity of the glossy surfaces. Another challenge is the requirement for a long operating time. Most consumer, as well as many commercial and industrial, devices are designed to be used for short durations and require frequent recharging. Salmon trollers often stay at sea for two to three days at a time, and a fishing day may last 12 hours. Many of these boats have primitive, unreliable or inaccessible electrical systems. Therefore any system for this application must be able to operate with minimal external power supply and only infrequent recharging. A third challenge of the application is the nature of the users. Though many fishermen are well versed in certain electrical and electronic systems relevant to their work, few have experience with modern software paradigms or input methods. Any system deployed must not require extensive training and must be intuitive for nontechnical users to operate. At the same time, it must minimize interference with normal fishing and allow accurate data entry under these conditions. Other goals include a low system cost, ease of deployment across many vessels with varying layouts and electrical systems, and reliable accuracy of entered data. In order to be implemented in the fishery, the system must match or exceed the capabilities of Project CROOS’ current paper envelope data collection system. 3 Final Report: At-‐Sea Electronic Data Logging and Data Entry for Salmon Fisheries Based on previous experience the system should be small and contained in a single device. The screen should be visible in daylight. Battery life should be 12 to 18 hours minimum. The user interface should be intuitive, responsive, and integrated with the fishing operation. Other desirable traits include waterproofness and durability, reliability, and data security. Small (~7” screen) tablets have many of these traits, but lack daylight visibility and battery life. E-‐readers such as the Amazon Kindle and Barnes and Noble Nook have daylight visible screens and longer batter life. However, limited screen responsiveness make them unsuitable as general purpose tablets, so the hardware is accordingly limited. Our initial goal was to test the usefulness of the E Ink screen for data entry. To accomplish this we designed a system combining a Nook for data entry, a smartphone hub to add features (GPS, data storage, Bluetooth linkage to a barcode reader, and processing capabilities beyond the capability of the Nook), and a wireless hotspot to connect the Nook with the hub and the cellular network. We understood that this complex system violated our first principle of single device integration, but we hoped to overcome these problems with our design. The software system we developed was designed to be portable among devices, so we also tested a single device design based on the Google Nexus, a small tablet with more processing power and GPS, but without the daylight readable screen and long battery life. Methods This section describes the methods used to satisfy research objectives. They include the software development approach, the hardware selection method, our testing methodology, and how to train the fishermen. Our research approach involved developing several configurations for a prototype system and then testing these prototypes with fishermen at sea. This approach allowed us to explore the various objectives and risk areas, including visibility, usability, and power demand. The system design (Figure 1) consists of a data entry component (called the Data Entry and Display Unit or DEDU) to receive input from the fisherman, a communications component (called the Hub) to receive and format the data for transmission to shore, and the Fish Trax™ database to provide shoreside storage of the data and visualization features. Software The data collection system was built as two software applications: a server and a client, which communicate using asynchronous HTTP requests via an application program interface (API). We refer to the device running the server application as the Hub and the device running the client application as the DEDU. We modified a copy of the Fish Trax™ web portal to handle communication with the Hub over a web API. 4 Final Report: At-‐Sea Electronic Data Logging and Data Entry for Salmon Fisheries Figure 1. Initial design of a 3-‐device system. The blue box contains the at-‐sea components. The webserver is on shore. The client application is built using HTML5 and JavaScript, and is accessed through a web browser like a standard web page. Its purpose is to display information to and collect information from the fisherman. The client application is compatible with browsers on mobile platforms such as Android or iOS as well as on computers running Windows, Linux, or MacOS. We used the HTML5 Local Storage and Application Cache features to make the application available offline. We were able to leverage several open source JavaScript libraries including jQuery, Underscore, and Backbone to help create the user interface and manage a local database. A native Android launcher application was developed to automate the client application startup process. The launcher can be installed as a standard Android application and allows us access to Android functionality not available through HTML5, such as hardware button binding and network connection management. 5 Final Report: At-‐Sea Electronic Data Logging and Data Entry for Salmon Fisheries The server application is composed of three modules: a web server, a GPS tracking module, and a shore-‐side communication module. The web server module handles all communication between the client application and the server application using a traditional client/host framework over HTTP and a web API. The GPS tracking module records vessel tracks and fish catch locations. The shore-‐side communication module communicates with Fish Trax™ over a web API. An independent copy of the Fish Trax™ web portal was set up to test the remote entry of data from the SeaTab system. This provided access to pre-‐defined queries, map visualization, and a web interface to the database. We made several modifications to the system, including Hub registration and a web API used for Hub communication. Hardware We tested a variety of Android platforms for the project, including smartphones, tablets, and e-‐ readers. The primary devices we settled on were the Barnes and Noble Nook Touch e-‐reader and the Samsung Galaxy Precedent smartphone. Later, we shifted our testing to the Google Nexus 7 tablet. A list of the Android devices tested on the project, along with important features and limitations, is presented in Table 1. Table 1. Summary of devices evaluated as data entry and display units (DEDU) and Hubs, with major features and limitations. Manufacturer Model Device type Application Features Limitations Barnes & Nook Touch e-‐reader DEDU low power Lacks GPS, slow Noble requirement, E screen refresh, Ink screen, Wi-‐Fi, touch variable very low cost screen response Samsung Galaxy smartphone Hub Bluetooth, Wi-‐Fi, Screen visibility, Precedent cellular, low cost, battery life, GPS does not meet Bluetooth HID standard Google (Asus) Nexus 7 tablet DEDU and Wi-‐Fi, low cost, Screen visibility, Hub GPS, responsive battery life touch screen PocketBook Pro e-‐reader DEDU and E Ink, Wi-‐Fi, Slow touch and Hub Bluetooth, GPS screen response Google Nexus HPSA smartphone Hub Bluetooth, Wi-‐Fi, Screen visibility, (Samsung) Cellular, GPS battery life 6 Final Report: At-‐Sea Electronic Data Logging and Data Entry for Salmon Fisheries Nook The Barnes and Noble Nook Simple Touch is an inexpensive (~$100) consumer e-‐reader that comes with Android 2.1. It has an E ink Pearl monochrome e-‐paper screen which features a high contrast ratio, exceptional daylight visibility, and low power consumption. Dimensions are 5” wide x 6.5” high. The device has five hardware buttons, but primarily accepts input through a capacitive touchscreen. It has no auxiliary sensors or GPS and communication is limited to wireless via Wi-‐Fi and wired via USB. Precedent The Samsung Galaxy Precedent is an inexpensive (~$130) smartphone that can be purchased without a cellular service contract. It runs Android 2.2. The device’s screen is a standard full color backlit LCD display. It includes a standard suite of communication and sensor options, including cellular, Wi-‐Fi, GPS, and Bluetooth. Nexus The Google Nexus 7 (Figure 2) is an inexpensive (~$200) but powerful tablet computer that runs Android 4.1. The device’s screen is a standard full color backlit LCD display. Dimensions are 4.7” wide x 7.7” high. Its three hardware buttons control the power and adjust the volume of the device, making it entirely dependent on its touchscreen interface for user input. It does not support cellular communication, but does include Wi-‐Fi, GPS, and Bluetooth capabilities. Figure 2. Google Nexus 7 tablet showing location of the hardware power button. Volume +/-‐ buttons are directly below the power button. All other controls are in software. Barcode Scanner We tested two Bluetooth barcode scanners on this project: a Motorola Symbol CS3070 and a Cipher Lab 1600 Cordless Scanner (Figure 3). Each is battery powered and has an LED scanner. External Power Sources Early on in the research it became clear that the smartphone and tablets would not run the server application for more than a few hours without external power. We explored two kinds of backup power supplies, which could be used either to charge or extend the life of the devices in the SeaTab system. 7 Figure 3. Bluetooth barcode scanners. Final Report: At-‐Sea Electronic Data Logging and Data Entry for Salmon Fisheries The myCharge Portable Power Bank 6000 (Figure 4) is a small power pack designed to provide an extra charge to mobile devices such as phones and electronic readers. It provides and accepts power via USB connectors. This model features a 6000 mAh capacity. The Schumacher XP750C Portable Power unit (Figure Figure 4. myCharge Portable 5) is designed primarily for Power Bank 6000. automotive use and includes jumper cables and an air compressor in addition to its battery, making it fairly bulky. It is charged via standard 120v AC power, and outputs either via a 12v outlet or a USB connection. Because it is designed to provide a short burst of power rather than a long duration, the unit does not specify the mAh capacity Figure 5. Schumacher XP750C Portable of the battery. Power unit. We also explored methods for charging these power sources prior to use, both using 120 VAC power and 12VDC power. The vessels we worked with offered one or the other type of power on board their vessel, although not always continuously. Adapters were readily purchased for converting 120 VAC and 12VDC to power USB devices. Two such adapters are shown in Figure 6. Figure 6. 12 VDC (left) and 120 VAC (right) to USB power converters. Hotspots We purchased and tested two kinds of WiFi hotspots: the 3G MiFi 2200 and the 4G MiFi 4510L (Figure 7). These hotspots create a wireless local area network and use the Verizon cellular network to provide internet service to connected devices. Implementation and Testing Figure 7. Verizon MiFi 4510L and MiFi 2200 hot spots Our initial plan was to develop a system using separate hardware devices to act as the client and the server. We refer to this configuration as the 3 Device System. We created the 3 Device system and conducted tests in the lab, the field, and at sea. Based on the results of these tests and the availability of new hardware, we redesigned the system to operate on a single device. This configuration is referred to as the 1 Device System. We conducted another set of tests using the 1 Device system in the lab, the field, and at sea. Laboratory and field tests were conducted by our technicians, while at-‐sea tests were conducted autonomously by fishermen. 8 Final Report: At-‐Sea Electronic Data Logging and Data Entry for Salmon Fisheries 3-‐Device System The 3-‐Device system (Figure 8) is composed of a Data Entry and Display Unit (DEDU) that runs the client application, a Hub that runs the server application, and a wireless hotspot that facilitates Wi-‐Fi communication between the DEDU and Hub, as well as providing Internet access to both devices when a cellular connection is available. DEDU For this implementation we used the Barnes and Noble Nook as a DEDU. We ‘rooted’ the device to circumvent its functionality as a reader and allow it to run custom Android applications (this modification is legal on the Nook). After installing and testing a variety of web browsers on the device, we selected UC Browser (http://www.ucweb.com/) to display our client application for this system. We assigned our client application to be launched when the prominent center hardware button (the ‘n’ button) was pressed, as well as when the device was started. Hub Figure 8. Components of the 3-‐device system: Barnes and Noble Nook, MiFi Hotspot, and Samsung Precedent. For the Hub we chose the Samsung Galaxy Precedent phone. We assigned the server application to be launched when the device was started, and programmed it to automatically search for and connect to our hotspot’s local area network. Due to observed instability, we also set the server to be periodically restarted using a third party application. Hot Spot We tested this system using two different Verizon hotspots: the 3G MiFi 2200 and the 4G MiFi 4510L. The 3G/4G discrepancy did not affect our project since no 4G service is available in the test area (Newport, OR and surrounding coastal waters). We purchased a low volume data plan to provide cellular internet access to connected devices. Battery Packs While the effective battery life of the Nook was sufficient to operate for an entire trip without recharging, the hotspot and Hub both required auxiliary power. Our initial lab and field tests used a pair of small myCharge power packs. These proved to be insufficient, and subsequent tests (including all of our at-‐sea tests) used a single Schumacher Instant Power automotive emergency battery pack connected via a 12v USB adapter. 9 Final Report: At-‐Sea Electronic Data Logging and Data Entry for Salmon Fisheries Waterproofing We explored several ways to waterproof equipment for operation at sea. One way was to place the DEDU unit inside a plastic enclosure. We purchased plastic pouches from Trendy Digital, Sealine, and Overboard (Figure 9). Another was to treat the units to a special waterproofing nanocoating performed by Liquipel (Santa Ana, California). We had two Nooks treated by Liquipel. 1 Device System Figure 9. Overboard, Sealine, and Trendy Digital waterproof pouches The 1 Device system (see Figure 10) consisted of a single Nexus 7 acting as both the DEDU and the Hub. This allowed the server and client to communicate internally without the need for a Wi-‐Fi network. Because the Nexus 7 does not have cellular capabilities, data transfer from the Hub to Fish Trax™ did not occur until the device was in range of a Wi-‐Fi network to provide Internet access. The Nexus 7 runs Android 4.1, which supports the mobile version of the Google Chrome browser, so we used this to run the client application and display our interface. Though we did not need or choose to significantly adapt the client application for this device, changing the browser improved several aspects of the interface’s usability and provided us increased access to debugging tools. Figure 10. Design of the 1-‐device system. The DEDU and Hub functions are contained in a single The server application remained device. In this implementation there is no wireless unchanged in this implementation, as hotspot or cellular network connectivity, so data internal communication was achieved are not transmitted to the Fish Trax™ data base using the same HTTP and API structure. until the device is in range of a wireless network. The launcher application was configured to start both the server and client applications from a single icon on the device’s desktop. The functions of hardware buttons were left unchanged to preserve the other functionality of the device. 10 Final Report: At-‐Sea Electronic Data Logging and Data Entry for Salmon Fisheries Data Entry and Display Unit Screens The fisherman’s primary experience with our data entry system it through the user interface. A properly designed interface will help speed adoption of this system by the fishermen. Through multiple iterations over the years we have found that the interface must be clear, simple, and responsive. It also needs to follow the workflow of the CROOS protocols in a way that integrates with the on-‐deck operation of the fishery. The most recent version of our interface is based on a series of screens, designed to be easy to use, with large fonts and buttons, sparse and understandable wording, and simple controls. We show some of the screens and the basic workflow to illustrate these features in Figures 11 through 17. Figure 12. Fishing Summary. Once the fisherman puts his gear in the water, he screen. The user presses the New Trip presses the Gear In button. When the button to start the trip. All screens display fisherman catches a fish, he presses the latitude and longitude at the bottom. Hub Fish Caught button. This sends a signal to connection data are for debugging. the Hub to record the GPS location and displays a waypoint (WP) on the screen. Multiple waypoints can be entered. 11 Figure 11. Trip Setup. The introductory Final Report: At-‐Sea Electronic Data Logging and Data Entry for Salmon Fisheries Figure 13. Barcode entry. The barcode is used as a key identifier in the database. Each fish sampled must have a unique barcode. The fisherman presses the WP button for each fish and is asked to enter a barcode number. We initially intended to scan the barcode into the system, but this proved operationally difficult. With 4-‐ or 5-‐ digit barcodes, manual entry is easier. It is important to enter the correct barcode. Figure 14. Length and Depth. The fisherman records the length of each fish and estimates the depth in the water column at which the fish was caught. An approximate value is entered (i.e., 60, 70, or 80) and then adjusted using the + and – buttons. 12 Final Report: At-‐Sea Electronic Data Logging and Data Entry for Salmon Fisheries Figure 15. Species, fin clip, sex and maturity. This is the final data entry screen. Species defaults to Chinook or is selected from a drop-‐down menu. Ad Clip (adipose fin clip) toggles between No and Yes. Maturity can be selected from a drop-‐ down menu. The interface is designed for clarity and ease of use. Once all data are entered, the Submit button transmits data to the Hub and returns to the Fishing Summary screen. Figure 16. Fishing Summary. The Fishing Summary screen contains a list of all fish caught, listed by WP and barcode. The fisherman can scroll through the list to review it. There is a limited ability to modify or add data (for example, Maturity is not know until the fish is cleaned). The End Trip button goes to the Finalize Trip screen. 13 Final Report: At-‐Sea Electronic Data Logging and Data Entry for Salmon Fisheries Figure 17. Finalize Trip. When fishing is done for the day, the fisherman presses the Gear Out button. At the end of the trip, the fisherman reviews the data and presses the End Trip button. The trip is now complete, and the user is taken back to the New Trip screen. Lab and Field Testing In the lab we verified expected operation of the devices, including correct operations of buttons and entry fields, connectivity between devices, correct insertion of data into database. We also took equipment and systems outdoors to test operation in the field. This included walking around the parking lot, driving along the waterfront and through mountainous areas, and visiting vessels at dock. We sampled GPS positions using both the Android platforms as well as dedicated Garmin GPS equipment to verify the accuracy of the devices. We also tested wireless communication using the hotspots and verified the transmission of data to and from the Fish Trax™ server. 14 Final Report: At-‐Sea Electronic Data Logging and Data Entry for Salmon Fisheries At-‐sea Testing We took the systems out to sea between June and September 2012 to verify operation off shore and in the hands of fishermen. Details are reported in Table 2. Table 2. Chronology of field testing of SeaTab systems. Date Vessel Tester Test type Jun 29 F/V Granville ARC Team verification of GPS operation and communications on board vessel under way Jul 19 OSU R/V Elakha Wil Black system test Aug 6-‐8 F/V Granville Corey Feldner fishermen test Aug 16-‐18 F/V Sunwest Al Townsend fishermen test Aug 16-‐19 F/V Gal Kevin Bastien fishermen test Sep 7-‐8 F/V Nile II Lee Taylor / fishermen test and CROOS verification Michael Wood Sep 7-‐9 F/V Sunwest Al Townsend fishermen test and CROOS verification Training and Instruction We met with each of the fishermen to walk through the process of operating the equipment and collecting sample data. We also provided each a written set of instructions and a troubleshooting guide in case the equipment behaved unexpectedly. On one occasion the fishermen did not receive the written instructions with the kit, and said this prevented him from completing the assignment. 15 Final Report: At-‐Sea Electronic Data Logging and Data Entry for Salmon Fisheries Results Fishermen as data collectors. Transitioning fishermen from the manual system of recording information on envelopes to the SeaTab system introduced a number of operational challenges. The excessive complexity of operating the 3-‐Device system made it very difficult to use. One fisherman was able to record only one fish using the 3-‐Device system. Another recorded 8 of the 15 he caught with only 4 of the 8 having a valid GPS position. One fisherman observed the Nook had lost connection with the Hub and stopped collecting data, unaware the Nook would continue to collect useful data even when not connected to the Hub. Fisherman found it difficult to initialize a sampling trip on the DEDU, and to perform the SeaTab data collection operations while continuing to collect their regular CROOS sample data. They found the screen on the 1-‐Device system extremely hard to read outdoors. One fisherman recorded all his fish (over 30), but did so by entering the data recorded on the CROOS envelopes later in the wheelhouse after completing the CROOS sampling. Yet another vessel having two fishermen on board attempted to do both CROOS sampling and SeaTab data entry simultaneously, but eventually moved into the wheelhouse to complete the data entry, once again due to the poor visibility of the screen outdoors. The 3-‐Device System The 3-‐Device system tested included a Nook, a Samsung Precedent, and either the Verizon MiFi 4610 or MiFi 2200. When we initially developed the 3-‐Device System, we chose to use the myCharge Portable Power Bank 6000 for power. This could not provide enough power for a full day, and thus was inadequate for normal fishing operations. We then tested the 3-‐Device system using the Schumacher XP750C Portable Power unit, providing it to two fishermen to test at sea. The 3-‐Device System proved to be very difficult for the fishermen to start-‐up because the three devices needed to be started in a specific order. One fisherman unwittingly shut the power off at the power supply, and the data collection units lost power, and thus he was unable to sample any fish. Another fisherman was able to correctly power the unit up. One fisherman reported the Nook provided erratic operation, in some cases displaying a different number (such as an ‘8’) than the one pushed (such as a ‘0’). This could have been the effect of moisture on the Nook operation. During two of the at-‐sea tests, the MiFi 2200 units failed, and were no longer available for use. The 1-‐Device System We tested a 1-‐Device System with two fishermen. This system required they only use the Nexus 7 tablet, and plug it in to the power supply at night or whenever power ran low. They were also 16 Final Report: At-‐Sea Electronic Data Logging and Data Entry for Salmon Fisheries instructed to turn the tablet off at night. For these tests, the system was able to operate without any power problems. In one case the fisherman said the system operated for over 2.5 days before it ran out of power. In the other case it retained power when it was returned to dock four days later. Screen visibility The principle advantage of the Nook is its E Ink Pearl screen. This screen is visible in sunlight and has low power use, enabling long battery life. The disadvantage of the Nook is the limited hardware capabilities dictate a more complex 3-‐device system. Additionally, the screen, while highly visible, is slow to respond, making it difficult for the fishermen to be confident that they had correctly entered data. In contrast, the Nexus 7 has a responsive screen, but poor daylight visibility and shorter battery life. Figure 18 demonstrates the contrast in visibility between the two screens. Photographed in full sunlight, the Nook screen is clearly visible while the Nexus 7 screen is faint and obscured by reflections. The fishermen’s experience confirmed the importance of these considerations. Figure 18. Comparison of the Nook (left) and Nexus 7 (right) in full sunlight. The Nook screen is fully visible while the Nexus is faint and confused by reflections. 17 Final Report: At-‐Sea Electronic Data Logging and Data Entry for Salmon Fisheries Comparison with Project CROOS data We engaged the services of fisherman going out to sea to sample fish under the CROOS program. Under this program, fishermen record their information using a GPS receiver and entering data on an envelope which is turned in to a Project CROOS port liaison. The port liaison then enters the data into the Project CROOS database. The fishermen were asked to record the fish catch data using SeaTab while they were also recording the data using the CROOS protocols. They were given a stipend for each day they participated in this program. We compared the data collected using SeaTab with that in the CROOS database (Table 3), and found the following coherence. The column “Num Samples” shows the number of samples that were received using SeaTab relative to the number sampled for Project CROOS. The columns “% … match” indicate the percentage of time the data collected with SeaTab data matched the CROOS data. In this case a time “match” occurred if the values were identical, a location “match” if the values were within 150m of one another, a length “match” if the values were within 5cm, and a depth “match” if the values were within 5m. Table 3. Comparison between data recorded with SeaTab and data entered using the standard protocol. Date Fisherman Num % time % location % length % depth Samples match match match match Aug 6-‐8 Corey Feldner 4 of 8 100% 100% 25% 25% Aug 16-‐ Kevin Bastien 1 of 15 100% 100% 100% 0% 19 Sep 7-‐8 Lee Taylor / 28 of 29 72% 27% 75% 65% Michael Wood Sep 7-‐9 Al Townsend 33 of 33 100% 100% 100% 100% Fishermen commented how much work it is to record data using SeaTab and CROOS. In the case of Al Townsend, he chose to enter all his data in the wheelhouse at the end of the day using the information recorded on the CROOS envelopes. In the case of Lee Taylor’s boat and his mate Michael Wood, they chose to do some on the deck and some in the wheelhouse later. Waterproofing Nook tests. We tested the Nooks by dripping water on the screens, and found that the functionality of the Nook touchscreen is severely impaired by any quantity of water on the screen surface, making data entry impossible until the screen surface is wiped with a dry towel or the moisture is allowed to evaporate. Plastic Pouches. We placed the Nooks into each of the plastic waterproof pouches. The Nooks would not accept keystrokes when inside any of the pouches, wet or dry. We also tried out the Nexus 7 tablets, and they were able to fully operate inside the pouches. Liquipel tests. We immersed a treated Nook into about five centimeters of water, then took it out, allowing the water to drain from the electronic connector port, and dried the unit off. We 18 Final Report: At-‐Sea Electronic Data Logging and Data Entry for Salmon Fisheries then operated the DEDU program and were able successfully to enter data and verify it transmitted correctly to the Hub. We also immersed the unit in the salt water from Yaquina Bay and dried the unit completely off. This unit completely failed to operate, providing no response to keyboard entries. Discussion During the project we were able to address several of the risks we had identified in our proposal. In some cases, the risks did not materialize. Table 4 identifies each of the risks and the outcome, in some cases including action taken on our part to mitigate the risk. Table 4. Development risks anticipated during the project with outcomes and possible mitigations. Anticipated Risk Short product life of consumer electronics Consumer electronic obsolescence Difficulty in programming the wireless interfaces Electrical interference on board fishing vessel Outcome This risk had a significant impact on our research. Of the approximately 20 devices used, 4 of them failed (20%). These were 2 Verizon MiFi units that died and 1 Nook Touch unit that behaved erratically, and one MyCharge battery failed. All of these units were deployed at sea, and we believe the ocean environment (humidity and salt spray) may have been a significant contributor to this high failure rate. Use of higher quality units and more rigorous protection from the elements should mitigate this risk. Also, systems with fewer devices will have fewer failure modes. No devices became obsolete during the six months of the project. In at least one case another category of device (tablet) was offered at a price point that made use of it cost-‐effective. This was the Google Nexus 7 tablet. Software could be used on both the Nook and Nexus 7 with little change, and will be adaptable to future Android devices. We were unable to directly use the smartphone for communication while retaining its functionality as a Hub. We mitigated this by adding a WiFi Hotspot, which provided wireless communication functionality but increased system complexity and power consumption. Bluetooth wireless became much more challenging than originally thought. The Precedent smartphone did not support the HID protocol that was needed for seamless Bluetooth connections. We mitigated this by dropping the Bluetooth component of our system (the barcode scanner). Tests we conducted did not find this to be a factor. 3-‐Device System Discussion This system provided the following benefits: • The E ink display was very easy to read in daylight • The data entry interface was easy to operate and matched the capabilities of the manual sampling protocols. • The Nook was lightweight and portable. 19 Final Report: At-‐Sea Electronic Data Logging and Data Entry for Salmon Fisheries • • Once treated with Liquipel the Nook initial tests look promising for resisting the effects of water but was found ineffective if the device is immersed in salt water. The system was able to transmit the data from the Nook to the Android Hub, and then to the Fish Trax™ database while at-‐sea using the cellular connection. Issues with the 3 Device System: • The system was complex to power up and this proved unusable for the fishermen. Although a power supply was provided with the system, the instructions made it difficult to be sure the unit was receiving power as expected. • The system was difficult to package, requiring a box to hold part of the gear, a detached Nook, and a separate power supply. • Communication between the devices was poor. Two of the hot spots failed at sea, and when they were operational, there were challenges in having the devices connect to the correct network. • The set-‐up and start-‐up sequence of the system was too complex. Fishermen were unsure of which devices to power on in what order. Automatic connection of all three devices over the wireless network on the vessel was problematic. Some of the network connection issues could be solved with static IP addresses, but the Nook cannot use static IP addresses. • The responsiveness of the data entry interface on the Nook was slow. This was confusing to users in some cases, and limited the ability of the system to provide timely feedback to user actions. 1-‐Device System benefits: • The user interface on the Nexus 7 was identical to that used on the Nook, and thus provided the same high degree of usability. • The Nexus 7 was lightweight and portable, although not as light as the Nook. • When enclosed in a plastic case, the unit was fully protected from water. • The system was able to receive the data entered by the fishermen on the screens and then transfer it to the Android Hub. Once in range of a wireless network, the data transferred automatically to the Fish Trax™ database. 1 Device Issues: • The Nexus 7 screen was difficult to see in broad daylight, and the fishermen ended up recording their data indoors in the wheelhouse. • The batteries on the Nexus 7 were insufficient to power the unit for an entire day’s use. But with the Schumacher XP750C Portable Power the system could be deployed for multiple days without recharging. Fisherman had to either keep the Nexus 7 connected to the Schumacher XP750C Portable Power supply or charge it several times a day. The Schumacher XP750C Portable Power was deployed for over 2 days of field collection without recharging. 20 Final Report: At-‐Sea Electronic Data Logging and Data Entry for Salmon Fisheries Regardless of which system the fishermen used, they recommended improvements to the screen design. During the research and development process, we made the following choices: • Barcode scanner -‐ Implementation of an electronic barcode reader was rejected for use in fish catch sampling at sea due to low frequency of entering barcodes (less than 15 times per day). Being a wireless device, the barcode scanner takes several seconds to resynchronize with the Hub, which becomes an inconvenient delay to the fisherman. Since the unit is a separate device, arrangements would have to be made to ensure it had the power needed for operation and waterproofing. On the back deck of the boat, the barcode scanner becomes one more device for the fisherman to have to manage. Implementation of a barcode scanner requires additional programming, and places a restriction on the Hub that it support the HID protocols needed for Bluetooth operation. In consideration of these factors, and because the barcodes used by Project CROOS are relatively short (5 digits), we chose to collect barcodes manually via a virtual numeric keypad on the DEDU. • External GPS receiver -‐ We considered implementing an external GPS receiver to ensure reception of a position at sea, but scrapped this idea early in the project. For the vessels we encountered, we were able to determine that the GPS position provided by the Android smartphone was sufficient for our needs. We conducted tests using an Android smartphone and a Garmin GPS receiver on board a fishing vessel (inside and outside the cabin) and found the position fixes matched within 8 meters. We also learned that determination of catch location is not an exact measurement. Fishing vessels troll at a speed of 2.5 to 3.5 knots, meaning that the vessel would be moving about 250 to 350 feet per minute/75 to 100 m per minute. The accuracy of the catch location therefore will depend on how quickly the fisherman was able to press the button to mark the fish after bringing the fish aboard. Summarizing our results, we were able to successfully deploy a system that could record catch data at sea. We were able to automatically record and associate catch time and position with manually entered data such as barcode, fish length, depth of capture, etc. We were able to program an Android application that was portable to any number of Android-‐compatible devices. Our system also successfully demonstrated the ability to transmit this data to shore in ‘real time’ (i.e. 5-‐10 minute delay) where it was immediately available via the Fish Trax™ web portal. This was accomplished using a cellular network accessible to the vessel close to shore. Unfortunately, our system is not yet sufficient for widespread implementation. The separate aspects of the task, including creation of an interface and device usable in the troll pit, accurate data collection, and storage and transmission of data to shore have been accomplished. However, no single system was able to reliably perform all of these functions due to the limitations of commercially available hardware and the prohibitive cost of custom hardware development. As with other data collection systems which have been developed for this application, ours is a significantly improved iteration, which addresses some, but not all, limitations of 21 Final Report: At-‐Sea Electronic Data Logging and Data Entry for Salmon Fisheries previous systems. The chief accomplishments of this research effort are the demonstration of an exceptionally suitable daylight readable display and the development of a flexible, modular software system, which is portable among a variety of hardware devices. As new hardware becomes available, we expect that this software system will become viable for widespread deployment with minimal modification, and could be easily adapted for field data collection in a wide range of applications. Conclusions Use of tablet technology is quite feasible for at-‐sea data collection. The fishermen are able to obtain GPS position fixes and enter data reliably using today’s available technology. Also, we are seeing on the horizon Android tablet designs that are hardier and have better outdoor visibility. However, we have learned the technology must be kept simple in design and operation for success. Issues remain in fielding operational systems, including training the fishermen on proper use of the equipment and updating the data entry design to improve the user experience. Recommendations Based on the findings of this research, we make the following recommendations for implementing electronic data collection technology in the salmon fishery. Our experience supports our earlier conclusions about the desirability of: • Single device • Daylight visible screen • Low power • Intuitive interface • Portable software Future development should focus on a new class of tablet devices that are now becoming available. These are based on color reflective screens including Pixel Qi and Mirasol technologies. In particular we are seeing rugged tablets becoming available based on Pixel Qi screens that appear suitable to this application. There may be uses in a broad variety of fishery and at-‐sea data collection, and in any research or commercial activity that requires data collection outdoors in rugged conditions. A properly designed system with configurable user interface and back end database functions should find wide application. • Improve the data entry program design. Add positive confirmations on data entry and follow up checks to ensure data is complete. • Finalize system design. Implement a one device system that offers outdoor visibility, real-‐time communication, and ease of use for the fisherman. Use any of the available Android tablets with reflective screens now coming on to the market. 22 Final Report: At-‐Sea Electronic Data Logging and Data Entry for Salmon Fisheries • • Operationalize the system. Implement validation checks, provide device authentication, and test the system with the fishermen. Validate operation in the fishery. Implement a test group of fishermen to finalize the training and work out final bugs. 23