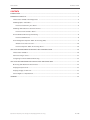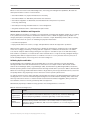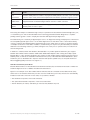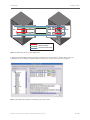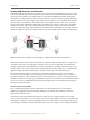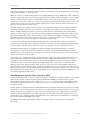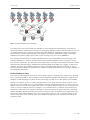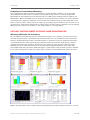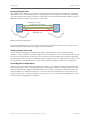
1
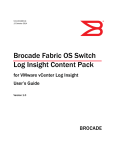
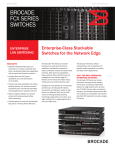
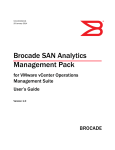
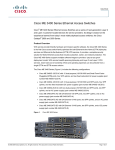
DATA CENTER
Operational Simplicity:
Automating and Simplifying
SAN Provisioning
The network matters for storage. This paper discusses key server
and storage trends and technology advancements and explains how
Brocade Gen 5 Fibre Channel and Brocade Fabric Vision technology
delivers the performance, reliability, and simplicity needed to meet the
new requirements of today’s data center.
DATA CENTER
TECHNICAL BRIEF
CONTENTS
INTRODUCTION........................................................................................................................................... 3
OPERATIONAL SIMPLICITY ........................................................................................................................... 3
Infrastructure Validation and Diagnostics .............................................................................................. 4
Validating Optics and Cables.................................................................................................................. 4
How Does ClearLink D_Port Work?................................................................................................... 5
Validating SAN Robustness and Performance.......................................................................................... 7
How Does Flow Generator Work?..................................................................................................... 7
Threshold-Based Monitoring and Alerting................................................................................................ 8
How Does MAPS Work?................................................................................................................... 8
Zone Management: Dynamic Fabric Provisioning (DFP)............................................................................. 9
What Do Customers Do Now?........................................................................................................ 10
How Does Dynamic Fabric Provisioning Work?................................................................................. 10
USE CASE: PRE-DEPLOYMENT OF PRIVATE CLOUD INFRASTRUCTURE............................................................ 10
Infrastructure Validation...................................................................................................................... 10
Pre-Provisioning of Zones..................................................................................................................... 11
Configuring for Threshold-based Monitoring........................................................................................... 12
USE CASE: POST-DEPLOYMENT OF PRIVATE CLOUD INFRASTRUCTURE.......................................................... 12
Monitoring SAN Health and Performance............................................................................................... 12
Verifying Disruptive Links..................................................................................................................... 13
Verifying Integrity of New Link............................................................................................................... 13
Server Migration or Replacement......................................................................................................... 13
SUMMARY................................................................................................................................................ 14
Operational Simplicity: Automating and Simplifying SAN Provisioning
2 of 15
DATA CENTER
TECHNICAL BRIEF
INTRODUCTION
As customers look to Fibre Channel Storage Area Networks (FC SANs) for building private storage cloud services
for their enterprise data centers, some of the key requirements are:
•Consolidated and highly virtualized pools of compute, storage, and network resources
•Secure and efficient use of inter-fabric connectivity
•Lower capital and operational costs, higher asset utilization
•On-demand and efficient provisioning of application resources through automated management
Brocade has developed solutions to address these key requirements, leveraging the Brocade® ApplicationSpecific Integrated Circuit (ASIC) and Brocade Fabric OS® (FOS) version 7.x in the Gen 5 Fibre Channel
platforms, Brocade Network Advisor, and Brocade Host Bus Adapter (HBA) and Converged Network Adapter
(CNA) technology (as well as working with transceiver vendors) to address these key requirements. To enable
customers to achieve their goals, Brocade is delivering key technologies (see Figure 1) that allow customers to:
•Scale up/out based on business growth
•Secure data and optimize inter–data center bandwidth utilization
•Reduce CapEx and OpEx cost with built-in diagnostics and innovative SAN monitoring and management tools
Hyper-Scale
Fabrics
• Scale-out optical
UltraScale ICLs
• Scale-up UltraScale
ICL ports-on-demand
• 128 Gbps ISL
Trunks
Metro Cloud
Connectivity
• Integrated DWDM
and dark fiber
• In-flight encryption
and compression
• Resilient metro links
Operational
Simplicity
• ClearLink cable and
optics diagnostics
• Simple thresholdbased monitoring
and alerting
• Health and
performance
dashboard views
Cloud-Optimized
Performance
• Higher IOPS
• Twice the bandwidth
• Energy efficient
ASICs
Fig01_enabling-private-storage-clouds
•Optimize both bandwidth and Input/Output Operations Per Second (IOPS) while being energy efficient
Figure 1. Enabling private storage clouds.
OPERATIONAL SIMPLICITY
Brocade SAN fabrics provide a secure, low-latency, and high-performance infrastructure for the mission-critical
applications on which Fortune 1000 companies depend. With higher density virtualized environments, new
and evolving workloads, and the increasing adoption of flash-based storage, network reliability, availability, and
optimized performance become even more critical. While these technologies help meet business goals, they
can also increase management complexity and drive up operational costs. In the current business environment
where administrators have to do more with less, technology can be used to simplify management and reduce
manually intensive and error-prone tasks.
This is one of several technical briefs that address Brocade solutions for helping customers in their transition
to private storage clouds. This paper describes tools that are available on the Brocade Gen 5 Fibre Channel
platforms for infrastructure diagnostics, proactive monitoring and alerting, and zone management, as well as the
benefits that these tools can provide in your SAN infrastructure.
Operational Simplicity: Automating and Simplifying SAN Provisioning
3 of 15
DATA CENTER
TECHNICAL BRIEF
Based on customer need for automated diagnostics, monitoring, and management capabilities, Brocade has
developed innovative solutions in several areas:
•Automated validation of physical infrastructure connectivity
•Automated validation of SAN fabric performance and robustness
•Automated configuration of fabric-wide, threshold-based rules and policies for proactive
monitoring and alerting
•Automated provisioning and administration of zone management
•At-a-glance dashboard views of SAN health and performance
Infrastructure Validation and Diagnostics Whether building a new SAN or connecting to an existing SAN, pre-staging and validating a fabric prior to putting
it into production ensures that there are baseline metrics in terms of rated throughput, latency, decibel loss
through patch panels, and quality of optic cables as a measure of Cyclic Redundancy Checks (CRCs). Currently,
customers have these two options for validating the physical infrastructure:
•Use SAN test equipment
•Deploy actual devices like servers, storage, and tape libraries that will be supported in production
While the best practice is to use actual devices to validate the infrastructure, equipment may not be available
at the time of staging. Purchasing or leasing SAN test equipment to validate the infrastructure is an added
cost that can easily be addressed by providing the test support in the fabric as part of the SAN functionality.
Once a SAN is in production, most data centers have restricted access or may be remotely managed. Having to
physically place SAN test equipment in-line to troubleshoot issues is not only intrusive and error-prone, but it
can be critically disruptive, if the wrong link is removed for diagnosis.
Validating Optics and Cables
The digital diagnostics capabilities that are available with most current transceivers provide generalized
warnings and alert levels that are defined across transceivers from multiple vendors. With the Gen 5 Fibre
Channel Short Wavelength (SWL), Long Wavelength (LWL), and Extended Long Wavelength (ELWL) transceivers,
Brocade provides granular vendor-specific thresholds and flags critical alarms (as listed in Table 1) with Brocade
Fabric Vision technology and Brocade Network Advisor. By proactively monitoring critical transceivers, customers
can quickly address any physical layer issues without the need for special optical testers.
As network speeds increase, media and cable tolerance become critical for avoiding degraded performance and
avoiding CRC errors over time. Brocade designed intelligence into the Brocade FC switching ASICs and worked
with major transceiver vendors so that Gen 5 Fibre Channel Small Form-Factor Pluggables (SFPs) provide linklevel validation, which is commonly provided by SAN test equipment.
Fabric-based physical layer validation testing provides the following benefits to customers:
Table 1. Infrastructure Diagnostics
Test
Benefit
Local and
Long-Distance
Measurements
Checks for cable reroutes within a data center or path reroute over Dense WavelengthDivision Multiplexing (DWDM) to a distance granularity of 16.4 feet (5 meters)
Latency
Measurements
Measures latency between links within or across data centers for latency-sensitive
applications like Virtual Machine (VM) motion and replication, or for monitoring Service Level
Agreements (SLAs)
Operational Simplicity: Automating and Simplifying SAN Provisioning
4 of 15
DATA CENTER
TECHNICAL BRIEF
Test
Benefit
Link
Performance
Generates traffic patterns similar to the projected traffic patterns over links of the new fabric
to ensure that it meets performance requirements and detects potential congestion points
Transceiver
Health Check
Validates that all electrical and optical components of the transceiver are working as
designed and that the decibel budget between the links is within tolerance
Transceiver
Uptime
Proactively monitors and trends for the integrity of the optics during its operational life cycle,
with the power on hours or years
This testing and analysis is enabled through a new port operational mode called the ClearLink diagnostics port,
or “ClearLink D_Port.” Part of Brocade Fabric Vision technology, Brocade ClearLink Diagnostics is a patentpending technology that is used to simplify and automate SAN physical layer diagnostics.
The ClearLink D_Port is statically configured by the user to run diagnostics during pre-deployment or when there
are susceptible physical layer issues. It is an offline diagnostics tool that allows users to automate a battery
of tests to measure and validate latency and distance across the switch links, as well as to verify the integrity
of 16 Gbps transceivers in the fabric. In addition, a ClearLink D_Port requires only the individual ports that are
attached to the link being tested to go offline, leaving the rest of the ports to operate online, in isolation from
the link being tested.
In addition to switch-to-switch link validation, Brocade FOS v7.1 provides dynamic ClearLink D_Port support
between Gen 5 Fibre Channel switches and Brocade 1860 Fabric Adapters when running at 16 Gbps speed.
Brocade FOS v7.1 also provides ClearLink D_Port support for Gen 5 Fibre Channel switches running in Access
Gateway mode, as well as for UltraScale Inter-Chassis Links (ICLs) on Brocade DCX® 8510 Backbones. (Note:
ClearLink D_Port on UltraScale ICLs skips the electrical and optical loopback tests, as the Quad Small FormFactor Pluggable [QSFP] used does not support it.)
How Does ClearLink D_Port Work?
Brocade Network Advisor or Brocade FOS Command-Line Interface (CLI) commands can be used to initiate the
ClearLink diagnostic tests to validate the cables and transceivers.
Figure 2 is an example of two Gen 5 Fibre Channel switches that are connected via Inter-Switch Links (ISLs),
either local or over distance. When the ports are set in the ClearLink D_Port mode, the tests are automatically
initiated on both ends of the link. In this mode, it is possible to validate:
•The electrical components of the local transceiver
•The optical and electrical components of the remote transceiver
•The link distance (in meters) and latency (in nanoseconds) between the ports
Operational Simplicity: Automating and Simplifying SAN Provisioning
5 of 15
DATA CENTER
TECHNICAL BRIEF
ASIC
RX
RX
TX
RX
TX
16 Gbps SFPs
16 Gbps SFPs
TX
TX
RX
Electrical Loopback
Optical Loopback
List Distance/Saturation
RX
RX
ASIC
TX
fig02_D-Port-diagnos
TX
Figure 2. ClearLink D_Port to D_Port diagnostics.
In Figure 3, Brocade Network Advisor displays ClearLink D_Port test results for six ISLs where two ports
succeeded, two ports failed the optical component of the test, and two ports are still in progress.
Figure 3. Brocade Network Advisor: ClearLink D_Port test results.
Operational Simplicity: Automating and Simplifying SAN Provisioning
6 of 15
DATA CENTER
TECHNICAL BRIEF
Validating SAN Robustness and Performance
Validating the physical infrastructure is a good first step to ensure maximum availability, but users also need
to know if the SAN will deliver the required performance. Flow Generator, available with Brocade Fabric Vision
technology, provides a built-in test traffic generator for pre-testing and validating Gen 5 Fibre Channel SAN
infrastructures, including internal connections within the switch, for robustness before deploying applications.
With Flow Generator, users can configure a Gen 5 Fibre Channel capable port as a simulated device that can
generate traffic for specified flows, transmitting frames at full 16 Gbps line rate. It allows users to emulate
a Gen 5 Fibre Channel SAN without actually having any 16 Gbps hosts, targets, or SAN testers, and validate
hardware components, end-to-end connectivity, and flow performance to ensure that it meets the required
Service Level Agreement (SLA). Figure 4 illustrates the Flow Generator functionality. In this example, hosts H1
and H2 and targets T1 and T2 are not physical devices; they are simulated devices created by Flow Generator.
T1
H2
T2
fig04_Operational_Simplicity_v2
H1
Figure 4. Flow Generator simulates hosts and targets to validate SAN performance and robustness.
Flow Generator allows a Gen 5 Fibre Channel ASIC port to generate traffic, creating load from an ingress point
of the fabric, all the way to the target egress switch port. This tests the complete path of the traffic within
the fabric, including any ISLs/UltraScale ICLs as well as the backplane connections within each switch. Flow
Generator allows users to customize flows with a different payload size, data pattern, etc. to simulate actual
application traffic, and activate multiple flows in the fabric to fully exercise the SAN infrastructure.
Flow Generator displays statistics related to the created flows, providing information on the RX Frame
Count (measured on the ingress port) and TX Frame Count (measured on the egress port) to establish a
performance baseline for flows and identify any flows that need attention. Users can use Flow Monitor, also
available with Fabric Vision technology, to get additional statistics associated with the Flow Generator created
flows. Users can also use MAPS (Monitoring and Alerting Policy Suite) for threshold-based monitoring and
alerting of Flow Generator flows.
How Does Flow Generator Work?
Prior to creating and activating the flows, administrators use the Flow Generator control command to
configure the source device and the destination device ports as Simulator Ports (SIM Ports). Once the
SIM Ports are established, the Port ID and Worldwide Names associated with the SIM Ports are used to
create the Flow Generator flows.
Flow Generator can create unidirectional flows from a single source to a single destination, from a single
source to multiple destinations, or from a single source to all zoned destinations. Users can test bi-directional
flows between a single pair of devices by defining a second set of flows with the source and destination ports
reversed. Figure 5 illustrates uni-directional Flow Generator flows from a single source to multiple destinations.
Operational Simplicity: Automating and Simplifying SAN Provisioning
7 of 15
DATA CENTER
TECHNICAL BRIEF
Source Device
Destination
Device
LUN1
LUN2
fig05_Operational_Simplicity_v2
Flow Direction
Figure 5. Uni-directional flow from a single host to multiple LUNs.
Threshold-Based Monitoring and Alerting
As SAN infrastructures continue to grow in size and complexity, proactive monitoring of the health and
performance of the SAN becomes critical. However, defining and setting up appropriate threshold-based rules
and policies for proactive monitoring can be a complex, time consuming task that requires expertise.
The Brocade Monitoring and Alerting Policy Suite, or MAPS, is an easy-to-use policy-based threshold monitoring
and alerting suite that proactively monitors the health and performance of the SAN infrastructure to ensure
application uptime and availability. What makes it “easy-to-use”? MAPS takes the complexity, guess work, and
manual effort out of defining and configuring appropriate rules and thresholds that enables proactive monitoring.
Offering pre-built groups, policies, and actions—all based on Brocade’s more than 15 years’ experience and
expertise—MAPS makes threshold configuration, monitoring and alerting simple. Using Brocade Network
Advisor, organizations can configure the entire fabric (or multiple fabrics) at one time using common rules and
policies, or customize policies for specific ports or switch elements—all through a single dialog.
MAPS also provides an integrated dashboard that displays all critical information, including overall switch health,
error statistics for every aspect of the switch, along with details on out-of-policy conditions. This dashboard
helps administrators quickly pinpoint potential issues and easily identify trends and other behaviors occurring
on a switch or fabric.
Other Brocade tools, such as Flow Monitor and Bottleneck Detection, are integrated into MAPS. As a
result, MAPS can monitor flows that are established within Flow Monitor and generate alerts based on user
defined rules. Similarly, Bottleneck Detection information is integrated with the MAPS dashboard, enabling
administrators to get an instant view of the bottlenecked ports in the switch, enabling rapid problem resolution.
How Does MAPS Work?
Based on Brocade’s more than 15 years’ experience and best practice expertise, Brocade has pre-validated
hundreds of threshold-based rules with appropriate pre-defined actions, and packaged these rules into predefined monitoring policies: aggressive, conservative, and moderate. The Aggressive Policy contains rules with
very strict thresholds, and is for environments that need a pristine network. The Conservative Policy contains
rules with more lenient thresholds and is for environments that are resilient and can tolerate some errors; the
default monitoring policy. The Moderate Policy contains rules with threshold values between the aggressive and
conservative policies. If these three pre-defined policies aren’t quite right for your environment, MAPS allows you
to copy a policy and modify any rules to fit your specific environment, accelerating the configuration process.
MAPS provides pre-defined monitoring groups to further streamline the configuration process. Pre-defined
monitoring groups include: all host ports; all target ports; all E_Ports; all SFPs; all power supplies; all fans; CPU
utilization, and more. Ports are automatically assigned to the right group, dramatically reducing manual effort
and errors. Users also have the flexibility to create custom monitoring groups—such as switch ports attached
Operational Simplicity: Automating and Simplifying SAN Provisioning
8 of 15
DATA CENTER
TECHNICAL BRIEF
to high priority applications and another group of switch ports attached to low priority applications—and monitor
each group according to its own unique rules.
MAPS also supports multiple alerting mechanisms, including RASlog messages, SNMP traps, email notifications,
as well as port fencing when errors exceed the specified threshold. MAPS offers the flexibility to monitor a given
counter for different threshold values and take different actions when each threshold value is crossed. For
example, users can monitor a CRC error counter at a switch port and can generate a RASlog when the error rate
reaches two per minute, send an e-mail notification when the error rate is at five per minute, and fence a port
when the error rate exceeds ten per minute.
Once MAPS policies are enabled, users can easily monitor SAN health and performance using the integrated
dashboard. Available at the switch level via the CLI or at the fabric or multi-fabric level via Brocade Network
Advisor, the MAPS dashboard provides a summary view that shows the overall health of the switch (healthy,
marginal or down) as well as the status of every monitored category including port health; switch status policy;
fabric state changes; FRU health; security violations; switch resources; FCIP health; and traffic performance;
giving administrators a quick view into issues and hot spots. For categories that are out of range, the summary
view also shows the rules that were triggered to accelerate troubleshooting.
In addition to the summary view, the MAPS dashboard provides a historical view to quickly show trends. The
historical view provides raw counter information regardless of whether rules were triggered; giving administrators
instant visibility to statistics such as CRC errors, link resets, and Class 3 TX timeout discards over time.
Brocade Bottleneck Detection is integrated into MAPS, identifying and alerting administrators to device or
ISL congestion as well as abnormal levels of latency in the fabric. Through the MAPS dashboard, users see
bottleneck events that are detected as well as get an instant view of bottlenecked ports in the switch, enabling
faster problem detection and resolution.
Flow Monitor is also integrated into MAPS. Flow Monitor, part of Fabric Vision technology, provides users much
deeper visibility into the application traffic between a host and a target LUN. With Flow Monitor, users get
information on various performance metrics associated with an application flow, such as transmit or receive
frame count, transmit or receive throughput, SCSI Read or Write frame count, number of SCSI Reads and
Writes per second, etc. Whenever NPIV is used on the host, users can monitor Virtual Machine (VM) to LUN
level performance as well. With Flow Vision integrated into MAPS, users can monitor Flow Vision statistics and
generate alerts based on the user-defined rules. By proactively monitoring flows of interest, users know how well
critical applications are performing. If any of those application flows experience performance degradation, users
are notified proactively via MAPS alerts.
Zone Management: Dynamic Fabric Provisioning (DFP)
Zoning is a security mechanism used to specify the devices in the fabric that should be allowed to communicate
with each other. Zoning is based on either port World Wide Name (pWWN) or Domain,Port (D,P). (See the
Secure SAN Zoning Best Practices white paper on www.brocade.com for details.) When using pWWN, the SAN
administrators cannot pre-provision zone assignments until the servers are connected and the WWN name of
the HBAs is known.
As data centers consolidate and increase fabric device density, providing an automatic provisioning tool for SAN
administrators to plan ahead and pre-provision device connectivity becomes imperative. Solutions are necessary
that can simplify customer migrations to truly secure, automated private cloud storage services. The Brocade
Gen 5 Fibre Channel SAN platforms provide an integrated switch and HBA solution that enables customers to
dynamically provision switch-generated virtual WWNs and create a fabric-wide zone database prior to acquiring
and connecting any Brocade HBAs to the switch.
The Brocade fabric-based implementation supports a scalable solution for environments with blade and
rack servers.
Operational Simplicity: Automating and Simplifying SAN Provisioning
9 of 15
DATA CENTER
TECHNICAL BRIEF
What Do Customers Do Now?
Defining, adding, or changing a zone database for device connectivity is currently a very manual process. In
cases where the HBAs fail or servers come off lease, the zone database must be updated to accurately reflect
the changes in the fabric. Deploying a server in an FC SAN requires multiple administrative teams, such as
server, SAN, and storage teams, to coordinate and perform configuration tasks like creating zoning at the
fabric and Logical Unit Number (LUN) mapping and masking at the storage device before deploying a server. To
configure WWN zoning and LUN masking, administrators need to know the physical pWWN of the server. This
means that administrative teams cannot start their configuration tasks until the physical server arrives and its
physical pWWN is known. Additionally, due to the sequential and interdependent nature of tasks across various
administrative teams, it may take several days or weeks before a server gets deployed in an FC SAN.
Zoning becomes more complicated in an Access Gateway environment where the port that is connected to the
switch is virtualized, allowing up to 255 virtualized connections from a single switch port. DFP reduces the zone
management overhead as devices move between Access Gateway ports.
In order to simplify and accelerate server deployment and improve operational efficiency, DFP enables SAN
administrators to pre-provision services like zoning, Quality of Service (QoS), Device Connection Control (DCC),
or any services that require port-level authentication prior to servers arriving in the fabric.
How Does Dynamic Fabric Provisioning Work?
A list of port Fabric-Assigned World Wide Names (FA-WWNs) are automatically generated and can be provisioned
to current and future servers in the fabric. During the initial login, the switch provides a virtual WWN to the
Brocade HBA.
There are a few simple steps for setting up the DFP:
1. Select a switch port.
2. Configure an auto-assigned or user-assigned FA-WWN.
3. Create a zone with the FA-WWN and target device.
4. Enable zoning.
5. Connect a Brocade FC HBA to the switch port.
6. HBA automatically acquires the FA-WWN, and the server is ready for operation.
In the future, as devices are replaced or moved, no additional changes are needed for zone management.
USE CASE: PRE-DEPLOYMENT OF PRIVATE CLOUD INFRASTRUCTURE
Infrastructure Validation
In a pre-deployment scenario where all the Gen 5 Fibre Channel switches are interconnected (see Figure 4),
all the ports can be placed in the ClearLink diagnostic mode. They are automatically run through the link
performance, latency, and distance measurement tests as well as the optical health checks prior to connecting
servers and storage to the SAN, without having to use expensive SAN testers to individually test each port or
link. If running Brocade FOS v7.1, the UltraScale ICLs of the Brocade DCX 8510 Backbones can also be tested
for link distance and latency. If Brocade 1860 Fabric Adapters are also deployed, the 16 Gbps links to the server
are also automatically tested for link performance, latency, distance measurements, and optical health checks.
Operational Simplicity: Automating and Simplifying SAN Provisioning
10 of 15
DATA CENTER
TECHNICAL BRIEF
16 Gbps
SAN Core
fig04_Operational_Simplicity
16 Gbps
SAN Edge
Figure 6. ClearLink infrastructure validation.
If the data centers are interconnected over dark fiber for workload migration and replication, assessing the
distance and latency tolerance becomes critical for maintaining application uptime. SAN administrators can now
use ClearLink diagnostics to measure the latency and cable distance to a granularity of 16.4 feet (5 meters),
without having to contact network engineers. This reduces unnecessary organizational delays in identifying
application performance impacts due to cable or path rerouting issues over a metro DWDM link.
Once the physical infrastructure is verified, SAN administrators can leverage Fabric Vision technology’s Flow
Generator capabilities to measure flow performance before deploying applications into production to ensure
they meet the required SLA. Flow Generator allows administrators to emulate a fully loaded Gen 5 Fibre Channel
SAN with all Brocade FOS features enabled without actually having any 16 Gbps hosts, targets, or SAN testers
available. This built-in test capability negates the need for third party traffic generator equipment, as well as
allows performance validation to be performed in advance of implementing new servers or storage, reducing risk
and accelerating deployment.
Pre-Provisioning of Zones
Customers can plan ahead and pre-provision servers before they are connected to the switch ports in the SAN.
This is a one-time procedure. Servers can be moved or replaced in the fabric without having to modify the zone
database or make any changes to fabric services, like booting over SAN, QoS, or DCC policies that use WWN.
By pre-provisioning the servers to storage, SAN administrators can reduce the time to bring resources online
from an error-prone manual process to a plug-and-play model. The SAN administrators do not need to know the
pWWNs of the servers while they configure the servers in the fabric. When an actual server is connected to the
switch, or moved or replaced, there are no changes to zone administration. For example, in the private cloud
architecture, a VM needs to be created on-demand in a self-service manner for internal customers. With DFP,
multiple 2-Terabyte (TB) LUNs can be pre-provisioned to physical servers to automate the storage provisioning.
This removes the interaction between server and storage administrators in order to ultimately support a selfservice model. When a new workload needs to be created in the physical server, a chunk of the 2 TB can be
assigned per VM.
Operational Simplicity: Automating and Simplifying SAN Provisioning
11 of 15
DATA CENTER
TECHNICAL BRIEF
Configuring for Threshold-based Monitoring
Prior to deploying the SAN into production, administrators can take advantage of MAPS to set up and enable
threshold-based rules and policies for proactive monitoring and alerting. Customers currently using Brocade
Fabric Watch can automatically import existing thresholds into a MAPS policy, enabling seamless migration from
Fabric Watch to MAPS. New MAPS users can simply use the pre-defined groups and select one of the pre-defined
monitoring policies—Aggressive, Moderate, or Conservative—and enable that policy for each logical switch in the
fabric. If a custom policy is needed, users can simply copy an existing policy and modify the rules and actions to fit
the environment. Using Brocade Network Advisor, administrators can further reduce configuration time by deploying
MAPS policies and rules across the fabric, or even multiple fabrics, from a single dialog.
USE CASE: POST-DEPLOYMENT OF PRIVATE CLOUD INFRASTRUCTURE
Monitoring SAN Health and Performance
Once the MAPS threshold-based policies are enabled and the SAN goes into production, proactive monitoring of
the health and performance of the SAN becomes critical. Brocade tools such as MAPS, Flow Vision, Bottleneck
Detection, and Brocade Network Advisor allow administrators to proactively monitor the health and performance
of the SAN infrastructure and be alerted when pre-defined thresholds are exceeded, allowing them to address
problems before they impact operations. Administrators can quickly see trends and issues that may impact
availability as well as latency and bottlenecks in the fabric that could degrade application performance. With
customizable health and performance dashboards (Figure 7), administrators have all critical information available
in one screen, allowing them to take the proactive actions needed to ensure availability and optimize resources.
Figure 7. Brocade Network Advisor health and performance dashboards provide all critical information in one view.
Operational Simplicity: Automating and Simplifying SAN Provisioning
12 of 15
DATA CENTER
TECHNICAL BRIEF
Verifying Disruptive Links
After a SAN has been deployed into production, during the operational life cycle of the fabric, links may begin to
exhibit CRC errors or increased latency due to misconfigurations or other problems (see Figure 5). The relevant
ports can be taken offline (red link) and put into ClearLink D_Port mode without disrupting the fabric, if there are
additional connections between the switches to route traffic.
Fabric A
Disruptive Link
Fabric B
fig05_test-link
Existing Links or Trunk
Figure 8. Testing a disruptive link.
The automated ClearLink D_Port tests can be used to verify if the problem is a cable issue or an optics issue.
Then the problem can be serviced accordingly, to minimize downtime.
Verifying Integrity of New Link
As more switches and adapters are added to the fabric, or as additional ISLs are required for reducing
congestion, it is good practice to verify the integrity of the new connections. Prior to connecting the new link, the
two end ports can be placed in ClearLink D_Port mode and run through the diagnostic tests without disrupting
the existing fabric. Once the tests are completed and the integrity of the link is confirmed, the two end ports can
be connected to form an additional ISL or a trunk member without disrupting the traffic on an existing trunk.
Server Migration or Replacement
When servers come off lease, HBAs are replaced due to failure or are upgraded to handle increased workloads.
The SAN administrator needs to manually update the zone database to reflect these changes. If DFP was used
during the pre-deployment stage, the SAN administrator does not have to interact with server administrators to
make any changes. For example (see Figure 6), if you need a new server that requires more CPU and memory,
and the existing server is repurposed, all that you need to do is to move the fabric-assigned WWN from one port
to another without changing the zone database.
Operational Simplicity: Automating and Simplifying SAN Provisioning
13 of 15
DATA CENTER
TECHNICAL BRIEF
Create zones using FA-WWN1
instead of physical WWN of
the server.
Fabric assigns FA-WWN1 to
Server 1 during enhanced
fabric login process.
Create LUN mapping
using FA-WWN1.
T1, pWWN1
FA-WWN1
Server uses Brocade HBA
configured to use FA-WWN.
When Server 1 is replaced
with Server 2, fabric assigns
FA-WWN1 to Server 2 during
enhanced fabric login process.
No change to existing zones.
No change to LUN mapping
or masking at target.
fig06_operational-simplicity
H2, pWWN2
Figure 9. Post-provision zones.
SUMMARY
Aside from delivering the highest-performing SAN platforms in the industry with the Gen 5 Fibre Channel
product line, Brocade has introduced breakthrough Fabric Vision technology that simplifies and automates
the deployment and management of Brocade fabrics. As customers move to create a private storage cloud
infrastructure for their virtualized environment or deploy new flash storage arrays, the ability to ensure the
integrity of the underlying infrastructure and dynamically provision and bring resources online is important to a
successful deployment of storage clouds.
By leveraging the integrated ASIC features in the Gen 5 Fibre Channel platforms, Brocade FOS, Fabric Vision
technology, Brocade Network Advisor, and Brocade HBAs with 3.x drivers, customers can save on both the OpEx
and CapEx of maintaining SANs with the following features:
•Automation of validation of the integrity of optics and cables without the need for external test equipment
•Measuring latency and distance between switches and fabrics to ensure they are within application tolerance
and meet the SLA
•Automation of validation of SAN infrastructure performance without the need for hosts, targets, or external
traffic generators
•Measuring flow performance before deploying applications into production to ensure they meet the required SLA
•Automation of applying rules and policies for threshold-based monitoring and alerting
•Health and performance dashboards that show all critical information in one screen, quickly pinpointing any
problem areas
•Automation of zone management by dynamically pre-provisioning servers to the fabric, which virtually
eliminates the need for zone management as servers are connected, repurposed, or removed from the fabric
To learn more about the Brocade Gen 5 Fibre Channel platforms, including the Brocade DCX 8510 Backbone
and Brocade 6520/6510/6505 Switches, Brocade Fabric Vision technology, Brocade FOS, Brocade 1860
Fabric Adapter, and Brocade Network Advisor, contact your sales representative or visit www.brocade.com/
Gen5FibreChannel
Operational Simplicity: Automating and Simplifying SAN Provisioning
14 of 15
DATA CENTER
© 2013 Brocade Communications Systems, Inc. All Rights Reserved. 09/13 GA-TB-377-03
ADX, AnyIO, Brocade, Brocade Assurance, the B-wing symbol, DCX, Fabric OS, ICX, MLX, MyBrocade,
OpenScript, VCS, VDX, and Vyatta are registered trademarks, and HyperEdge, The Effortless
Network, and The On-Demand Data Center are trademarks of Brocade Communications Systems,
Inc., in the United States and/or in other countries. Other brands, products, or service names
mentioned may be trademarks of their respective owners.
Notice: This document is for informational purposes only and does not set forth any warranty,
expressed or implied, concerning any equipment, equipment feature, or service offered or to be
offered by Brocade. Brocade reserves the right to make changes to this document at any time,
without notice, and assumes no responsibility for its use. This informational document describes
features that may not be currently available. Contact a Brocade sales office for information on
feature and product availability. Export of technical data contained in this document may require an
export license from the United States government.
TECHNICAL BRIEF