1
Observer Reference Guide
September 2003
Trademark Notices
© 1994-2003 by Network Instruments, LLC (Limited Liability Corporation). All rights reserved.
“Observer”, “Network Instruments” and the “N with a dot” logo are registered trademarks of Network Instruments, LLC,
Minneapolis, Minnesota, USA.
Limited Warranty—Hardware
Network Instruments, LLC. ("Network Instruments") warrants this hardware product against defects in materials and
workmanship for a period of 90 days from the date of shipment of the product from Network Instruments, LLC. Warranty is
for depot service at the Minneapolis, MN Corporate Headquarters. Warranties and licenses may give you more coverage in
certain local jurisdictions; Network Instruments also offers extended warranties as part of its maintenance agreement
program.
If a defect exists, at its option Network Instruments will (1) repair the product at no charge, using new or refurbished
replacement parts, or (2) exchange the product with a product that is new or which has been manufactured from new or
serviceable used parts and is at least functionally equivalent to the original product. A replacement product assumes the
remaining warranty of the original product or 60 days, whichever provides longer coverage for you. When a product or part
is exchanged, any replacement item becomes your property and the replaced item becomes Network Instruments' property.
This manual is furnished under license and may only be used or copied in accordance with the terms of such license. The
information in this manual is furnished for informational use only, is subject to change without notice, and should not be
construed as a commitment by Network Instruments, LLC. Network Instruments, LLC assumes no responsibility or liability
for any errors or inaccuracies that may appear in this manual. Network Instruments, LLC does not warrant that the hardware
will meet your requirements or that the operation of the hardware will be uninterrupted or that the hardware will be errorfree.
NETWORK INSTRUMENTS, LLC SPECIFICALLY DISCLAIMS ALL OTHER WARRANTIES, EXPRESSED
OR IMPLIED, INCLUDING BUT NOT LIMITED TO, IMPLIED WARRANTIES OF MERCHANTABILITY
AND FITNESS FOR A PARTICULAR PURPOSE. IN NO EVENT SHALL NETWORK INSTRUMENTS, LLC BE
LIABLE FOR ANY LOSS OF PROFIT OR ANY OTHER COMMERCIAL DAMAGE, INCLUDING BUT NOT
LIMITED TO SPECIAL, INCIDENTAL, CONSEQUENTIAL, OR OTHER DAMAGES.
Network Instruments, LLC makes no other warranty, expressed or implied.
Limited Warranty—Software
Network Instruments, LLC will replace defective media or documentation for a 60-day period after the shipment of the
product from Network Instruments, LLC. Should Network Instruments, LLC release a newer version of the software within
60 days of shipment of the product, Network Instruments, LLC will update the copy of the software upon request, provided
request is made by the licensed user within the 60-day period of shipment of the new version. This update may consist of a
CD, or a manual, or both at the discretion of Network Instruments, LLC. User may be charged a shipping fee for updates.
Network Instruments, LLC shall not be liable for material, equipment, data, or time loss caused directly or indirectly by
proper or improper use of the software. In cases of loss, destruction, or corruption of data, Network Instruments, LLC shall
not be liable. Network Instruments, LLC does not take any other responsibility. Network Instruments, LLC does not warrant
that the product will meet your requirements or that the operation of the product will be uninterrupted or that the product
will be error-free.
NETWORK INSTRUMENTS, LLC SPECIFICALLY DISCLAIMS ALL OTHER WARRANTIES, EXPRESSED
OR IMPLIED, INCLUDING BUT NOT LIMITED TO, IMPLIED WARRANTIES OF MERCHANTABILITY
AND FITNESS FOR A PARTICULAR PURPOSE. IN NO EVENT SHALL NETWORK INSTRUMENTS, LLC BE
LIABLE FOR ANY LOSS OF PROFIT OR ANY OTHER COMMERCIAL DAMAGE, INCLUDING BUT NOT
LIMITED TO SPECIAL, INCIDENTAL, CONSEQUENTIAL, OR OTHER DAMAGES.
Network Instruments, LLC makes no other warranty, expressed or implied.
© 2003 Network Instruments, LLC
i
Technical Support
Network Instruments provides technical support:
By phone (depending on where you are located):
US & Countries outside Europe at (952) 932-9899
UK and Europe at +44 (0) 1959 569880
By fax (depending on where you are located):
US & Countries outside of Europe at (952) 932-9545
UK and Europe at +44 (0) 1959 569881
Or by email at:
[email protected]
Network Instruments provides technical support for a period of 90 days after the purchase of the product at no charge. After
the 90-day initial support period, support will only be provided to those customers who have purchased a maintenance
agreement.
Telephone technical support hours are between 9:00am and 5:00pm (CST US) at each office.
Suggestions are welcomed. Many of the improvements made to our products have originated as end user suggestions. Please
submit detailed suggestions in writing to: [email protected] or by fax at: (952) 932-9545. Please submit
any corrections to or criticism of Network Instruments’ publications to: [email protected] or by fax at (952)
932-9545.
End User License Agreement
Network Instruments' Observer products are neither shareware nor freeware. Network Instruments' Observer products are
commercial software and/or hardware products that are subject to international copyright laws.
Upon purchase and registration of the specific Network Instruments’ product, you have a non-transferable right to use the
specific product at one site on one LAN on one personal computer (PC). Additional networks can be monitored by
purchasing additional Probes or Observer licenses which will grant you the right to use additional probes or consoles for
each license purchased. The purchase of a Probe does not include a license for Observer. Should you need additional
Observer consoles, you will need to purchase additional licenses separately.
To install Network Instruments’ Observer on additional PCs or laptops, you will need to purchase an additional Observer
license for each system. If you are installing Probes on PCs or laptops, you will need to purchase a Probe for each system.
Network Instruments’ Observer software and license numbers are the property of Network Instruments, LLC and may not
be copied by any means for purposes other than backup.
After you purchase a Network Instruments software license, you will recieve license and activation numbers. These license
and activation numbers are your proof of purchase. You will need to produce this information for upgrades. You may need to
provide the activation numbers to receive technical support.
This software is licensed as stated above. The license does not constitute ownership of the software, only the right to use the
software.
ii
Network Instruments Observer Reference Guide
Table of Contents
Introduction .................................................................................................. 1
About this Guide.............................................................................................. 1
Installing Observer ..................................................................................... 3
System Requirements..................................................................................... 3
Licensing Observer ......................................................................................... 3
Quick Installation Overview............................................................................. 4
Running Observer or a Probe ......................................................................... 5
Step-by-Step Installation Instructions.............................................................. 5
Probe Installation ............................................................................................ 6
Ethernet Errors By Station and NIC Driver Installation ................................... 6
Network Instruments Hardware Probes and Systems .................................. 13
Main Observer Display ............................................................................ 15
Observer Basics............................................................................................ 16
Running Probes with Multiple Interface Cards .............................................. 28
Uninstalling Observer.................................................................................... 31
The Capture Menu..................................................................................... 33
Packet Capture Mode ................................................................................... 33
The Statistics Menu .................................................................................. 69
Bandwidth Utilization..................................................................................... 69
Efficiency History........................................................................................... 73
Internet Observer Mode (Internet Patrol, Pairs Matrix, IP Subprotocols)...... 76
Network Activity Display................................................................................ 88
Network Errors by Station Mode ................................................................... 93
Network Vital Signs Mode ............................................................................. 95
Pair Statistics (Matrix) Mode ....................................................................... 105
Protocol Distribution Statistics Mode........................................................... 112
RMON Tables ............................................................................................. 115
Router Observer.......................................................................................... 115
Access Points Load Monitor........................................................................ 119
Packet Size Distribution Statistics Mode..................................................... 122
Top Talkers Statistics Mode........................................................................ 125
Utilization History Mode .............................................................................. 132
Utilization Thermometer Mode .................................................................... 137
Web Observer ............................................................................................. 137
Wireless Access Points Statistics ............................................................... 141
Wireless Site Survey ................................................................................... 144
Triggers and Alarms Mode.......................................................................... 148
Configuring Triggers and Alarms ................................................................ 149
FDDI Network Vital Signs............................................................................ 162
Wireless Vital Signs .................................................................................... 163
Network Summary....................................................................................... 165
© 2003 Network Instruments, LLC
iii
Saving and Replaying Saved Statistical Modes.......................................... 166
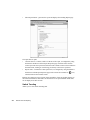
Trending and Analysis Menu ............................................................... 167
Network Trending Mode.............................................................................. 167
WAN Delay Analysis ................................................................................... 186
Application Analysis .................................................................................... 192
The Tools Menu ....................................................................................... 197
Discover Network Names Mode.................................................................. 197
Ping/Trace Route ........................................................................................ 205
Replay Packet Buffer .................................................................................. 207
SNMP Trending Data Manager................................................................... 208
SNMP MIB Editor ........................................................................................ 209
SNMP MIB Walker ...................................................................................... 209
Switch Station Locator ................................................................................ 211
Traffic Generator ......................................................................................... 214
Enterprise Licensing.................................................................................... 216
Edit Switch Scripts ...................................................................................... 217
Define Protocols for Protocol Distribution Statistics .................................... 218
Import/Export Filters.................................................................................... 218
Register Custom Decode DLLs................................................................... 218
Switch Setup Dashboard............................................................................. 219
Select Address Table for Local Observer ................................................... 219
Filter Setup for Selected Probe ................................................................... 219
The Options Menu................................................................................... 233
Observer General Options .......................................................................... 233
Selected Probe or SNMP Device Properties............................................... 257
Actions Menu ........................................................................................... 263
Redirecting Probes...................................................................................... 263
Notifying a Probe User ................................................................................ 263
Adding/Configuring an RMON Probe .......................................................... 263
Adding, Editing, or Deleting an SNMP Device ............................................ 267
Update Switch Scripts ................................................................................. 267
Updating All Probes to Current Observer Version ...................................... 267
Resetting SNMP Device Alarm Counters.................................................... 267
Real-Time Expert ..................................................................................... 269
Overview ..................................................................................................... 269
Getting Started with Expert Analysis........................................................... 270
Using Real-Time Expert .............................................................................. 281
Expert Displays ........................................................................................... 289
Switched Observer ................................................................................ 305
Introduction to Switched Observer .............................................................. 305
Using the Switch Dashboard....................................................................... 309
Switch Scripts.............................................................................................. 312
Switched Modes.......................................................................................... 324
Observer Suite: SNMP Management Console ................................. 329
iv
Network Instruments Observer Reference Guide
SNMP Overview.......................................................................................... 329
Introduction to SNMP Management Console.............................................. 333
Using SNMP Management Console ........................................................... 336
Configuring SNMP Agents .......................................................................... 338
Collecting SNMP Agent Information............................................................ 344
The MIB Editor ............................................................................................ 352
The MIB Walker .......................................................................................... 384
SNMP Technical Overview ......................................................................... 388
Observer Suite: Web Reporting........................................................... 395
Introduction to Web Publishing Service ...................................................... 395
Configuring Web Publishing Service........................................................... 396
Using Web Publishing Service .................................................................... 400
Creating Comparison Reports..................................................................... 413
Observer Suite: RMON Console .......................................................... 415
Introduction to the RMON Console ............................................................. 415
Using the RMON Console........................................................................... 415
RMON Modes ............................................................................................. 416
DICOM Extension .................................................................................... 429
Introduction to DICOM ................................................................................ 429
Capturing Data in Observer’s DICOM Extension ........................................ 430
DICOM Extension Decode Window ............................................................ 433
Troubleshooting ...................................................................................... 437
General Principles....................................................................................... 437
Specific Issues ............................................................................................ 438
How do I connect Observer to a Probe across a Firewall? ......................... 439
Observer Suite Custom Decode Kit.................................................... 441
Introduction ................................................................................................. 441
Warranty...................................................................................................... 441
Installation ................................................................................................... 441
How the Custom Decode API Works .......................................................... 441
Using the Custom Decode Kit ..................................................................... 442
Files Included .............................................................................................. 442
Using Observer from HP OpenView ................................................... 445
Overview ..................................................................................................... 445
© 2003 Network Instruments, LLC
v
vi
Network Instruments Observer Reference Guide
Introduction
About this Guide
Purpose
The Observer Reference Manual comprehensively describes every menu option,
mode, tool and setup dialog in the Observer protocol analyzer. It is intended as a
companion to Installing and Using Network Instruments Observer, which is more
task-oriented, providing tutorials and examples. The content of both manuals is
available in Observer’s online help system.
Intended Audience
This guide is for experienced computer users who are familiar with Microsoft
Windows, TCP/IP networking, and protocol analysis concepts.
Document Conventions
When this document displays a menu path such as File->Save..., it means that you
should choose Save... from the File menu.
Variables are shown in italic type. For example, when the manual states that “The
format of address entries in a .ali file is MACaddress alias,” it means that you must
supply the actual MAC address and alias pairs in that particular order.
Things to Note
•
Observer is shipped with default global options such as: general configuration
options, email options, pager options, and SNMP options (if you have purchased
the SNMP Suite). To change any of these options, go to Options > Observer
General Options.
•
Right-click menus are available throughout Observer. To quickly locate and
execute a command, just right-click and a menu will be displayed.
•
Some modes are available in both non-switched and switched modes. Any notes
for operating the mode in a switched environment are documented along with the
mode.
1
2
Introduction
Installing Observer
System Requirements
Windows PC requirements: Pentium 400 or better with 256MB minimum RAM,
512MB recommended. Display: SVGA running at least 800x600. Operating
System: Windows 2000 or XP.
Licensing Observer
Observer is always distributed and sold in a demo version. The demo mode is
provided so that a potential Observer user can get a feel for the package without
having to purchase it. You can turn a demo version of Observer into a licensed
version with an identification and license number, as described below. Additionally,
depending on which Console you have purchased, your license numbers may activate
any one, several, or all of the available Observer Management Consoles.
Demo mode has two options:
•
Demo data simulation—Observer simulates network traffic and does not require
a network or network hardware to be present.
•
Time limited—Observer’s Packet Capture mode captures live network data for
five seconds, and the statistics modes function and display your network data for
one minute.
The identification and license numbers are unique and can only be used for one copy
of Observer, and will work for only one copy of Observer. The license number will
“turn on” the Observer demo, converting it to an actual Observer which provides
complete functionality.
To turn the demo version of Observer into a fully-functioning licensed version, you
will need to fill out the license dialog with your name (or department) and your
company name to generate your unique customer identification number. To display
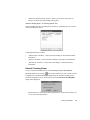
the license dialog, choose File > License Observer from the main Observer window.
Once the licensing information has been filled out, you will need to fax your
company identification number (and possibly arrange for payment depending upon
how you purchased Observer) to Network Instruments to receive your license
number. The license number will turn your demo copy of Observer into a fully
functioning copy of Observer.
3
Network Instruments’ fax numbers are:
•
(952) 932-9545 in the US and outside of Europe, and
•
+44 1959 569881 in Europe and the UK.
Depending on where and how you purchased Observer, you may have a “Right to
Use” (RTU) certificate or a set of activation numbers document. Follow the
instructions on the RTU or the activation number document to license Observer.
Quick Installation Overview
If you’re very familiar with installing programs under Microsoft Windows,
you can use this section for instructions on how to install Observer on
your PC. If in doubt, skip to the step-by-step instructions for the
operating system you are using.
Installing Observer is straightforward: Just run the setup program. Observer can be
installed either from the Observer CD or from the Internet.
Network Instruments recommends that those users with Internet
access download Observer from the Network Instruments’ Web site;
the version published on the Web site is the latest release.
Either:
•
Download the demo from the Network Instruments’ ftp site at
ftp://ftp.networkinstruments.com/pub/demos/obsdemo.exe, or
•
Run the Observer installation program from Windows by putting the Observer
CD in your CD drive and following the instructions on the screen.
Quick Install
If you are upgrading Observer from a previous release, you need not
unininstall the existing version before you install the upgrade.
1.
Setup will ask you to choose a language; select your preferred language and click
on the Next button.
2.
Setup will ask if you want to install Observer, an Advanced Probe, or a RMON
Probe. Select “Observer” and click on the NEXT button.
3.
Setup will ask you which directory you would like Observer installed into.
Unless you have a specific reason to install Observer elsewhere, we
suggest that you install Observer in the default destination.
4.
4
Installing Observer
Check the README.WRI for any late-breaking installation information.
Running Observer or a Probe
You must reboot your PC before you can run Observer (or a Probe). Once rebooted, you
can run Observer or the Probe by double-clicking on the Observer icon in the Observer
group or the (Advanced or RMON) Probe icon from the Network Instruments’
(Advanced or RMON) Probe group.
Step-by-Step Installation Instructions
This describes installing a licensed version of Observer using Microsoft Windows
2000/XP:
Copy the Observer Files to the Windows PC
1.
Start Windows 2000/XP and choose File > Run.
2.
In the Run dialog box, fill in the path to the executable SETUP.EXE (typically
[your CD drive]:\SETUP.EXE).
3.
The initial setup dialog box will ask you to select the installation language.
4.
The Welcome dialog will be displayed. By clicking on the NEXT button, you are
agreeing to the license terms.
Running Observer or a Probe
5
5.
Next, setup will ask if you want to install Observer, Advanced Probe, or RMON
Probe. Select Observer.
6.
Setup will ask where to copy the Observer files. Unless you have a specific
reason to install Observer elsewhere, we suggest that you install Observer in this
default destination.
7.
Setup will copy the Observer files onto your PC.
Probe Installation
For instructions on Probe installation, see the Network Instruments’ Probe manual.
Ethernet Errors By Station and NIC Driver
Installation
To view and process Ethernet station errors, Observer requires that you use a driver
for your network adapter card that has been modified to pass error packets to the
Observer application.
Normally, NDIS drivers only keep track of the number of error packets
seen on a network. The NDIS driver does not process or pass the error
6
Installing Observer
packet in any way. Without some way of passing error packets up to the
operating system or application, there is no way for the operating system
or application to obtain information about the source and nature of the
errors.
Network Instruments has worked with a number of card manufacturers to modify the
standard network card NDIS driver so that it will maintain error counts, and pass error
packets up to Observer for processing. Observer ships with a number of these
ErrorTrak™ drivers. They are located in the Drivers directory on the distribution media,
and are installed to the [usually C:] \Observer Files\Drivers directory during the
installation process.
The Network Instruments’ ErrorTrak™ drivers are modified standard
drivers and work just as the standard driver do, with the one addition that
error packets are passed to Observer.
Please check the Network Instruments’ Web site for more information on supported
network adapter cards:
•
PCMCIA adapters
http://www.networkinstruments.com/html/osup1001.html
•
ISA and PCI adapters
http://www.networkinstruments.com/html/osup1002.html
Installing ErrorTrak™ Drivers under Windows 2000/XP
1.
Open Start > Settings > Control Panel > System > Hardware > Device
Manager.
2.
From the Device Manager tree, open Network adapters and double-click on the
entry for your adapter card.
3.
Choose the Driver Tab and click the UPDATE DRIVER... button.
4.
This will start the Update Device Driver wizard. Select the SEARCH FOR A
SUITABLE DRIVER FOR MY DEVICE option button and click NEXT.
5.
From the next dialog, check the SPECIFY A LOCATION button. Click NEXT.
6.
From the next dialog, browse to the C:\Observer Files
\Drivers\CARD_TYPE\Win2000 directory (where “CARD_TYPE” is the chip set
that you are using—e.g. Intell21143 for NIC cards using the Intel 121143 chip set).
7.
Select the NET2000.INF file and click NEXT. Windows 2000/XP will update the
driver.
Please check the Network Instruments’ Web site for more information on supported
network adapter cards:
•
For ISA and PCI adapters
http://www.networkinstruments.com/html/osup1001.html
Ethernet Errors By Station and NIC Driver Installation
7
•
For PCMCIA adapters
http://www.networkinstruments.com/html/osup1002.html
Wireless NIC Driver Installation
For Observer to properly analyze wireless packets, the driver must pass through all of
the packets, not just those packets addressed to that NIC (i.e., it must put the card in
‘promiscuous’ mode). Observer must also have access to the ‘raw’ wireless packets.
Because standard wireless drivers do not support either raw or promiscuous mode, NI
has written a custom driver so that you can use Observer as a wireless protocol
analyzer.
Before you install the driver, you must:
•
Verify that the NIC is operating correctly with the manufacturer-supplied driver
as described in the manufacturer’s installation instructions. After you’ve made
sure your hardware is functioning, uninstall the manufacturer’s software.
•
Install Observer. See “Step-by-Step Installation Instructions” on page 5. You
must install Observer so that you can update the NIC driver from the Observer
directory.
Important Note For Atheros combo card users:
Do not use Windows to configure your wireless network settings such as
SSID and WEP keys. Use the Network Instruments/Atheros 802.11 Client
Utility (installed in your Observer Program Group along with Observer)
instead. To turn off Windows wireless configuration, right-click on the
network connection and choose Properties. Click on the Wireless Networks
tab and make sure that the Use Windows to configure my wireless network
settings checkbox is left unchecked. See step 12 of this installation
procedure for details.
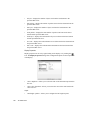
To update the driver, follow these steps:
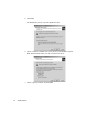
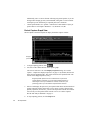
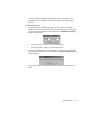
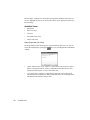
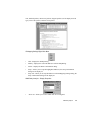
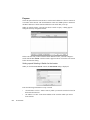
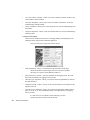
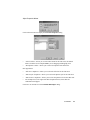
1.
8
Installing Observer
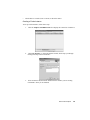
Right-click on the ‘My Computer’ icon and choose Properties.
2.
Click the Hardware tab and then the Device Manager... button to display the
Device Manager:
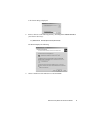
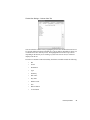
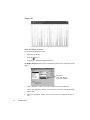
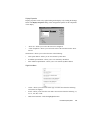
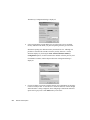
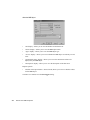
3.
Right-click on the wireless driver (e.g. Nortel Networks e-mobility) and choose
Properties.
4.
Click on the Driver tab and then click the Update Driver... button. This starts the
Update Hardware Wizard:
Ethernet Errors By Station and NIC Driver Installation
9
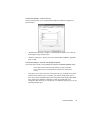
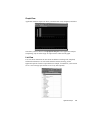
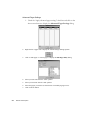
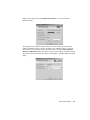
5.
Click Next.
The Wizard asks you how you want to update the driver:
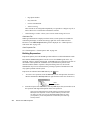
10
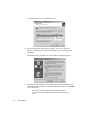
6.
Choose “Search for a suitable driver for my device (recommended)” and click
Next. The Wizard asks where you want to search for the driver:
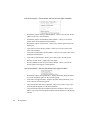
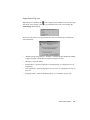
7.
Choose “Specify a location” and click Next.
Installing Observer
A file locator dialog is displayed:
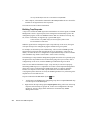
8.
Enter (or browse to) the following directory (assuming that C:\Observer Files is
your Observer directory):
C:\Observer Files\drivers\wireless
The Wizard displays the following:
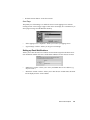
9.
Choose “Install one of the other drivers” and click Next.
Ethernet Errors By Station and NIC Driver Installation
11
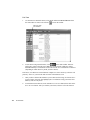
The wizard displays a list of compatible drivers:
10. Choose the appropriate analyzer driver with the “NI” prefix (“NI/Nortel
Networks e-mobility 802.11b Wireless network PC Card,” for example) and
click Next.*
The Wizard informs you that the driver lacks a Microsoft digital signature:
11. Click Yes. Network Instruments has tested the driver and verified that it works
with Windows and with Observer. When the installation is complete, click Finish
to close the Wizard.
Note that you can switch wireless operation between analyzer (i.e.,
“promiscuous”) mode and standard NIC mode without re-installing the
driver.
12
Installing Observer
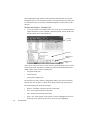
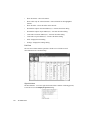
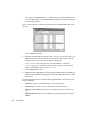
*The table below shows what driver to select for each of the supported
wireless NICs:
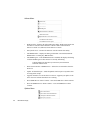
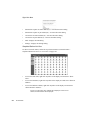
NIC
Analyzer Driver
Symbol Spectrum24 - 41x1 models
NI/Symbol LA-41x1 [or 41x3] Spectrum24 Wireless network PCMCIA [or PCI] Card Driver
Nortel 41x1 models
NI/Nortel Networks e-mobility 802.11b Wireless
network PC [or PCI] Card Driver
Cisco Aironet 340-350 series models
NI/Cisco Systems 340 [or 350] Series PCMCIA
[or PCI] Wireless network Adapter
Intel 2011b models
NI/Intel® PRO/Wireless [or PRO/11 Wireless]
2011 network PC [or PCI] Card Driver
Proxim Harmony and Skyline models
NI/Atheros Based 802.11a Wireless Network
Adapter
Atheros Based AR5001 Combo Cards
NI/Atheros Based 802.11a/b (or a/b/g) Wireless
Network Adapter
Network Instruments Hardware Probes and Systems
Network Instruments offers dedicated hardware kits, probes, and turnkey analyzer
systems to analyze high-traffic gigabit Ethernets and WAN links. Visit
networkinstruments.com to see a current list of hardware options. Refer to the relevant
Network Instruments hardware Installation and Quick Start Guide for installation and
operational details.
Network Instruments Hardware Probes and Systems
13
14
Installing Observer
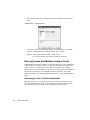
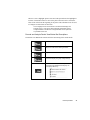
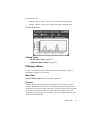
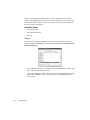
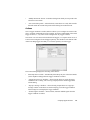
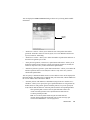
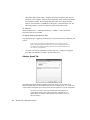
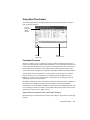
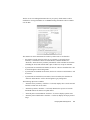
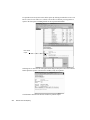
Main Observer Display
The main Observer display includes a number of display components that can be
docked or free floating. Most display areas can be configured to be displayed or
hidden. Right-clicking on most display areas will offer a display configuration menu.
Probe list
Mode commands
Menus
Toolbar
Trace window
Mode displays
Mode tabs
Status bar
Please note that Observer’s main display may vary depending on which functionality
features for Real-Time Expert you have installed and on which views you have
selected from the View menu.
15
Observer Basics
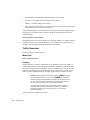
Observer Menus
File Menu
16
•
License Observer—when Observer is not licensed, this displays the Licensing
dialog. If Observer is licensed, the relicense (upgrade) dialog will be displayed
with your current identification and license number. If Observer is licensed, you
will be prompted to relicense your copy of Observer.
•
Select Menu Language—allows you to select a language in which Observer
menus will be displayed. Once you select a different language, you will be
prompted to restart Observer before the changes will take effect.
•
Print Probe List—allows you to print a list of currently-available Probes.
•
Print Trace Window—allows you to print the current trace window.
•
Print Setup—allows you to configure printers for use with Observer.
•
Save Current Observer Configuration—saves the current Observer configuration,
including window position and open modes.
•
Load Comma Delimited File—allows you to load a previously saved statistics
comma delimited file. For example, if you load a Vital Signs data file, the saved
(comma delimited) information will be displayed using Observer’s Vital Signs
mode display.
•
Save Mode in Comma Delimited File—allows you to save the current statistical
modes data in comma delimited format.
Main Observer Display
•
Load and Analyze Observer Capture Buffer—allows you to load a previously
saved packet buffer for analysis by the Decode and Analysis submode of Packet
Capture mode.
•
Save Observer Capture Buffer—allows you to save the present capture buffer in
Observer (.BFR) format.
•
Save Decode as Text—allows you to save the present decode as a text file.
•
Exit—exits Observer.
View Menu
•
Advanced, RMON and SNMP Probe lists—this toggles the left hand display of the
list of Probes. If you have either the SNMP or RMON management consoles, these
will also be displayed in the Probe list. When checked, the Probe list is available
for display. The Probe list display will show all active and nonactive registered
Probes.
•
Show Probe List as a Map—when selected, Observer displays the list of Probes in
the map (versus list) format.
•
Status Bar—toggles the display of the status bar.
•
Tabbed Probe Window—when selected, the workbook tabs (showing each
Observer, SNMP, or RMON mode) are displayed at the bottom of each Probe’s
main display area. Unchecking removes the workbook tabs from the display.
Clicking on a workgroup mode tab will set focus on that mode.
•
Trace Window—when selected, the Probe trace window is displayed at the bottom
of the main Observer window. The Probe trace window shows all Probe-Observer
communication. Unchecking removes the trace window from the display.
•
Getting Started Window—when selected, shows the Getting Started Window,
which helps new users with tips and a simplified interface.
•
Probe List Display Properties—displays the Probe List Display Properties dialog.
•
Toolbar Setup—displays the Toolbar Setup dialog. See “Toolbar Setup – Toolbars
Tab” on page 27.
Observer Basics
17
Capture Menu
•
Packet Capture—displays the Packet Capture mode.
•
Decode and Analysis—displays the Decode and Analysis submode.
Decode and Analysis Submode Menu
•
Load and Analyze Observer Capture Buffer—allows you to load a previously
saved packet buffer for analysis by the Decode and Analysis submode of Packet
Capture mode.
•
Save Observer Capture Buffer—allows you to save the present capture buffer in
Observer (.BFR) format.
•
Save Decode as Text—allows you to save the present decode as a text file.
Statistics Menu
18
•
Activity Display—displays the Activity Display mode for the current network
types. See “Network Activity Display” on page 88.
•
Bandwidth Utilization—displays the Bandwidth Utilization mode. See
“Bandwidth Utilization” on page 69.
Main Observer Display
•
Efficiency History—displays the Efficiency History mode. See “Efficiency
History” on page 73.
•
Errors by Station—displays the Ethernet/Token Ring/FDDI Errors By Station
mode. See “Network Errors by Station Mode” on page 93.
The window’s title, when the mode is displayed, will display the type of
network—e.g., Ethernet, FDDI, or Wireless.
•
Internet Observer (IP Matrix)—displays the Internet Observer mode. See “Internet
Observer Mode (Internet Patrol, Pairs Matrix, IP Subprotocols)” on page 76.
•
Pair Statistics (Matrix)—displays the Pair Statistics (Matrix) mode. See “Pair
Statistics (Matrix) Mode” on page 105.
•
Protocol Distribution—displays the Protocol Distribution mode. See “Protocol
Distribution Statistics Mode” on page 112.
•
RMON Tables—displays RMON Tables; only active if you have selected an
RMON probe.
•
Router Observer (or Access Point Load Monitor when in wireless mode)—displays
the Router Observer mode. See “Router Observer” on page 115.
•
Size Distribution Statistics—displays the Size Distribution Statistics mode. See
“Packet Size Distribution Statistics Mode” on page 122.
•
Summary—displays the Network Summary mode. See “Network Summary” on
page 165.
•
Top Talkers Statistics—displays the Top Talkers Statistics mode. See “Top Talkers
Statistics Mode” on page 125.
•
Utilization History—displays the Utilization History mode. See “Utilization
History Mode” on page 132.
•
Utilization Thermometer—displays the current-time utilization in a graphic display
similar to a thermometer. See “3D Step Chart View” on page 136.
•
Vital Signs—displays the Network (Ethernet/Token Ring//FDDI/Wireless/Frame
Relay) Vital Signs mode. See “Network Vital Signs Mode” on page 95.
•
Web Observer—displays the Web Observer mode. See “Web Observer” on
page 137.
•
Wireless Access Point Statistics—displays statistics on traffic passing through any
Access Points (APs) visible to the Observer wireless NIC. See “Wireless Access
Point Load Monitor” on page 141.
•
Wireless Channel Scan Monitor—starts the Wireless Channel Scan Monitor. See
“Wireless Site Survey” on page 144.
Observer Basics
19
•
Triggers and Alarms—displays the Triggers and Alarms mode. See “Triggers and
Alarms Mode” on page 148.
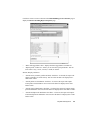
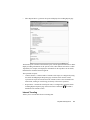
Trending/Analysis Menu
•
Network Trending—displays the Network Trending mode.
•
Start Network Trending Viewer—starts the Network Trending viewing console.
•
Start Web Browser Report—displays the Web Publishing Service window.
•
Application Analysis—displays the Application Analysis Mode, which shows
how various types of servers are performing.
•
Load and Analyze Observer Capture Buffer—allows you to load a previously
saved packet buffer for analysis by the Decode and Analysis submode of Packet
Capture mode.
•
WAN Delay Analysis—displays the WAN Delay Analysis Mode.
Tools Menu
•
20
Discover Network Names—displays the Discover Network Names mode. This is
where you can automatically discover your hard network addresses and alias the
hard addresses to names.
Main Observer Display
•
Ping/Trace Route—opens the Ping/Trace Route window.
•
Replay Packet Buffer—displays the Replay Packet Buffer mode.
•
SNMP MIB Editor—displays the SNMP MIB Editor.
To display SNMP MIB Editor you will need to purchase Network
Instruments’ Observer Suite.
•
SNMP MIB Walker—displays the Walk Agent MIB dialog, permitting the user to
examine an SNMP Agent in detail.
To display SNMP agent information you will need to purchase Network
Instruments’ Observer Suite.
•
SNMP Trending Data Manager—displays the SNMP Trending Data Manager
dialog.
•
Switch Station Locator—displays SNMP-generated list of MAC addresses for
every port on a switch.
•
Traffic Generator—displays the Traffic Generator dialog.
•
Enterprise Licensing—displays the Enterprise Licensing dialog.
•
Edit Switch Scripts—displays the Edit Switch Scripts submenu.
•
Define Protocols for Protocol Distribution Statistics—displays the setup properties
for Protocol Distribution.
•
Import/Export Filter Presets—displays the Import/Export Filter Presets submenu.
•
Register Custom Decode DLLs—displays the Register Custom Decode DLLs
dialog.
•
Switch Setup Dashboard—displays the switch dashboard. This dialog is where all
switch specific configuration is done within Observer.
•
Select Address Table for Local Observer—this displays the dialog to select the
address table for local Observer.
•
Filter Setup for Selected Probe—displays the Filters dialog for the currently active
Probe. If you are using Observer to monitor the local segment, this is the filters
dialog for the local segment. If you are using a Probe with Observer, this dialog
will display the filter for the currently active Probe.
•
Select Network Adapter Card (NIC)—displays the change adapter dialog. This
item is available only on a system with multiple adapters.
Observer Basics
21
Actions Menu
•
Redirect Probe—displays the Probe Redirection dialog. Redirecting a Probe lets
the Observer console connect and direct a Probe’s data to either the local
Observer console or a (different) remote Observer console.
•
Notify Probe User—activates the Observer console-to-Probe chat utility.
•
Add RMON Probe—displays the dialog to add either a Network Instruments’
RMON Probe or a third-party RMON Probe.
•
Add SNMP Agent—if the SNMP Extension is installed, this displays the dialog
to add an SNMP Agent to those Observer is already monitoring.
To display SNMP agent information you will need to purchase Network
Instruments’ Observer Suite.
•
Delete Selected Probe or SNMP Device—deletes the selected Probes from the
Probe list.
•
Update All Switch Scripts—sends all updated switch scripts to any Probes that
are using switch scripts.
•
Upgrade All Probes to Current Observer Version—upgrades your probes to the
same version of software that Observer is running.
•
Reset SNMP Device Alarm Counters—resets the SNMP device alarm counters.
•
Reset All SNMP Devices Alarm Counters—resets all SNMP device alarm
counters.
Options Menu
22
Main Observer Display
•
Observer General Options—displays the Observer General Options dialog. These
options include general Observer options and options for email and pager
notification, as well as SNMP general configuration information.
•
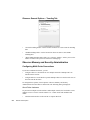
Observer Memory and Security Administration—displays the dialogs that let you
set up users and passwords, and configure memory usage of Observer and Probes.
•
Selected Probe or SNMP Device Properties—displays the Probe Options dialog,
including Probe settings and Probe parameters (displays the current network
adapter information from the perspective of Observer’s driver). See “Selected
Probe or SNMP Device Properties” on page 257.
•
Web Reporting Configuration—if Observer is licensed for the Web Extension, this
item will display the Web Extension configuration.
To display Web reporting information you will need to purchase Network
Instruments’ Observer Suite.
Window Menu
•
Cascade—displays the standard Windows cascade option.
•
Tile Horizontally—displays the standard Windows tile horizontally option.
•
Tile Vertically—displays the standard Windows tile vertically option.
•
Arrange Icons—arranges any iconified windows at the bottom of the display.
•
Close All Mode Windows—closes all (current Probe) open mode windows.
•
Display of all open modes (in this menu Packet Capture, Bandwidth Utilization,
and Internet Observer modes are open).
Observer Basics
23
•
Windows—opens the Windows dialog that displays all open modes.
Help Menu
•
Contents—displays the Help files contents.
•
Search Help—displays the Help system word search function.
•
How to Use Help—displays Help information on Windows help.
•
About Observer—displays the Observer “About” dialog, which includes version
numbers, licensing status information, and a list of the Extension(s) that
Observer is licensed for.
Observer Toolbars
By default, Observer displays three toolbars: Modes, Settings, and Actions.
Observer’s toolbars can be customized. See “Customizing Toolbars” on page 27.
Start Modes Toolbar
Each of Observer’s modes are accessible through the main menu display. Some
modes are accessible via the Start Modes toolbar.
Mode icons are described below.
Load and Analyze Observer Capture Buffer
Start Network Trending Viewer
24
Main Observer Display
WAN Delay Analysis
Start Web Report
Packet Capture
Bandwidth Utilization
Internet Observer
Top Talkers Statistics
Protocol Distribution
Network Trending
Settings Toolbar
You can decide the look of certain mode views and you can choose the general settings
of Observer.
Each of Observer’s settings is accessible through the toolbar menu or the icons on the
toolbar.
Discover Network Names
Local Address Table Select
Probe Filter Setup
Select Network Adapter
Switch Dashboard Setup
Start Ping/Trace Route Utility
Show MIB Editor
Walk Agent MIB
Actions Toolbar
Observer Basics
25
Each icon launches a certain action.
Actions are described below:
Redirect Probe
Notify Probe user—when connected to a
remote Probe.
RMON Probe Configuration
Network Device Properties
Delete Probe(s)
Mode Commands Toolbar
All of Observer’s modes share some common buttons on the toolbar located at the top
of each display window. Each icon’s function is listed below.
Start capturing packets or statistics.
Stop capturing packets or statistics
without clearing the display.
Stop capturing packets or statistics and
clear the display.
Select from one of the available views,
which differ according to the current
mode:
View decoded packets
Displays the Tools menu, from which you
can Save, Print, and change display
Properties such as colors and graph
styles.
Toolbar Setup
You can customize Observer toolbars, which will allow you to quickly move from
mode to mode without the need to navigate the menu system. You can also easily
restore the default toolbars. See “Customizing Toolbars” on page 27.
26
Main Observer Display
Moving Buttons
To move buttons from the main Observer display, drag the button and drop it in the
desired location while holding down the Alt key.
Deleting Buttons
To delete a button, drag the button from the toolbar while holding the Alt key and drop
it anywhere except on a toolbar.
Customizing Toolbars
To start a configuration session, select View > Tool Bar Setup. The Customize dialog
will be displayed.
Toolbar Setup – Toolbars Tab
Toolbars checkboxes—check any box to display the corresponding toolbar; uncheck a
box to hide the toolbar:
•
•
Statistics, Analysis and Trending
•
Tools
•
Actions
“Show ToolTips” checkbox—when selected, displays a help balloon on each
button when the mouse pointer is placed over the button. This can be toggled off or
on.
It is recommended that this option be left on.
•
“New Look” checkbox—allows you to select the look of the buttons from a flat
look or a 3D look.
•
New button—allows you to create a new, empty toolbar.
Observer Basics
27
•
Reset button—allows you to reset the currently-selected button to its original
values.
Toolbar Setup – Commands Tab
•
Categories—allow you to select the category for which buttons are available:
Analysis, Capture, Statistics, Trending, Actions, Tools, Options.
•
Buttons—displays the buttons available in each category.
Any button can be added to any toolbar, regardless of the category.
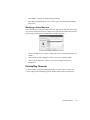
Running Probes with Multiple Interface Cards
With MultiProbe licensing (available as a software Probe option or as a standard part
of Expert Observer or Observer Suite), you may run more than one instance of the
Probe software on a single machine, associating each instance with a separate
network interface card. This allows you to view two or more separate local interfaces
concurrently (for example, a local Ethernet and Wireless interface, or two local
Ethernet interfaces). See “Managing MultiProbe Instances” in your Probe manual for
details.
Displaying the List of Probes in Map Mode
Map mode allows you to view your list of probes on top of a map that may reflect
your geographical network layout or your topological network layout. Map mode
provides an alternate way to view the list of probes in a freeform layout.
28
Main Observer Display
Activate Map mode by selecting View > Show Probe List as a Map.
Once a Probe is displayed on the map, you will need to place the Probe in the desired
location on the map. Click and drag a Probe icon to move it on the map.
Customizing the Probe Map
When the list of Probes is in map format, you can display your network graphically,
either geographically or topologically, with respect to the positions of the Probes. The
size of the network map can be bigger than the window, in which case you may move
around the map using the horizontal and vertical scroll bars.
You can use one of the maps provided or import your own map in BMP or DIB format.
If you choose to use your own map, copy the bitmap into the
C:\Observer Files\MAPS directory. Observer supports two-color, 16-color, 256-color,
or 24-bit full-color bitmaps (if supported by your monitor/adapter). Observer includes a
number of geographical maps.
To select a map, right-click anywhere on the Map and select the “Modify Map Display
Properties” menu item. This will display the Map Setup dialog.
•
“Map background bitmap” textbox—the current map name.
•
Select button—allows you to select the bitmap to use for the Probe; only active if
“Show background bitmap” checkbox is selected.
•
“Show background bitmap” checkbox—allows you to select to view the bitmap as
a background image.
Running Probes with Multiple Interface Cards
29
Map sizes and color:
•
“Horizontal size” textbox—allows you to select the horizontal size of the map.
•
“Vertical size” textbox—allows you to select the vertical size of the map.
•
“Background color” dropdown—allows you to enter the map background color.
•
“Lock map objects” checkbox—allows you to lock in place all map objects so
they cannot be (mistakenly) moved.
•
Note—allows you to enter any notes you may want to keep about the map.
Map Probe List Right-Click Menu
•
Modify Map Display Properties—displays the Map Setup dialog.
•
Modify Probe or SNMP Device Display Properties—allows you to modify the
Map Probe settings; only active if you have selected a map probe item. See
“Modifying a Probe Map Item” on page 31.
•
Insert Line—displays the Line Description dialog.
“Line Thickness” dropdown—allows you to select the line thickness.
“Line Color” dropdown—allows you to select the line color.
•
Insert Text—displays the Describe Text dialog.
“Text” textbox—allows you to enter the “Describe” text.
•
30
Insert Rectangle—displays the Shape Description dialog.
Main Observer Display
•
Insert Ellipse—displays the Shape Description dialog.
•
Show Probe and SNMP Devices List—allows you to view the Probe and SNMP
Devices list.
Modifying a Probe Map Item
When new Probes are displayed in map mode, they appear in the upper left corner of the
map. You can change how Probes are displayed by right-clicking on the Probe map item
and selecting “Modify Probe or SNMP Device Display Properties.”
•
“Probe or SNMP Device” textbox—displays the name of the Probe map item; not
editable.
•
“Select picture bitmap” dropdown—allows you to select a picture bitmap.
•
“Picture shape” dropdown—allows you to select the shape of the Probe’s
background.
Uninstalling Observer
Observer includes a complete uninstalling facility. To remove Observer from your
system, simply run the uninstall program by double-clicking on the Uninstall icon.
Uninstalling Observer
31
32
Main Observer Display
The Capture Menu
Packet Capture Mode
Packet Capture mode captures network traffic and stores the data for later viewing in
the Packet View Decode window. Packet capture is also used to view specific packets
during a network conversation. From looking directly at the information being sent
and the specific reply, you can often get a clear view of a problem or of an incorrect
communication.
Once the packets are captured, they can be viewed and analyzed in the Decode and
Analysis submode of Packet Capture mode. This is true for “live captures” (captures
that happen in real time) where Observer captures and saves traffic on the local
segment or uses a Probe to capture and save traffic on a remote segment, and for
analysis of saved.BFR buffer files, in which the local copy of Observer can be used to
examine and analyze packets captured by any copy of Observer.
Packet Capture is available in graph, dial, list, 3D, and pie views.
Packet Capture Setup Options
The Packet Capture Setup dialog is where buffer and packet specific options are set.
You can access the Packet Capture Setup dialog by selecting Capture > Packet
33
Capture and then clicking on the Settings button. The Capture Setup dialog will be
displayed.
•
“Capture Buffer size (Kilobytes)” textbox—allows you to set the amount of
Windows memory that Observer will set aside to store captured packets. Values
are in kilobytes. For example, a 2048 KB buffer would represent a 2.048 MB
buffer.
Observer will show the buffer percentage full and give you an idea of what the
best buffer size is for a particular situation. Keep in mind that a full 4 MB buffer
is a lot of data to sort through. You will want to capture an event in as little time
with as little buffer space as possible.
Observer has no limitations on the amount of RAM that can be used for a buffer.
The maximum allowable buffer size is displayed in Options > Selected Probe
or SNMP Device Properties and then clicking on the Probe Parameters tab. The
following formulas are used to calculate the maximum allowable buffer:
For Windows 2000/XP
Maximum Buffer Size = (Total Physical Memory-18MB) *.4
It is not recommended that you use Observer to view packets going to
or coming from the Observer PC. If you need to look at the traffic
to/from the Observer PC, install Observer on another PC. There are
many reasons why this is not a good idea but, in general, you will see
varying amounts of your own data with a protocol analyzer on your own
PC. This is due to the architecture of the PC and the inability of
34
The Capture Menu
Windows to multi-task the receiving and analysis of the data going and
coming from the Observer PC.
•
Do not include traffic from Observer/Probe local MAC address—excludes packets
sent and received from the station running Observer or Probe (the MAC address of
the station from which you are capturing packets).
•
“Include Expert Load information marker frames” checkbox—When checked,
Observer will not strip out the timestamp informational markers used by Expert
Time Interval and What If analysis modes. Leave this box unchecked unless you
intend to use these modes.
•
“Use circular packet buffer” checkbox—allows you to choose the buffer as fixed or
circular (first in, first out).
•
Fixed buffers—capture packets until the size of all of the captured packets is
equal to the size of the buffer defined. At that time, Observer stops capturing
packets and can no longer accept any new packets until the buffer is cleared.
•
Circular buffers—when the packet capture buffer fills, Observer will write
new packets to the end of the buffer and discard packets from the start of the
buffer. Using this feature allows you to continually run a packet capture, and
once the event of interest takes place, you can immediately go to the Observer
station and have the event recorded. You can record the event regardless of
how long and how much network activity preceded the event. The circular
buffer also allows you to save the buffer to sequentially labeled multiple files
(see below).
Saving the buffer to a file or files while capturing using a circular buffer:
•
“Save packets to a file while capturing using a circular packet buffer” checkbox—
When checked, causes Observer to use a “FIFO” (first in, first out) buffer for
packet capture.
•
“Maximum file size (MB)” checkbox—Specify the largest file you want written
out to your hard disk. The valid range is from 1MB to 2000MB.
Saving partial packets:
•
“Enable capturing partial packets” checkbox—by default, Observer will capture
the entire packet. This option allows you to define a specific amount of each packet
to capture to the buffer. For example, a setting of 64 bytes will result in Observer
only capturing the first 64 bytes of every packet.
Most of the pertinent information about the packet (as opposed to the information
contained in the packet) is at the beginning of the packet, so this option allows you
to collect more packets for a specific buffer size by only collecting the first part of
the packet.
Packet Capture Mode
35
Additionally, since it is more efficient collecting only partial packets, if you are
having trouble keeping up with your bandwidth, setting this to a lower number
will help keep CPU utilization (per captured packet) at a minimum.
•
“Partial packet header size” spinbox—indicates the actual number of bytes per
packet Observer will capture. Minimum = 16; maximum =10,000.
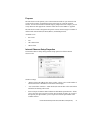
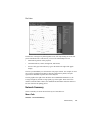
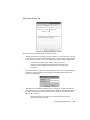
Packet Capture-Graph View
Select Capture > Packet Capture to display the Packet Capture window.
Dropped
packets
1.
To begin capturing packets, click
.
2.
You will see three different lines on the capture graph.
The color of each line is set in the Display Properties dialog. See “Packet
Capture – Graph View Display Properties” on page 37. By default, the blue line
shows the non-captured traffic. The yellow line shows the captured traffic. The
red line shows dropped packets (if any).
Dropped packets represent an error condition that is not part of the
normal operation of Observer. If you are seeing dropped packets you
should begin to check your hardware for conflicts, or make sure your
processing power is up to the minimum requirements of Observer.
36
3.
Observer will display the percent of your capture buffer that is full, the number of
packets captured, and the current filter (if any). Once you have captured some
quantity of packets (at least one), you can view the packets with the VIEW button.
You can only save the packet buffer from the viewer. See “Packet CaptureDecode and Analysis Submode” on page 37.
4.
To stop capturing packets, click the Stop button.
The Capture Menu
5.
To clear the capture buffer and stop the capture, click the CLEAR button.
6.
To view captured packets, click the Decode button.
In most cases, Packet Capture is more useful if you apply appropriate
filters (Tools->Filter Setup for Selected Probe). See “Filter Setup for
Selected Probe” on page 219.
Packet Capture – Graph View Display Properties
Click Settings and the tab for the type of graph or chart for which you want to set the
display properties:
•
“Item” dropdown—allows you to select which item will be configured.
•
“Item color” dropdown—allows you to select the color of the display item.
•
“Item plot” dropdown—allows you to select the item to be displayed as Lines or
Bars. This dropdown will only be active if “Lines” is selected in the “Item plot”
dropdown.
•
“Item line thickness “dropdown—allows you to select the thickness of the
displayed item (in pixels).
•
Graph Time option buttons—allows you to set how the “X” axis will be displayed.
Clock time will show times using a 24-hour clock (i.e., the current time). Relative
time will display times from the start of the activation of the mode.
Packet Capture-Decode and Analysis Submode
The Decode and Analysis submode of Packet Capture mode is where the captured
buffer is decoded and the packet conversations can be examined and analyzed in detail.
Additionally, the Decode and Analysis submode of Packet Capture mode is where two
Packet Capture Mode
37
other independent modes, Ethernet Vital Signs and Collision Expert are accessed,
enabling the user to view an Ethernet network’s vital signs and more specifically test
for collisions that may be caused by a malfunctioning NIC card somewhere on the
network.
Decode and Analysis – Decode View
1.
To view the packets in the capture buffer, click on the VIEW icon from the Packet
Capture button bar or select Capture > Packet Capture, click on the Decode
button, and then click on the Decode tab.
Packet
header
Decode
Raw packet
display
Navigation
tabs
Once you are in the view screen, you can click on a particular packet (with your left
mouse button) in the top window to display the packet decoded information in the
middle window. There are three window panes:
•
the packet header pane.
•
the decode pane.
•
the raw packet display pane.
The three panes are fully sizable by dragging the borders up or down. Packets that
Observer does not recognize are shown in raw mode in the decode and raw panes.
The packet header pane shows the following:
38
•
Packets—the number of packets currently in the buffer.
•
First—the first packet number in the buffer.
•
Last—the last packet number in the buffer.
•
Offset—the “offset” display is only shown if you have highlighted a section of
the decode screen. When a section of the decode screen is highlighted,
The Capture Menu
Observer’s active highlight option is activated. This option shows the highlighted
sections of actual data in the raw area of the packet decode screen as well as the
offset of the value from the beginning of the packet. This information can be used
to configure an offset filter for that value.
You can highlight an item of the decode in the Raw Packet Display area
and right-click on it. Two options will be displayed: Start Packet Capture
on Segment/Offset or Create Filter on Segment/Offset. These options are
only available in this area.
Decode and Analysis Packet View Button Bar Descriptions
The Packet View Button Bar controls all of the functioning of the decode mode.
Start mode
Stops the mode without clearing the buffer.
Stops the mode and clears the buffer.
Access the display and graph settings dialogs.
Access the view menu, which lets you select
how stations are identified in the display. You
can display stations by:.
Packet Capture Mode
39
Access a dropdown menu from which you can:
.
Saving Capture Buffers and Decodes
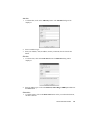
•
Save Capture Buffer—displays the Save Packet Capture dialog.
Clicking on the
Advanced button
will display these
additional fields
The Save Packet Capture dialog contains the following items:
•
Display of captured packets.
•
“First packet” textbox—allows you to set the first packet in the capture
buffer to be saved to the file. By default, this is packet 1.
•
“Last packet” textbox—allows you to set the last packet in the capture buffer
to be saved to the file. By default, this is the last packet in the capture buffer.
ADVANCED button—configures the advanced saving features.
40
The Capture Menu
•
“Append packets to existing file” checkbox—when selected, allows you to add
packets to the existing file.
•
“Replace hardware address in all saved packets” checkbox—when selected,
enables hardware address substitution in the saved buffer.
•
“Original address” dropdown—allows you to determine which hardware
address will be searched for during the replacement. The hardware address
must be entered manually the first time it is used. Observer will remember ten
previously-entered addresses. This box is only enabled when the “Replace
hardware address in all saved packets” checkbox is selected.
•
“New address” dropdown—allows you to determine which hardware address
will be replaced during the replacement. The hardware address must be
entered manually the first time it is used. Observer will remember ten
previously-entered addresses. This box is only enabled when the “Replace
hardware address in all saved packets” checkbox is selected.
As the changes are made in the saved buffer file, and not in the buffer
loaded into Observer, in order to change several hardware addresses, it
will be necessary to change while saving and then reload the buffer file for
each subsequent change.
•
Save Packet Buffer in Sniffer® Format—displays the Save Packet Capture dialog
to save the current Observer packet buffer in Sniffer® format. This is useful for
sites that require the sending of Observer capture buffers to Sniffer® users for
viewing or analysis. The following extensions will be used (depending on the type
of buffer being saved):
*.enc—for Ethernet captures
*.trc—for Token Ring captures
*.fdc—for FDDI captures
*.cap—for CAP formats
You can read a Sniffer® formatted buffer by selecting “Load Capture
buffer in Sniffer® format” from the main Observer “File” menu item.
•
Save Decode as Text—displays the Save Decode as Text dialog and allows you to
save the current packet buffer to a text file. This differs from “Save Capture
Buffer” in that it will save the buffer in text format (to be viewed by a text editor),
where the option under “Save Capture Buffer” saves the packet buffer in
Observer’s buffer format for the Observer viewer to read at a later date. You will be
given a choice of packet numbers to print. The default is set for all captured
packets. However, if after reviewing a packet’s contents in the “View Packets”
Packet Capture Mode
41
dialog you are interested in some particular section of the capture, you can
specify only that section.
•
“First packet” textbox—allows you to set the first packet in the capture
buffer to be saved to the file. By default, this is packet 1.
•
“Last packet” textbox—allows you to set the last packet in the capture buffer
to be saved to the file. By default, this is the last packet in the capture buffer.
Save information format (must select one):
•
COMMENTED HEADERS option button—if selected, saves the commented
headers)
•
RAW PACKETS option button—if selected, saves the raw packets.
•
COMMENTED HEADERS + RAW PACKETS option button—if selected, saves the
commented headers and raw packets.
•
COMMA DELIMITED HEADER INFORMATION option button—if selected, saves
the comma delimited header information.
•
COMMA DELIMITED HEADER INFORMATION WITH PACKET SUMMARY option
button—if selected, saves the comma delimited header information with the
packet summary.
Address display mode (must select one):
•
USE ETHERNET ADDRESSES option button—if selected, displays the Ethernet
address.
•
USE ALIASES IN ETHERNET HEADERS option button—if selected, displays the
aliases in the Ethernet headers.
Printing the Decode
The default print option is set to print all captured packets; however, you can choose
from many print options. You can choose to print commented or raw packets or both,
42
The Capture Menu
which can be most useful for a programmer analyzing packet details in depth. You can
have Observer print Ethernet addresses or aliases as the printed headers.
You can also choose whether Observer will print packets continuously or print each
packet on a single page. (Providing that length of a packet allows it, every new
packet will always start printing on a new page.)
•
Once you have made your print option selections, click on the PRINT button.
•
Print Setup—displays the Print Setup dialog.
Adding and Viewing Decode Header Comments
When viewing a saved capture buffer, there is are options to add and view comments.
To add a comment to a packet that hasn’t yet been commented, right-click on the packet
and choose Add Comment... from the popup menu. The Packet Comment dialog is
displayed:
This same dialog is displayed when you select View Comment... after right-clicking a
packet header that is already commented. The Edit Comment, when checked, allows
the person viewing the comment to make additions or changes to the comment text.
Packet Capture Mode
43
To delete a comment from a packet header, right click the header and choose Delete
comment... from the popup menu.
Finding Packets within the Decode
Click the Tools button on the Decode window’s button bar and select Find Packet to
display the Find Packet Contents dialog. Here, you can set options to search the
capture buffer in whatever format and for whatever string you specify.
Multiple instances of the Find Packet dialog can be active at one time.
To activate the multiple instance search, start one search and choose
Tools > Find Packet again without closing your first search—both will
remain active.
Search string format:
•
TEXT option button—if selected, interprets the buffer as text and searches for
the given sequence. A maximum of 16 characters are allowed in the string.
•
HEXADECIMAL option button—if selected, interprets the buffer as
hexadecimal code and searches for the given sequence of codes (separated
by spaces; e.g., C0 FF CC). The maximum value for a code is FF.
•
DECIMAL option button—if selected, interprets the buffer as decimal code
and searches for the given sequence of codes (separated by spaces; e.g., 102
90 87). The maximum value for a code is 255.
•
“Find Sequence” textbox—allows you to enter the exact string of characters
or codes to search for.
Direction:
44
The Capture Menu
•
DOWN option button—Search forward through the buffer.
•
UP option button—Search backward through the buffer.
•
“Search on offset” checkbox and textbox—allows you to define a specific
offset to start your search.
PostFilter
•
Choose PostFilter from the Decode window’s Tools menu to re-filter a captured
buffer or saved buffer using a different filter profile and displays the Select
Postfilter Profile dialog.
•
To select a filter profile, highlight the profile in the tree display.
•
If you click on the EDIT PROFILE button, the Filter dialog will be displayed.
Decode and Analysis – Packet View Settings Setup Properties
Packet View Settings – General Tab
•
“Set focus on the last packet” checkbox—causes the tabular packet display to set
focus on the last (rather than the first) packet in the capture, allowing you to see the
most recently captured information.
This is particularly useful when viewing a capture live where the user
wishes to examine data as it arrives.
Packet Capture Mode
45
•
“Expand 2nd level trees” checkbox—when selected, causes the tree decode
display to expand all second level trees.
•
“Expand 3rd level trees” checkbox—when selected, causes the tree decode
display to expand all third level trees.
•
“Expand 4th level trees” checkbox—when selected, causes the tree decode
display to expand all fourth level trees.
•
“Use EBCDIC for displaying SNA data (use ASCII otherwise)” checkbox—in
the event that the packet contains SNA (Service Network Architecture) data,
selecting this box causes Observer to use EBCDIC (Extended Binary-Coded
Decimal Interchange Code) for representing characters as numbers when
displaying SNA data. EBCDIC is used almost exclusively on IBM computers.
•
“Use EBCDIC for displaying all data (use ASCII otherwise)” checkbox—when
selected, Observer uses EBCDIC (Extended Binary-Coded Decimal Interchange
Code) for representing characters as numbers when displaying all data. EBCDIC
is used almost exclusively on IBM computers.
•
“Bytes Per Row in Hexadecimal Display” radio buttons—Choose 16 or 10 bytes
per row.
•
Packet timing display resolution dropdown—allows you to select the packet
timing display resolution.
Packet View Settings – Custom Application Ports Tab
•
46
The Capture Menu
“Auto determine protocols by bit patterns” checkbox—when selected, Observer
will attempt to analyze the RTP and RTCP packets and automatically use the bit
patterns to attempt to determine which protocols are contained in the capture
buffer.
•
“Assign protocols to dynamically assigned port numbers” checkbox—when
selected, allows you to manually assign port numbers to dynamic port-based
protocols.
Create an Assignment
1. To create an assignment, right-click on the protocol you wish to assign port
numbers to and select the ADD PORTS button. If you already have a port assigned,
you may also click on the MODIFY PORTS button. The Add/Modify Port Range
dialog will be displayed:
•
“First Port” spinbox—allows you to select the first port.
•
“Last Port” spinbox—allows you to select the last port.
2.
To delete an assignment, click on the assignment or protocol to be deleted, rightclick, then click on the DELETE ALL PORTS button. A Delete Confirmation dialog
will be displayed:
3.
To execute the deletion, click the YES button. To abort the deletion, click the NO
button.
Packet Capture Mode
47
Packet View Settings – IPv6 Tab
You can select from the following option buttons:
48
•
Compressed hexadecimal
•
Not compressed hexadecimal
•
Compressed IPv4 compatible
•
Not compressed IPv4 compatible
•
Decimal “.” separated
The Capture Menu
Packet View Settings – Column Order Tab
You can select the column order by highlighting an item (the checkbox does not have to
be selected) and then clicking on the BEFORE or AFTER button, depending on where you
would like the item to fall on your list. The highlighted item will move up or down
depending on the button you are clicking. If you do not select an item, it will not be
displayed on the list.
Decode List Columns Order and Visibility checkboxes available include the following.
•
Pkt
•
Source
•
Destination
•
Type
•
Summary
•
Diff. Time
•
Day Time
•
Relative Time
•
Size
•
BEFORE button
•
AFTER button
Packet Capture Mode
49
Packet View Settings – Protocol Colors Tab
•
Text Color button—displays the Color dialog allowing you to select the text
color.
•
Background Color button—displays the Color dialog allowing you to select the
background color.
Packet View Settings – Decode SNMP MIBs Tab
Allows you to select the compiled MIB files you would like to decode. It is best to
only select the MIBs that are necessary to save memory and shorten the load time.
See “The MIB Editor” on page 352.
50
The Capture Menu
Packet View Settings – Protocol Forcing
Protocol forcing allows you to examine packets that have unknown or proprietary
packet headers.
•
“Enable Protocol Forcing” checkbox—selecting this box allows you to enter the
desired protocol type and the offset.
•
“Protocol” combo box—allows you to select from IP, IPX, NetBIOS, AppleTalk,
TCP, or UDP.
Decode and Analysis – Decode View Display Properties
This menu choice and the corresponding button displays the Protocol Colors dialog.
You can also access this dialog by single-clicking your right mouse button
on any packet line in the List Of Packets (the top part of the View Packets
screen).
•
This allows you to choose the color of the packet line you would like to associate
with the selected frame type. For example, you could set all IP packet types to
show with a white background and a green foreground, while displaying all IEEE
802.3 packet types (NetWare’s default) as a white foreground with a red
background. This can help you visually pick out a particular packet type if you are
capturing multiple types.
Packet Capture Mode
51
Decode and Analysis – Packet Header and Decode Panes Right-Click Menu
•
Start Packet Capture on Source Station Address—allows you to start the packet
capture on the source station address.
•
Start Packet Capture on Destination Station Address—allows you to start the
packet capture on the destination station address.
•
Start Packet Capture on Station Pair—allows you to start the packet capture on
station pair.
•
Create Filter on Source Station Address—allows you to create a filter on the
source station address.
•
Create Filter on Destination Station Address—allows you to create a filter on the
destination station address.
•
Create Filter on Station Pair—allows you to create a filter on a station pair.
•
Packet List Color Setup—displays the Color dialog.
•
Set Decode Relative Time Origin to Selected Packet—allows you to set the
decode relative time origin to a selected packet.
Decode and Analysis – Decode (Raw Packet Pane) Right-Click Menu
52
•
Start Packet Capture on Segment/Offset—displays the Filters dialog and allows
you to start the packet capture on the selected segment.
•
Create Filter on Segment/Offset—displays the Filters dialog and allows you to
create a filter on the selected segment.
•
Copy Hexadecimal Selection to Clipboard—allows you to make a copy of the
selected segment and paste it in the desired location.
•
Copy Hexadecimal Selection in Address Format to Clipboard—allows you to
make a copy of the selected segment in address format and paste it in the desired
location.
The Capture Menu
Decode and Analysis – Summary View
Summary View gives summary information on the packets contained in the capture,
whether it is a live capture or a .BFR file being examined. To go to the Summary view,
click on the “Summary” navigation tab at the bottom of the Decode and Analysis
window.
Capture
Attributes
Size
Distribution
Errors
Protocols
Navigation
tabs
In Summary View, the Decode and Analysis window contains a browsable tree of
Capture Attributes, Size Distribution, and Errors and Protocols. Additional branches
may be available depending on the type of network being analyzed (Wireless Data
Rates are summarized, for example).
Decode and Analysis – Protocols View
Decode and Analysis Protocols View is similar in appearance and function to Protocol
Distribution Statistics mode. The difference between Decode and Analysis Protocols
view and Protocol Distribution Statistics mode is that the display is static (reflecting the
distribution of protocols in the capture buffer) rather than, as with Protocol Distribution
Statistics mode, dynamic (reflecting an ongoing, updated distribution of what is
happening on the monitored segment).
While the numerical display in Protocol Distribution Statistics mode is updated as
Observer receives new data, in Protocols View in Decode and Analysis, the display will
only change when a new capture is loaded into the buffer, or a new filter is applied to
the present capture.
To view Decode and Analysis – Protocols View, click on the “Protocols” navigation tab
at the bottom of the Decode and Analysis window.
Packet Capture Mode
53
The selection bar can be used to determine whether All, IP and its subprotocols, or
IPX and its protocols will be displayed. If IP or IPX is used, the subprotocol
percentage will be calculated based on that protocol, and not on total packets.
Decode and Analysis Protocols – List View
In Decode and Analysis Protocols – List View, the Decode and Analysis window
displays a list of the protocols used in the capture.
•
Protocol—the name of the protocol or subprotocol used.
•
Packets—the total number of packets in the protocol captured.
•
%Packets—the percentage of the total captures that were sent in the specified
protocol.
•
Bytes—the total number of bytes in the protocol captured.
•
%Bytes—the percentage of the total bytes that were sent in the specified
protocol.
•
%Util—the percentage bandwidth utilization being sent in the specified protocol.
Decode and Analysis Protocols – List View Display Properties
There are no display properties for the List View.
54
The Capture Menu
Decode and Analysis Protocols – List View Right-Click Menu
•
Expand All—allows you to expand all branches.
•
Close All—allows you to close all branches.
•
Expand Branch—allows you to open the branch.
•
Close Branch—allows you to close the branch.
•
Show Subprotocols of—not active.
•
Go to Higher Level Protocol—not active.
•
Display Properties—not active.
Decode and Analysis Protocols – 3D Column Chart View
Decode and Analysis Protocols – 3D Chart View Display Properties
Packet Capture Mode
55
Data:
•
“Maximum items” spinbox—allows you to set the maximum items to be
displayed.
Graph:
•
“3D depth” spinbox—allows you to set the 3D depth of the displayed item.
•
“3D angle” spinbox—allows you to set the 3D angle of the displayed item.
Decode and Analysis Protocols – Pie View Right-Click Menu
56
•
Expand All—allows you to expand all branches.
•
Close All—allows you to close all branches.
•
Expand Branch—allows you to open the branch.
•
Close Branch—allows you to close the branch.
•
Show Subprotocols of—not active.
•
Go to Higher Level Protocol—allows you to proceed to the higher level protocol.
•
Display Properties—activates the Display Properties dialog.
The Capture Menu
Decode and Analysis Protocols – Pie View
Decode and Analysis Protocols – Pie View Display Properties
Data:
•
“Maximum items” spinbox—allows you to set the maximum items to be displayed.
Graph:
•
“3D depth” spinbox—allows you to set the 3D depth of the displayed item.
•
“3D angle” spinbox—allows you to set the 3D angle of the displayed item.
Packet Capture Mode
57
Decode and Analysis Protocols – Pie View Right-Click Menu
•
Expand All—allows you to expand all branches.
•
Close All—allows you to close all branches.
•
Expand Branch—allows you to open the branch.
•
Close Branch—allows you to close the branch.
•
Show Subprotocols of—not active.
•
Go to Higher Level Protocol—allows you to proceed to the higher level protocol.
•
Display Properties—activates the Display Properties dialog.
Decode and Analysis – Top Talkers View
Top Talkers View in Decode and Analysis is similar in appearance and function to
Top Talkers mode. The difference is that the display is static, reflecting the
distribution of packets among the stations in the capture buffer, rather than, as with
Top Talkers mode, dynamic: reflecting an ongoing, updated distribution of what is
happening on the monitored segment.
While the numerical display in Top Talkers mode changes as Observer receives new
data, in Top Talkers View in Decode and Analysis the display will only change when
a new capture is loaded into the buffer or a new filter is applied to the present capture.
To view Decode and Analysis – Top Talkers View, click on the “Top Talkers”
navigation tab at the bottom of the Decode and Analysis window.
Decode and Analysis Top Talkers – Right-Click Menu
58
•
Start Packet Capture on station address(es)—activates the Filters dialog.
•
Start Packet Capture on pair address(es)—activates the Filters dialog.
•
Create Filter on station address(es)—activates the Filters dialog.
•
Create Filter on pair address(es)—activates the Filters dialog.
The Capture Menu
•
Find—displays the Find dialog.
•
Display Properties—displays the Display Properties dialog.
Decode and Analysis Top Talkers View – MAC View
Decode and
Analysis Top
Talkers
navigation tabs
•
Alias—displays the alias name of the station.
•
IP address—displays the IP address of the station.
•
Address—displays the address of the station.
•
% Pkts—displays the total number of packets received by the station during the
capture.
•
Packets—displays the total number of packets received by the station during the
present interval.
•
Pkt/s—displays the total number of packets received by the station per second.
•
% Bytes—displays the total number of bytes received by the station during the
capture.
•
Bytes—displays the number of bytes received by the station during the present
interval.
•
Bytes/s—displays the total number of bytes received by the station per second.
•
%Brdcst+Multcst/Pkts—displays the total number of broadcast and multicasts per
packet.
•
Broadcasts—displays the total number of broadcasts.
•
Broadcasts/s—displays the total number of broadcasts per second.
Packet Capture Mode
59
•
Multicasts—displays the total number of multicasts.
•
Multicasts/s—displays the total number of multicasts per second.
Decode and Analysis Top Talkers – IP View
60
•
DNS Name—displays the Domain Name Server name of the station.
•
IP address—displays the IP address of the station.
•
Packets Rx—displays the total number of packets received by the station during
the capture.
•
Bytes Rx—displays the total number of bytes received by the station during the
capture.
•
Packets Tx—displays the total number of packets transmitted by the station
during the capture.
•
Bytes Tx—displays the total number of bytes transmitted by the station during
the capture.
•
Total packets—displays the total number of packets received by the station
during the capture.
•
Total bytes—displays the total number of bytes received by the station during the
capture.
•
Utilization % Rx—displays the total number of utilities received by the station
during the capture.
•
Utilization % Tx—displays the total number of utilities transmitted by the station
during the capture.
The Capture Menu
Decode and Analysis Pairs (Matrix)
Pairs (Matrix) view in Decode and Analysis is similar in appearance and function to
Observer’s Pair Statistics (Matrix) mode. The difference is that the display is static,
reflecting distribution of conversations in the capture buffer, rather than, as with Pair
Statistics (Matrix) mode, dynamic: reflecting an ongoing, updated distribution of what
is happening on the monitored segment. While the graphical display in Pair Statistics
(Matrix) mode changes as Observer receives new data, in Decode and Analysis – Pairs
(Matrix) view, the display will only change when a new capture is loaded into the buffer
or a new filter is applied to the present capture.
Decode and Analysis Pairs (Matrix) – Setup Properties
•
“Ignore latencies above (ms):” textbox—sets the latency time that (above which),
Observer will ignore packets. Latency configuration will make Observer only track
packets that are part of a true conversation flow.
Packet Capture Mode
61
Decode and Analysis Pairs (Matrix) – List View
Decode and Analysis Pairs (Matrix) – List View Display Properties
•
“Item” dropdown—allows you to select which item will be configured.
•
“Item color” dropdown—allows you to select the color of the main display item.
Graph:
•
“Bar height” spinbox—allows you to configure the bar height in pixels.
Station names:
62
•
Alias option button—allows you to select to view stations by alias name.
•
IP address option button—allows you to select to view stations by IP address.
•
MAC address option button—allows you to select to view stations by MAC
address.
The Capture Menu
Decode and Analysis Pairs (Matrix) – List View Right-Click Menu
•
Start Packet Capture on station address(es)—activates the Filters dialog.
•
Start Packet Capture on pair address(es)—activates the Filters dialog.
•
Create Filter on station address(es)—activates the Filters dialog.
•
Create Filter on pair address(es)—activates the Filters dialog.
•
Find—displays the Find dialog.
•
Display Properties— displays the Display Properties dialog.
Decode and Analysis Pairs (Matrix) – Pair Circle View
Clicking on the list of Protocols on the selection bar will cause the display of only the
selected protocols.
Decode and Analysis Pairs (Matrix) – Dial View Display Properties
There are no display properties for this view.
Packet Capture Mode
63
Decode and Analysis Pairs (Matrix) – Dial View Right-Click Menu
•
Cursor—allows you to select the cursor type. You can select from the following:
arrow, hand, or magnify.
•
Zoom—allows you to select the view mode. You can select from the following:
1x, 2x, 5x, 10x, 20x, or 40x.
•
Hide selected stations—hides the highlighted station.
•
Show all stations—shows all stations.
•
Show traffic only for selected stations—shows all traffic for the highlighted
stations.
•
Show all traffic—shows all traffic on the network.
•
Start Packet Capture on station address(es)—activates the Filters dialog.
•
Start Packet Capture on pair address(es)—activates the Filters dialog.
•
Create Filter on station address(es)—activates the Filters dialog.
•
Create Filter on pair address(es)—activates the Filters dialog.
•
Find—displays the Find dialog.
•
Display Properties—displays the Display Properties dialog.
Decode and Analysis – Internet Observer View
Internet Observer View in Decode and Analysis submode of Packet Capture mode is
similar in appearance and function to Internet Observer mode. The difference is that
the display is static, reflecting the distribution of protocols in the capture buffer,
rather than, as with Internet Observer mode, dynamic: reflecting an ongoing, updated
distribution of what is happening on the monitored segment. While the numerical
display in Internet Observer mode changes as Observer receives new data, in Internet
Observer View (in Decode and Analysis submode of Packet Capture mode) the data
will only change when a new capture is loaded into the buffer, and when a new filter
is applied to the present capture.
64
The Capture Menu
To view Decode and Analysis – Internet Observer View, click on the “Internet
Observer” navigation tab at the bottom of the Decode and Analysis window.
In Internet Observer View, the top tabs include three options for viewing capture
Internet data: Internet Patrol, IP Pairs (Matrix), and IP Subprotocols.
Decode and Analysis Internet Observer – Internet Patrol View
Top tabs
Navigation
tabs
When Internet Patrol is selected, the following items are displayed in the bar above the
main table:
•
Station pairs—gives the number of station pairs in the capture buffer engaged in IP
conversations. A “station pair,” consists of a station sending traffic to another
station in one direction. If Station A is sending traffic to Station B and Station B is
sending traffic to Station A, that is counted as two station pairs.
•
Filter—describes whether or not a filter is present.
The following items are displayed in the main table:
•
Station (by MAC)—gives the MAC address of each station.
In the charts, this is generally referred to as Station 1, or simply as 1.
•
Talking to (by IP)—gives the IP address of each station involved in the
conversation with the station listed in Station (by IP), above.
In the charts, this is generally referred to as Station 2, or simply as 2.
•
First seen—displays the time of the earliest packet in the capture sent by the station
listed in Talking to (by IP).
•
Last seen—displays the time of the most recent packet in the capture sent by the
station listed in Talking to (by IP).
Packet Capture Mode
65
•
Total packets—displays the total number of packets in the capture sent (in either
direction) between the station listed in Station (by IP) and the station listed in
Talking to (by IP).
•
Total bytes—displays the total number of bytes in the capture sent (in either
direction) between the station listed in Station (by IP) and the station listed in
Talking to (by IP).
•
Packets 1 -> 2—displays the total number of packets sent from the station listed
in Station (by IPC) to the station listed in Talking to (by IP).
•
Packets 1 <- 2—displays the total number of bytes in the capture sent to the
station listed in Station (by IP) from the station listed in Talking to (by IP).
•
Bytes 1 -> 2—displays the total number of bytes in the capture sent from the
station listed in Station (by IP) to the station listed in Talking to (by IP).
•
Bytes 1 <- 2—displays the total number of bytes in the capture sent to the station
listed in Station (by IP) from the station listed in Talking to (by IP).
Decode and Analysis Internet Observer – IP Pairs (Matrix) View
When IP Pairs (Matrix) is selected, a circular matrix is displayed, showing IP pair
connections.
Clicking on any device on the display brings up a menu that permits configuration of
the display and performance.
66
The Capture Menu
Decode and Analysis Internet Observer – IP Subprotocols View
When IP Subprotocols is selected from the selection bar, a tabular display appears.
When IP Subprotocols is selected on the selection bar, the following items are displayed
in the bar above the main table:
•
Stations—gives the number of stations in IP conversations.
•
Displaying—describes what units are counted in the display.
•
Filter—describes whether or not a filter is present.
The following items are displayed in the main table:
•
DNS name—gives the Domain Name Server name of each station that generated
data in the present capture.
•
IP address—gives the IP address of the station referred to in the previous column.
The remaining columns list all the IP subprotocols that Observer is capable of
recognizing. Some of the listed subprotocol columns may contain only zeroes,
indicating that no packets of that subprotocol are present in the capture buffer.
The display can be sorted by DNS name, IP address, or by any of the subprotocols.
Click once on the label of any column to sort by descending order; click twice on the
label of any column to sort by ascending order.
Reading and Writing Sniffer Files
Observer has the ability to read and write Network General Sniffer® formatted packet
capture files. This has been requested for sites that require the sending of Observer
capture buffers to Sniffer® users for viewing or analysis. Sniffer® captures can also
now be read by Observer to use Observer's decode facility on Sniffer® captures.
Observer fully supports the following:
Packet Capture Mode
67
*.enc—for Ethernet captures
*.trc—for Token Ring captures
*.fdc—for FDDI captures
*.cap—for CAP files
Options for reading or writing Sniffer® formatted packet buffers are available from
the Packet View Mode Commands menu.
68
The Capture Menu
The Statistics Menu
Bandwidth Utilization
Shows bandwidth usage statistics for your network.
Menu Path
Statistics ->Bandwidth Utilization. The mode starts immediately.
Purpose
Bandwidth Utilization is calculated by recording the number of bytes seen by the
Observer (or Probe) station over a 1-second interval. This value is then adjusted by
adding to the appropriate MAC header and footer data size information. From this
point, the amount of data is compared to the maximum theoretical throughput of your
NIC driver reports (i.e., 10MB, 100MB, or whatever your NIC card is reporting) and
a percentage statistic is displayed.
Bandwidth Utilization displays a graph that is an instantaneous “window” on your
bandwidth utilization. Information is real-time, although the graph will only display
up to 16 minutes of information. Sampling is once per second.
You cannot start or stop this mode. When the mode is displayed, it is automatically
started. To stop the mode, simply close the mode window. The Bandwidth Utilization
display can be viewed in graph, dial, list, 3D, or pie views. There is no setup dialog
for Bandwidth Utilization.
Once you are in the Bandwidth Utilization screen, the graph shows the current
bandwidth utilization. Maximum, average, and latest utilization values are shown at
the top of the graph.
Available Views
•
Graph View
•
Dial View
•
List View
•
3D Column Chart View
69
Graph View
Graph View Display Properties
To set the display properties, either:
•
right-click the display,
•
click the
•
select Mode Commands->Display Properties
icon, or
The Display Properties dialog offers configuration options for the components of the
display.
Only active if
“Lines” was selected
in “Item plot” dropdown.
70
•
“Item” dropdown—allows you to select which item will be configured.
•
“Item color” dropdown—allows you to select the color of the main (Bandwidth)
display item.
•
“Item plot” dropdown—allows you to select the item to be displayed as lines or
bars.
The Statistics Menu
•
“Item line thickness” dropdown—allows you to select the thickness of the line (in
pixels). This field is only active if “Lines” was selected in “Item plot.”
•
“Graph Time” option buttons—allows you to set how the “X” axis will be
displayed. Clock time will show times using a 24-hour clock (i.e., the current time).
Relative time will display times from the start of the activation of the mode.
The Bandwidth Utilization display is not subject to any filters as it
compares the actual activity on the network to the network’s theoretical
capacity.
Bandwidth Utilization
71
Dial View
3D Column Chart View
3D Column Chart View Display Properties
To set the display properties for list view, click Settings.
The Data fields are:
•
72
The Statistics Menu
“Maximum items” spinbox—allows you to select the maximum items to be
displayed.
The Graph fields are:
•
“3D depth” spinbox—allows you to select the 3D depth of the graph items.
•
“3D angle” spinbox—allows you to select the 3D depth of the graph items.
3D Line Chart View
Related Topics
• 3D Step Chart View on page 136.
• Utilization History Mode on page 132.
Efficiency History
Provides a benchmark of network efficiency, useful for measuring the impact of
administrative changes to your network.
Menu Path
Statistics->Efficiency History. The mode starts immediately.
Purpose
Efficiency History was designed to provide a snapshot of your network’s current
efficiency. Running the efficiency test (over time) should provide similar values for
similar network loads from a single Observer PC. In other words, this test is dependent
on the network card in the Observer PC and the current load of the network. It is
designed to give an aggregate view of efficiency. The value should be about the same
when run in similar situations.
Efficiency History
73
Unlike most of the diagnostic modes, Efficiency History generates a
small amount of network traffic: 420 packets per minute on Ethernet
and 180 packets per minute on a Token Ring. Such small loads will
have no effect on network performance.
A common use for this mode is to judge the effectiveness, or lack of effectiveness, of
changes and alterations to your network setup/configuration. Many administrators use
this item as a gauge prior to a network change and then after the change is complete.
If the number goes down, you know that the change has affected your network’s
ability to carry data in a negative way. If the number goes up, the change has
improved your network’s ability to carry data.
You should run the test often to get a “feel” for what your network should read. Once
you know a baseline value for your network, any large change in one direction or
another should give you a reason to investigate.
When the mode is active, the test is run every 10 seconds. The test consists of
Observer bursting 70 packets (for Ethernet and Fast Ethernet) or 30 (for Token Ring)
onto the network. The first 10 packets are ignored, but the rest are measured for the
network’s ability to let data flow. Results are displayed in megabits/s.
You cannot start or stop this mode. When the mode is displayed, it is automatically
started. To stop the mode, simply close the mode window. The Efficiency History
display can be viewed in graph, dial, list, 3D, or pie views. There is no setup dialog
for Efficiency History.
Efficiency History can be activated from the main window by selecting Statistics >
Efficiency History.
Available Views
74
•
Graph View
•
Dial View
•
List View
The Statistics Menu
Graph View
Display Properties
To set display properties, click the Settings button. The Display Properties dialog
offers configuration options for the components of the display.
•
“Item” dropdown—allows you to select which item will be configured.
•
“Item color” dropdown—allows you to select the color of the main display item.
•
“Item plot” dropdown—allows you to select the item to be displayed as lines or
bars.
•
“Item line thickness” dropdown—allows you to select the thickness of the line; this
dropdown is only active if you have selected “Lines” from the “Item plot”
dropdown.
Graph horizontal scale:
•
“Pixels/interval” spinbox—allows you to select how many pixels each interval
display will occupy.
•
“Seconds/interval” dropdown—allows you to set the number of seconds Observer
will average before displaying interval information.
Efficiency History
75
Dial View
Display Properties
There are no display properties available for this view.
List View
Internet Observer Mode (Internet Patrol, Pairs
Matrix, IP Subprotocols)
Lets you look at internet usage by users, by connection pairs, or by subprotocols.
Menu Path
To start Internet Observer mode, select Statistics > Internet Observer (IP Matrix) or
click on the
76
icon. Click
•
Internet Patrol Tab
•
IP Pairs (Matrix) Tab
•
IP Subprotocols Tab
The Statistics Menu
to start the mode. The mode has a three tabs:
Purpose
Internet Observer mode permits you to examine Internet traffic on your network. This
can be used to monitor overall Internet usage and to focus on a specific station or
stations. You can also break down Internet usage by subprotocols. For example, you can
easily determine what proportion of Internet traffic involves the WWW vs. popmail.
Internet Observer mode is designed to keep track of users’ Internet usage in a number of
different tabs: Internet Patrol, IP Pairs (Matrix), and IP Subprotocols.
Available Views
•
Pair Circle
•
List
•
3D Column Chart
•
3D Pie Chart
Internet Observer Setup Properties
The Internet Observer Setup dialog includes setup options for all three Internet
Observer tabs.
Statistics settings:
•
“Remove inactive IP address after (min)” textbox—allows you to set the number of
minutes that inactive IP addresses will remain in the display.
•
“Use current filter” checkbox—when checked, the current filter will be used. When
unchecked no filtering will be used.
•
Select TCP port for Internet Patrol and IP to IP Sub-Modes option buttons—allows
you to select only one TCP port to track or all TCP traffic (all ports). If you select
the Specific port option button, you are required to enter the port number in the
available textbox.
Internet Observer Mode (Internet Patrol, Pairs Matrix, IP Subprotocols)
77
•
IP Subprotocols by Station sub-mode parameters option buttons—allows you to
configure the display of the port by port data: either by number of packets or by
number of bytes.
•
Modify Network Trending and Internet Observer TCP/IP Subprotocols button—
clicking this button displays the list of protocols to use for the IP Subprotocols
submode tab. Twelve (12) subprotocols can be defined.
Internet Patrol Tab
Internet Patrol displays MAC address to layer 3 IP address traffic. If the MAC
address has an alias assigned, this text will be displayed instead of the true MAC
address. Additionally, the IP addresses of the destination sites will be resolved using
DNS.
This view of your Internet traffic is most appropriate for local network traffic to and
from the Internet, and for sites that use DHCP. Since DHCP changes IP addresses
frequently, source IP addresses are not useful on DHCP site for identification.
78
The Statistics Menu
List View
List View Properties
Right-Click Menu
•
Start Packet Capture on station address(es)—activates the Filters dialog.
•
Start Packet Capture on pair address(es)—activates the Filters dialog.
•
Create Filter on station address(es)—activates the Filters dialog.
•
Create Filter on pair address(es)—activates the Filters dialog.
Internet Observer Mode (Internet Patrol, Pairs Matrix, IP Subprotocols)
79
•
Find—displays the Find dialog.
•
Display Properties—displays the Display Properties dialog.
Pair Circle View
Display Properties
Data:
•
“Item” list—allows you to select the item to be configured.
•
“Color” dropdown—allows you to select the color of the item listed in the “Item”
list box.
Station name—allows you to select from one of the following:
80
•
Alias option button—allows you to select to view stations by alias name.
•
DNS name option button—allows you to select to view stations by DNS name.
•
IP address option button—allows you to select to view stations by IP address.
•
MAC address option button—allows you to select to view stations by MAC
address.
The Statistics Menu
Talking to name:
•
DNS name option button—allows you to select to talk to stations by DNS name.
•
IP address option button—allows you to select to talk to stations by IP address.
Right-Click Menu
•
Cursor—allows you to select the cursor type. You can select from the following:
arrow, hand, or magnify.
•
Zoom—allows you to select the view mode. You can select from the following: 1x,
2x, 5x, 10x, 20x, or 40x.
•
Hide selected stations—hides the highlighted station.
•
Show all stations—shows all stations.
•
Show traffic only for selected stations—shows all traffic for the highlighted
stations.
•
Show all traffic—shows all traffic on the network.
•
Start Packet Capture on station address(es)—activates the Filters dialog.
•
Start Packet Capture on pair address(es)—activates the Filters dialog.
•
Create Filter on station address(es)—activates the Filters dialog.
•
Create Filter on pair address(es)—activates the Filters dialog.
•
Find—displays the Find dialog.
•
Display Properties—displays the Display Properties dialog.
Internet Observer Mode (Internet Patrol, Pairs Matrix, IP Subprotocols)
81
3D Column Chart View
You can determine how the chart collects its data by clicking on the dropdown:
You can select from the following:
82
•
Total packets—displays the total number of packets in the capture sent in either
direction.
•
Total bytes—displays the total number of bytes in the capture sent in either
direction.
•
Packets 1 -> 2—displays the total number of packets sent from the station.
•
Packets 1 <- 2—displays the total number of bytes in the capture sent to the
station.
•
Bytes 1 -> 2—displays the total number of bytes in the capture sent from the
station.
•
Bytes 1 <- 2—displays the total number of bytes in the capture sent to the station.
The Statistics Menu
Display Properties
Data:
•
“Maximum items” spinbox—allows you to select the maximum items to be
displayed.
Graph:
•
“3D depth” spinbox—allows you to select the 3D depth of the graph items.
•
“3D angle” spinbox—allows you to select the 3D depth of the graph items.
3D Pie Chart View
IP Pairs (Matrix) Tab
IP to IP Pairs (Matrix) displays true layer 3 IP address to true layer 3 IP address traffic.
This view of your Internet traffic is appropriate for local segments talking to the
Internet and for backbone traffic flow.
Internet Observer Mode (Internet Patrol, Pairs Matrix, IP Subprotocols)
83
On a local network, this view will show all Internet usage IF the IP addresses are
static. If you are using DHCP on your local network, you should view your Internet
traffic using the “Internet Patrol” tab described above.
List View
On a backbone, this view can show true user Internet usage and traffic flow, even if
your users are downstream from the backbone via routers.
Display Properties
Right-Click Menu
•
84
The Statistics Menu
Start Packet Capture on station address(es)—activates the Filters dialog.
•
Start Packet Capture on pair address(es)—activates the Filters dialog.
•
Create Filter on station address(es)—activates the Filters dialog.
•
Create Filter on pair address(es)—activates the Filters dialog.
•
Find—displays the Find dialog.
•
Display Properties—displays the Display Properties dialog.
Pair Circle View
This display shows Internet connections in a “spider graph” as Observer senses your
users accessing sites. By right clicking on any of the addresses shown in the display,
you can start a packet capture.
Display Properties
Data:
•
“Item” list—allows you to select which item will be configured.
Internet Observer Mode (Internet Patrol, Pairs Matrix, IP Subprotocols)
85
•
“Color” dropdown—allows you to select the color of the display item.
Station name:
•
DNS name option button—allows you to select to view stations by DNS name.
•
IP address option button—allows you to select to view stations by IP address.
Right-Click Menu
•
Cursor—allows you to select the cursor type. You can select from the following:
arrow, hand, or magnify.
•
Zoom—allows you to select the view mode. You can select from the following:
1x, 2x, 5x, 10x, 20x, or 40x.
•
Hide selected stations—hides the highlighted station.
•
Show all stations—shows all stations.
•
Show traffic only for selected stations—shows all traffic for the highlighted
stations.
•
Show all traffic—shows all traffic on the network.
•
Start Packet Capture on station address(es)—activates the Filters dialog.
•
Start Packet Capture on pair address(es)—activates the Filters dialog.
•
Create Filter on station address(es)—activates the Filters dialog.
•
Create Filter on pair address(es)—activates the Filters dialog.
•
Find—displays the Find dialog.
•
Display Properties—displays the Display Properties dialog.
IP Subprotocols Tab
IP subprotocols display layer 3 IP addresses traffic flow broken down by subprotocol.
Subprotocols are defined in the setup dialog. Twelve (12) user-defined subprotocols
86
The Statistics Menu
can be created. “Other” indicates a protocol that did not match the criteria of the twelve
user-defined protocols.
List View
Display Properties
Display properties can be set by right-clicking on the display or by clicking the
icon. The Display Properties dialog offers configuration options for the components of
the display.
•
“Item” dropdown—allows you to select which item will be configured.
•
“Item color” dropdown—allows you to select the color of the main display item.
Internet Observer Mode (Internet Patrol, Pairs Matrix, IP Subprotocols)
87
Graph:
•
“Bar height” spinbox—allows you to select the bar height.
Right-Click Menu
•
Start Packet Capture on station address(es)—activates the Filters dialog.
•
Start Packet Capture on pair address(es)—activates the Filters dialog.
•
Create Filter on station address(es)—activates the Filters dialog.
•
Create Filter on pair address(es)—activates the Filters dialog.
•
Find—displays the Find dialog.
•
Display Properties—displays the Display Properties dialog.
Network Activity Display
Shows critical network utilization and broadcast information graphed against a traffic
reference line.
Menu Path
Click Statistics->Network Activity Display. The mode starts running immediately.
Purpose
The Network Activity Display can show you the health of a network at a glance and
can warn of impending slowdowns due to broadcast or multicast storms.
Available Views
•
Network Activity Plot
•
Graph View
•
List View
Network Activity Plot
The Network Activity Plot view shows critical network utilization and broadcast
information graphed against a packet traffic reference line. This display can show you
88
The Statistics Menu
at a glance the health of a network and can warn of impending slowdowns due to
broadcast or multicast storms.
The indicator lines change color for easy viewing of specific network conditions:
•
If an indicator line is yellow, the NAD is showing a network condition that is
essentially idle (total net utilization is under 5%).
In this case, the percentage of broadcast or multicast packets may be
high compared to actual traffic. However, because the traffic is so low, this
condition is not statistically important.
•
If an indicator line segment is green, the NAD is displaying a normal network
condition.
•
If an indicator line segment displays red, the NAD is letting you know that a load
condition exists.
This is not necessarily a problem, but indicates that you should be aware
of this condition.
•
Load conditions can mean different things depending on where the red vs. blue
vs. green lines appear. Typically, a red line means that a threshold has been
overcome. Blue lines display on the side where the threshold may be an
indication of trouble.
•
By default, red lines will be displayed if broadcast or multicast packets are
representing more than 10% of total network utilization or if utilization goes
over 35%.
Network Activity Display
89
Things to note:
•
Error thresholds can be set in the Display Settings dialog.
•
The gray area behind the current display is the outline of the last Network Vital
Signs.
•
NAD information can be saved to a comma delimited file by selecting File >
Save Mode in Comma Delimited Format.
Display Properties
Display properties can be set by right-clicking on the display or by clicking the
Settings button. The Display Properties dialog offers configuration options for the
components of the display.
•
“Utilization %” spinbox—allows you to select the number of utilizations per
packet.
•
“Multicasts % Total Packets” spinbox—allows you to select the number of
multicasts per total packets.
•
“Broadcasts % Total Packets” spinbox—allows you to select the number of
broadcasts per total packets.
Right-Click Menu
Right-clicking on the dial will display the Display Properties dialog for Network
Activity Display – Dial View.
Graph View
The NAD display in graph mode has a slightly different setup. Please note that the
mode clock is located at the intersection of the X and Y axis of the display in graph
90
The Statistics Menu
mode. The clock counts down the number of seconds left in the “Seconds/Interval” time
period until data will be written to the display.
Mode
clock
Display Properties
Display properties can be set by right-clicking on the display or by clicking the
icon. The Display Properties dialog offers configuration options for the components of
the display.
•
“Item” dropdown—allows you to select which item will be configured.
•
“Item color” dropdown—allows you to select the color of the item listed in the
“Item” list box.
•
“Item plot” dropdown—allows you to select the item to be displayed as Lines,
Points, or Bars.
•
“Item line thickness” dropdown—allows you to select the thickness of the
displayed line in pixels. This option is only available for items that have been
defined as a “Line” in the “Item plot” dialog.
Network Activity Display
91
Graph horizontal scale:
•
“Pixels/interval” spinbox—allows you to set how many pixels each interval
display will occupy.
•
“Seconds/interval” dropdown—allows you to set the number of seconds
Observer will average before displaying interval information.
Right-Click Menu
Right-clicking on the graph will display the Display Properties dialog for Network
Activity Display – Graph View. Display Properties on page 91
List View
Display Properties
The Network Activity List View has only one display property option. To reset the
columns to their default widths, click on the
icon or go to Mode Commands >
Display Properties. The following dialog will be displayed:
To reset column widths to their default values, click YES. To leave them in their
present state, click NO.
Right-Click Menu
Right-clicking on the list will display the Display Properties dialog for Network
Activity Display – List View. see “Display Properties” on page 92.
92
The Statistics Menu
Network Errors by Station Mode
The Network Errors by Station mode displays network error packets broken down by
the source (station) of the error and the type of error packet.
Menu Path
Choose Statistics->Network Errors by Station. Click the Start button to start running
the mode.
Purpose
Network Errors by Station tracks and shows slightly different error counts depending on
the access method of the network you are monitoring: Ethernet, FDDI, Token Ring, or
Wireless. Screenshots in this section show Ethernet Errors by Station.
To track Ethernet errors by station, you must use a Network Instruments’
ErrorTrak™ driver and a certified network adapter card.
Please check Network Instruments’ Web site for more information about the current set
of supported cards and new drivers.
Available Views
•
Graph View
•
3D Chart and Pie Views
•
3D Chart and Pie Views
Graph View
The Network Errors by Station – Graph View display consists of the standard
summation header, packet and error rate dials, error summary registers, and the station
error list box.
Summation
header
Station
error
list box
Network Errors by Station Mode
93
•
The summation header displays the number of stations and the total number of
packets analyzed.
•
The station error list box shows each station that has sent an error packet and the
number and type of errors. Additionally, error rates (value per second) are
displayed and “% Errors/Total packets” statistic is displayed. The “%
Errors/Total packets” statistic is the total number of error packets, divided by the
total number of packets times 100. In formula format it would look like:
((total error packets) / (total number of station packets)) * 100
This statistic provides a good “grade” of a particular station’s error activity.
Display Properties
Display properties can be set by right-clicking on the display and selecting “Display
properties” or by clicking the
icon. The Display Properties dialog offers
configuration options for the components of the display.
•
“Item” dropdown—allows you to select the item to be configured.
•
“Item color” dropdown—lets you select the color of the item listed in the “Item”
list box.
Graph:
•
“Bar height” spinbox—lets you configure the bar height in pixels.
Right-Click Menu
94
•
Start Packet Capture on station address(es)—activates the Filters dialog.
•
Start Packet Capture on pair address(es)—activates the Filters dialog.
The Statistics Menu
•
Create Filter on station address(es)—activates the Filters dialog.
•
Create Filter on pair address(es)—activates the Filters dialog.
•
Find—displays the Find dialog.
•
Display Properties—displays the Display Properties dialog.
3D Chart and Pie Views
Observer also offers 3D bar chart and pie views of Network Errors by Station. Simply
click the 3D bar or Pie icon on the left side of the window. You can change colors and
other display properties by right-clicking the chart and selecting Display Properties
from the pop-up menu.
Network Vital Signs Mode
The Network Vital Signs mode shows the current network activity mapped with current
error conditions on your network.
This section describes the Vital Signs as displayed for standard Ethernet analysis. For
FDDI Vital signs, see “FDDI Network Vital Signs” on page 162. For Wireless Vital
signs, see “Wireless Vital Signs” on page 163.
Menu Path
Statistics->Network Vital Signs
Purpose
The Network Vital Signs display gives you a complete snapshot of error conditions and
of their importance in the context of current network activity. Aggregate problems
found here can be pinned down to a specific station using the “Errors by Station mode.”
The Ethernet Network Vital Signs will ONLY show errors that are available
with your specific NDIS driver. To see what errors your driver supports,
select Options > Selected Probe or SNMP Device Properties >
Probe Parameters tab. The area under “Network errors that NIC NDIS
drivers claims to provide” will show which NDIS errors your network card
is capable of counting.
The importance of the error condition is key when trying to determine the severity of a
particular error. For example, 50% CRC packet errors is not a problem if the sample
size (total activity) is two packets. On the other hand, 10% CRC packet errors during a
busy traffic period represents a critical problem.
Observer’s Network Vital Signs informs you at a glance as to the error condition and its
severity with respect to traffic conditions by combining graphical shapes with specific
color codes.
Network Vital Signs Mode
95
As with the Network Activity Display, the following colors have specific meanings:
•
A yellow line anywhere in the display represents an idle condition. In other
words, no matter what your display is telling you, activity is so low that the errors
are not statistically important.
•
A green line shows normal network activity and error counts.
•
A red line indicates error counts out of “normal” range. When a red line
condition is displayed.
A red line will be displayed when the following default error counts are
encountered:
-Utilization goes over 35%.
-CRC & packets too small represent more than 25% of the total traffic.
-Packets too big represent over 1% of total traffic.
•
Whenever a red line (i.e. a critical condition) is displayed, all of the formerly
green lines turn blue to highlight the network state.
You cannot start or stop this mode. When the mode is displayed, it is automatically
started. To stop the mode, simply close the mode window. The Network Vital Signs
mode can be viewed in graph, dial, or list views.
Vital Sign information can be saved to a comma delimited file by choosing File >
Save Mode in Comma Delimited Format.
Setup Properties
Setup options are the same for graph, dial, and list views.
•
“Run collision test” checkbox—when selected, the collision test is run.
If your network NDIS driver supports collisions (see Options > Selected Probe or
SNMP Device Properties > Probe Parameters tab) you can turn on Observer’s
collision testing. This is done by clicking the COLLISION EXPERT button on the
Network Vital Signs selection bar.
When this option is on, Observer will burst 100 Pkts/sec and listen to see how many
packets collide with other packets. This method was considered the best way to see if
your network has a problem with collisions since NDIS drivers will only display
collisions when the packet sent from the PC is collided with. If you are showing
96
The Statistics Menu
collisions, this means that some station on your network is not respecting the traffic of
other stations. see “Collision Expert Analysis” on page 100.
Available Views
•
Graph View
•
Dial
•
List
Graph View
Display Properties
Display properties can be set by right-clicking on the display or by clicking the
icon. The Display Properties dialog offers configuration options for the components of
the display.
Only active if
“Lines” was selected
in “Item plot” dropdown.
•
“Item” dropdown—allows you to select which item will be configured.
Network Vital Signs Mode
97
•
“Item color” dropdown—allows you to select the color of the main display item.
•
“Item plot” dropdown—offers a choice of the item to be displayed as Lines,
Points, or Bars.
•
“Item line thickness” dropdown—offers a choice of the thickness of the
displayed item in pixels. This option is only available for items that have been
defined as a “Line” in the “Item plot” dialog.
Graph horizontal scale:
•
“Pixels/interval” spinbox—allows you to select how many pixels each interval
display will occupy.
•
“Seconds/interval” dropdown—allows you to set the number of seconds
Observer will average before displaying interval information.
Right-Click Menu
Right-clicking on the graph will display the Display Properties dialog for Network
Vital Signs – Graph View. see “Display Properties” on page 97.
98
The Statistics Menu
Summary List View
Plot View
The gray area
behind the
current display
is the outline
of the last
Network Vital
Signs
Display Properties
Different error thresholds can be set in the Display Properties dialog.
Network Vital Signs Mode
99
•
“Utilization %” spinbox—allows you to select the utilization threshold number.
•
“CRC errors % Total Packets” spinbox—allows you to select the CRC errors
threshold number.
•
“Alignment errors % Total Packets” spinbox—allows you to select the alignment
errors threshold number.
•
“Too small % Total Packets” spinbox—allows you to select the too small number
threshold number.
•
“Too big % Total Packets” spinbox—allows you to select the too big threshold
number.
•
“Collisions % Total Packets” spinbox—allows you to select the collision
threshold number. % of Total Packets refers to the number of test packets that
have collided (not the total number of packets on your network).
Right-Click Menu
Right-clicking on the dial will display the Display Properties dialog for Network
Vital Signs – Dial View.
Collision Expert Analysis
This mode examines all stations that were active immediately prior, during, and just
after a collision occurs. These stations will be tracked and aberrant stations (stations
that are consistently present or retransmitting at the time of the collision) are flagged
and tracked. Should one (or more) stations show consistently high retransmissions
around collisions, the station or stations will be identified. Expert logic will show
collision events and statistically summarize those stations that show exceptional
collision-causing rates. The summary area of the Collision Expert Analysis mode will
make recommendations regarding what stations should be checked for failing
hardware. Replacement of the NIC on the aberrant station is almost always the result
of finding a station causing collisions, but checking cabling is another option.
The Collision Expert display shows the top 10 colliders on your network, how many
packets and collisions were observed and the percent of collisions caused by each of
the top 10 colliders.
The bottom half of the Collision Expert Analysis dialog shows the Expert Analysis
section displaying the collision events and an analysis summary of exceptional
events.
The Collision Expert Analysis dialog must be run for at least 10 minutes
to provide accurate results. The longer it runs, the better the data.
It is best to run the Collision Expert Analysis mode during heavy
network activity times.
100
The Statistics Menu
Setup Properties
The Setup dialog for Collision Expert Analysis lets you configure thresholds for
warnings about aberrant stations.
Expert thresholds (times from average % collisions):
•
“Warning level” spinbox—sets the multiplier that Expert mode will use to warn of
events. For example, if this is set to “5,” the Expert will warn when a station’s
collision rate is five times the network average.
•
“Critical level” spinbox—the number (multiplier) that the Expert will warn when
the station’s collisions become critical. For example, if this is set to “10”, the
station will be flagged critical when its collision rate is 10 times the network
average.
Minimum packet numbers for valid analysis:
•
“Minimum number of packets” spinbox—this is the minimum number of packets
that any station must send/receive prior to the Expert acknowledging the station for
analysis. This value is set to disregard stations that may have a high number of
collisions, but not enough traffic to be statistically valid. For example, if a station
has 50% collisions, but only 20 packets, it would not be considered statistically
valid for analysis.
“Minimum number of collisions” spinbox—this is the minimum number of collisions
that any station must display prior to the Expert acknowledging the station for analysis.
Network Vital Signs Mode
101
List View
To start Collision Expert Analysis, click the Collision Expert Analysis tab.
Display Properties
Display properties can be set by right-clicking on the display or by clicking the
icon. The Display Properties dialog offers configuration options for the components
of the display.
•
“Item” list—allows you to select which item will be configured.
•
“Item color” dropdown—allows you to select the color of the main display item.
Graph:
•
102
The Statistics Menu
“Bar height” spinbox—allows you to configure the bar thickness in pixels.
Right-Click Menu
•
Start Packet Capture on station address(es)—activates the Filters dialog.
•
Start Packet Capture on pair address(es)—activates the Filters dialog.
•
Create Filter on station address(es)—activates the Filters dialog.
•
Create Filter on pair address(es)—activates the Filters dialog.
•
Find—displays the Find dialog.
•
Display Properties—displays the Display Properties dialog.
Network Vital Signs Mode
103
3D Chart View
Pie View
104
The Statistics Menu
3D Chart and Pie Display Properties
Data:
•
“Maximum items” spinbox—allows you to select the maximum items to be
displayed.
Graph:
•
“3D depth” spinbox—allows you to select the 3D depth of the graph items.
•
“3D angle” spinbox—allows you to select the 3D depth of the graph items.
Pair Statistics (Matrix) Mode
Tracks all conversation pairs on your network and allows you to examine the details of
a specific conversation for analysis.
Menu Path
Statistics->Pairs Statistics (Matrix)
Purpose
The dial mode of the Pair Statistics shows a matrix of all conversations, with line
thickness representing the amount of data flowing between each pair.
A number of statistics are kept for each pair, including the packets and bytes in each
direction, and the latency for each direction. Latency can further be configured to be
ignored after a certain number of milliseconds. see “Setup Properties (all views)” on
page 106. Latency configuration will make Observer only track packets that are part of
a true conversation flow, as opposed to packets that may be the result of someone going
to get a cup of coffee, for example.
In the course of a few hours, you will find that almost every station on your segment
will have some sort of conversation with every other station. This is why Observer
provides the ability to “zoom” in on a specific conversation on the top of your display.
Pair Statistics (Matrix) Mode
105
This will make watching one conversation amongst many hundreds much easier. To
zoom in, highlight the pair you are interested in and it will be displayed on the top of
the Pair dialog.
Available Views
•
Graph View
•
Pair Circle View
•
List View
•
3D Column Chart View
•
3D Pie Chart View
Setup Properties (all views)
The Setup dialog is where mode specific setup information options are set. You can
access the Setup dialog by clicking the
icon or by selecting Mode Commands
> Setup.
106
•
“Ignore latencies above (ms)” textbox—sets the latency time that above which,
Observer will ignore packets. Latency configuration will make Observer only
track packets that are part of a true conversation flow.
•
“Use current filter” checkbox—when checked, Observer will use the current
filter showing mode information. When unchecked, Observer will display mode
information on all stations, using no filter.
The Statistics Menu
List View
The List view of Pair Statistics shows all pairs and the latency times between
conversations.
To display latenc
for a pair here...
...select a pair
from the list.
Display Properties
Display properties can be set by right-clicking on the display or by clicking the Settings
button. The Display Properties dialog offers configuration options for the components
of the display.
•
“Item” dropdown—allows you to select the item to be configured.
•
“Item color” dropdown—allows you to select the color of the item listed in the
“Item” list box.
Graph:
•
“Bar height” spinbox—lets you configure the bar thickness in pixels.
Station names—allows you to select from one of the following:
•
Alias option button—allows you to view stations by alias name.
Pair Statistics (Matrix) Mode
107
•
IP address option button—allows you to view stations by IP address.
•
MAC address option button—allows you to view stations by MAC address.
Right-Click Menu
The Pair Statistics – Graph View right-click menu offers a number of filtering
options, as well as access to the Display Properties dialog.
•
Start Packet Capture on station address(es)—activates the Filters dialog.
•
Start Packet Capture on pair address(es)—activates the Filters dialog.
•
Create Filter on station address(es)—activates the Filters dialog.
•
Create Filter on pair address(es)—activates the Filters dialog.
•
Find—displays the Find dialog.
•
Display Properties—displays the Display Properties dialog.
Pair Circle View
The pair circle view of Pair Statistics provides a view of all the network conversations
in one convenient map. The thickness of each line represents the amount of data
flowing between the stations. The thickness grows in a logarithmic pattern.
Additionally, there are two different colors for new and older traffic.
108
The Statistics Menu
Display Properties
Display properties can be set by right-clicking on the display or by clicking the Settings
button. The Display Properties dialog offers configuration options for the components
of the display.
•
“Item” list—allows you to select the item to be configured.
•
“Color” dropdown—allows you to select the color of the item listed in the “Item”
list box
Station name—allows you to select from one of the following:
•
Alias option button—allows you to view stations by alias name.
•
IP Address option button—allows you to view stations by IP address.
•
MAC Address option button—allows you to view stations by MAC address.
Right-Click Menu
•
Cursor—allows you to select the cursor type. You can select from the following:
arrow, hand, or magnify.
•
Zoom—allows you to select the view mode. You can select from the following: 1x,
2x, 5x, 10x, 20x, or 40x.
•
Hide selected stations—hides the highlighted station.
Pair Statistics (Matrix) Mode
109
•
Show all stations—shows all stations.
•
Show traffic only for selected stations—shows all traffic for the highlighted
stations.
•
Show all traffic—shows all traffic on the network.
•
Start Packet Capture on station address(es)—activates the Filters dialog.
•
Start Packet Capture on pair address(es)—activates the Filters dialog.
•
Create Filter on station address(es)—activates the Filters dialog.
•
Create Filter on pair address(es)—activates the Filters dialog.
•
Find—displays the Find dialog.
•
Settings—displays the Settings dialog.
List View
The List View of Pair Statistics provides a tabular view of all the network
conversations in one convenient map.
Right-Click Menu
The Pair Statistics – List View right-click menu offers a number of filtering options,
as well as access to the Display Properties dialog.
110
The Statistics Menu
•
Start Packet Capture on station address(es)—activates the Filters dialog.
•
Start Packet Capture on pair address(es)—activates the Filters dialog.
•
Create Filter on station address(es)—activates the Filters dialog.
•
Create Filter on pair address(es)—activates the Filters dialog.
•
Find—displays the Find dialog.
•
Settings—displays the Display Properties dialog.
•
Reset Column Widths—Returns the column widths to their original settings.
3D Column Chart View
Pair Statistics (Matrix) Mode
111
3D Pie Chart View
3D Chart and Pie View Display Properties
Data:
•
“Maximum items” spinbox—allows you to select the maximum items to be
displayed.
Graph:
•
“3D depth” spinbox—allows you to select the 3D depth of the graph items.
•
“3D angle” spinbox—allows you to select the 3D depth of the graph items.
Protocol Distribution Statistics Mode
Displays network protocol usage statistics.
Menu Path
Statistics -> Protocol Distribution Statistics
Purpose
Protocol Distribution mode shows how your network’s data is being distributed based
on protocol. Viewing protocols can give you an idea of what servers and applications
112
The Statistics Menu
are being used and if there are any unknown or misconfigured protocols on your
network.
You can have a maximum number of the following for each subprotocol: 512 for UPD,
512 for TCP, and 512 for Frame.
The Protocol Distribution mode displays Protocol Statistics in list, 3D chart, and pie
views. The Protocol Distribution mode can be activated from the main window by
selecting Statistics > Protocol Distribution.
Protocol Tree View
3D Column Chart View
Protocol Distribution Statistics Mode
113
3D Pie Chart View
Settings
•
114
The Statistics Menu
“Use Current Filter” checkbox—Check this box if you want only packets
matching the current filter criteria to be used for the Protocol Distribution
display.
•
“Define Protocols for Protocol Distribution Statistics”—displays a dialog that lets
you define the protocols to be displayed:
•
Displays the Frame Name, First Port (Hex), and Last Port (Hex).
•
Add button—displays the Add/Edit SubProtocol dialog, where you can define the
frame name and range for the protocol you are defining:
RMON Tables
See “Using the RMON Console” on page 415.
Router Observer
Shows router utilization rates. To accurately assess utilization rates, you must enter the
correct bandwidth speed in the Settings dialog.
Menu Path
Statistics->Router Observer
Purpose
Router Observer lets you to look at a router (or group of routers) in real time to see their
utilization rate. You can quickly find out if a router is acting as a bottleneck and, if so,
whether the source of the packets clogging the router are incoming or outgoing (or
RMON Tables
115
both). By examining historical information you can tell whether this is a chronic
problem, which might indicate the need for a faster connection, or an acute problem,
which might indicate a failure of some sort. Observer does this passively; therefore,
the Access Point is not affected.
Available Views
•
List and Dials View
•
3D Column Chart View
•
Pie View
Settings
To use the Access Points Load Monitor you must first configure the mode. This is
done by clicking the Settings button, which will then display the Access Points Load
Monitor Setup dialog.
116
•
Select a Router from the list (of stations). Do so by highlighting the station. This
list is read from your address/alias list.
•
“Router speed (Baud)” textbox—this is the device’s defined throughput (in other
words, enter 54000000 for 802.11a/g access points, or 11000000 for 802.11b
access points.
The Statistics Menu
List and Dials View
Dials provide a “heads-up” immediate display of packets/second, bits/second, and
interface utilization.
Right-Click Menu
•
Settings—displays the Settings dialog.
•
Reset Column Widths—Resets the columns to their original widths.
Router Observer
117
3D Column Chart View
Pie View
Chart and Pie View Display Properties
Data:
•
“Maximum items” spinbox—allows you to select the maximum items to be
displayed.
Graph:
118
The Statistics Menu
•
“3D depth” spinbox—allows you to select the 3D depth of the graph items.
•
“3D angle” spinbox—allows you to select the 3D depth of the graph items.
Access Points Load Monitor
Shows wireless Access Points utilization rates. Available only when the current Probe
(or Probe instance) is capturing packets from a wireless network interface. Note that for
Observer to accurately assess utilization rates, you must enter the correct bandwidth
speed (i.e., 54000000 for 801.11a/802.11g, or 11000000 for 802.11b) in the Settings
dialog.
Menu Path
Statistics->Access Points Load Monitor
Purpose
The Access Points Load Monitor lets you to look at an access point (or group of access
points) in real time to see their utilization rate. You can quickly find out if an access
point is acting as a bottleneck and, if so, whether the source of the packets clogging the
AP are incoming or outgoing (or both). By examining historical information you can
tell whether this is a chronic problem, which might indicate the need for a faster
connection, or an acute problem, which might indicate a failure of some sort. Observer
does this passively; therefore, the Access Point is not affected.
Available Views
•
List and Dials View
•
3D Column Chart View
•
Pie View
Access Points Load Monitor
119
Settings
To use the Access Points Load Monitor you will need to first configure the mode.
This is done by clicking the Settings button, which will then display the Access
Points Load Monitor Setup dialog.
•
Select a Router from the list (of stations). Do so by highlighting the station. This
list is read from your address/alias list.
•
“Router speed (Baud)” textbox—this is the device’s defined throughput (in other
words, enter 54000000 for 802.11a/g access points, or 11000000 for 802.11b
access points.
List and Dials View
Dials provide a “heads-up” immediate display of packets/second, bits/second, and
interface utilization.
Right-Click Menu
120
•
Settings—displays the Settings dialog.
•
Reset Column Widths—Resets the columns to their original widths.
The Statistics Menu
3D Column Chart View
Pie View
Chart and Pie View Display Properties
Access Points Load Monitor
121
Data:
•
“Maximum items” spinbox—allows you to select the maximum items to be
displayed.
Graph:
•
“3D depth” spinbox—allows you to select the 3D depth of the graph items.
•
“3D angle” spinbox—allows you to select the 3D depth of the graph items.
Packet Size Distribution Statistics Mode
Shows statistics about the sizes of packets on your network.
Menu Path
Statistics->Packet Size Distribution
Purpose
Size Distribution Statistics Mode shows all stations on your network (subject to your
filter criteria) and each station’s traffic patterns broken down by the size of the packet.
This information can help pinpoint network flow problems and identify stations or
routers that are sending mostly small packets as opposed to larger packets.
The rest of the screen shows the size distribution, divided by packet size, in bytes.
This is shown as a percentage (or total packets) for each address.
Size Distribution Statistics mode can be activated from the main window by selecting
Statistics > Size Distribution Statistics.
Size Distribution is available in graph, list, 3D chart, and pie views. To begin
collecting statistics, click the Start button.
Size Distribution Statistics Setup Properties
Filtering direction—allows you to specify the direction of traffic which Observer will
display.
•
122
The Statistics Menu
“Destination” option button
•
“Source” option button
•
“Destination+Source” option button—in most cases, you will want to use the
Destination+Source option.
•
“Use current filter” checkbox—when checked, Observer will use the current filter
when showing mode information. When not selected, Observer will display mode
information on all stations, not using any filter.
Available Views
•
List View
•
3D Column Chart View
•
3D Pie View
List View
By default, the stations listed are all the stations on your network. In other words, this is
the “unfiltered” traffic. You can set Observer to view all traffic or filtered traffic in the
Size Distribution Statistics Setup dialog. see “Packet Size Distribution Statistics
Mode” on page 122.
Packet Size Distribution Statistics Mode
123
Display Properties
Display properties can be set by selecting the right-click menu item or by clicking the
Settings button. The Settings dialog offers configuration options for the components
of the display.
•
“Item” dropdown—allows you to select the item to be configured.
•
“Item color” dropdown—lets you select the color of the item listed in the “Item”
list.
Graph:
•
“Bar height” spinbox—lets you configure the bar thickness in pixels.
Packet ranges:
•
Show % option button—allows you to select the specific size range as a
percentage of total traffic for the station.
•
Show totals option button—allows you to select the specific size range as the
total number of packets for the station.
Right-Click Menu
The Size Distribution Statistics right-click menu offers a number of filtering options,
as well as access to the Display Properties dialog.
124
•
Start Packet Capture on station address(es)—activates the Filters dialog.
•
Start Packet Capture on pair address(es)—activates the Filters dialog.
•
Create Filter on station address(es)—activates the Filters dialog.
•
Create Filter on pair address(es)—activates the Filters dialog.
The Statistics Menu
•
Find—displays the Find dialog.
•
Settings—displays the Display Properties dialog.
3D Column Chart View
3D Pie View
Top Talkers Statistics Mode
Shows most active stations on your network, along with broadcast/multicast statistics.
Top Talkers Statistics Mode
125
Menu Path
Statistics->Top Talkers
Purpose
Top Talkers Statistics shows all stations on your network (subject to your filter
criteria) and the Broadcast/Multicast statistics. This information provides detailed
traffic flow statistics that can show a runaway station, a broadcast/multicast storm, or
an unbalanced switch.
If you are considering implementing a switch, this information can help divide
stations effectively for your switch. Once you have implemented a switch, using the
switched version of this mode can verify balanced port loads.
The Top Talkers window can be activated from the main window by selecting
Statistics > Top Talkers Statistics. You can choose MAC or IP view.
Top Talkers Setup Properties
MAC Properties Tab
Filtering direction—allows you to specify the direction of traffic Observer will
display. Options are listed below:
126
•
Destination option button
•
Source option button
•
Destination+Source option button—on most occasions, you would want to use
the Destination+Source option.
•
“Use current filter” checkbox—when selected, Observer will use the current
filter showing mode information. When not selected, Observer will display mode
information on all stations, not using any filter.
The Statistics Menu
IP Properties Tab
•
“Remove inactive IP address after (min)” spinbox—removes inactive IP addresses
(IP addresses which have no packet flow activity) after the number of minutes
entered in the dialog.
•
“Maximum number of IP addresses” spinbox—allows you to enter the number of
minutes before inactive IP addresses are removed.
•
“Resolve IP addresses using DNS” checkbox—if you have DNS, Observer will
attempt to resolve all IP addresses using their DNS name and display this
resolution in the “DNS” column.
•
“Use current filter” checkbox—when selected, Observer will use the current filter
showing mode information. When not selected, Observer will display mode
information on all stations, not using any filter.
Available Views
Top Talkers is available in Graph, List, 3D Chart, and Pie Views. Depending on what
hardware and driver you have installed, the following tabs are available:
•
MAC Tab
•
IP Tab
•
Wireless Types Tab (active for wireless analysis only)
•
Wireless Speeds Tab (active for wireless analysis only)
•
Wireless Latest Tab (active for wireless analysis only)
Right-Click Menu (all tabs)
The Top Talkers right-click menu offers a number of filtering options, as well as access
to the Display Properties dialog.
•
Start Packet Capture on station address(es)—starts a capture on highlighted station
address(es).
•
Start Packet Capture on pair address(es)—starts a capture on highlighted
address(es) pairs.
•
Create Filter on station address(es)—creates a filter on the highlighted station
address(es) and activates the filter dialog.
•
Create Filter on pair address(es)—creates a filter on the highlighted pair of
address(es) and activates the filter dialog.
Top Talkers Statistics Mode
127
MAC Tab
The MAC view offers a display of stations by MAC address.
Display Properties
Display properties can be set by right-clicking on the display or by clicking the
Settings button. The Settings dialog offers configuration options for the components
of the display.
•
“Item” dropdown—allows you to select which item will be configured.7
•
“Item color” dropdown—allows you to select the color of the main display item.
Graph:
•
128
The Statistics Menu
“Bar height” spinbox—allows you to select the bar height.
IP Tab
The IP view offers a display of stations by IP address.
To begin collecting statistics, click the Settings button. The display shows Alias, IP
address, and MAC address.
•
The “%” field shows the percent of bandwidth utilization for that
destination/source/total address.
This is the percent of filtered bandwidth. If you would like to see the
percent of total bandwidth that a particular address is using, you will need
to set up an ANY_ADDRESS to and from ANY_ADDRESS filter, and no
protocol filter.
•
The “Packets” field shows the number of packets to (or from) the
destination/source address, subject to the current filter set.
•
The “Bytes” field shows the bytes to (or from) the destination/source address,
subject to the current filter set.
•
Packets and Bytes are also displayed as rated values (Pkts/sec and Bytes/sec).
•
Broadcast and Multicast packet rates and numeric values are also displayed by
station.
Display Settings
Display properties can be set by clicking the Settings button. The 3D Pie/Column
chart tab offers configuration options for the components of the display.
•
“Item” dropdown—allows you to select which item will be configured.
•
“Item color” dropdown—allows you to select the color of the main display item.
Graph:
Top Talkers Statistics Mode
129
•
“Bar height” spinbox—allows you to select the bar height.
Wireless Types Tab (active for wireless analysis only)
This display shows the type of each station sensed in the air: whether it is a network
station talking over the air to wireless stations, a wireless station, or an AP. For
stations, it shows which APs they are using. For APs, it displays the Service Set
Identifier (SSID) and whether WEP is enabled on that AP. It also displays Control,
Data and Management totals per station. As with other tabular displays in Observer,
right-click on the column headings to configure the column view.
130
Statistic
Description
Alias
Alias of the Top Talker system, if one is available.
Address
Media Access Control (MAC) address, i.e., the “hardware address.”
Packets
The total number of packets sent by the system.
Management
The number of management packets sent by the system.
Control
The number of control packets sent by the system.
Data
The number of data packets sent by the system.
Probe Request
The number probe requests sent by the system.
Retries
The number of transmission retries sent by the system.
Type
The type of station: Wireless or Access Point
The Statistics Menu
AP Used
The access point used by the system.
Wireless Speeds Tab (active for wireless analysis only)
This tab shows signal strength, quality, the overall rate and data rate, as well as the
packet distributions for different rates. As with all of the statistical displays in Observer,
you can configure the mode to display only the statistics that you are currently
interested in by right-clicking on the column headers.
Statistic
Description
Alias
Alias of the Top Talker system, if one is available.
Address
Media Access Control (MAC) address, i.e., the “hardware address.”
Packets
The total number of packets sent by the system.
Avg Strength (%)
The average signal strength, as a percentage of the optimum.
Avg Quality (%)
The average signal-to-noise ratio, as a percentage of the optimum.
Avg Data Rate
The rate of data packets on the wireless network.
Avg speed
The speed of all packets on the wireless network.
Util %
The percentage of bandwidth utilized.
Pkt 1
The number of packets captured at 1Mbit/sec.
Pkt 2
The number of packets captured at 2Mbit/sec.
Pkt 5.5
The number of packets captured at 5.5Mbit/sec.
Top Talkers Statistics Mode
131
Pkt 11
The number of packets captured at 11Mbit/sec.
Wireless Latest Tab (active for wireless analysis only)
This tab shows the strength, quality, and speed of the wireless network, as seen at the
last poll, as opposed to the other Top Talker displays, which present running
averages.
Utilization History Mode
Displays long-term bandwidth utilization data and allows that data to be exported.
Menu Path
Statistics->Utilization History
Purpose
Utilization History displays (and allows for export) longer term information about
your bandwidth utilization. The graph shows high, low and average utilization over
time—the amount of time is only limited by your computer’s RAM. Sampling is still
once a second, but the display can be configured to report at various time intervals.
You cannot start or stop this mode. When the mode is displayed, it is automatically
started. To stop the mode, simply close the mode window. The Utilization History
display can be viewed in graph, dial, or list view. There is no setup dialog for
Utilization History.
132
The Statistics Menu
Once the Utilization History graph is displayed, it automatically begins capturing data.
The display of the data will depend on how you have setup each item in the Display
Properties dialog. There are three statistics that the display will keep track of:
maximum, average, and minimum. Although data points are only shown for the time
period set in the Display Properties dialog, data is collected and processed every
second, and then averages the data over the configured time period (seconds/interval).
Available Views
•
Graph View
•
Dial View
•
List View
•
3D Chart
Graph View
The clock
displays the
time period set
in the Display
Properties
dialog
Things to keep in mind:
•
While in graph mode, it is important to remember that the scroll bar at the bottom
of the graph will allow you to see historical utilization data that was collected
during the current session of Observer.
•
You can save Utilization History data to a comma-delimited file by choosing File >
Save Mode in Comma Delimited Format from Observer’s Main menu.
•
The Utilization History display can be cleared using the Clear button.
Utilization History Mode
133
Display Properties
Display properties can be set by right-clicking on the display or by clicking the
Settings button. The Settings dialog offers configuration options for the components
of the display.
This dropdown is active
only if “Lines” was
selected in the “Item
plot” dropdown.
•
“Item” dropdown—allows you to select which item will be configured.
•
“Item color” dropdown—allows you to select the color of the main display item.
•
“Item plot” dropdown—allows you to select the item to be displayed as lines or
bars.
•
“Item line thickness” dropdown—allows you to select the thickness of the line;
this is only active if you have selected “Lines” from the “Item plot” dropdown.
Graph horizontal scale:
•
“Pixels/interval” spinbox—allows you to select how many pixels each interval
display will occupy.
•
“Seconds/interval” dropdown—allows you to set the number of seconds
Observer will average before displaying interval information.
Right-Click Menu
Right-clicking on the graph will display the Display Properties dialog for Utilization
History – Graph View.
134
The Statistics Menu
3D Column Chart View
3D Line Chart View
Utilization History Mode
135
Dial View
The dial view of Utilization History provides a view of longer term information about
your bandwidth utilization. The dial shows high, low, and average utilization over
time.
Utilization Summary View
3D Step Chart View
136
The Statistics Menu
Utilization Thermometer Mode
The Utilization Thermometer displays the current network bandwidth utilization as a
percentage of the total theoretical network speed. Additionally, the thermometer shows
a running one minute and five minute average. These averages are shown on the right of
the bandwidth scale as round blue (1 minute) and red (5 minute) balls.
Utilization Thermometer can be activated from the main window by selecting Statistics
> Utilization Thermometer.
There are no configuration options for the Utilization Thermometer.
Web Observer
This mode was designed to view a Web server from the standpoint of the traffic flow
into and out of the device. In this mode, Observer focuses on all port 80 (the default for
Web traffic) or all port traffic going in and out of the specified device.
Web Observer mode can also be used to evaluate the port 80 (or all
traffic) usage of any station with an IP address, even if it isn’t a server.
Web Observer is available in graph and list views.
Utilization Thermometer Mode
137
Setup Properties
To use Web Observer you will need to first configure the mode. This is done by
clicking the
icon, which will then display the Web Observer Setup dialog.
•
“Select a web server from the list” dropdown—allows you to select the server’s
IP address, including alias and comment.
•
“Remove inactive IP address after (min)” textbox—allows you to set how long to
keep IP addresses on the table before assuming they are inactive.
Filtering:
•
Filter on hardware address option button
•
Filter on IP address option button
Select Web server port:
•
All ports option button—allows you to select all ports (i.e., all IP traffic).
•
Specific port option button and textbox—allows you to enter a specific port (the
default is 80). The textbox will be enabled when you select the Specific port
option button.
Available Views
•
List View
•
3D Chart and Pie Views
All views except List View include heads-up server address and response time dial
meters.
138
The Statistics Menu
List View
The Web Observer mode can be activated from the main window by selecting Statistics
> Web Observer.
The main display shows the Web server address. Should the server go down, the dial
display turns into a broken connection display.
The Web Observer display items include:
•
Stations—displays the number of stations that have exchanged traffic with the
selected server during the time that Web Observer has been running, minus those
stations whose IP addresses have been removed from the table, as configured
above.
•
Packets—displays the total number of packets transmitted and received by the
selected server during the time that Web Observer has been running.
•
Bytes—displays the total number of bytes transmitted and received by the station
during the time that Web Observer has been running.
•
Server—displays the name, IP address, and MAC address of the specified server.
•
Overall average packets per second—displays the average packets per second.
•
Overall average bytes per second—displays the average bytes per second.
•
Overall average utilization—displays the average utilization.
On the bottom pane display, Observer lists the current IP addresses that are
communicating with the specified Web server with the following information:
•
DNS Name—displays the name given to the listed station in Discover Network
Names mode.
•
IP address—displays the IP address of the listed station.
•
In packets—displays the number of packets sent to the listed station from the
specified Web server.
Web Observer
139
•
In bytes—displays the number of bytes sent from the listed station to the
specified Web server.
•
Out packets—displays the number of packets sent to the listed station from the
specified Web server.
•
Out bytes—displays the number of bytes sent from the listed station to the
specified Web server.
•
Total packets—displays the total number of packets sent between the listed
station and the specified Web server.
•
Total bytes—displays the total number of bytes sent between the listed station
and the specified Web server.
•
In % util.—displays the total utilization received between the listed station from
the specified Web server.
•
Out % util.—displays the total utilization transmitted to the listed station from
the specified Web server.
Display Properties
Display properties can be set by right-clicking on the display or by clicking the
icon. The Display Properties dialog offers configuration options for the components
of the display.
•
“Item” dropdown—allows you to select the look of the information presented in
the view.
•
“Item color” dropdown—allows you to select the color of the item listed in the
“Item” list box.
Graph:
•
140
The Statistics Menu
“Bar height” spinbox—allows you to configure the bar height in pixels.
Right-Click Menu
•
Start Packet Capture on station address(es)—activates the Filters dialog.
•
Start Packet Capture on pair address(es)—activates the Filters dialog.
•
Create Filter on station address(es)—activates the Filters dialog.
•
Create Filter on pair address(es)—activates the Filters dialog.
•
Find—displays the Find dialog.
•
Setup—displays the Setup Properties dialog.
•
Display Properties—displays the Display Properties dialog.
Wireless Access Point Statistics
Shows traffic passing through wireless Access Points (APs). Available only if a
Network Instruments wireless driver is installed with one of the supported wireless
cards.
Menu Path
Statistics->Access Point Statistics
Purpose
The Access Point Statistics mode shows traffic passing through any Access Points
(APs) visible to the Observer wireless NIC.
Wireless Access Point Statistics
141
This mode is an all-purpose tool for maintaining performance and security on a
WLAN that uses APs, showing you:
•
Wireless stations that are connected to an AP
•
Non-wired stations that they communicate with
•
Levels of signal strength, quality, data transfer rates, and non-data transfer rates
on each station on the access point
•
AP traffic totals
For example, you can immediately see if there is a station connected to the wrong AP,
or if an unauthorized AP has been installed. AP statistics will display whether a
station has a problem with quality or range of connection based on the number of
reassociations and retransmissions, or whether a station is misconfigured based on
station poll totals.
There are two Access Point Statistics tabs. The Cumulative tab shows running totals
of statistics collected since the mode was started; the Latest/Min/Max tab shows the
most recent, the minimum, and the maximum values for access point statistics.
The following table describes each statistic shown in List and Graph view.
Note that some columns are turned off by default; right click on the
column heading to set which statistics you want to display.
•
Access Point—The MAC address of the Access Point for this row of statistics.
•
Station—The MAC address or alias of the station communicating with the AP.
To switch between showing aliases and MAC addresses, press the Setup button
to the left of the display.
The following statistics are available on the Cumulative tab.
142
•
Type—The type of device connected to the AP: a wireless station, a station
(unwired), or another Access Point.
•
Avg Strength (%)—The average strength of the signal, expressed as a percentage
of the optimum strength.
•
Avg Quality (%)—The average signal-to-noise ratio of the signal, expressed as a
percentage of the optimum.
•
Avg Data Rate—The average rate of data packets on the wireless network.
•
Avg Rate—The average rate of all packets (data+control+management+beacon)
on the wireless network.
•
Packets—The total number of packets seen.
•
Data pkts (Directed)—The total number of data packets seen.
The Statistics Menu
•
Associations—The number of associations (connection sessions) that have been
established with this AP.
•
Bytes—The total number of bytes seen.
•
CRC—The total number of CRC errors reported by the AP.
•
Retries—The total number of transmission retries reported by the AP.
•
Station Polls—The total number of poll requests by station; a high number means
that a station cannot connect to an AP. In the 802.11b protocol, a station first polls
for an AP, then associates with a responding AP.
The following statistics are available on the Latest/Min/Max tab.
•
Latest Strength—The strength of the signal seen at the last poll.
•
Min Strength—The lowest strength signal seen, expressed as a percentage of the
optimum.
•
Max Strength—The highest strength signal seen, expressed as a percentage of the
optimum.
•
Latest Quality—The quality of the signal as seen at the last poll.
•
Min Quality—The poorest quality signal seen, expressed as a percentage of the
optimum.
•
Max Quality—The best quality signal seen, expressed as a percentage of the
optimum.
•
Latest Data Rate—The data rate seen at the last poll.
•
Min Data Rate—The slowest data rate seen, expressed in Mbits/sec.
•
Max Data Rate—The fastest data rate seen, expressed in Mbits/sec.
•
Latest Rate—The rate of total packet throughput seen at the last poll.
•
Min Rate—The slowest rate of total packet throughput seen, expressed in
Mbits/sec.
•
Max Rate—The fastest rate of total packet throughput seen, expressed in
Mbits/sec.
Setup and Display Properties
To change the bar height, color, and whether to display aliases or MAC addresses by
clicking the Display Properties icon to the left of the list or graph view. You can also
change the display properties for 3D charts and pie charts by clicking the Display
Properties icon to the left of the 3D Chart or Pie view.
Wireless Access Point Statistics
143
Right-click Menu
In Graph and List views, you can create a filter or start a packet capture on any listed
station or AP. You can also search for stations, APs, or MAC address by choosing
Find...
Wireless Site Survey
Scans selected wireless channels, displaying detailed activity on the WLAN by
channel.
Menu Path
Statistics->Wireless Site Survey (only available when a supported wireless card and
driver are installed.)
Purpose
The Wireless Site Survey displays activity by channels on your wireless network. Its
eight tabs show detailed statistical counts, letting you limit the display to Transmit
(TX) and Receive (RX) where appropriate.
Two things to note about the Site Survey:
•
You must set the channels to scan in the Probe or Device Properties dialog,
802.11a/b Settings. See “Wireless 802.11a/b Tab” on page 261.
•
When Observer is scanning channels, the other modes (such as Top Talkers,
Access Point Statistics) will no longer be able to present complete view of the
network, as Observer’s data sample is limited to the current channel being
scanned. Therefore, you should only use the Site Survey by itself.
The tabs and the information on them is described in the following sections.
Note that some fields are hidden by default; to reconfigure the display,
right-click on the statistics column heading.
144
The Statistics Menu
General Information Tab
This table summarizes essential information about what access points and stations are
currently visible to wireless Observer:
Frame Type Tab
This table summarizes frame type totals for wireless data, management, and control
packets:
Control Frames Tab
This table details control frames analyzed, including Power Save Polls, Requests to
Send (RTS), Clear to Send (CTS), acknowledge (ACK), and CF (Contention Free) End
packets.
Wireless Site Survey
145
Management Frames Tab
Displays detailed information about wireless management frames, including
association requests and responses, reassociation requests and responses, ATIMs
(Announcement Traffic Indication Message), and authentication/deauthentications.
Data Frames Tab
Displays detailed information about data frames on the wireless network.
Speeds Tab
Shows what stations are either transmitting (or receiving) wireless data at the various
supported rates. To switch between transmitting and receiving speeds, click the down
arrow next the Tx (or Rx) and select the desired setting.
146
The Statistics Menu
Signal Tab
Displays detailed statistics on wireless signal strength and quality, as well as data rates
being used by stations and APs.
Channel Scan Tab
•
Channel—Channel being tracked in this row of data.
•
Avg Strength (%)—The average strength of the signal, expressed as a percentage of
the optimum strength.
•
Avg Quality (%)—The average signal-to-noise ratio of the signal, expressed as a
percentage of the optimum.
•
Avg Data Rate—The rate of data packets on the wireless network.
•
Avg Rate—The rate of all packets (data+control+management+beacon) on the
wireless network.
•
CRC—Total number of CRC errors reported on this channel.
•
Packets—Total number of packets (data+control+management+beacon) seen.
•
Data pkts (directed)—Total number of data packets (packets with a payload and an
address) seen.
•
Beacons—Total number of beacons seen.
•
Bytes—Total number of bytes seen.
Wireless Site Survey
147
•
Retries—Total number of retries reported on this channel.
•
Min Quality—The poorest quality signal seen, expressed as a percentage of the
optimum.
•
Max Quality—The best quality signal seen, expressed as a percentage of the
optimum.
•
Latest Quality—The quality of the signal as seen at the last poll.
•
Min Strength—The lowest strength signal seen, expressed as a percentage of the
optimum.
•
Max Strength—The highest strength signal seen, expressed as a percentage of the
optimum.
•
Latest Strength—The strength of the signal seen at the last poll.
•
Min Data Rate—The slowest data rate seen, expressed in Mbits/sec.
•
Max Data Rate—The fastest data rate seen, expressed in Mbits/sec.
•
Latest Data Rate—The data rate seen at the last poll.
•
Min Rate—The slowest rate of total throughput seen, expressed in Mbits/sec.
•
Max Rate—The fastest rate of total packet throughput seen, expressed in
Mbits/sec.
•
Latest Rate—The rate of total packet throughput seen at the last poll.
Triggers and Alarms Mode
Lets you set triggers in response to particular network conditions, and define actions
to occur when the conditions are met.
Menu Path
Statistics->Triggers and Alarms
Purpose
Observer’s Triggers and Alarms mode allows you to set a trigger for a particular
network activity (using presets or defining your own) and to associate an action
condition when the triggered condition is present. Multiple triggers can be set and run
concurrently.
Actions can be pop-up windows, printed trouble tickets, or appended information to
an event log. Triggers can also be set to execute a user-defined program—such as an
email package or paging software.
Triggers and Alarms is available in List View.
148
The Statistics Menu
Start the Triggers and Alarms mode by clicking the Start button.
The initial Triggers and Alarms display shows the event log and the current trigger and
alarm settings (the number of configured triggers).
The Event Log can be saved by selecting File > Save Mode in Comma Delimited
Format from Observer’s main menu. The event log can also be cleared by clicking the
CLEAR icon.
Configuring Triggers and Alarms
1.
Configuring Triggers and Alarms is done through a series of dialogs accessed by
first clicking the Settings button from the main Triggers and Alarms display.
2.
Check one, many, or all of the items to enable alarms.
Configuring Triggers and Alarms
149
3.
Once you have set which alarms you would like to activate, select the “Triggers”
tab to configure the specific Alarm options.
4.
A separate action can be defined for each alarm or a single action can be set for
all alarms. The checkbox on the “Alarm List” tab defines which trigger setting
options will be displayed on the “Triggers” tab. see “Trigger Settings” on
page 150.
5.
Click on the “Actions” tab to display the Actions Settings dialog. see
“Fragmented IP Packets” on page 153.
Trigger Settings
Average Packet Size
This trigger is used to identify average packet sizes below a certain size over a period
of time.
150
•
“Trigger if below average packet size” textbox—allows you to set the size, in
bytes, of the minimum packet size to monitor.
•
“Minimum number of packets (trigger level)” textbox—allows you to set the
smallest number of packets in the averaging period that will be provided as data
for the trigger. For example, if you set the minimum number of packets to 1000
and the averaging period to 10 seconds, then if less than 1000 packets are seen in
The Statistics Menu
the ten second time period, this 10 second time period is not considered as data for
this trigger.
This value ensures that the trigger will not be activated during a slow period of network
activity when a particular device or station is broadcasting.
•
“Averaging period” spinbox—allows you to set the amount of time, in seconds,
that data will be collected and averaged before a value is considered for the trigger.
Sampling is every second. Values for the averaging period can be from 1 to 100
(seconds).
•
“Use current filter profile” checkbox—when selected, allows you to use the current
protocol filter.
Bad IP Checksum
This trigger activates if a bad IP checksum is encountered. This usually indicates a bad
network adapter or bad cabling and is a common cause of unexplained network
slowdowns.
•
“Use current filter profile” checkbox—when selected, allows you to use the current
protocol filter.
Broadcasts-Multicasts/Total Packets
This trigger activates when the ratio of broadcasts and/or multicasts is above a certain
user-specified level. This trigger is typically used to warn of broadcast/multicast storms.
•
“Broadcasts/received packets ratio (%)” checkbox and spinbox—allows you to set
the ratio as a percentage of broadcasts to received packets.
•
“Multicasts/received packets ratio (%)” checkbox and spinbox—allows you to set
the ratio as a percentage of multicasts to received packets.
•
“Minimum number of packets (trigger level)” textbox—this is the smallest number
of packets in an averaging period that will be provided as data for the trigger. For
example, if you set the minimum number of packets to 1000 and the averaging
period to 10 seconds, then if less than 1000 packets are seen in the ten second time
period, this 10 second time period is not considered as data for the trigger.
Configuring Triggers and Alarms
151
This value ensures that the trigger will not be activated during a slow period of
network activity when a particular device or station is broadcasting.
•
“Averaging period (sec)” spinbox—the amount of time in seconds that data will
be collected and averaged before a value is considered for the trigger. Sampling
is every second. Values for the averaging period can be from 1 to 100 (seconds).
•
“Use current filter profile” checkbox—when selected, allows you to use the
current protocol filter.
Duplicate IP Addresses
This trigger activates when two IP addresses that are identical, from different
hardware devices, are seen on your network.
•
“Use current filter profile” checkbox—when selected, allows you to use the
current protocol filter.
Ethernet Frame Errors
This trigger activates when a percentage of Ethernet frame errors are observed.
152
•
“Percentage of frames with errors (0.01%)” spinbox—allows you to set the
percentage of frames, within the limits of the number of packets collected and the
averaging period, that will set off the trigger.
•
“Minimum number of packets (trigger level)” textbox—allows you to set the
minimum number of packets collected before considering the data as a trigger
condition. This is set to ensure that a low network activity state does not trigger
an error alarm that is statistically meaningless.
•
“Averaging period (sec)” spinbox—allows you to set the amount of time in
seconds that data will be collected and averaged before a value is considered for
the trigger. Sampling is every second. Values can be from 1 to 100 (seconds).
•
“Use current filter profile” checkbox—when selected, allows you to use the
current protocol filter.
The Statistics Menu
Ethernet Frame Errors by Station
This trigger activates when there is an Ethernet frame error by station observed.
•
“Hardware Address” dropdown—allows you to select the hardware address
(station) that you want to trigger on. These addresses are read from the address
table (see Filters section).
•
“Percentage of error packets (0.01%)” spinbox—allows you to define the percent
of errors you want to trigger on.
•
“Min number of packets (trigger level)” textbox—allows you to define the
minimum number of packets you want Observer to examine prior to considering
the condition a triggerable event. This allows you to avoid low traffic situations
where the percent of error packets may be quite high, but the total traffic to/from
that station is so low that, in essence, it is an idle period.
•
“Time interval (seconds)” spinbox—allows you to set how long the trigger will
look at traffic and calculate the above conditions before resetting and starting over.
•
“Error Type” option buttons—allows you to select the type of error you want
Observer to trigger on: CRC, Align, or Too Small.
•
“Use current filter profile” checkbox—when selected, allows you to use the current
protocol filter.
Fragmented IP Packets
This trigger allows you to find fragmented IP packets and is used to find TCP/IP
devices that are not optimally configured (e.g., routers with MTUs that are set too
small) and devices that may be down (or are about to go down).
•
“Number of fragments” textbox—allows you to set the number of fragmented
packets which activate the trigger.
•
“Minimum number of packets (trigger level)” textbox—allows you to set the
smallest number of packets in an averaging period that will be provided as data for
Configuring Triggers and Alarms
153
the trigger. For example, if you set the minimum number of packets to 1000 and
the averaging period to 10 seconds, then if less than 1000 packets are seen in the
ten second time period, this 10 second time period is not considered as data for
the trigger.
This value ensures that the trigger will not be activated during a slow period of
network activity when a particular device or station may be sending only a few
fragmented packets, but they constitute a high percentage of the total.
•
“Averaging period (sec)” spinbox—allows you to set the amount of time, in
seconds, that data will be collected and averaged before a value is considered for
the trigger. Sampling is every second. Values can be from 1 to 100 (seconds).
•
“Use current filter profile” checkbox—when selected, allows you to use the
current protocol filter.
IPX Server Busy
This trigger is activated when Observer sees a 9999 NCP (server busy) packet. This is
one of the first things to check when looking for NetWare slowdowns.
•
“Number of server busy replies” textbox—allows you to set the number of NCP
9999 packets received in an averaging time period.
•
“Minimum number of packets (trigger level)” textbox—allows you to set the
smallest number of 9999 NCP packets in the averaging period that will be
provided as data for the trigger. For example, if you set the minimum number of
packets to 1000 and the averaging period to 10 seconds, then if less than 1000
packets total are seen in the ten second time period, this 10 second time period is
not considered as data for the trigger.
This value ensures that the trigger will not be activated during a slow period of
network activity where a NetWare server may be sending only a few 9999 packets,
but they constitute a high percentage of the total. This situation would be unusual, but
you may want to deliberately set the minimum number of packets to a low threshold
to see if server busy is still showing. If so, the server is not network load bound, but
has an internal limitation that is slowing down its response to external requests.
•
154
The Statistics Menu
“Averaging period (sec)” spinbox—allows you to set the amount of time, in
seconds, that data will be collected and averaged before a value is considered for
the trigger. Sampling is every second. Values can be from 1 to 100 (seconds).
•
“Use current filter profile” checkbox—when selected, allows you to use the current
protocol filter.
Number of Packets
This trigger is for the number of packets per time period. Typically, it is used to
calculate the packets/second for a particular device (e.g., router or bridge).
•
“Number of packets (trigger level)” textbox—allows you to set the actual number
of packets that are sent/received with respect to your current filter. For example, if
you have a router or bridge that is rated at a particular packets/second throughput,
you could set a trigger to let you know if that device is being asked to service more
traffic than it is rated for. To do this, you would first set a filter to see packets that
are going and coming from the device. Then, you would set the number of packets
per second that the device is rated at in this dialog. Running this trigger will let you
know if and when the device is being overrun and whether it is a source of network
slowdowns.
•
“Time interval (seconds)” spinbox—allows you to set how long the trigger will
look at traffic and calculate the above conditions before resetting and starting over.
•
“Use current filter profile” checkbox—when selected, allows you to use the current
protocol filter.
Occurrence of Hardware Address
This trigger allows you to set when the occurrence of a specified hardware address is
observed.
•
“Hardware address” dropdown—allows you to select the hardware address.
•
“Address to check” option buttons—allows you to choose from Destination or
Source.
•
“Use current protocol filter” checkbox—when selected, allows you to use the
current protocol filter.
Configuring Triggers and Alarms
155
Sequence of Bytes at Offset
This trigger allows you to set a trigger on a user-defined event.
•
“Sequence (hexadecimal)” textbox—allows you to set the actual packet
information to look for. This is entered as hexadecimal codes. This sequence is
non-byte swapped (i.e., network byte order). For example, if you define an
offset-sequencing trigger to look for telnet packets (i.e., looking for TCP port
23), the offset would be 34 (14 bytes of Ethernet header + 20 more bytes of IP
header) and the sequence would be 00 17 (23 in hex).
See the section on active highlighting (in the Packet View sections of the manual) for
help on creating offsets. You can enter a specific offset from a packet’s beginning and
specific information to look for after that offset.
•
“Offset from beginning” textbox—allows you to set the decimal position to start
looking for the sequence.
•
“Use current protocol filter” checkbox—when selected, allows you to use the
current protocol filter.
Unknown IP Addresses
This trigger is designed to have Observer scan all packets and locate an unknown IP
address. This is useful if you have users who may inadvertently (or not) change their
IP address; thus, causing problems with any IP address strategy.
To use this trigger, you must have a “hosts” file in the Observer installation directory.
This host file should have all known IP addresses listed. Observer will compare all
newly found IP addresses to the addresses in the hosts file, and if a new address is
found, Observer will trigger the associated action.
Configuration includes the exclusion of up to three hardware addresses (usually
routers).
156
The Statistics Menu
•
“Exclude hardware addresses” combo box—allow you to select the hardware
address.
•
“Use current protocol filter” checkbox—when selected, allows you to use the
current protocol filter.
Utilization
The Utilization setup dialog lets you set utilization thresholds that will trigger an action.
•
Utilization trigger level (%) spinbox—allows you to set the percentage of network
bandwidth utilization which you select as the trigger.
•
Condition section—allows you to choose different ways that the utilization trigger
can be reached. Maximum utilization is the condition when the actual utilization
has reached a user-specified number of times. Average utilization is the condition
when the network’s average utilization is greater than the utilization trigger.
•
“Averaging period (sec)” spinbox—allows you to set the amount of time, in
seconds, that data will be collected and averaged before a value is considered for
the trigger. Sampling is every second. Values can be from 1 to 100 (seconds).
•
“Use current protocol filter” checkbox—when selected, allows you to use the
current protocol filter.
Wireless Frame Errors
This dialog lets you set up a trigger for Wireless Frame Errors:
•
“Percentage of frames with errors” spinbox—Set the percentage of errors that will
trigger an alarm.
•
“Minimum number of packets (trigger level)” spinbox—Set the minimum number
of error packets that will trigger an alarm.
Configuring Triggers and Alarms
157
•
“Averaging period (sec)” spinbox—Specify how long to collect packets for
calculating the average.
•
“Use current filter profile”—When checked, causes Observer to only look at
traffic that falls within the current filter profile when calculating the trigger
values.
Wireless Frame Errors by Station
This dialog lets you set up a trigger for Wireless Frame Errors by Station:
•
“Hardware address” spinbox—Specify a hardware address. Until you specify a
hardware address, the trigger is not activated.
•
“Percentage of error packets” spinbox—Set the percentage of errors that will
trigger an alarm.
•
“Min number of packets (trigger level)” spinbox—Set the minimum number of
error packets that will trigger an alarm.
•
“Averaging period (sec)” spinbox—Choose how long to collect packets for
calculating the average.
•
“Error Type” radio buttons—Choose CRC (Cyclical Redundancy Check), WEP
(Wireless Equivalency Privacy), or PLCP (Physical Layer Convergence
Protocol).
•
“Use current filter profile”—When checked, causes Observer to only look at
traffic that falls within the current filter profile when calculating the trigger
values.
WIreless Unknown Access Points
This dialog lets you set up a trigger for unknown access points:
158
The Statistics Menu
•
“Modify Known AP” button—Launches a dialog from which you can provide a list
of known Access Points.
•
“Use current filter profile”—When checked, causes Observer to only look at traffic
that falls within the current filter profile when looking for an unknown AP.
Actions
Once a trigger condition is reached, Observer allows you to configure an action to take
place. A number of different actions are possible. An action is independent of the actual
trigger or alarm (i.e., any action can be configured for any trigger or alarm).
One action or set of actions can be defined for all triggers, or a separate action or set of
actions can be configured for each trigger separately. The checkbox at the bottom of the
Alarm List dialog toggles the ability to set actions separately for each trigger.
The Actions dialog displays the following action choices:
•
Start/Stop Observer mode—automatically Starts/Stops any one of the listed modes
(in the dropdown dialog) when the trigger condition is reached.
•
“Append to Event Log” checkbox—when selected, Observer writes the trigger
condition to the event log. The event log is displayed in the initial Triggers and
Alarms dialog.
•
“Pop up a message” checkbox—when selected, prompts Observer to pop up a
message window on the Observer station notifying you of the trigger condition.
This message box will display the trigger condition.
•
“Sound a signal” checkbox—when selected, sounds an audible signal when the
trigger condition is reached.
Configuring Triggers and Alarms
159
•
“Print to the default Windows printer” checkbox—when selected, prompts
Observer to print a trouble ticket to the default Windows printer. The trigger
condition will be printed on the trouble ticket.
•
“Disable this alarm after the first event” checkbox—when selected, stops the
Trigger/Alarm mode after the first occurrence of the trigger condition.
•
“Write to a file” checkbox—when selected, prompts Observer to write the
current trigger condition to a specified file and activates the Setup button. When
the Setup... button is clicked, the Setup File Action dialog is displayed.
•
•
“File Name” textbox—allows you to specify the file name.
•
APPEND TO FILE option button—if selected, appends the file.
•
OVERWRITE FILE option button—if selected, overwrites the file.
•
“Use these settings for all alarms” checkbox—if selected, settings are used
for alarms.
“Execute a program” checkbox—when selected, prompts Observer to execute a
program and activates the Setup button. When the Setup button is clicked, the
Setup Execute Command Action dialog is displayed.
•
“Command Line” textbox—allows you to enter a command line.
When specifying a program to execute, you may include the option -LOG in the
command line. When -LOG is specified in the command line, a temporary file name
pointing to a file containing the whole event log or the last log entry will be
substituted for the -LOG flag.
•
160
The Statistics Menu
WRITE THE LAST LOG ENTRY option button—if selected, writes the last log
entry.
•
•
WRITE THE WHOLE EVENT LOG option button—if selected, writes the whole
event log.
•
“Use these settings for all alarms” checkbox—if selected, settings are used for
alarms.
“Send an email” checkbox—when selected, instructs Observer to send an email
message as the action and activates the Setup button.
You must set up the general email server information in the Options >
Observer General Options > Email Notifications tab. see “Observer
General Options – Email Notifications Tab” on page 79.
•
“Dial a pager” checkbox—when selected, instructs Observer to send information to
a pager as the action, and activates the Setup
icon. When the Setup icon is
clicked, the Dial Pager Action dialog is displayed.
Information to send the pager:
•
•
SEND THE LAST LOG ENTRY option button—when selected, sends the last log
entry to the pager.
•
SEND THE WHOLE EVENT LOG option button—when selected, sends the entire
contents of the event log to the pager.
•
SEND TEXT OR NUMBERS FROM THE LINE BELOW option button—when
selected, sends whatever is listed in the edit box to the pager.
•
Blank textbox—allows you to enter specific text or numbers for the pager to
send.
•
“Use these settings for all alarms” checkbox—if selected, settings are used for
alarms.
“Send SNMP Trap” checkbox—when selected, sends an SNMP trap to a
designated IP address and activates the Setup button. When configured to send a
trap as an alarm action, Observer sends one of two SNMP “enterprise” traps,
depending upon whether the event is a threshold event—utilization exceeding the
set threshold level, for example entries, or a single event, such as the appearance of
an unknown IP address.
Configuring Triggers and Alarms
161
The Management Information Base, or MIB, for Observer’s traps is NETINSTMIB.MIB and will be found in the “Observer Files” directory.
While this file is not needed in order to configure Observer to send an
SNMP trip, it will be needed in order to configure the SNMP device or
program receiving the trap.
Clicking the SETUP button displays the Setup Send Trap Action dialog.
•
“Destination IP Address” textbox—allows you to set the IP address of the
station to which the SMTP trap is to be sent.
•
“Destination Port” textbox—allows you to set the IP address of the station
(usually a personal computer) to which the SMTP trap is to be sent.
•
“Community String” textbox—allows you to set the community name, or
password, of the station to which the SMTP trap is to be sent.
•
“Use these settings for all alarms” checkbox—when selected, the same
settings will be used for all alarm actions that send SMTP traps.
You cannot manually configure which trap is sent. Observer chooses
the appropriate trap automatically.
FDDI Network Vital Signs
Provides a summary of FDDI network errors.
Menu Path
When FDDI is the active Probe or Device, select
Statistics-=>Network Vital Signs
Purpose
FDDI Vital Signs provides a summary of the errors occurring on an FDDI ring
mapped with current error conditions on your network.
This display has been designed to give you a snapshot of error conditions and the
importance of those error conditions with respect to the current network activity.
These error conditions are displayed as three different error groups and beacons. This
162
The Statistics Menu
display shows aggregate errors for your ring. Should these aggregate errors indicate a
problem, specific errors by station are available in the FDDI Errors by Station dialog,
and complete SMT and MAC by station information is available in the FDDI SMT and
MAC decodes found in Packet Capture and Decode.
The error groups are Beacons, Error Count, Lost Count, and Not Copied.
Beacons
Beacons indicate that a card (or cards) cannot insert into the ring. Beaconing is used by
FDDI to isolate a break in the FDDI ring. If the node that is beaconing does so for more
than 10 seconds, the ring will assume that this node has a stuck beacon, and the ring will
initiate a self test for each node on the ring. If a node fails the self test, it will remove
itself from the ring. The upstream neighbor on the ring will identify the beaconing
station.
Error Count
An Error Count indicates defective frames on the ring.
Lost Count
Lost Count indicates packets that went around the ring with a valid destination address,
but were not copied (received) by any station.
Not Copied
Not Copied is an SMT frame indicating that a packet was sent, but not copied to the
receiving station. This usually happens because there was not enough buffer space on
the receiving card.
It also points out the total number of SMT and MAC frames for the collection period.
The collection period for the Network Vital Signs can be set under Options > Selected
Probe or SNMP Device Properties > Vital Sign report (refresh) period (sec).
Wireless Vital Signs
Shows current wireless activity mapped with current wireless error conditions on a
wireless network. An NI Wireless driver and supported card are required.
Menu Path
When the currently active probe or device is wireless, choose
Statistics->Network Vital Signs.
Wireless Vital Signs
163
Purpose
The Wireless Vital Signs mode shows current wireless activity mapped with current
wireless error conditions on your WLAN. The Vital Signs mode displays a
comprehensive snapshot of error conditions and of their criticality in the context of
current WLAN activity. To pin down aggregate problems revealed by Wireless Vital
Signs, go to Access Point Statistics, Top Talkers, and Errors by Station.
Another way to use this “at-a-glance” view of network health is to install Observer on
a wireless laptop and watch what happens to the vital signs as you move the system
around your office.
Available Views
•
Graph View
•
Dial View:
•
List View
Graph View
The Graph view of Wireless Network Activity shows the error rates and other
statistics in spike meter with a user-selectable interval. You can use the scrollbar to
move “backwards in time;” hovering the cursor over any point on the graph gives
details about that point in time.
Right click Menu
Right clicking anywhere on the graph menu launches the Display Settings dialog,
where you can set graph colors, and the time interval for sampling data.
164
The Statistics Menu
Dial View:
In Dial View, vital signs are plotted against 4 axes, each representing one of the four
protocol-defined bit rates. This allows you to see the relationships between:
•
Data Packets (packets with a payload)
•
Non-Data Packets (control, management, and beacon)
•
Errors of all types, broken down by type in the table to the right of the graph
display.
This lets you immediately see each statistic in its proper context. For example, an error
rate of 50% is insignificant if Observer has only analyzed two packets, but quite
significant if thousands of packets have been analyzed.
The bar graphs to the right of the dial show current bandwidth utilization (U), the
average strength (S), and the average quality (Q) of the signal. These meters also
indicate (with watermark “floats”) the minimum and maximum values that Observer
has seen since the last polling period.
Network Summary
Shows a summary of current network activity in a browsable tree.
Menu Path
Statistics->Network Summary
Network Summary
165
Purpose
The Network Summary’s browsable tree is a convenient place to find all the major
statistical counts of bandwidth usage, size distribution, protocols and errors for your
network.
Available Views
•
List View (which displays the tree)
List View:
Saving and Replaying Saved Statistical Modes
Observer allows all time-sensitive statistic displays to be saved and reloaded for later
analysis.
All displays that allow this functionality include a Save Mode in Comma Delimited
Format and a Load Comma Delimited File in that displays Tools menu, and in the
Observer Main Window’s File menu.
For example, to save the active Network Activity Display data, select File > Save
Mode in Comma Delimited Format. By saving the file, you can later view the saved
data by going back into the Network Activity Display and selecting File > Load
Comma Delimited File. This will display a separate Network Activity Display with
your historical data loaded
166
The Statistics Menu
Trending and Analysis Menu
Network Trending Mode
Network Trending Overview
Observer’s Network Trending mode, in conjunction with the Network Trending
Viewer, allows you to collect, store, view, and analyze the network traffic statistics
over long periods of time. This will provide you with baseline comparison data,
which is often essential in identifying and troubleshooting network performance
problems. Network Trending also generates text reports about network conditions
over specified time periods.
You can configure Observer to run Network Trending mode continuously or start the
Network Trending mode automatically every time you start Observer. The statistics
data is stored in a format that can be easily compressed and passed for viewing to any
site that has an Observer Network Trending Viewer installed. The Network Trending
Viewer does not collect the traffic information, it only processes the information
collected by Observer.
The task of collecting network statistics over a long period of time imposes
limitations on the ways data can be collected and stored. Protocol analyzers can
provide many types of information, and often it is difficult to know in advance what
data will be needed to find the cause of an existing problem or to diagnose a
developing one.
Ideally, it would be best to collect all of the data passing through the network and then
go through the data back and forth with some kind of analysis tool and view the
processed data from different perspectives. Unfortunately, the volume of data passing
through a typical network is usually very high. The huge amount of data generated by
capturing every packet over long periods of time would not be practical to store and
analyze given a typical PC’s disk and processor resources.
Protocol analyzers deal with this problem using a mechanism called “sampling.” The
term “sampling” refers to a method of collecting only some portion of the total data
flowing on a network at any one moment and statistically adjusting the results for this
as a representation of the total data sent on the network. This may mean that a
protocol analyzer, through sampling, may process only one packet in every ten. The
number “10” in this case is called a sampling divider. Since the protocol analyzer can
keep up with the processing of every tenth packet in high and low traffic conditions, it
167
provides a more accurate statistical picture than a protocol analyzer that tries to
process all incoming data. A protocol analyzer that tries to capture all incoming data
will lose more packets during high traffic bursts and less in slower traffic periods.
Network Trending manages these enormous amounts of data in the following ways:
•
First, it allows you to choose a sampling divider appropriate for your network.
An approximate rule for selection of the sampling divider for a Pentium 166
MHz PC running Observer is the maximum expected bandwidth utilization
divided by 4. This means that if the bandwidth utilization on the network often
reaches 80% (this would be quite high), you will want to use the sampling
divider 20 (or higher). You should select a still higher sampling divider on a
slower PC. Statistically speaking, a sampling divider of 10 (i.e., 1 in 10 packets
are sampled) collects plenty of data to “see” a complete picture of network traffic
over a course of hours or days. In reality, a much larger divider can be used
without the risk of erroneous results. Most modern PCs can easily handle this
sampling rate on a 100MB/sec Fast Ethernet or 16MB/sec Token Ring.
The sampling divider represents a trade-off between accuracy and speed. The
higher the sampling divider, the less data that will be collected; thus, the less
accurate the data collection. The lower the sampling factor, the slower the postprocessing of data will be, as well as the higher the likelihood of non-statistically
adjusted dropped data will affect your results.
•
Second, once the data is collected, the Network Trending Viewer aggregates the
data to display information in a number of convenient summation-oriented
charts, tables, or reports. The Network Trending Viewer lets you view data from
a perspective of time, and thus gives you an overview of how your network is
functioning over the course of hours, days, or weeks. This information will be
useful in a number of ways, but specifically, it allows you to see trend
information that would only be guesswork with a standard protocol analyzer’s
information. Trend data may show usage patterns that indicate the need for a
configuration change, a change in how a system is used, or that there are
infrequent, but foreseeable problems.
The Network Trending facility was integrated into Observer to provide a second
perspective to the data Observer collects. Observer’s standard modes are designed to
give you an instant snapshot of the current condition of the network. This allows you
to troubleshoot with instantaneous information. Network Trending provides a broader
view of your network and gives you overall trend information. This trend information
may be useful to solve a specific problem and can be used for long-term planning.
You can think of Network Trending as Observer information plotted against the added
dimension of time.
168
Trending and Analysis Menu
Network Trending
Network Trending is where Observer collects data for later viewing with the Network
Trending Viewer.
Dashboard
display
Dial
display
Network Trending
progress bar
Internet Observer
progress bar
Network Trending and the Dashboard
The Dashboard display is combined with the Network Trending mode and Internet
Observer Trending mode to supply a continuous heads-up display of the general
network trends, Internet networking trends, and CPU conditions on the segment being
monitored.
•
Progress bar- The bar will fill up the progress track as each collection interval is
completed. For example, if the collection interval is set for one hour, the bar will
take one hour to fill up. This allows you to see at a glance the state of your
collection.
There are two progress bars: one displays the progress of Network Trending and
the other displays Internet Observer Trending.
The Network Trending pane contains the following items:
•
Interval—lists the block of time in which data will be collected.
•
Stations—lists the number of stations on the network that have sent traffic during
the present interval.
•
Packets—lists the number of packets sent on the network during the present
interval.
•
Bytes—lists the number of bytes sent on the network during the present interval.
•
Start time—displays the start time of the present interval.
•
End time—displays the end time of the present interval.
•
Current time—displays the current time.
Network Trending Mode
169
The Internet Observer Trending pane contains the following items:
•
Pairs—lists the number of station pairs on the network that have exchanged IP
traffic during the present interval.
•
Packets—lists the number of IP packets sent on the network during the present
interval.
•
Bytes—lists the number of bytes sent in IP packets on the network during the
present interval.
•
Start time—displays the start time of the present interval.
•
End time—displays the end time of the present interval.
•
Current time—displays the current time.
The four dial displays are:
•
Packets/second (Pkt/s)—displays the packets per second rate in dial and history
(the graph below the dial) format.
•
Bytes/second (B/s)—displays the bytes per second rate in dial and history (the
graph below the dial) format.
•
Bandwidth Utilization (Util)—displays the currently monitored segments
bandwidth utilization in dial and history (the graph below the dial) format.
•
Processor Utilization (CPU)—displays the local (or Probe) PC’s current
processor utilization in dial and history (the graph below the dial) format.
The Dashboard information pane contains the following items:
•
Stations—lists the number of stations on the network that have sent traffic
during the current Network Trending session.
•
Packets—lists the number of packets sent on the network during the current
Network Trending session.
•
Bytes—lists the number of bytes sent on the network during the current Network
Trending session.
The dashboard is always on when the mode is displayed. The dashboard will display
information from the time Network Trending was started—it shows a continuous
display, not just of the current poll.
There are no display configuration items for the Dashboard.
Collecting Network Trending Information
Using Network Trending mode to collect the data involves the following steps:
170
Trending and Analysis Menu
6.
To start Network Trending, choose Trending/Analysis > Network Trending from
the main Observer menu or click on the Start button on the toolbar. The Network
Trending dialog will be displayed.
7.
Click the Settings button to enter the Network Trending Settings dialog. See
“Network Trending Setup” below.
8.
Configure your collection parameters.
9.
Click the Start button. Observer will begin to collect data. This may take from
minutes to hours depending on the amount of time you set the Statistics Collection
Interval.
Network Trending Setup
Clicking the Settings button displays the Network Trending Settings dialog.
We recommend using the default setup options for your first few sessions
(and possibly setting the collection interval to one minute). After you get a
feel for how Network Trending works, you can experiment with the
additional settings.
Network Trending Setup – General Tab
The General tab includes the following items:
•
“Enable Network Trending” checkbox—allows you to enable/disable Network
Trending.
•
“Enable IP Trending” checkbox—allows you to enable/disable IP Trending.
•
“Use current filter” checkbox—allows you to set Network Trending to use the
current filter when collecting information.
Network Trending Mode
171
•
“Modify Network Trending and Internet Observer TCP/IP Subprotocols”
button—click to display the List of IP SubProtocols dialog.
The List of IP SubProtocols dialog displays the SubProtocols and allows you to add a
new one, change an existing one, or delete an existing one.
172
1.
To edit or add a protocol, click on the EDIT or ADD button.
2.
The Add/Edit IP SubProtocol dialog is displayed.
3.
If you are editing a protocol, the protocol you selected on the List of IP
SubProtocols will be displayed in the SubProtocol textbox. The information in
this textbox is editable.
4.
If you are adding a protocol, enter the desired name of the SubProtocol in the
textbox. You can have a total of 12 subprotocols in your list of IP SubProtocols.
5.
Add or edit the port numbers in the Port 1, Port 2, Port 3, Port 4, or Port 5
textboxes.
6.
Select either TCP or UDP from the dropdown boxes.
7.
Click on the Ok button to display the List of IP SubProtocols dialog.
8.
If you need to delete a protocol, click on the DELETE button. The confirm Delete
IP SubProtocol dialog will be displayed.
Trending and Analysis Menu
9.
To delete the selected protocol, click on the YES button. To cancel the delete
request, click on the NO button.
Network Trending Setup – Data Collection Tab
This setup allows you to select the days and times you wish to collect trending data.
•
“Run Network Trending continuously” checkbox—allows you to select to run
Network Trending at all times Observer is running, even if it is not displayed.
If you want to be sure that Network Trending is running at all times that the
Observer PC is on, check this box and add Observer to your Windows
Startup group.
Time to collect statistics (24 hour clock):
•
“Collect statistics at all times” checkbox—allows you to select to have statistics
collected at all times Network Trending is running. If you check this item, the
Begin, End, and Week days boxes will be disabled. If your business hours are from
8:00 am to 5:00 pm and employees generally show up a little early and stay a little
late, you would set this to begin at 07 hour 00 min and end at 18 hour and 00 min.
This begins statistics at 7:00 am and ends the collection each day at 6:00 pm. You
can also select specific days of the week for collection.
•
“Begin hour and minutes” textboxes—allow you to enter the time the collection of
trending data will begin on the days selected. You must enter time information
using military time (i.e., 8 am = 0800, 3 pm = 1500).
•
“End hour and minutes” textboxes—allow you to enter the time the collection of
trending data will end on the days selected. You must enter time information using
military time (i.e., 9:30 am = 0930, 4:15 pm = 1615).
Setting only your business’ main traffic times is a good idea for two reasons: it
allows you to view only the important data without cluttering displays with
additional data, and it drastically saves on disk space regardless of the amount of
Network Trending Mode
173
data flowing on your network (when Network Trending uses a constant amount
of disk space for each collection period).
•
“Week days” checkboxes—allow you to select the days trending data will be
collected.
Network Trending Setup – Data Transfer Tab
The Data Transfer tab is only relevant when using a remote Probe to transfer data to
Observer.
•
“Periodically transfer Trending data” checkbox—allows you to setup the Probe
to transfer data according to the interval set.
•
“Transfer interval (min)” textbox—sets the time interval, in minutes, between
transfers of data from the remote Probe to the local Observer console.
Network Trending Setup – Network Trending Specific Tab
The Network Trending Specific tab contains the Network Trending Specific
Parameters box.
•
174
“Sampling divider” textbox—allows you to set the value for n, where Network
Trending will look at one out of every n packets.
Trending and Analysis Menu
•
“Statistics collection interval” textbox—allows you to set the time period, in
minutes, for which Network Trending will log data.
Network Trending Setup – IP Trending Specific Tab
The IP Trending Specific tab contains three checkboxes, permitting the user to choose
which information to collect.
Trending Information to Collect:
•
“Internet Patrol” checkbox—causes Network Trending to collect Internet Patrol
information.
•
“IP Pairs” checkbox—causes Network Trending to collect IP Pairs information.
•
“IP Protocols” checkbox—causes Network Trending to collect IP Protocols
information.
Network Trending Viewer
To access Network Trending Viewer select Trending/Analysis > Start Network
Trending Viewer or click on the
icon on the toolbar. If you click on Start Network
Trending Viewer from the Trending/Analysis menu, the Network Trending Viewer
mode will be displayed. If you click on the icon, the View Network Trending Data
dialog will be displayed.
•
Transfer and view current day statistics option button—when selected, allows you
to view the current day statistics.
Network Trending Mode
175
•
View Probe data listing option button—when selected, allows you to view the
Probe data listing.
•
Start Network Trending viewer option button—when selected, opens the
Network Trending Viewer.
The Network Trending Viewer is the facility where Network Trending and Internet
Observer Trending data can be viewed and manipulated. Network Trending Viewer
can display statistical data that has been collected in a chart or list format—for the
network as a whole and for every individual station present on the network at any
moment in time.
Viewer tree
Options toolbar
Screen display
tabs
Viewer Tree
The Viewer tree is where the user gets an overall view of the time periods for which
trending data is available for Network Trending (shared and switched) and Internet
Observer Trending. Branches with a root entry ending “Observer” or “Probe” contain
176
Trending and Analysis Menu
Network Trending data. Branches with a root entry ending in “(Internet)” contain
Internet Observer data. Branches ending in “(Switch)” contain switch trending data.
Observer
data
Internet
data
Switched
data
Within the branch, the calendar tree displays each Probe’s trending data in a tree-format
based on first the Probe, the month, the day, and then the station.
The Network Trending Viewer’s main screen displays a Viewer tree, a date or calendar
tree, a toolbar, a View/Display area, and (possibly) scroll bars.
The Network Trending Viewer Toolbars
The Network Trending Viewer has two toolbars which have menu access throughout
the Modes Menu:
•
Statistics Toolbar (will not be displayed if viewing Internet data)
•
Options Toolbar
The Statistics Toolbar
Network Trending Mode
177
The Statistics Toolbar contains the following buttons in order from top to bottom:
Stations activity time—displays when each station was first seen on the network
and when it was last seen on the network.
Top Talkers—displays each station’s total packets in and out, and each station’s
total bytes in and out.
Packet Size Distribution—displays the packet size distribution.
Bandwidth Utilization—displays the bandwidth utilization (maximum, average, and
minimum) for the selected day or days. You must have selected “show date by time.”
Router Bandwidth Utilization—displays router bandwidth utilization in total packet
or percentage format.
You must have a router and a router speed selected in
Observer’s Router Observer mode to see statistics in this
dialog and you must have the router selected in the list.
Protocols—displays the protocols seen on the network. Available types are: TCP/IP,
IPX/SPX, NetBIOS (including NetBEUI), AppleTalk, DECNET, SNA, and Other.
TCP/IP Subprotocols—displays the subprotocols of TCP/IP seen on the network by
type. This includes ARP, RARP, IP, TCP, UDP, ICMP and Other.
IPX Subprotocols—displays the subprotocols of IPX/SPX seen on the network
broken out by type. Available types are: SPX, IPX, SAP, NCP, RIP, NetBIOS, Diagn
(Diagnostic), WatchDog, Serializ (Serialization), and Other.
IP Applications—displays configurable (port-based) IP applications. These are
configurable in the Network Trending Setup dialogs.
Errors—this display will be dependent on the topology of the trending data.
Selecting a day on the calender tree will display the aggregate errors for the entire
network based on time stamps or station (depending on the state of the “Show data
by station” or “Show data by time” buttons).
When a day is selected on the calendar tree, you
will see aggregate errors for the entire network.
Token Ring errors—displays all Token Ring soft errors. This data is similar to the
Token Ring Network Vital Signs in Observer.
Ethernet Frame errors—this displays the frame errors as collected by the NDIS
MAC driver. This data is analogous to the Ethernet Network Vital Signs in Observer.
178
Trending and Analysis Menu
FDDI frame errors—this displays the frame errors as collected by the NDIS MAC
driver. This data is analogous to the FDDI Network Vital Signs in Observer.
When a station is selected on the calendar tree, you
will see aggregate errors by station displayed in
Observer.
Token Ring errors (by type)—displays the Token Ring errors by severity type. This
data is analogous to the Token Ring Errors by Station display in Observer.
Network Errors by Station—displays the Ethernet station errors if you are using a
supported network adapter card and driver that can report errors by station. This
data is analogous to the Network Errors by Station display in Observer.
FDDI by station—displays the FDDI station errors. This data is analogous to the
FDDI Errors by Station display in Observer.
The Options Toolbar (IP Trending)
When displaying IP trending data, the Options Toolbar contains the following
buttons—in order from left to right:
Display Properties—display properties can be set by right-clicking on the display or
by clicking the DISPLAY PROPERTIES button. The Display Properties dialog offers
configuration options for the components of the display, and changes depending
whether you are viewing a list or a graph.
General Viewer Properties—sets general viewer properties for the Network
Trending Viewer.
Show data per second—toggles between showing data as time-rated (per-second)
or non-time rated (generally as packets or bytes).
Show incoming packets—shows data by destination.
Show outgoing packets—shows data by source.
Show all packets—shows data by source and destination.
Show data by station—shows all data by station.
Network Trending Mode
179
Show data by time—shows data by time.
List—shows data in list format.
Line graph—shows data as a 2-D line graph (not available in all modes).
Alternate columns—shows data as an alternate column graph.
Separate columns—shows data as a separate column graph.
Pie chart—shows data as a pie chart.
Go to previous day—moves to the previous day’s trending information.
Go to next day—moves to the next day’s trending information.
Go to current day—moves to the current day’s trending information.
Delete—deletes a day’s trending data.
Compress—compresses a day’s or group of days’ data for disk storage efficiency.
When data has been compressed, you must first decompress it in order to view it.
Decompress—decompresses a day’s or group of days’ data.
This is necessary in order to view compressed data.
Create report—the create report dialog lets you specify reporting options.
Create Comma-Separated-Values File—exports trending data to a file in which
values are separated by commas, permitting the importation of trending data into
spreadsheets, databases, and other programs that support this format.
Print—displays the Windows print dialog, enabling trending data to be printed to a
user-selected printer.
Copy to Clipboard—copies the currently-displayed data, in the currently-displayed
format, to the Windows clipboard.
180
Trending and Analysis Menu
Refresh—refreshes the current display, reloading data from the hard drive, if
necessary.
Find—displays the Find dialog, enabling the user to search trending data for a given
character string.
The Options Toolbar (Internet Trending)
When displaying Internet trending data, the Options Toolbar contains the following
buttons, in order from left to right:
Display Properties—display properties can be set by right-clicking on the display or
by clicking the DISPLAY PROPERTIES button. The Display Properties dialog offers
configuration options for the components of the display and changes depending
whether you are viewing a list or graph.
General Viewer Properties—sets general viewer properties for the Network
Trending Viewer.
Show data per second—toggles between showing data as time-rated (per- second)
or non-time rated (generally as packets or bytes).
List—shows trending data in a tabular list view.
View Graph—shows trending data as a configurable line or bar graph.
Pair Circle—shows trending data as a pair circle, similar to Pair Statistics (Matrix)
mode.
View Connection Detail—views one selected connection in detail. Clicking this
button toggles the VIEW ALL STATIONS button off.
View All Stations—views all connections for the selected time period. Clicking this
button toggles the VIEW CONNECTION DETAILS button off.
Go to previous day—moves to the previous day’s trending information.
Go to next day—moves to the next day’s trending information.
Delete—deletes a highlighted day’s trending data.
Network Trending Mode
181
Compress—compresses a day’s or group of days’ data for disk storage efficiency.
When data has been compressed, you must first decompress it in order to view it.
Decompress—decompresses a day’s or group of days’ data. This is necessary in
order to view compressed data.
Create report—the create report dialog lets you specify reporting options.
Create Comma-Separated-Values File—exports trending data to a file in which
values are separated by commas, permitting the importation of trending data into
spreadsheets, databases, and other programs that support this format.
Print—displays the Windows print dialog, enabling trending data to be printed to a
user-selected printer.
Copy to clipboard—copies the currently-displayed data, in the currently-displayed
format, to the Windows clipboard.
Refresh—refreshes the current display, reloading data from the hard drive, if
necessary.
Find—displays the Find dialog, enabling the user to search trending data for a given
character string.
Using Network Trending Viewer to Display Results
To start Network Trending Viewer:
182
1.
Open Network Trending Viewer.
2.
Select a date by clicking on the date from the tree display on the left side of the
Trending Viewer. The Network Trending Viewer, by default, will only “view”
one day at a time. Should you want to view more than one day, select the
Setup/Time Settings button and set the number of days you would like to view
after the day selected.
Trending and Analysis Menu
Network Trending Viewer – Observer List View
Network Trending Viewer – Observer Alternate Columns View
Network Trending Mode
183
Network Trending Viewer – Observer Separate Columns View
Network Trending Viewer – Pie Chart View
184
Trending and Analysis Menu
Network Trending Viewer – Internet List Internet Patrol View
Network Trending Viewer – Internet List IP to IP Pairs (Matrix) View
Network Trending Mode
185
Network Trending Viewer – Internet List IP Subprotocols
WAN Delay Analysis
WAN Delay Analysis compares both ends of a conversation from two probes. The
conversation can be between two probes or between a probe and a local probe. WAN
Delay Analysis determines packet connection pairs and measures the amount of delay
between the packet pairs.
Header
bar
Select one to
show packet
flow
Packets
analyzed
(arrows show
the direction
of the
packets)
Connection #
File 1 Packet #
Direction of packet
186
Trending and Analysis Menu
Delay in seconds
IP Packet ID
File 2 Packet #
When you select the Connection Dynamics button, the following items are displayed
in the Header bar:
•
File 1—displays the number of packets and connections analyzed for File 1.
•
File 2—displays the number of packets and connections analyzed for File 2.
•
WAN IP Connections—displays the number of WAN IP connections analyzed.
•
Status—displays the current status of the analysis.
Settings:
•
“File Synchronization Offset”—the offset is computed to compensate for the time
zone and processor clock differences between the systems being analyzed.
•
“User Defined Offset” spinbox—allows you to add an additional time offset to the
File Synchronization Offset described above.
WAN Connections:
•
“Conn” checkbox—allows you to select which connection you wish to analyze.
•
File 1—displays the IP addresses of the first packet.
•
File 2—displays the IP addresses of the second packet.
•
File 1 Pkts—displays the number of packets in File 1.
•
File 2 Pkts—displays the number of packets in File 2.
•
Type—displays the connection type between File 1 and File 2.
The following items are displayed in the main table:
•
Packet comparison—displays the packets and common connections; you may click
on a packet to view the packet flow.
WAN Delay Analysis
187
WAN Analysis Setup Properties
Captured Buffer Files to Analyze:
•
“File 1” and “File 2” textboxes—displays the captured buffer file you have
selected; to edit this selection, you must click on the Choose Files button.
•
Choose Files button—displays the Open Files dialog.
•
“File 1” textbox—allows you to enter the first capture file buffer name
you wish to compare.
•
“File 2” textbox—allows you to enter the second capture file buffer
name you wish to compare.
•
Select buttons—allows you to select the files you wish to select by
displaying the standard Windows Open dialog.
Connection Identification Method:
188
•
IP Address + IP ID (Port mapped) option button—allows you to select to view
the IP address and IP ID.
•
IP Address + IP ID + TCP/UDP Ports (Ports will match) option button—allows
you to view all ports that match.
•
“Apply IP Mapping” checkbox—allows you to manually set the IP matching.
•
Settings button—displays the IP Mapping Settings dialog; only active if the
“Apply IP Mapping” checkbox is selected. see “IP Mapping Settings” on
page 189.
Trending and Analysis Menu
•
“Time Synchronization Window (mSec)” spinbox—allows you to set the
maximum number of seconds for time synchronization.
•
“Maximum packets to analyze per connection” spinbox—allows you to select the
maximum number of packets you want to analyze; only active if the “Enable”
checkbox is selected.
•
“Enable” checkbox—allows you to limit the number of packets to be analyzed.
IP Mapping Settings
To display the IP Mapping Settings dialog, select WAN Analysis Delay > Setup >
Apply IP Mapping and click on the SETTINGS button.
•
Profile dropdown—displays the profile names available.
•
Add button—displays the New Profile Name dialog.
•
Delete button—displays the Delete dialog.
WAN Delay Analysis
189
•
Rename button—displays the Modify Profile Name dialog.
Profile IP Map Values:
•
IP1—displays the IP address of the first probe you are capturing packets on.
•
IP2—displays the IP address of the second probe you are capturing packets on.
•
Add button—displays the IP Map dialog.
•
Delete button—allows you to delete an IP address.
•
Modify button—allows you to modify an IP address.
•
Swap All button—allows you to swap all IP addresses from the IP1 column to
the IP2 column.
WAN Delay Analysis – Summary Statistics
The Summary Statistics view of WAN Delay Analysis gives you a textual display of
the selected connections (computed in the WAN Delay Analysis – Connection
Dynamics view). You may select one or many connections. The statistics summary
gives you details on the analyzed packets, such as: number of packets analyzed, delay
190
Trending and Analysis Menu
time, matched packets, direction of packets, dropped packets (will be displayed in red
type), time of first packet, and time of last packet.
IP Mapping Settings Right-Click Menu
•
Add—displays the IP Map Dialog.
•
Modify—displays the current IP addresses in the IP Map Dialog.
•
Delete—displays the Delete Confirmation dialog.
•
Swap—allows you to swap the highlighted addresses; the Swap Confirmation
dialog will be displayed.
•
Swap All—allows you to swap all addresses in the IP Mapping Settings dialog; the
Swap Confirmation dialog will be displayed.
WAN Delay Analysis – Display Properties
•
“Item” list—allows you to select which item to be configured.
WAN Delay Analysis
191
“Color” dropdown—allows you to select the color of the display item you have
selected.
Application Analysis
Menu Path
Trending/Analysis->Application Analysis
Purpose
Application Analysis lets you view detailed information about how a server is
performing, giving you an accurate picture of the user’s experience of your network
application, such as response time and failed requests. You can also configure the
analysis to track application-specific requests
Available Views
•
Server Discovery
•
Graph View
•
List View
Server Discovery
Application Analysis includes a tabbed “Server Discovery” view that scans your
network and shows you active servers and any applications Observer recognizes.
Click the Server Discovery tab to display the view and click the Start button to begin
scanning.
Right-click any server to add its statistics to the application analysis graph and list
displays. You can also start a packet capture on that address or create a filter. The
Application Analysis itself has both a graph and list view, which you can select from
the View menu.
192
Trending and Analysis Menu
Graph View
Application Analysis Graph view shows you transactions: total, completed, and failed:
Note that if you have chosen to Graph Specific Request in the Application Analysis
Setup dialog, only the selected type of request will be reflected in the graph.
List View
List view shows transactions in more detail. In addition to tracking total, completed,
and failed transactions, List view breaks down the statistics, showing you the
application-specific reasons a request failed (for example, it would show you if an FTP
server is out of storage space and can’t receive any more uploads).
Application Analysis
193
Settings
You can change the display properties of the graph (its colors, scale, etc.) by clicking
the Graph tab on the settings dialog, which you access by clicking the Settings
menu:
The Application Analysis setup tab lists the servers currently under analysis, letting
you add, edit, or delete them.
When you add or edit a server to place under Application Analysis, the following
setup dialog is displayed:
Select an IP address to monitor; Server Name lets you uniquely name this
application analysis connection. As there can be multiple connections to a given IP
address (for example, when your FTP and Telnet services reside on the same
machine), you might want to indicate the service being monitored in addition to the
DNS name of the machine.
194
Trending and Analysis Menu
By checking the Graph Specific Request box, you will limit the completed, failed, and
total transactions statistics being graphed to the type of transaction selected from the list
box that becomes active when you check the box.
Application Analysis
195
196
Trending and Analysis Menu
The Tools Menu
Discover Network Names Mode
Captures network addresses and assigns them aliases.
Menu Path
Tools->Discover Network Names
Purpose
Discover Network Names mode captures all network addresses on the segment, stores
them in the filter table, and assigns them aliases. You can assign a name to a network
address or use the IP address, DNS name, NetWare login name, or Microsoft network
login name. After storing the network names, you can use the stored names in all your
queries. If you cannot directly discover a group of network names, Observer also allows
you to import an address list into the Address Table.
Available Views
•
Graphical Station List View
•
List View
197
List View
1.
To start Discover Network Names, select Tools > Discover Network Names from
the main Observer menu or click on the
icon on the toolbar.
“Discover using”
your selection
2.
To start discovering network names, click
on the mode toolbar. Observer
will begin to collect all of the active addresses on the network. Addresses will be
added immediately as each station accesses the network or as each station is contacted
(depending on which discovery mode you have chosen).
In all cases, once Discover Network Names completes its active discovery, Observer will
passively “listen” to your network and record all of the addresses seen.
198
3.
Once you have collected the addresses you are interested in saving, click on the SAVE
ALIASES button. You may also highlight just a few addresses using your mouse and
Shift key and save only those.
4.
To reload the current alias list, click on the RELOAD ALIASES button, then click on the
SAVE ALIASES button. After you confirm your choice, Observer saves the alias list.
The Tools Menu
Add Alias
1. To add an alias, click on the Add Entry button. The Add Alias dialog will be
displayed.
2.
Select an Address Type.
3.
Enter your Address, Alias, IP address, and any comments, then click on the OK
button.
Edit Alias
1. To edit an alias, click on the Edit Alias button. The Edit Alias dialog will be
displayed.
2.
Select an address type. Click on the Ethernet, Token Ring, or FDDI option button or
the WAN button.
Delete Alias
1. To delete an alias, click on the Delete Alias button. After you confirm the deletion,
the alias is deleted.
Discover Network Names Mode
199
Right-Click Menu
•
Start Packet Capture on station address(es)—activates the Filters dialog.
•
Start Packet Capture on pair address(es)—activates the Filters dialog.
•
Create Filter on station address(es)—activates the Filters dialog.
•
Create Filter on pair address(es)—activates the Filters dialog.
•
Find—displays the Find dialog.
•
Settings—displays the Settings dialog.
Graphical Station List View
To discover network names, follow the steps listed in Discover Network Names –
Graphical Station List View. see “List View” on page 198.
•
To view the alias name, right-click anywhere in the display area and select “Show
Alias.”
•
To view the IP address, right-click anywhere in the display area and select “Show IP
Address.”
•
To view the hardware address, right-click anywhere in the display area and select
“Show Hardware Address.”
If there is no alias name, the IP address will be displayed. If there is no IP
address, the MAC address will be displayed.
200
The Tools Menu
Right-Click Menu
•
Start Packet Capture on station address(es)—activates the Filters dialog.
•
Start Packet Capture on pair address(es)—activates the Filters dialog.
•
Create Filter on station address(es)—activates the Filters dialog.
•
Create Filter on pair address(es)—activates the Filters dialog.
•
Find—displays the Find dialog.
•
Settings—displays the Settings dialog.
•
Show Alias—displays the station’s alias name.
•
Show IP Address—displays the station’s IP address.
•
Show Hardware Address—displays the station’s hardware address.
Discover Using: Selections
Observer’s Discover Network Names will auto-alias network addresses that it finds in
three possible ways: IP, IPX, or Microsoft (Msft). Each of these methods has specific
configuration options. Configuration of each method is done by first clicking the protocol
option (i.e., IP, IPX, or MSFT) button, and then clicking the SETUP icon on the Discover
Network Names toolbar.
The default mode is IP. In this mode, Observer will first try to ARP all of the addresses in
the IP address range given in the IP configuration twice, and then listen for any additional
hard addresses that may show up over time.
IP Discovery Setup
In this dialog you specify the range of IP addresses that you would like Discover Network
Names to find. You need to enter your local IP address (in the setup) for packet formation
purposes.
Discover Network Names finds IP addresses by sending two ARPs to each address within
the specified range, then listens passively for any new IP addresses that may show up on
the network.
Discover Network Names Mode
201
Click on the IP button to display the setup options.
•
“Replace aliases by newly discovered name” checkbox—allows you to replace any
previously entered aliases with the newly discovered names.
•
“Local IP address” integer textbox—allows you to enter the IP address of your
station.
Local net range:
•
“First IP address” integer textbox—allows you to enter the first IP address in a range.
•
“Last IP address” integer textbox—allows you to enter the last IP address in a range.
•
“Passively discover IP addresses” checkbox—allows you to skip the ARP part of
discovery and only listen for IP packets, recording each new IP address as it is found.
This is the recommended mode for FDDI.
When using IP discovery in non-passive mode, Observer sends two ARP
packets per address within the first few seconds of discovery. This will cause
quite a bit of traffic for the first few seconds of discovery.
IPX Discovery Setup
Observer queries any local NetWare servers and asks the server for a NetWare login name
for each hard address found on the local segment. This is done by creating IPX packets
and logging into the server as administrator. You will be prompted for a NetWare
administrator password before Observer begins to poll the server.
Click on the IPX button to display the setup options.
202
The Tools Menu
•
“Replace aliases by newly discovered name” checkbox—allows you to replace
existing aliases with a newly discovered name.
•
Forget passwords button—allows you to select if you would like Observer to forget
your NetWare login password for the next time you resolve names.
Msft (Microsoft) Configuration
Observer is passively listening to packets in this mode and will only find the
NetBIOS/NetBEUI names as they are broadcast on the network. To alias all of the names
on a network may take anywhere from five minutes to many hours.
Click on the MSFT button or the Settings button to display the setup options.
•
“Replace aliases by newly discovered name” checkbox—allows you to specify
whether you want Observer to replace existing aliases with a newly discovered name.
Resolve IP
Once you have resolved an alias list, you cannot do a “Save As” to save it as
another name. Saving an alias after you resolve aliases will only overwrite
your current alias list and will not create a new one.
Before running your discovery, you can select which address table you wish
to be working in. If you do not have multiple address tables set up, you can
add a new one. see “Multiple Address Tables” on page 204.
1.
To resolve IP addresses into DNS names, click the RESOLVE IP button. The screen
will refresh with available DNS names displayed.
2.
Click on the SAVE ALIAS button. After you confirm the save, the alias list is saved and
will be available for use in other Observer modes.
Import Aliases
If you cannot automatically discover your network names, Observer offers an alternative
to the autodiscovery process—the Import Aliases process. This allows you to import two
types of Address/Alias maps:
•
the binary file format used and created by Network Instruments Observer and Link
Analyst programs (these have a .adr filename extension)
Discover Network Names Mode
203
•
an ASCII (text) file that contains line entries for each MAC Address entry (these files
must have a .ali filename extension)
The format of address entries in a .ali file is
MACaddress, IP, alias
where MACaddress is the MAC address, IP is the Internet Protocol dot address, and alias
is the alias by which you want the system to be known. Note that entries are separated by
commas. If you want to specify a MAC Address/Alias pair without an IP, the format is:
MACaddress, , alias
Note the two commas separated by a space. You can specify the MAC address with or
with out colons, as long as the format is consistent within the .ali file. Leading zeros are
allowed but not required. For example
00:00:C0:87:49:45, 168.0.0.1, router1
00:00:C0:13:4B:33, 223.188.11.3, Sue’s Accounting PC
-or0000C08B4194, 175.203.57. 8, John
C0134B33 Roman
The alias can be no longer than 17 characters.
The “Replace aliases with newly discovered name” option will replace any existing MAC
address/alias pairs in the Address Table with the entry found in the .ali file. If this option is
left unchecked, any pair of existing MAC address/alias entries are not overwritten.
Existing IP address and comment fields are never overwritten by the Import Aliases
action.
Multiple Address Tables
Multiple address tables are supported to allow the saving and reuse of different
address/alias lists (e.g., for multiple sites). The default address table,
204
The Tools Menu
LocalAddressTable.adr, is stored in the LocalAddressTable directory under the Observer
installation directory.
1.
You can add a new address table by selecting Tools > Select Address Table for
icon on the Observer toolbar. The Select Local
Observer Address Table dialog will be displayed.
Local Observer or by clicking on the
2.
To create a new address table, click on the NEW button. The New Local Observer
Address Table dialog will be displayed.
3.
Type in the name you wish the address list to refer to and click on the OK button. You
will be taken back to the Select Local Observer Address List dialog where you click
on the OK button.
Ping/Trace Route
A flexible Ping/Trace Route utility.
Menu Path
Tools->Ping/Trace Route
Ping/Trace Route
205
Purpose
Observer’s Ping/Trace Route permits the user to see if specific stations on an IP network
are active and to trace a route from the Observer (or Probe) PC to a selected station. To
open Ping/Trace Route, select Tools > Ping/Trace Route.
Saved
Internet
addresses
Display
window
•
“Internet Address” textbox—allows you to specify the Internet address to ping, or the
address to which the route will be traced.
•
Save button—allows you to save the present Internet address.
•
Delete button—selecting an address in the saved addresses box and clicking this
button allows you to delete the address from the saved addresses.
•
Ping option button—allows you to select the Internet address to ping and the results to
be displayed in the main Ping/Trace Route display area.
To “ping” an address is to send out an “ICMP echo request” to that address.
If the station is operating normally, it will respond—unless it is behind a
firewall that prevents such response.
206
•
Trace Route option button—allows you to select a route from the Observer personal
computer to the specified Internet address to be traced.
•
“Timeout(sec)” dropdown—allows you to specify the number of seconds that
Observer will wait for a response before assuming that the packet Observer sent was
either not received or not responded to.
•
“Packets” dropdown—if the Ping option button is selected this dropdown box
specifies the number of “ping” packets, or ICMP echo requests, that will be sent.
When the Trace Route option button is selected, this option has no effect and will be
grayed out.
The Tools Menu
•
“Packet size” dropdown—if the Ping option button is selected, this edit box selects
the number of “ping” packets, or ICMP echo requests, that will be sent. When the
Trace Route option button is selected, this option will not be activated.
•
Display Window—displays the results of the ping or trace.
Replay Packet Buffer
Allows you to generate traffic on the network from a previously saved capture file.
Menu Path
Tools->Replay Packet Buffer
Purpose
Replay Packet Buffer mode, like Traffic Generator mode, permits the user to create traffic
on the network. Unlike Traffic Generator; however, Replay Packet Buffer mode sends
some or all of a previously saved capture buffer onto the network. To begin Replay Packet,
select Tools > Replay Packet Buffer.
Dial
Displays
Animation
pane
Main
pane
•
Dial displays—the left dial displays the speed (packets per second) of the buffer as it
is being replayed. The right dial displays the speed (bytes per second) of the buffer as
it is being replayed.
Totals pane:
•
This pane displays totals for the replay: the number of packets transmitted, the
number of bytes transmitted, and the number of seconds that the replay buffer has
been transmitted.
•
Animation pane—while the transmission is occurring this display will be animated.
Replay Packet Buffer
207
Main pane:
•
“Select buffer” textbox and button—allows you to enter the name of the buffer
(.BFR) file to be transmitted. Enter the name and address of the file to be transmitted
or click the Select buffer button to browse to it.
•
“First packet” textbox—allows you to set the number of the first packet in the buffer
to be transmitted.
•
“Last packet” textbox—allows you to select the number of the last packet in the
buffer to be transmitted.
•
“Speed (pkt/sec)” textbox—allows you to set the speed, in packets per second, which
you would like to attempt to transmit the buffer.
If the speed is set at a higher number than the Observer computer’s NIC card is capable of,
it will only be able to transmit the buffer at the NIC card’s maximum rate.
Generation Mode:
•
“Time period to generate (1-65500 sec)” option button and textbox—if selected,
packets will be generated at the configured speed for the number of seconds specified
in the edit box. If the specified contents of the buffer are completely transmitted
before the end of that time period, the transmission will loop back to the first packet
as chosen above.
If you select this option button, the textbox will be active.
•
“Number of times to replay this buffer” option button and textbox—if this option
button is selected, the buffer file, or the selected portion of it, will be replayed the
number of times specified in the edit box.
If you select this option button, the textbox will be active.
SNMP Trending Data Manager
The SNMP Trending Data Manager provides a convenient method of browsing and
pruning SNMP trending data. It shows you what data is available, how much space it is
taking up, and offers a couple of options for conserving space:
•
Erasing the trending data does just that; both processed trending data and the raw poll
data that it was derived from are deleted and will no longer be available in the Trend
Viewer.
•
Processing and removing raw trending data erases only the raw poll data, after the
averages have been processed and saved for the trending viewer. You'll still be able to
see aggregate trending data in the viewer, but you will not be able to zoom in on the
raw polling data once it has been removed.
The SNMP Trending Data Manager also allows you to delete log files.
208
The Tools Menu
SNMP MIB Editor
See “The MIB Editor” on page 352.
SNMP MIB Walker
Lets you walk a MIB to determine what objects it contains.
Menu Path
Tools->SNMP MIB Walker
Purpose
The MIB Walker automatically browses through the hierarchy of an SNMP Management
Information Base (MIB) and displays what objects it contains.
To open SNMP MIB Walker, select Tools > SNMP MIB Walker. If this is the first time you
have run the mode, the setup screen is displayed, which allows you to select and configure
MIB Walker profiles:.
Select a device or click New Device... to configure a new device. The MIB walker profile
creation dialog includes the following controls:
•
Profile name--choose a name that is descriptive enough to be meaningful to you later.
•
“IP Address” textbox—allows you to enter the IP address to be used for the profile.
•
“Community” textbox—allows you to enter the community for the profile (public or
private).
•
“SNMP version” dropdown—allows you to select the SNMP version.
•
“Initial OID” textbox—allows you to enter the initial OID.
•
“Comment” textbox—allows you to enter comments regarding this walk.
SNMP MIB Editor
209
•
The “Choose existing SNMP devices...” button allows you to pick an SNMP device
to create a MIB profile from a list of SNMP devices that have already been defined in
or discovered by Observer.
After you have a profile (or a number of profiles) defined, the SNMP MIB walker looks
like this:.
1.
Select a MIB Walker profile.
2.
By default, the initial OID for the walk will be 1.3.6.1.4.1. If you prefer to have your
MIB walk begin from another OID, enter it in the “Initial OID” textbox or use the
dropdown arrow if you've recently used another starting point.
1.3.6.1.4.1 is the “root” of the proprietary part of the MIB tree. A walk from
1.3.6.1.4.1 will give you information on the proprietary OIDs. To get information
from the standard OIDs, start the walk at 1.3.6.1.2.1.
3.
Click the Start button to start.
4.
SNMP Extension’s MIB Walker will step through all higher branches of the MIB tree
(starting at the initial OID) and display the results in the Walk Network Device MIB
Table Viewer.
The following buttons are active from the Walk Agent MIB Table Viewer after the walk
has been completed:
210
•
Print button -allows you to send the table to a user-chosen printer.
•
Save List button -allows you to save the table to a user-chosen text file.
•
View Tree or View List button-allows you to switch between Tree View and List
View.
•
Identify Nodes button-allows you to identify the walked nodes using a user-chosen
MIB file.
The Tools Menu
Viewing the MIB Tree
Selecting the View Tree button from the Walk Agent MIB dialog displays the Walk Agent
MIB Tree Viewer. The Walk Agent MIB Tree Viewer displays the structure, although not
the values, of the discovered MIB tree.
Setting Values
One of the main uses of the MIB Walker and the Walk Agent List Viewer is to permit you
to explore the SNMP agent by setting values to see what effect different values have on
the actual device and to be sure that objects are writable.
1.
To set a value, select any object on the Walk Agent List Viewer and click
on the Set Value
button. The Set Value dialog will be displayed. Before
attempting to make any changes, note the present value, so that you can restore the
device to its original state.
2.
Enter an appropriate real or test value into the Value textbox.
3.
Click the Set Value button. SNMP Extension will attempt to set the given OID to the
entered value.
4.
If the attempt to set the value succeeds, the dialog box will be redisplayed with the
Status line reading “Done.”
Be careful to use the proper type of value when setting the value. If you
attempt to set an integer SNMP value to a character string (e.g., “Bob”) it will
be set to zero.
5.
If the attempt to set the value fails, an error dialog will be displayed, and the Status
line on the Set Value dialog box will read “Failed” instead of “Done.”
Failure can happen for one or both of two reasons:
•
the MIB object you are attempting to set is Read-Only and cannot be reset
•
you do not have the proper read-write community name for this device.
Switch Station Locator
Shows MAC addresses of devices connected to switches on the Network.
Menu Path
Tools->Switch Station Locator
Switch Station Locator
211
Purpose
Select this option from the Tools menu to view the MAC addresses of devices connected
to switches on the network. The Switch Station Locator uses SNMP queries to determine
the MAC addresses of all the stations attached to each switch that you set up.
When you start the locator, you must first choose a switch to query. A dialog appears
listing the currently configured switches:
If this is the first time you have used the Switch Station Locator, you must configure a
switch with the New Switch... button to make it appear in the list of switches. The section
below describes this dialog.
Setting up and Selecting A Switch for the Locator
When you click the New Switch... button, the Edit Switch dialog is displayed:
Enter the following information to set up a switch:
212
•
“Switch Name” text box—Enter a name by which you want the switch to be listed in
the Switch Selection list.
•
“IP Address” text box—Enter the IP Address of the switch on which you want to
locate stations.
The Tools Menu
•
“Community” text box—Enter the IP community of the switch on which you want to
locate stations. Note that this string is case sensitive.
•
“SNMP Version” dropdown box—Make sure that you match this entry to the version
SNMP running on the switch.
•
“Use Alias List” dropdown box—Choose either “no alias list” or a local Observer (or
Remote Probe) alias lookup table to display the alias in addition to the MAC address
for each station found.
•
“Refresh every xxxx minutes” checkbox/spinbox:—Checking this option causes the
Switch Station Locator to repeat the station query every given number of minutes
(from 0-9999)
•
“Choose from Existing SNMP devices...” button—Click this button to display a list
of SNMP-configured switches recognized on your network. Double-click the desired
switch to auto-fill the Edit Switch dialog with that switch's configuration parameters.
•
“OK” button—Save the settings and return to the Switch Station Locator switch
selection window.
•
“Cancel” button—Abandon the changes and return to the Switch Station Locator
switch selection window.
Editing a Switch in the Selection List
You can change any of the properties listed above for a listed switch by highlighting that
switch and clicking the Edit Switch button.
The Switch Station Locator Monitor Window
Once you have added all of the new switches you want to query, double-click on one of
the listed switches to display the Switch Station Monitor window, which displays the
switch being queried in the window title, and shows the following information about
stations attached to the switch:
Switch Station Locator
213
•
Port If Number—The SNMP Port Interface number for the station
•
Port Name—The name of the port connected to the station.
•
Address—The MAC address of the station.
•
Alias—The alias of the station, if you have chosen to use an alias list (see Setting Up
and Selecting a Switch for the Locator above).
You can sort the display by a particular field by clicking on the column heading for that
field. You can select which fields you want to display by right-clicking on any of the
column headings.
Switch Station Locator Setup
The Setup button to the left of the display lets you specify whether you want the monitor
window to clear after every poll (the default), or to accumulate switch listing until you
manually clear the display with the Eraser button on the toolbar.
Traffic Generator
Generates packets to test the network.
Menu Path
Tools->Traffic Generator
Purpose
Traffic Generator is the tool in which Observer can generate a user-chosen number of
configurable packets to test the network’s performance. Sometimes a network problem
only shows up under peak load conditions. Traffic Generator allows you to stress your
network by generating generic broadcast traffic, source or destination specific generic
traffic, or protocol specific traffic for stressing a specific device or group of devices.
Caution: Be careful when generating traffic. Generating too much traffic
can slow down the network. You may of course
want to stress test your
network by using the Traffic Generator to simulate a heavy load (which is just
one of the many uses of the Traffic Generator). Just be aware of what you
are doing, and perhaps notify your users of possible downtime.
To use the Traffic Generator in this manner, the NIC must be capable of
generating sufficient traffic to heavily load the network. For example, a 10
megabit NIC card simply can’t use more than 10% of a 100 megabit
network’s bandwidth.
Traffic Generator is available in List View.
214
The Tools Menu
You can display the Traffic Generator dialog in Observer by selecting Tools > Traffic
Generator.
Header
display
•
“Packet size” textbox—allows you to define the size of the packets that will be
generated. Allowable values are from 64 (bytes) to 1514 for Ethernet and from 64
(bytes) to 4096 for Token Ring.
•
“Packets/sec” textbox—allows you to define the number of packets that Observer or
the Probe will generate per second.
•
“Time period to generate (1-65550 sec)” option button and textbox—allows you to
define the amount of time Observer or Probe will generate packets in seconds; the
textbox is only active once you have checked the option button.
•
“Number of packets to generate” option button and textbox—allows you to define the
number of packets Observer will send; the textbox is only active once you have
checked the option button.
You can specify a destination address and/or a source address. These will be displayed in
the header display. The address list is compiled from your filters table, with the addition of
the “Local” address and a “Broadcast” address.
•
“Generate packets with random size distribution (range from 64 to ‘Packet size’)”
checkbox—allows you to specify the type of packet that Observer will generate. By
default, Observer will generate generic broadcast packets, but you can specify IP,
TCP, UDP, or IPX and Observer will form packets with the corresponding headers.
When generating traffic it is best to view the generated traffic as well as the
results of the traffic generation from a separate Observer station than the
one that is generating the traffic.
Note: You can edit the packet header string that the Traffic Generator
transmits. Simply highlight the hexadecimal codes you want to change, right
click and select Edit Selection... from the popup menu.
Traffic Generator
215
Traffic Generator Right-Click Menu
•
Set Destination Address—displays the Select Address dialog.
•
Set Source Address—displays the Select Address dialog.
•
Set Protocol Header—allows you to choose from one of the following: IP, IPX, or
Default.
•
Edit Selection—allows you to edit your selection.
•
Load Packet From File—displays the Load Packet dialog.
Enterprise Licensing
Lets you activate and monitor enterprise licenses (if you have purchased such licensing).
Menu Path
Tools->Enterprise Licensing
Purpose
Enterprise licensing allows you to keep track of the Observer licenses and identification
numbers in your organization. To activate Enterprise Licensing, you must obtain a special
license code from your Network Instruments representatives (see the back cover of this
manual for contact information). Until you enter this code in the License Observer dialog
(available on the File menu), the Enterprise Licensing option will be disabled. Once
216
The Tools Menu
you’ve entered the code, click Tools -> Enterprise Licensing to display the Enterprise
Licensing dialog:
•
Identification—displays the Observer identification number.
•
License—displays the Observer license number.
•
Assigned to Probe—displays the Probe the license number and identification number
are assigned to.
•
Add button—displays the Add/Edit Enterprise Probe License dialog.
•
“Identification” textbox—allows you to add an identification number.
•
“License” textbox—allows you to add a license number.
•
Delete button—allows you to delete a license or an identification number.
•
Import from a file button—allows you to import the numbers from a file.
•
Export to a file button—allows you to export the numbers to a file.
•
Print list button—allows you to print the list of numbers.
Edit Switch Scripts
Edit Telnet Switch Script File
see “Telnet Scripts” on page 312.
Edit Switch Scripts
217
Edit SNMP Switch Script File
see “SNMP Scripts” on page 319.
Define Protocols for Protocol Distribution Statistics
See “Settings” on page 114.
Import/Export Filters
This option lets you save filters (See “Filter Setup for Selected Probe” on page 219.) that
you have created with Filter Setup for Selected Probe... or load filter rules that have
been sent to you by another Observer user.
Each filter file can store multiple filters. A checklist of filters available for import or
export is displayed, allowing you to select the desired filters for import or export.
Register Custom Decode DLLs
Lets you integrate custom-written decode applications into the Observer environment.
Menu Path
Tools->Register Custom Decode
Purpose
Observer allows you to write your own protocol decoder, assuming that you have expert
knowledge in the following:
•
The protocol you are writing the decoder for
•
The C++ Programming Language
In addition, it helps if you have Microsoft C++ Developer's Studio, as Network
Instruments has included an example project file for that environment along with the
example source code. The Custom Decode Kit is contained in the Observer
Files\Drivers\CustomDecodeKit directory (CustomDecodeKit.exe, which is a selfextracting archive). Along with the example project and source files, the Kit also includes
an Acrobat PDF file that outlines the steps in building a DLL.
Once you have built a DLL and placed it in the Observer FIles directory, select Register
Custom DLL from the Tools menu and add the new DLL to the list of registered DLLs.
Once a DLL has been registered, the new decode will be available in the Decode and
Analysis tree control.
218
The Tools Menu
Switch Setup Dashboard
see “Main Switch Dashboard – Switch Setup Tab” on page 309.
Select Address Table for Local Observer
see “Multiple Address Tables” on page 204.
Filter Setup for Selected Probe
Lets you filter which packets to capture by applying various criteria.
Menu Path
Tools->Filter Setup for Selected Probe
Purpose
Packet filtering lets you configure Observer to discard the packets you are not interested in
so that you can focus on the traffic you are interested in. Without filtering, it can be much
more difficult to find the packets that will help you solve a problem or focus on
problematic network stations and devices.
Filters consist of rules that cause a packet to be included or excluded during packet
captures and certain statistical modes. Each rule is a condition test applied to each packet
sensed. Depending on the type of network you are analyzing, you can test for over a dozen
types of conditions, including:
•
sending and receiving addresses (MAC, IP, DLCI)
•
which protocol packets are part of
•
whether packets include a particular ASCII, hex, or bit string starting from a specified
offset
•
whether packets include a particular numeric value at a specified offset
You can either include or exclude packets based on the results returned for each packet by
each rule in the filter.
Types of Filter Rules
As noted, there are a number of different rule types. Note that not all rule types (WAN and
Wireless) apply to all network types, and others only apply to post-capture filtering (for
example, rules that filter for packets that have been annotated with Observer or Expert
packets generated by Observer).
If you apply a rule that is not relevant to the current capture or post capture filter scenario,
that rule is ignored.
Switch Setup Dashboard
219
The table below lists all the rule types and setup options. A setup dialog is displayed when
you first create a rule; you can edit a rule by double-clicking its icon in the Filter Setup
rule editor. Detailed setup descriptions follow the table.
Rule Type
Usage
Specify a hardware or IP address or range of addresses for
source and destination. You can also limit the rule to apply
only to packets from particular source or destination ports.
Filter for packets that have been commented by an Observer
user and saved with a capture file. Comments are useful for
annotating packets when two analysts are working on a problem together, perhaps sending each other captures from
remote sites on a corporate network. There are no setup
options. Available for post-filter only.
Specify the categories of errors you want to filter for: CRC,
Alignment, packet to small, and packet too large are
available for all network types. You can also filter for Wireless WEP errors if you are analyzing a wireless network. If
you are analyzing a WAN link, you can filter for WAN abort
and RBIT errors. Observer also lets you filter for Token Ring
error notifications when analyzing Token Ring networks.
This rule lets you filter for Observer-generated Expert packets. These packets will only be generated if the “Include
Expert Load information packets” box has been checked in
Mode Commands > Setup for Packet Capture. There are
no setup options. Available for post-filter only.
Specify a packet length, and whether you want to filter for
packets that are less than, equal to, or greater than that
length. You can also filter for packets that fall within a range
of length values.
This rule is useful when you need to filter for a numeric value
(or range of values) that is embedded within a byte, word or
double word.
Use this rule to filter an ASCII, hexadecimal, or binary string
starting at specified offset or within a specified range. Hexadecimal and binary strings allow you to filter for values
embedded within a particular byte, word, or double word if
you know the offset, either from the beginning of the packet,
or from the beginning of a particular protocol header. If you
want to filter for numeric value or range of values within a
byte or word, consider using the numeric value filter.
Specify a port or range of ports for inclusion or exclusion.
Select a protocol and field to filter on. For example, you can
filter for ICMP “Destination unreachable” messages, or the
presence of a VLAN tag.
220
The Tools Menu
Rule Type
Usage
Specify a WAN DLCI by number.
Specify a WAN Port by number.
Lets you filter for direction (DCE or DTE or both), and logically chain tests for forward congestion packets, backward
congestion packets, and discard eligibility.
Enter or select a hardware address that corresponds to the
wireless Access Point you wish to capture traffic from.
Select a wireless data rate, and whether you want to filter for
packets traveling at, under, or over that rate.
Select a wireless channel, and whether you want to filter for
packets received from channels less than, greater than, or
equal to that channel.
Select a wireless signal strength, and whether you want to filter for packets received at, under, or over that signal
strength.
The following sections detail all the types of filter rules and their settings.
Filter Setup for Selected Probe
221
Filtering by Address
This rule lets you look at traffic by address or address pair. Setup options are described
below:
You can set address by MAC,
IP, or IPv6
You can filter for a single address,
or a range of addresses.
Enter or select the desired
address or a range of
addresses. You can also select
Any Address.
You can filter for packets sent
or received by Address 1 and
Address 2.
If selected, allows you to filter
by port in addition to Address.
Click OK to save changes and exit, or Cancel to exit without saving.
Filtering for Errors
Choose which types of errors you want to filter for. When you select multiple error
conditions to filter for, the conditions are chained with logical ORs. In other worlds, if you
check “CRC” and “Packet too small,” you will filter for packets that contain either of
those errors in addition packets that include both.
222
The Tools Menu
Filtering by Packet Length
You can filter for packets that are less than, greater than, or equal to a given length in bytes
(including CRC bytes). You can also filter for a range of values, entering the minimum
and maximum length of packets that you want filtered.
Filtering for Numeric Values at an offset
Similar to the Pattern rule described below, a Numeric Value rule lets you filter for a
numeric value contained in a byte, word, or double word at a known offset, either from the
beginning of the packet, or from a specified protocol header.
If the value you want to filter on is a partial byte or word, you can mask out the portion of
the word you are not interested in filtering on. You also can specify the bit ordering (Little
Endian or Big Endian, i.e., most significant or least significant bit first).
Filter Setup for Selected Probe
223
Filtering for a Text, Hexadecimal, or Binary Pattern
When defining a Pattern rule, you can enter a specific offset from the beginning of a
Lets you set a protocol header
as the origin for determining the
offset other than the packet header
Choose ASCII, Hex, or Binary search.
Choose whether to limit the search to
a range, and enter the offset (& range).
Enter the ASCII string, hex codes
or binary code strings that you want
to search for.
packet header (or from the beginning of a protocol’s header), and a specific pattern or data
sequence to search for after that offset.
The offset is the decimal position to start looking for the sequence, in the byte order you
specify (Big endian or little endian, or most significant bit first or last, respectively). Enter
the offset as a decimal value. If you select Search Using Range you can enter a ending
offset beyond which the filter will not search for the pattern.
The pattern itself is the actual ASCII, Hex or Binary string that you are filtering for.
For example, to define an offset-sequencing filter to look for telnet packets (i.e., looking
for TCP port 23) in one direction, the offset would be 34 (14 bytes of Ethernet header + 20
more bytes of IP header) and the hex pattern would be 00 17 (23 in hex).
To create a Pattern rule for telnet in both directions, you could first tell Observer you want
to start the offset at the IP-TCP protocol portion of the header (specify IP-TCP in the
“Protocol” dropdown dialog), then tell Observer that you want the first offset to start
immediately (port number is the first field after the TCP header) by entering “0” in the
first offset field and “00 17” in the first “Offset Filter” area. This will filter for telnet
packets in the direction of source to destination. To see the telnet response packets, you
should enter a second offset (in the same dialog) for offset “2” and with a value of “00
17”. The second offset specifies the destination port (this is the reason for the offset of
“2”).
For hexadecimal patterns, you must enter the two-character representation
of each byte in the hex pattern, with a SPACE between. For the example
above, telnet is on port 23, which is represented as “00 17” in hex. Note the
SPACE between the “00” and the “17.”
For binary patterns, you must enter each byte as two 8-position bit strings
separated by a space (for example,”10011101 11001100”).
224
The Tools Menu
Filtering by Port
Filtering by port is useful in many different troubleshooting and security monitoring
Choose IP-TCP, IP-UDP, or IPX.
Select a port or range of ports to filter for.
Select what direction you want to filter for. If the “other port”
option is left unchecked, Observer filters for packets to or
from any port to the given port.
By checking the “other port” box, you can specify a second
port, allowing you to filter for traffic between specific source
and destination ports in both directions.
scenarios. The Port Filter rule lets you filter by either source or destination port, or traffic
moving between specific source and destination ports.
Filtering by Protocol Data fields
Observer’s Protocol Data Field filter rule lets you search for specific values in selected
Select one of the pre-defined protocol filters from the
protocol selection tree, or select “User Defined” to
create a custom protocol filter using a Port or Pattern
rule.
Lets you add, edit, or delete user defined protocols.
protocol header fields. For example, you can filter for ICMP “destination unreachable”
packets, as well as wireless control, data, and management packets, to name but two. You
can also define your own custom protocol filter, either by port or search pattern.
Filter Setup for Selected Probe
225
Filtering by WAN DLCI
If you have deployed one of Network Instruments WAN Probes or Systems (or you are
post-filtering a packet capture obtained from such a setup), you can filter by DLCI
number.
Filtering by WAN Port
If you have deployed one of Network Instruments WAN Probes or Systems (or you are
post-filtering a packet capture obtained from such a setup), you can filter by WAN Port
number.
Filtering by WAN data flow direction and congestion control packets (WAN
Conditions)
If you have deployed one of Network Instruments WAN Probes or Systems (or you are
post-filtering a packet capture obtained from such a setup), you can filter by WAN data
flow direction (i.e., DCE, DTE, or any direction). In addition, you can add WAN traffic
management conditions to the filter rule (forward congestion, backward congestion,
discard eligibility.) The conditions are chained by logical ORs. For example if you set
direction to DTE and check all of the option boxes, you will filter for DTE packets that
have the forward congestion, backward congestion, or discard eligibility bit set.
226
The Tools Menu
Filtering by Wireless Access Point, Data Rate, and Signal Strength
Observer includes filter rules useful for 802.11a/b/g wireless analysis, letting you filter for
an access point, particular data rates and ranges of data rates, and signal strength.
Simple Filters (Single-rule filters)
In most cases a single-rule filter is all you need. For example, suppose user Katie is having
access and performance problems with the web server. The only traffic you are interested
in for troubleshooting purposes is the traffic between those two devices (Katie’s machine
and the intranet web server).
Filter Setup for Selected Probe
227
Here’s how to create a simple, one-rule filter to capture that traffic:
228
1.
Choose Filter setup for selected Probe from the tools menu. The Filter Editor
screen is displayed, showing a blank address rule (i.e., a rule that captures all traffic
on the network):
2.
Select the rule by clicking on it. Note the selection color change. Right-click the rule
and choose the Edit Filter... option. In the example, we have named the filter Katie<->Web Server.
3.
Right-click on the address rule and choose Edit... from the menu. The rule’s setup
dialog is displayed:
The Tools Menu
4.
Choose IP as the address Type, and Single address as the range for both address 1 and
address 2. Select (or enter) the IP addresses of the devices you are interested in
monitoring from the Address drop-down list. Set the direction arrow to capture
packets going both directions. Click OK to save the rule changes and close the setup
dialog. The Rule Editor should now look something like this:
5.
Click OK to save the filter.
Changing a Rule Type (Edit as...)
Suppose you want to filter for error packets instead of by address. To change any rule’s
type, right-click and choose Edit as... to display the list of rule types which you can
choose from.
Filter Shortcuts
Most Observer displays that include station lists or decoded packets allow you to jump to
the filter setup screen through the right-click menu. The filter setup screen is automatically
filled in with the relevant rule set. For example, from the Discover Network Names list
Filter Setup for Selected Probe
229
view, you can right-click to set a filter or direct a filtered capture from that station. You
can set a pattern filter by right clicking on the hex pane of the decode window. From the
Expert TCP and UDP Events displays, Observer Expert and Suite users can auto-create a
“conversation filter” (i.e. an address and port filter) by right-clicking an event.
Chaining Multiple Filter Rules by using Logical Operators
Sometimes you need more sophisticated rules to capture packets from a number of
addresses that meet complex criteria.
For these kinds of situations, you can chain multiple rules together into a single filter using
the logical operators AND, OR, and BRANCH. The filter rule editor arranges the rules
according to where the fall logically in the decision tree that you are building when using
multiple rules. Each rule is represented by a rectangle, ANDs are represented by
horizontal connecting lines, ORs and BRANCHes are represented by vertical lines.
AND and OR mean exactly what you would think. For example, the following rule would
cause Observer to include only CRC error packets that originate from IP 255.0.0.1 (in
other words, both the address rule AND the error rule must return positive for the packet
to be captured).
If you want to capture traffic from 2555.0.0.1 along with any error packets regardless of
originating station, you would chain the rules with OR:
BRANCH is somewhat like an OR, but if the packet matches the first rule in the branch, it
is matched only against the rules that follow on that branch.
Suppose your network includes an intrusion detection system (IDS) with a “honeypot”
(i.e., a system to attract hackers so that you can monitor what they are doing). The IDS is
230
The Tools Menu
programmed to send mail whenever the honeypot receives packets on ports 23 or 80 from
a system outside of your network.
To verify the operation of your IDS, you would want to capture any relevant traffic
touching the honeypot, as well as any email traffic coming from the IDS. You are not
interested in filtering the honeypot for email traffic, nor are you interested in filtering the
IDS traffic for port numbers. Here is how to use a BRANCH to implement such rule logic:
These rules filter for “honeypot” traffic on ports 23 or 80.
These rules filter for mail (smtp) on the IDS.
When you chain multiple rules in a filter, packets are processed using the “first match
wins” method: If a packet matches any include or exclude rule in the filter, it is not
processed any further, and the rules that follow the match are never applied to the packet.
Applying Multiple Filters
In addition to applying multiple rules within filters, you can apply multiple filters to both
realtime and post-filtered captures. You can apply each filter alone or in any combination.
To apply multiple filters, check the “Use Multiple Filters” checkbox at the lower left.
Checking this box displays the Multiple Filters Selection list. In this example, 2 of the 11
user-created filters will be applied:
Filter Setup for Selected Probe
231
From the Multiple Filters Selection dialog, you can:
•
Select which filters to apply by clicking the checkboxes.
•
Edit and Delete filters by selecting them and using the button controls
•
Add a new filter, which displays the filter rule editor for the new filter.
Double clicking on a filter brings you directly to the rule editor. Besides giving descriptive
names to filters, you can also set the display color of each filter in the list by right-clicking
and choosing Set Color...
232
The Tools Menu
The Options Menu
Observer General Options
The Observer General Options dialog allows you to select the general settings for
Observer. These include general configuration options, email options, pager options, and
SNMP options (if you have purchased Observer Suite). Default options are described in
this manual; your views may vary based on the settings you apply.
Select Options > Observer General Options. The General Tab dialog will be
displayed. It contains a browsable tree of configuration folders and options, which are
described below.
Observer General Options – General Tab
•
The Ask for confirmation... options let you set whether Observer will prompt you to
Click on OK before closing dialogs and completing other operations.
•
The Associate file extensions options let you set up Windows to automatically load
Observer whenever the selected file type is double-clicked from Explorer.
233
•
The Disable Observer features options let you choose to disable selected Observer
features for bandwidth, processor, or security reasons. You can choose to:
- disable the Expert Analysis portion of the Packet Capture mode.
- disable the local internal Probe, i.e., make the system a remote console only.
- disable DNS name resolution, in all modes that would otherwise show DNS names.
•
Display and formatting options let you:
-enable or disable data tips (in other words, tooltip help) for toolbar buttons
-show or hide manufacturer’s names when displaying hardware (MAC) addresses
-use the 24 hour format for graphs and reports. In 24 hour format 2pm is 14:00
-use or scientific notation for large numbers.
Scientific notation, also known as exponential notation, is the process of taking large
numbers and making them easier to read at a glance. It simplifies numbers by getting
rid of the zeros. In Observer’s case we take any number that is above 999,999 and
place it into scientific notation.
For example: 11,800,000 would be represented as 11.8e6. The e denotes the
exponential, or the number of 0's to be used after the decimal place. 11.8e6 would be
11800000 bytes, or roughly 11.8 MB. The number after the e shows the number of 0's
after the decimal place.
•
Security: Strong encryption is available for Advanced MultiProbe and Observer
Suite users. Encryption key files let you use private encryption keys to ensure that
unauthorized persons do not have access to the data flowing between Observer
consoles and Probes.
To use encryption keys, you must copy the encryption key file into the installation
directory (usually “C:\Observer Files”) of each Probe or Console that you want to
authorize. To generate a key file, use the Encryption Key Utility (which is located in
the Observer program group from the Windows Start Menu). Its online help explains
its use and how to set up the keys it generates.
•
234
The Startup and runtime options let you configure how Observer behaves when it first
starts up, and what kinds of statistics it should keep track of:
•
Keep PC CPU and hard drive always awake, if selected, prevents the hard
drive from going into a power save spindown.
•
Receive SNMP/RMON traps, if selected, enables Observer to receive SNMP or
RMON traps.
•
Turn on active Modes on Observer startup, if selected, causes Observer to
automatically load previously active (open) modes.
•
Run unattended started Packet Capture and Internet Observer, if selected,
runs Packet Capture and Internet Observer without user intervention when
Observer opens. This is allowed only if the “Turn on active Modes on Observer
startup” checkbox is selected.
Observer General Options
Observer General Options–Notifications Tab
The Notifications tab lets you set up the page and email services that Observer uses to
contact the administrator when the criteria set in Triggers and Alarms have been met (see
“Triggers and Alarms Mode” on page 148).
Paging Server Settings
Observer’s paging interface is a complete messaging system for sending alarms to pagers
and cell phones using a modem or Internet connection to a pager service carrier. It
includes a Windows tray icon that provides instant access to Observer’s built-in paging
server.
Configuring a pager service requires you to have some information about the pager
service. When a modem is used, you will need to know about the modem installed or
connected to the Observer PC.
Paging Server Information Checklist
To set up a pager service, you need to obtain the following configuration information from
the pager service supplier:
Network Instruments’ technical support does not have pager service
information.
For SNPP-Based Paging Services
• PIN (destination)—provided by your pager service provider.
•
Login ID, if any—provided by your pager service provider.
•
Password (if any)—provided by your pager service provider.
Observer General Options
235
•
Server IP address—IP address of the pager service provider.
•
Port number—port number of the pager service provider.
For Protocol-Based Paging Services (TAP or UCP)
• PIN (destination)—provided by your pager service provider.
•
Login ID, if any—provided by your pager service provider.
•
Password, if any—provided by your pager service provider.
•
Message type—alphanumeric (sends numbers and letters to a pager), numeric
(generates only numbers), and tone (messages transmitted via tone).
•
Maximum message length—the maximum number of lines your paging service
provider supports.
•
Modem line—allows you to select the modem to use.
•
Modem connection speed—allows you to select the speed your modem will connect
to the pager service provider.
•
Data bits—the number of bits used in communication by the service provider.
•
Parity—many communication programs add an extra bit of data (a parity bit) to each
group of bits sent together as a check to whether they all arrived. Parity checking can
be selected to be “Even” (a successful transmission will form an even number) or
“Odd.” If the service provider does not use parity checking, the selection should be
sent to “None.”
•
Stop bits—communication programs send 1 or 2 bits to tell the program at the other
end that it is beginning or ending a data transmission.
Most service carriers use either 7E1 (7 data bits, even parity, 1 stop bit) or
8N1 (8 data bits, no parity, 1 stop bit).
•
Protocol—the communication protocol used by the paging service provider.
For a Voice-Based Paging Service
• Paging service phone number—the pager number.
236
•
Delay before sending messages—the number of seconds to pause before sending
messages.
•
Preliminary dial sequence—the numbers to be dialed after the paging service number
prior to sending a message.
•
Closing dial sequence.
Observer General Options
Configuring Your Paging Service
You may have to modify some settings in order to adapt to the local environment. It will
be necessary to choose among the provided services or install a new paging service and
substitute the local pager access number, if any, for the supplied one.
1. Select the Default pager configuration from the dropdown menu.
If your pager is not on the list, click on the NEW button. The Paging Service
Properties dialog will be displayed. see “Paging Server Information
Checklist” on page 235.
2.
To view the initial pager configuration dialog, click the PROPERTIES button. The
Paging Service Properties dialog will be displayed.
3.
Enter the Service name. This is the name of the service used to access the pager; the
Service name you selected from the dropdown list is your default.
4.
Enter the Service phone number—use the international number format (e.g., “+1
(123) 1234567”) in order to allow TAPI to work with the Windows location settings.
This textbox will not be displayed if you are using a SNPP pager service, as
SNPP uses TCP/IP to communicate with the paging service, rather than a
modem.
If it’s necessary to have Observer wait for an outside line, insert one or more commas
at the beginning of the string (e.g., “,,,+1 (123) 123-4567”).
Additional spaces and the hyphen in the phone number are optional; they
make the number more easily readable by the user, but will be ignored when
Observer General Options
237
dialing: Observer will dial only the numbers and pause for approximately
one-half second for each comma character.
5.
Select a Service protocol from the dropdown list. Observer supports four different
pager service protocols: TAP, UCP, SNPP, and Voice. Selecting the appropriate
service protocol and clicking the CONFIGURE button enables the user to enter servicespecific configuration data. Each protocol displays a different set of options that need
to be set. Those options are described below for each protocol.
6.
Enter the maximum message length for the pager.
7.
Click the OK button.
Configure SNPP Settings
SNPP (Simple Network Paging Protocol) is a new standard whereby pager messages
can be sent by a computer over the Internet, rather than requiring the sender to
configure and use an installed modem.
One advantage to using an SNPP service is that most of the configuration is
done on the server side by the paging service provider.
Configuring SNPP pagers requires the following information:
•
“PIN (destination)” textbox—enter the PIN of the destination for the page.
Usually, this will be the recipient’s pager number, but some service providers
will require you to prefix or postfix additional numbers to it.
•
“Login ID (if any)” textbox—enter the login ID. If you have a login ID, it will have
been provided by your paging service provider.
•
“Password (if any)” textbox—enter the password for the paging service. If you have a
password, it will have been provided by your paging service provider.
Server settings:
238
•
“Server IP address” textbox—enter the IP address (e.g., “192.168.0.123”) or DNS
name (e.g., “pager.impossico.com”). This will have been provided by your paging
service provider.
•
“Port number” textbox—enter the port number. By default, it is 7777, but may vary.
This port number will have been provided by your paging service provider.
Observer General Options
Configure TAP Settings
TAP (Telecator Alphanumeric Protocol) is a messaging industry standard protocol for
sending message requests from automated equipment. TAP is the most common
protocol used in the United States.
•
“PIN (destination)” textbox—enter the PIN of the page destination.
Usually, this will be the recipient’s pager number, but some service providers
will require you to prefix or postfix additional numbers to it.
•
“Password (if any)” textbox—enter the password for the paging service. This will
have been provided by your paging service provider.
•
“Message type” dropdown—allows you to select the type of pager: Alphanumeric,
Numeric, or Tone.
All paging services support one or more of these types of messages; some
support more than one. If in doubt, the first type to try would be Numeric, as
Alphanumeric messages are a superset of Numeric.
•
“Modem line” dropdown—allows you to select from among the currently defined
modem devices. These devices are from those defined for the system in the Start >
Setttings > Control Panel > Phone and Modem Options dialog.
If the dropdown is blank, Windows does not identify a modem installed
and/or properly configured on your machine. You cannot dial a paging
service without a modem. After physical installation, it is necessary to
configure the modem by clicking
Start > Setttings > Control Panel > Phone and Modem Options.
After adding or configuring a modem, you may need to restart Observer
and/or Windows before the modem will become visible to the system.
The following settings depend on the configuration required by the paging service
provider and should be provided by them. If in doubt, try the default settings first.
•
“Connection speed” dropdown—allows you to select the connection speed of the
modem to your service provider.
Observer General Options
239
•
“Use error control” checkbox—allows you to select whether or not the modem’s error
control features will be enabled.
•
“Data bits” dropdown—allows you to select the number of data bits to be used in
communicating with the modem.
•
“Parity” dropdown—allows you to select the parity to be used in communicating with
the modem.
•
“Stop bits” dropdown—allows you to select the data bits to be used in communicating
with the modem.
Configure UCP Settings
UCP (Universal Computer Protocol) is a messaging industry standard protocol for
sending message requests from automated equipment.
UCP is the most common pager protocol used in Europe.
•
“PIN (destination)” textbox—enter the PIN of the destination for the page.
Usually, this will be the recipient’s pager number, but some service providers
will require you to prefix or postfix additional numbers to it.
•
“Password (if any)” textbox—enter the password for the paging service. This will
have been provided by your paging service provider.
•
“Message type” dropdown—allows you to choose between Alphanumeric, Numeric,
and Tone messages.
•
“Response timeout” textbox—allows you to select the number of seconds before the
response times out.
•
“Operation type” dropdown—allows you to choose the appropriate UDP operation
type: 01, 03, 50, or 51. This information will have been provided by your paging
service provider.
If in doubt, select 01, which allows for simple messaging. The other
operation types offer a superset of that functionality.
240
Observer General Options
•
“Modem line” dropdown—allows you to select from among the currently defined
modem devices. These devices are from those defined for the system in the Windows
Control Panel.
The following settings depend on the configuration required by the paging service
provider and should be provided by them. If in doubt, try the default settings first.
•
“Connection speed” dropdown—allows you to select the connection speed of the
modem to the service provider.
•
“Use error control” checkbox—allows you to select whether or not the modem’s error
control features will be enabled.
•
“Data bits” dropdown—allows you to select the number of data bits to be used in
communicating with the modem.
•
“Parity” dropdown—allows you to select the parity to be used in communicating with
the modem.
•
“Stop bits” dropdown—allows you to select the data bits to be used in communicating
with the modem.
Configure Voice Settings
Voice-based paging services require the following information:
•
“Delay before sending message” textbox—allows you to enter the number of seconds
that the program should pause after connection before sending the message.
•
“Preliminary dial sequence (if any)” textbox—allows you to enter a sequence of
numbers that the program should send after connection, but before sending the
message.
•
“Closing dial sequence (if any)” textbox—allows you to enter a sequence of numbers
that the program should send after sending the message, but before hanging up the
connection.
•
“Modem line” dropdown—allows you to select from among the currently defined
modem devices. These devices are from those defined for the system in the Windows
Control Panel.
Observer General Options
241
Advanced Pager Settings
1. Check the “Apply advanced pager settings” checkbox and click on the
ADVANCED button to display the Advanced Pager Settings dialog.
242
2.
Right-click on a pager item to display the Advanced Pager Settings options.
3.
Click on “Edit pager” or “Insert pager” to display the Edit Pager Entry dialog.
4.
Select your start time from the “Start” spinbox.
5.
Select your end time from the “End” spinbox.
6.
Select the pagers you wish to use from the list of available paging services.
7.
Click on the OK button.
Observer General Options
Pager Service Tray Icon
When Observer is launched, the
icon is displayed in the Windows tray. You can rightclick on the icon to display a menu or you can double-click on the icon to display the
About Paging Server dialog.
The items on the menu are not listed in the same order as in the dialog, but contain the
same information.
•
“Disable message (page) delivery” checkbox—checking this box disables the sending
of pager messages; clearing this box enables messages to be sent.
•
Ok button—closes the dialog.
•
Settings button—opens the Paging Server Settings dialog. see “Paging Server Log”
on page 245.
•
View logs button—opens the Paging Server Log viewer. see “Paging Server Log” on
page 245.
•
Send page button—opens the Send Page dialog. see “Send Page” on page 245.
Observer General Options
243
Paging Server Settings
The Paging Server Setting dialog contains the following items:
•
“Wait for service connection” (seconds) spinbox—allows you to set the time for a
service connection.
•
“Retry delay” (seconds) spinbox—allows you to set the interval between attempts to
send a pager message.
•
“Number of retries” spinbox—allows you to set the number of times to retry sending
a failed pager message.
When the pager message is successfully sent, further retries are aborted.
•
“Discard messages older than” (minutes) spinbox—allows you to set the number of
minutes to attempt to keep sending a paging message. After this time period, if
minutes are reached, the message, even if not sent, is discarded.
•
“Days to keep pager logs” spinbox—allows you to set the number of days to keep
pager logs. Log entries older than this are purged.
•
“Configure Paging Service” dropdown—allows you to configure your paging service.
See “Configuring Your Paging Service” on page 237.
Paging Server Log
•
244
“Select day” dropdown—allows you to select the service log day.
Observer General Options
•
Refresh event list button—clears the event list.
Send Page
The primary use of Send Page is to enable the user to test the paging service without
creating an error event to trigger a page. It also can be used simply as a convenient way to
send a pager message from the Windows desktop.
•
“Select paging service” dropdown—allows you to select your paging service.
•
“Type message” textbox—allows you to type a test message.
Setting up Email Notifications
Allows you to enter the mail server and user account name assigned to the Observer PC
user. Destination stations will receive notifications addressed “From” this user account.
•
“Mail server” textbox—allows you to enter your SMTP mail server’s address (e.g.,
“myserver.com”).
•
“Email user account” textbox—allows you to enter the user account name; this name
will be displayed as the “From” address.
Observer General Options
245
Observer General Options – SNMP Tab
This tab will not be active unless you have purchased a licensed copy of Observer Suite.
After installation, the SNMP Management Console will generally require little, if any,
configuration before it can be used.
•
“Compiled MIB folder” textbox—allows you to define the path to the directory where
SNMP Management Console should look for compiled MIB files.
The default is “C:\Observer Files\SNMP.” We do not recommend changing this
unless you have a specific reason to do so. When you change the MIBs or requests
directory, any currently installed MIBs (or requests) will become inaccessible to the
SNMP Management Console and its supporting utilities. If you change these
directories, you will need to move the files in the existing directories to the new
location. All executable files in the SNMP Management Console package use these
definitions to find installed MIBs and requests.
•
“SNMP Requests folder” textbox—allows you to define the path to the directory
where SNMP Management Console should look for compiled request files.
The default is “C:\Observer Files\SNMP.” It is recommended that you do not change
this unless you have a specific reason to do so.
•
“Stop MIB compilation upon error in MIB source file” checkbox—allows you to stop
MIB compilation when an error is encountered in the MIB source file.
•
“Use as MIB source editor” textbox—allows you to enter the program you wish to
use to edit MIB source files.
The default is Microsoft Windows Notepad, although any editor capable of saving a
plain text file will do.
•
246
“Default SNMP version” dropdown—allows you to select the default version of
SNMP to use for new agents. You may also override this in the Agent Properties
dialog.
Observer General Options
SNMPv1 is, in practice, by far the most commonly-used standard; very few agents
support SNMPv2.
•
“Repeat alarm notifications” spinbox—allows you to select the number of times that
Observer should send out SNMP-related alarms when the alarm has been triggered.
•
“Repeat trap notifications” spinbox—allows you to select how many times to repeat
trap notifications.
While, in practice, the vast majority of notifications sent via UDP will reach their
destination, the UDP protocol, which is specified by the SNMP RFC for trap
notification, does not require or permit packets being acknowledged by the receiving
station. It is simply a matter of sound practice to repeat trap notifications several
times.
•
“Request timeout period (sec)” spinbox—allows you to set the number of seconds
that SNMP Management Console will wait for an agent to respond before resending a
request.
•
“Request retry count” spinbox—allows you to define how many times SNMP
Management Console will re-send a request to an agent before timing out.
•
“Max data buffer (x100K) for running charts” spinbox—allows you to define how
much memory will be made available for SNMP Management Console’s chart
display.
The more memory made available, the more data points the chart display will be able
to show. Memory saved for the SNMP Management Console’s chart display;
however, will not be available for other programs or purposes.
•
“Check this box to enable all optional hint messages” checkbox—if selected, allows
you to enable any optional hint messages for SNMP Management Console that you
have previously disabled.
Observer General Options
247
Observer General Options – Trending Tab
•
“Network Trending Folder” sets the location for Observer to store Network Trending
data.
•
“SNMP Trending Folder” sets the location for Observer Suite to store SNMP
Trending data.
•
“Write SNMP Trending data to disk every x minutes” spinbox—allows you to set the
number of minutes the system will wait before sending logs.
Observer Memory and Security Administration
Configuring Multi-Probe Connections
If you have a Multi-Probe license, you can:
•
configure Observer’s local Probe to view multiple networks if multiple NICs are
installed on the local PC
•
configure Observer’s local Probe to provide multiple Observer consoles with views of
the local network interfaces
To configure these options, choose Options->Observer Memory and Security
Administration from the Observer main menu. The following dialog is displayed:
About Probe Instances
To provide for multiple network interfaces and multiple consoles, the local Probe creates
multiple instances of itself. A Probe instance is a “virtual” Probe with attributes that
define:
•
248
which network interface on the local PC to capture data from
Observer General Options
•
which Observer console (local or remote) to direct the data to.
Creating a Probe Instance
To set up a Probe Instance, follow these steps:
1.
Click the Adapters and Redirection tab to display the current list of instances:
2.
Click New Instance... to begin the Instance wizard, which steps you through
naming and setup of the new instance:
3.
Select an instance ID, then name and describe the instance you are creating.
Click Next... when you are finished.
Observer General Options
249
The Memory Configuration dialog is displayed:
4.
Select an appropriate Capture Buffer size given the local system’s available
memory and how much traffic you plan on capturing from the given network.
Statistical reporting uses different memory and much less of it. Although it is
possible to customize the amounts of memory used by Observer’s various
statistical displays (by checking the Used Advanced Statistics Memory
Configuration option), for most situations the defaults will work perfectly well.
Click Next to continue, and the adapter/redirection configuration dialog is
displayed
5.
250
Choose an adapter to associate with this instance, and a destination for the Probe
to direct its analysis data. “Local Observer” means the Observer console through
which the Probe is being configured; when configuring a stand-alone Probe this
option will be grayed out. Click Finish when you are done.
Observer General Options
The Probe Adapters and Redirection tab will now list the new Probe instance:
Configuring User Accounts for Secure Access
If you wish to restrict access to packet captures and reporting provided by a Probe
instance, you can define security attributes of the local Probe by clicking the Security tab:
The example above shows the Security tab as it appears when the Probe Instances button
in the upper left corner of the display is selected. This view lets you select a Probe instance
from the dropdown list box and display users that have access to that instance and their
permissions.
Observer General Options
251
To display security information by user account, press the User Account button to the left
of the Probe Instances button. This lets you see what permissions the currently selected
user has access to on each instance of the Probe:.
When displaying a user account’s permissions as above, you can use the checkboxes to
fine-tune the permissions that user has on each account by clicking on the Permissions
checkboxes to select or deselect the particular option. The different types of permission
are described below:
Permission
Encrypt data
Explanation
Data sent to the console will be triple-DES encrypted during
transmission. Triple-DES is an extension of the original 56-bit key Data
Encryption Standard approved by the National Security Agency. By
making 3 DES encryption passes, it increases the effective key length
to 168 bits.
Only use this option if you need strong encryption, because it imposes
a significant performance cost. Even with this option turned off, the
Probe will not send raw, easily-readable data; it will be concealed by
the proprietary compression algorithm.
252
Configure
User is allowed to change the Probe’s configuration options (such as
memory usage, etc.).
Redirect
User is allowed to change the destination console for Probe analysis
data.
Select Adapter
User is allowed to change the adapter setting for the Probe.
Capture Packets
User is allowed to view captured packets from the Probe’s network.
Network Trending
User is allowed to view Network Trending data from the Probe’s
network.
Observer General Options
Permission
Internet Patrol
Explanation
User is allowed to run Internet Patrol on the Probe’s network.
Creating or Editing a User Account
To create a new account click New User Account; to edit an existing account, select the
account and click Edit User Account. These options are also available on the right-click
menu.
The setup options are the same whether you are creating a new account or editing an
existing account:
Fill out the name and password fields and select the instances you want this account to
have access to.
By default, when you give an account access to an instance, that account will have
permission to do everything it is possible to do with a Probe instance: receive all statistics
and capture packets, redirect it, configure its memory, etc. If you want to change the
default permissions for the user you are creating or editing, click Change Default
Permissions..., which displays the Set Default Permissions dialog:
Observer General Options
253
Check the desired options and click OK. When you grant this account access to another
Probe instance, the permissions will be automatically set to match what you have selected
here. You also will be able to reset this user’s permission to these values on any Probe
instance by right-clicking the account or instance and choosing the Reset User Account
Permissions option from the popup menu.
Customizing Statistics and Capture Buffers For Probe
Instances
There are two kinds of buffers that a Probe uses to store data in real-time: Capture buffers
and statistical buffers. The capture buffer is used to store the raw data captured from the
network; the statistical buffers store data entries which are series of snapshots of a given
statistical datapoint.
Selecting an appropriate capture buffer size given system resources is all most users need
to worry about; the default settings for the statistical buffers work perfectly fine in the vast
majority of circumstances.
However, if you are pushing the limits of the PC system on which the Probe is installed by
creating many instances, you may be able to avoid some performance problems by finetuning the memory allocation for each instance.
For example, suppose you want to give a number of remote administrators access to Top
Talkers data from a given Probe. You will be able to add more instances within a given
system’s memory constraints if you set up the statistics buffers to only allocate memory
for tracking Top Talkers and to not allocate memory for statistics that no one will be
looking at.
To view and manage memory allocation for Probe instances, click the Memory
Management tab to display the list of instances and their buffer sizes:
254
Observer General Options
Right click any instance and select Edit Probe Instance... to access the memory
allocation dialog:
This dialog lets you select the Capture buffer size, as well as letting you pick from a
number of Statistics memory “presets” (Regular, Large, and Extra Large). If you want
finer control over the statistics memory allocation, check the Use Advance Statistics
Memory Configuration option, which lets you select from a number of statistics memory
presets that you can define and edit yourself. Clicking New... or Edit... displays the setup
dialog:
Observer General Options
255
Enter a descriptive name for the custom memory configuration and select a previous
configuration as a model for the new configuration if desired. Click Next> to display the
second setup dialog:
By clicking on one of the Network Types buttons, you can view and change the number of
entries allocated for each statistical type:
An entry is a record of the given statistic; for example, a Top Talker entry consists of a
station, for errors, an entry would consist of error listing. When you constrain a report to n
number of entries, the Probe will only report the last n entries to the Observer console;
entries after the nth entry are never reported or displayed on the Observer console.
Observer informs you when the Probe is exceeding its memory buffer for a particular
statistic by displaying an error message.
Setting the Total System Memory reserved for Probes
Because Observer operates in real-time, its buffers must always remain in RAM; if the
buffers resided in standard Windows user memory, nothing would prevent the buffer file
from being swapped out to disk and subsequent packet loss. For this reason, the Probe
256
Observer General Options
reserves its memory from Windows upon startup so that no other applications can use it
and cause the buffer to be swapped out to disk.
Although the default amount of total reserved memory should work perfectly in most
situations, you can change it. Click the Observer Reserved Memory tab to display how
much memory is reserved for Probe operation and how much memory is left for Windows:
The setup screen will not allow you to reserve memory in excess of what Windows needs
to run, but it will allow you leave less than the optimum amount necessary for Windows to
perform at its best. Proceed with caution; any performance benefits you might gain by
increasing Observer’s allotment can be lost if you do not leave enough memory for
Windows to perform well.
Selected Probe or SNMP Device Properties
The Probe Options menu item lists and allows you to configure options for the currently
active probe. This includes the built-in probe that is part of the basic Observer product. To
open the Probe Options, select Options > Selected Probe or SNMP Device Properties.
Selected Probe or SNMP Device Properties
257
Edit Probe Entry Tab
•
“Name” textbox—displays the name of the Probe.
Note: The Local Probe title address and comment cannot be edited.
•
“IP address” textbox—displays the IP address of the Probe system.
•
“Comment” textbox—displays the view comments of the Probes area.
Timing:
•
“Communication timeout (sec)” textbox—allows you to define how long Observer
will wait for the Probe to communicate before it assumes the connection is lost.
Values are from 2 to 60 seconds.
•
“Probe report period or local Observer information refresh time (sec)” textbox—
allows you to set how often the Probe sends a refresh packet or how often the local
Observer’s dialogs are refreshed. This value has a minimum of 2 seconds with no
maximum.
•
“Statistics report (refresh) period (sec)” textbox—allows you to set the statistics
display refresh period. This value has a minimum of three seconds with no maximum.
•
“Vital signs report (refresh) period (sec)” textbox—allows you to set the Network
Vital Signs refresh period. Values are from 10 to 600 seconds.
Select Observer (or Probe) type:
258
•
Advanced Observer option button—defines Observer (or the Probe) as a standard
(non-switched) Observer or Probe. Changing this option will close all modes.
•
Switched Observer option button—defines Observer (or the Probe) as switched.
Changing this option will close all modes.
Selected Probe or SNMP Device Properties
Note: When switching from Advanced to Switched mode, you must
configure Observer for switched operation. Details on how this is done are
found in the “Switch Configuration” section of this manual.
Probe Parameters Tab
•
“Network type”—displays the Probe’s network topology. Possible topologies include
Ethernet, Token Ring, FDDI, and Dialup.
•
“Network speed”—displays the network speed.
The distinction here is between the actual, measured speed of the network
and the speed that the NIC card, possibly incorrectly, reads from its
connection. For example, a 10/100MB NIC card on a 10/100MB connection
to a switch on a network where all the other stations are running at 10MB will
report the network speed as 100MB.
This item is the actual number that the NIC card driver sends Observer, so
10MB Ethernet will be reported as “10,000,000”. 100MB Ethernet will be
reported as “100,000,000”.
•
“NIC hardware address”—displays the hard address of the Probe’s NIC.
•
“NIC card name”—displays the name of the card as reported by the NDIS driver to
the registry.
•
“NIC card driver name”—displays the name of the card driver as reported by the
NDIS driver to the registry.
•
“Probe (Local Observer) VxD”—displays the name of the driver file used by the local
Observer or Probe.
•
“Number of adapters”—displays the number of cards the local Observer o r Probe has
configured.
•
“RAM available (MB)”—displays the amount of RAM the local Observer or Probe
reports have available.
Selected Probe or SNMP Device Properties
259
•
“Maximum capture buffer (MB)”—displays the maximum capture buffer Observer
will allow you to configure. Observer has no limitations on the amount of RAM that
can be used for a buffer. The maximum allowable buffer size is displayed in the
Options > Selected Probe or SNMP Device Properties > Probe Parameters tab. The
following formulas are used to calculate the maximum allowable buffer:
For Observer:
Maximum Buffer Size = (Total Physical Memory—18MB) *.4. The total amount
allocated cannot exceed 100 MB.
For Expert Observer and Observer Suite:
You can allocate up to 4 gigabytes, limited only by the physical memory installed on your
system.
In all cases, the actual buffer size (Max Buffer Size) is also reduced by 7% for
memory management purposes. Should you try and exceed the Max Buffer Size an
error dialog will be displayed indicating the minimum and maximum buffer size for
your Observer (or Probe) buffer.
•
“Network errors the NIC NDIS driver claims to provide”—displays the aggregate
errors that your NDIS driver claims to provide statistics for.
Adapter Speed Tab
The Adapter Speed tab contains a dropdown box from which you can choose to let
Observer and the NIC card automatically determine the network speed, or to select from
various values (in megabits per second) for the network speed to be used for calculations.
The primary use of this is to correct a mistaken NIC card’s impression of
overall network speed. An NIC card connected to a 10 megabit hub on a
gigabit network, for example, will think that the entire network is only 1% as
fast as it actually is.
260
Selected Probe or SNMP Device Properties
Wireless 802.11a/b Tab
This tab is available if the currently selected Probe is an 802.11b wireless device.
Note that if your wireless network is configured for WEP, you must activate
WEP and enter the WEP key(s) in the Edit WEP Keys dialog in Observer,
which is described below in this section.
•
“Site Profiles”—allows you to save and retrieve wireless parameters, rather than rekeying the parameters every time you change sites.
•
“Monitor Traffic By”—the method to monitor traffic. The three available methods are
as follows (choose one):
•
Channel— Specify a channel to monitor.
•
BSSID— Specify the Basic Service Set ID of the Access Point you want to
monitor.
•
ESSID—Specify the Extended Service Set ID of the network you want to
monitor.
•
Scan Channels—(Only available if you have chosen to monitor by Channel)
Scan the selected channels. To select channels to scan, click Channel Map...
•
WEP Encryption—Choose Wireless Equivalency Privacy encryption settings. To use
WEP, check the Use WEP keys to decrypt wireless traffic checkbox and click Edit
WEP Keys... to enter the appropriate encryption keys.
•
Antenna to use—the type of antenna connected to your system. Specify one of the
following:
•
Antenna Diversity—Use the stronger signal from the two antenna ports. This
is the recommended setting for the standard snap-on antenna.
Selected Probe or SNMP Device Properties
261
•
Primary Antenna Only—If you are not using the standard snap on antenna,
choose this option if the antenna you are using is connected to the primary
antenna port (see your NIC manual for details).
•
Secondary Antenna Only—If you are not using the standard snap on
antenna, choose this option if the antenna you are using is connected to the
secondary antenna port (see your NIC manual for details).
Web Reporting Configuration
See “Configuring Web Publishing Service” on page 396.
262
Selected Probe or SNMP Device Properties
Actions Menu
Redirecting Probes
When using Observer with a Probe you can redirect a Probe from one Observer console to
another, or from another to the local Observer console. To display the redirection dialog,
from the main Observer menu select Actions > Redirect Probe.
Once you connect to the selected Probe, you can choose to redirect the local Probe or to
another Observer station.
Probe redirection can be password protected. The password is set on the Probe, from the
Options > Probe Options dialog.
The redirection password is case-sensitive; moxie, Moxie, and MOXIE would
all be different passwords.
Notifying a Probe User
Observer provides a chat utility that allows the network administrator to communicate in
real time with Probe PC users. Selecting Actions-> Notify Probe user will open a chat
window on the Probe PC.
This utility is useful if you want to warn a non-dedicated Probe system user that you are
going to do something (e.g. Packet Capture) that is processor-intensive.
Adding/Configuring an RMON Probe
RMON Console Configuration Options
RMON configuration information is kept in the RMON Probe Configuration dialog. This
can be accessed by either right-clicking on the RMON Probe (once you have connected to
it) or by selecting Options > Selected Probe or SNMP Device Properties.
263
RMON Probe Configuration – Edit Probe Entry Tab
This section provides Observer with the basic RMON Probe connection and timing
values.
•
“Name” textbox—allows you to specify a name that will be listed for the Probe on the
list of Probes in Observer.
•
“IP address” textbox—allows you to enter the IP address of the RMON Probe.
•
“Comment” textbox—allows you to enter any comment that might help identify the
Probe. This information will be displayed in the Observer list of Probes.
•
“Read Community String” textbox—allows you to enter the Read Community String
for the Probe; the default is “public.” This string may be considered the “password”
string for reading data from this Probe.
•
“Write Community String” textbox—allows you to enter the Write Community String
for the Probe; the default is “public.” This string may be considered the “password”
string for writing configuration data to this Probe.
•
“Trap Community String” textbox—allows you to enter the Trap Community String
for the Probe; the default is “public.” This string may be considered the “password”
string for writing configuration data to this probe.
Timing:
264
Actions Menu
•
“Communication timeout (1-60 sec)” textbox—allows you to define how long (in
seconds) to wait from a response from the Probe.
•
“Number of retries (1-6)” textbox—allows you to define how many times to retry
communication if no response is received within the Communication timeout period.
•
“Statistics report (refresh) period (3-600 sec)” textbox—allows you to define the
number of seconds between refreshing RMON tables and modes that display time
based statistics.
•
“Vital signs report (refresh) period (10-600 sec)” textbox—allows you to define the
number of seconds between refreshing the vital signs mode.
•
Connect to Probe button—allows you to connect the RMON Probe.
•
Reboot Probe button—allows you to reboot the RMON Probe.
•
Connection display—displays the connection status of the RMON Probe.
•
“Log SNMP packets to Trace window” checkbox—when selected, logs SNMP
packets.
•
“Log connection status messages” checkbox—when selected, displays any log
connection status messages.
RMON Probe Configuration – Probe Parameters Tab
These items are collected directly from the RMON Probe. Selecting the interface (if
multiple interfaces are present) will display that interface’s information.
•
“Software Revision” display—allows you to view the software revision reported by
the Probe.
•
“Hardware Revision” display—allows you to view the hardware revision reported by
the Probe (if it is hardware-based Probe).
•
“Interfaces” list—allows you to view the list of interfaces the Probe is capable of
monitoring. You may also select the interface you would like to monitor here. To
monitor multiple interfaces, you need to add a separate Probe in Observer using
Actions > Add RMON Probe.
•
“ifIndex” display—allows you to view the MIB2 interface index number for the
interface being monitored.
Adding/Configuring an RMON Probe
265
•
“Network type” display—allows you to view the network type the Probe is
monitoring.
•
“Network speed” display—allows you to view the speed of the network as reported
by the Probe.
•
“Hardware address” display—allows you to view the hardware address of the Probe
interface.
RMON Conformance Tab
266
Actions Menu
•
“RMON1 Supported” display—allows you to view if RMON1 is supported by the
Probe. This determination is made by querying the first 10 RMON table entries. If
any one responds, RMON1 is reported to be supported.
•
“RMON2 Supported” display—allows you to view if RMON2 is supported by the
Probe. This determination is made by querying the groups 11-19 RMON table entries.
If any one responds, RMON2 is reported to be supported.
•
“Supported RMON Groups” list—displays the groups that the Probe report supports.
This report is a (formatted) printout of the RMON probeConfig (group 19)
ProbeCapabilities item.
•
“Supported Protocols” list—displays the protocols that the Probe report supports.
This report is a (formatted) printout of the RMON protocolDir (group 11)
protocolDirTable table.
•
“Use history group for statistics gathering” checkbox—when selected, the history
group is used for gathering statistics.
Trap Destinations Tab
This tab lets you the define SNMP management systems that will receive traps. To add a
manager to the list, click the Add... button. Both the Add and Edit let you enter the IP
address of the manager you wish to define as a trap destination, as well as its community
string and port number. The Refresh button causes Observer to query the RMON probe
and forward any trap conditions to the management systems listed in the dialog.
Adding, Editing, or Deleting an SNMP Device
See Adding, Modifying, and Deleting SNMP Agents on page 339.
Update Switch Scripts
This option updates all switch scripts located at each Probe.
Updating All Probes to Current Observer Version
Choose this option to update all licensed Probes to the current Observer version. After you
choose the option, a confirmation dialog is displayed. After you choose Yes, all the
licensed Observer Probes connected to this Observer console will be updated
automatically.
Resetting SNMP Device Alarm Counters
Actions>Reset SNMP Device Alarm Counters resets the alarm counters for the
currently active SNMP device. To reset alarm counters for all SNMP Devices, choose
Actions->Reset All SNMP Devices Alarm Counters.
Adding, Editing, or Deleting an SNMP Device
267
268
Actions Menu
Real-Time Expert
Overview
Real-Time Expert incorporates all of the features of Observer and adds Observer’s Expert
system to help identify problems and help determine the best course of action. With RealTime Expert you can get real-time post capture expert event identification, expert analysis,
and modeling of network traffic data.
Real-Time Expert has multiple views to help identify different network problems.
•
Expert Summary problem analysis—shows all error events in a single, concise
display. For connection-oriented problems, a simple double-click drills down to
further analysis.
•
TCP/UDP/ICMP Events—displays protocol-based and application-based problems.
Local traffic is judged using different criteria than WAN/Internet traffic to help make
certain no false readings are provided. All common port-based services are tracked
and slow response/no response and slow connect/no connect are flagged and sorted by
severity. A generic TCP condition expert tracks all port-based protocols for slow
response or connect characteristics.
•
IPX Events—displays all communication errors being transferred via Novell.
•
NetBIOS Events—displays the number of NetBIOS conditions and events that are
being transferred over the network.
•
Expert Wireless Events—tracks network conditions between wireless stations and
logs a number of events of interest to a wireless network administrator, including the
type of error, the sending and receiving stations, and other status information. As with
other expert events, detailed explanations are just a click away in Expert Help.
•
Time Interval Analysis of any conversation—can be displayed as a “drill-down” from
any problem identified in the IP/TCP/UDP Experts. Time Interval Analysis shows
network errors organized by time periods to identify whether a problem is sporadic or
consistent throughout the day. This information is critical in determining if a problem
is spread throughout a period of hours or if it is localized to a specific time span.
Network utilization within the Interval Analysis is displayed to help match slow
responses with heavy network load.
•
Connection Dynamics—provide a graphical view of system conversations. Packet-topacket delay times are shown visually, allowing instant identification of long latency
and response times. Retransmissions and lost packets are flagged in red for quick
269
identification. Should a particular packet require further investigation, its decode is
only a click away.
•
Server Analysis—displays a server/device's characteristics and response times
charted against the number of simultaneous requests asked of that device. Response
times are charted for recorded request sets and plotted for predicted response times as
request loads increase.
•
“What If” Modeling analysis—starts with measurements based on actual client/server
conversations or peer-to-peer conversations, and plots possible response time,
utilization, and packet flow scenarios. This allows you to predict network bandwidth
and response-time impact for topology changes (e.g., 10MB to 100MB) or by
changes in variables such as average packet size, send-to-receive packet ratio, latency,
server load, and number of users.
This “live-modeling” lets you assess the impact of possible network or
application changes.
Getting Started with Expert Analysis
To display Expert Analysis, select the Decode button from the Packet Capture window
and click the Expert Analysis tab.
Expert Analysis tab
Configuring Real-Time Expert
Configuring the Expert system is a two-step process. While it is recommended that all
Expert users familiarize themselves with both configuration areas, the Expert system is
quite functional for most LANs without any modification of the default configurations.
The two Expert configuration areas are the Expert Item Thresholds and each Expert
mode’s General Settings.
Expert Thresholds (OSI Model)
To display the Expert Thresholds (OSI Model) configuration display, select Mode
Commands > Expert Thresholds (OSI Model) while the Expert window is displayed.
270
Real-Time Expert
You may also view the Expert Thresholds (OSI Model) display by clicking the
button.
EDIT
PROFILES
button
SET
DEFAULTS
button
Expert Thresholds define what parameters are used when determining if a particular event
is a problem or not. Thresholds are set for all Expert events, and for some events, more
than one threshold is set. For example, for TCP Bad Checksums, only the number of
frames during the entire capture process is set. For FTP Session delays, values are set both
for slow connect and slow response, as well as values for grading marginal and critical for
both. In addition to these, values for network and WAN/Internet response times values are
set.
Because of the potentially large number of values that are required and because a number
of different network/WAN/Internet configurations dictate predictable value sets, RealTime Expert Thresholds permit the user to save profiles for sets of values. The Thresholds
configuration displays are loosely based on the OSI model, separating different expert
items from where in the communications stack the item is found.
Each item can be turned on or off by checking the box in the “On” column. The fewer
items that are checked, the less memory used by Observer, and the less processing time
will be occupied by the Expert Analysis.
Expert Threshold Profiles
Configuring profiles is started from the top section of the Expert Thresholds (OSI Model)
display.
Getting Started with Expert Analysis
271
1. Click the Edit Expert Profile button to begin the process. This will
display the Edit Expert Profile dialog.
2.
To create a new profile, click on the Create New button. The Create New Expert
Profile dialog will be displayed.
3.
When you create a new profile, you may base your new profile on an existing profile.
This will populate the new profile with values from the “Based on” profile.
4.
To rename an existing profile, highlight the profile and then click on the Rename
button. The Rename Expert Profile dialog will be displayed.
5.
To delete an existing profile, highlight the profile and then click on the DELETE
button.
Set Defaults Button
The SET DEFAULTS button will populate all values in the current profile with the values
from the Default Expert Profile. Note that the SET DEFAULTS button will be grayed out
when the current profile is set to “Default Expert Profile.”
Expert Items
Each tab in the Expert Thresholds (OSI Model) display represents a different layer of
communication to process for Expert Analysis.
272
Real-Time Expert
Data Link Tab
•
Broadcast Storm—triggers the number of broadcast frames per second.
•
Ethernet Alignment—frames with alignment errors per second.
•
Ethernet CRC—frames with CRC errors per second.
•
Ethernet Frame Too Long—frames with jabber errors per second.
•
Ethernet Frame Too Small—frames with runt errors per second.
•
FDDI Beacons—beacons present on the ring (total).
•
FDDI Error Count—error count total per minute.
•
FDDI Lost Count—frames reported lost per minute.
•
FDDI Not Copied Count—frames not copied per minute.
•
Frame Relay Backward Cong.—the threshold where congestion is considered severe.
•
Frame Relay Forward Cong.—the threshold where congestion is considered severe.
•
High Average Utilization—critical level of average utilization as a percent, averaged
over the current capture.
•
High Peak Utilization—critical level of peak utilization as a percent, for the current
capture.
•
High Retransmissions—exceed number of retransmissions per minute.
•
Multicast Storm—trigger number of multicast frames per second.
•
TokenRing Abort Delimiter—abort delimiter transmitted reports per minute.
•
Token Ring ARI-FCI Errors—ARI-FCI error reports per minute.
Getting Started with Expert Analysis
273
274
•
Token Ring Beacons—number of beacons present on the ring.
•
Token Ring Burst Errors—burst error reports per minute.
•
Token Ring Frame Copied Errors—frame copied error reports per minute.
•
Token Ring Frequency Errors—frequency error reports per minute.
•
Token Ring Internal Errors—internal error reports per minute.
•
Token Ring Line Errors—line error reports per minute.
•
Token Ring Lost Frame Errors—lost frame error reports per minute.
•
Token Ring Monitor Errors—monitor error reports per minute.
•
Token Ring Receive Congestion—receive congestion error reports per minute.
•
Token Ring Purge—ring purge reports per minute.
•
Token Ring Token Errors—token error reports per minute.
•
Wireless CRC—Percent CRC errors per second exceed limit.
•
Wireless Low Quality Per Station—Packets with a signal quality percent less than
this.
•
Wireless PLCP—Frames with short PLCP error per second.
•
Wireless Signal Strength Per Station—Packets with a signal strength percent less than
this.
•
Wireless WEP—Frames with WEP decode error per second.
Real-Time Expert
Network Tab
•
ICMP Echo Requests—the maximum number of ICMP echo requests (pings) per
workstation per second.
•
ICMP Problems—enables the tracking and recording of ICMP error messages. When
checked, Real-Time Expert will identify ICMP error messages both in the Expert
Summary and in the ICMP Events section. When not checked, ICMP events are
ignored.
•
IP Bad Checksum—counts frames with bad IP checksums. The value is the packets
per station for the entire capture or capture period.
•
IP Duplicate Address—the same IP addresses seen coming from two different MAC
addresses within this number of seconds.
•
Wireless High (re)associations—Exceed (re)associations per minute.
•
Wireless Missed ACKs—Percentage of missed ACKs per second when more than 20
data packets.
•
Wireless Station Can Not Associate—Wireless Station Can Not Associate.
Getting Started with Expert Analysis
275
Transport Tab
276
•
IPX Busy—percentage of server busy replies.
•
IPX Retransmissions—percentage of IPX retransmissions.
•
NETBIOS Retransmissions—percentage of NETBIOS retransmissions.
•
TCP Bad Checksum—the count of frames with bad TCP checksum. This is a total for
the entire capture or period.
•
TCP Retransmissions—percent of TCP retransmissions. Values are required for
marginal and critical, as well as for the local network and WAN/Internet traffic.
Values can be set from 0.1% to 100%.
•
TCP Too Fast Retransmissions—retransmissions faster than the defined period, in
milliseconds.
•
TCP Zero Windows—percentage of TCP zero window advertised packets. Values are
required for marginal and critical, as well as for the local network and WAN/Internet
traffic. Values can be set from 0.1% to 100%.
•
UDP Bad Checksum—the count of frames with bad UDP checksum. This is a total
for the entire capture or period.
•
UDP Retransmissions—percent of UDP retransmissions. Values are required for
marginal and critical, as well as for the local network and WAN/Internet traffic.
Values can be set from 0.1% to 100%.
•
Wireless WEP not used—Packets with no WEP on directed data packets with data
present.
Real-Time Expert
Session Tab
Session data is compiled for all data associated with a particular port-based
conversation. This includes all data packets, acks, etc. This differs from the
Presentation/Application Expert events where server application processing
times are tracked.
•
DNS Session Delays—defines the session response time delay for DNS (UDP) that is
considered marginal and critical. Values are required for both the local network and
Internet/WAN.
•
FTP Session Delays—defines the session response time delay for FTP that is
considered marginal and critical. Values are required for the local network and
Internet/WAN, and for initial connection (slow connect) as well as for ongoing
communications (slow response).
•
Generic TCP Protocols Session Delays—defines the session response time delay for
all TCP port-based protocols that are not defined specifically that are considered
marginal and critical. The port number will be displayed without a name. Values are
required for the local network and Internet/WAN, and for initial connection (slow
connect) as well as for ongoing communications (slow response).
•
HTTP Session Delays—defines the session response time delay for HTTP (Web) that
is considered marginal and critical. Values are required for the local network and
Internet/WAN and for initial connection (slow connect) as well as for ongoing
communications (slow response).
•
IPX NCP Session Delays—defines the session response time delay for IPX Network
Core Protocol packets that is considered marginal and critical. Values are required for
Getting Started with Expert Analysis
277
the local network and Internet/WAN and for initial connection (slow connect) as well
as for ongoing communications (slow response).
278
•
IPX SMB Session Delays—defines the session response time delay for IPX Server
Message Block packets that is considered marginal and critical. Values are required
for the local network and Internet/WAN and for initial connection (slow connect) as
well as for ongoing communications (slow response)
•
LPD Session Delays—defines the session response time delay for LPD that is
considered marginal and critical. Values are required for the local network and
Internet/WAN, and for initial connection (slow connect) as well as for ongoing
communications (slow response).
•
IP NetBIOS Session Delays—defines the session response time delay for (IP)
NetBIOS that is considered marginal and critical. Values are required for the local
network and Internet/WAN, and for initial connection (slow connect) as well as for
ongoing communications (slow response).
•
NETBIOS Session Delays—defines the session response time delay for NETBIOS
that is considered marginal and critical. Values are required for the local network and
Internet/WAN, and for initial connection (slow connect) as well as for ongoing
communications (slow response).
•
NFS Session Delays—defines the session response time delay for NFS that is
considered marginal and critical. The port number will be displayed without a name.
Values are required for the local network and Internet/WAN, and for ongoing
communications (slow response).
•
NNTP Session Delays—defines the session response time delay for NNTP (Network
News) that is considered marginal and critical. Values are required for the local
network and Internet/WAN, and for initial connection (slow connect) as well as for
ongoing communications (slow response).
•
POP3 Session Delays—defines the session response time delay for POP3 that is
considered marginal and critical. Values are required for the local network and
Internet/WAN, and for initial connection (slow connect) as well as for ongoing
communications (slow response).
•
RPC Session Delays—defines the session response time delay for RPC that is
considered marginal and critical. Values are required for the local network and
Internet/WAN, and for initial connection (slow connect) as well as for ongoing
communications (slow response).
•
SMTP Session Delays—defines the session response time delay for SMTP that is
considered marginal and critical. Values are required for the local network and
Internet/WAN, and for initial connection (slow connect) as well as for ongoing
communications (slow response).
•
SNMP Session Delays—defines the session response time delay for SNMP that is
considered marginal and critical. The port number will be displayed without a name.
Real-Time Expert
Values are required for the local network and Internet/WAN, and for ongoing
communications (slow response).
•
TCP SYN Requests—the number of sync frames seen per second.
•
Telnet Session Delays—defines the session response time delay for Telnet that is
considered marginal and critical. Values are required for the local network and
Internet/WAN, and for initial connection (slow connect) as well as for ongoing
communications (slow response).
•
User Defined [1-5] Session Delays—defines the session response time delay for user
defined port-based TCP protocols that are considered marginal and critical. Protocols
are defined by Port and Name. Values are also required for the local network and
Internet/WAN, and for initial connection (slow connect) as well as for ongoing
communications (slow response).
Presentation/Application Tab
•
DNS Application Processing Time—defines the application processing time delay for
DNS (UDP) that is considered marginal and critical.
•
FTP Application Processing Time—defines the application processing time delay for
FTP that is considered marginal and critical.
•
Generic Applications Processing Time—defines the application processing time
delay for all TCP port-based protocols that are not defined specifically that are
considered marginal and critical. The port number will be displayed without a name.
•
HTTP Application Processing Time—defines the application processing time delay
for HTTP (web) that is considered marginal and critical.
Getting Started with Expert Analysis
279
280
•
LPD Application Processing Time—defines the application processing time delay for
LPD that is considered marginal and critical.
•
NetBIOS Application Processing Time—defines the application processing time
delay for NetBIOS that is considered marginal and critical.
•
NFS Application Processing Time—defines the application processing time delay for
NFS that is considered marginal and critical.
•
NNTP Application Processing Time—defines the application processing time delay
for NNTP that is considered marginal and critical.
•
POP3 Application Processing Time—defines the application processing time delay
for POP3 that is considered marginal and critical.
•
POP3 Login Failures—defines the application processing login failures.
•
RPC Application Processing Time—defines the application processing time delay for
RPC that is considered marginal and critical.
•
SMTP Application Processing Time—defines the application processing time delay
for SMTP that is considered marginal and critical.
•
SMTP Login Failures—defines the application processing SMTP login failures.
•
SNMP Application Processing Time—defines the application processing time delay
for SNMP that is considered marginal and critical.
•
TDS Dataset Not Found—defines the application processing TDS dataset not found.
•
TDS Login Failures—defines the application processing TDS login failures.
•
TDS Timeout—defines the application processing TDS timeout.
•
Telnet Application Processing Time—defines the application processing time delay
for Telnet that is considered marginal and critical.
•
User Defined [1-5] Application Processing Time—defines the application processing
time delay for user-defined port-based TCP protocols that are considered marginal
and critical. Protocols are defined by port and name.
•
VoIP Jitter—defines the application processing VoIP jitter.
•
VoIP Percent Lost—defines the application processing VoIP percent lost.
Real-Time Expert
Using Real-Time Expert
Real-Time Expert analyzes all captured packets and each captured packet’s contents in
order to identify problems.
Packets
processed
display
header
Expert
button bar
Expert
Analysis pane
Functional Overview
There are a number of ways to approach a network problem with Real-Time Expert. As
with any network problem, you should first determine if you can reproduce the problem. If
you can reproduce the problem, set up a capture to collect data for the entire event (start to
finish) and then use the Expert in post capture mode to identify possible causes of the
event. Each section of the Expert is designed to shed light on different possible problems.
If the problem cannot be reproduced, it is often possible to run the Expert in real-time
analysis mode to see if you can gather more information about the problem when it
happens, or if there are other, more general, network problems occurring that could be
influencing your network performance.
In addition to finding the source of a problem, Real-Time Expert also offers a number of
modeling features designed to help predict what changes on your network/WAN’s
configuration (e.g., from 10MB to 100MB) to response time or bandwidth utilization. This
“live modeling” is based on a sample of your network data and projections can be made to
simulate more users or slower WAN connects.
Expert Summary, Expert Events, and Expert Analysis
Real-Time Expert is divided into three areas: Expert Summary, Expert Events, and Expert
Analysis.
Using Real-Time Expert
281
•
Expert Summary—a collection of critical events from the various Expert Events
sections, as well as a display of non-TCP based events (e.g., a CRC or alignment
error).
•
Expert Events—break down the IP conversations into subprotocol groups of TCP,
UDP, and ICMP. In the case of TCP and UDP, the conversations are further broken
down by application. Each conversation is graded based on a user-defined threshold
for a number of conditions.
•
Expert Analysis—takes the analysis of Expert Events to the next level. A number of
different types of views can be displayed for each conversation displayed in the
Expert Events sections. Typically, these displays are accessed by right-clicking on the
conversation in question and choosing the form of analysis required.
Real-Time and Post-Capture Analysis
The Expert system within Observer can be used either in real-time or post-capture. Once
data has been captured, a number of different, related displays are available to help isolate
and identify problems.
Real-Time Analysis
Real-Time Expert Analysis can identify problems as they happen. In general, you would
run Observer’s Packet Capture and view the Expert Summary as the capture is taking
place. Since real-time processing can involve a tremendous amount of data, it is possible
that Observer may get behind in processing packets. It is important to know what
percentage of the packets have been processed; therefore, the Expert displays this
information on the display header.
The header shows the number of packets captured, the number of packets processed, and
the percent of packets processed. Expert Analysis of packets is done at a lower priority
than actual capture: Observer will first try to maintain full line rate capture, and then
process the Expert Analysis during lulls in the capture of data.
There are a number of considerations when doing real-time analysis. The first decision is
whether to use a circular or a static buffer. This decision should be based on the amount of
available RAM on your system that can be used for the Observer capture buffer. You will
also want to calculate whether the buffer will be large enough to capture the data required
to analyze the event.
If you have a large amount of RAM, you may want to assign the largest buffer possible
and run the Expert in real-time, collecting all packets and data. When using the Expert in
this situation, the Expert Summary, Expert Events, and Expert Analysis all will be
available.
282
Real-Time Expert
If the amount of RAM available for the Observer buffer is not large or is not large enough
to capture the event in question or for the amount of time required to view the conditions
in question, you should set Observer to capture using a circular buffer. In this case,
Observer will capture packets until the buffer is full and then add new packets to the buffer
while removing the oldest packets. As this process continues, the Expert Summary and
Expert Events sections will continue to collect totals for events.
After some period of time, the Expert Events dialogs begin to remove noncritical events based on the user-supplied settings in the General tab under
Expert Global Settings.
Post-Capture Analysis
Post-capture analysis can be done on an Observer capture buffer or Sniffer® buffer. Often
a capture from a remote site will be forwarded to an individual with Real-Time Expert for
analysis. Post capture Expert Analysis does not have any of the buffer limitations of realtime analysis.
Expert Global Settings
Real-Time Expert Global Settings allow configuration of the different expert modes and
other items that are used in all Real-Time modes.
To access the Expert Global Settings dialog, either select the Expert Global Settings item
from Mode Commands (when in Packet Capture View with the Expert Analysis tab
.
selected) or click the EXPERT SETUP icon
Expert Global Settings – General Tab
These values define how many items Real-Time Expert will keep in memory at any one
time.
Using Real-Time Expert
283
Number of Expert list entries to keep:
•
“TCP conditions and events” textbox—defines the number of TCP items that will be
tracked. An item is defined as a conversation on a particular port. Note that if you
compact multi-port conversations into a single conversation (set in the TCP/IP tab),
the number of items does not change. A higher value will result in more system
memory usage; a lower value will use less memory usage. The default value is 1000.
•
“UDP conditions and events” textbox—defines the number of UDP items that will be
tracked. An item is defined as a conversation on a particular port. Note that if you
compact multi-port conversations into a single conversation (set in the TCP/IP Tab),
the number of items does not change. A higher number will result in more system
memory usage; a lower number will use less memory. The default value is 1000.
•
“ICMP conditions and events” textbox—defines the number of ICMP items that will
be tracked. An item is defined as a single ICMP message. A higher value will result in
more system memory usage; a lower value will use less memory. The default value is
1000.
Entries are removed based on a last-seen and least-critical basis—first the
oldest non-critical items are removed, then the oldest critical items.
284
•
“IPX conditions and events” textbox—defines the number of IPX conditions and
events that will be tracked.
•
“NETBIOS conditions and events” textbox—defines the number of NETBIOS
conditions and events that will be tracked.
•
“Minimum pkts for % of packets analysis (% of retransmissions and zero windows)”
textbox—defines the minimum number of packets to be present before any
identification of retransmissions and zero window calculations are made.
Real-Time Expert
Expert Global Settings – IP Range Tab
These items define how Real-Time Expert identifies which conversations are local
(network) and which conversations are from the WAN or Internet.
•
Auto-determine local IP subnets option button—when selected, Observer will
(attempt to) automatically determine the local subnet. This is done by identifying
your local adapter and using the configured IP address and subnet mask. When this
information is identified, Observer assumes your local IP range to be within your
subnet.
•
Define local IP range option button—when selected, allows you to enter a specific IP
address range to use as the local range.
Selected Adapter Settings:
•
“Adapter Name” display—allows you to view the adapter name.
•
“Subnet mask” display—allows you to view the subnet mask.
•
“IP Address” display—allows you to view the IP address.
•
IP Range textboxes—allows you to enter an IP range; only active when the Define
local IP range option button is selected.
Using Real-Time Expert
285
Expert Global Settings – TCP/IP Tab
These items define how IP conversations will be identified.
Compact multiport connections to a single connection for:
•
“TCP subprotocols” checkbox—when selected, multi-port conversations (for the
same pair) will be shown as one conversation. In this case, each port-based Expert
event for the conversation pair will be summed and displayed as a total (of all items)
seen on all ports for that conversation.
When not selected, every port will be listed as a separate line and displayed as a
separate conversation item.
•
“Show undetermined TCP protocols as one connection” checkbox—when selected,
port-based protocols that are not identified by Observer are collected into one
conversation display line.
•
“UDP subprotocols (except DNS)” checkbox—when selected, multi-port
conversations will be shown as one conversation. In this case, each port-based expert
event for the conversation pair will be summed and displayed as a total (of all items)
on all ports for that conversation.
When not selected, every port will be listed as a separate line and displayed as a
separate conversation.
286
•
“Show undetermined UDP protocols as one connection” checkbox—when selected,
port-based protocols that are not identified by Observer will be collected into one
conversation display line.
•
“DNS protocol over UDP” checkbox—by default, this box is checked to compact
DNS requests into one conversation. (DNS conversations are treated separately in
Real-Time Expert. The reason for this is that Observer sends many DNS packets in an
attempt to resolve all IP addresses in all list boxes; if DNS was not compacted, there
Real-Time Expert
would be as many separate conversations recorded for the Real-Time Expert system
as there are IP addresses collected. It is possible to not have “other” (non-DNS)
conversations shown separately, but to still have the DNS compacted.)
Expert Global Settings – Time Interval Analysis Tab
This setup dialog defines the time interval for the Time Interval Analysis.
•
“Time interval (ms)” textbox—allows you to set the amount of time (in milliseconds)
to split any conversation into when viewing the Time Interval Analysis mode. The
default is 1000ms (1 second).
•
“Include time intervals that have no data” checkbox—when selected, all time
intervals will be displayed regardless of whether data has been collected or not. When
not selected, time intervals without data will not be displayed.
Using Real-Time Expert
287
Expert Global Settings – What-If Analysis Tab
This dialog sets the default items for the What-If Analysis display.
Graph Settings:
•
“Full Duplex Send & Half Duplex Color” dropdown—allows you to define the color
of the graph line for sent data. For full duplex, this is only the “send” color. For
standard networks (half duplex), this defines both “send” and “receive” colors.
•
“Full Duplex Receive Color” dropdown—allows you to define the color of the graph
line for full duplex receive sent data; only active if the “Full Duplex” checkbox is
selected.
•
“Full Duplex Send & Half Duplex Reference Color” dropdown—allows you to define
the color of the reference graph line for sent data. The reference line shows the
original value prior to modifying any of the modeling values. For full duplex, this is
only the reference send color. For standard networks (half duplex), this defines both
send and receive reference colors.
•
“Full Duplex Receive Reference Color” dropdown—allows you to define the
reference color of the graph line for full duplex receive sent data. The reference line
shows the original value prior to modifying any of the modeling values.
•
“Show Reference Lines” checkbox—allows you to select a reference line to be
displayed when any value in the live modeling sections are changed. The reference
line shows the original value prior to modifying any of the values.
Processing Time (ms):
•
288
Real-Time Expert
“Client” spinbox—allows you to set the default client processing time. Client
processing time is the amount of time the client requires (on average) to process a
request and to respond.
•
“Server” spinbox—allows you to set the default server processing time. Server
processing time is the amount of time the server requires (on average) to process a
request and to respond.
Server Characteristics:
•
“Start thread time (ms)” spinbox—allows you to set the amount of time it takes to
process a thread on the server. This is only taken into account when the Server Type
item (selected in the What-If display) is defined as “Web.”
•
“Maximum Adapter Card Throughput (Mbps)” spinbox—allows you to define the
server’s maximum throughput. This is only taken into account when the Server Type
item (selected in the What-If display) is defined as “Ftp.” This may be the rated
utilization of the adapter, but most likely it is some fraction of the maximum
theoretical utilization of the network.
One way to get a value for this option is to run Observer on the server using
the packet generation mode and setting the generation rate very high. You
can then view the utilization that the server can create using Observer’s
utilization modes. The maximum utilization will reflect the NIC card’s ability to
generate traffic.
•
“Full Duplex” checkbox—when selected, the Expert will assume (by default) that the
connection is full duplex.
•
“Include utilization from other sources in What-If Analysis” checkbox—when
selected, in addition to the selected pair’s utilization, the other network utilization is
added to all calculations. Thus, the utilization is the pair’s utilization plus the other
utilization or the total utilization. When not checked, only the selected pairs’
utilization is used in calculations.
Expert Displays
Real-Time Expert is displayed in two ways:
•
Opening a (previously captured) buffer and selecting the “Expert Analysis” tab at the
bottom of the decode display, or
•
Capturing packets and selecting the View icon from Packet Capture. Then select the
“Expert Analysis” tab at the bottom of the decode display.
By default, the Expert Summary will be displayed when the Expert is opened.
Expert functionality is accessed through the use of the button bar on the left of the display
and through the use of double clicks and right clicks on different items. Typically, where
only one choice is available, a double click will “drill-down” for more information on an
item (e.g., on items in the Summary display). When multiple choices are available, a rightclick will offer a menu to select the choice (e.g., on items in the TCP Events display).
Expert Displays
289
Expert Button Bar
The Expert button bar has three sections: Summary, Expert Data, and Analysis.
Summary
button
Expert
Data
button
Analysis
button
The Summary and Expert Data sections can be accessed by selecting either the SUMMARY
or EXPERT DATA buttons. Within the Expert Data buttons, there are options for TCP
Events, UDP Events, and ICMP Events. Additionally, you may “drill-down” from the
Summary section to any of the Expert Data sections by double-clicking on the identified
problem.
For most Analysis functions, access is a two-step process.
1. Select a pair (or conversation) in one of the Expert Data sections and
click on it.
2.
Click the START icon to start the analysis.
Note that some Analysis modes offer a number of ways to view the conversation. Once
this selection has been made for a particular conversation, you can review the Analysis for
the last chosen conversation by selecting the ANALYSIS button on the button bar.
Expert Summary
The Expert Summary offers a summation of Expert Events seen in real-time or any events
seen in a previously captured buffer.
290
Real-Time Expert
The Summary is typically the first place to begin using the Expert. Once a general set of
metrics is identified with respect to the network or capture, the next steps in pinpointing
the problem usually become obvious.
The Summary displays the general problems reported and how many times the problem
has been identified. The Expert Analysis display pane at the bottom of the window offers
general instructions on what options are available in the display and may offer a short
explanation of the highlighted item.
As with all Expert displays, the far left button bar is the standard Packet Capture View bar
and can be accessed either by selecting a button or by using Start Modes.
Expert Events
TCP Events
The TCP Events display shows each conversation based on protocol, port, or by station to
station conversation. Columns display the protocol, status, number of packets in each
direction, packet delay in each direction, the number of retransmissions in each direction,
any zero TCP windows advertised in each direction, and an “other” section.
Highlighting any pair will display Expert Analysis in the “Expert Analysis” pane at the
bottom of the display.
Expert Displays
291
Analysis is offered for both client and server.
TCP
events
row
TCP Events Row Definitions
Station Columns:
•
First “Station/Port->” column—displays the client in any conversation.
•
Second “<-Station/Port” column—displays the server in any conversation, if it can be
identified.
Station column ports are displayed based on the setting chosen in the “Expert Global
Settings.” See “Expert Global Settings” on page 283.
By default, conversations will be identified by server port and application.
•
Protocol—application protocols are displayed, if known. If the port used is unknown
to Observer, this column will be blank.
•
Status—displayed as red, yellow, or green.
•
Red—indicates a critical problem.
•
Yellow—indicates a marginal problem.
•
Green—indicates no problems.
Settings for critical and marginal are set in the “Expert Threshold (OSI Model)” setup
dialog. See “Expert Thresholds (OSI Model)” on page 270.
•
Packets—displays the number of packets seen in each direction.
•
Delay (ms)—calculates in each direction as an overall average of the delay within the
protocol. Only delay between data sent and acknowledgment is used for the
calculation.
Whether the delay is judged critical or marginal is considered differently for local
data and for Internet/WAN data. This is to make certain that no false critical or
292
Real-Time Expert
marginal values are displayed for Internet/WAN data that may naturally be slower
than local response time data.
Each level, for critical or marginal and for Local or Internet/WAN, are setup in the
“Expert Threshold (OSI Model)” setup dialog. See “Expert Thresholds (OSI Model)”
on page 270.
•
Retrans—displays by conversation and direction.
Thresholds are set in the “Expert Threshold (OSI Model)” setup dialog under
“Transport” and “TCP Overall Retransmissions.” See “Expert Thresholds (OSI
Model)” on page 270.
•
Zero Wnd—displays by conversation and direction.
Thresholds are set in the “Expert Threshold (OSI Model)” setup dialog under
“Transport” and “TCP Zero Window.” See “Expert Thresholds (OSI Model)” on
page 270.
•
Other—displays other error conditions. These include slow connection on the specific
protocol and slow response on the specific protocol or conversation.
As with other columns, the thresholds for these items can be found in the “Expert
Threshold (OSI Model)” setup dialog under “Session” for most common TCP
applications and under “Transport” and “TCP Overall Conditions.” See “Expert
Thresholds (OSI Model)” on page 270.
TCP Events Right-Click Menu
Highlight any TCP conversation and right click to display the right click menu with
options for further analysis on the specific conversion.
•
Connection Dynamics—sends the conversation information to the Connection
Dynamics display. See “Connection Dynamics” on page 297.
•
Time Interval Analysis—sends the conversation information to the Time Interval
Analysis display. See “Expert Global Settings – Time Interval Analysis Tab” on
page 287.
The Time Interval Analysis option has a sub-menu that allows you to select how you
would like to view the conversation. Options are:
•
Station1/Port <-> Station2/Port—sends conversation data to Time Interval
Analysis for the specific station/port conversation.
Expert Displays
293
•
Station1/Port <-> Local network—sends conversation data (by port) for Station1
and all other stations on the local network. The local network is defined in the
“Expert Global Settings” dialog under the “IP Range” tab. See “Expert Global
Settings – IP Range Tab” on page 285.
•
Station1/Port <-> Internet/WAN—sends conversation data (by port) for Station1
and all other stations found from the Internet/WAN. The Internet/WAN network
is defined in the Expert Global Settings dialog. See “Expert Global Settings – IP
Range Tab” on page 285.
•
Station1 <-> Station2—sends conversation data for Station1 and Station2 (all
ports).
•
Station1 <-> Local Network—sends conversation data (all ports) for Station1 and
all other stations on the local network. The local network is defined in the
“Expert Global Settings” dialog under the “IP Range” tab. See “Expert Global
Settings – IP Range Tab” on page 285.
•
Station1 <-> Internet/WAN—sends conversation data (all ports) for Station1 and
all other stations found from the Internet/WAN. The Internet/WAN network is
defined in the “Expert Global Settings” dialog under the “IP Range” tab. See
“Expert Global Settings – IP Range Tab” on page 285.
•
The same descriptions apply for all “Station2” references.
•
Server Analysis—sends the conversation information to the server display.
•
What-If Analysis—sends the conversation information to the What-If Analysis live
modeling display.
The What-If Analysis is only displayed if there is server delay information
available.
•
VoIP Analysis—sends the conversation information to the VoIP Analysis display.
•
Expert Explanation: TCP Station
Note: Expert Explanation is context-sensitive to the specific column where
you right-click. For example, if you right-click on the “Delay (ms)” column,
you will be offered Expert Explanation on “TCP Delay.” If you right-click on
the “Retrans” column, you will be offered Expert Explanation on “TCP
retransmissions.”
UDP Events
The UDP Events section is identical to the TCP Events section, only it reports on UDP
protocols. See “TCP Events Row Definitions” on page 292.
ICMP Events
294
Real-Time Expert
The ICMP Events dialog tracks ICMP errors and reports the error, station, port, and
number of occurrences of the error.
For specific explanations of each ICMP error, right-click on the error in question and
select “Expert Explanation.”
IPX Events
The IPX Events dialog tracks IPX communication errors. Columns display the protocol,
status, number of packets in each direction, packet delay in each direction, and the number
of retransmissions in each direction.
Expert Displays
295
NetBIOS Events
The NetBIOS Events dialog tracks NetBIOS communication errors. Columns display the
protocol, status, number of packets in each direction, packet delay in each direction, and
the number of retransmissions in each direction.
Wireless Events
The Wireless Events dialog tracks wireless communication errors. Columns display the
station, status, number of packets in each direction, associations in each direction., as well
as various error counts from each direction.
Generating Reports in MS Word Format
You can configure and generate an MS-Word format expert analysis report that can be as
detailed or concise as needed. Click the Tools button and choose Create Expert Report
in MS-Word format...
296
Real-Time Expert
A wizard then displays a series of dialogs that let you configure what will be included in
the report and the pathname under which it will be saved.
Expert Analysis
Time Interval Analysis
The Time Interval Analysis displays TCP or UDP Event conversations in a table format
showing the conversation split up by the user-defined time period.
To access the Time Interval Analysis display, right-click on a conversation in either the
TCP Events or the UDP Events. Select TIME INTERVAL ANALYSIS and then choose your
connection option. See “TCP Events Right-Click Menu” on page 293.
Time periods can be defined by either right-clicking on the display and selecting
“Properties,” or by selecting the “Time Interval Analysis” tab from the “Expert Global
Settings” display.
Columns include Network Utilization and Network Packets/sec to help determine, for
each Time Interval Analysis, what the overall network conditions were and how that may
have affected the errors observed.
If you are not seeing any values under Network Utilization, make sure that
you have the option to collect “Expert Load Information Packets” checked on
in the Packet Capture setup.
The “Notes” section displays the type of conversation and the stations listed.
Connection Dynamics
Connections Dynamics show a selected conversation graphically illustrating the interpacket delay as a spacing between packets. Packet-to-packet delay times are shown
graphically, allowing instant identification of long latency and response times.
Expert Displays
297
Retransmissions and lost packets are flagged in red for quick identification. The packet
display can contain either a brief or detailed view of each packet’s contents.
To access Connection Dynamics, right-click on a conversation in either the TCP Events or
the UDP Events and select CONNECTION DYNAMICS. Once a conversation has been
displayed in Connection Dynamics, it can be reviewed by clicking the CONNECTION
DYNAMICS button on the Expert button bar.
The Connection Dynamics display consists of the graphical display and a status bar that
changes as you hover your mouse over a particular packet. When no packet is under the
mouse, the status bar displays the type of conversation in the display (TCP or UDP), the
conversation’s duration (in seconds), and packet count.
Connection Dynamics Packet Color Code
The packet square under the mouse cursor will always be blue. When a packet is not under
the mouse cursor, the color of the packet squares and accompanying packet frame gives
information about the packet.
Packets will be colored according to the following rules:
298
•
Gray—a normal response time. Real-Time Expert believes that there is no problem
with this packet.
•
Purple—a possible problem. While Real-Time Expert does not believe that there is
necessarily a problem with this connection, it bears further examination by the
network administrator to see if there might be a problem, particularly if there are
several purple-coded packets.
•
Red—a definite problem, in terms of response time, CRC error, skipped packets,
excessive retransmission, or other functionality. Real-Time Expert believes that there
is a problem with this packet, and the network administrator should investigate to
Real-Time Expert
determine if the problem with this connection is temporary and transient, or indicates
a more serious problem on the network.
Connection Dynamics Right-Click Menu
The Connection Dynamics right-click menu offers display options and access to a packet’s
decode.
•
Decode—displays the decode of the selected packet.
•
Show Header Details—toggles the display of packet details. When details are not
being displayed, each packet’s details can be seen in the Connection Dynamics status
bar by hovering the mouse over a packet.
•
Time Resolution—zooms in and out showing the packet spacing (timing) on different
pixel scales.
Server Analysis
The Server Analysis displays are designed to help evaluate a server’s or system’s response
time under various load scenarios.
The “server” in Server Analysis can be selected in a number of ways. From either the TCP
Events or UDP events, right-clicking on any conversation will offer access to Server
Analysis for either station in the right-click menu, or by clicking the SERVER ANALYSIS
button and selecting the server from the dropdown list at the top of the display.
Expert Displays
299
The graph on the top of the Server Analysis display shows the response times for each
level of simultaneous requests. An average line is shown for baselining purposes.
What-If Analysis
What-If live modeling and analysis offers both a predictive tool for modeling potential
response times, utilizations, or packets per second at different network speeds, and also
permits you to change different conversational and network metrics to predict changes in
performance with the new values.
The What-If Analysis starts with a conversation collected from your network and bases all
predictions on your actual network data. Different system formulas are used for different
types of systems to be modeled.
To begin your What-If live modeling session, right-click on a conversation from either the
TCP or UDP Events display and select WHAT-IF ANALYSIS.
300
Real-Time Expert
You can only do What-If modeling on conversations that have a recorded
server (the second address in any conversation) delay.
The top of the display will show which stations are currently being modeled. The client is
on the left, the server is on the right.
The X-axis of the graph will always display different network speeds. If the data collected
was from Observer, a vertical reference line will be displayed showing the network speed
at which the data was collected.
The Y-axis will display different values depending on the graph type selected.
A key display will show the different items on the graph and their associated colors.
The items below the graph initially represent the actual data from the captured
conversation. Items can be changed to model changes in the network.
Observed Connection Parameters (derived directly from the conversation data collected):
•
Average Packet Size (Bytes)—displays the average size of the packets sent from the
client and the server. Changing these values in the Client or Server spinboxes will
model changes in network performance.
•
Latency (mSec)—displays the average latency time as observed in the transaction
conversation. Values are shown for packets sent from the client and the server.
Changing these values in the Client or Server spinboxes will model changes in
network performance.
•
Transaction Packet Ratio—displays the transaction packet ratio of the packets sent
from the client and the server.
•
“Utilization from other sources (%)” spinbox—sets the network utilization to
simulate. This would be in addition to the current conversational conditions recorded,
and only changes the modeled values if the option to “Include utilization from other
sources in What-If Analysis” is checked in the Expert Global Settings, What-If tab
setup.
User-Defined Parameters are initially set in the Expert Global Settings, What-If tab.
Changing the values here will only affect the current calculation and will not be preserved
for subsequent modeling sessions.
•
“Graph type” dropdown—changes what modeling results will be displayed in the
graphic view. Options include Packets/sec, Response time (sec), and Utilization (%).
While all three views are related, select the view that displays the option you are
interested in.
•
“Simultaneous users” spinbox—sets the number of users to simulate.
•
Processing Time (ms)—the amount of time, in milliseconds, that the server or client
will take to process the request.
Expert Displays
301
Server Characteristics:
•
“Server type” dropdown—options include Database, Ftp, Level, and Web servers.
Each different server selection causes the expert to use a different formula suited for
the selection. A level server offers a formula for a typical server.
•
“Start thread time (ms)” spinbox—taken into account when the “Server type” item is
defined as “Web.” The value is the amount of time it take to process a thread on the
server.
•
“Arrival rate (trans/sec)” spinbox—taken into account when the “Server type” item is
defined as “Database.” The number of transactions per second that are being
requested of the (Database) server.
•
“Maximum adapter cCard throughput (Mbps)” spinbox—taken into account when the
“Server type” item is defined as “Ftp.” This item defines the server’s maximum
throughput. This may be the rated speed of the adapter, but most likely it is some
fraction of the maximum theoretical speed (utilization) of the network. The default of
this item is set in the Expert Global Settings, under the What-If tab.
One way to get a value for this option is to run Observer on the server using
the packet generation mode. Set the generation rate very high and view the
utilization that the server can create using Observer’s utilization modes. The
maximum utilization will reflect the NIC card’s ability to generate traffic.
•
Restore Original Values button—resets all values to the initial settings for the
analyzed pair.
•
Set Reference button—sets the current graph lines to the reference line. For example,
if you change the number of simultaneous users from 1 to 100, a What-If prediction
line will be displayed and the original reference line will be displayed. If the “Set
Reference” button is pressed, the new What-If prediction line will become the
reference line for further What-If modeling.
What-If Analysis Right-Click Menu
The right-click menu offers a number of configuration selections in the What-If Analysis
display.
•
302
Real-Time Expert
Y-Axis—selects the values to be shown on the Y-axis. This is an alternative method
of selecting the “Graph Type.” Options include Packets/sec, Response time (sec), and
Utilization (%). While all three views are related, select the view that displays the
option you are interested in.
•
Show Reference Lines—displays a “reference line” indicating the speed of the
network/WAN from the initial capture data. This will only be displayed if the option
to “Show Reference Lines” is enabled in the Expert Global Settings, under the WhatIf tab. See “Expert Global Settings – What-If Analysis Tab” on page 288.
•
Full Duplex—toggles off and on the interpretation of data as full-duplex.
•
Reset Values—resets all values to the initial settings for the analyzed pair. This has
the same effect as selecting the Restore Original Values button.
•
Change Pair Direction—changes the view of the “direction” of the pair (i.e., swaps
the client and server).
Voice Over IP Expert
With the increasing importance of real-time communications—such as audio and video
conferencing—over networks, the International Telecommunications Union (ITU)
developed the H.323 standard, for real-time communications over networks that, like
Ethernet, Token Ring, and FDDI, do not provide a guaranteed Quality of Service (QoS).
Prominent among the uses of H.323 is Voice over IP, or VoIP. VoIP uses RTP (Real-time
Transport Protocol), a UDP-based protocol for the transmission of real-time data, for use
in such applications as audio and video conferencing. While RTP packets contain the
actual real-time data, the protocol is augmented by RTCP (Real-time Transport Control
Protocol), which is used to send information about the data being transferred: the number
of packets sent and received, the identities of the stations involved in the conversation, and
so forth. By analyzing an RTCP conversation and using it to interpret the RTP data, VoIP
Expert can identify and diagnose problems in a VoIP or other RTP/RTCP session.
The VoIP Expert displays H.323 conversational data in three separate graphs. Each display
is designed to help identify why a connection may be experiencing problems, or at what
level of network load are H.323 conversations exhibiting acceptable quality behavior.
To access the VoIP Expert, right-click on a RTCP (Real-Time Control Protocol)
connection in the “UDP Events” display and select “VoIP Expert” item. The RTCP part of
the conversation is the “control” aspect of the RTP (Real-Time Protocol) conversation.
When selecting the RTCP conversation, you will see that its port number is always one
more than its associated RTP data stream.
The first display shows the conversations lost packets and jitter in the direction of the
arrow. The second display shows the other direction.
•
Lost Packet % (fraction lost)—The fraction of RTP data packets from a particular
source lost since the previous Sender Report (SR) or Receiver Report (RR) packet
was sent.
•
Jitter—An estimate of the statistical variance of the RTP data packet arrival time,
measured in timestamp units and expressed as an unsigned integer.
Expert Displays
303
The RTP timestamp units are based on the sampling rate for a particular payload type. In
the case where there are multiple sources in a single RTCP packet, only the maximum
reported Lost Packet % and Jitter values will be plotted at the given time point.
The last display shows the current conversation’s bandwidth utilization, the total
RTP/RTCP utilization in the capture, and the total network load during the capture.
To view total network utilization, you must have “Include Expert Load Information
packets” checked in Packet Capture setup.
Decoding of VoIP Voice messages—Observer is also able to decode and either save or
play VoIP voice messages.
Select UDP Events from the Expert Data button bar, and right-click on a connection that
contains VoIP voice data.
VoIP data is always contained in RTP conversations, rather than RTCP
conversations. In the example, the protocol used is RTP/G723, a common
format for VoIP voice traffic.
Select either Save Audio... or Play Audio from the popup dialog. Selecting Save Audio
will cause the following dialog to be displayed, permitting the user to enter a name in
which to save the .WAV file.
Selecting Play Audio will cause Windows to play the audio file with whichever program
Windows has been configured to use for .WAV files (usually Windows Media Player).
304
Real-Time Expert
Switched Observer
Introduction to Switched Observer
Observer provides the ability to gather statistics and capture port data for switched
environments. This ability is unique in the world of protocol analysis and makes Observer
the ideal tool for traffic management and troubleshooting in a switched environment.
Observer offers the following modes for switched environments; all modes display data by
port (with the exception of Packet Capture):
•
Discover Network Names
•
Packet Capture
•
Bandwidth Utilization
•
Internet Observer
•
Network Errors by Station
•
Protocol Distribution (including IP subprotocols and IPX subprotocols)
•
Size Distribution Statistics
•
Top Talkers
•
Utilization History
•
Triggers and Alarms
Each mode offers specific switch port information. Documentation on each mode’s
switched display is discussed in this section.
Switched environments have been quite difficult to manage for a number of reasons, but
the main problem has been the fundamental incompatibility between the architecture of
most protocol analyzers and the function of a switch. A switch’s purpose to ensure that
traffic between systems is isolated to the specific switch ports facilitating data interchange.
The purpose of a protocol analyzer is to “listen in” on conversations between systems
without being directly involved in the connection. Here lies the problem: a switch’s job in
life is to ensure that no third party receives data that is not directly involved in the data
exchange—the exact functionality that a protocol analyzer requires.
A switch isolates traffic between sending and receiving stations by instantaneously
creating and removing virtual segments within the switch matrix between ports. For
305
example, if a system on port 3 of a switch has a packet destined for port 7, the switch will
create a virtual segment between ports 3 and 7 for the time required to move the packet.
The switch then removes the virtual segment. In this example, two things are ensured: for
the period of time that port 3 communicates with port 7, the bandwidth between port 3 and
7 is not shared with any other stations; and any other port pair can communicate while port
3 and 7 are communicating.
Switches provide the full maximum theoretical bandwidth for port to port communication,
and add to the potential maximum bandwidth of a network by allowing multiple
simultaneous connections between stations. As long as there are no problems on the
network, this is a valid methodology for moving traffic between station. Not only is it
valid, but replacing a shared hub with a switch will almost invariably increase real
throughput. As your network moves from a one-to-many communication environment to a
many-to-many communications environment, your switch will continue to improve
overall data throughput.
When a problem arises on the network, this methodology erects great barriers to
troubleshooting. The very fact that data streams are “hidden” and paths are simultaneously
created and then removed makes this environment much like trying to judge the traffic on
a busy highway with your eyes closed.
Technology Overview
Observer bridges the gap between switches and protocol analyzers by using three methods
for switch management:
1. Statistical sampling technologies that let you see all ports on your switch. This
functionality is included in the standard Observer product.
2. RMON console functionality for switched with embedded RMON. This requires the
RMON Extension for Observer.
3. SNMP console monitoring functionality for switches with embedded SNMP agents.
This requires the SNMP Extension for Observer.
Additionally, since Observer can manage the ports on your switch, you can also use
Packet Capture for any port (or groups of ports if your switch supports this feature)
without first configuring your switch outside of the Observer environment.
A brief discussion of different switch management options will help develop an
understanding of your ability to monitor your switches with Observer.
In general, switches fall into two categories:
•
Switches with management options.
•
Switches without management options.
Most switches from higher-end (name brand) manufacturers fall into the first category, but
there is a great deal of differentiation between offerings. Some of the lower-cost switches
306
Switched Observer
and switches from lower-end manufacturers do not offer any management options
whatsoever.
If your switch does not offer any management options, Observer (or any
protocol analyzer for that matter) will be of little use in your switched
environment.
Should your switch fall into the first category, there are typically four different types of
management options available:
1. An SNMP agent to monitor different switch traffic and device-specific information.
2. An internal RMON Probe to provide partial or full RMON statistics and capture
functions within the hardware of the switch.
3. The ability to mirror ports (e.g., spanning ports [Cisco’s term], tap port, or
management ports).
4. A Web-based management console providing various users and port-based statistics.
Observer provides analysis and management functionality for the first three options. Your
Web browser provides access for the last.
Switch SNMP Agents
For switches that include an SNMP agent in the switch hardware, Observer’s SNMP
Management Console will allow you to query and view any or all SNMP data that the
switch collects. SNMP offers a number of advantages and disadvantages over standard
protocol analyzers. In general, protocol analysis and SNMP are considered a
complementary solution—which is to say that their feature sets have little overlap.
Additionally, SNMP is not often considered a reliable form of problem management
because it is not an independent view of the situation. A good example would be when
you’re having a problem with your router—do you really want to take your router’s view
of the situation? SNMP used for problem determination provides information from the
source of the problem at the exact time when that information is most likely to be
unreliable. SNMP management is better suited for management, rather than
troubleshooting.
SNMP management can provide device-specific information that a protocol analyzer
cannot “see” from within the device. Examples of this would be internal switch
forwarding time-outs, switch management passwords, serial number, and ID information.
Internal RMON Probes
A number of switches offer some or all of the RMON1/2 statistics to use in managing and
troubleshooting your switch and the associated devices on the ports.
In this environment, should the RMON implementation be sufficient for real work,
Observer’s RMON(2) Extension may be used to query, configure, and report any and all
of the 19 RMON1/2 groups of information.
Introduction to Switched Observer
307
RMON and protocol analysis is not typically complementary in the way SNMP and
protocol analysis can be. Rather, RMON is the “protocol analysis” side of the SNMP
standard, and is an attempt to duplicate the functionality of a protocol analyzer within the
standards-based world of SNMP. A full implementation of RMON2 comes close to what
any high end protocol analyzer provides, if in a more cryptic format. In theory, what you
lose in ease of use, you gain in multi-vendor interoperability. Sadly, most switches to date
have either not implemented RMON at all, or have such a limited subset of RMON that
the RMON functionality is not of much use.
Port Mirroring
For switches that support port mirroring (i.e., spanning, tapping), Observer offers two
types of control and monitoring:
•
Port capture, and
•
Port looping.
Port capture (otherwise known as “static” monitoring) allows you to set a Probe to
capture all the data and traffic from one port and redirect it to the Probe management port.
For switches that support multiple port redirection, Observer allows you to specify
multiple ports to capture. This mode captures all packets that are found on the port and is
usually used for Packet Capture, but can also be used for any of the statistical modes of
Observer.
Looping is the ability to have a Probe “loop” through all ports on the switch and collect
statistics on the switch as a whole. This functionality is unprecedented in the world of
protocol analyzers and provides a view of your switch as a whole—which ports are being
used and to what extent; the total broadcast and cross-port jabber; the total data throughput
of your switch (and thus, its ultimate efficiency) and much more.
Looping is achieved by Observer’s telnet or SNMP interface controlling your switch’s
management interface and directing, in an ordered, timed, and controlled manner, the
redirection of standard port data flow to the Observer Probe port.
Observer’s Probe redirects data from a specific port for a specific amount of time, then
moves to the next port for the same amount of time. This continues until a loop is made of
all ports on the switch (not including the Observer Probe port) and then begins again.
Because Observer knows how long each port was sampled and how long it took to move
to the next port, it can put all of the data together using statistical sampling calculations
and provide a complete view of traffic on your entire switch.
The requirements to use Observer’s port looping and port capture functions are:
308
•
your switch must support some sort of port redirection (often called mirroring,
spanning, or tapping), and
•
the switch must support a telnet or SNMP interface for controlling the mirroring, and
Switched Observer
•
you must either write a script for Observer to control the mirroring or use one of the
scripts included, and
•
you must enable looping or capture in the Probe setup.
More information on scripting is included at the end of this section. Probe configuration
options are documented in the “Using Probes” section of this manual and briefly at the end
of this section.
Web-Based Management
Many switches offer some limited management information via a browser directly
connecting to the switch via a specific port (usually 80). While this information is often
provided in a visually pleasing format, it is often limited and suffers from the same
dependencies as SNMP (the information will be reliable only when the device is
functioning correctly). As with SNMP, Web-based information is often more useful from a
management perspective as opposed to a troubleshooting one.
Configuration
To enable Probe looping, you must tell Observer about your switch and either specify one
of the included scripts for the Probe to use or write a script for your specific switch.
Observer includes a number of scripts for specific switches. These scripts have been tested
at Network Instruments on the switch models listed in the beginning comments of the
script itself. Scripts should be similar within vendor’s switch implementations. Both of
these items are configured in the Switch Dashboard.
Using the Switch Dashboard
The Switch Dashboard is the control console for starting, stopping, and configuring all
looping and capturing of switch data by a Probe or the Observer local Probe. Additionally,
this is where you tell the Probe which switch (by IP address) to connect to.
Notches probe must be set to switched mode to be able to view the Switch
Dashboard. This is done in the Local Observer Configuration dialog.
Standard (Non-Distributed) Observer
From the main menu select Options > Selected Probe or SNMP Device Properties >
Switched Observer (option button).
For Distributed Observer
Select the Probe you want to put into switched mode in the list of Probes. From the main
menu select Options > Selected Probe or SNMP Device Properties > Edit Probe Entry
tab, and then select the SWITCHED OBSERVER option button.
Main Switch Dashboard – Switch Setup Tab
Using the Switch Dashboard
309
Each switch being monitored will require a setup in the Switch Dashboard Dialog. This
dialog can be displayed by selecting Tools > Switch Setup Dashboard.
Button
bar
Edit
boxes
Switch
ports
Important Note: Each change made in this dialog must be followed by
selecting the Stop button and then selecting the
(RE)CONNECT AND
ENABLE SWITCH MANAGEMENT icon.
Switch Dashboard Button Bar
The Switch Dashboard button bar has three buttons:
(Re)Connect and Enable Switch Management—this connects (or reconnects
the Probe to the switch defined in the “Switch IP Address” setting, and begins
whatever script is defined in the Probe settings dialog.
Disconnect and pause switch management—this causes the Probe to
disconnect and stops the processing of the current Probe’s script.
Clear switch log—clears the “Switch Telnet Communications Log.”
Window header display:
•
Number of cycles—shows the number of “loops” or cycles that the Probe has made
through your switch ports. Statistically, the more cycles, the closer to 100% accuracy
the displays will provide. A good rule of thumb would be that the information is + or
– 20% after the first 29 cycles, + or – 10% after the next 29 cycles, + or – 5% after the
next 29 cycles, etc.
Edit boxes:
310
•
“Script” dropdown—allows you to select the script file the current Probe will use.
•
Edit button—displays the Editing Telnet Script dialog.
Switched Observer
•
“Switch script style” dropdown—allows you to select Telnet or SNMP. See “Switch
Scripts” on page 312.
•
“Looping mode” dropdown—allows you to select Looping or Static.
•
Looping is where the Probe samples each port checked in the “Switch Ports”
display.
•
Static is where the Probe collects all data from the port or ports selected (if
supported by your switch).
•
“Switch address” textbox—allows you to input the IP address or DNS name of the
switch to be managed by this Probe.
•
“Number of switch ports” dropdown—allows you to define the number of total ports
your switch contains. This number is used by Observer for all timing and
configuration settings.
•
“Monitoring port” dropdown—allows you to define the port where Observer or the
Observer Probe is connected. Observer excludes this port from all calculations.
SNMP Management Parameters:
•
“Timeout (ms)” textbox—allows you to set the timeout (in milliseconds); only
enabled if you selected SNMP in the “Switch script style” dropdown.
•
“Retries” textbox—allows you to set the number of retries; only enabled if you
selected SNMP in the “Switch script style” dropdown.
•
“Write community name” textbox—allows you to enter the community name; only
enabled if you selected SNMP in the “Switch script style” dropdown.
•
Check Selected button—checks the selected ports for monitoring or looping. You can
select ports using the standard Windows selection controls.
•
Uncheck Selected button—unchecks the selected ports for monitoring or looping.
You can select ports using the standard Windows selection controls.
•
“Switch Ports” checkboxes—allows you to select which switch ports will be included
in the looping cycle. The number of ports displayed reflects the entry in the “Number
or switch ports” edit box.
Using the Switch Dashboard
311
Switch Dashboard – Switch Management Log Tab
•
“Log switch management communication” checkbox—when selected, all
communication with the switch will be displayed in the “Switch Management Log”
window. This is primarily used for debugging.
•
“Scroll to the last line” checkbox—allows you to set the focus of the switch
communication log to the last line of the log.
•
“Maximum number of log lines” textbox—allows you to set the length of the switch
communication log.
•
“Save selected log lines to a file” button—allows you to save the selected log lines to
a file.
•
“Switch Management Log” display—allows you to display the switch management
log.
Switch Scripts
Observer supports two types of switch scripts: Telnet and SNMP.
•
Telnet scripts control the Telnet interface of your switch to loop through your switch’s
ports.
•
SNMP scripts send SNMP commands to your switch to loop through your switch’s
ports and are the preferred scripts for using switched Observer.
Telnet Scripts
Observer Telnet switch scripts are text files with the extension “.scr”. An example switch
script file name might be “HP Switch Script.scr”. Scripts have sections which define
specific parts of the switch initialization and control sequences. Scripts send keystrokes to
312
Switched Observer
the switch in a timed fashion to manipulate the management properties of the switch.
Observer emulates a VT100/ANSI emulator when sending sequences to your switch.
Note: SNMP scripts are preferred.
Specifically, in the case of Observer, the Telnet script can either loop the Probe’s listening
capabilities from port to port, or focus the Probe’s capture ability to a specific port (or
group of ports if your switch supports this feature).
•
All lines that begin with a “#” (pound sign or hash mark) are ignored and considered
comments.
•
Each section begins with a header enclosed in square brackets that describes the
section’s general functions.
•
Script tokens tell Observer to do specific actions and to send specific keystrokes to
your switch’s Telnet interface.
Sections Headers
•
[Initialize]—the beginning of a script and area where initial login and navigation to
mirroring sections of the management interface.
•
[PortXon]—enables port collection. For each port, replace the “X” with a number,
“[Port1on]” for example. You should have as many PortXon sections as you have
ports on your switch.
The maximum number of ports is 64.
•
[PortXoff]—disables port collection. For each port replace the “X” with a number,
“[Port1off]” for example. If your switch needs the specific port disabled prior to
switching to the next port, use this as the header for these sequences (see Cisco switch
script example later in this section).
Telnet Script Commands and Tokens
Most script activities will begin using Observer’s built-in script editor. The script editor is
accessed by selecting Tools > Edit Switch Script > Edit Telnet Switch Script File from
Observer’s main menu. Selecting this item will display the script editor. Note that it is not
required to use the script editor to edit and maintain scripts (they are text files), but using
Switch Scripts
313
the editor makes the task of entering tokens easier and will contribute to the overall
accuracy of the script.
Each line that is to be sent to the switch must begin with a token and end with a line feed
or {Enter}. Additional commands are available to manipulate the switch.
You can enter three types of information into an Observer Telnet switch script:
•
Telnet Script Commands (called Tokens)—are special commands pre-programmed
into the script editor. Tokens are entered by clicking the specific token button on the
right side of the script editor dialog. Note that tokens can be entered by hand—the
only benefit of the script editor is to save on errors in typing the specific token text.
•
Script Keys—simulate specific keys that would be sent using a terminal or terminal
emulation program. Note that the sequence sent is that which would be sent from a
VT100/ANSI terminal (e.g., terminal.exe that is included in Windows 2000/XP).
•
Simple Keystrokes—letters, numbers, and standard characters. In general, any key
which puts something you can read on the screen. These keystrokes can simply be
typed into your script as you would normally type them into a word processor.
The following sections explain how to enter the different types of information into the
script editor.
Entering Tokens into a Telnet Script
Tokens are entered by placing the cursor in the correct position and then clicking the
specific token button on the right side of the script editor dialog.
Entering Keystrokes into a Script
Keystrokes are entered by placing the cursor in the correct position and then entering the
keystrokes as you would when interfacing the Telnet management application on your
switch.
314
Switched Observer
Script Tokens
The available script tokens are:
•
SEND-> token—follow this token by any sequence of keystrokes to be sent.
•
WAITFOR-> token—this token should be followed by the string the script should
wait for. The script will wait the number of seconds specified in the SETWAIT-> line.
If the expected string does not arrive before the timeout is reached, the script will
terminate with an error message.
•
SETWAIT-> token—this token should be followed by the number of seconds the
script should wait for any input to be received from the remote host (when using the
“WAITFOR->” token). After the wait is complete, the script will advance to the next
instruction. If no time is entered, this defaults to 10 seconds.
•
PORTS_OFF-> token—this token sends all commands to turn off all ports from every
[PortXoff] section. This can be useful in beginning or ending a looping section.
•
PORTS_ON-> token—this token sends all commands to turn on all ports from every
[PortXon] section. This can be useful in beginning or ending a looping section.
•
PAUSE-> (ms) token—this token pauses the script execution for the number of
milliseconds listed after the “->”. For example, to pause the script for five seconds,
you would enter “PAUSE->5000” (no quotes).
•
WRITE_LOG-> token—writes the text after the token into the Switch Management
Log. This is used for debugging purposes.
Script Keys—these buttons are used to send specific sequences to your management
application that would be available using a terminal or terminal emulator.
•
{Enter} button—sends an enter sequence. This should be used each time you would
click the “Enter” key during your Telnet session.
•
{Esc} button—sends the escape (Esc) sequence.
•
{Left} button—sends the left arrow sequence.
•
{Right} button—sends the right arrow sequence.
•
{Up} button—sends the up arrow sequence.
•
{Down} button—sends the down arrow sequence.
•
{Tab} button—sends a tab space.
•
{Space} button—sends a space.
•
{MonitorPort} button—this token is replaced by the value that is entered in the
“Monitoring port” edit box in the Script dashboard. It is possible to use math in
conjunction with this token, if needed. Addition and subtraction are supported. The
following result would be present in the script with a monitor port set to 4: {Monitor
Port+2} would be replaced by “6”; {Monitor Port-1} would be replaced by “3.”
Switch Scripts
315
•
{RepeatCharacter} button—sends the character immediately after the “>” for the
number of times immediately after the character. For example,
{RepeatCharacter>?15} would send the ? character 15 times.
Note: Any script key or token can be entered by hand using the keyboard.
The buttons are provided to help script accuracy.
Script Editor buttons:
• Save button—saves the current script, using the name and location that it originally
had when it was opened by the script editor.
•
Save As button—saves the current script prompting you for a name and location.
•
Cancel button—cancels your current editing session.
•
Help button—displays the help item for the scripting dialog.
Telnet Script Example
The following is an example script for Cisco switches. Each contains comments regarding
its application.
Note: Initial connection to the switch is done in the Switch Dashboard. See
“Using the Switch Dashboard” on page 309.
# begin initialization header section
[Initialize]
# wait for the switch to respond, and wait for the
# password login screen
WAITFOR->Password:
# send the 1st password
SEND->my1stpassword{Enter}
# wait for the switch to respond, and wait for the
# CiscoSwitch> prompt
WAITFOR->CiscoSwitch>
# send the “enable” command to enter configuration
# mode
SEND->enable{Enter}
# wait for the switch to respond, and wait for the
# next password prompt
WAITFOR->Password:
316
Switched Observer
# send the next password
SEND->mynextpassword{Enter}
# wait for the switch to respond, and wait for the
# CiscoSwitch# prompt
WAITFOR->CiscoSwitch#
# send the “config t” command to enter
# configuration mode
SEND->config t{Enter}
# wait for the switch to respond, and wait for the
# CiscoSwitch (config) prompt
WAITFOR->CiscoSwitch(config)#
# send the config “int FA 0/2” command
# sets the configuration interface to port 2
# (where the Probe is)
SEND->int FA 0/2{Enter}
# wait for the switch to respond, and wait for the
# CiscoSwitch (config-if)# prompt
WAITFOR->CiscoSwitch(config-if)#
# Turns all port monitoring off (in case any were
# left on
PORTS_OFF->
# section for turning on port 1 (to send data to
# port 2 as defined above)
[Port1on]
# send port monitor command to turn on port 1
SEND->port monitor FA0/1{Enter}
# wait for the switch to respond, and wait for the
# CiscoSwitch (config-if)# prompt
WAITFOR->CiscoSwitch(config-if)#
# begin section to turn off port 1
[Port1off]
Switch Scripts
317
# turn port 1 monitoring off
SEND->no port monitor FA0/1
# wait for the switch to respond, and wait for the
# CiscoSwitch (config-if)# prompt to get ready for
# next sequence of commands
WAITFOR->CiscoSwitch(config-if)#
# The next sections are repeats of the one for
# port 1, with the actual port number changed.
# Note that Observer will automatically skip the port
# that the Probe is connected to (defined in the
# “Monitoring Port” section of the Switch Setup
# Dashboard)
# You should have a port section for each port on your
# switch—in other words, if you have 8 ports
# on your switch, you should have 8 sections with
# “[PortXon}” and “[PortXoff]” headers. If you
# have a 64-port switch, you should have 64
# sections with “[PortXon}” and “[PortXoff]”
# headers.
[Port2on]
SEND->port monitor FA0/2
WAITFOR->CiscoSwitch(config-if)#
[Port2off]
SEND->no port monitor FA0/2
WAITFOR->CiscoSwitch(config-if)#
[Port3on]
SEND->port monitor FA0/3
WAITFOR->CiscoSwitch(config-if)#
[Port3off]
SEND->no port monitor FA0/3
WAITFOR->CiscoSwitch(config-if)#
etc...
318
Switched Observer
SNMP Scripts
Observer’s SNMP switch scripts are text files with the extension “.snm”. An example
SNMP switch script file name might be “3COM Switch SNMP Script.snm”. Scripts have
sections, which define specific parts of the switch initialization and control sequences.
SNMP scripts send specific SNMP “commands” directly to the switch in a timed fashion
to manipulate the management properties of the switch.
Note: SNMP scripts are preferred.
Specifically, in the case of Observer, the SNMP script can either loop the Probe’s listening
capabilities from port to port, or focus the Probe’s capture ability to a specific port (or
group of ports if your switch supports this feature).
•
All lines that begin with a “#” (pound sign or hash mark) are ignored and considered
comments.
•
Each section begins with a header enclosed in square brackets that describes the
section’s general functions.
•
Script tokens tell Observer to do specific actions and to send specific SNMP
commands to your switch’s SNMP interface.
Sections Headers
[Initialize]—the beginning of a script and area where any switch initialization takes place.
This may be to reset the port-monitoring feature or to enable switch management.
[PortXon]—enables port collection. For each port, replace the “X” with a number—
“[Port1on]” for example. You should have as many PortXon sections as you have ports on
your switch.
[PortXoff]—disables port collection. For each port, replace the “X” with a number—
“[Port1off]” for example. If your switch needs the specific port disabled prior to switching
to the next port, use this as the header for these sequences (see Cisco switch script
example earlier in this section).
SNMP Script Commands and Tokens
Most script activities will begin using Observer’s built in script editor. The script editor is
accessed by selecting Tools > Edit Switch Scripts > Edit SNMP Switch Script File from
Observer’s main menu. Selecting this item will display the script editor. Note that it is not
required to use the script editor to edit and maintain scripts (they are text files), but using
Switch Scripts
319
the editor makes the task of entering tokens easier and will contribute to the overall
accuracy of the script.
Each SNMP command line that is to be sent to the switch must begin with a token.
Additional commands are available to manipulate the switch.
You can enter three types of information into an Observer SNMP switch script: SNMP
Script Tokens, Object Types, and Script Keys.
•
SNMP Script Commands (called Tokens)—special commands pre-programmed into
the script editor. Tokens are entered by clicking the specific token button on the right
side of the script editor dialog. Note that tokens can be entered by hand (the only
benefit of the script editor is to save on errors in typing the specific token text).
•
Object Types—define the type of the value you will be using in the SNMP command.
Object types can be either Integer or OctetString.
•
Script Keys—are variables inserted into the script from the script dashboard.
Entering Tokens into a SNMP Script
Tokens are entered by placing the cursor in the correct position and then clicking the
specific token button on the right side of the script editor dialog.
SNMP Script Tokens
The available script tokens are:
•
SET-> token—sets the specific OID to the value defined at the end of the command.
The format for the SET command is:
SET->OID=Object Type=Value
Where:
320
Switched Observer
“SET->” is the token
“OID” is the specific SNMP OID (Object Identifier). An example OID would be
“1.3.6.1.4.1.343.6.10.1.7.0”.
“Object Type” specifies if the OID value is an Integer or OctetString. An example Object
Type would be “{Integer}”
“Value” is the value that the OID should be set to. An example value would be “2”.
A sample SET command would be:
SET->1.3.6.1.4.1.343.6.10.1.7.0={Integer}=2
•
PAUSE-> (ms) token—this token pauses the script execution for the number of
milliseconds listed after the “->”. For example, to pause the script for five seconds,
you would enter “PAUSE->5000” (no quotes).
•
WRITE_LOG-> token—writes the text after the token into the Switch Management
Log. This is used for debugging purposes.
SNMP Script Keys
These buttons are used to send specific values to the SNMP script.
The SNMP key is:
•
{Monitor Port} button—this token is replaced by the value that is entered in the
“Monitoring port” edit box in the Script dashboard. It is possible to use math in
conjunction with this token if needed—addition and subtraction are supported. The
following result would be present in the script with a monitor port set to 4:
{Monitor Port+2} would be replaced by “6”
(Monitor Port-1} would be replaced by “3”
Any script key or token can be entered by hand using the keyboard. The
buttons are provided to help script accuracy.
SNMP Script Editor Buttons
• Save button—saves the current script, using the name and location that it originally
had when it was opened by the script editor.
•
Save As button—saves the current script, prompting you for a name and location.
•
Cancel button—cancels your current editing session.
•
Help button—displays the help item for the scripting dialog.
SNMP Script Example
The following is an example script for a 3COM switch. Each contains comments
regarding its application.
Switch Scripts
321
Note: Initial connection to the switch is done in the Switch Dashboard. See
“Using the Switch Dashboard” on page 309.
# Note 1: The script that you create MUST correspond to your particular
# switch SNMP command structure.
#
# Note 2: It is sufficient to fill as many [PortXon] and [PortXoff] sections
# as the number of ports on your switch. For example if your switch has 16
# ports you can fill only 16 [on-off] sections.
#
# begin initialization header section
[Initialize]
#
# write a note into the log file to let you know it got this far
WRITE_LOG->SNMP Script for Intel 510T Switches
####Disable Port Monitoring ports
SET->1.3.6.1.4.1.343.6.10.1.7.0={Integer}=2
####Set Monitoring (Destination) Port
SET->1.3.6.1.4.1.343.6.10.2.4.1.21.1.1.{MonitorPort}={Integer}=2
PAUSE->20
WRITE_LOG->INITIALIZATION COMPLETE
[Port1on]
####Set Source Port 1
SET->1.3.6.1.4.1.343.6.10.2.4.1.21.1.1.1={Integer}=1
PAUSE->20
####Enable Monitoring
SET->1.3.6.1.4.1.343.6.10.1.7.0={Integer}=1
PAUSE->20
[Port1off]
####Disable Monitoring
SET->1.3.6.1.4.1.343.6.10.1.7.0={Integer}=2
PAUSE->20
322
Switched Observer
[Port2on]
SET->1.3.6.1.4.1.343.6.10.2.4.1.21.1.1.2={Integer}=1
PAUSE->20
SET->1.3.6.1.4.1.343.6.10.1.7.0={Integer}=1
PAUSE->20
[Port2off]
SET->1.3.6.1.4.1.343.6.10.1.7.0={Integer}=2
PAUSE->20
[Port3on]
SET->1.3.6.1.4.1.343.6.10.2.4.1.21.1.1.3={Integer}=1
PAUSE->20
SET->1.3.6.1.4.1.343.6.10.1.7.0={Integer}=1
PAUSE->20
[Port3off]
SET->1.3.6.1.4.1.343.6.10.1.7.0={Integer}=2
PAUSE->20
[Port4on]
SET->1.3.6.1.4.1.343.6.10.2.4.1.21.1.1.4={Integer}=1
PAUSE->20
SET->1.3.6.1.4.1.343.6.10.1.7.0={Integer}=1
PAUSE->20
[Port4off]
SET->1.3.6.1.4.1.343.6.10.1.7.0={Integer}=2
PAUSE->20
etc...
Switch Scripts
323
Switched Modes
Discover Network Names – Switched
Discover Network Names works in the same way for both switched and non-switched
mode. In switched mode, since all broadcasts are propagated over all ports on the switch,
eventually Discover Network Names will find all relevant addresses. There is no
additional setup for using Discover Network Names in switched mode.
Packet Capture – Switched
When working in switched mode, Packet Capture works in a similar manner as in standard
mode with the following exceptions:
•
In switched mode, Observer must “prepare” the switch for packet capture. This
preparation will begin as soon as you click the Start icon. If Observer is using looping
to monitor statistical information on your switch, preparation includes the
discontinuing of the looping process and mirroring of one or more ports (depending
on what your switch supports) to the Observer port. This may take a few seconds;
therefore, your capture will not start immediately.
•
Prior to the capture starting, all other modes that are currently running will be ended.
These running modes are dependent on the looping function and would no longer
report accurate data.
•
When the capture is ended, the switch is reset back into looping mode.
The preparation dialog allows you to define which port(s) you want to capture. While in
Packet Capture mode, Observer is no longer “sampling” data from the ports. Observer,
with the help of your switch, will capture all packets on the designated port(s).
When the START CAPTURE button is clicked, the Prepare Switch dialog is displayed. This
dialog will not be displayed if you have selected “Static” from the Looping Mode
dropdown on the Switch Dashboard Setup dialog. See “Main Switch Dashboard – Switch
Setup Tab” on page 309.
In this dialog you can configure which port or ports you would like to capture data from.
324
Switched Observer
1. Click on a checkbox next to a port. You may also select one or more ports by Controlclicking and then clicking CHECK SELECTED or UNCHECK SELECTED, as desired.
Some switches support multiple mirroring of ports; others only support one port at a time.
If your switch supports multiple mirroring of ports, Observer will be able to initiate a
capture on all ports selected. If your switch does not, Observer will only be able to capture
data on one selected port.
2. Once port selection is complete, click the PREPARE SWITCH button. Observer will
prepare the switch to capture data on the port or ports that you have selected. The
Switch Ready dialog will be displayed.
3. To begin capturing packets on the port or ports, click OK.
Bandwidth Utilization – Switched
Bandwidth Utilization in a switched environment is a metric that is completely different
than what you may be used to in a non-switched environment. The bandwidth of any
switch depends on the mixture of port speeds, how many ports are in use, and how
efficient the many-to-many relationship is constructed.
For example, the maximum theoretical bandwidth of a switch with eight 10/megabits ports
would be 40/megabits. The maximum theoretical bandwidth of a switch with eight
10/megabits ports and two 100/megabits would depend on which ports are talking to
which other ports. In the best of all cases (that is the two 100/megabits ports are talking to
each other) the maximum theoretical bandwidth (or throughput) of the switch would be
140/megabits. But if for some percentage of the time the systems on the 100/Mbits ports
are speaking to 10/megabits devices, the maximum throughput would change depending
on what is happening at any moment of time.
The idea of bandwidth utilization in a switched environment becomes one of throughput
and how close to a maximum theoretical throughput the switch can achieve. This
throughput is a good judge of how efficiently your switch is utilizing its resources, but the
actual number itself ranges quite a bit depending on which ports are talking to which other
ports.
For this reason, Observer shows switched Bandwidth Utilization as a number of graphs
(dials or port listing). In graph mode the top graph shows the total switch load in
bits/second. All other displays show each port’s speed in bits/sec. The graph and dials
Switched Modes
325
automatically scale from modem speeds of 1000 bits/second to gigabit speeds of 1000
megabits/sec.
Y-axis values automatically to the current (within the viewable time frame) port or
aggregate switch load. Typical network speeds are represented by the following values:
Modem/ISDN/TI/T3
10K—45M
10megabit Ethernet Range
2M—8M
100megabit Ethernet Range
20M—80M
1000megabit (GigaBit) Range
200M—800M
4MB Token Ring
1M—3M
16MB Token Ring
4M—14M
This metric is a good value to determine how efficiently you are utilizing your switch.
See “Bandwidth Utilization” on page 69.
Internet Observer – Switched
In switched mode, Internet Observer functions identically to the non-switched Internet
Observer.
See “Internet Observer Mode (Internet Patrol, Pairs Matrix, IP Subprotocols)” on page 76.
Network Errors by Station – Switched
The Switched Network Errors by Station mode will identify and display Ethernet error
packets broken down by switch port source of the error and the type of error packet. To
identify the specific station on a port that has multiple addresses, a separate Observer or
Probe would need to be installed on that downstream segment.
The ability to track Ethernet errors by station requires the use of both a Network
Instruments ErrorTrak™ driver, a certified network adapter card, and a switch that will
forward error packets when the port is being monitored.
Once the switched Errors by Station is running, the display is identical to the standard
(non-switched) Errors by Station display except all data is by port.
See “Network Errors by Station Mode” on page 93.
Size Distribution Statistics – Switched
Switched Size Distribution Statistics displays all standard (non-switched) size distribution
statistics by port. Each port may display a particular MAC address (and IP address) if the
326
Switched Observer
port is attached to only one system, or may display “multiple addresses” if the port is
attached to multiple system via a downstream hub.
Top Talkers – Switched
To view Top Talkers statistics in switched mode, you must first set your Probe (local or
remote) to switched mode and then complete the switched setup for your particular switch.
See “Configuration” on page 309.
Switched Top Talkers mode displays all standard (non-switched) Top Talkers statistics by
port. Each port may display a particular MAC address (and IP address) if the port is
attached to only one system, or may display “multiple addresses” if the port is attached to
multiple systems via a downstream hub.
The MAC display of Top Talkers shows all other statistics identically as in the standard
(non-switched) MAC Top Talkers display, only they are by port as opposed to by address.
The IP display of Top Talkers shows all statistics identically as in the standard (nonswitched) IP Top Talkers display, only they are the IP addresses that are found within your
switch.
See “Packet Size Distribution Statistics Mode” on page 122.
Utilization History Mode – Switched
In switched mode, Utilization History displays the same information that the non-switched
mode displays, only the display is both by port. The ports displayed will reflect the ports
that have been checked in the Switch Dashboard. The top display is the aggregate switch
throughput.
As with switched Bandwidth Utilization, the top graph (the first dial in dial mode or
“switch” line in detail mode) shows the aggregate Utilization History information for the
entire switch (all ports that are checked in the Switch Dashboard). All other graphs (dials
or lines) are for the specific ports of the switch being monitored.
See “Utilization History Mode” on page 132.
Triggers and Alarms – Switched
In switched mode, Triggers and Alarms function identically to the non-switched Triggers
and Alarms, with the exception that only the triggers will function on switch port data.
See “Triggers and Alarms Mode” on page 148.
Switched Modes
327
328
Switched Observer
Observer Suite: SNMP Management
Console
SNMP Management Console is a part of Network Instruments’ Observer Suite, bringing
the cross-platform SNMP (Simple Network Management Protocol) standard to the
Observer console.
SNMP is not “simple” as its name implies. On the contrary, it is a difficult
concept to understand. A brief overview and description of SNMP follows;
however, it is by no means a comprehensive discussion. This overview is
intended to give you a very simple introduction to SNMP. You don’t have to
be a software engineer to understand SNMP, but you will find that using
Observers’ SNMP Management Console is easier to use with a basic
understanding of how SNMP works.
SNMP Overview
Simple Network Management Protocol (SNMP) is an application-layer protocol designed
to facilitate the exchange of management information between network devices. The
SNMP system consists of three parts: SNMP Manager, SNMP Agent, and MIB.
•
SNMP Manager—uses information in the MIB to perform operations on each object.
•
SNMP Agent—gathers data from the MIB, which is the repository for information
about device parameters and network data. The agent also can send traps, or
notifications of certain events, to the manager.
•
Management Information Base (MIB)—stores the information about each managed
object.
From the perspective of a network manager, network management takes place between
two major types of systems: those in control, called managing systems, and those observed
and controlled, called managed systems. The most common managing system is called a
Network Management System (NMS). Managed systems can include hosts, servers, or
network components such as routers or intelligent repeaters.
The exchange of information between managed network devices and a robust NMS is
essential for reliable performance of a managed network. Because some devices have a
limited ability to run management software, most of the computer processing burden is
assumed by the NMS. The NMS runs the network management applications that present
management information to network managers and other users.
329
Instead of defining a large set of commands, SNMP places all operations in a GetRequest,
GetNextRequest, GetBulkRequest, and SetRequest format. For example, an SNMP
manager can get a value from an SNMP agent or store a value in that SNMP agent. The
SNMP manager can be part of a NMS, and the SNMP agent can reside on a networking
device such as a router. If SNMP is configured on a router, the SNMP agent can respond to
MIB-related queries being sent by the NMS.
GetRequest, GetNextRequest,
GetBulk, SetRequest
Network Management
Station — SNMP Manager
Network Device — MIB
SNMP Agent
GetResponse, Trap
•
GetRequest—supplies a list of objects and values they are to be set to (SetRequest).
The agent returns GetResponse.
•
GetNextRequest—retrieves the next instance of information for a particular variable
or device.
•
GetResponse—informs the management station of the results of the GetRequest or
SetRequest by returning an error indication and a list of variable/value bindings.
•
GetBulkRequest—similar to GetNextRequest, but fills the GetResponse with up to a
maximum repetition number of GetNext interactions.
•
SetRequest—alters the value of objects which can be written to the MIB.
•
Trap—an unsolicited message sent by an SNMP agent to an SNMP manager
indicating that some event has occurred.
With this operation, an SNMP manager does not need to know the exact variable name. A
sequential search is performed to find the needed variable from within the MIB.
In a managed device, specialized low-impact software modules, called agents, access
information about the device and make it available to the NMS. Managed devices
maintain values for a number of variables and report those, as required, to the NMS. For
example, an agent might report such data as the number of bytes and packets in and out of
the device, or the number of broadcast messages sent and received. In the Internet
Network Management Framework, each of these variables is referred to as a managed
object. A managed object is anything that can be managed, anything that an agent can
access and report back to the NMS. All managed objects are contained in the Management
Information Base (MIB), a database of the managed objects.
An NMS can control a managed device by sending a message to an agent of that managed
device requiring the device to change the value of one or more of its variables. The
managed devices can respond to commands such as set or get commands. The set
commands are used by the NMS to control the device. The get commands are used by the
NMS to monitor the device.
330
Observer Suite: SNMP Management
MIBs
A Management Information Base (MIB) is a formal description of a set of network objects
that can be managed using the Simple Network Management Protocol (SNMP).
The unit of data collected is called the SNMP object. For each device, a set of SNMP
objects and rules for addressing the objects are defined in a MIB file. MIBs are key to the
logical, orderly functioning of SNMP. MIB objects (OIDs) are represented by a tree
hierarchy; each object has a unique address based on its position in the tree. The address
count begins from the “root” of the object tree; one number is added to the address with
each new branch. The root of the tree is unnamed and splits into three main branches:
Consultative Committee for International Telegraph and Telephone (CCITT),
International Organization for Standardization (ISO), and joint ISO/CCITT.
ISO
(1)
CCITT
ISO/
CCITT
ORG
(3)
DOD
(6)
Typical beginning of an
object identifier
1.3.6.1
Internet
(1)
Directory
(1)
Management
(2)
Private
(4)
Experimental
(3)
Reserved for
Directory use
First and second
MIB versions
(1)
Used to identify
objects defined by
private vendors
Used to identify
objects used in
Internet experiments
Used to identify
objects which are
defined in IABapproved documents
Enterprise
(1)
Individual vendor
products
These branches and those that fall below each category have short text strings and integers
to identify them. Text strings describe object names, while integers allow computer
software to create compact, encoded representations of the names.
The object identifier in the Internet MIB hierarchy is the sequence of numeric labels on
the nodes along a path from the root to the object. The Internet standard MIB is
represented by the object identifier 1.3.6.1.2.1. It also can be expressed as
iso.org.dod.internet.mgmt.mib. The format of the MIB is defined as part of the SNMP.
SNMP Overview
331
(All other MIBs are extensions of this basic management information base.) MIB-I refers
to the initial MIB definition; MIB-II refers to the current definition. SNMPv2 includes
MIB-II and adds some new objects.
Each MIB has a name, a syntax, and an encoding.
•
Name—identifies the object
Example:
SYSDESCR = the object descriptor
1.3.6.1.2.1.1.1 = the object identifier
•
Syntax—defines the object’s structure (e.g., octet string, integer).
•
Encoding—an object’s representation using the object’s syntax (e.g., “the local IP
address for this TCP connection,” “Read Only,” or “Mandatory”).
Example:
Object: TCPConnLocalAddress
Syntax: Integer
Definition: The local IP address for this TCP connection
Access: Read only
Status: Mandatory
When requested, the SNMP agent transfers an SNMP message across the network in a
standard format, as specified by the set of SNMP Request for Comments (RFCs). Related
MIB objects often are combined into MIB groups. MIB groups make it easier to manage a
large number of MIB objects. Some MIBs, such as the standard MIB-2, contain many
MIB groups. Proprietary MIBs usually have only one, or a few, groups.
OIDs
An Object Identifier (OID) is a unique identifier assigned to a specific object. The
identifier consists of a sequence of numbers that identify the source of the object, as well
as the object itself. This sequence of numbers is variable in length, so in addition to the
sequence of numbers, there is a length field. OIDs are organized in a tree structure; the
sequence of numbers identifies the various branches of the subtree that a given object
comes from.
The root of the tree is the ISO (International Standards Organization) trunk. Its value is
one (1). Each branch below the root further identifies the source of the given object. All
SNMP objects are members of the subtree identified by iso.org.dod.internet or 1.3.6.1.
Each additional component further defines the exact location of an object. The numbers
for each subtree are assigned by the IETF to ensure that all branches are unique. While it is
good to know that OID identification structure exists, in general, OID management is
332
Observer Suite: SNMP Management
done by SNMP Management Console and no specific OID knowledge is required to use
SNMP Management Console.
SNMP Management Station
The SNMP Management Station is a program designed to poll SNMP agents, collect
information, and display the collected information in an easy-to-view format. Because
each SNMP agent on a network can support a unique MIB, the SNMP management station
must load MIB information for all the agents it intends to access. Without this
information, the management station cannot make sense of proprietary MIBs and cannot
obtain information from their agents.
The management station polling process typically includes the following steps:
•
The management station composes an SNMP request that includes one or more MIB
objects.
•
The management station sends the request packet to an agent, located on a network
device.
•
The agent receives the request, checks the values of the objects requested, composes a
reply packet, and sends it back to the management station.
•
In the case of SNMP Management Console, the data is displayed in chart, form, list,
or table format.
Through the management station, SNMP agents can provide information to a network
administrator without the administrator physically attending to the device.
Almost any network device can be equipped with an SNMP agent. However, because the
addition of an SNMP agent typically will increase the cost of the device, many devices are
available without the SNMP agent installed. Typical examples of SNMP-aware devices
are: network bridges, routers, network cards, Ethernet and Token Ring hubs/switches,
network printers, UNIX hosts, NetWare servers, and Windows 2000/XP servers and
stations.
Introduction to SNMP Management Console
During the last decade, reliance on local and wide area networks has increased steadily. As
networks grow larger in size and more complex, so does the importance of effective
network management.
While many methods exist for monitoring network activity, one of the most important
emerging standards is SNMP. Unlike protocols designed to monitor network traffic,
SNMP is a standard for monitoring specific network devices, providing an efficient and
highly flexible way to collect and organize the information needed to optimize network
performance.
Introduction to SNMP Management Console
333
Network Instruments designed SNMP Management Console as a highly functional, easyto-use feature of FrameMaker Suite to help you take advantage of SNMP's capabilities.
SNMP Management Console includes an SNMP management plug-in for Observer, a
MIB compiler, and a graphical forms editor/viewer—a complete RFC-compliant
implementation of SNMP for the Microsoft Windows 2000/XP platforms.
Whether you're a network administrator, network user, programmer, network application
developer, or network product tester, SNMP Management Console delivers features that
will help you get the most from SNMP and your network.
SNMP Management Console offers:
•
Greater network control—in addition to helping you collect network management
information, SNMP Management Console can set or configure writable objects. You
may, for example, switch modes on a network printer or reconfigure a 100BaseT
Ethernet hub or switch.
•
Extended Management Information Base (MIB) support—since SNMP Management
Console supports any MIB-2 (RFC1213) agents installed on most Windows 2000/XP,
Windows NT, UNIX, Linux, and NetWare systems and devices, SNMP Management
Console lets you install MIB definitions for SNMP agents from different vendors. If
your network includes SNMP devices from different vendors, separate MIB
definitions can be installed and used simultaneously by SNMP Management Console.
•
Ease of use—SNMP Management Console’s modular design makes it both powerful
and easy to use. Different SNMP functions are divided among the main windows, and
multiple agent data can be viewed simultaneously.
Who Should Use SNMP Management Console?
Any network administrator, systems consultant, or network programmer will find SNMP
Management Console useful. SNMP Management Console and its related utilities are
designed to meet the needs of network professionals, ranging from beginner to expert.
SNMP Management Console is most useful for network administrators who want to
monitor their LANs and manage SNMP-aware devices from a single location. SNMP
Management Console helps administrators make decisions based on hard facts instead of
guesswork.
In many cases, SNMP provides more information or different information that is not
accessible using other network analysis tools, helping the administrator pinpoint problems
and determine solutions that might be overlooked otherwise.
SNMP Management Console Main Components
The SNMP Management Console software package includes the following components:
334
Observer Suite: SNMP Management
•
The MIB Compiler compiles SNMP MIBs into the binary format used by SNMP
Management Console and offers a drag-and-drop interface for creating custom
requests from MIB objects.
•
Global Event Log displays general SNMP events and traps.
•
Agent windows display all lists, charts, forms, tables and the local event log.
•
SNMP agents and SNMP agent request lists show all agents, and when an agent is
selected, the set of requests that have been configured for the agent.
SNMP Management Console is integrated into the Observer interface. All SNMP
functionality is available concurrent with Observer’s functionality.
Getting Started
SNMP Management Console and its utilities are powerful, yet can be learned with only a
few hours’ study. The programs are designed primarily for network administrators, but
this manual includes information that may be of interest to anyone who wants to learn
more about their network from an SNMP perspective.
Preparing to Use SNMP Management Console
Install Additional MIBs
SNMP Management Console includes a number of preinstalled MIBs. These MIBs are for
various common devices (e.g., servers) and include the standard MIB RFC1213.
The standard MIB (RFC1213) should work on any SNMP-enabled device.
You may find that the standard MIB or the provided MIBs provide enough
information so that no additional proprietary MIB installation is required.
Should you want to install a vendor-specific MIB, select File > Compile MIB File option
and specify your MIB file.
This option is only available from the File menu when the MIB Editor is
visible. To make the MIB Editor visible, select View > MIB Editor.
SNMP Management Console will import and compile your MIB. The MIB will now be
available for selecting requests in the MIB viewer.
Enable SNMP Network Agents
Although many devices are advertised as SNMP-compatible, you may need to install or
enable manufacturer-provided SNMP agents on your specific device. For example, you
may need to configure and run SNMP services on your UNIX or Windows system. You
will also need to check whether there is (or has been) a community name specified on the
agent and what the community name is on the specific system.
Typically, the default community name is “public.”
Introduction to SNMP Management Console
335
Check the device or server manuals for more information on installing or enabling SNMP
agents.
Configuring SNMP Management Console
After installation, SNMP Management Console will generally require little, if any,
configuration before it can be used.
General SNMP Management Console options are defined in Options > Observer
General Options > SNMP Tab. See “Observer General Options – SNMP Tab” on
page 246.
Using SNMP Management Console
SNMP Management Console Interface Overview
The SNMP Management Console is integrated into the Observer interface. Make certain
that you have the SNMP Management Console Agent List visible by selecting View >
Advanced, RMON and SNMP Probe Lists from Observer’s main menu.
MIB
Editor
pane
List of
SNMP
Agents
Agent
display
pane
When Observer is licensed to include SNMP Management Console, the Console is
running at all times. To view the Console windows, just click on one of the SNMP agents
in the List of SNMP Agents.
When an agent is selected, Observer’s interface turns into the SNMP Management
Console interface. You will notice that the menus, button bars, and main display areas
change. You can return to the Observer interface by selecting a Probe from the List of
Probes.
The SNMP Management Console interface is divided into three main sections:
336
Observer Suite: SNMP Management
•
List of SNMP Agents pane—displays each agent as an icon. Agents are queried by
request files that define five types of requests: charts, forms, lists, tables, and traps.
When an agent is selected, the requests are displayed in the SNMP Agent Requests
pane.
•
SNMP Agent Request pane—SNMP Agent Requests are shown in this pane.
Selecting a chart, form, list, table, or trap will display the associated request output in
the Agent Display pane.
•
Agent Display pane—all data is displayed in one window per agent. Each item
(charts, forms, lists, tables, and traps) is selected by the associated tab at the bottom of
the Agent window.
Additionally, SNMP agents can be displayed in map format alongside of Observer Probes.
The map format lets you display graphically (either geographically or topologically) your
network layout, including the positions of SNMP agents and the connections between
them and Observer Probes. You can scan in or draw a map or diagram and place your
servers, hosts, and other SNMP agents in their appropriate locations. SNMP Management
Console includes a set of bitmaps for different devices, or you may add your own bitmaps
for map objects (in Windows BMP format).
SNMP Management Console lets you add, edit, or delete agent entries. When you add a
new agent entry, you must associate a request file with it. Assigning a MIB also makes
available a set of pre-configured menu requests used to poll the agent for data. A request
file defines a set of objects for monitoring from one or more MIB groups. You can remove
request items or create and add new request items using the MIB Editor. See “The MIB
Editor” on page 352.
Functional Overview
SNMP Management Console polls SNMP agents and displays the collected information in
a chart, form, list, or table. To accomplish this, the SNMP Management Console creates
request packets in SNMP format and sends these packets to agents using the UDP protocol
as the carrier. The SNMP packet, often called a PDU (Protocol Data Unit) consists of one
or more SNMP objects.
When SNMP Management Console sends an SNMP packet to an SNMP agent, it either
asks for information about an object (a Get request), or asks to set the value of an object (a
Set request). When the agent receives the SNMP packet, it checks whether the object
exists in the agent's MIB, finds object values, creates a reply packet, and returns the reply
packet to the SNMP Management Console.
Because SNMP uses UDP (User Datagram Protocol) to transfer requests and replies, and
because the UDP protocol does not require the receiving station to acknowledge receipt of
a packet, there is a chance that either the request or reply packet will be lost.
To address this potential problem, SNMP Management Console uses a timeout-retry
mechanism. You can specify the amount of time SNMP Management Console will wait
Using SNMP Management Console
337
before deciding that the request was lost and the number of times SNMP Management
Console will resend the packet. When the maximum number of retries is reached and no
reply has been received, SNMP Management Console considers the SNMP agent not
present, out of order, or turned off, and displays a timed out message in the agent log.
Configuring SNMP Agents
For the SNMP Management Console to work with SNMP agents on the network, both
must be configured.
Here, the term “SNMP Agent” is used to mean the actual agent on the
network device, rather than the representation of that device in Observer’s
SNMP Extension.
The SNMP agents on the network must recognize SNMP Management Console as a
management station that is permitted to access their MIB information. To poll the agents
for information, the SNMP Management Console must know the IP addresses and
community names of each agent.
A device’s “community name” is, in effect, its password. Some devices have two
community names (or two passwords) one of which is a read-only password (usually
called the community name, the public community name, or the read community name),
and a read-write password (usually called the private community name, the write
community name, read/write community name, or sometimes, the community name). In
many environments, the default read community name is “public” and the default write
community name is “private.”
If there is a public and a private community name, SNMP Management Console can use
either, although it cannot write to an SNMP device without the read-write community
name.
The necessity of configuring the SNMP agent on the network will depend on the device.
Most devices, when properly queried using the appropriate community name, will
respond.
If you wish to restrict access to the SNMP device, replace “public” with a new
community name. The new community name becomes your password to the
agent.
The usual reason to change community names is for security. Security can
be enhanced by picking a random string of alphanumeric characters as a
community name, rather than using the default community name of “public,”
which provides little, if any, security at all.
Some agents will require further configuration, sometimes involving entering the SNMP
Management Console's IP address in the agent's database as a management console.
In such cases, the default IP address is 0.0.0.0. The “0” IP address means
that any SNMP management station can access the agent. If you decide that
338
Observer Suite: SNMP Management
only SNMP Extension is to have access to this sort of SNMP agent, set the
IP address to the SNMP Extension’s console address.
The procedure may be different for each agent. Refer to the device’s
documentation for more information on configuring and enabling SNMP.
To have the SNMP agent send trap messages to SNMP Management Console, you must
add the SNMP Management Console’s IP address to the list of management stations that
can receive trap messages from the agent. This is a different issue from that of some
agents requiring an IP address for SNMP requests. Traps are sent in response to an event
on the device, and not in response to a request from SNMP Management Console; without
being told where to send the traps, the SNMP agent simply would not know where to send
them.
See the specific device’s manual for instructions on how to configure the
SNMP device.
Adding, Modifying, and Deleting SNMP Agents
To collect information from your SNMP-enabled network devices, you must add an agent
entry for each SNMP agent on your network.
Adding an SNMP Agent
To add a new agent entry, select Actions > Add SNMP Device or right-click in the SNMP
Agents pane and select the ADD_SNMP AGENT item. Either action will open the Network
Device Properties dialog.
Network Device Properties – Description Tab
•
“Name” textbox—the name that is displayed to the right of the agent icon in the
SNMP Agents list. Enter any descriptive name.
•
“IP Address” textbox—the IP address of the SNMP agent you want to add.
•
“Community” textbox—the community name. This is typically “public.” By
convention, SNMP uses the community name and management station IP address the
same way login name and password are used in a telnet (terminal) session.
Configuring SNMP Agents
339
Some SNMP agents will respond to a menu request only if the management station IP
address exists in the agent's list and if the request contains the proper password.
In SNMP, the password is called the community name. To remain accessible to any
SNMP station, most SNMP agents use the default community name “public”.
If you do not specify the correct community name (or, in the case of those
agents who maintain an IP address table, if your SNMP Management
Console IP address is unknown to the SNMP agent), the agent will not
respond to your requests. SNMP Management Console will re-send the
request until it times out.
If you are polling the SNMP agent for the first time, a failure to respond may
be caused by any one, or more, of the following:
The SNMP agent is up and running, but SNMP Management Console is not
entered as a management station in the agent's database.
The community name is wrong.
SNMP services are not enabled on the device.
The SNMP agent's device is down.
If you have previously successfully polled the SNMP agent, only the last one
is possible, unless the configuration of the SNMP agent’s device has
changed.
•
“Version” dropdown—SNMP Management Console supports both SNMPv1 and
SNMPv2, a superset of SNMP1.
Most SNMP devices do not support SNMPv2. If in doubt, leave this setting at
the default, SNMPv1.
340
•
“Device type” textbox—a request file based on the RFC1213 standard MIB request
file is included with SNMP Extension.
•
Browse button—allows you to browse available files.
•
“Comment” textbox—allows you to fill in any comment you want here.
Observer Suite: SNMP Management
Network Device Properties – Notification Tab
Notify on Trap/Alarm:
•
“Email address” textbox—allows you to enter the email address to send notifications
to (from traps or alarms for this agent).
This is a different issue from the IP address (of the computer running
Observer with SNMP Extension) to which the SNMP agent itself is to send
traps. In this case, you are specifying the email address of the person who is
to be notified when a trap message is received by SNMP Extension.
Network Device Properties – Data Logging Tab
Time to log data (24 Hour Clock): You can choose to have device data logged all the
time, or schedule times to collect and log data on particular days of the week within
particular hours.
Keep polling even if not logging Chart Request data.
Configuring SNMP Agents
341
Edit an SNMP Agent
To edit an agent, right-click on an existing agent entry and select the PROPERTIES menu
item.
Delete an SNMP Agent
To delete an agent, right-click on an existing agent entry and select the DELETE NETWORK
DEVICE menu item.
SNMP Buttons
SNMP buttons (some of them are grayed out unless an SNMP device is selected from the
Observer Device list) buttons provides shortcuts for opening the MIB Editor and walking
a MIB:
Walk Agent MIB—causes SNMP Extension to “walk” through the agent MIB,
generating a file that can be used to help you set up and reconfigure a MIB file.
Show MIB Editor—toggles the display of the MIB Editor.
Using Agent Information Windows
The information collected from agents by SNMP Extension is displayed, upon request, in
an Agent Information Window. When you select an agent entry from the SNMP Agents
list, or from the map display, an Agent Display pane opens.
An agent display is an “MDI child” window. It cannot be moved outside the display area.
You can open multiple agent windows simultaneously and tile them in horizontal, vertical,
342
Observer Suite: SNMP Management
or cascading formats. One window per agent is opened. Select a tiling choice from the
Windows menu or click the appropriate tiling choice on the button bar.
The total number of agent windows you can open simultaneously is limited
only by your available Windows resources.
Each agent window can display any combination of lists, charts, tables, or forms. Each
new list, chart, table, or form creates a new tab at the bottom of the agent window.
When multiple agent windows are open, you can select an active window by selecting it
from the Windows menu. The Windows menu also includes commands for arranging
icons and closing all open windows.
Agent windows can be minimized (its icon will appear at the bottom of the Agent Display
Area) or maximized to completely fill the Agent Display Area. When the agent window is
maximized, it will change in size as the Agent Display Area is resized.
Each Agent Information Window consists of a title bar containing the name of the
monitored SNMP agent, a button bar, and a window where information (chart, list, table,
or error log) is displayed. The button bar includes the following buttons:
Start SNMP chart button—starts the chart (this button is only available for
charts).
Stop SNMP chart button—stops the chart (this button is only available for
charts).
Clear SNMP chart button—clears the chart’s data (this button is only
available for charts).
Refresh the current request view—refreshes the current list or table.
Close current tab—closes the current request view (not the whole request
window).
Start chart trending—saves the current chart’s data in trending format.
Write unsaved chart data to log file—when logging has been enabled for a chart,
SNMP Extension will write any unsaved data to the log file.
Print current agent display—prints the current display.
SNMP chart properties—opens the Properties dialog allowing you to set and
modify chart properties for the present session.
Each agent information window contains an Event Log tab that displays the local event
log. This window cannot be closed. Errors appear only if the agent is down or
Configuring SNMP Agents
343
malfunctioning. When an agent is down, the Event Log displays a message indicating that
SNMP Management Console exceeded the number of retries while attempting to poll the
agent. Another type of error is reply packet parsing errors. If these errors appear, either the
SNMP agent is malfunctioning or it's sending reply objects not supported by SNMP
Extension.
Collecting SNMP Agent Information
After opening an Agent Information window, you may collect information from SNMP
agents for display in charts, lists, forms, or tables. Charts are used for time-dependent
information. Lists and tables are used for both time-dependent and time-independent
information. Forms display SNMP data in a graphical format. Each collection mode is
discussed below.
Collecting Chart Information
Chart displays are limited to numerical time-dependent information; therefore, MIB
objects such as IP addresses, octet strings, hardware addresses, bitfields, enumerated
integers, and different constant integers are not candidates for chart requests. In general,
three types of variables do not fit well in charts:
•
Non-numerical variables that cannot be displayed in any reasonable way in the chart
format (e.g., names).
•
Constants: change of a value in time (the differential of the value) will always be
equal to zero.
•
Table objects are not displayed in charts.
Chart requests are created and modified using the MIB Editor. See “Using the MIB
Editor” on page 354.
To receive chart information from an agent, select the Charts tree item in the SNMP Agent
Requests area. Then double-click on the chart you would like to view. This will display
344
Observer Suite: SNMP Management
the chart in the current agent information window if one is open, or will open a new agent
information window if one is not currently running.
When you select a chart request, SNMP Extension begins polling the agent. You can
define the length of the request period and define chart display parameters by rightclicking on the chart and selecting Chart Properties. See “Building and Modifying Charts”
on page 359.
Chart information can be saved from the agent window. You can save the chart data in a
file then import it into a spreadsheet program (e.g., Microsoft Excel or Lotus 1-2-3).
Customizing Charts
When agent information is displayed in chart format, several options are available for
customizing the display. To define the following settings, right-click on the chart and
select CHART PROPERTIES.
Note: When changes are made to a chart from the Chart Properties display
window, the changes are effective for the present session only. Persistent
changes must be made to the chart from the MIB Editor. See “Using the MIB
Editor” on page 354.
Collecting SNMP Agent Information
345
Chart Properties – Chart Items Tab
•
Show items—displays your choice of monitored items in a chart.
Chart Properties – Chart Properties Tab
•
“Title” textbox—displays the current chart’s title.
Note: The title can be changed only from the MIB Editor. If you attempt to
make a change to a chart from either the Chart window or the SNMP Agent
Request pane, the following warning box will be displayed:
If you do not wish to receive further warnings that changes outside of the
MIB Editor are not persistent, check the “Do not show this dialog in the
future” checkbox. To enable warnings, click Options > Observer General
Options > SNMP and check the box entitled “Check this box to enable all
optional hint messages.”
346
Observer Suite: SNMP Management
•
“Polling frequency (sec)” spinbox—allows you to set how frequently SNMP
Management Console will poll an agent for data to update the chart.
Show chart items:
•
all items (scroll) option button—allows you to display all items contained in the chart.
•
“Page size” spinbox—allows you to specify the number of items displayed on each
page of the chart.
•
checked items only option button—allows you to select the items kept on the Chart
Items tab to be displayed.
Appearance:
•
Columns option button—allows you to change the display of the chart.
•
“3D” checkbox—allows the display of the chart in three-dimensional
sequential columnar format.
•
“Alternate” checkbox—allows the display of the chart in alternating bar
columnar format.
•
Pie option button—displays the chart in two-dimensional pie format.
•
Lines option button—displays the chart in two-dimensional line format.
•
“Line width” spinbox—selects the width of the chart lines in pixels.
Color of axis/labels:
•
Black option button—allows you to select black as the color of the axis and labels.
•
White option button—allows you to select white as the color of the axis and labels.
•
“Show grid” checkbox—enables or disables the display of the grid, the regular
pattern of points on the chart which are used to determine the size and location of
chart items.
•
“Grid color” dropdown—allows you to define the color of the grid.
•
“Background color” dropdown—allows you to define the graph background color.
Be careful not to select the same color for both text and background, as it will
render the text unreadable.
•
“Samples per page” spinbox—allows you to define the number of samples you would
like displayed on one page.
Collecting List Information
When you request agent information using the list format, SNMP Extension polls the
agent once to receive a snapshot of agent objects defined in the list request.
Collecting SNMP Agent Information
347
Lists have only one limitation regarding type of object: they cannot display tabular
objects. Lists can display text, IP addresses, descriptions, and numeric variables, but not
tables.
Lists are best for objects that have a one-to-one relationship. For example: a
statistic that does not change, such as SystemName; or a statistic that does
not have a variable number of data points, such as RouteMetrics. Tables are
best to display items that may have a variable number of responses, such as
a list of current connections by IP address.
To receive list information from an agent, select the Lists item in the SNMP Agents
request area, then select the List tree item you wish to view.
Read
values
display
Textbox
displayed
once you
select an
object
entry
List requests are created and modified using the MIB Editor. See “Using the MIB Editor”
on page 354.
When you select a list menu request, SNMP Management Console sends the request to the
agent and (if the agent is running and configured properly) receives a reply, which can be
viewed in the list display in the agent information window. If necessary, SNMP Extension
will re-send the request.
Read Values Display
Some objects in the list are writable, which means you can use SNMP Management
Console to set the value of the object remotely. Writable objects display “[RW]” in the
Access column of the display. Read-only objects show “[RO]” in the Access column.
Writable Object Setting
To define a setting for a writable object:
1.
348
Select the writable object entry in the agent window.
2.
Enter or select a new value for the object in the textbox that is displayed at the bottom
of the window.
3.
Click the SET button. SNMP Management Console sets the value of the writable
object and repeats the original request to make sure that the value was changed.
Observer Suite: SNMP Management
4.
The updated list information will be displayed.
Collecting Forms Information
Forms are SNMP Management Console’s way of displaying SNMP data in a flexible
graphical format. Forms can be groups of items that show objects in a clean, colorful
formatted view; bitmaps of devices with ports that change color, depending on the value
of the SNMP response; or multiple-choice dropdown writable SNMP lists for configuring
a server.
Any type of SNMP object can be placed on a form. Each object’s display format can be
adjusted to meet the needs of your display requirements. Example forms include an IP
route form that allows you to view or set the status of multiple IP routes from the devices
route table, or a System Information form that lets you set certain system information
writable objects. Two sample forms follow:
Collecting SNMP Agent Information
349
To modify the sampling behavior of a form, right-click on the form and select FORM
PROPERTIES. The Form Properties dialog will be displayed:
•
“Title” textbox—displays the form’s title.
Note: The chart title can be changed only from the MIB Editor. If you attempt
to make a change to a chart from either the Chart window or the SNMP
Agent Request pane, a warning box is displayed:
If you do not wish to receive further warnings that changes outside of the
MIB Editor are not persistent, check the “Do not show this dialog in the
future” checkbox. To reenable warnings, click Options > Observer General
Options > SNMP and check the box entitled “Check this box to enable all
optional hint messages.”
Data Polling:
•
“Polling frequency (sec)” spinbox—allows you to determine the polling frequency
with which the MIB objects in the form will be polled. Enter a number between 1 and
999 manually, or use the arrow keys to set the polling frequency.
•
poll continuously option button—allows you to select continuous sampling in which
the MIB objects will be sampled every “n” seconds, where “n” is the frequency set.
•
poll number of times option button and spinbox—allows you to select a set number of
times in which the MIB objects will be sampled; the number of times is set in the
spinbox attached to the option button.
•
snapshot poll option button—allows you to select to have a snapshot poll of samples.
Forms are created and modified using the Forms Designer in the MIB Editor. List requests
are created and modified using the MIB Editor. See “Using the MIB Editor” on page 354.
Collecting Table Information
SNMP tables are collections of different types of objects. Picture the SNMP table as a
spreadsheet. Each row contains fields of data related to an object. Access to the SNMP
MIB table is similar to reading the spreadsheet row by row.
SNMP works in the following way: SNMP Extension requests the values of all or some
objects from the first line in the SNMP MIB table. After receiving a reply, it displays the
values in the table and requests information for the next line. SNMP Extension continues
350
Observer Suite: SNMP Management
to collect information row by row until it reaches the end of the table. This process is
called “traversing the table” in SNMP terminology.
To receive table information from an agent, select the table tree item in the SNMP Agent
Request area, and double click on the table you wish to view.
Tables are created and modified using the Forms Designer in the MIB Editor. List requests
are created and modified using the MIB Editor. See “Using the MIB Editor” on page 354.
Read Values Display
SNMP Extension will read the table and display the values of the table objects line by line.
Tables can contain more than one writable object. Writable objects display “[RW]” in the
Access column of the display. Read-only objects show “[RO]” in the Access column.
Writable Option Setting
To define a setting for a writable object:
1.
Select the writable object entry in the agent window.
2.
Enter or select a new value for the object in the textbox that is displayed at the bottom
of the window.
3.
Click the SET button. SNMP Management Console sets the value of the writable
object and repeats the original request to make sure that the value was changed.
4.
The updated list information will be displayed.
Depending on the type of table and the constraints imposed by the agent MIB design, you
may be able to change the values of writable table objects, add additional lines to the table,
or both.
Traps
An SNMP device may be configured by its manufacturer to send trap messages which
notify the SNMP management station (in this case, SNMP Extension) of certain
conditions. Unlike get and set requests, a trap message doesn’t require a request from
SNMP Extension. It’s sent by the device automatically when there is an error, a certain
Collecting SNMP Agent Information
351
level of activity, or other condition. SNMP Extension collects incoming trap messages
constantly.
“Trap” and “trap message” are used interchangeably.
To receive trap messages with SNMP Management Console, SNMP Management
Console's IP address must be included in the trap configuration table of the SNMP agent.
Trap configuration is usually separate from general SNMP configuration.
If you configure one but not the other, you may be able to poll the SNMP
agent, but receive no trap messages.
The SNMP agent doesn’t expect confirmation for trap messages. If the message doesn’t
reach its destination, SNMP Management Console has no way of knowing the message
was sent, and the agent has no way of knowing whether a message was received.
Under normal circumstances most of the trap messages do reach their
destinations. The limitation of traps comes from the lack of verification
capabilities built into the relevant RFC specifications.
The MIB Editor
The MIB Editor is where MIBs are compiled and MIB objects are placed in requests to
create SNMP Management Console lists, charts, tables, forms, and traps.
Compiled
MIBs
Request
files
352
•
MIB—a MIB is a text file in Abstract Syntax Notation One (ASN.1) format, which
describes in a structured way the objects an SNMP device supports.
•
Compiled MIBs—a compiled MIB is a binary file created from a MIB file in
preparation for creating requests to be submitted to an SNMP agent.
Observer Suite: SNMP Management
•
Device Types (Requests)—a request file is the actual file sent to an SNMP agent,
polling and/or setting the states of various MIB objects or OIDs.
The MIB Editor displays compiled MIBs on the left pane of the window and request files
on the right pane. Both compiled MIBs and requests are displayed in a familiar Windows
tree format. The MIB Editor is used to compile MIBs and create/edit requests.
The MIB Editor Toobar
Compile MIB File—causes SNMP Extension to compile a MIB file.
MIB Object Properties—permits the setting of properties for the
selected MIB object.
Copy MIB Object—copies the selected MIB object to the Windows
Clipboard.
Paste MIB Object—pastes the selected MIB object from the Windows
Clipboard onto the SNMP Requests pane of the MIB Editor.
Paste Subtree—pastes the selected subtree from the Windows
Clipboard onto the SNMP Requests pane of the MIB Editor.
New Request File—creates a new request file in the SNMP Requests
pane of the MIB Editor.
New Request Folder—creates a new request folder in the SNMP
Requests pane of the MIB Editor. Request folders are used to
organize request files.
Request Object—creates a new request object in the selected folder
of the SNMP Requests pane of the MIB Editor.
Delete a MIB or Request Object—deletes the selected object.
Save Modified MIB Requests—saves the modified file. If the file has
not been changed since the last save, this menu item will be grayed
out.
Print Agent Data—prints the data for the current agent, as configured.
This simply prints the current state of the SNMP Request (right-hand)
pane of the MIB Editor.
•
Refresh the Current Request View—refreshes the display for the current request.
The MIB Editor
353
Using the MIB Editor
The following number of definitions may help in navigating the MIB editor dialogs.
MIB
MIBs are text files that the creator of an SNMP agent provides to describe the variables
the particular agent keeps track of. These variables are called SNMP objects.
Often, in the context of SNMP, they are simply referred to as “objects.”
MIBs have a very specific structure for the organization of objects; any SNMP
management console (SNMP Management Console in this case) can use the MIB to form
queries of the SNMP agent on a specific device. MIBs are supplied by the manufacturer of
the device.
There are two logical sets of statistics that every agent (in theory) should keep track of:
•
The standard MIB-2 (RFC1213) set or MIB-1 (RFC1066), and
•
Any proprietary MIB(s) objects.
SNMP is structured this way so that each device can offer standard (MIB-1/2) data that
would be common between all network devices (e.g., packets in, packets out), and data
that is device-specific (like number of sheets printed on a network printer). MIB-2 is a
superset of MIB-1. Sometimes these two sets of MIB objects are combined into one MIB
file. Other times you may find that the manufacturer only provides you with a proprietary
MIB and expects you to use the RFCMIB-2 (or MIB-1) to view the standard data objects.
Unfortunately, there are manufacturers that only offer a subset of objects in the standard
MIB(s). In these cases, you can ask the agent for the objects that are missing, but the agent
will not respond.
All SNMP agents keep track of some or all of the objects in the standard
MIBs (MIB-1 or MIB-2). If you do not have access to a proprietary MIB for
your device, you may be able to get all the information you require from the
standard MIBs.
A Request File
A request file is built within SNMP Management Console to organize, group, and define
specific SNMP requests that may be made of an agent. Each request can be for one or
more SNMP objects, and the response to the request may be displayed in list, chart, table,
or form format. A number of request files come with SNMP Management Console, but in
general, request files are built by you to suit your specific needs with regards to the matrix
that your site needs to collect.
When SNMP Management Console polls an SNMP agent for information, a request
allows it to receive information about many different objects simultaneously. You can
create your own requests (or edit the requests provided) using the MIB Editor.
354
Observer Suite: SNMP Management
Compiled MIBs
SNMP Management Console compiles the MIB prior to using it to create requests. This is
done to save on memory when parsing request responses and to make drag-and-drop
request building faster.
Your path to begin building requests (lists, charts, tables, or forms) will begin by
determining whether SNMP Management Console includes a suitable MIB for your
device. See “Building Requests” on page 357.
If you have a specific MIB that was included with your device, you should begin by
compiling the MIB. See “Compiling MIBs” below.
If you do not have a specific MIB for your device and the device is not listed on the list of
MIBs, you can still use the standard MIBs to create requests for that device. In that case,
you will use the standard RFC1213 or RFC1066 MIB to build your requests.
Compiling MIBs
Prior to building a request, you may need to compile a MIB. You will need to do this if
you have a MIB that was distributed with your device or have received a new MIB for a
device. If you don’t have a specific MIB for your device and want additional information
on what the standard MIBs provide, you must obtain a MIB from the manufacturer.
Once you have the MIB, you compile it using the MIB Editor. Compiling the MIB is not
much more complicated than opening a file. However, some companies do not strictly
follow the MIB file format, so you may need to modify the MIB text file. Also, after
compiling the MIB file, you must create your own requests.
The MIB Compiler parses MIB text files and converts them into a format that can be used
by SNMP Management Console and its utilities. The MIB Compiler is used when you
don't have a pre-compiled MIB for a particular SNMP device. You may also need to use
the MIB Compiler to recompile a MIB after editing the device MIB file (for example, to
correct an error in a manufacturer-supplied MIB file) or to update a manufacturer-supplied
MIB file for a new device.
The MIB Compiler expects ASN1-formatted MIB text files which have the MIB
Management Console (e.g., RFC1213.MIB).
ASN.1 (Abstract Syntax Notation One) is the standard way, defined by two
ISO (International Organization for Standardization) standards, to describe a
message that can be sent or received in a network.
ASN.1 is defined in two different places:
the rules of syntax for describing the contents of a message in terms of data
types and content sequence or structure is defined by the ISO 8824/ITU
X.208 standard.
The MIB Editor
355
how you actually encode each data item in a message is defined by the ISO
8825/ITU X.209 standard.
The Compile Process
1.
356
To compile a new MIB, open the MIB Editor by selecting Tools > SNMP MIB Editor
or click on the SHOW MIB EDITOR icon
from the main button bar.
2.
Select Mode Commands > Compile MIB File to open the Import MIB Source
dialog to display files to select for compiling.
3.
Select the MIB file (*.MIB) you wish to compile. The Save Compiled MIB As
dialog will be displayed.
4.
Insert the desired file name and click on the CREATE button.
5.
The MIB will be compiled and the resulting file (with a .MIC extension) will be
placed in the Observer Files\SNMP directory.
Observer Suite: SNMP Management
6.
Once the MIB is successfully compiled, it will be automatically listed in the MIB
Editor with the other compiled MIBs.
7.
Should the compiler have problems compiling your MIB, the compiler will exit to the
MIB Editor and the log will display the errors, listing which MIB line caused the
error. Click the EDIT SOURCE button to edit the MIB file and correct the error.
8.
After correcting the error, simply compile the MIB again. If there are any further
errors, the compiler will stop again. Repeat until the MIB successfully compiles.
Building Requests
As described earlier in this section, requests are built from MIB objects and can be
displayed in list, chart, table, or form format. Requests are grouped together in a request
file. Request files contain folders for each format of request: chart, list, table, form, and
trap.
SNMP Management Console includes a number of pre-built request files that can be used
as is or modified to suit your specific needs. Most users will find that the included request
files, possibly modified, will serve quite well.
Requests can contain objects from one MIB or many separate MIBs. Once built and saved,
requests are displayed in a tree structure for each agent that the request file is associated
with.
When adding a new SNMP Agent, you must specify a request file. All configured requests
for the agent become available each time the newly-registered SNMP agent entry is
selected. You can remove requests from an agent or add newly-created requests to an
agent using the MIB Editor.
To receive information about an object, SNMP Management Console polls an SNMP
agent by sending a request packet. The request packet can combine one or more object
IDs. When the agent receives the request, it searches its databases, retrieves object values,
composes a reply, and sends the reply as a reply packet back to SNMP Management
Console.
The MIB Editor
357
The structure of the SNMP polling process suggests that an SNMP request can be
considered a single object. By combining several SNMP objects in a single request, the
same requests can be used for all SNMP agents using the same MIB.
The MIB Editor provides this functionality for SNMP Management Console by allowing
you to design requests for each agent. When you configure a new SNMP agent, you
designate its request file in the SNMP Agent Properties dialog.
Why Build Custom Requests?
The request files that are included as part of the SNMP Management Console package will
serve most user’s needs most of the time; however, there may be situations where it can be
advantageous to build custom requests. RFC1213 includes methods for manufacturers to
define SNMP objects not specifically defined (in effect, proprietary MIB objects). In some
cases, a manufacturer may not have precisely adhered to the RFC1213 specification and
mislabelled an object.
Custom requests allow the SNMP Management Console to work with SNMP agents that
interact with objects not directly defined in RFC1213, and in dealing with badly-formed
SNMP agents.
Another advantage of custom requests is the ability to share them. For example, a network
administrator in a large corporation may need to create a periodic report about network
traffic. Four other network administrators from the same corporation, located in different
states, must create similar reports about their network segments. By creating a single,
uniform custom request, it is possible to easily compare the performance of the network
segments on the important criteria.
Yet another advantage of custom requests is to avoid data overload. While SNMP and its
proprietary features can provide a mountain of information, only some of it will be
relevant in a given situation. By either modifying standard requests to eliminate
extraneous data, or by creating custom requests from scratch, you will be able to create
displays of information that are useful to your specific situation. For example, RFC1213
defines twenty different ICMP objects, but much of the time, most network administrators
will find themselves interested in only one or two. By creating a custom chart, the network
administrator can focus more on what’s relevant by eliminating the display of the
extraneous.
Custom requests also provide a way for one network administrator to:
•
Design a standard for obtaining exactly the information needed;
•
Prepare information in a way more easily understood by less technically-oriented
people, and;
•
Share the standard with other administrators.
Through discussion and testing, a comprehensive set of custom requests can be developed
to obtain consistent sets of data customized for an organization's particular needs.
358
Observer Suite: SNMP Management
Creating A Custom Request File
1.
To create a custom request file, from the MIB Editor select Mode Commands >
.
New Request File or click on the NEW REQUEST FILE icon
2.
The Add New Device Type dialog will be displayed.
3.
Name the request file.
4.
Leave the “Add default RFC1213 requests to the new file” checkbox selected, if
desired.
5.
Click the CREATE button.
6.
The new request tree on the right hand side of the MIB Editor will be displayed. Note
the new request items that are now available: Charts, Expressions, Forms, Lists,
Tables, and Traps.
Building and Modifying Charts
Much of what is done in the MIB Editor when building and modifying charts is similar to
what can be done from the Agent Display window. There are two significant differences
when modifying a chart from the MIB Editor:
•
Changes, once saved, are permanent. When changes are made from the Agent
Display, they are for that session only.
•
More features of the chart can be modified by the MIB Editor.
Charts are indicated in the MIB Editor by the
icon.
The MIB Editor
359
1. To create a new, blank chart, right-click on Charts and select NEW CHART. A new
chart, entitled “New Chart” will be created.
2.
Drag-and-drop any non-table MIB object from the left-hand pane of the MIB Editor
onto the chart (remember: charts cannot display tabular data).
A MIB object can be copied from any available compiled MIB.
New
chart
Drag
and
drop to
new
chart
Drag
and
drop
items
displayed
Only those MIB objects that have been copied to the chart can be monitored by the
chart.
While it’s certainly possible to copy a myriad of MIB objects to the chart and
only use a few, it’s generally a better idea to copy only those objects you plan
on charting with that particular chart.
360
Observer Suite: SNMP Management
Object Properties Wizard
Click on the YES button to display the New Item Properties dialog.
•
“Label” textbox—allows you to enter a label name for the chart item; the default
name is from the list of Compiled MIBs you are dragging and dropping from.
•
“Description” textbox—allows you to enter a description of the chart item.
Item Appearance:
•
“Fill color” dropdown—allows you to select the fill color for the chart item.
•
“Pattern style” dropdown—allows you to select the pattern style for the chart item.
•
“Pattern color” dropdown—allows you to select the pattern color for the chart item.
•
The example box (to the right of the three dropdown boxes) shows how the
combination will appear.
Click NEXT to continue on to the Attached MIB Object dialog.
The MIB Editor
361
Attached MIB Object
•
“ID” display—allows you to view the ID label for the chart item.
•
“Name” display—allows you to view the MIB Object name.
•
“Type” display—allows you to view the MIB Object type.
•
“Access” display—allows you to view whether the MIB Object is read-only or readwrite.
•
“Enumerated values” display—allows you to view the enumerated values to be
displayed by the MIB Object.
•
“Description” display—allows you to view the description of the chart item.
Request Specific:
•
Absolute value option button—when selected, allows you to receive absolute values
for the MIB Object.
Click NEXT to continue on to the Set Triggers dialog.
362
Observer Suite: SNMP Management
Set Triggers
•
“Chart item” display—allows you to view the chart item name.
•
“Upper threshold” checkbox—when selected, allows you to enable triggers for upper
thresholds of the chart item.
•
“Upper threshold” textbox—when the “Upper threshold” checkbox is selected, this
box will be enabled and you can set the upper threshold values.
•
“Lower threshold” checkbox—when selected, allows you to enable triggers for lower
thresholds of the chart item.
•
“Lower threshold” textbox—when the Lower threshold checkbox is selected, this box
will be enabled and you can set the lower threshold values.
•
Edit alarm response buttons—displays the Edit Alarm Response dialog.
Edit Alarm Response
•
“Action” checkboxes—allow you to enable any action in response to a threshold:
•
Send email message
The MIB Editor
363
•
Page phone number
•
Play sound file
•
Execute command line
•
Add to event log
These actions can be configured independently. It is possible to configure any, all, or
none of these to be executed when a threshold is reached.
•
“Email message” textbox—allows you to enter an email message to be sent.
Chart Items Tab
When agent information is displayed in chart format, several options are available for
customizing the display. To define the settings, right-click on the Chart and select
PROPERTIES. The Chart Properties dialog will be displayed. See “Chart Properties –
Chart Items Tab” on page 346.
Chart Properties Tab
See “Chart Properties – Chart Properties Tab” on page 346.
Building Expressions
Expressions permit you to take SNMP agent data and derive useful mathematical results.
Raw data that SNMP Management Console receives from SNMP agents can be very
useful but, often it’s only the starting point. An SNMP agent on a switch may keep track of
the number of data packets the switch has received, the number of packets it has
discarded, and the number of packets it has passed along. However, the network
administrator may be more interested in the percentage of packets discarded since this
may signal a problem with the system.
Expressions are indicated in the MIB Editor by the
1.
icon.
To create a new expression, from the MIB Editor, click on Expressions, then select
Mode Commands > New Expression or right-click and select NEW EXPRESSION)
New
Expression
2.
From the left pane of the MIB Editor, select any MIB objects that you intend to use in
the expression and drag-and-drop them on the new expression.
There may be a slight performance penalty caused by including unnecessary
MIB objects in an expression. In terms of system efficiency, it’s best to add
only those you need. If you find you need additional MIB objects to create
your expression, you can easily add them at a later time by the same dragand-drop method.
364
Observer Suite: SNMP Management
3.
Right-click on the new expression to rename it, if desired.
4.
Right-click on the renamed expression and select EDIT EXPRESSION to display the
Modify Expression dialog.
The Modify Expression dialog box is, in effect, a numeric calculator, permitting the
creation and modification of mathematical expressions using selected MIB objects,
constants, and mathematical operations.
5.
Numbers can be entered from the keyboard; mathematical functions can be entered
either via the keyboard, or from the buttons of the dialog. The INSERT MIB OBJECT
button can be used to insert MIB objects that have been dragged to the expression.
6.
Click OK to save the edited expression.
Now that the new expression has been built, it can be used in a chart. See “Building and
Modifying Charts” on page 359.
Building List and Table Requests
1.
To create a new list, from the MIB Editor, click on “Lists,” then select Mode
Commands > New List Request or right-click and select NEW LIST.
Right-click on
“New List”
2.
SNMP Management Console will create a new list. Rename the list whatever you find
appropriate.
3.
Open the MIB tree for the MIB you would like to use.
4.
Display the objects you want to include on your list, highlight the objects, and drag
the objects from the MIB tree listing to the request file tree.
The MIB Editor
365
You may use MIB objects from two or more different compiled MIBs.
5.
Once complete, select Mode Commands > Save Request File. The new list will be
available for all Agents that use this request file.
The same actions can be taken to build tables.
Building Trap Requests
A trap is an event that an SNMP Agent (the actual hardware or software agent, not SNMP
Management Console’s Agent request) can be configured to automatically report to the
management program, in this case SNMP Extension. RFC1157 defines seven traps, any,
all, or none of which may be supported by a given SNMP Agent.
To find out which, if any, SNMP traps your device supports, please consult
the documentation for that device.
When the Agent has been configured to report a trap and a trap event occurs, the Agent
will report the trap to the management program without having to be polled.
For example, one defined trap is the coldStart trap. A device with an SNMP agent that
supports this trap will issue this trap when the device is performing a “cold” boot (or
reboot), one where the device’s configuration or implementation may be altered. Another
is the warmStart trap, which is issued when a “warm” boot is occurring.
The advantage of a trap is that the management program does not have to repeatedly query
the agent for the trap condition. Like an alarm clock going off at a pre-set time, when a
configured trap event occurs, it notifies SNMP agent without having to be asked.
There are some inherent limitations to traps. A trap can only be sent from a properlyfunctioning SNMP Agent, so it’s impossible for a router to send a trap announcing that it’s
down. Since a trap is configured in the SNMP Agent itself, it’s relatively inflexible.
Further, since traps are sent via UDP (a protocol that does not include method for
verifying that a packet has been received), the SNMP Agent has no way of knowing if the
trap has been received and acted on.
Traps are indicated in the MIB Editor by the
366
icon.
1.
To add a trap to an SNMP request, simply drag a trap from a compiled MIB and drop
it on the trap tree of the MIB request.
2.
Right-click on the trap to bring up the Trap Properties dialog. The boxes on the Trap
Properties tab will always be grayed out, as there is no configuration of the traps
themselves; traps are simply either monitored or not monitored by SNMP
Management Console.
Observer Suite: SNMP Management
3.
4.
Click on the “Set Triggers” tab to configure the trap’s alarms and to display the Set
Triggers tab.
Alarm actions can be set independently. It is possible to configure some,
none, or all of the possible alarm actions to happen when the trap is
received.
Actions:
•
“Send email message” checkbox—if selected, a triggering event will cause an email
message to be sent to a designated recipient as configured in Options > Observer
General Options > Email Notifications. (See “Setting up Email Notifications” on
page 245.) Enter the message in the “Email message” textbox.
•
“Page phone number” checkbox—if selected, a triggering event will cause a pager
message to be sent to the recipient designated in Options > Observer General Options
> Phone Pager. See “Observer General Options–Notifications Tab” on page 235.
•
“Play sound file” checkbox—if selected, a triggering event will cause a sound file to
be played.
The MIB Editor
367
•
“Execute command line” checkbox—if selected, a triggering event will cause a DOS
or Windows program to be run.
Only one command will be executed. If you need or wish to have more than
one program run, you may set up a batch file (e.g., WARNINGS.BAT) as the
command line to be executed. You can then use a text editor to create
WARNINGS.BAT and enter multiple commands in that batch file.
Designing and Building Forms
SNMP Extension's Forms Editor is a full-function forms designer enabling you to display
information in a variety of formats and to actively interact with SNMP devices. While
SNMP Management Console comes with several sample forms, it is possible for you to
design custom forms.
Forms are indicated in the MIB Editor by the
1.
icon.
To build a new form, from the MIB Editor, click on “Forms,” then select Mode
Commands > New Form Request or right-click and select NEW FORM.
2.
SNMP Management Console will create a new form. Rename the form whatever you
find appropriate.
3.
Open the MIB tree for the MIB you would like to use.
4.
Display the objects you want to include on your list, highlight the objects, and drag
the objects from the MIB tree listing to the Request file tree.
5.
Right-click on the form and select EDIT FORMS CONTROL to display the Form Editor
dialog.
Horizontal
toolbar
Vertical
toolbar
A form consists of an arrangement of one or more controls and drawing objects on the
form. Controls can display SNMP and other information and, in some cases, allow the
user to interact with an SNMP agent. Controls and drawing objects are created and
manipulated from Mode Commands or from the two toolbars of the Form Editor.
368
Observer Suite: SNMP Management
When the Form Editor is active, Mode Commands contains the following items:
Form Editor
Form Designer
•
Select Control—permits the selection of one or more controls and drawing objects.
Click on one object to select it; either Control-click on several objects or draw a
bounding outline to select multiple objects.
•
Add Text Control—permits the creation of a text control on the form. Click anywhere
on the form to create a text control at that point.
•
Add Edit Control—permits the creation of an edit box control on the form. Click
anywhere on the form to create an edit box control at that point.
•
Add List Box—permits the creation of a list box control on the form. Click anywhere
on the form to create a list box control at that point.
•
Add Combo Box—permits the creation of a combo box control on the form. Click
anywhere on the form to create a combo box control at that point.
•
Add Group Box—permits the creation of a group box control on the form. Click
anywhere on the form to create a group box control at that point.
•
Add Bitmap—permits the insertion of a bitmap into the form. Click anywhere on the
form to insert a bitmap at that point.
•
Add Push Button—permits the insertion of a button control into the form. Click
anywhere on the form to insert a button at that point.
•
Add Drawing—permits the insertion of a drawing into the form. Click anywhere on
the form to insert a drawing at that point.
•
Add Enumerated Bitmap—permits the insertion of an enumerated bitmap control into
the form. Click anywhere on the form to insert an enumerated bitmap at that point.
•
Add Dial Control—permits the insertion of a dial control into the form. Click
anywhere on the form to insert a dial control at that point.
•
The following two items will be grayed out if unavailable:
The MIB Editor
369
•
•
Paste MIB Object—permits the insertion of a MIB object that has been cut or
copied to the Windows Clipboard.
•
Clear MIB Object—permits the deletion of a MIB object.
Test Form—toggles the form between Edit Mode and Preview Mode. In Preview
Mode, while the form will not display any actual data, it is possible to test buttons and
dropdown forms.
The horizontal toolbar contains the following buttons, which correspond to their
equivalent entries on the MODE COMMANDS menu.
Select Control
Add Text Control
Add Edit Control
Add List Box
Add Combo Box
Add Group Box
Add Bitmap
Add Push Button
Add Drawing
Add Enumerated Bitmap
Add Dial Control
Paste MIB Object
370
Observer Suite: SNMP Management
Delete MIB Object
Test Form
When the Forms Designer is active, Mode Commands > Align Controls submenu
contains the following items:
•
Undo Last Operation—reverses the action of the last operation on the form.
Saving the form will clear the undo buffer.
•
Redo Last Operation—reverses the action of the last undo operation on the form.
Saving the form will clear the redo buffer.
•
Show grid—toggles the display of the grid, the rectangular array of points on the
form.
•
Snap to grid—toggles whether or not objects moved or placed on the form near grid
points will be “snapped” or automatically moved into contact with those grid points.
•
Align the Left Edges of the Selected Controls—causes the left edges of selected
controls or objects on the form to be aligned on the left side.
•
Align the Right Edges of the Selected Controls—causes the right edges of selected
controls or objects on the form to be aligned on the right side.
•
Align the Top Edges of the Selected Controls—causes the top edges of selected
controls or objects on the form to be aligned on the top side.
•
Align the Bottom Edges of the Selected Controls—causes the bottom edges of
selected controls or objects on the form to be aligned on the bottom side.
•
Make the Selected Controls the Same Size as the Last Selected control—causes the
selected controls or objects to become both the same height and width as the last
selected control.
•
Make the Selected Controls the Same Height as the Last Selected control—causes the
selected controls or objects to become the same height as the last selected control.
The MIB Editor
371
•
Make the Selected Controls the Same Width as the Last Selected control—causes the
selected controls or objects to become the same width as the last selected control.
The vertical toolbar contains the following buttons, which correspond to their equivalent
entries on the MODE COMMANDS menu:
Undo Last Operation
Redo Last Operation
Show Grid
Snap to Grid
Align the Left Edges of the Selected Controls
Align the Right Edges of the Selected Controls
Align the Top Edges of the Selected Controls
Align the Bottom Edges of the Selected Controls
Make the Selected Controls the Same Size as the Last
Selected Control
Make the Selected Controls the Same Height as the Last
Selected Control
Make the Selected Controls the Same Width as the Last
Selected Control
Each of the controls or objects has its own properties dialog which is accessed by selecting
the control or object and right-clicking on it.
372
Observer Suite: SNMP Management
Text Field Properties
•
“Wrap text (multi-line)” checkbox—allows you to break between words and wrap to
multiple lines.
•
“Clip text to bounding rectangle” checkbox—allows you to set the text to be aligned
or clipped to the bounding rectangle of the textbox.
•
“Transparent” checkbox—allows you to set the text box to be transparent.
•
“Align text” dropdown—allows the text to be aligned left, centered, or right.
•
“Text Color” dropdown—allows you to select the text color from a color palette.
•
Font button—permits the selection of the font for the current text box. This selection
overrides the default font selection.
•
Default Font button—permits the selection of a default font for text boxes, setting the
font that will be used when no font is specified, as above.
•
“Label” textbox—allows you to add text that will be shown in the text object.
The MIB Editor
373
Edit Field Properties
•
“Multiline” checkbox—if selected, the text will break between words and wrap to
multiple lines.
•
“Read-only” checkbox—if selected, prevents you from being able to change the
associated MIB information, even if the MIB object is writable.
•
“Vertical scroll bar” checkbox—if selected, adds a vertical scroll bar to the object,
allowing you to scroll up or down to see hidden information.
•
“Right aligned text” checkbox—if selected, the text will be aligned to the right side of
the box.
•
“Number” checkbox—if selected, the edit box will display only numbers, rather than
alphanumeric characters.
•
Value Type option button—when selected, the edit object displays a MIB object.
•
MIB OBJECT option button—allows you to select among MIB objects attached to
the form.
•
“Associated MIB object” dropdown—if the MIB OBJECT option button is
selected, this dropdown box is displayed permitting you to select among the MIB
objects attached to the form.
If the dropdown box is blank, no MIB object has been attached to the form.
To attach a MIB object or some MIB objects to a form, simply select one or
more MIB objects from the left pane of the MIB Editor and drag-and-drop
them onto the form.
•
374
Arithmetic expression option button—when selected, the edit object displays an
arithmetic expression.
Observer Suite: SNMP Management
•
If the Arithmetic expression option button is selected, the bottom pane of the
dialog will include a SET EXPRESSION button
Set Expression
button displayed
if “Arithmetic
Expression” selected.
Arithmetic
expression will
be displayed, if
selected.
Setting an Expression
1. Click the SET EXPRESSION button. The Choose Expression dialog box will be
displayed.
2.
The upper pane will contain those expressions available in the present SNMP request.
Select any expression and click the NEXT button.
The MIB Editor
375
3.
The Set Expression Indexes dialog will be displayed.
4.
Select the index you wish to modify and enter your chosen value in the “Assign index
value” textbox. Click the FINISH button.
5.
The Edit Field Properties dialog will be redisplayed.
List Box Properties
376
•
“Sort lines” checkbox—if selected, the items in the list box will be sorted
alphabetically.
•
“Whole lines” checkbox—if selected, the list box will display a whole number of
lines, rather than permitting fractional lines.
•
“Hidden (useful for table holders)” checkbox—if selected, the table will be hidden on
the form. The primary use for this is for table holders that will be used elsewhere in
the form.
Observer Suite: SNMP Management
•
“Associated MIB object” dropdown—allows you to choose among the MIB objects
attached to the form.
Combo Box Properties
•
“Sort lines” checkbox—if selected, the lines in the list box will be sorted in
alphanumeric order.
•
“Whole lines” checkbox—if selected, the list box will display whole number of lines,
rather than permitting fractional lines.
•
“Hidden (useful for table holders)” checkbox—if selected, the table will be hidden on
the form. The primary use for this is table holders that will be used elsewhere in the
form.
•
Simple option button—if selected, the combo box will be a simple list.
•
Dropdown option button—if selected, the combo box will be a dropdown box.
•
Dropdown list option button—if selected, the combo box will be a dropdown list.
•
“Associated MIB object” dropdown—allows you to select the MIB object to be
associated with the combo box.
The MIB Editor
377
Group Box Properties
•
“Label” textbox—allows you to add a descriptive label for the group box.
•
“Right aligned text” checkbox—if selected, the text in the group box will be right
aligned.
Bitmap Properties
•
“Bitmap path” display—allows you to view the bitmap path.
•
“Bitmap path” selection box—allows you to select the bitmap to be displayed on the
form. Click on the
button to select the bitmap. The Select Bitmap dialog will be
displayed. See “Select Bitmap Dialog” on page 379.
Styles:
378
Observer Suite: SNMP Management
•
“Stretch to bounding rectangle” checkbox—if selected, the bitmap will be stretched to
the limits of the rectangular boundary, even if that requires a horizontal or vertical
distortion of the image.
•
“Clip to bounding rectangle” checkbox—if selected, the bitmap will be clipped or
trimmed at its rectangular boundary.
•
“Transparent background (upper-left corner)” checkbox—if selected, the bitmap will
be displayed in the upper left corner of the bitmap object’s rectangular boundary, with
the rest of the rectangular boundary of the bitmap object being transparent.
Select Bitmap Dialog
Button Control Properties
•
“Label” textbox—allows you to enter the text that will be shown in the button object.
Styles:
•
“Multiline” checkbox—if selected, allows the button to have more than one line of
text.
•
“Action” dropdown—allows you to determine which action will occur when the form
button is clicked. You can select from None, SNMP Get, and SNMP Set.
The MIB Editor
379
•
“Associated MIB object” dropdown—allows you to select which of the MIB objects
attached to the form will be polled or set when the button is clicked.
Drawing Control Properties
380
•
Shape option buttons—allows you to select from one of the following shapes:
rectangle, rounded rectangle, raised panel, recessed panel, oval, or diamond for the
drawing object.
•
“Rounded Corner Width” spinbox—allows you to set the width of the rounded
corners in a rounded rectangle drawing object; only active if you have selected the
Rounded rectangle option button.
•
“Border Width” spinbox—allows you to set the width, in pixels, of the object’s
border.
•
“Fill Color” dropdown—allows you to set the fill color for the object.
•
“Border Color” dropdown—allows you to set the border color for the object.
•
“Transparent fill” checkbox—if selected, will gray out the Fill Color box and cause
the contents of the drawing box to be transparent, allowing any object on which it is
placed to show through the contents of the box. The border will not be transparent.
Observer Suite: SNMP Management
Enumerated Bitmap Properties
Styles:
•
“Stretch to bounding rectangle” checkbox—if selected, the bitmap will be stretched to
the limits of the rectangular boundary, even if that requires a horizontal or vertical
distortion of the image.
•
“Clip to bounding rectangle” checkbox—if selected, the bitmap will be clipped or
trimmed at its rectangular boundary.
•
“Transparent background (upper-left corner)” checkbox—if selected, the bitmap will
be displayed in the upper left corner of the bitmap object’s rectangular boundary, with
the rest of the rectangular boundary of the bitmap object being transparent.
•
“Display value as label” checkbox—if selected, the value of the expression to be
displayed as the label of the enumerated bitmap.
•
Edit Label button—displays the Configure Bitmap Label dialog. See “Configure
Bitmap Label” on page 382.
•
Arithmetic expression—displays and configures the arithmetic expression that the
enumerated bitmap will represent, as well as the indexes, if any.
•
Set Expression button—displays the Choose Expression dialog. See “Setting an
Expression” on page 375.
•
Enumerated values/ranges—displays and configures the bitmap that will be displayed
in response to values of the selected expression.
•
Edit Values/Ranges button—displays the Edit Ranges/Values dialog. See “Edit
Ranges/Values” on page 383.
The MIB Editor
381
Configure Bitmap Label
Text color:
•
Reverse option button—if selected, the label’s text color will be the reverse of the
background color.
•
Selected option button—if selected, you can choose a text color using the dropdown
box.
•
“Color” dropdown—allows you to select the text color; only active if you have
selected the Selected option button.
Text offset:
382
•
“X” textbox—allows you to set the offset, in pixels from the upper left corner of the
bitmap, where the label will be placed.
•
“Y” textbox—allows you to set the offset, in pixels from the upper left corner of the
bitmap, where the label will be placed. A text offset of X:4 and Y:10, for example,
will begin the label at 4 pixels to the right and ten pixels below the upper left corner of
the bitmap.
•
“Label suffix” textbox—text entered into this edit box will be appended to the
displayed value. For example, if the label suffix is “hours” and the value of the object
is 4, the label will read “4 hours.”
Observer Suite: SNMP Management
Edit Ranges/Values
1.
Click on the <undefined value> line.
2.
Click on the
icon to choose the default bitmap to be displayed.
3.
For each value or range of values you wish to be represented by a different bitmap,
click on the ADD NEW button.
4.
Enter the value or range in the appropriate edit boxes, then click on the
set the bitmap for that range.
icon to
Dial Control Properties
Styles:
•
“Display graph” checkbox—if selected, will enable the display of a histogram graph
below the dial display.
Arithmetic expression:
•
Set Expression button—displays the Choose Expression dialog. See “Setting an
Expression” on page 375.
The MIB Editor
383
Conclusion
The complexities involved in the design and building of custom forms are considerable,
but are more than compensated for by the great amount of control that custom forms give
to both the display of SNMP information and the control of SNMP devices.
By careful form design, it is possible not only to make data more useful to experienced
Observer users, but also to make it possible for users with little technical knowledge to
interact effectively with SNMP devices.
The MIB Walker
Overview
In attempting to configure or reconfigure an SNMP device, it’s often useful to be able to
see what OID values the SNMP device has and to explore the implementation of both
standard MIBs and the SNMP device’s proprietary MIBs.
This is particularly useful when a device uses proprietary OIDs for which
there is no published MIB file or when a published MIB file has an error in it.
By rewriting (and then recompiling) a MIB file to reflect the actual
configuration, you can have more control over the device, even if it is
nonstandard.
The tool that is used to explore the MIB objects and values on a device in SNMP
Management Console is the MIB Walker.
Choose Walk Profile
384
•
“Profile name” textbox—allows you to enter the profile name.
•
“IP Address” textbox—allows you to enter the IP address.
•
“Community” textbox—allows you to enter the community name.
•
“SNMP version” dropdown—allows you to select the SNMP version.
•
“Initial OID” textbox—allows you to enter the initial OID.
•
“Comment” textbox—allows you to enter comments about the walk profile.
Observer Suite: SNMP Management
SNMP MIB Walker
The MIB Walker is accessed by selecting an SNMP device from the SNMP Agents pane
and clicking Tools > SNMP MIB Walker.
1.
To walk an agent MIB, right-click on the desired SNMP Agent in the SNMP Agent
pane and select WALK NETWORK DEVICE MIB.
Selected
agent
Initial
OID
2.
By default, the initial OID for the walk will be 1.3.6.1.4.1. If you prefer to have your
MIB walk begin from another OID, enter it in the “Initial OID” textbox or use the
dropdown arrow if you’ve recently used another starting point. Note that 1.3.6.1.4.1 is
the “root” of the proprietary part of the MIB tree. A walk from 1.3.6.1.4.1 will give you
information on the proprietary OIDs. To get information from the standard OIDs, start
the walk at 1.3.6.1.2.1.
3.
Click the WALK! button to start.
The MIB Walker
385
4.
SNMP Management Console’s MIB Walker will step through all higher branches of
the MIB tree (starting at the initial OID) and display the results in the Walk Network
Device MIB Table Viewer.
Number of
discovered
objects
If in List view,
“View Tree”
will be
displayed
SET VALUE
button
The following buttons are active from the Walk Agent MIB Table Viewer after the walk
has been completed:
386
•
Print button—allows you to send the table to a user-chosen printer.
•
Save List button—allows you to save the table to a user-chosen file.
•
View Tree or View List button—allows you to switch between Tree View and List
View. See “View MIB Tree” on page 387.
•
Identify Nodes button—allows you to identify the walked nodes using a user-chosen
MIB file.
•
Close button—allows you to close the Walk Agent MIB Tree Viewer.
Observer Suite: SNMP Management
View MIB Tree
Selecting the VIEW TREE button from the Walk Agent MIB dialog displays the Walk
Agent MIB Tree Viewer. The Walk Agent MIB Tree Viewer displays the structure,
although not the values, of the discovered MIB tree.
If in Tree view,
“View List”
will be
displayed
SET VALUE
button
Setting Values
One of the main uses of the MIB Walker and the Walk Agent List Viewer is to permit you
to explore the SNMP agent by setting values to see what effect different values have on
the actual device and to be sure that objects are writable.
1.
To set a value, select any object on the Walk Agent List Viewer and click on the SET
VALUE button. The Set Value dialog will be displayed.
Before attempting to make any changes, note the present value, so that you
can restore the device to its original state.
2.
Enter an appropriate real or test value into the Value textbox.
3.
Click the SET VALUE button. SNMP Extension will attempt to set the given OID to
the entered value.
4.
If the attempt to set the value succeeds, the dialog box will be redisplayed with the
Status line reading “Done.”
The MIB Walker
387
Be careful to use the proper type of value when setting the value. If you
attempt to set an integer SNMP value to a character string (e.g., ”Bob”) it will
be set to zero.
5.
If the attempt to set the value fails, an error dialog will be displayed, and the Status
line on the Set Value dialog box will read “Failed” instead of “Done.”
Failure can happen for one or both of two reasons:
•
the MIB object you are attempting to set is read-only and cannot be reset,
and/or
•
you do not have the proper read-write community name for this device.
SNMP Technical Overview
History
Simple Network Management Protocol (SNMP) was proposed in 1988 as a set of
Requests for Comments (RFCs) defining the basic principles and implementation for a
protocol that would establish a standard for Internet monitoring and management, as a
replacement for the myriad of vendor-specific network management solutions available at
the time.
Since then, SNMP has gained considerable popularity. Although it hasn’t replaced all
proprietary solutions, it has become a widely accepted standard for network management.
Subsequent RFCs for SNMP have corrected problems and supplemented the original
standard Management Information Base (MIB).
The standard MIB, defined by RFC1213, defines numerous objects in ten groups—
system, interfaces, address translation, IP, ICMP, TCP, UDP, EGP, transmission, and
SNMP.
However, manufacturers are constantly adding capabilities to their products, and some of
them are not covered by the standard objects and groups. To bring the benefits of SNMP
monitoring and control to additional features, software and hardware vendors have
developed proprietary MIBs.
Most major computer hardware manufacturers now offer lines of networking products that
support SNMP, including network cards, hubs, bridges, routers, switches, and printers.
Because adding an SNMP agent to network hardware often increases the price of the
product, manufacturers usually offer versions with and without SNMP support.
Most operating systems, including UNIX and Microsoft Windows systems, implement
SNMP agents in their architecture.
In early 1990, the original SNMP specifications were revised and updated. New MIB
groups were added and some old MIB objects became obsolete. In general, the new MIB
specification, called MIB II (or MIB-2) is compatible with the original MIB, now called
MIB I.
388
Observer Suite: SNMP Management
By the end of 1991, the standard SNMP MIB specification was extended by the Remote
Network Monitoring MIB (RMON). RMON provides a set of SNMP objects related to
network analysis and monitoring. Information provided by RMON is somewhat different
in scope from the typical SNMP information provided by network devices. Usually, a
device collects information about the device itself, in connection to either operation of the
device or its relationship to the network. The RMON agent, on the other hand, attempts to
collect information about network traffic to and from other devices on the network (aside
from the agent device), including network statistics, history, information about hosts on
the network, connections, and events. An RMON agent can set filters and capture traffic to
and from specific devices on the network.
Security concerns related to SNMP prompted development of a secure SNMP called SSNMP, and the first S-SNMP RFCs appeared in mid-1992. S-SNMP adds security
enhancements to the original SNMP protocol but does not offer any additional
functionality. S-SNMP is not compatible with the original SNMP.
About the same time, a considerable design effort focused on enhancing the SNMP
protocol, incorporating the security features provided by S-SNMP and adding new MIB
functionality. The result of this effort is SNMP Version 2, or SNMPv2.
SMNPv2 was not received enthusiastically by many software and hardware vendors.
Many had devoted considerable effort to the development of SNMP MIB I and MIB II
agents, and in many cases security was not important for users. Most agents currently
provided by vendors are SNMP MIB II, not SNMPv2.
SNMP MIB II with proprietary functionality is currently the defacto standard among
SNMP users. This overview addresses the general principles of SNMP without addressing
the details of SNMPv2.
General Principles
SNMP is designed around the concept of a relationship between a management station and
managed agents.
A management station is the location where a network administrator can view, analyze,
and even manage local network devices. A management station can be a dedicated
computer or workstation, or software running on a general-purpose workstation—like a
personal computer running SNMP Extension on Windows 2000/XP.
An SNMP agent is a program that runs on the managed device. It collects information
about device operation. For example, if the object is a TCP/IP router, the agent can collect
information about network traffic passing through the router and information about the
behavior of the router itself under different load conditions.
The SNMP agent maintains a database called the Management Information Base (MIB).
The agent uses the MIB to track and systematically update data. Information in a MIB is
organized in a tree structure. Each piece of data can be considered a leaf on various
branches of the tree. Individual pieces of data are called data objects.
SNMP Technical Overview
389
When the management station needs information from an SNMP agent, it sends an SNMP
request. SNMP specifications allow the station to ask for more than one MIB object in a
single request.
When the SNMP agent receives the request, it searches its local MIB, finds the current
values of the requested data, forms a response packet (PDU), and sends the PDU back to
the management station.
The management station receives the PDU, decodes it from the SNMP PDU format, and
displays the information as a list or in a graphical format that allows the network manager
to view, analyze, and modify the information.
The following sections review the concepts above in more detail.
SNMP MIB Objects, Groups, and Addresses
A MIB is a set of SNMP objects organized in a tree address structure. Each object in a
MIB has a unique address called an object identifier, and each branch on the tree is
identified by a number. The ISO 8824 specification defines the lower branches of the
SNMP MIB tree as:
iso(1).org(3).dod(6).internet(1) or, as expressed in Structure of Management Information
(SMI) language, 1.3.6.1 (see illustration).
The SNMP tree resides under the Internet subtree. Four branches after the Internet subtree
can be used by SNMP: The directory(1) subtree is reserved for future use by OSI.
•
The mgmt(2) subtree includes standard SNMP MIBs I or II (RFC1156 and
RFC1213).
•
The experimental(3) subtree is reserved for Internet experiments.
•
The private(4) subtree provides space for vendor-specific MIBs. All private MIBs are
located under enterprises(1) branch. Any private object ID (OID) should begin from
the base address 1.3.6.1.4.1.
The address 1.3.6.1.2.1 or iso.org.dod.internet.mgmt.mib represents the address of the
standard SNMP MIB I or II on the ISO tree. Inside the MIB branch, SNMP objects are
organized beneath higher level branches called MIB groups. Because of the large number
of objects—the standard MIB II includes almost two hundred—MIB groups have been
created to simplify addressing. Groups consist of related objects: for example, ICMP, TCP,
EGP, and other statistics object groups.
The object address is the path from the MIB's root to an object. For example, the object
sysDescr in the MIB(1) System Group has the address 1.3.6.1.2.1.1.1 (see illustration).
Types of SNMP MIB Objects
SNMP objects accommodate many different types of data in the tree structure, including
numbers, text, addresses, bitfield assigned descriptions, and object IDs. Two
390
Observer Suite: SNMP Management
specifications are used to describe the MIB objects: Abstract Syntax Notation One
(ASN.1) and Basic Encoding Rules (BER).
Abstract Syntax Notation One (ASN.1)
ASN.1 describes objects in textual MIB descriptions. It describes rules for writing
consistent MIBs that compile without errors, both standard and proprietary. ASN.1
includes basic types such as INTEGER, OCTET STRING, OBJECT, NULL, and
SEQUENCE. For example, the following is a sample of the ASN.1 object sysDescr from
the MIB II System Group:
-—the System group
sysDescr OBJECT-TYPE
SYNTAX OCTET STRING
ACCESS read-only
STATUS mandatory
DESCRIPTION
“A textual description of the entity. This value should include the full name and
version identification of the system's hardware type, software operating-system
[sic], and networking software. It is mandatory that this only contain printable
ASCII characters.”
::= { system 1 }
The sample above shows the singular SNMP object. More precisely, the singular object is
expressed as an OID appended by the 0 address (OID.0). For example, the object sysDescr
in the MIB(1) System Group can be expressed as 1.3.6.1.2.1.1.1.0, signifying that the
object has only one instance. The SNMP Extension OID notation always uses the “.0”
extension for singular objects, to distinguish more clearly between singular and columnar
objects.
In addition to singular objects, ASN.1 also describes the columnar objects: tables or
sequences of objects. A singular SNMP object represents only one value. In the situations
where many data entries exist for a similar type (e.g., the IP routing table), it can be
difficult or impossible to combine these values as singular values (particularly when the
number of the entries is variable). In these situations, data is better represented by list-like
structures or sequences called tables. Each line in a table represents one expression of the
set of objects included in the table. A good example of this is the IP Address Table from
the MIB II:
ipAddrTable OBJECT-TYPE
SYNTAX SEQUENCE OF IpAddrEntry
ACCESS not-accessible
STATUS mandatory
DESCRIPTION
“The table of addressing information
relevant to this entity's IP addresses.”
::= { ip 20 }
SNMP Technical Overview
391
ipAddrEntry OBJECT-TYPE
SYNTAX IpAddrEntry
ACCESS not-accessible
STATUS mandatory
DESCRIPTION
“The addressing information for one of
this entity's IP addresses.”
INDEX { ipAdEntAddr }
::= { ipAddrTable 1 }
IpAddrEntry ::=
SEQUENCE {
ipAdEntAddr
IpAddress,
ipAdEntIfIndex
INTEGER,
ipAdEntNetMask
IpAddress,
ipAdEntBcastAddr
INTEGER
}
Basic Encoding Rules (BER)
BER describes how to convert the values of MIB objects into a format that allows them to
be transferred through a network. The BER specification provides a way to express all
ASN.1 objects in binary format. BER rules are used for object types, object values, and
object IDs. The usual format of a BER-encoded value includes the type field (1 byte),
variable length, and data fields. The consistent format allows multiple objects to be placed
in a single PDU on the transmitting side and decoded on the receiving side.
SNMP Requests
SNMP works by exchanging SNMP requests between a management station and an
SNMP agent. Requests are usually transferred as a data portion of an IP-UDP packet,
although implementations of SNMP exist for TCP, IPX-SPX, and other protocols. For
UDP, the SNMP management station sends requests to the agent over the network to UDP
port number 161. The SNMP message consists of two parts:
•
The SNMP header, including SNMP version number, request size information, and a
password (called a community name).
•
The block of one or more requested objects combined in the PDU.
There are five different PDU types: GetRequest, GetNextRequest, GetResponse,
SetRequest, and Trap. The first four PDUs have the same format. (The Trap PDU has a
somewhat different format and has a different scope of use). The first three fields of the
first four PDUs identify PDU type, PDU size, and error information. These common fields
are followed by a variable bindings field that includes one or more request or reply
objects.
392
Observer Suite: SNMP Management
The GetRequest PDU is used by the management station to retrieve the values of one or
more objects from an agent. These values are usually singular, not columnar. When an
agent receives a GetRequest PDU, it checks the PDU for errors, finds the values
corresponding to the request packets, and sends a GetResponse PDU back to the
management station. If the error in the request packet occurs, the GetResponse PDU
returns an error message instead of the requested data. Errors can occur for the following
reasons:
•
The variable bindings field does not exactly match the available object. In this case,
the GetResponse PDU returns a “noSuchName” error message.
•
The variable is an aggregate type, such as a table object, in which case the return
message is “noSuchName.”
•
The size of the GetResponse PDU would exceed the local protocol stack limitations.
In this case, the error message “tooBig” is returned.
The management station uses the GetNextRequest PDU to retrieve one or more objects
and their values from an agent. Usually these objects are multiple objects residing inside a
table. To retrieve all lines of the table, the management station starts at the beginning of a
table and sends GetNextRequest PDUs until all entries in the table are read. If no error
occurs, the agent returns the GetResponse PDUs on each of the GetNextRequest PDUs.
The SetRequest PDU is used by the management station to modify the value of an object
on the SNMP agent. If no error occurs, the agent sets a new value for the specified object
and returns a GetResponse PDU as a confirmation of the successful operation.
Agents send SNMP traps to the management station as notification regarding predefined
events. The trap PDU has a different format than the other four SNMP messages. On UDP,
traps are sent to port 160 on the management station. Because trap messages can be sent
from many different agents, the header of the trap PDU includes an enterprise OID and
agent address followed by the generic and specific trap types, timestamp, and the variable
bindings field.
There are seven generic trap types:
•
“coldStart”—the SNMP agent device is reinitializing in a way that allows the device
or agent to be reconfigured.
•
“warmStart”—the SNMP agent device is reinitializing in the way that does not allow
the device or agent to be reconfigured.
•
“linkDown”—the SNMP agent detected a failure in the connection link.
•
“linkUp”—the connection link came up.
•
“authenticationFailure”—the SNMP management station did not properly
authenticate with the agent.
•
“egpNeighborLoss”—an EGP peer of the SNMP agent is down.
SNMP Technical Overview
393
•
“enterpriseSpecific” trap—the SNMP agent is notifying the management station
about an event defined by the vendor for the device. The specific trap type provides
more information.
RFCs
The SNMP specification and related matters are defined in the following RFCs:
RFC1089—SNMP over Ethernet
RFC1140—IAB Official Protocol Standards
RFC1147—Tools for Monitoring and Debugging TCP/IP
Internets and Interconnected Devices
RFC1155—Structure and Identification of Management [superseded by RFC1470]
Information for TCP/IP-Based Internets
RFC1156 (H)—Management Information Base Network
Management of TCP/IP-Based Internets
RFC1157—A Simple Network Management Protocol
RFC1158—Management Information Base Network
Management of TCP/IP-Based Internets: MIB-II
RFC1161 (H)—SNMP over OSI
RFC1187—Bulk Table Retrieval with the SNMP
RFC1212—Concise MIB Definitions
RFC1213—Management Information Base for Network Management of TCP/IPbased Internets: MIB-II
RFC1215 (I)—A Convention for Defining Traps for use with the SNMP
RFC1224—Techniques for Managing Asynchronously-Generated Alerts
RFC1270 (I)—SNMP Communication Services
RFC1303 (I)—A Convention for Describing SNMP-based Agents
RFC1470 (I)—A Network Management Tool Catalog
RFC1298—SNMP over IPX
RFC1418—SNMP over OSI
RFC1419—SNMP over IPX
394
Observer Suite: SNMP Management
Observer Suite: Web Reporting
Web Publishing Service is a part of Network Instruments’ Observer Suite, bringing
Observer’s reporting ability to any computer with a standard Web browser.
Introduction to Web Publishing Service
The Observer Suite’s Web Publishing Service allows an administrator, end-user, or
consultant to view network trending data monitored by Observer from any Web browser.
Web Publishing Service works in conjunction with Observer and Observer’s built-in Web
server, permitting you to selectively make trending information available either to
anybody with a Web browser and TCP/IP connectivity to the Observer PC, or to those who
have been provided with a password.
With the Observer Suite’s Web Publishing Service you can:
•
Publish network “Weather Reports” for your corporate intranet/extranet.
•
Provide non-Observer users controlled access to network or WAN baseline data.
•
Access current or historical statistics from any browser, anywhere.
•
See real-time statistics with granularity down to one minute.
•
Provide security levels with administrator-definable access for multiple levels of
protection.
•
Give in-house administrators control over access to sensitive data by outside network
consultants and technicians.
Overview
Observer’s Web Publishing Service adds to the functionality of Observer and expands the
availability of Observer statistics to any platform that supports a Web browser. Network
trending information (and SNMP trending information, if you have SNMP Management
Console), is collected by Observer and reports are dynamically generated on a request-byrequest basis from any browser. Reports can be configured to display data based on time,
station(s), or both. Options include a single day’s data, a range of days, weeks, months, or
even longer. Additionally, reporting can be based on specific stations or servers to get
current or historical usage and usage trends.
Web reporting can be password-protected and content-defined so access to network
trending information is completely controlled by the local administrator. This ability
395
allows an administrator to not only define which reports and statistics should be published
for outside viewing, but also allows the setting of an access password to define who can
access the data.
For example, this flexible security system would allow a local administrator to let an
outside consultant have the ability to view data flow and packet error information without
providing packet capture and decode abilities; thus, protecting any sensitive company data
such as passwords, user names, and accounting information. Another application might be
to let internal network users check for themselves the current network or server utilization
prior to making a call to the help desk with a slow response complaint.
Statistics Available
All statistics are available for single stations or the entire network. Time periods can be
defined to show a single time frame (e.g., minutes, days, weeks) or compare two time
frames. Drill-down is also available for all aggregate displays to find specific station
information for the selected time frame. All statistics are available for Ethernet, Token
Ring, and FDDI, and for every segment tracked by a Probe.
When supplemented with a Probe, Observer can be configured to automatically “harvest”
Probe segment data back to the Observer Web console at administrator- definable time
intervals, making Probe segment data available for your entire network or WAN.
Combining the power of Observer and the accessibility of the World Wide Web, Observer
Web Publishing Service is an ideal addition to any Observer implementation.
Configuring Web Publishing Service
Web Publishing Service has two configuration options. The user may:
•
configure which statistics will be available to browsers on a Probe by Probe basis or
for all Probes, and/or
•
configure password access to view the configured statistics.
Both items are configured in the Web configuration dialog within the Observer console by
selecting Options > Web Reporting Configuration from the main Observer Menu.
Web Reporting Configuration
Set Access to Trending Information Tab
396
Observer Suite: Web Reporting
The Set Access to Trending Information tab lets you specify which statistics will be
available for viewing and whether or not SNMP trending information will be available
over the Web.
The statistics list can be maintained on a Probe-by-Probe basis or for all Probes.
•
Precedence is based on the last value set. For example, if “Network activity
summary” is enabled for “Observer and all Probes,” and then disabled for
“Probe001,” Network activity summary information will be available for all Probes
(including the local, built-in Probe that is part of Observer) except for Probe001.
•
If permissions are enabled for all Probes, the box for “Observer and all Probes” will
be checked against a white background.
•
If permissions are disabled for all Probes, the box for “Observer and all Probes” will
be cleared.
•
If permissions are enabled for some Probes, but not for others, the checkbox for
“Observer and all Probes” will be checked against a gray background.
The following options are available:
•
“Network activity summary” checkbox—if selected, displays who is on the network
and first seen/last seen access times.
•
“Network top talkers” checkbox—if selected, identifies the top users of network
bandwidth. Shows all stations or top XX talkers.
•
“Network packet size distribution” checkbox—if selected, displays packets sizes.
•
“Network protocol distribution” checkbox—if selected, displays the major protocol
usage.
Configuring Web Publishing Service
397
398
•
“Network IP subprotocol distribution” checkbox—if selected, displays the major IP
subprotocol distribution (e.g., TCP, UDP, ICMP, ARP, RARP, IP).
•
“Network IP group protocol distribution” checkbox—if selected, displays the major
Network IP subprotocol distribution.
•
“Network IP applications distribution” checkbox—if selected, displays the IP
applications distribution (e.g., Telnet, POP, HTTP). User-defined applications can be
added.
•
“Network IPX subprotocol distribution” checkbox—if selected, displays major IPX
protocol distribution.
•
“Network errors distribution” checkbox—if selected, displays total network errors
distribution.
•
“Station activity summary” checkbox—if selected, displays network activity broken
down by station.
•
“Station errors distribution” checkbox—if selected, displays network errors displayed
by station.
•
“Router statistics” checkbox—if selected, displays your router’s throughput over
time.
•
“Internet Observer Trending Information” checkbox—if selected, determines whether
or not Internet Observer Trending information will be made available via Web
Extension.
•
“Enable SNMP Trending information over the Web” checkbox—if selected,
determines whether or not SNMP Trending information will be made available via
Web Extension.
Observer Suite: Web Reporting
Web Server Options Tab
The Web Server Options tab contains the following items:
•
“Request password to access Web reporting” checkbox—if selected, allows you to set
a password for accessing the Web Publishing Service facility. If password protection
is on, each user will have to enter a password to gain access to the reporting facility.
If the Web Publishing Service has not been configured to require a
password, all of the trending data enabled during Web Publishing Service
configuration will be available to anyone with TCP/IP connectivity to the
Observer PC.
•
Set password button—only active if the “Request Password to access Web reporting”
checkbox is selected. Clicking on the Set Password button displays the Set Web
Access Password dialog.
•
“Run Web server as Windows 2000/XP service” checkbox—if Web Extension has
been installed on a copy of Observer running under Windows 2000/XP, checking this
box will make the Web server a Windows service, causing it to run whenever the
Observer PC is started.
Changes to the Web server’s status as a service will take place the next time
that the Observer PC is rebooted.
Configuring Web Publishing Service
399
•
“Web server port” textbox—this textbox sets the port that will be used for accessing
the Web server.
Changes to the Web server port will take effect the next time that the
Observer PC is rebooted.
Using Web Publishing Service
To receive maximum benefit from the Web Publishing Service, it is recommended that
you run Observer’s Trending mode at all times to collect a complete view of your
network/WAN’s data flow patterns.
Once you have collected trending data at the local Observer (or at the console for
Distributed Observer), you can view the data using Web Publishing.
For data collected at a Probe site, Observer offers the ability to “harvest” data from remote
Probes at configurable time frames. Please see the “Using Probe” (Probe Setup) section of
the Probe manual for more information on configurable Probe data transfers.
To view Web Publishing data from any Web browser, enter the following URL in your
Web browser:
http://[Observer PC]/Observer/WebExt.htm
substituting either the IP address (e.g., “192.168.0.3”) or DNS name (e.g.,
“jim.impossico.com”) for [Observer PC].
400
Observer Suite: Web Reporting
The Web Publishing Service Welcome page will be displayed.
Whether or not you have configured Web Publishing Service to require a password, the
Web Publishing Service Welcome page will be displayed. If you have configured Web
Publishing Service to require a password, the correct password must be entered in order to
access Web Publishing Service data. If Web Publishing Service has not been configured to
require a password, any or no password will work.
Click on the type of trending you wish to view. You can select from: Network Trending,
Switch Trending, Internet Trending, or SNMP Trending.
Network Trending
Allows you to view Network Trending historical data.
Using Web Publishing Service
401
Home link
Probe list
Logged data
dates
Allows you to set
the report period
Allows you to set
the report items
Click button to
generate report
•
Probe list—lists the Probes (including the built-in, local Probe that is part of
Observer) for which trending data has been collected.
•
“Dates with logged data” chart—displays the dates logged data is available for.
•
“Report period” combo box—allows you to select the report period time. You can
select either: 1 day, 1 week, 2 weeks, 1 month, or custom.
Statistic, Display, and Notes:
402
•
“Network activity summary (traffic and utilization)” checkbox—if selected, the
report will capture a summary of network activity. You can select the data to be
displayed as a chart and/or a table.
•
“Network packet size distribution” checkbox—if selected, the report will capture
network packet size distribution. You can select the data to be displayed as a chart
and/or a table.
•
“Network protocol distribution” checkbox—if selected, the report will capture
network protocol distribution. You can select the data to be displayed as a chart and/or
a table.
•
“Network IP subprotocol distribution” checkbox—if selected, the report will capture
network IP subprotocol distribution. You can select the data to be displayed as a chart
and/or a table.
Observer Suite: Web Reporting
•
“Network IP group protocol distribution” checkbox—if selected, the report will
capture network IP group protocol distribution. You can select the data to be
displayed as a chart and/or a table.
•
“Network IP applications distribution” checkbox—if selected, the report will capture
network IP applications distribution. You can select the data to be displayed as a chart
and/or a table.
•
“Network IPX subprotocol distribution” checkbox—if selected, the report will
capture network IPX subprotocol distribution. You can select the data to be displayed
as a chart and/or a table.
•
“Network errors distribution” checkbox—if selected, the report will capture network
errors distribution. You can select the data to be displayed as a chart and/or a table.
•
“Network top talkers” checkbox—if selected, the report will capture top talkers. You
can select the data to be displayed as a chart and/or a table. You may also select to
show all stations on the network or you may limit the number to a user-specified
number of top talkers.
•
“Station errors distribution” checkbox—if selected, the report will capture station
errors distribution. You can select the data to be displayed as a chart and/or a table.
You may also select to show all stations on the network or you may limit the number
to a user-specified number of error procedures.
•
“Router statistics” checkbox—if selected, the report will capture router statistics. You
can select the data to be displayed as a chart and/or a table.
•
“Transparent chart/pie background” checkbox—if selected, the report chart (if
defined) will have a transparent background.
•
“Enter a note to include in the report” textbox—allows you to enter a note for
inclusion in the report.
Using Web Publishing Service
403
•
Show Report button—generates the report and displays the Trending Report page.
The report has two parts:
•
Contents Section—contains a table of contents of the report, as configured by using
the Statistic checkboxes on the Report Properties page. Each line in the contents
section represents one report item. Each line in the contents section is also a hotlink to
the named item; clicking on it will bring you directly to the item it represents.
•
Report items—contains the actual report items, as configured by using the Statistics
checkboxes on the Report Properties page. Each section also contains an
which is linked to the contents section.
icon,
Reports can contain two types of items: charts and tables. Charts are graphic displays of
the selected information, while tables are numerical or text representations. Most items
can be displayed as either or both.
Switch Trending
Allows you to view Switch Trending data.
404
Observer Suite: Web Reporting
Click the INTERNET TRENDING button on the Web Publishing Service Welcome page to
display the Internet Trending Report Properties page.
•
“Dates with logged data” chart—displays the dates logged data is available for.
•
“Report period” combo box—allows you to select the report period time. You can
select either: 1 day, 1 week, 2 weeks, 1 month, or custom.
Statistic, Display, and Notes:
•
“Switch activity summary (traffic and load)” checkbox—if selected, the report will
capture a summary of switch activity. You can select the data to be displayed as a
chart and/or a table.
•
“Switch packet size distribution” checkbox—if selected, the report will capture
switch packet size distribution. You can select the data to be displayed as a chart
and/or a table.
•
“Switch protocol distribution” checkbox—if selected, the report will capture switch
protocol distribution. You can select the data to be displayed as a chart and/or a table.
•
“Switch IP subprotocol distribution” checkbox—if selected, the report will capture
switch IP subprotocol distribution. You can select the data to be displayed as a chart
and/or a table.
Using Web Publishing Service
405
406
•
“Switch IP group protocol distribution” checkbox—if selected, the report will capture
switch IP group protocol distribution. You can select the data to be displayed as a
chart and/or a table.
•
“Switch IP applications distribution” checkbox—if selected, the report will capture
switch IP applications distribution. You can select the data to be displayed as a chart
and/or a table.
•
“Switch IPX subprotocol distribution” checkbox—if selected, the report will capture
switch IPX subprotocol distribution. You can select the data to be displayed as a chart
and/or a table.
•
“Switch errors distribution” checkbox—if selected, the report will capture network
errors distribution. You can select the data to be displayed as a chart and/or a table.
•
“Switch top talkers” checkbox—if selected, the report will capture top talkers. Data is
displayed as a pie chart only.
•
“Port errors distribution” checkbox—if selected, the report will capture port error
distribution. Data is displayed as a pie chart.
•
“Transparent chart/pie background” checkbox—if selected, the report chart (if
defined) will have a transparent background.
•
“Enter a note to include in the report” textbox—allows you to enter a note for
inclusion in the report.
Observer Suite: Web Reporting
•
Show Report button—generates the report and displays the Trending Report page.
The Switch report is similar to the Network report, with the significant difference in that it
displays trending information for the specific switch, rather than the network as a whole.
Top Talkers, for example, will display the information for the top talkers on the switch,
rather than the monitored network segment.
The report has two parts:
•
Contents Section—contains a table of contents of the report, as configured by using
the Switch Trending Report Properties page. Each line in the contents section
represents one report item. Each line in the contents section is also a hotlink to the
named item; clicking on it will bring you directly to the item it represents.
•
Report Items—contains the actual report items, as configured by using the Switch
Trending Report Properties page. Each section also contains an
hotlinked to the contents section.
icon that is
Internet Trending
Allows you to view Internet Observer trending data.
Using Web Publishing Service
407
Click the INTERNET TRENDING button on the Web Publishing Service Welcome page to
display the Internet Trending Report Properties page.
A listing of days for which Internet trending data is available will be displayed in the date
selection pane. Select the day you wish to see a report for and click on the SHOW REPORT
button to display the Internet Trending Report page.
Bottom
pane tabs
The bottom pane of the report contains three tabs, permitting three different views of
Internet trending information for the selected time period:
408
Observer Suite: Web Reporting
Internet Observer
• Station (by MAC)—the MAC address of the first station in the conversation.
•
Talking to (by IP)—the IP address of the second station in the conversation.
•
Packets Total—total packets sent between the two stations.
•
Bytes Total—total bytes sent between the two stations.
•
Packets ->—packets sent from the first station to the second station.
•
Packets <-—packets sent to the first station from the second station.
•
Bytes ->—bytes sent from the first station to the second station.
•
Bytes<-—bytes sent to the first station from the second station.
IP Pairs (Matrix)
• Station 1—the IP address of the first station in the conversation.
•
Station 2—the IP address of the second station in the conversation.
•
Packets total—total packets sent between the two stations.
•
Bytes total—total bytes sent between the two stations.
•
Packets ->—packets sent from the first station to the second station.
•
Packets <-—packets sent to the first station from the second station.
•
Bytes ->—bytes sent from the first station to the second station.
•
Bytes<-—bytes sent to the first station from the second station.
IP Subprotocols
Displays the packet distribution among IP subprotocols of the station.
Using Web Publishing Service
409
It is possible to select any line or lines in the report. By clicking on either the CONNECTION
DETAILS, the STATION1 DETAILS, or the STATION2 DETAILS button, you can generate a
report in the lower pane, including details for the requested information.
Item detail
report
Selecting one or more lines in either pane and clicking on that pane’s PRINTABLE REPORT
button opens the report in a new browser window, ready to be printed.
Click the PRINT button in the browser window to print the report.
410
Observer Suite: Web Reporting
SNMP Trending
Allows you to view SNMP trending data.
Click the SNMP TRENDING button on the Web Publishing Service Welcome page to
display the SNMP Trending Report Properties page.
•
“Dates with logged data” chart—displays the dates logged data is available for.
•
“Report period” combo box—allows you to select the report period time. You can
select either: 1 day, 1 week, 2 weeks, 1 month, or custom.
•
“Date” calendars—allows you to select the day or dates you would like to run the
report on.
Chart Properties:
•
Plots radio buttons—you can select “averages only” or “averages and ranges.”
•
“Charts” checkbox—you can select if you want to view the reports in a chart format.
•
“Auto-scale” combo box—allows you to select the scale option.
Statistic:
•
“Summary table” checkbox—if selected, the report will capture a summary of SNMP.
The data will be displayed as a table. You can select to display all items or only
selected items using the radio buttons in the “Notes” column.
Using Web Publishing Service
411
•
“Average in time intervals” checkbox—if selected, the report will capture the average
in time intervals you have selected in the “Averaging for tables” combo box. You can
select the data to be displayed as a chart and/or a table. You may also select to display
all items or only selected items using the radio buttons in the “Notes” column.
•
“Enter a note to include in the report” textbox—allows you to enter a note for
inclusion in the report.
•
Show Report button—generates the report and displays the Trending Report page.
•
Export in XML button—exports the report to XML.
The report has two parts:
•
Summary Section—contains a tabular summary of the report. Each item in the
summary table section represents one report item, and is also hotlinked to the chart or
table that it represents. Clicking on the item will bring you directly to the chart or
table it represents.
•
Report Items—contains the actual chart or table report items, as configured with the
Report Properties button. Each section also contains a
to the contents section. Clicking on the
section.
412
Observer Suite: Web Reporting
icon, which is hotlinked
icon will bring you back to the summary
Creating Comparison Reports
The procedure for creating comparison reports is identical to that for creating summary
reports with one difference: instead of choosing one time range for summary, you choose
two ranges to compare to each other.
Creating Comparison Reports
413
414
Observer Suite: Web Reporting
Observer Suite: RMON Console
RMON Console is a part of Network Instruments’ Observer Suite bringing the RMON
(Remote Monitoring) standard to the Observer console.
Introduction to the RMON Console
Observer Suite’s RMON Console allows you to view any RMON1/2 Probe’s RMON data
from within the Observer interface. The RMON data can be viewed in familiar Observer
mode formats or in a pure RMON1/2 table format.
Viewing RMON data in Observer’s familiar mode format lets you see your Probe’s data
without trying to decipher the complexity of the different RMON variables and RMON
variable formats. Note that not all Observer modes are available using RMON because of
the standards-based nature of the RMON data.
If the RMON Request for Comments (RFCs) do not provide a specific metric for
Observer, then it cannot be displayed. Notes on what standard Observer mode metrics are
missing can be found later in this section. See “RMON Modes” on page 416.
If you need to view all RMON variables in their native format, the RMON table provides a
complete RMON data listing.
With Observer and the RMON Extension you can:
•
View any RMON1/2 Probe’s data from within the Observer interface.
•
Manage any RMON enabled device from within Observer.
Using the RMON Console
Once Observer Suite has been activated (by entering the appropriate license numbers),
Observer is ready to make a connection to an RMON Probe.
Connecting to a Probe
Unlike using an Advanced Observer Probe, when using RMON Probes, the Observer
console must initiate a connection to the Probe.
A number of parameters are required to initiate the connection. Start by selecting Actions
> Add RMON Probe from Observer’s main menu. This will display the RMON Probe
Configuration dialog. To initiate a connection, you must enter an IP address of the
415
RMON Probe and modify the read and write community string (if necessary). Once this
information is entered, click on the OK button.
RMON Console Configuration Options
See “Adding/Configuring an RMON Probe” on page 263.
RMON Modes
Once a connection to an RMON Probe is made, you can view the RMON Probe’s data in a
number of familiar Observer formats. The Observer modes that are supported for RMON
Probes are:
•
Packet Capture
•
Packet View (Decode)
•
Bandwidth Utilization
•
Utilization History
•
Utilization Thermometer
•
Network Activity Display
•
Vital Signs
•
Top Talkers
•
Pair Statistics (Matrix)
•
Web Observer
•
Router Observer
•
Protocol Statistics
•
IP Subprotocols
•
IPX Subprotocols
•
Discover Network Names
•
Triggers and Alarms
Most RMON modes are identical to their Observer Advanced Probe counterparts. For all
modes, subtractions, additions, and notes (if any) follow.
Packet Capture Mode
416
•
Comparative Standard Observer Mode Functionality: Identical
•
RMON Limitations: Filters are subject to your Probe’s ability to create offsets;
dropped packets are not shown. When transferring packet buffers from the RMON
Probe to Observer, the buffer is transferred one packet at a time (as per the RMON
Observer Suite: RMON Console
standard). Filtering by layer 3 IP address is not supported by the RMON standard. See
“Filter Setup for Selected Probe” on page 219.
Packet View (Decode)
•
Comparative Standard Observer Mode Functionality: Identical
•
RMON Limitations: Live decodes are not supported. Buffer transfers will be much
slower than using an Advanced Probe. RMON does not allow block packet transfers.
Bandwidth Utilization Mode
•
Comparative Standard Observer Mode Functionality: Identical
•
RMON Limitations: None
Utilization History Mode
•
Comparative Standard Observer Mode Functionality: Identical
•
RMON Limitations: None
Utilization Thermometer
•
Comparative Standard Observer Mode Functionality: Identical
•
RMON Limitations: None
Network Activity Display Mode
•
Comparative Standard Observer Mode Functionality: Identical
•
RMON Limitations: None
Network Vital Signs Mode
•
Comparative Standard Observer Mode Functionality: Similar
•
RMON Limitations: Collisions and the Collision Expert are not supported.
•
Notes: The collection of errors for any Probe is limited to the completeness and
accuracy of the error tracking on the Probe. Observer’s RMON Console simply
reports what is found on the RMON Probe.
Top Talkers Statistics Mode
•
Comparative Standard Observer Mode Functionality: Identical
•
RMON Limitations: None
Pair Statistics (Matrix) Mode
•
Comparative Standard Observer Mode Functionality: Similar
•
RMON Limitations: Pair latencies are not calculated.
RMON Modes
417
Web Observer Mode
•
Comparative Standard Observer Mode Functionality: Similar
•
RMON Limitations: No ping test is available in RMON.
Router Observer Mode
•
Comparative Standard Observer Mode Functionality: Identical
•
RMON Limitations: None
Protocol Distribution Mode
•
Comparative Standard Observer Mode Functionality: Identical
•
RMON Limitations: None
IP Subprotocols
•
Comparative Standard Observer Mode Functionality: Identical
•
RMON Limitations: None
IPX Subprotocols
•
Comparative Standard Observer Mode Functionality: Identical
•
RMON Limitations: None
Discover Network Names Mode
•
Comparative Standard Observer Mode Functionality: Similar
•
RMON Limitations: No IPX or Microsoft discovery is available.
•
Notes: Discover Network Names active discovery works in a slightly different
manner in RMON mode. The active process is split between the Observer console
and the RMON Probe. Initially, the Observer console pings the address range set in
the discovery setup. The Probe then collects the response packets and stores them on
the address list. Passive discovery is identical.
Triggers and Alarms Mode
•
Comparative Standard Observer Mode Functionality: Only standard RMON RFC
Statistics Group items are triggered on. These include:
For Ethernet
Packet Size 64 Byte Packets
Packet Size 65-127 Byte Packets
Packet Size 128-255 Byte Packets
Packet Size 256-511 Byte Packets
Packet Size 512-1023 Byte Packets
418
Observer Suite: RMON Console
Packet Size 1024-1518 Byte Packets
Broadcast Packets
Bytes
Collisions
CRC & Alignment Errors
Fragments
Jabbers
Multicast Packets
Occurrence of Hardware Address
Oversized Packets
Packets
Sequence of Bytes at an Offset
Undersized Packets
For Token Ring
Packet Size 18-63 Byte Packets
Packet Size 64-127 Byte Packets
Packet Size 128-255 Byte Packets
Packet Size 256-511 Byte Packets
Packet Size 512-1023 Byte Packets
Packet Size 1024-2047 Byte Packets
Packet Size 2048-4095 Byte Packets
Packet Size 4096-8191 Byte Packets
Packet Size 8192-18000 Byte Packets
Packet Size >18000 Byte Packets
Abort Errors
AC Errors
Beacon Events
Beacon Packets
Beacon Time
Burst Errors
Claim Token Events
Claim Token Packets
Congestion Errors
Data Broadcast Packets
Data Bytes
Data Multicast Packets
Data Packets
Frame Copied Errors
Frequency Errors
Internal Errors
Line Errors
Lost Frame Errors
MAC Bytes
MAC Packets
RMON Modes
419
NAUN Changes
Occurrence of Hardware Address
Ring Poll Events
Ring Purge Events
Ring Purge Packets
Sequence of Bytes at an Offset
Soft Error Reports
Token Errors
•
Actions are identical to Observer’s standard actions.
•
RMON Limitations: Only statistics kept in the statistics group (RMON1 Group 1) are
triggered upon.
•
Notes: The following information on each statistics group 1 item is taken directly
from the RMON1 MIB. Each vendor’s RMON implementation should follow the
described metric for each item. RMON timing for any trigger that tracks a time
interval is 1/100th of a second. Additionally, each trigger (except the Occurrence of a
hardware address and the Sequence of bytes at an offset) allows configuration to
trigger on either a specific value floor or ceiling, a floor or ceiling value per second,
or a floor or ceiling delta between sampling periods.
RMON Ethernet Triggers
Packet Size 64 Byte Packets
The number of packets (including bad packets) received that were 64 octets in length
(excluding framing bits, but including FCS octets).
Packet Size 65-127 Byte Packets
The number of packets (including bad packets) received that were between 65 and 127
octets in length inclusive (excluding framing bits, but including FCS octets).
Packet Size 128-255 Byte Packets
The number of packets (including bad packets) received that were between 128 and 255
octets in length inclusive (excluding framing bits, but including FCS octets).
Packet Size 256-511 Byte Packets
The number of packets (including bad packets) received that were between 256 and 511
octets in length inclusive (excluding framing bits, but including FCS octets).
Packet Size 512-1023 Byte Packets
The number of packets (including bad packets) received that were between 512 and 1023
octets in length inclusive (excluding framing bits, but including FCS octets).
420
Observer Suite: RMON Console
Packet Size 1024-1518 Byte Packets
The number of packets (including bad packets) received that were between 1024 and 1518
octets in length inclusive (excluding framing bits, but including FCS octets).
Broadcast Packets
The number of good packets received that were directed to the broadcast address. Note
that this does not include multicast packets.
Bytes
The number of octets (1 octet = 1 byte) of data (including those in bad packets) received
on the network (excluding framing bits, but including FCS octets). This trigger can be
used as a reasonable estimate of Ethernet utilization.
Setting up an RMON Utilization Trigger
In the Actions dialog, select a “Sampling Interval” that reflects the amount of time (in
seconds) that you would like to average data over. For example, a Sampling Interval of
one second will track the network traffic for one second prior to comparing the upper and
lower thresholds. Set the value for lower threshold to 1 byte less than the upper threshold.
Use the following values for the upper threshold with the following utilizations:
10-Mbit Ethernet:
10%
125000
20%
250000
30%
375000
40%
500000
50%
625000
60%
750000
70%
875000
80%
1000000
90%
1125000
100%
1250000
100-Mbit Ethernet:
10%
12500000
20%
25000000
RMON Modes
421
30%
37500000
40%
50000000
50%
62500000
60%
75000000
70%
87500000
80%
100000000
90%
112500000
100%
125000000
Note: The RMON standard does not consider an event to happen unless
both Upper and Lower Thresholds have been crossed.
Collisions
Collisions show the best estimate of the number of collisions on this Ethernet segment.
The value returned will depend on the location of the RMON Probe. Section 8.2.1.3
(10BASE-5) and section 10.3.1.3 (10BASE-2) of IEEE standard 802.3 states that a station
must detect a collision, in the receive mode, if three or more stations are transmitting
simultaneously. A repeater port must detect a collision when two or more stations are
transmitting simultaneously. Thus, a Probe placed on a repeater port could record more
collisions than a Probe connected to a station on the same segment would.
Probe location plays a much smaller role when considering 10BASE-T. 14.2.1.4
(10BASE-T) of IEEE standard 802.3 defines a collision as the simultaneous presence of
signals on the DO and RD circuits (transmitting and receiving at the same time). A
10BASE-T station can only detect collisions when it is transmitting. Thus, Probes placed
on a station and a repeater, should report the same number of collisions.
Note: An RMON Probe inside a repeater should ideally report collisions
between the repeater and one or more other hosts (transmit collisions as
defined by IEEE 802.3k), plus receiver collisions observed on any coax
segments to which the repeater is connected.
CRC & Alignment Errors
The number of packets received that had a length (excluding framing bits, but including
FCS octets) of between 64 and 1518 octets, inclusive, but had either a bad Frame Check
Sequence (FCS) with an integral number of octets (FCS Error) or a bad FCS with a nonintegral number of octets (Alignment Error).
Fragments
The number of packets received that were less than 64 octets in length (excluding framing
bits, but including FCS octets) and had either a bad Frame Check Sequence (FCS) with an
422
Observer Suite: RMON Console
integral number of octets (FCS Error) or a bad FCS with a non-integral number of octets
(Alignment Error).
Note: It is entirely normal for etherStatsFragments to increment. This is
because it counts both runts (which are normal occurrences due to
collisions) and noise hits.
Jabbers
The number of packets received that were longer than 1518 octets (excluding framing bits,
but including FCS octets), and had either a bad Frame Check Sequence (FCS) with an
integral number of octets (FCS Error) or a bad FCS with a non-integral number of octets
(Alignment Error).
Note: This definition of jabber is different than the definition in IEEE-802.3
section 8.2.1.5 (10BASE5) and section 10.3.1.4 (10BASE2). These
documents define jabber as the condition where any packet exceeds 20 ms.
The allowed range to detect jabber is between 20 ms and 150 ms.
Multicast Packets
The number of good packets received that were directed to a multicast address. Note that
this number does not include packets directed to the broadcast address.
Occurrence of Hardware Address
The occurrence of a hardware address specified in the Actions dialog. The addresses are
listed from the local or remote address table. This table can be viewed or edited in either
the “Discover Network Names” mode dialog, or the “Filter” dialog.
Note: This trigger is only available using Network Instruments’ RMON2
Probe.
Oversized Packets
The number of packets received that were longer than 1518 octets (excluding framing bits,
but including FCS octets) and were otherwise well formed.
Packets
The number of packets (including bad packets, broadcast packets, and multicast packets)
received.
Sequence of Bytes at an Offset
The occurrence of a sequence of bytes at a specified offset. The format of the offset is a
decimal number representing the number of bytes “offset” or from the beginning of a
packet. The bytes defined must be defined in hex with a space between each set of
characters.
RMON Modes
423
For example, if you define an offset-sequencing trigger to look for telnet packets (i.e.,
looking for TCP port 23), the offset would be 34 —14 bytes of Ethernet heading + 20 more
bytes of IP header, and the sequence would be 00 17 — port 23 in hex.
See the section on active highlighting (in the Packet View sections of the manual) for help
on creating offsets.
Note: This trigger is only available using Network Instruments’ RMON2
Probe.
Undersized Packets
The number of packets received that were less than 64 octets long (excluding framing bits,
but including FCS octets) and were otherwise well formed.
RMON Token Ring Triggers
Packet Size 18-63 Byte Packets
The number of good non-MAC frames received that were between 18 and 63 octets in
length inclusive, excluding framing bits, but including FCS octets.
Packet Size 64-127 Byte Packets
The number of good non-MAC frames received that were between 64 and 127 octets in
length inclusive, excluding framing bits, but including FCS octets.
Packet Size 128-255 Byte Packets
The number of good non-MAC frames received that were between 128 and 255 octets in
length inclusive, excluding framing bits, but including FCS octets.
Packet Size 256-511 Byte Packets
The number of good non-MAC frames received that were between 256 and 511 octets in
length inclusive, excluding framing bits, but including FCS octets.
Packet Size 512-1023 Byte Packets
The number of good non-MAC frames received that were between 512 and 1023 octets in
length inclusive, excluding framing bits, but including FCS octets.
Packet Size 1024-2047 Byte Packets
The number of good non-MAC frames received that were between 1024 and 2047 octets
in length inclusive, excluding framing bits, but including FCS octets.
Packet Size 2048-4095 Byte Packets
The number of good non-MAC frames received that were between 2048 and 4095 octets
in length inclusive, excluding framing bits, but including FCS octets.
424
Observer Suite: RMON Console
Packet Size 4096-8191 Byte Packets
The number of good non-MAC frames received that were between 4096 and 8191 octets
in length inclusive, excluding framing bits, but including FCS octets.
Packet Size 8192-18000 Byte Packets
The number of good non-MAC frames received that were between 8192 and 18000 octets
in length inclusive, excluding framing bits, but including FCS octets.
Packet Size >18000 Byte Packets
The number of good non-MAC frames received that were greater than 18000 octets in
length, excluding framing bits, but including FCS octets.
Abort Errors
The number of abort delimiters reported in error reporting packets detected by the Probe.
AC Errors
The number of AC (Address Copied) errors reported in error reporting packets detected by
the Probe.
Beacon Events
The number of times that the ring enters a beaconing state (beaconFrameStreamingState,
beaconBitStreamingState, beaconSetRecoveryModeState, or beaconRingSignalLossState)
from a non-beaconing state. Note that a change of the source address of the beacon packet
does not constitute a new beacon event.
Beacon Packets
The number of beacon MAC packets detected by the Probe.
Beacon Time
The amount of time that the ring has been in the beaconing state. The time interval
recorded is in 1/100 of a second.
Burst Errors
The number of burst errors reported in error reporting packets detected by the Probe.
Claim Token Events
The number of times that the ring enters the claim token state from normal ring state or
ring purge state. The claim token state that comes in response to a beacon state is not
counted.
RMON Modes
425
Claim Token Packets
The number of claim token MAC packets detected by the Probe.
Congestion Errors
The number of receive congestion errors reported in error reporting packets detected by
the Probe.
Data Broadcast Packets
The number of good non-MAC frames received that were directed to an LLC broadcast
address (0xFFFFFFFFFFFF or 0xC000FFFFFFFF).
Data Bytes
The number of bytes of data in good frames received on the network (excluding framing
bits but including FCS octets) in non-MAC packets.
Data Multicast Packets
The number of good non-MAC frames received that were directed to a local or global
multicast or functional address. Note that this number does not include packets directed to
the broadcast address.
Data Packets
The number of non-MAC packets in good frames received on the network.
Frame Copied Errors
The number of frame copied errors reported in error reporting packets detected by the
Probe.
Frequency Errors
The number of frequency errors reported in error reporting packets detected by the Probe.
Internal Errors
The number of adapter internal errors reported in error reporting packets detected by the
Probe.
Line Errors
The number of line errors reported in error reporting packets detected by the Probe.
Lost Frame Errors
The number of lost frame errors reported in error reporting packets detected by the Probe.
426
Observer Suite: RMON Console
MAC Bytes
The number of octets (bytes) of data in MAC packets (excluding those that were not good
frames) received on the network (excluding framing bits, but including FCS octets).
MAC Packets
The number of MAC packets (excluding packets that were not good frames) received.
NAUN Changes
The total number of NAUN changes detected by the Probe.
Occurrence of Hardware Address
The occurrence of a hardware address specified in the Actions dialog. The addresses are
listed from the local or remote address table. This table can be viewed or edited in either
the “Discover Network Names” mode dialog, or the “Filter” dialog.
Note: This trigger is only available using Network Instruments’ RMON2
Probe.
Ring Poll Events
The number of ring poll events detected by the Probe (i.e., the number of ring polls
initiated by the active monitor that were detected).
Ring Purge Events
The number of times that the ring enters the ring purge state from normal ring state. The
ring purge state that comes in response to the claim token or beacon state is not counted.
Ring Purge Packets
The number of ring purge MAC packets detected by the Probe.
Sequence of Bytes at an Offset
The occurrence of a sequence of bytes at a specified offset. The format of the offset is a
decimal number representing the number of bytes “offset” or from the beginning of a
packet. The bytes defined must be defined in hex with a space between each set of
characters.
For example, if you define an offset-sequencing trigger to look for telnet packets (i.e.,
looking for TCP port 23), the offset would be 42 if no Token Ring source routing
information is in the packet, and the sequence would be 00 17 — port 23 in hex.
See the section on active highlighting (in the Packet View sections of the manual) for help
on creating offsets.
•
Note: This trigger will only be available using Network Instruments’ RMON2 Probe.
RMON Modes
427
Soft Error Reports
The number of soft error report frames detected by the Probe.
Token Errors
The number of token errors reported in error reporting packets detected by the Probe.
RMON Table
The RMON table is provided for viewing raw RMON data exactly as it is stored on the
RMON Probe. Most tables and indices are not directly useful in this view. These values
are most likely to be used for verification or troubleshooting purposes. Each of the 19
RMON1/2 groups are available.
428
Observer Suite: RMON Console
DICOM Extension
Introduction to DICOM
The Informationstechnische Dienstleistung division of Siemens AG in Germany has
developed, in cooperation with Network Instruments, a DICOM Extension for Observer.
This Console decodes and analyzes the interaction procedures for medical/technical
equipment which utilizes DICOM (Digital Imaging and Communications in Medicine
standard).
The DICOM standard is a specification for packet structure, as well as a communication
definition for exchanging data between medical equipment. DICOM relies on industry
standard network connections (TCP/IP) and is an efficient method for communicating
digital images from diagnostic devices to display systems. DICOM is used for CT and MR
including: Nuclear Medicine, Ultrasound, Computed Radiography, Digitized Film, Video
Capture, HIS/RIS information, and connections between networked hardcopy output
devices.
The DICOM protocol was developed through a joint effort between potential users and the
companies that manufacture medical imaging equipment. The development of a decoder
module for a protocol analyzer based on a standard Microsoft platform (PC or notebook)
targets the need for a technician to carry an affordable, portable DICOM diagnostic tool.
Observer’s ease of use, and the addition of DICOM decoding, provides a quick and
efficient troubleshooting tool that technicians can utilize to pinpoint malfunctions in
networked medical environments.
Networks may have many problems and/or configuration issues which can cause
downtime, some of which may be DICOM-related problems. New network installations or
network additions in such environments often produce system malfunctions and hardware
mismatches. These malfunctions can be due to ongoing network traffic problems or even
incompatible systems from different vendors causing communication failures. Observer
DICOM provides a technician or administrator with an inexpensive tool that covers both
general (network) and specific (DICOM) troubleshooting demands—getting your network
back up and running as fast as possible.
Functionality
Observer’s DICOM Protocol Decode and Packet View is shown in three ways:
•
Raw Data TCP Packets—the DICOM data within the TCP packets is displayed in
hexadecimal.
429
•
PDUs of DICOM Upper Layer Protocol—Observer’s Packet Summary window
shows captured PDUs of DICOM Upper Layer Protocol in order of appearance.
Selected PDUs can then be decoded and displayed.
•
DICOM Messages—command and data messages are sorted, and selected messages
are decoded and displayed. Because the raw data and the decode are displayed
simultaneously, they can be compared line by line.
Decode
•
DICOM Upper Layer and DICOM Messages are decoded. Decode of private data
elements is also possible through a user-defined text file.
Error Display
•
Type check of single data elements.
Licensing
Observer DICOM is licensed for one PC (or one laptop) on one network at one site. If
Observer DICOM is to be loaded on a laptop, a separate license for each laptop is
required.
You may upgrade an existing copy of Observer or Distributed Observer to Observer
DICOM (or Distributed Observer DICOM) by obtaining DICOM-specific activation
numbers from Network Instruments or your Network Instruments’ distributor or dealer.
The DICOM upgrade Console is a “for charge” upgrade. Pricing depends on the
geographical area you are located in—please contact Network Instruments for specific
pricing information regarding the DICOM Extension.
Capturing Data in Observer’s DICOM Extension
Observer DICOM obtains its (DICOM) data from Observer’s Packet Capture buffer. All
the packets that have been captured in Observer can also be transferred to Observer
DICOM mode. Observer DICOM mode filters the data with a DICOM post-filter that is
configured in Address Filter Setup. See “Capture in the Packet Capture Window” on
page 430. This filtering ensures that the DICOM communication is always apparent.
Data can be captured in three different ways:
•
Capture in the packet capture window.
•
Capture in the Observer DICOM window.
•
Importing a capture buffer.
Capture in the Packet Capture Window
The following steps are necessary:
430
DICOM Extension
1.
Start Observer.
2.
Open the Packet Capture window by selecting Capture > Packet Capture. This
view shows you whether or not all the packets have been captured, how full the
capture buffer is at any given time, and whether any low-level communication errors
have occurred (depending on the NIC).
3.
Check, and if necessary, alter the setups (i.e., pre-filter, buffer size) by clicking on the
SETUP icon.
4.
To begin the capture, select Mode Commands > Start Mode or click on the START
icon.
5.
As soon as you have acquired a sufficient number of captures, select Mode
Commands > Stop or click on the STOP icon to stop the capture process.
If the IP addresses of the communication partners are unknown or if you want to derive
them automatically from a TCP packet:
1.
Change to the Observer Standard Decode view in Mode Commands > View or click
on the VIEW icon.
2.
Mark a TCP packet belonging to the communication you want to decode.
3.
Select Mode Commands > Automatic DICOM Address Pair Setup to set the
addresses and ports of the communication partners for the DICOM post-filter
automatically.
4.
Click on the OK button.
5.
You can now change to the DICOM window with Mode Commands > Start
DICOM Decode or click on the DECODE icon.
If the IP addresses are known:
1. Select Mode Commands > Start DICOM Decode.
Capturing Data in Observer’s DICOM Extension
431
2.
Select Mode Commands > Select IP Address Pair to open the DICOM Address
Filter Setup dialog.
3.
Enter the source IP address, the destination IP address, and the ports.
4.
Click the OK button.
Capture in the Observer DICOM Window
Only DICOM data that has already passed through the DICOM filter is displayed in this
window. All the communication packets that pass through a pre-filter (assuming one is
active) are acquired in the capture buffer, regardless of whether or not they contain any
DICOM data.
The following steps are necessary:
1. Start Observer.
2.
Select Start Modes > Packet Capture.
3.
Check, and if necessary, alter the setups (i.e., pre-filter, buffer size) by clicking on the
SETUP icon.
4.
Select Mode Commands > Start DICOM Decode.
5.
Select Mode Commands > Select IP Address Pair.
6.
Enter the source IP address and the destination IP address. Set the destination port to
0 and specify the known port as the source port.
7.
Select Mode Commands > Start Mode. You can now follow the setup procedure
for your DICOM communication online.
8.
As soon as you have acquired enough data, select Mode Commands > Stop to stop
the capture process.
Importing a Capture Buffer
The capture file must be available in a format that is supported by Observer (i.e., Observer
bar or Sniffer format).
The following steps are necessary:
1. Start Observer.
2.
432
DICOM Extension
Select File > Load and Analyze Observer Capture Buffer.
3.
Select a *.BFR file.
4.
Confirm your selection with “Open.”
If the IP addresses of the communication partners are unknown or if you want to derive
them automatically from a TCP packet:
1. Change to the Observer Standard Decode view in Mode Commands >
View.
2.
Mark a TCP packet belonging to the communication you want to decode.
3.
Select Mode Commands > Automatic DICOM Address Pair Filter Setup to set the
addresses and ports of the communication partners for the DICOM post-filter
automatically.
4.
You can now change to the DICOM window with Mode Commands > Start
DICOM Decode.
If the IP addresses are known:
1. Select Mode Commands > Start DICOM Decode.
2.
Select Mode Commands > Select IP Address Pair to open the DICOM Address
Filter Setup window.
3.
Enter the source IP address, the destination IP address, and the ports.
DICOM Extension Decode Window
The DICOM window contains its own Mode Menu, similar to that of Observer itself. This
menu contains all of the actions that can be selected in DICOM mode. The button bar on
the left edge of the window offers exactly the same functionality, as well as explaining the
meanings of the buttons.
The first three entries (Start Mode, Stop, and Clear) are linked to the Packet Capture and
Decode windows of Observer (i.e., if you select one of these entries in either of these
windows, the action is also effective in the other window).
Observer DICOM Address Filter Setup (Select IP Address Pair)
You must enter the communication partners whose DICOM communications you want to
decode in this menu. They can be generated automatically in the Observer Decode
window by marking a TCP packet for DICOM communication and then selecting Mode
Commands > Automatic DICOM Address Pair Setup.
If you set the destination port to 0, this port is ignored. The specified source port is
compared with the source and destination ports for the packets in the Observer buffer and
processed if they match.
DICOM Extension Decode Window
433
Evaluating Data in Observer’s DICOM Extension
In order to be able to represent and evaluate a DICOM communication, the data must be
captured in Observer DICOM.
After you have captured the data, you will see either the DICOM Upper Layer Protocol
View or the DICOM Message View. You can toggle between these two views at any time
either in Mode Commands or by using the button bar on the left edge of the screen.
Both of the views have a button bar (Mode Commands) on the left, a combined
navigation/information bar at the top, and three superimposed output windows with a
freely definable size.
You can toggle between the two views (DICOM Upper Layer Protocol View and DICOM
Message View) by clicking on the appropriate buttons in the button bar, which also
contains buttons for the other functions in the Mode Commands (see description of the
functions in the Observer DICOM window above).
The left part of the combined navigation/information bar contains icons for navigating
between the different packets (first packet, last packet, up/down 100 packets, up/down one
screen, up/down one packet). The right part shows the total number of packets available
for decoding, the IP source address, the IP destination address and the TCP ports used for
DICOM in your communication. Your current position in the communication packet
relative to the start (start = 0) is indicated on the far right.
The top output window contains a list of your communication packets, with details of the
packet number (Pkt), the communication direction (Direction), the packet type (Type),
additional information (Information) and the packet size in bytes (Size). The packet,
which is selected in the top output window (shown on a colored background), is displayed
in its decoded form in the middle window. Lines marked with a + can be expanded
(position the mouse pointer on the + and press the left mouse button), while lines marked
with a - cannot. The bottom output window contains a hexadecimal view of the packet,
which is selected in the top window. The bytes corresponding to the line that is selected in
the middle output window (colored background) are also highlighted in the bottom
window. The three output windows thus offer the following information for evaluation
(from top to bottom):
(top) DICOM packets
(middle) decoded DICOM information
(bottom) raw DICOM data
DICOM Data Dictionary Extensions
To extend the Data Dictionary, simply open the file <Observer-program-folder>\Data.dic
using any text editor, e.g., Notepad.exe.
Then enter your extensions in accordance with the following syntax:
TAG;DESCRIPTION;VALUE REPRESENTATION;VALUE Multiplicity
434
DICOM Extension
The ‘;’ character acts as a delimiter.
•
Tag—two WORDS separated by a comma
Example: 0008,0016
•
Description—text that is displayed when the data is decoded.
Example: SOP Class UID
•
Value Representation (VR)—how the data field should be interpreted if it is not
specified explicitly.
Example: UI
•
Value Multiplicity (VM)—not evaluated at present. Can be omitted together with the
final delimiter.
Example: 1-n
With Value Multiplicity
0008,0016;SOP Class UID;UI;1
Without Value Multiplicity
0008,0016;SOP Class UID;UI
Important Things to Note
• The maximum permitted line length is 120 characters.
•
All tags that are not listed in the Data.dic file are represented as Unknown Tag.
•
Blank lines are not interpreted.
•
Lines beginning with a # (comment lines) are not interpreted.
•
If a tag is defined more than once, only the first tag in the list is evaluated.
DICOM UID Dictionary Extensions
To extend the UID Dictionary, simply open the file <Observer-program-folder>\Uid.dic
using any text editor, e.g. Notepad.exe.
Then enter your extensions in accordance with the following syntax:
UID;Description
The ‘;’ character acts as a delimiter.
•
UID—Unique identifier, up to 64 characters (the numbers 0 to 9 and the “,” character
are allowed).
Example: 1.2.840.10008.1.1
•
Description—text that is displayed when the data is decoded; all control characters
are ignored (e.g., Tab).
DICOM Extension Decode Window
435
Example: Verification SOP Class
Example: 1.2.840.10008.1.1;Verification SOP Class
Important Things to Note:
• The maximum permitted line length is 200 characters.
•
All UIDs that are not listed in the Uid.dic file are represented as Unknown UID.
•
Blank lines are not interpreted.
•
Lines beginning with a # (comment lines) are not interpreted.
•
If a UID is defined more than once, only the first UID in the list is evaluated.
Troubleshooting DICOM Extension Problems
Errors
Possible Cause
No packets either in DICOM
Message View or in DICOM
Upper Layer Protocol View
•
Invalid station addresses specified
•
Invalid TCP port specified for DICOM
•
Capture started too late (after DICOM
communication set up)
•
Capture Partial Packet set (in Observer Decode
window)
•
Use Circular Packet Buffer activated (in Observer
Decode Window
•
TCP/IP error
•
Capture buffer too small (check in main Packet
Capture window)
•
Packets lost during capture (check in main Packet
Capture window)
•
Decoding interrupted when new connection set up
•
TCP/IP error
Incomplete communication
436
DICOM Extension
Troubleshooting
General Principles
Although most installations of Observer will proceed without any trouble, due to the vast
number of network configurations and PC hardware/software options that Observer
supports, sometimes trouble arises.
If you experience trouble in setting up Observer, keep a number of things in mind.
•
Try to simplify your setup in any way possible. This means if you have a screen saver
loaded, disable it. If you are running some fancy network add on peer-to-peer jet
engine turbo stimulator, remove it. This does not mean that you will not be able to use
Observer with your other products, but if you can determine where the problem is,
you can focus on that piece of the puzzle and you may be well on your way to solving
the problem.
•
Don’t trust anyone or anything. The only way to really know what your hardware
settings are is to have the card or device in one hand and the manual in the other.
Programs that try to discover interrupts and other settings only function properly
when everything is working correctly—exactly when you don’t need them. Don’t
blindly trust other network drivers—they may or may not be reporting the correct
information.
•
Do not, under any circumstances, share interrupts, i/o ports, or memory addresses
between adapters. No matter what has worked before or what might work in the
future, sharing interrupts or memory settings is not a valid configuration.
Troubleshooting Checklist
•
Does your network work without any Observer programs or drivers loaded? If not,
check your network installation instructions. Once your network appears to be
running correctly, try to install Observer again.
•
Try installing Observer on a different PC to see if you experience the same problem.
This does not mean that you will not be able to use Observer on the desired PC. It may
give you some insight into the problem that you are having.
•
Look on the Network Instruments’ Web site under “Support”—your problem may
already be solved and documented.
437
Specific Issues
NDIS
Observer is reporting that your network adapter card does not support promiscuous mode.
•
Contact your network card adapter manufacturer and see if they support promiscuous
mode for the card and driver you own.
•
If you cannot get in touch with the network card manufacturer, try downloading the
latest driver from the network card manufacturer’s Web page. Very often, card
manufacturers do not include promiscuous mode in an initial release of a driver, but
add it in later releases.
ODI
Observer is not “seeing” the packet types that you are interested in.
Check to make sure that you have included the correct FRAME line in your NET.CFG.
Observer is not accepting packets on your network.
•
Are you licensed?
See the “Licensing” section in this manual for information on turning a DEMO
version of Observer into a licensed product. You can tell the state of your license by
clicking on Help > About Observer.
•
Do you have the correct filter(s) set? Check the “Filter” dialog to verify the active
filter set.
When setting up a to/from filter, you should set the address of interest in the left side
of the filter box and ANY_ADDRESS in the right section. Then select “´.“You should
not put the desired address in both sides of the filter.
General
Problems with PCMCIA adapters
If you are running Observer on a laptop with a PCMCIA adapter and things do not seem to
be working correctly, try to run Observer from a standard desktop PC.
If Observer works from the desktop PC and not the laptop, you can assume that the
PCMCIA adapter either does not support promiscuous mode or the drivers claim to
support promiscuous mode but do not.
For both cases, contact the manufacturer of the PCMCIA adapter and ask if they have
drivers that support promiscuous mode.
438
Troubleshooting
Load Driver Could Not Open VMONI1 Service
Observer is telling you that you have not installed the VMON50 Service under Windows.
You will need to follow the instructions for installing Observer.
Problems Licensing Your Product
“My license numbers do not work”
•
Make sure you are licensing the correct version of the product. License numbers are
version specific, and will work within all equal major version numbers of a product.
For example, the license number for Observer 7.0 will work with Observer 7.1, but
not with Observer 8.0. To obtain a license number for a new version, please see the
upgrade policy for that product, or contact Network Instruments or your local
distributor. Note that identification numbers are based on your name and company
name and do not change from product version to version or product to product.
The license number you received is based on the text that you typed in the name and
company fields in the licensing dialog. You must type in your name and company
EXACTLY as you see it printed on the RTU (Right To Use) certificate that was supplied
to you. Each character, each space, each punctuation mark is used to create your customer
identification number. The license number (for your product version) is based on your
identification number
How do I connect Observer to a Probe across a
Firewall?
To connect Observer to a Probe across a firewall, you need to manually configure the
firewall to let Observer use specific ports.
Observer versions 8.0 and greater use ports 25901 and 25903 for all communication
between Observer and an Advanced Probe. Therefore, you must configure the firewall to
allow traffic on these ports. To use an RMON Probe, you must allow traffic on port 161.
Observer versions 7.x and lower used ports 901 and 903 to transfer data and commands
between the Probe and the Observer console. As of version 8.0, ports 901 and 903 are only
used (once) for upgrading version 7.x probes to the current version. It is only necessary to
open up these ports if you have older version Probes on the other side of the firewall that
need to be upgraded.
How do I connect Observer to a Probe across a Firewall?
439
440
Troubleshooting
Observer Suite Custom Decode Kit
Introduction
Observer Suite’s Custom Decode Kit gives an experienced C++ programmer the ability to
add custom, proprietary, or additional protocols to Observer decodes.
The Custom Decode Kit is provided as a Microsoft Development Studio v6.0 C++ project.
This project should be used as an example and template.
The Custom Decode Kit is an add-on for Observer Suite and is not available
with the basic Observer or Real-Time Expert products. To upgrade your
Observer to the Observer Suite, please contact your Network Instruments’
sales representative, dealer, or distributor.
Warranty
The Custom Decode Kit is provided “as is” and without any warranty. Network
Instruments does not give technical support for the Custom Decode kit, instruction in C++
programming, or training on how to use the Custom Decode Kit.
Installation
To install the Custom Decode Kit, run CustomDecodeKit.exe. This will, by default, be
found in the Observer’s Drivers\CustomDecodeKit folder. Specify the location where you
want to install the Custom Decode Kit.
By default, it will install to C:\CustomDecodeKit
Run Microsoft Development Studio and open the CustomDecode project.
How the Custom Decode API Works
The Custom Decode API provides an interface that displays custom decodes in Observer's
decode module. A custom decode is inserted in the protocol decode window (the middle
pane in Observer's Decode and Analysis window).
The purpose of the Custom Decode DLL is to add lines to the Tree Control in Decode and
Analysis.
441
The Custom Decode DLL entry point functions: CustomDecodeFrame(),
CustomDecodeIP(), CustomDecodeUDP(), and CustomDecodeTCP() are called from
Observer to permit a programmer to add a custom decode.
For example, if you decide to write a decode for UDP port 8765, when your
CustomDecodeUDP() function is called, you have to check in the UDP
header whether or not the port is 8765.
If it is, you do your decode, adding lines to the Tree Control in a way similar
to the CustomDecode sample project. When you are finished, you return
TRUE from CustomDecodeUDP().
If the port is not 8765, just return FALSE from CustomDecodeUDP() and
Observer will perform the default processing. See the CustomDecode
sample project code for more details.
Using the Custom Decode Kit
The DLL code can be built using the Microsoft Development Studio C++ compiler. The
DLL entry points are of “extern C” type for maximum compatibility.
You can use any other C or C++ compiler as long as the entry point API
function definitions are preserved intact and the functions are explicitly
exported in a .def file.
A new decode DLL can be renamed to something other than CustomDecode.DLL by
changing the output module name and a LIBRARY name in the CustomDecode.DEF file.
It is necessary to use multiple, distinct names if Observer Suite is going to use multiple
decode DLLs.
Currently, Observer supports up to eight (8) simultaneously loaded custom
decode DLLs.
The code can be written in generic C++ or the programmer can create a DLL project with
MFC support and include in it CustomDecode.cpp, CustomDecode.h, CustomDecode.def,
UserDefinedFunctions.cpp and UserDefinedFunctions.h. In this case, it will be necessary
to name the project something other than CustomDecode and to delete the DllMain()
function code from CustomDecode.cpp file.
Files Included
The CustomDecode project includes the following files:
CustomDecode.cpp, CustomDecode.h, and CustomDecode.def
These files include four entry point functions, defined as follows:
//decode starting at a frame protocol header
extern “C” BOOL FAR PASCAL CustomDecodeFrame
void * pFrameStart,
442
Observer Suite Custom Decode Kit
void * pProtocolFieldStart,
long nProtocolLength,
long nOffsetFromBeginningOfPacket,
long nBitmapLevel,
DWORD dOpenTreeList,
HWND hwndTree,
void * pPrintStruct);
//decode starting after IP protocol header
extern “C” BOOL FAR PASCAL CustomDecodeIP (
void * pIpHeaderStart,
void * pIpDataStart,
long nIpDataLength,
long nOffsetFromBeginningOfPacket,
long nBitmapLevel,
DWORD dOpenTreeList,
HWND hwndTree,
void * pPrintStruct);
//decode starting after UDP protocol header
extern “C” BOOL FAR PASCAL CustomDecodeUDP (
void * pUdpHeaderStart,
void * pUdpDataStart,
long nUdpDataLength,
long nOffsetFromBeginningOfPacket,
long nBitmapLevel,
DWORD dOpenTreeList,
HWND hwndTree,
void * pPrintStruct);
//decode starting after TCP protocol header
extern “C” BOOL FAR PASCAL CustomDecodeTCP (
void * pTcpHeaderStart,
void * pTcpDataStart,
long nTcpDataLength,
long nOffsetFromBeginningOfPacket,
long nBitmapLevel,
DWORD dOpenTreeList,
HWND hwndTree,
void * pPrintStruct);
In addition, the files include helper functions used in the user-defined sections of the code.
UserDefinedFunctions.cpp and UserDefinedFunctions.h
These files include the user code. They contain implementation functions that map all four
functions onto user modifiable functions. They also contain a very simple example decode
in the SimpleDecodeSample() function.
StdAfx.cpp and StdAfx.h
Files Included
443
These are the standard Microsoft Development Studio AFX files.
Only an experienced C++ programmer should modify any of the source files
in the Observer Suite Custom Decode Kit.
Please refer to code comments for explanations about particular functions.
444
Observer Suite Custom Decode Kit
Using Observer from HP OpenView
Overview
All Observer-family analyzers include the tools you need to integrate Observer into
Hewlett-Packard’s OpenView administrative interface. This will allow you to see and
control Observer-equipped PCs from the HP OpenView administrative interface.
For details on how to integrate Observer products with HP OpenView, please see the
HPOV_Integration_Readme.html located in the HPOV_Integration directory which is
located in your Observer install directory.
445
446
Numerics
79327
Heading1
Efficiency History
73
A
Actions 159
Active highlight 39
Add SNMP Device 339
Address Filter 222
Advanced Pager Settings 242
Advanced Probe
port usage 439
aliases
importing 203
importing from text file 203
Application Analysis 192
Average Packet Size 150
B
Bad IP Checksum 151
Bandwidth Utilization 69
Switched 324
Bandwidth Utilization Mode 325–326
Switched ??–326
Broadcasts-Multicasts/Total Packets 151
buffer size calculations and formulas 34, 260
C
capture
buffer, defining maximum 260
capture buffer
advanced saving features 40–41
saving 40
saving in Sniffer format 41
saving range 40
Capture Internet Observer 64
Capture Matrix 61
Capture Protocols 53
Capture Summary 53
Capture Top Talkers 58
Channel setup for wireless analysis 261
Collision Expert 96, 100
Collision Expert Analysis 100
configuration
IP subprotocols 248
Observer General Options 324
Probe properties 257
Configure Observer Probe Instances 249
configuring
pager alarms
dial sequences 236
pager service 236
connection dynamics 269, 297
Customizing the Probe Map 29
D
Decode and Analysis Submode
Capture Attributes 53
Decode View 38
Internet Observer – Internet Patrol View 65
Internet Observer – IP Pairs (Matrix) View 66
Internet Observer View 64
Packet View Button Bar Descriptions 39
Pairs (Matrix) 61
Protocols View 53
Top Talkers View 58
Define Products for Protocol Distribution Statistics
218
DICOM Extension 429–433
capturing
Observer DICOM window 432
Packet Capture window 430
capturing data 430
decode window 433
decoding 430
DICOM data dictionary extensions 434
DICOM UID Dictionary extensions 435
error display 430
evaluating data 434
functionality 429
importing a capture buffer 430, 432
introduction 429
licensing 430
Observer DICOM address filter setup 433
performance 436
system requirements 430
troubleshooting 436
©1994-2002 Network Instruments, LLC
447
Network Instruments Advanced and RMON FrameMaker
uses of DICOM 429
Discover Network Names (Address Book) 197
Discover Network Names Mode 197
Displaying the List of Probes in Map Mode 29
DLCI Address Filter 226
Duplicate IP Addresses 152
E
Edit Probe User Account Dialog 253
Edit Switch Scripts 217
Efficiency History 73
Email Notification Tab 245
End User License Agreement ii
error filter 222
ErrorTrak
drivers 7
ESSID setup for wireless operation 261
Ethernet Frame Errors 152
Ethernet Frame Errors by Station 153
Ethernet Vital Signs and Collision Expert
event log 149
Expert Connection Dynamics 297
Real Time Expert
analysis 297
configuring 283–289, 304
connection dynamics 297
displays 289
events 291
functional overview 281
global settings 283
IP range settings 285
live modeling 300
network settings 275
overview 269
post capture analysis 282–283
real-time analysis 282
server analysis 299
session settings 277
setting defaults 272
TCP/IP settings 286
threshold profiles 271
thresholds (OSI Model) 270
time interval analysis 297
transport settings 276
using 281–283
Voice over IP Expert 303
what-if analysis 300
settings 288
Expert ICMP Events 294
Expert IPX Events 295
Expert NetBIOS Events 296
Expert Server Analysis 299
Expert Summary 290
Expert TCP Events 292
Expert Time Interval Analysis
Expert UDP Events 294
Expert VoIP 303
Expert What If 300
Expert Wireless Events 296
297
F
95
448 Network Instruments Observer Reference Guide
FDDI
beacons 163
Error Count 163
error count 163
Lost Count 163
Network Vital Signs 162
Not Copied 163
Vital Sign display 162
filters 219
firewall configuration 439
firewall, connecting to probes through
G
General Options
SNMP Trending Tab
248
H
H.323 303
Historical Replay 163
historical replay 163
I
ICMP Expert 269
Import Aliases 203
Import/Export Filter Presets 218
Installation for Windows 2000 5
Internet Observer 76
Internet Observer Internet Patrol 78
Dial View 80
439
List View 82
Internet Observer IP Pairs (Matrix) 83
Internet Observer IP Subprotocols View
Internet Patrol 78
IP Discovery Setup 201
IP Subprotocols 67, 86
IP to IP Pairs (Matrix) 83
IPX
discovery 169
IPX Discovery Setup 202
IPX Server Busy 154
86
J
Jitter
303
L
License Agreement ii
license numbers 3, 16
licensing i, 3
Licensing Observer 3
Limited Warranty i–ii
live modeling 300
M
maximum utilization 69
MIB
compiling 355
definition 331
Observer 162
MIB Compiler 355
MIB Editor 352–357, 359, 364–368
MIB Walker 384
MIBs 355
Mode 148
Modifying a Probe Map Item 31
modifying a Probe map item 30
Msft (Microsoft) Configuration 203
Multiple Address Tables 204
Multiple Filters 231
N
NET.CFG 438
Network Activity Display 88
Network Activity Display Mode
Dial View 88
Graph View 90
List View 92
Network Device Properties - Description Tab 339
Network Device Properties - Notification Tab 341
Network Errors by Station 93
Network Errors by Station Mode
Graph View 93
List View 95
Network Instruments’fax numbers 3
network problems 1
Network Summary 165
Network Trending 169
Network Trending Mode
Collecting Network Trending Information 170
Network Trending and the Dashboard 169
Network Trending Viewer 175
Network Trending Viewer Toolbars 177
Options Toolbar (Internet Trending) 181
Options Toolbar (IP Trending) 179
Overview 167
Setup 171
Statistics Toolbar 177
Viewer Tree 176
Network Trending mode 169
Network Vital Signs
Wireless 163, 165
Network Vital Signs Mode 95
Dial View 99
Graph View 97
List View 99
NIC driver installation 6
Notify Probe User 263
Number of Packets 155
numeric value filter 223
O
Observer
licensing i, 3
port usage 439
Observer Basics 16
Observer General Options Tab 233
Observer Menus 16
Capture Menu 18
Decode and Analysis Submode Menu
Edit Switch Script Submenu 22
File Menu 16
Statistics Menu 18
Tools Menu 21
Trending/Analysis Menu 20
©1994-2002 Network Instruments, LLC
18
449
Network Instruments Advanced and RMON FrameMaker
View Menu 17
Observer Toolbars
Actions Toolbar 26
Mode Commands Toolbar 26
Start Modes Toolbar 24
Occurrence of Hardware Address 155
OID, definition 332
Options toolbar 179
P
Packet Capture 33
saving 40
saving buffer
advanced saving features 40–41
saving in Sniffer format 41
saving range 40
Setup Options 33
setup options 33
switched environments 324
Packet Decode 38
Packet Length Filter 223
packets 36
Paging Server Settings 244
paging service
configuration 236
tray icon 243
Pair Statistics (Matrix) 105
Pair Statistics (Matrix) Mode
Dial View 108
List View 110
pattern filter 224
Phone Pager Tab 235
ping timeout 138
Ping Trace Route 205
Ping/Trace Route 205–207
Port filter 225
port usage 439
ports used by Observer 439
Probe
adding RMON Probe 22
installation 6
running a 2nd local 28
Probe Instance Adapters and Redirections 248
Probe Instance Security Settings 251
Probe Map
450 Network Instruments Observer Reference Guide
customizing 29
Probe Properties Adapter Speed Tab 260
Probe Properties Edit Probe Entry Tab 258
Probe Properties Probe Parameter Tab 259
Protocol Distribution 112
Protocol Distribution Mode
Setup Properties 114
Protocol Distribution Statistics 112
Protocol filter 225
Purpose 1
Q
Quality of Service (QoS)
Quick Install 4
303
R
Real-time Transport Control Protocol 303
Real-time Transport Protocol 303
Redirecting a Probe 263
Replay Packet Buffer 207
Reserve Observer Memory 256
Resolve IP 203
Right to Use 4
RMON Console
configuration 428
connecting to a Probe 415
introduction 415
RMON Ethernet triggers 420
RMON modes 416
RMON table 428
RMON Token Ring triggers 424
system requirements 415
using 415
RMON Tables 115
Router Observer 115
Router Observer Mode
Setup Properties 116, 120
RTCP 303–304
RTP 303
running Observer or Probe 5
S
search 44
Select Address Table for Local Observer
Sequence of Bytes at Offset 156
server analysis 270, 299
settings dialog 324
size distribution statistics
219
switched 326
Sniffer®
format
saving 41
reading, writing Sniffer® files 67
SNMP
community name 338
general principles 389
history 388
technical overview 388
trap, sending from Observer 161
SNMP Console
adding an SNMP agent 339
adding, modifying, and deleting SNMP agents
339
building and modifying charts 359
building expressions 364
building list and table requests 365
building trap requests 366
collecting chart information 344
collecting forms information 349
collecting information 344
collecting list information 347
collecting table information 350
compiled MIBs 355
compiling MIBs 355
configuring
SNMP agents 338
SNMP Extension 336
custom request file 359
custom requests 358
customizing charts 345
designing and building forms 368
enabling SNMP network agents 335
functional overview 337
interface overview 336
introduction 333
MIB 354
definition 331
MIB Editor 352–353
MIB Objects, Groups, and Addresses
MIB Walker 384
overview 384
request file 354
requests 357
RFCs 394
setting values 387
SNMP MIB objects 390
traps 351
tutorial 336
using 336
viewing the MIB tree 387
walking the MIB 385
SNMP General Options Tab 246
SNMP MIB Editor 209
SNMP Trending Data Manager 208
SNMP Trending Tab 248
SNMP Walker 209
SNPP Settings 238
Statistics Memory Allotment Page 255
Switch Dashboard
using 309
Switch scripts 312
SNMP 319
telnet 312
Switch Setup Dashboard 219
Switch Station Locator 211
Switched Observer
introduction 305
looping monitoring 308
static monitoring 308
technology overview 306
T
390
TAP (Telecator Alphanumeric Protocol)
TCP Expert 269
Technical Support i–ii
time interval analysis 269, 297
Token Ring
Network Vital Signs 31
tokens 315, 320
Toolbars
customizing 27
Icons defined 24
Top Talkers 327
Wireless Latest Tab 132
Wireless Speeds Tab 131
Wireless Types Tab 130
Top Talkers Statistics 125
Top Talkers Statistics Mode
IP View 129
MAC – Properties Tab 126
MAC View 128
Setup Properties 126
Traffic Generator 214
Trending
calender tree 177
Triggers and Alarms 148
239
©1994-2002 Network Instruments, LLC
451
Network Instruments Advanced and RMON FrameMaker
configuring 149
Triggers and Alarms Mode
Actions 157–158
Trigger Settings 150
troubleshooting
checklist 437
ODI 438
promiscuous mode 438
shared interrupts 437
setting access to trending Information 397
SNMP report 411, 413
statistics available 396
switch report 404
system requirements 396
using 400
Web server configuration options 400
WEB Extension - Configuring 396
Web Observer 137
WEP Encryption setup for wireless analysis 261
what-if analysis 288, 300
Wireless Access Point Filter 227
Wireless Data Rate Filter 227
Wireless NIC
installing Network Instruments custom drivers for
U
UCP Settings 240
UDP Expert 269
Uninstalling Observer 31
Unknown IP Addresses 156
Using the MIB Editor 354
Utilization 157
Utilization History 132
Utilization History Mode
Dial View 135–136
Graph View 133
switched 327
Utilization Thermometer Mode
8
Supported hardware 13
Wireless Probe Properties setup 261
Wireless Signal Strength Filter 227
Wireless Site Survey 144
Wireless Vital SIgns 163
137
V
version number, finding 24
Voice over IP Expert 303
Voice Settings 241
VoIP 303–304
VoIP Expert 303
W
WAN Conditions Filter 226
WAN Connections 187
WAN Delay Analysis 186
IP Mapping Settings 191
Setup Properties 188
Summary Statistics 190
Web Extension
comparison reports 413
configuring the Web server port 400
installing the Web server as a service 399
Internet Patrol report 407–410
introduction 395
overview 395
permissions 397
setting access to SNMP trending information
398
452 Network Instruments Observer Reference Guide