1
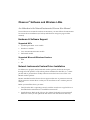
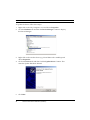
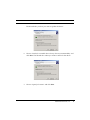
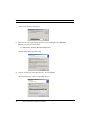
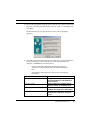
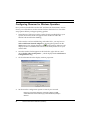
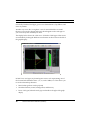
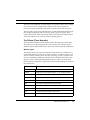
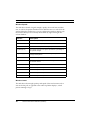
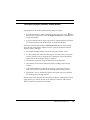
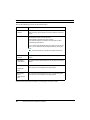
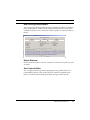
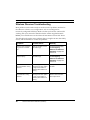
Observer User Manual Addendum
802.11b Wireless Installation & Operation
March 2002
© 2002 by Network Instruments, LLC (Limited Liability Corporation). All rights reserved.
Network Instruments' Observer for use with Microsoft Windows 98/Me, Windows NT 4.x,
Windows 2000, Windows XP, or greater based computers.
“Observer”, “Network Instruments” and the “N with a dot logo” are registered trademarks of
Network Instruments, LLC, and may be registered in certain jurisdictions.
ii
Observer User Manual Addendum (Wireless)
Contents
Hardware & Software Support .......................................................................... 1
Supported NICs ............................................................................................ 1
Supported Microsoft Windows Versions .................................................... 1
Network Instruments Custom Driver Installation ............................................ 1
Configuring Observer for Wireless Operation ................................................ 6
New Features for Wireless Support ................................................................. 8
Wireless Access Point Statistics (New Mode) ............................................ 8
Wireless Channel Scan Monitor (New Tool) ............................................ 10
Network (Wireless) Vital Signs .................................................................... 11
Top Talkers (Three New tabs) .................................................................... 13
Wireless Types....................................................................................... 13
Wireless Speeds .................................................................................... 14
Wireless Latest....................................................................................... 14
The Expert Analysis Wireless Events Button .............................................. 15
New Filtering Enhancements .................................................................... 17
Router Observer ......................................................................................... 17
Save Capture Buffer .................................................................................. 17
Wireless Observer Troubleshooting .............................................................. 18
© Network Instruments, LLC
iii
iv
Observer User Manual Addendum (Wireless)
Observer® Software and Wireless LANs
An Addendum to the Network Instruments Observer User Manual
To use Observer in an 802.11b wireless environment, you must follow the instructions
for custom driver installation (see below) and Observer setup (see page 6 of this
manual).
Hardware & Software Support
Supported NICs
•
Symbol Spectrum24 - 41x1 models
•
Nortel 41x1 models
•
Cisco Aironet 340-350 series models
•
Intel 2011b models
Supported Microsoft Windows Versions
•
2000
•
XP
Network Instruments Custom Driver Installation
For Observer to properly analyze 802.11b wireless packets, the driver must pass
through all of the packets, not just those packets addressed to that NIC (i.e., it must
put the card in ‘promiscuous’ mode). Observer must also have access to the ‘raw’
802.11b wireless packets.
Because standard wireless drivers do not support either raw or promiscuous mode,
NI has written a custom driver so that you can use Observer as a wireless protocol
analyzer.
Before you install the driver, you must:
•
Verify that the NIC is operating correctly with the manufacturer-supplied driver as
described in the manufacturer’s installation instructions.
•
Install Observer. Refer to the Observer User Manual for details. You must install
Observer so that you can update the NIC driver from the Observer directory.
1
Observer® Software and Wireless LANs
To update the driver, follow these steps:
1.
Right-click on the ‘My Computer’ icon and choose Properties.
2.
Click the Hardware tab and then the Device Manager... button to display
the Device Manager:
3.
Right-click on the wireless driver (e.g. Nortel Networks e-mobility) and
choose Properties.
4.
Click on the Driver tab and then click the Update Driver... button. This
starts the Update Hardware Wizard:
5.
Click Next.
2
Observer User Manual Addendum (Wireless)
Network Instruments Custom Driver Installation
The Wizard asks you how you want to update the driver:
6.
Choose “Search for a suitable driver for my device (recommended)” and
click Next. The Wizard asks where you want to search for the driver:
7.
Choose “Specify a location” and click Next.
© Network Instruments, LLC
3
Observer® Software and Wireless LANs
A file locator dialog is displayed:
8.
Enter (or browse to) the following directory (assuming that C:\Observer
Files is your Observer directory):
C:\Observer Files\drivers\wireless
The Wizard displays the following:
9.
Choose “Install one of the other drivers” and click Next.
The wizard displays a list of compatible drivers:
4
Observer User Manual Addendum (Wireless)
Network Instruments Custom Driver Installation
10. Choose the appropriate analyzer driver with the “NI” prefix (“NI/Nortel
Networks e-mobility 802.11b Wireless LAN PC Card,” for example) and
click Next.*
The Wizard informs you that the driver lacks a Microsoft digital
signature:
11. Click Yes. Network Instruments has tested the driver and verified that it
works with Windows and with Observer. When the installation is
complete, click Finish to close the Wizard.
Note that you can switch wireless operation between analyzer (i.e.,
“promiscuous”) mode and standard NIC mode without re-installing the
driver.
*The table below shows what driver to select for each of the supported
wireless NICs:
NIC
Symbol Spectrum24 - 41x1 models
Nortel 41x1 models
Cisco Aironet 340-350 series models
Intel 2011b models
Analyzer Driver
NI/Symbol LA-41x1 [or 41x3]
Spectrum24 Wireless LAN PCMCIA [or
PCI] Card Driver
NI/Nortel Networks e-mobility 802.11b
Wireless LAN PC [or PCI] Card Driver
NI/Cisco Systems 340 [or 350] Series
PCMCIA [or PCI] Wireless LAN Adapter
NI/Intel(R) PRO/Wireless [or PRO/11
Wireless] 2011 LAN PC [or PCI] Card
Driver
© Network Instruments, LLC
5
Observer® Software and Wireless LANs
Configuring Observer for Wireless Operation
Once you have installed the wireless NIC and Network Instruments’ custom
driver, you will be able to see the wireless Probe in the Probe List. Check the
setup options before you begin capturing packets.
1.
Start Observer. If the new wireless card is the only installed NIC in your
system, the wireless Probe will appear in the Probe List under the
Wireless Advanced Probes heading.
If the wireless card is installed along with other NICs, you may have to
Select a Different Network Adapter by choosing that option from the
Tools menu (or by clicking the NIC icon
on the toolbar). Observer will
display the list of available cards. Select the NI Analyzer driver for your
wireless NIC.
2.
Once the wireless Probe appears in the Probe list, right click on it and
choose Probe or Device Properties…, which displays the Local Observer
Configuration dialog.
3.
Click on the 802.11b tab to display wireless properties:
4.
Set the wireless configuration options to match your network.
Note that if your wireless network is configured for WEP, you must
activate WEP and enter the WEP key(s) in the Edit WEP Keys dialog in
Observer.
6
Observer User Manual Addendum (Wireless)
Configuring Observer for Wireless Operation
The configuration options are described below:
Option
Description
Site Profiles
Site Profiles let mobile users save and retrieve wireless parameters,
rather than re-keying the parameters every time you change sites.
Monitor Traffic By
Choose the method to monitor traffic. The three available methods
are as follows (choose one):
Channel
Specify a channel to monitor.
BSSID
Specify the Basic Service Set ID of the Access
Point you want to monitor.
ESSID
Specify the Extended Service Set ID of the network you want to monitor.
Scan Channels
(Only available if you have chosen to monitor by
Channel) Scan the selected channels. To select
channels to scan, click Channel Map…
WEP Encryption
Choose Wireless Equivalency Privacy encryption settings. To use
WEP, check the “Use WEP keys to decrypt wireless traffic” checkbox
and click Edit WEP Keys... to enter the appropriate encryption keys.
Antenna to use
Specify the type of antenna connected to your system:
Antenna
Diversity
Use the stronger signal from the two antenna
ports. This is the recommended setting for the
standard snap-on antenna.
Primary
Antenna
Only
If you are not using the standard snap on antenna,
choose this option if the antenna you are using is
connected to the primary antenna port (see your
NIC manual for details).
Secondary
Antenna
Only
If you are not using the standard snap on antenna,
choose this option if the antenna you are using is
connected to the secondary antenna port (see
your NIC manual for details).
© Network Instruments, LLC
7
Observer® Software and Wireless LANs
New Features for Wireless Support
In addition to decoding and analyzing 802.11b wireless LANs (WLANs),
Observer has updated a number of statistical modes and added some new
ones. These new and updated features are described in the sections that
follow.
Wireless Access Point Statistics (New Mode)
This mode is available on the Statistics menu whenever Observer is analyzing
through a wireless device or Probe.
The Access Point Statistics mode shows traffic passing through any Access Points
(APs) visible to the Observer wireless NIC. This mode is an all-purpose tool for
maintaining performance and security on a WLAN that uses APs, showing you:
•
Wireless stations that are connected to an AP
•
Non-wired stations that they communicate with
•
Levels of signal strength, quality, data transfer rates, and non-data
transfer rates on each station on the access point
•
AP traffic totals
For example, you can immediately see if there is a station connected to the
wrong AP, or if an unauthorized AP has been installed. AP statistics will
display whether a station has a problem with quality or range of connection
based on the number of reassociations and retransmissions, or whether a
station is misconfigured based on station poll totals.
The table below describes each statistic.
Note that some columns are turned off by default; right click on the
column heading to set which statistics you want to display.
8
Statistic
Description
Access Point
The MAC address of the Access Point for this row of statistics.
Station
The MAC address or alias of the station communicating with the AP.
Type
The type of device connected to the AP: aa wireless station, a station
(unwired), or another Access Point.
Avg Strength (%)
The average strength of the signal, expressed as a percentage of the
optimum strength.
Observer User Manual Addendum (Wireless)
New Features for Wireless Support
Statistic
Description
Avg Quality (%)
The average signal-to-noise ratio of the signal, expressed as a percentage of the optimum.
Avg Data Rate
The average rate of data packets on the wireless network.
Avg Rate
The average rate of all packets (data+control+management+beacon)
on the wireless network.
Packets
The total number of packets seen.
Data pkts
(Directed)
The total number of data packets seen.
Multicasts
The total number of multicast packets seen.
Bytes
The total number of bytes seen.
CRC
The total number of CRC errors reported by the AP.
Retries
The total number of transmission retries reported by the AP.
Associations
The number of associations (connection sessions) that have been
established with this AP.
Station Polls
The total number of poll requests by station; a high number means that
a station cannot connect to an AP. In the 802.11b protocol, a station first
polls for an AP, then associates with a responding AP.
Min Quality
The poorest quality signal seen, expressed as a percentage of the
optimum.
Max Quality
The best quality signal seen, expressed as a percentage of the
optimum.
Latest Quality
The quality of the signal as seen at the last poll.
Min Strength
The lowest strength signal seen, expressed as a percentage of the
optimum.
Max Strength
The highest strength signal seen, expressed as a percentage of the
optimum.
Latest Strength
The strength of the signal seen at the last poll.
Min Data Rate
The slowest data rate seen, expressed in Mbits/sec.
Max Data Rate
The fastest data rate seen, expressed in Mbits/sec.
Latest Data Rate
The data rate seen at the last poll.
© Network Instruments, LLC
9
Observer® Software and Wireless LANs
Statistic
Description
Min Rate
The slowest rate of total packet throughput seen, expressed in Mbits/
sec.
Max Rate
The fastest rate of total packet throughput seen, expressed in Mbits/
sec.
Latest Rate
The rate of total packet throughput seen at the last poll.
Wireless Channel Scan Monitor (New Tool)
The Wireless Channel Scan Monitor shows activity by channels on your
wireless network. This mode is available on the Tools menu.
Two things to note about the channel scan monitor:
•
You must set the channels to scan in the Probe or Device Properties
dialog (see page 6 of this manual).
•
When Observer is scanning channels, the other modes (such as Top
Talkers, Access Point Statitistics) will no longer be able to present
complete view of the network, as Observer’s data sample is limited to the
current channel being scanned. Therefore, you should only use the
Channel Scan monitor by itself.
The table below describes each Channel Scan Monitor statistic in detail.
Note that some fields are hidden by default; to reconfigure the display,
right-click on the statistics column heading:
Statistic
Description
Channel
Channel being tracked in this row of data.
Avg Strength (%)
The average strength of the signal, expressed as a percentage of
the optimum strength.
Avg Quality (%)
The average signal-to-noise ratio of the signal, expressed as a percentage of the optimum.
Avg Data Rate
The rate of data packets on the wireless network.
Avg Rate
The rate of all packets (data+control+management+beacon) on the
wireless network.
CRC
Total number of CRC errors reported on this channel.
10
Observer User Manual Addendum (Wireless)
New Features for Wireless Support
Statistic
Description
Packets
Total number of packets (data+control+management+beacon) seen.
Data pkts
(directed)
Total number of data packets (packets with a payload and an
address) seen.
Beacons
Total number of beacons seen.
Bytes
Total number of bytes seen.
Retries
Total number of retries reported on this channel.
Min Quality
The poorest quality signal seen, expressed as a percentage of the
optimum.
Max Quality
The best quality signal seen, expressed as a percentage of the optimum.
Latest Quality
The quality of the signal as seen at the last poll.
Min Strength
The lowest strength signal seen, expressed as a percentage of the
optimum.
Max Strength
The highest strength signal seen, expressed as a percentage of the
optimum.
Latest Strength
The strength of the signal seen at the last poll.
Min Data Rate
The slowest data rate seen, expressed in Mbits/sec.
Max Data Rate
The fastest data rate seen, expressed in Mbits/sec.
Latest Data Rate
The data rate seen at the last poll.
Min Rate
The slowest rate of total throughput seen, expressed in Mbits/sec.
Max Rate
The fastest rate of total packet throughput seen, expressed in Mbits/sec.
Latest Rate
The rate of total packet throughput seen at the last poll.
Network (Wireless) Vital Signs
To start Vital Signs, select Statistics from the main menu, then Network Vital
Signs.
The Wireless Vital Signs mode shows current wireless activity mapped with
current wireless error conditions on your WLAN. The Vital Signs mode
displays a comprehensive snapshot of error conditions and of their criticality
in the context of current WLAN activity. To pin down aggregate problems
© Network Instruments, LLC
11
Observer® Software and Wireless LANs
revealed by Wireless Vital Signs, go to Access Point Statistics, Top Talkers, and
Errors by Station.
Another way to use this "at-a-glance" view of network health is to install
Observer on a wireless laptop and watch what happens to the vital signs as
you move the system around your office.
The display below shows the “dial view” of Wireless Vital Signs. Other views
are available by clicking the different view buttons on the tool bar to the left of
the graph display:
In Dial View, vital signs are plotted against 4 axes, each representing one of
the four 802.11b-defined bit rates: 1, 2, 5.5, and 11 Mbits/sec. This allows you
to see the relationships between:
•
Data Packets (packets with a payload)
•
Non-Data Packets (control, management, and beacon)
•
Errors of all types, broken down by type in the table to the right of the graph
display.
12
Observer User Manual Addendum (Wireless)
New Features for Wireless Support
This lets you immediately see each statistic in its proper context. For example,
an error rate of 50% is insignificant if Observer has only analyzed two
packets, but quite significant if thousands of packets have been analyzed.
The bar graphs to the right of the dial show current bandwidth utilization (U),
the average strength (S), and the average quality (Q) of the signal. These
meters also indicate (with watermark “floats”) the minimum and maximum
values that Observer has seen since the last polling period.
Top Talkers (Three New tabs)
The Top Talkers statistical mode displays three tabs showing wireless data
when Observer is capturing packets via the wireless NIC: Wireless Types,
Wireless Speeds, and Wireless Latest These tabs are described in detail below.
Wireless Types
This display shows the type of each station sensed in the air: whether it is a
LAN station talking over the air to wireless stations, a wireless station, or an
AP. For stations, it shows which APs they are using. For APs, it displays the
Service Set Identifier (SSID) and whether WEP is enabled on that AP. It also
displays Control, Data and Management totals per station. As with other
tabular displays in Observer, right-click on the column headings to configure
the column view.
Statistic
Description
Alias
Alias of the Top Talker system, if one is available.
Address
Media Access Control (MAC) address, i.e., the “hardware address.”
Packets
The total number of packets sent by the system.
Management
The number of management packets sent by the system.
Control
The number of control packets sent by the system.
Data
The number of data packets sent by the system.
Probe Request
The number probe requests sent by the system.
Retries
The number of transmission retries sent by the system.
Type
The type of station: Wireless or Access Point
AP Used
The access point used by the system.
© Network Instruments, LLC
13
Observer® Software and Wireless LANs
Wireless Speeds
This tab shows details of signal strength, quality, the overall rate and data
rate, as well as the packet distributions for different rates. As with all of the
statistical displays in Observer, you can configure the mode to display only
the statistics that you are currently interested in by right-clicking on the
column headers.
Statistic
Description
Alias
Alias of the Top Talker system, if one is available.
Address
Media Access Control (MAC) address, i.e., the “hardware address.”
Packets
The total number of packets sent by the system.
Avg Strength (%)
The average strength of the signal, expressed as a percentage of
the optimum strength.
Avg Quality (%)
The average signal-to-noise ratio of the signal, expressed as a percentage of the optimum.
Avg Data Rate
The rate of data packets on the wireless network.
Avg speed
The speed of all packets (data+control+management+beacon) on
the wireless network.
Util %
The percentage of bandwidth utilized.
Pkt 1
The number of packets captured at 1Mbit/sec.
Pkt 2
The number of packets captured at 2Mbit/sec.
Pkt 5.5
The number of packets captured at 5.5Mbit/sec.
Pkt 11
The number of packets captured at 11Mbit/sec.
Wireless Latest
This tab shows the strength, quality, and speed of the wireless network, as
seen at the last poll, as opposed to the other Top Talker displays, which
present running averages.
14
Observer User Manual Addendum (Wireless)
New Features for Wireless Support
The Expert Analysis Wireless Events Button
Expert Mode can be used in both real time and post-capture:
•
For real-time analysis, when capturing packets, select the View
icon
from Packet Capture. Then select the Expert Analysis tab at the bottom of
the decode display.
•
For post-capture analysis, open a (previously captured) buffer and select
the "Expert Analysis" tab at the bottom of the decode display.
The Expert Analysis tab includes a Wireless Events button on the toolbar
along the left of the display. Observer tracks network conditions between
wireless stations and logs:
•
The station sending and the station receiving the wireless event.
•
A color-coded status indicator showing the criticality of the event (each
level of criticality can be configured by clicking the Expert Thresholds
icon to the left of the Expert Analysis window.
•
The number of packets going in each direction for the event.
•
The number of association attempts from the sending and receiving
stations.
•
Cyclical Redundancy Check/Physical Layer Convergence Protocol
(CRC/PLCP) errors reported on the sending and receiving stations.
•
Equivalency Privacy (WEP) encryption/decryption errors reported on
the sending and receiving stations.
Expert Analysis also displays the following conditions: weak signal and low
signal quality per station, missed ACKs, failed associations, and whether
WEP is used on a particular AP or station.
© Network Instruments, LLC
15
Observer® Software and Wireless LANs
The tracked Wireless Events are described below.
Event
Description
Station 1->
<-Station 2
Shows the wireless station sending and the wireless
station receiving. Where possible, the client is listed first and server
second.
Status
Displays a colored box indicating the status of the conversation.
Red indicates a critical event has occurred.
Yellow indicates a marginal event has occurred.
Green indicates that the conversation’s communication is within
acceptable event parameters.
A red or yellow status will display when any expert event for the pair
occurs. You can customize the criticality thresholds by clicking the
Expert Thresholds icon to the left of the Expert Analysis window.
Packets->
<-Packets
Displays the number of packets in each direction of the pair’s communication.
Associations->
<-Associations
The number of association attempts from the sending and receiving
stations.
CRC/PLCP Errors>
<-CRC/PLCP
Errors
The number of cyclical redundancy check/physical layer convergence
errors reported on the sending and receiving stations.
WEP Decode
Errors->
<-WEP Decode
Errors
The number of Wireless Equivalency Privacy encryption/decryption
errors reported on the sending and receiving stations.
Note also that the Expert Summary now displays wireless events.
16
Observer User Manual Addendum (Wireless)
New Features for Wireless Support
New Filtering Enhancements
You can now filter by the wireless access point hardware address in addition
to the standard MAC address and IP address filtering that has always been
available in Observer. You can choose to either capture or exclude packets by
the AP.
Router Observer
Router Observer mode now shows statistics for wireless access points as well
as routers.
Save Capture Buffer
You can apply WEP decryption by supplying the key profiles in the Save
Capture Buffer dialog. These are the same key profiles configured in the
Device or Probe Properties dialog described on page 6 of this manual.
© Network Instruments, LLC
17
Observer® Software and Wireless LANs
Wireless Observer Troubleshooting
Most problems with wireless analysis are the result of problems unrelated to
the Observer software or its configuration, such as unconfigured or
incorrectly configured WEP keys. Make sure that you have the wireless NIC
working with your network as described in the vendor supplied manuals
before you install Observer or the Network Instruments custom NIC driver.
The table below describes some problems that you might run into, their likely
causes, and the remedies to correct the problems.
Symptom
Possible Cause
Remedy
Observer does not display
any protocol or IP statistics.
WEP not activated, or incorrect WEP key(s).
Configure the WEP key(s).
See Configuring
Observer for Wireless
Operation on page 6 of
this manual.
Expert Analysis doesn’t
display anything.
WEP not activated, or incorrect WEP key(s).
Configure the WEP key(s).
See Configuring
Observer for Wireless
Operation on page 6 of
this manual.
Network drive becomes
disconnected after running
Observer.
This can happen when you
reconfigure the driver (either
through vendor utilities or
Windows) while Observer is
running.
Use Explorer to reconnect to
the drive.
Wireless NIC becomes disassociated after running
Observer
This can happen when you
reconfigure the driver (either
through vendor utilities or
Windows) while Observer is
running.
Re-install and configure the
Network Instruments wireless analyzer driver.
18
Observer User Manual Addendum (Wireless)
NOTES
© 2002 Network Instruments, LLC
19
8800 West Highway Seven, Fourth Floor, Minneapolis, MN 55426 USA
phone 952.932.9899 • fax 952.932.9545
[email protected]
www.NETWORKINSTRUMENTS.com
© 2002 Network Instruments, LLC. Network Instruments, Observer, and
the "N with a dot" logo are registered trademarks of Network
Instruments, LLC, Minneapolis, MN USA.