1
M32R Debugger and Trace
TRACE32 Online Help
TRACE32 Directory
TRACE32 Index
TRACE32 Documents ......................................................................................................................
ICD In-Circuit Debugger ................................................................................................................
Processor Architecture Manuals ..............................................................................................
M32R .........................................................................................................................................
M32R Debugger and Trace ..................................................................................................
1
General Note ......................................................................................................................
4
Brief Overview of Documents for New Users .................................................................
4
Warning ..............................................................................................................................
5
Quick Start .........................................................................................................................
6
Troubleshooting ................................................................................................................
9
SYStem.Up Errors
9
Memory Access Errors
9
FAQ .....................................................................................................................................
10
Configuration .....................................................................................................................
12
General SYStem Settings and Restrictions ....................................................................
SYStem.BdmClock
SYStem.CONFIG
13
Define JTAG frequency
13
Configure debugger according to target topology
13
Select target CPU
13
SYStem.CPU
SYStem.CpuAccess
SYStem.JtagClock
SYStem.LOCK
SYStem.MemAccess
SYStem.Mode
SYStem.Option IMASKASM
14
Define JTAG clock
15
Lock and tristate the debug port
15
Select memory access mode
16
Establish the communication with the target
16
Display SYStem window
16
Enables program break via debug interrupt
17
Disable interrupts while single stepping
17
SYStem.Option
SYStem.Option DBI
Select CPU access mode
SYStem.Option IMASKHLL
Disable interrupts while HLL single stepping
17
SYStem.Option KEYCODE
Code protection
18
Allow debugger to drive JTAG and reset
19
Display SYStem window
19
Trace specific Commands ................................................................................................
20
SYStem.Option TriState
SYStem.view
©1989-2014 Lauterbach GmbH
M32R Debugger and Trace
1
SYStem.Option BTM
SYStem.Option DTM
Enables program trace messages
20
Enables data trace messages
20
SYStem.Option STALL
Trace message overrun control
20
SYStem.Option TRCLK
Trace output clock ratio
21
Trace port width
21
TrOnchip ............................................................................................................................
22
SYStem.Option TRDATA
TrOnchip.CONVert
Automatically converts range to single address
22
Resets all TO settings
23
Convert variable breakpoints
23
Opens configuration panel
23
Security Levels of the M32R Family ................................................................................
24
TrOnchip.RESet
TrOnchip.VarCONVert
TrOnchip.view
Security Level
24
Flash Erase if Device is secured
25
General Restrictions and Hints
26
Floating Point Formats
27
Integer Access Keywords
27
JTAG Connection ..............................................................................................................
28
Mechanical Description of the 10-pin Debug Cable
28
Electrical Description of the 10-pin Debug Cable
28
Mechanical Description of the 20-pin Trace Connector
29
Memory Classes ................................................................................................................
31
Support ...............................................................................................................................
32
Available Tools
32
Compilers
32
Realtime Operation Systems
32
3rd Party Tool Integration
33
Products .............................................................................................................................
34
Product Information
34
Order Information
34
©1989-2014 Lauterbach GmbH
M32R Debugger and Trace
2
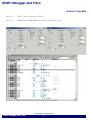
M32R Debugger and Trace
Version 11-Nov-2014
28-Jul-14
Width “TWord” renamed to “HByte”.
30-Jun-14
TrBus.Out and TrBus.Set were moved to general_ref_t.pdf.
©1989-2014 Lauterbach GmbH
M32R Debugger and Trace
3
General Note
This documentation describes the processor specific settings and features for TRACE32-ICD for the
following Renesas M32R CPU families:
•
(SDI-3) M32192, M32195, M32196, M32185, M32186
•
(SDI-2) M32176, M32180
If some of the described functions, options, signals or connections in this Processor Architecture Manual are
only valid for a single CPU or for specific families, the names of the families are added in brackets.
Brief Overview of Documents for New Users
Architecture-independent information:
•
”Debugger Basics - Training” (training_debugger.pdf): Get familiar with the basic features of a
TRACE32 debugger.
•
”T32Start” (app_t32start.pdf): T32Start assists you in starting TRACE32 PowerView instances
for different configurations of the debugger. T32Start is only available for Windows.
•
“General Commands” (general_ref_<x>.pdf): Alphabetic list of debug commands.
Architecture-specific information:
•
“Processor Architecture Manuals”: These manuals describe commands that are specific for the
processor architecture supported by your debug cable. To access the manual for your processor
architecture, proceed as follows:
-
•
Choose Help menu > Processor Architecture Manual.
“RTOS Debugger” (rtos_<x>.pdf): TRACE32 PowerView can be extended for operating systemaware debugging. The appropriate RTOS manual informs you how to enable the OS-aware
debugging.
©1989-2014 Lauterbach GmbH
M32R Debugger and Trace
4
General Note
Warning
NOTE:
To prevent debugger and target from damage it is recommended to connect or
disconnect the debug cable only while the target power is OFF.
Recommendation for the software start:
•
Disconnect the debug cable from the target while the target power is off.
•
Connect the host system, the TRACE32 hardware and the debug cable.
•
Power ON the TRACE32 hardware.
•
Start the TRACE32 software to load the debugger firmware.
•
Connect the debug cable to the target.
•
Switch the target power ON.
•
Configure your debugger e.g. via a start-up script.
Power down:
•
Switch off the target power.
•
Disconnect the debug cable from the target.
•
Power OFF the TRACE32 hardware.
©1989-2014 Lauterbach GmbH
M32R Debugger and Trace
5
Warning
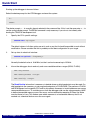
Quick Start
Starting up the debugger is done as follows:
Select the device prompt for the ICD Debugger and reset the system.
b::
RESet
The device prompt B:: is normally already selected in the command line. If this is not the case enter B:: to
set the correct device prompt. The RESet command is only necessary if you do not start directly after
booting the TRACE32 development tool.
1.
Specify the CPU specific settings.
SYStem.CPU <cputype>
The default values of all other option are set in such a way that it should be possible to work without
modification. Please consider that this is probably not the best configuration for your target.
2.
Set up data for electrical interface.
SYStem.JtagClock <frequency>
Normally the default value is 10.0 MHz, but the it can be increased up to 25 MHz.
3.
Inform the debugger about read only and none-readable address ranges (ROM, FLASH).
MAP.DenyAccess
MAP.NoDenyAccess <range>
MAP.BOnchip <range>
The BreakOnchip information is necessary to decide where on-chip breakpoints must be used. Onchip breakpoints are necessary to set program breakpoints to FLASH/ROM. The sections of FLASH
and ROM depend on the specific CPU and its chip selects. Accesses to invalid addresses can cause
unrecoverable bus errors. To avoid bus errors from the debugger side use the subcommands of MAP
to define inaccessible memory areas. Bus errors can be removed by executing SYStem.Up. Make
sure that there isn’t any T32 window open which accesses to a inaccessible memory that is not
masked out, otherwise the bus error can occur again.
©1989-2014 Lauterbach GmbH
M32R Debugger and Trace
6
Quick Start
4.
Enter debug mode.
SYStem.Up
This command resets the CPU and enters debug mode. After this command is executed it is possible
to access memory and registers.
5.
Configure chip according application.
Before loading binary data into the processor memory, the memory should be made writable for the
debugger. Therefore processor configuration registers have to be set e.g. chip select register.
6.
Load the program.
Data.LOAD.SR program.abs /verify
; SR specifies the format,
; program.abs is the file name
The format of the Data.LOAD command depends on the file format generated by the compiler. Refer
to “Supported Compilers” to find the command, that is necessary for your compiler. It is
recommended to use the option/verify that verifies all written data. This test discovers a problem with
the electrical connection, wrong chip configurations or linker command file settings.
For a detailed description of the Data.LOAD command and all available options see “Data” in
”General Commands Reference Guide D” (general_ref_d.pdf).
©1989-2014 Lauterbach GmbH
M32R Debugger and Trace
7
Quick Start
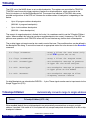
A typical start sequence for the MSC8101 is shown below. This sequence can be written to an ASCII file
(script file) and executed with the command DO <filename>. Other sequences can be found on the
TRACE32 Product Software CD in the DEMO directory ~~\demo\m32r.
b::
; Select the ICD device prompt
WinClear
; Clear all windows
SYS.CPU M32196
; Select CPU
SYS.JC 15000000.
; Choose JTAG frequency
SYS.UP
; Reset the target and enter debug
; mode
MAP.DENYACCESS
; Forbid any access to the memory in
; general
MAP.BONCHIP 0x0000--0x007FFF
; ROM
; Specifies the program memory where
; on-chip breakpoints must be used
Data.LOAD.SR Sieve.abs /VERFY
; Load the application, verify the
; process
Go main
; Run and break at main()
Data.List
; Open source window
Register /SpotLight
; Open register window
Var.Local
; Open window with local variables
©1989-2014 Lauterbach GmbH
M32R Debugger and Trace
8
Quick Start
Troubleshooting
SYStem.Up Errors
The SYStem.Up command is the first command of a debug session where communication with the target is
required. If you receive error messages while executing this command this may have the following reasons.
•
The JTAG lines are not connected correctly.
•
The target has no power.
•
The pull-up resistor between the JTAG[VCCS] pin and the target VCC is too large.
•
The target is in reset:
The debugger controls the processor reset and use the RESET line to reset the CPU on every
SYStem.Up. Therefore no external R-C combination or external reset controller is allowed.
•
There is logic added to the JTAG state machine:
By default the debugger supports only one processor in one JTAG chain. If the processor is only
one member of a JTAG chain the debugger has to be informed about the target JTAG chain
configuration. Use the SYStem.CONFIG command to specify the position of the device in the
JTAG-chain.
•
There are additional loads or capacities on the JTAG lines.
Memory Access Errors
After system up is completed successfully, data can be written to or read from memory. Trying to access
memory not belonging to the memory map of the processor will be refused with the error message
no memory mapped at address
D:XXXXXXXX
and
bus error generated by CPU
When a unrecoverable bus error occurs the target processor has to be reset.
©1989-2014 Lauterbach GmbH
M32R Debugger and Trace
9
Troubleshooting
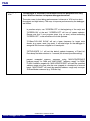
FAQ
Debugging via
VPN
The debugger is accessed via Internet/VPN and the performance is very
slow. What can be done to improve debug performance?
The main cause for bad debug performance via Internet or VPN are low data
throughput and high latency. The ways to improve performance by the debugger
are limited:
in practice scripts, use "SCREEN.OFF" at the beginning of the script and
"SCREEN.ON" at the end. "SCREEN.OFF" will turn off screen updates.
Please note that if your program stops (e.g. on error) without executing
"SCREEN.OFF", some windows will not be updated.
"SYStem.POLLING SLOW" will set a lower frequency for target state
checks (e.g. power, reset, jtag state). It will take longer for the debugger to
recognize that the core stopped on a breakpoint.
"SETUP.URATE 1.s" will set the default update frequency of Data.List/
Data.dump/Variable windows to 1 second (the slowest possible setting).
prevent unneeded memory accesses using "MAP.UPDATEONCE
[address-range]" for RAM and "MAP.CONST [address--range]" for ROM/
FLASH. Address ranged with "MAP.UPDATEONCE" will read the specified
address range only once after the core stopped at a breakpoint or manual
break. "MAP.CONST" will read the specified address range only once per
SYStem.Mode command (e.g. SYStem.Up).
©1989-2014 Lauterbach GmbH
M32R Debugger and Trace
10
FAQ
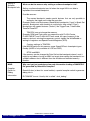
Setting a
Software
Breakpoint fails
What can be the reasons why setting a software breakpoint fails?
Setting a software breakpoint can fail when the target HW is not able to
implement the wanted breakpoint.
Possible reasons:
The wanted breakpoint needs special features that are only possible to
realize by the trigger unit inside the controller.
Example: Read, write and access (Read/Write) breakpoints ("type" in Break.Set
window). Breakpoints with checking in real-time for data-values ("Data").
Breakpoints with special features ("action") like TriggerTrace, TraceEnable,
TraceOn/TraceOFF.
TRACE32 can not change the memory.
Example: ROM and Flash when no preparation with FLASH.Create,
FLASH.TARGET and FLASH.AUTO was made. All type of memory if the
memory device is missing the necessary control signals like WriteEnable or
settings of registers and SpecialFunctionRegisters (SFR).
Contrary settings in TRACE32.
Like: MAP.BOnchip for this memory range. Break.SELect.<breakpoint-type>
Onchip (HARD is only available for ICE and FIRE).
RTOS and MMU:
If the memory can be changed by Data.Set but the breakpoint doesn't work it
might be a problem of using an MMU on target when setting the breakpoint to a
symbolic address that is different than the writable and intended memory
location.
M32R
Compiler
Option for
Debug
Information
Why can I get just symbols and no code information loading a DWARF/ELF
file generated by Greenhills Compiler?
Greenhills has (at least for some families) a special compiler switch to generate
debug info in
ELF/DWARF format. Usually this is called "-dual_debug".
©1989-2014 Lauterbach GmbH
M32R Debugger and Trace
11
FAQ
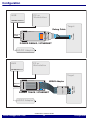
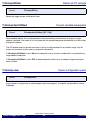
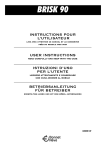
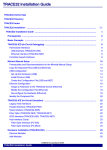
Configuration
HUB
PC or
Workstation
100 MBit Ethernet
Target
Debug Cable
PODBUS IN
POWER DEBUG / ETHERNET
LAUTERBACH
POWER
JTAG
Connector
TRIG
ETHERNET
CON ERR
RECEIVE
COLLISION
C
B
DEBUG CABLE
TRIGGER
TRANSMIT
POWER
7-9 V
LAUTERBACH
USB
EMULATE
RECORDING
DEBUG CABLE
RESERVED FOR POWER TRACE
SELECT
Ethernet
Cable
A
PODBUS OUT
POWER DEBUG / ETHERNET
AC/DC Adapter
HUB
PC or
Workstation
100 MBit Ethernet
Target
PODBUS IN
POWER TRACE / ETHERNET
NEXUS Adapter
POWER
TRIG
SELECT
RECORDING
TRIGGER
ETHERNET
CON ERR
TRANSMIT
CABLE
RECEIVE
CBA
COLLISION
C
B
A
POWER TRACE / ETHERNET
LAUTERBACH
LAUTERBACH
NEXUS ADAPTER
PODBUS OUT
LAUTERBACH
POWER
7-9 V
JTAG NEXUS
Connector
DEBUG CABLE
LOGIC ANALYZER PROBE
EMULATE
USB
Ethernet
Cable
AC/DC Adapter
©1989-2014 Lauterbach GmbH
M32R Debugger and Trace
12
Configuration
General SYStem Settings and Restrictions
NOTE:
All trace related settings described here are only relevant, if the device provides
trace capabilities!
Trace features can only be used, if a special device and /or a special adapter board (Pitch-Converter) is
used. Both products are provided by Renesas.
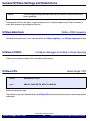
SYStem.BdmClock
Define JTAG frequency
Obsolete command syntax. It has the same effect as SYStem.JtagClock. Use SYStem.JtagClock instead.
SYStem.CONFIG
Configure debugger according to target topology
There are no multicore capable CPUs available at the moment.
SYStem.CPU
Select target CPU
Format:
SYStem.CPU <cpu>
<cpu>:
M32192, M32192FPU, M32176, M32180
Selects the processor type.
The processor type must be selected by the SYStem.CPU command before issuing any other target related
commands.
©1989-2014 Lauterbach GmbH
M32R Debugger and Trace
13
General SYStem Settings and Restrictions
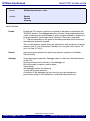
SYStem.CpuAccess
Select CPU access mode
Format:
SYStem.CpuAccess <mode>
<mode>:
Enable
Denied
Nonstop
Default: Denied.
Enable
Enable the CPU access to perform an update of the memory displayed in the
TRACE32 window. The debugger performs following: Stop program execution,
switch to debug mode, update memory, restart program execution. Stopping of
program execution is performed about 10 times/s. Each short stop takes
1 … 100 ms depending on the speed of the debug interface and on the size of
the read/write accesses required.
The run-time memory access has to be activated for each window by using the
memory class E: (e.g. Data.dump E:0x100) or by using the format option %E
(e.g. Var.View %E var1).
Denied
Interrupt program execution for performing memory accesses is forbidden.
Default setting.
Nonstop
Stops the program execution. Debugger does not affect the real-time behavior
of the CPU.
Nonstop reduces the functionality of the debugger to:
Run-time access to memory and variables
Trace display
The debugger inhibits the following:
To stop the program execution
All features of the debugger that are intrusive (e.g. spot breakpoints,
performance analysis via StopAndGo, conditional break points etc.)
©1989-2014 Lauterbach GmbH
M32R Debugger and Trace
14
General SYStem Settings and Restrictions
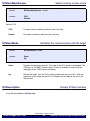
SYStem.JtagClock
Define JTAG clock
Format:
SYStem.JtagClock [<frequency>]
<frequency>
6 kHz…25 MHz
1250000. | 2500000. | 5000000. | 10000000.
Default frequency: 10 MHz.
Selects the JTAG port frequency (TCK) used by the debugger to communicate with the processor. This
influences e.g. the download speed. It could be required to reduce the JTAG frequency if there are buffers,
additional loads or high capacities on the JTAG lines or if VTREF is very low. A very high frequency will not
work on all systems and will result in an erroneous data transfer. Therefore we recommend to use the default
setting if possible
The debugger can not select all frequencies accurately. It chooses the next possible frequency and displays
the real value in the System Settings window. Besides a decimal number like “100000.’” also short forms
like”10kHz” or “15MHz” can be used. The short forms implies a decimal value, although no “.” is used.
When the debugger is not working correctly (e.g. memory is flickering) decrease the JtagClock.
SYStem.LOCK
Format:
Lock and tristate the debug port
SYStem.LOCK [ON | OFF]
Default: OFF.
If the system is locked, no access to the debug port will be performed by the debugger. While locked, the
debug connector of the debugger is tristated. The main intention of the lock command is to give debug
access to another tool.
The command has no effect for the simulator.
©1989-2014 Lauterbach GmbH
M32R Debugger and Trace
15
General SYStem Settings and Restrictions
SYStem.MemAccess
Select memory access mode
Format:
SYStem.MemAccess <mode>
<mode>:
CPU
Denied
Default: CPU.
CPU
Provides access to memory while the core is running.
Denied
No access to memory while the core is running.
SYStem.Mode
Establish the communication with the target
Format:
SYStem.Mode <mode>
<mode>:
Down
Up
Down
Disables the debugger (default). The state of the CPU remains unchanged. The
JTAG port is tristated if System.Option Tristate is checked.In other case the
debugger drives JTAG signals and Reset.
Up
Resets the target, sets the CPU to debug mode and stops the CPU. After the
execution of this command the CPU is stopped and all register are set to the
default level.
SYStem.Option
Display SYStem window
It has the same effect as SYStem.view
©1989-2014 Lauterbach GmbH
M32R Debugger and Trace
16
General SYStem Settings and Restrictions
SYStem.Option DBI
Format:
Enables program break via debug interrupt
SYStem.Option DBI [ON | OFF]
Default: OFF.
When DBI is ON, the chip will stop faster rather than via SW control, provided the CPU offers DBI capability.
SYStem.Option IMASKASM
Format:
Disable interrupts while single stepping
SYStem.Option IMASKASM [ON | OFF]
Default: OFF.
If enabled, the interrupt mask bits of the CPU will be set during assembler single-step operations. The
interrupt routine is not executed during single-step operations. After single step the interrupt mask bits are
restored to the value before the step.
SYStem.Option IMASKHLL
Format:
Disable interrupts while HLL single stepping
SYStem.Option IMASKHLL [ON | OFF]
Default: OFF.
If enabled, the interrupt mask bits of the CPU will be set during HLL single-step operations. The interrupt
routine is not executed during single-step operations. After single step the interrupt mask bits are restored to
the value before the step.
©1989-2014 Lauterbach GmbH
M32R Debugger and Trace
17
General SYStem Settings and Restrictions
SYStem.Option KEYCODE
Format:
Code protection
SYStem.Option Keycode [1…32 Byte keycode]
Default: 12 times 0xFF.
Some of the devices support Code Protection ID feature. Without a valid ID code, there is no access to the
device by the debugger.
Use the AREA window to get further information about the Security status after startup.
Use the following sequence in all your startup scripts or enter it in the command line one time in order to get
access to the device:
SYStem.Option KEYCODE
up to 32 byte representing your keycode
By default use:
SYS.OPTION KEYCODE 0xFF 0xFF 0xFF 0xFF 0xFF 0xFF 0xFF 0xFF 0xFF 0xFF\
0xFF 0xFF
If the device is blank, the debugger automatically uses 12 time 0xFF per default. Then no SYS.OPTION
KEYCODE command is needed. The number and location of bytes depends on the use MCU. It is normally
hard coded!
; Source code example for Renesas Compiler (CPU 32192, code location
; 0x00084)
.SECTION PROTECTID, DATA, ALIGN=1
; H'0000 0084 Protect ID
.DATA.B H'FF
.DATA.B H'FF,H'FF,H'FF,H'FF,H'FF,H'FF,H'FF
.DATA.B H'FF,H'FF,H'FF,H'FF
©1989-2014 Lauterbach GmbH
M32R Debugger and Trace
18
General SYStem Settings and Restrictions
SYStem.Option TriState
Format:
Allow debugger to drive JTAG and reset
SYStem.Option TriState [ON | OFF]
Default: OFF.
If this option is OFF the JTAG signals and nRST line are never driven by the debugger.
SYStem.view
Format:
Display SYStem window
SYStem.view
Displays the SYStem window.
©1989-2014 Lauterbach GmbH
M32R Debugger and Trace
19
General SYStem Settings and Restrictions
Trace specific Commands
SYStem.Option BTM
Format:
Enables program trace messages
SYStem.Option BTM [ON | OFF]
Default: ON.
The option can be switched when the chip has trace support. When BTM is ON, the chip delivers program
trace messages.
SYStem.Option DTM
Format:
Enables data trace messages
SYStem.Option DTM [OFF | Read | Write | ReadWrite]
Default: OFF.
The option can be used if the chip has trace support. When the option is set to READ|WRITE|READWRITE,
the CPU generates data trace messages, according to the selected access type.
SYStem.Option STALL
Format:
Trace message overrun control
SYStem.Option STALL [ON | OFF]
Default: OFF.
The option can be set when the chip has trace support and defines the behavior that becomes active when
the chip intern trace message FIFO buffer gets full. Stall OFF will cause losing of messages when the buffer
overruns.
©1989-2014 Lauterbach GmbH
M32R Debugger and Trace
20
Trace specific Commands
SYStem.Option TRCLK
Format:
Trace output clock ratio
SYStem.Option TRCLK [1/8 | 1/4 | 1/3 | 1/2 | * 1 | *2 | *3 | *4]
Default: 1/2.
The option can be set when the chip has trace support and defines the frequency of the trace output clock
based on the processor frequency. High frequencies can cause electrical connection problems during the
record of trace messages.
SYStem.Option TRDATA
Format:
Trace port width
SYStem.Option TRDATA [4 | 8]
Default: 8.
The option can be set when the chip has trace support and defines port width of the trace data. The
maximum is defined by the derivatives maximum trace pin count.
©1989-2014 Lauterbach GmbH
M32R Debugger and Trace
21
Trace specific Commands
TrOnchip
The OCE unit of the M32R allows to set on-chip breakpoints. The registers are controlled by TRACE32.
TRACE32 uses the on-chip trigger registers to perform on-chip breakpoints, which can be set in the
Data.List window or in the dialog Breakpoint.Set. The current user interface of TRACE32 offers many
possible configurations of the OCE unit. However the usable number of breakpoints is depending on the
device.
•
Up to 32 program address breakpoints
(M32192: 4 program breakpoints)
•
Up to 4 data address breakpoints
(M32192 : 4 data breakpoints)
The amount of range breakpoints is limited, that’s why it is sometimes useful to set the TrOnchip.CONvert
option. When enabled, this option let transform range breakpoints into normal, if necessary. The OCE can
perform more operations than TRACE32 offers with it’s user interface e.g. build a chain of breakpoints.
The on-chip trigger unit events can be also used to control the trace. The possible actions can be defined in
the Breakpoint.Set dialog. To control the trace unit an appropriate action has to be chosen for the Break.Set
command.
b.s flags /TraceData
; Setup a filter for Data Trace (only
; with DTM option set to on)
b.s flags /TraceEnable
; Setup a filter for Program Trace
b.s main /TraceTrigger
; Set Watchpoint message to generate
; Trigger for the Trace analyzer
b.s main /BusTrigger
; Set Watchpoint message to generate a
; trigger pulse on the PodBus
b.s main /BusCount
; Set Watchpoint message to allow
; frequency counter feature
On-chip Breakpoints can stimulate the EVENT0 … 2 pins. These signals can be used as input events for the
Simple Trigger Unit (STU).
TrOnchip.CONVert
Format:
Automatically converts range to single address
TrOnchip.CONVert [OFF | ON]
When enabled (default) the on-chip breakpoints are automatically converted from a range to a single
address if required. If the switch is off, the system will only accept breakpoints which exactly fit to the on-chip
breakpoint hardware.
©1989-2014 Lauterbach GmbH
M32R Debugger and Trace
22
TrOnchip
TrOnchip.RESet
Format:
Resets all TO settings
TrOnchip.RESet
Resets the trigger system to the default state.
TrOnchip.VarCONVert
Format:
Convert variable breakpoints
TrOnchip.VarCONVert [OFF | ON]
When enabled (default) the on-chip breakpoints are automatically converted from a range to a single
address if required. If the switch is off, the system will only accept breakpoints which exactly fit to the on-chip
breakpoint hardware.
The ICE-breaker does not provide resources to set an on-chip breakpoint to an address range. Only bit
masks can be used to mark a memory range with a breakpoint.
If TrOnchip.VarCONVert is set to ON and a breakpoint is set to a scalar variable then it is converted into a
single address breakpoint.
If TrOnchip.VarCONVert is set to OFF variable breakpoints will be set to an address range covering the
whole variable.
TrOnchip.view
Format:
Opens configuration panel
TrOnchip.view
Control panel to configure the on-chip breakpoint and trace registers. The details are described in section
TrOnchip.
©1989-2014 Lauterbach GmbH
M32R Debugger and Trace
23
TrOnchip
Security Levels of the M32R Family
Security Level
Depending on the verification result and the security level, the following
accesses to the device is possible:
•
Security ID code matches: Any access is possibly, there are no limitations
•
Security ID code does not match:
Security Level 0: There is no access at all, even flashing is not possible. The debugger
generates an error message and remains in down state.
Security Level 1: The debugger reaches up state, but all read/write access to the Flash memory,
to RAM, to registers and peripherals are blocked. No command will be accepted, except a
special command to erase the complete Flash area. Any attempt to execute a command (except
the Flash erase command) will cause an error message.
The special Flash erase command takes care that just a complete erased Flash allows access to
the device by the default Security ID code.
©1989-2014 Lauterbach GmbH
M32R Debugger and Trace
24
Security Levels of the M32R Family
Flash Erase if Device is secured
How to manage Flash erase if Security Level 1 is activated and the security key code is unknown?
•
Close all windows on the screen and perform a SYstem.up.
•
Enter diag 0x3000 0xF5 and wait until erasing is ready.
•
Enter the default Security Code and system up the debugger or
just system up the debugger (default Security Code is used implicitly).
Another way is to clear the flash memory of the CPU by using the instruction
…/unsecure.
Now the device is open with a cleared Flash RAM.
The JTAG clock must be limited to 1/2 of the M32 core clock.
Buffers, additional loads or high capacities on the JTAG/COP lines reduce the
debug speed.
Trace related options only in case the device provides Trace capabilities.
©1989-2014 Lauterbach GmbH
M32R Debugger and Trace
25
Security Levels of the M32R Family
General Restrictions and Hints
System.Up duration
System.Up takes 1 … 2 s caused by the target CPU.
If a new trace port width is selected (4->8 or 8->4), next
SYS.UP command takes a bit longer due to probe CPLD
reprogramming.
ASM debugging in hardware
loops - stepping
The debugger tries to step over delay slots. If the debugger is
not successful, set a software breakpoint after the hardware
loop and use go to step over the hardware loop.
HLL debugging in optimized
code
HLL debugging in optimized code is restricted. Source lines
may be assigned wrong, local variables may not be displayed.
Debugging with interrupts
When IMASKHLL or IMASKASM is enabled the debugger won’t
update correctly the interrupt disable bit in the SR register in
case the code executed the DI instruction. Use
SYStem.Option.IPLDI to switch the behavior.
Ignore RESET Monitoring
Normally the debugger monitors RESET and stops operation if
RESET is asserted. If one wants to disable RESET monitoring, he
has to enter
DIAG 0x3000 0xB1 1
To allow RESET monitoring again, enter
DIAG 0x3000 0xB1 0 (default after startup)
External Watchdog Timer
An external WDT must normally be turned off. For the case that it
is not possible, there are 2 solutions.
1. For the case the WDT can be feed by toggling a CPU pin:
DIAG 0x3000 0xEA <pin> (Example: DIAG 0x3000 0xEA
124.)
DIAG 0x3000 0xEB <0/1> (Example DIAG: 0x3000 0xEB 1 for
on)
2. For the case the WDT must be feed by anyhow:
Refer to DATA.TIMER.SEQUENCE and similar instructions
By default external WDT support is not enabled.
©1989-2014 Lauterbach GmbH
M32R Debugger and Trace
26
Security Levels of the M32R Family
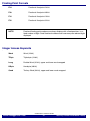
Floating Point Formats
F24
Fractional fixed point 24 bit
F48
Fractional fixed point 48 bit
F16
Fractional fixed point 16 bit
F32
Fractional fixed point 32 bit
NOTE:
Fractional floating point numbers are always displays with a fixed precision, i.e. a
fixed number of digits. Small fractional numbers can have many non relevant digits
displayed.
Integer Access Keywords
Word
Word (16 bit)
TByte
Triple byte (24 bit)
Long
Double Word (32 bit), upper and lower word swapped
HByte
Hexabyte (48 bit)
Quad
Tertiary Word (64 bit), upper and lower word swapped
©1989-2014 Lauterbach GmbH
M32R Debugger and Trace
27
Security Levels of the M32R Family
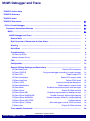
JTAG Connection
Mechanical Description of the 10-pin Debug Cable
This connector is defined by ARM and we recommend this connector for all future designs. Our debugger
“JTAG Debugger for StarCore” (LA-7845) is supplied with this connector:
Signal
TCK
TDI
TMS
DBI
VCC
Pin
1
3
5
7
9
Pin
2
4
6
8
10
Signal
GND
TDO
TRSTVCCTRB (trace buffer)
RST-
This is a standard 10 pin double row connector (pin to pin spacing: 0.100 in.). We strongly recommend to
use a connector on your target with housing and having a center polarization (e.g. AMP: 2-827745-0). A
connection the other way around indeed causes damage to the output driver of the debugger.
Electrical Description of the 10-pin Debug Cable
•
The input and output signals are 3.3 V TTL compatible.
VTREF is used as a sense line for the target voltage. It is also used as supply voltage for the
supply translating transceiver of the ICD interface to make an adaptation to the target voltage
(1.5 V) 1.8 … 3.3 V (3.6 V). On the newer debug cables (September 2003 and newer) it is used
as sense line, only.
•
RST, TDI, TMS, TCK: In normal operation mode the driver is enabled, but it can be disabled to
give another tool access to the JTAG port. In environments where multiple tools can access the
JTAG port, it is required that there is a pull-up or pull-down resistor at TCK. This is to ensure that
TCK maintains its level during a hand over between different tools.
•
TDO is an ICD input. It is connected to the supply translating transceiver.
•
RST (reset) is used by the debugger to reset the target CPU or to detect a reset on the target. It
is driven by an open collector buffer. A pull-up resistor is included in the ICD connector. The
debugger will only assert a pulse on nSRST when the SYStem.UP, the SYStem.Mode Go or the
SYStem.RESetOUT command is executed.
•
DBI is an output which can force the CPU into debug mode by hardware.
•
VCCTRB is an output and supplies the trace date buffer on the target. Normally 1.8 V.
•
N/C (= Vsupply) is not connected in the ICD. This pin is used by debuggers of other
manufacturers for supply voltage input. The ICD is self-powered.
©1989-2014 Lauterbach GmbH
M32R Debugger and Trace
28
JTAG Connection
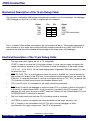
Mechanical Description of the 20-pin Trace Connector
Signal
TRCK
TRSYNC
TRDATA1
TRDATA2
VSS
TRDATA5
TRDATA6
VCC
EVENT1
EVENT3
Pin
1
3
5
7
9
11
13
15
17
19
Pin
2
4
6
8
10
12
14
16
18
20
Signal
VSS
TRDATA0
VSS
TRDATA3
TRDATA4
VSS
TRDATA7
EVENT0
EVENT2
N/C
This connector is the standard for single M32R targets. For pure debug features, this connector is not
needed. Not using this connector does not impact debug features at all.
Pins
Connection
Description
Recommendations
1
TRCLK
Trace Clock
2
VSS
System Ground Plan
Connect to digital ground.
3
TRSYNC
TRace Sync.
Strobe for valid Trace data.
4
TRDATA0
Trace data 0
5
TRDATA1
Trace data 1
6
VSS
System Ground Plan
7
TRDATA2
Trace data 2
8
TRDATA3
Trace data 3
9
VSS
System Ground Plan
10
TRDATA4
Trace data 4
11
TRDATA5
Trace data 5
12
VSS
System Ground Plan
13
TRDATA6
Trace data 5
14
TRDATA7
Trace data 6
Connect to digital ground.
Connect to digital ground.
Connect to digital ground.
©1989-2014 Lauterbach GmbH
M32R Debugger and Trace
29
JTAG Connection
15
VCC
Target VCC
16
EVENT0
Event output
17
EVENT1
Event output
18
EVENT2
Event output
19
EVENT3
Event output
20
N/C
Just used for voltage
reference.
©1989-2014 Lauterbach GmbH
M32R Debugger and Trace
30
JTAG Connection
Memory Classes
Memory Class
Description
D,C
Data memory. Memory seen from the cores point of view.
P
Program memory.
©1989-2014 Lauterbach GmbH
M32R Debugger and Trace
31
Memory Classes
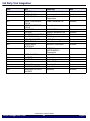
Support
M32176
M32180
M32192
YES
YES
YES
INSTRUCTION
SIMULATOR
POWER
INTEGRATOR
ICD
TRACE
ICD
MONITOR
ICD
DEBUG
FIRE
ICE
CPU
Available Tools
YES
YES
YES
Compilers
Language
Compiler
Company
Option
C
GNU-C
ELF/DWARF2
C
CC32R
C
D-CC
Free Software
Foundation, Inc.
Renesas Technology,
Corp.
Wind River Systems
Comment
ELF/DWARF
ELF/DWARF
Realtime Operation Systems
Name
Company
Comment
OSEK
ProOSEK
RTXC Quadros
Elektrobit Automotive GmbH
Quadros Systems Inc.
via ORTI
via ORTI
©1989-2014 Lauterbach GmbH
M32R Debugger and Trace
32
Support
3rd Party Tool Integration
CPU
Tool
Company
ALL
ALL
ALL
ADENEO
X-TOOLS / X32
CODEWRIGHT
ALL
CODE CONFIDENCE
TOOLS
CODE CONFIDENCE
TOOLS
EASYCODE
ECLIPSE
RHAPSODY IN MICROC
RHAPSODY IN C++
LDRA TOOL SUITE
ATTOL TOOLS
VISUAL BASIC
INTERFACE
LABVIEW
Adeneo Embedded
blue river software GmbH
Borland Software
Corporation
Code Confidence Ltd
ALL
ALL
ALL
ALL
ALL
ALL
ALL
ALL
ALL
ALL
ALL
ALL
ALL
ALL
ALL
ALL
CODE::BLOCKS
C++TEST
RAPITIME
DA-C
SIMULINK
VECTORCAST/RSP
WINDOWS CE PLATF.
BUILDER
Host
Windows
Windows
Windows
Code Confidence Ltd
Linux
EASYCODE GmbH
Eclipse Foundation, Inc
IBM Corp.
IBM Corp.
LDRA Technology, Inc.
MicroMax Inc.
Microsoft Corporation
Windows
Windows
Windows
Windows
Windows
Windows
Windows
NATIONAL
INSTRUMENTS
Corporation
Open Source
Parasoft
Rapita Systems Ltd.
RistanCASE
The MathWorks Inc.
Vector Software
Windows
Windows
Windows
Windows
Windows
Windows
Windows
Windows
©1989-2014 Lauterbach GmbH
M32R Debugger and Trace
33
Support
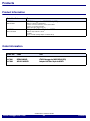
Products
Product Information
OrderNo Code
Text
LA-7661
JTAG Debugger for M32R SDI-3 (ICD)
DEBUG-M32R
Adapter for Debug on M32R SDI-3
includes software for Windows, Linux and MacOSX
requires a Power Debug Module
debug cable with 10 pin connector
LA-7662
Adapter Half-Size 10 pin for M32R
AD-HS-10-M32R
Adapter 10 pin 100 mil to 50 mil
for M32R
only for LA-7661 (Debug Adapter for M32R SDI-3)
Order Information
Order No.
Code
Text
LA-7661
LA-7662
DEBUG-M32R
AD-HS-10-M32R
JTAG Debugger for M32R SDI-3 (ICD)
Adapter Half-Size 10 pin for M32R
©1989-2014 Lauterbach GmbH
M32R Debugger and Trace
34
Products