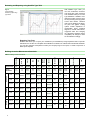
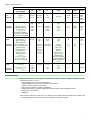
1
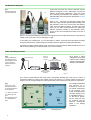
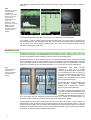
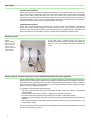
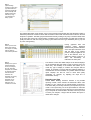
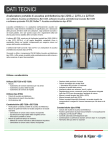
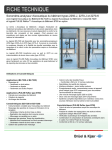
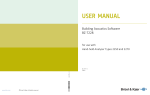
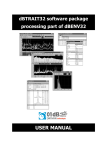
PRODUCT DATA
Hand-held Building Acoustics Analyzer Types 2250 and 2270 with Building Acoustics
Software BZ-7228
Building Acoustics is the assessment of sound insulation in
buildings and building elements. It is important for the well-being of
people in their homes, workplace or public venues, thus minimum
standards are set in the building regulations of each country.
BZ-7228 software is available for Hand-held Analyzers Type 2250
and Type 2270. It provides the flexibility, ease of use and
confidence in your results that field measurements require in
building acoustics.
Type 2270 users can turn their analyzer into a 2-channel building
acoustics analyzer with 2-channel Option BZ-7229.
Back at the office, Qualifier Type 7830 and PULSE Reflex Building
Acoustics Type 8780 offers versatile post-processing and reporting
of your measurement results.
Uses and Features
Uses (BZ-7228)
Uses (Type 7830 or Type 8780)
• Measurement of:
– Airborne sound insulation
– Façade sound insulation
– Impact sound insulation
• Building acoustics calculation
• Report generation
• Data archiving
Features (Type 7830 or Type 8780)
Features (BZ-7228)
• Complete hand-held building acoustics analyzer
• Measures source and receiving room level spectra
– Built-in pink and white noise generator
– Equalisation of sound source spectra
– Parallel or serial measurements
• Measures reverberation time spectra:
– Impulse and Interrupted Noise methods
– Built-in pink and white noise generator
• Measurement position management
• Calculates final results on the spot: ISO plus
12 national standards
• Measurement quality indicators
• Colour touch screen user interface
• Signal recording, voice commentary and integrated camera
(Type 2270 only) to document test environment
• Single-channel measurements (Type 2250 and 2270)
• 2-channel measurements (Type 2270 only, with BZ-7229)
• Building acoustics results calculation
• Analysis and report generation in one application
(Type 8780 incorporates Microsoft® Office)
• Automatic data integrity checking
• Before and after scenario combination and comparison in one
project (Type 8780 only)
• ISO plus 12 national standards
The Hand-held Analyzers
Types 2250 and 2270 are robust, hand-held anayzer
platforms designed to host a wide range of sound and
vibration measurement applications. Their uses range
from assessing environmental and workplace noise to
industrial quality control and product development (Product
Data BP 2025).
Fig. 1
Hand-held Analyzers
Type 2250 and 2270
Easy to use – their light and ergonomic design make
them easy to grip, hold and operate single-handedly. Their
high-resolution colour touch screens show the analzyer
setup, status and data at a glance, and with a tap of the
stylus, you can make quick selections. The “traffic light”
indicator, positioned centrally on the pushbutton panel,
shows you the current measurement status, even from a
distance.
Robust – the hand-held analyzers are built for the tough environment of field measurements. They will work
reliably in rain, dust, heat, frost, and during day or night.
To document your measurement, you can add spoken or written comments and make signal recordings
during any measurement. (Note that signal recordings require the Signal Recording Option BZ-7226.)
Type 2250 is a single-channel analyzer, while Type 2270 is 2-channel and has additional features such as a
built-in camera (allowing you to attach photos to your measurements).
Tasks in Building Acoustics
Fig. 2
Typical configuration
for building acoustics
measurements: sound
source, generator,
analyzer and PC for
reporting
2250/2270
Hand-held
Analyzer
4292-L OmniPower
2734-A Power Amplifier
Fig. 2 shows a typical
configuration for the most
common task in building
acoustics measurements:
airborne sound insulation.
8780 or 7830
Building Acoustics Software
with BZ-7228
Building Acoustics
Software
Report
PC
090062/3
Fig. 3 shows a typical airborne task setup using a loudspeaker (emitting pink noise) and a number of
microphone positions to measure the average source room spectrum L1, and the average receiving room
spectrum L2. The average background noise spectrum B2 is also measured to verify the true L2 spectrum.
Fig. 3
Sound source and
microphone positions
for measuring airborne
sound insulation
L1 = Source room level
L2 = Receiving room
level
B2 = Background level
T2 = Reverberation
Time
L1
Source Pos 1
L2
T2
Mic Pos 1
Area
S
Mic Pos 1
Mic Pos n
Source Pos 2
Source Room
2
B2
Mic Pos n
Volume V
Partition
Receiving Room
070141
The average reverberation
time spectrum, T2, is
measured to correct for
the amount of absorption
in the receiving room.
Finally, the single number
result (for example: DnTw)
is calculated from the L1,
L2, B2 and T2 spectra,
and the result can then
be compared with the
minimum requirements
stated in the building
regulations.
The sound level depends on the position in the rooms, so several microphone positions are used to measure
the average of the source room level, L1, the average of the receiving room level L2 and the average of the
background noise level B2. The average reverberation time T2 is also measured using several positions.
In Touch with your Measurements
The spectra required (L1, L2, etc.,) may be measured in any order, to suit field conditions and your
preferences. Fig. 4, Fig. 5 and Fig. 6 show typical displays when performing both single- and 2-channel
building acoustics measurements.
Fig. 4 shows a typical building acoustics display when you are ready to measure the first L2 position, with
source position 1.
Fig. 4
Typical single-channel
display when you are
ready to measure the
first L2 position, with
source position 1
Standard
Path
Task
Generator
Function
Measurement Status
Sound Field
Elapsed Time
Position
Leq
Spectrum (Leq)
Instant. Level
Spectrum (Instant.)
Cursor
Y Scale
Broadband Levels
Spectrum
Parameter
View Tabs
Parameter
Menus
Clock
The instantaneous (live) spectrum is shown and the high-resolution, colour, touch screen shows the setup,
status and data at a glance.
Using the stylus (or navigation pushbuttons) you can directly activate the indicated features (except those
with dashed lines in Fig. 4 above).
You can check the generator and loudspeaker signal level by tapping the Generator icon to switch the
generator on and off.
Fig. 5
Typical single-channel
display
Left: Inspection phase
Right: Save phase
Data not yet saved
Smileys
Data saved
Ready for Pos. 2
L2 (average)
Once the spectrum at position 1 has been measured (for the preset time of 10 s), you may inspect the
spectrum before saving (see Fig. 5, left).
A yellow ‘smiley’ icon indicates that you may be able to improve the measurement at one frequency band.
Tap the smiley icon to read the explanation and take the necessary action.
3
Press the Save pushbutton to save the measurement (see Fig. 5, right). You are now ready to measure at
position 2.
Fig. 6
Left: Typical 2-channel
inspection phase –
Façade Sound
Insulation is measured
with traffic noise as a
source. This is
indicated by the car
‘traffic’ icon
Centre: 2-channel
save phase – overview
Right: Type 2270
connected to two
microphones through
the Dual 10-pole
Adaptor
2-channel measurements (Type 2270 only) are as easy as single-channel measurements.
In Fig. 6 (left), L1 and L2 Position 3 has been measured and saved. You are now ready to measure in the
next 2-channel position. The Overview tab view (Fig. 6, centre) shows all the measured and saved positions,
with any smiley icons and annotations (paper clip icon). Any position may be excluded from the average
calculation by tapping the check mark.
Reverberation Time
Reverberation Time (RT) is an important parameter describing the acoustic quality of a room or space. It is
important for sound levels, speech intelligibility and the perception of music. In building acoustics, it is used
to correct for the effects of RT on building acoustics and sound power measurements.
Reverberation Time is the decay time for sound in a room after the excitation stops. It is the time for a 60 dB
drop in level, but the decay is usually measured over a 20 or 30 dB drop and then extrapolated to the 60 dB
range. It is labelled T20 and T30, respectively, for those two evaluation ranges. The Reverberation Time may
range from 0.1 seconds (or less) in anechoic chambers, to 10 or more seconds in large public spaces.
Fig. 7
Reverberation time
measurement –
measured using the
interrupted noise
method
Reverberation Time varies between
positions in a room, so it is usually
measured at several positions. The average
can be determined for the RT spectra, or
the decays for each frequency band can be
averaged and the Reverberation Time
spectrum then calculated for the averaged
decays (ensemble average).
Reverberation Time can be measured using
either Impulsive Excitation (Schroeder
Method), from a starting pistol or balloon
burst, or by using Interrupted Noise.
All it takes to measure Reverberation Time
is to press the Start/Pause pushbutton (and
burst the balloon in the case of impulsive
excitation). Reverberation times from 0.1 to
up to 20 seconds are then measured at peak sound levels up to 143 dB. No trial measurements, no
overloads, and the ‘traffic light’ clearly shows the measurement status from a distance.
A Reverberation Time spectrum, showing T20 and T30, is included in Fig. 8 (left). A yellow ‘smiley’ icon
indicates that you may be able to improve the measurement at one (or more) frequency bands – if just one
position shows a red smiley, then the ‘master’ smiley will also be red. Tap the relevant smiley icon to read the
explanation. A reverberation decay curve for 1/3-octave band is included in Fig. 8 (centre) and an overview
of results at one frequency band is included in Fig. 8 (right).
4
Fig. 8
Reverberation time
spectrum (left);
reverberation decay
curve (centre); and
overview of results
(right)
NOTE: A dedicated Reverberation Time Software module (BZ-7227) is also available. Please contact your
Brüel & Kjær representative for details.
Calculations
Standards
Even though the measurement functions (L1, L2, B2, T2) are the same for any building acoustics
measurement, the detailed measurement setup and calculation procedures depend on your national building
regulations. To ensure that your measurements comply, select the relevant standard before you save your first
measurement. This will automatically activate the required setup for measurement and calculation. An
overview of the available standards is shown in Table 1, and the calculated parameters in Table 2 (see page 8).
Results
In addition to measurement data, you may also need the receiving room volume and the partition area for
some calculations. These can of course be entered using the stylus/navigation pushbuttons on the
appropriate instrument display page. You may want to reuse some of your earlier measurements (like a T2
spectrum known from a similar receiving room), to save time. This is also possible, by using a re-use facility
in the Explorer display.
The calculations use a reference curve for frequency weighting of the sound reduction spectrum, resulting in
a single number like R'w = 52 dB (the weighted field sound reduction index according to the ISO 140–4). This
means you will know on site if your construction under test fulfils the minimum requirements of the local
building regulations. Examples of final results are shown in Fig. 9.
Fig. 9
With the required data
measured, final results
are shown, including
the reference curve.
For some results the
volume of the receiving
room and the area of
the partition must be
entered
5
Other Tasks
Façade Sound Insulation
Façade sound insulation is a variant of airborne sound insulation, with its own standards. The “source room”
is the space outside the facade, and the sound source may be road traffic or a loudspeaker representing
outdoor noise. When using traffic noise, the indoor and outdoor sound levels must be measured
simultaneously, requiring 2-channel measurements (Type 2270 only). The outdoor microphone positions are
flush with the facade, or 2 m in front of it. Calculations are similar to those of the airborne sound insulation,
but take the pressure increase at the microphone positions into account.
Impact Sound Insulation
Impact sound is typically caused by footsteps, and to measure impact sound insulation a standardised
impact sound source (tapping machine) is placed in the source room. The receiving room levels are
measured as for airborne sound insulation, with several positions of the tapping machine. Calculations are
like those for airborne sound insulation, except the results represent absolute (not relative) levels.
Wireless Systems
Fig. 10
Optional wireless
systems are available to control the
sound source for
airborne and impact
sound insulation
measurements
In the field, using a wireless system can speed up
measurements by reducing the number of cables and make it
easier for you to move between microphone positions and
rooms.
Review, Analysis and Report Generation using PULSE Reflex Building Acoustics Type 8780
PULSE Reflex Building Acoustics Type 8780 is the software package for post-processing and reporting of
building acoustics measurements made with Type 2250/2270. Measured data can be directly imported from
Type 2250/2270 into Type 8780 for viewing, further analysis/re-analysis and reporting of data. In addition to
being a post-processing tool, Type 8780 allows you to control Type 2250/2270 software upgrades as well as
licensing of the Type 2250/2270 applications.
The application incorporates the following features:
• ‘Fast-track’ report generation using the PULSE Reflex workflow concept and a library of user-defined
report templates
• Versatile handling of measurement data in combining and comparing assessments
• Interactive measurement integrity checks ensuring the best quality of calculation possible
• Available in several languages, Type 8780 can generate reports complying with national and international
legislation
• Edit measurement data in the interactive display to instantly reveal which factors contribute most to your
sound insulation results
Once your measurements are imported, Type 8780 will display data numerically and graphically, in one clear
and concise environment, see Fig. 11.
6
Fig. 11
Typical building
acoustics project using
Type 8780. Data are
presented graphically
and numerically with
detailed data quality
indications, using
Type 2250/2270’s
smiley system
The tabular Data Editor (at the bottom of the screen) presents all measured data and calculation results in
detail and provides the controls to refine data as well as to select which measurements to include in the final
analysis of a partition. The table groups all information visually, making it very easy to examine detail, while
at the same time seeing the overall results. In addition to the numerical data, the table also reveals the
quality and status of each item using the smiley system well known from Type 2250/2270 (see Fig. 12) and
by colour coding item(s).
Fig. 12
Close-up of the Data
Editor table showing
an example of a smiley
indicator with the
associated explanation
Having graphical data and
numerical
values
displayed
simultaneously makes evaluation
of the data (and interactive work
with the data) a very intuitive
process. Changes applied in one
part of the interface, such as,
editing the graphs or items in a
table, will immediately be
reflected in the other parts.
Fig. 13
Example of a report in
standard template
format, for example,
ISO 140. Standard
templates are available
for selected national
and international
standards. All
templates can be fully
customised. New
templates can be
derived from the
delivered ones, or
created from scratch
The software comes with default setups for all relevant displays
for the measured data and results, so that a report is just a few
clicks away. The flexibility of the software also allows you to
create any type of display to combine and compare data as
needed, for example to compare data from different partitions or
measurements of sound insulation of a partition before and after
repair. Displays can also be used to refine data quality
graphically, for example, by adjusting the slope line in
reverberation decays.
Reporting your Data
PULSE Reflex Building Acoustics includes a very flexible
reporting module, which embeds the Microsoft® Office suite
installed on your system into the PULSE Reflex environment.
This means that you can fully customise your reports and you can
create a new report using one of the pre-installed or self-made
templates using only a few mouse clicks. See a report example in
Fig. 13. Reports can remain linked to the data, so that if you need
to revise your analysis, a single click will refresh the report to
reflect all the changes.
7
Reviewing and Reporting using Qualifier Type 7830
With Qualifier Type 7830, you
can view, recalculate, document
and report data. View measured
and calculated data just as with
Type 2250/2270. Qualifier’s user
interface provides a Project Tree
for easy browsing and copy/paste
across data folders. Selected
data can be displayed as tables,
3D plots and graphs. Editing
options include adjustment of
reverberation decay graphical
alignment, manual data entries,
copy/paste data and changing
the calculation standard (where
compatible). All changes to data
are annotated accordingly.
Fig. 14
Typical building
acoustics project using
Type 7830
Reporting Your Data
Qualifier also allows you to report your calculations (or recalculations) using templates based on specific
standards such as ISO 140. Templates are available for a selection of national and international standards.
You can also customise a template to include your company’s logo in the report, or create a report from a
blank report template.
Building Acoustics Measurement Standards
Austria
Italy
UK
England
Wales
Sweden
Switzerland
France
Spain
ISO
DIN
ÖNORM
UNI
BS
BREW
SS
Sia
NF-S31
NBE
NEN
NEN’06
ASTM
Typical
Parameters
R´
L´n
R
L´n
DnT
L´nT
Dn
Ln
DnT
L´nT
DnT
R´
L´n
DnT
L´nT
DnAT
LnAT
DnAT
LnAT
llu
lco
DnT,A
LnT,A
FTL
Ln
Lab
10140–2*
EN
20140–3
S 5101
8270–1
EN
20140–3
051
74-04084/3
Field
140–4
52210–1 S 5100–1 8270–4
2750–4
Façade
140–5
52210–5 S 5100–3 8270–5
Impact
Lab
RT
Field
3382–2
Rating
*
USA
181
054,
-057
74-04084/4
5077
5077
E336–90
2750–5
EN
20140–5
181
055,
-057
74-04084/5
5077
5077
E966–90
8270–6
2750–6
EN
20140–6
-052
74-04084/6
52210–1 S 5100–2 8270–4
2750–7
EN
20140–7
056,
-057
74-04084/7
S 5101
BREW
181
52212
5077
E1007-11
5077
5077
NPR
5079
Airborne
717–1
52210–4 S5100–1 8270–7
5821–1, BS EN
SS–3
717-1 ISO 717–1
181
-057
NBECA88
5077
Impact
717–2
52210–4 S5100–2 8270–7
5821–2
SSISO 717–2
181
-057
NBECA88
5077
Partially fulfilled.
8
20140–4
10140–3* 52210–1
140–7
EN
20140–3
Netherlands
Germany
Measurement
Airborne
International
Table1 Building acoustics standards
E413–73
E1332–90
E989
Table2 Calculated parameters
Measurement Standards
ISO, DIN, ÖNORM,
UNI, BS, BREW
SS
Sia
NF
ISO 140
ISO 717
ISO 140
ISO 717
ISO 140
ISO 717
D Dn DnT R´ R
ISO
plus:
ISO
plus:
Dw8
DnTw8
R´w8
Rw8
Basic
Standards:
Airborne
Calculated
parameters:
Façade
Dw Dw+C Dw+Ctr
Dnw Dnw+C Dnw+Ctr
DnTw R´w or Rw
+C +Ctr
+C50-3150 +C50-5000
+C100-5000 +Ctr50-3150
+Ctr100-5000 +Ctr50-5000
R´45° R´tr,s
Dls,2m Dls,2m,n
Dls,2m,nT Dtr,2m
Dtr2m,n Dtr,2m,nT
See ISO
Calculated
parameters:
L´nt L´nT Ln
L´nw L´nTw or Lnw
+Ci +Ci 50-2500
NEN
NEN’06
ASTM
NF
S31-05x
ISO 140
NEN
5077
NEN
5077-2006
ASTM
E336,
1007,
E966,
E1332
D DnT R
ISO
plus:
DnT
DnT
NR NNR
FTL
DnTw+C−Cv
DnATrose
DnATroute
Rrose
Rroute
DA
DnAT
RA
R´A
Ilu
Ilu;k
DnT,A
DnT,A,k
ISO
plus:
DnT45°
DnTtr
ISO
plus:
Gi
Gi
GA
GA;K
GA
GA;K
DnATroute45°
D45°nT
Dls,2m,nT,w
DnATroute
+C−Cv
Dtr,2m,nT,
w+C−Cv
D45°nT,w+C
tr−Cv
Calculated
Dls,2m,w Dls,2m,n,w
parameters: Dls,2m,nT,w Dls,2m,nT,w+C
Dls,2m,nT,w+Ctr
Dtr,2m,w Dtr,2m,n,w
Dtr,2m,nT,w+C
Dtr,2m,nT,w+Ctr
R´45°w or R´tr,s,w
+C +Ctr
+C50-3150 +C 50-5000
+C 100-5000 +Ctr50-3150
+Ctr 100-5000 +Ctr 50-5000
Impact
NBE
ISO
plus:
L´nw8
L´nTw8
Lnw8
See ISO
R´A45°
Dls,2m,nAT
Dtr,2m,nAT
Dtr,2m,A
Dls,2m,A
Dls,2m,n,w+C
Dls,2m,n,w+Ctr
R´A45°AavD,2m,
AavD,2m,n,AavD,2m,
nT,AavR´A45°AefD,2m,
AefD,2m,n,AefD,2m,
nT,Aef
LnT Ln
ISO
plus:
LnAT
LnA
LnAT
LnA
NIC
NNIC
FSTC
OILR
OITL
OITC
LnT
LnT Ln
Ico
IIC NISR
Complete System
Brüel & Kjær provides a wide range of accessories to help you build a complete building acoustics
measurement system, such as:
• Power amplifier and a choice of sound sources
• Tapping machine for impact sound insulation measurements
• Tripods, extension cables and flat cables
• Microphone and cable for 2-channel applications
• Wireless transmission of generator signal and wireless remote control of tapping machine
• Rotating microphone boom
• Calibrators
Some of these options are shown in Fig. 15. Please refer to separate product data sheets for details. Ask
your local Brüel & Kjær representative for more information on complete systems.
9
Fig. 15
Accessories for
building acoustics
measurements
4231 Calibrator
AQ-0673
2734-B Power Amplifier
including AKG SR 450 Receiver
AO-0523
4292-L
OmniPower
Sound Source
UA-1476 Wireless
Remote Control
Receiver
UA-1476
Wireless
Remote
Control
Receiver
AKG PT 450 wireless
audio transmitter
4189 Microphone
ZC-0032 Preamplifier
UA-1317
Microphone
Holder
AR-0199 10-pin Flat Cable
UA-0801 JP-1041 Dual 10-pole Adaptor
Light-weight
Tripod
Building Acoustics Software
8780 and 7830
UA-1476 Remote
Control Wireless Transmitter
AQ-0633
10-pin Mic.Extension Cables:
AO-0697-030 3 m
AO-0697-100 10 m
3923 Rotating
Microphone
Boom
3207 Tapping Machine
AO-0524
*
4224 Sound Source
WL-1330 LEMO 10-pole
female to 7-pole
Brüel & Kjær male
WL-1330 7-pole
Brüel & Kjær female to
10-pole LEMO male
* Not supplied by
Brüel & Kjær
130812/1
Accredited Calibration Services at Brüel & Kjær
Ensure traceable measurement history from day one with accredited calibration for your Type 2250/2270.
We recommend calibration at a Brüel & Kjær ISO 7025 certified laboratory bi-annually or annually. Any
errors detected during calibration will be repaired prior to returning the instrument to you.
Compliance with Standards
The CE marking is the manufacturer's declaration that the product meets the requirements of the applicable EU directives
RCM mark indicates compliance with applicable ACMA technical standards – that is, for telecommunications, radio
communications, EMC and EME
China RoHS mark indicates compliance with administrative measures on the control of pollution caused by electronic
information products according to the Ministry of Information Industries of the People’s Republic of China
WEEE mark indicates compliance with the EU WEEE Directive
Safety
EN/IEC 61010– 1, ANSI/UL 61010–1 and CSA C22.2 No.1010.1: Safety requirements for electrical equipment for
measurement, control and laboratory use
EMC Emission
EN/IEC 61000–6–3: Generic emission standard for residential, commercial and light industrial environments
EN/IEC 61326: Electrical equipment for measurement, control and laboratory use – EMC requirements
CISPR 22: Radio disturbance characteristics of information technology equipment. Class B Limits
IEC 61672–1, IEC 61260, IEC 60651 and IEC 60804: Instrumentation standards
NOTE: The above is only guaranteed using accessories listed in this Product Data
EMC Immunity
EN/IEC 61000–6–2: Generic standard – Immunity for industrial environments
EN/IEC 61326: Electrical equipment for measurement, control and laboratory use – EMC requirements
IEC 61672–1, IEC 61260, IEC 60651 and IEC 60804: Instrumentation standards
NOTE: The above is only guaranteed using accessories listed in this Product Data
Temperature
IEC 60068–2–1 & IEC 60068–2–2: Environmental Testing.
Cold and Dry Heat.
Operating Temperature: –10 to +50°C (14 to 122°F)
Storage Temperature: –25 to +70°C (–13 to 158°F)
Humidity
IEC 60068–2–78: Damp Heat: 93% RH (non-condensing at +40°C (104°F)). Recovery time 2 ~ 4 hours
Mechanical
Non-operating:
IEC 60068–2–6: Vibration: 0.3 mm, 20 m/s2, 10 – 500 Hz
IEC 60068–2–27: Bump: 1000 bumps at 400 m/s2
IEC 60068–2–27: Shock: 1000 m/s2, 6 directions
Enclosure
IEC 60529 (1989): Protection provided by enclosures: IP20
10
Specifications – Type 2250/2270
Microphone
SUPPLIED MICROPHONE
Type 4189: Prepolarized Free-field ½″ Microphone
or
Type 4190: Free-field ½″ Microphone
Nominal Open-circuit Sensitivity: 50 mV/Pa (corresponding to
−26 dB re 1 V/Pa) ± 1.5 dB
Capacitance: 14 pF (at 250 Hz)
MICROPHONE PREAMPLIFIER ZC-0032
Nominal Preamplifier Attenuation: 0.25 dB
Connector: 10-pin LEMO
Extension Cables: Up to 100 m in length between the microphone
preamplifier and Type 2250/2270, without degradation of the
specifications
MICROPHONE POLARIZATION VOLTAGE
Selectable between 0 V and 200 V
SELF-GENERATED NOISE LEVEL
Typical values at 23°C for nominal microphone open-circuit sensitivity:
Weighting
Microphone
Electrical
Total
“A”
14.6 dB
12.4 dB
16.6 dB
“B”
13.4 dB
11.5 dB
15.6 dB
“C”
13.5 dB
12.9 dB
16.2 dB
“Z” 5 Hz–20 kHz
15.3 dB
18.3 dB
20.1 dB
“Z” 3 Hz–20 kHz
15.3 dB
25.5 dB
25.9 dB
Interface
KEYBOARD
Pushbuttons: 11 keys with backlight, optimised for measurement control
and screen navigation
ON-OFF BUTTON
Function: Press 1 s to turn on; press 1 s to enter standby; press for more
than 5 s to switch off
STATUS INDICATORS
LEDs: Red, amber and green
DISPLAY
Type: Transflective back-lit colour touch screen 240 × 320 dot matrix
Colour Schemes: Five different – optimised for different usage
scenarios (day, night, etc.)
Backlight: Adjustable level and on-time
USER INTERFACE
Measurement Control: Using pushbuttons on keyboard
Setup and Display of Results: Using stylus on touch screen or
pushbuttons on keyboard
Lock: Keyboard and touch screen can be locked and unlocked
USB INTERFACE
USB 2.0 OTG Micro AB and USB 2.0 Standard A sockets
MODEM INTERFACE
Connection to Internet through GPRS/EDGE/HSPA modem connected
through the USB Standard A Socket
Supports DynDNS for automatic update of IP address of host name
PRINTER INTERFACE
PCL printers, Mobile Pro Spectrum thermal printer or Seiko DPU
S245/S445 thermal printers can be connected to USB socket
MICROPHONE FOR COMMENTARY
Microphone, which utilises Automatic Gain Control (AGC), is
incorporated in underside of analyzer. Used to create voice annotations
for attaching to measurements
CAMERA (TYPE 2270 ONLY)
Camera with fixed focus and automatic exposure is incorporated in
underside of analyzer
Used to create image annotations for attaching to measurements
Image Size: 2048 x 1536 pixels
Viewfinder Size: 212 x 160 pixels
Format: JPG with exif information
LAN INTERFACE SOCKET
• Connector: RJ45 Auto-MDIX
• Speed: 100 Mbps
• Protocol: TCP/IP
INPUT SOCKET (2 – TYPE 2270 ONLY)
Connector: Triaxial LEMO
Input Impedance: ≥ 1 MΩ
Direct Input: Max. input voltage: ± 14.14 Vpeak
CCLD Input: Max. input voltage: ± 7.07 Vpeak
CCLD Current/voltage: 4 mA/25 V
TRIGGER SOCKET
Connector: Triaxial LEMO
Max. Input Voltage: ± 20 Vpeak
Input Impedance: > 47 kΩ
Precision: ± 0.1 V
OUTPUT SOCKET
Connector: Triaxial LEMO
Max. Peak Output Level: ± 4.46 V
Output Impedance: 50 Ω
HEADPHONE SOCKET
Connector: 3.5 mm Minijack stereo socket
Max. Peak Output Level: ± 1.4 V
Output Impedance: 32 Ω in each channel
Power
EXTERNAL DC POWER SUPPLY REQUIREMENTS
Used to charge the battery pack in the analyzer
Voltage: 8 – 24 V DC, ripple voltage < 20 mV
Current Requirement: Min. 1.5 A
Power Consumption: < 2.5 W, without battery charging, < 10 W when
charging
Cable Connector: LEMO Type FFA.00, positive at centre pin
EXTERNAL AC MAIN SUPPLY ADAPTOR
Part No.: ZG-0426
Supply Voltage: 100 – 120/200 – 240 V AC; 47 – 63 Hz
Connector: 2-pin IEC 320
BATTERY PACK
Part No.: QB-0061 Rechargeable Li-Ion battery
Voltage: 3.7 V
Capacity: 5200 mAh nominal
Typical Operating Time:
• Single-channel: >11 h (screen backlight dimmed); >8.5 h (full screen
backlight)
• 2-channel: >7.5 h (full screen backlight)
Use of external interfaces (LAN, USB, WLAN) will decrease battery
operating time
Battery Cycle Life: > 500 complete charge/discharge cycles
Battery Aging: Approximately 20% loss in capacity per year
Battery Indicator: Remaining battery capacity and expected working
time may be read out in % and in time
Battery Fuel Gauge: The battery is equipped with a built-in fuel gauge,
which continuously measures and stores the actual battery capacity in
the battery unit
Charge Time: In analyzer, typically 10 hours from empty at ambient
temperatures below 30°C. To protect the battery, charging will be
terminated completely at ambient temperatures above 40°C. At 30 to
11
40°C charging time will be prolonged. With external charger ZG-0444
(optional accessory), typically 5 hours
NOTE: It is not recommended to charge the battery at temperatures
below 0°C (32°F) or over 50°C (122°F). Doing this will reduce battery
lifetime
CLOCK
Back-up battery powered clock. Drift < 0.45 s per 24 hour period
Storage
INTERNAL FLASH-RAM (NON-VOLATILE)
For user setups and measurement data
• 512 MB
EXTERNAL SECURE DIGITAL MEMORY CARD
SD and SDHC Card: For store/recall of measurement data
USB MEMORY STICK
For store/recall of measurement data
Environmental
WARM-UP TIME
From Power Off: <2 minutes
From Standby: <10 seconds for prepolarized microphones
TEMPERATURE
IEC 60068–2–1 & IEC 60068–2–2: Environmental Testing. Cold and
Dry Heat.
Operating Temperature: –10 to + 50°C (14 to 122°F), <0.1 dB
Storage Temperature: –25 to +70°C (–13 to +158°F)
HUMIDITY
IEC 60068–2–78: Damp Heat: 90% RH (non-condensing at 40°C
(104°F))
Effect of Humidity: <0.1 dB for 0% <RH <90% (at 40°C (104°F)
and 1 kHz)
MECHANICAL
Environmental Protection: IP44
Non-operating:
IEC 60068–2–6: Vibration: 0.3 mm, 20 m/s2, 10 – 500 Hz
IEC 60068–2–27: Shock: 1000 m/s2
IEC 60068–2–29: Bump: 4000 bumps at 400 m/s2
WEIGHT AND DIMENSIONS
650 g (23 oz.) including rechargeable battery
300 × 93 × 50 mm (11.8 × 3.7 × 1.9″) incl. preamplifier and microphone
User Interface
USERS
Multi-user concept with login. Users can have their own settings with jobs
and projects totally independent of other users
PREFERENCES
Date, Time and Number formats can be specified per user
LANGUAGE
User Interface in Catalan, Chinese (People’s Republic of China), Chinese
(Taiwan), Croatian, Czech, Danish, English, Flemish, French, German,
Hungarian, Japanese, Italian, Korean, Polish, Portuguese, Romanian,
Russian, Serbian, Slovenian, Spanish, Swedish and Turkish
HELP
Concise context-sensitive help in English, French, German, Italian,
Japanese, Korean, Polish, Portuguese, Romanian, Serbian, Slovenian
and Spanish
UPDATE OF SOFTWARE
Update to any version (from 4.0 and up) using BZ-5503, included,
through USB or update via Internet:
WEB PAGE
Connect to the analyzer using an Internet browser supporting
JavaScript®. The connection is password protected:
• Guest level: for viewing only
• Administrator level: for viewing and full control of the analyzer
Specifications – Building Acoustics Software BZ-7228
Specifications apply to BZ-7228 unless otherwise stated.
BZ-7229 2-Channel Option is for Type 2270 only
STANDARDS
Conforms with the relevant parts of the following:
• IEC 61672 –1 (2002–05) Class 1
• IEC 60651 (1979) plus Amendment 1 (1993–02) and Amendment 2
(2000–10), Type 1
• ANSI S1.4–1983 plus ANSI S1.4A–1985 Amendment, Type 1
• IEC 61260 (1995–07) plus Amendment 1 (2001–09), 1/1-octave Bands
and 1/3-octave Bands, Class 0
• ANSI S1.11–1986, 1/1-octave Bands and 1/3-octave Bands, Order 3,
Type 0–C
• ANSI S1.11–2004, 1/1-octave Bands and 1/3-octave Bands, Class 0
• ISO, SS, DIN, Önorm, BS, BREW, Sia, UNI, NF-S31, NBE, NEN,
NEN’06, ASTM, see tables under Building Acoustics Measurement
Standards on page 8
Note: The International IEC Standards are adopted as European
standards by CENELEC. When this happens, the letters IEC are
replaced with EN and the number is retained. Type 2250/2270 also
conforms to these EN Standards
CHANNELS (TYPE 2270 ONLY)
All measurements are made from either Ch.1 or Ch.2 or both
simultaneously
TRANSDUCERS
Transducers are described in a transducer database with information on
Serial Number, Nominal Sensitivity, Polarization Voltage, Free-field Type,
CCLD required, Capacitance and additional information.
The analogue hardware is set up automatically in accordance with the
selected transducer
12
CORRECTION FILTERS
For microphone Types 4189, 4190, 4191, 4193, 4950 and 4952,
BZ-7228 is able to correct the frequency response to compensate for
sound field and accessories
Broadband Analysis
DETECTORS
A- and C-weighted: Broadband detectors with Fast exponential time
weighting
Overload Detector: Monitors the overload outputs of all the frequency
weighted channels
Under Range Detector: Monitors the under range of all the frequency
weighted detectors when set to High Range. Under range is set if level is
below lower limit of Linear Operating Range
Type 2270: Detectors available for both Ch. 1 and Ch. 2
MEASUREMENTS
LAF and LCF for Display as Numbers or Quasi-analogue Bars
MEASURING RANGES
When using Microphone Type 4189:
Dynamic Range: From typical noise floor to max. level for a 1 kHz pure
tone signal, A-weighted:
Single Range: 16.6 to 140 dB
High Range: 28.5 to 140 dB
Low Range: 16.6 to 110 dB
Primary Indicator Range: In accordance with IEC 60651, A-weighted:
Single Range: 23.5 to 123 dB
High Range: 41.7 to 123 dB
Low Range: 23.5 to 93 dB
Linear Operating Range: In accordance with IEC 61672, A-weighted:
1 kHz:
Single Range: 24.8 to 140 dB
High Range: 43.0 to 140 dB
Low Range: 24.8 to 110 dB
Frequency Analysis
CENTRE FREQUENCIES
1/1-octave Band Centre Frequencies: 63 Hz to 8 kHz
1/3-octave Band Centre Frequencies: 50 Hz to 10 kHz
MEASURING RANGES
When using Microphone Type 4189:
Dynamic Range: From typical noise floor to max. level for a pure tone
signal at 1 kHz 1/3-octave:
Single Range: 1.1 to 140 dB
High Range: 11.3 to 140 dB
Low Range: 1.1 to 110 dB
Linear Operating Range: In accordance with IEC 61260:
Single Range: ≤ 20.5 to 140 dB
High Range: ≤ 39.1 to 140 dB
Low Range: ≤ 20.5 to 110 dB
Internal Generator
Built-in pseudo-random noise generator
Spectrum: Selectable Pink or White
Crest Factor:
Pink Noise: 4.4 (13 dB)
White Noise: 3.6 (11 dB)
Bandwidth: Follows measurement frequency range
Lower Limit: 50 Hz (1/3-oct.) or 63 Hz (oct.)
Upper Limit: 10 kHz (1/3-oct.) or 8 kHz (oct.)
Output Level: Independent of bandwidth
Max.: 1 Vrms (0 dB)
Gain Adjustment: –80 to 0 dB
When bandwidth is changed, the level for all bands is automatically
adjusted to comply with the set output level
Correction Filters: For sound sources Type 4292-L, Type 4295 and
Type 4296: Flat or Optimum
Turn-on Time and Turn-off Time: Equivalent to RT = 70 ms
Repetition Period: 175 s
Output Connector: Output Socket
Control: See Measurement Control
External Generator
Selectable as alternative to Internal Generator
For controlling external noise generator
Levels: 0 V (Generator off), 3.3 V (Generator on)
Rise-time and Fall-time: 10 μs
Control: See Measurement Control
Measurements
Measurements are done at a number of positions and categorised in
functions (L1 for Source Room levels, L2 for Receiving Room levels, B2
for Receiving Room Background noise levels and T2 for Receiving Room
Reverberation Time measurements)
LEVELS L1, L2 AND B2
LZF spectrum for display only
LZeq in 1/1-octave or 1/3-octave bands
L1 and L2 simultaneously or as single channels
Averaging time: 1 s to 1 hour
Range (L1 and L2 simultaneously only): Autorange or manually set to
High Range or Low Range
Averaging: Up to 10 source positions each with up to 10 measurement
positions or up to 100 measurements may be averaged
Status Indications: Overload, under range, etc.
Crosstalk:
5 Hz – 10 kHz < –110 dB
10 kHz – 20 kHz < –100 dB
REVERBERATION TIME T2
T20 and T30 in 1/1-octave or 1/3-octave bands
Decays: LZeq spectra sampled at 5 ms intervals
Evaluation Range: –5 to –25 dB for T20 and –5 to –35 dB for T30
Measurement Time: Automatic selection of measurement time for the
decays based on the actual reverberation time of the room
Maximum Measurement Time: From 2 to 20 s
Averaging: T20 and T30 measurements can be averaged (arithmetic
averaging or ensemble averaging)
T20 and T30 Calculation: From slope in evaluation range
Slope Estimation: Least squares approximation
Quality Indicators: Quality indicators with status information like
Overload, Curvature in %, etc.; extensive list of Status information
Quality Indicators are available on reverberation time spectra for each
frequency band, and as overall quality indicators for each measurement
position and for the averaged result
Reverberation Time Range: Max. 20 s, min. 0.1 – 0.7 s, depending on
bandwidth and centre frequency
Manual Data Entry: A T2 value may be entered in any frequency band of
a measured spectrum
Measurement Displays
OVERVIEW
Table of measurement positions for each function (L1, L2, B2 or T2) with
readout for selectable frequency band on each position together with
quality indicator.
Positions can be included/excluded from average
SOUND LEVEL SPECTRUM
LZF spectrum plus A and C broadband bars
LZeq spectrum for L1@Pos, L2@Pos, B2@Pos, L1, L2, B2, L1-L2, L2-B2
Y-axis: Range: 5, 10, 20, 40, 60, 80, 100, 120, 140 or 160 dB. Autozoom or auto scale available
Cursor: Readout of selected band quality indicator for each frequency
band
REVERBERATION TIME SPECTRUM
One or two spectra can be displayed
Y-axis: Range: 0.5, 1, 2, 5, 10 or 20 s. Auto zoom available
Cursor: Readout of selected band quality indicator for each frequency
band
SPECTRUM TABLE
One or two spectra can be displayed in tabular form
DECAY
Decay curve for a position or the room average available for each
frequency band (if Ensemble Average selected)
Display of evaluation range and regression line
Readout of Curvature in %
Y-axis: Range: 5, 10, 20, 40, 60, 80, 100, 120, 140 or 160 dB. Auto zoom
or auto scale available
Result Displays
OVERVIEW
Table of measurement positions for all functions (L1, L2, B2 or T2) with
readout of quality indicators.
Positions can be included/excluded from result
CALCULATIONS
Shows the sound reduction index (spectrum and weighted) according to
the selected standard, along with the reference curve (if any), or
deviations (from the reference curve). See Table 2 on page 9
13
Measurement Control
Calibration
Measurement Sequence: Supports measuring:
• at all microphone positions before using another source
• at a microphone position for all sources before measuring at a new
position
• at subsequent microphone positions without source information
• at manually selected source and microphone positions
Measurements are started manually and can be automatically stored on
completion of measurement
Generator (L1, L2 and T2): The noise generator is turned on and off
automatically
Escape Time: 0 to 60 s
Build-up Time: 1 to 10 s
The generator can be turned on and off manually for checking equipment
and sound levels
Initial calibration is stored for comparison with later calibrations
Acoustic: Using Sound Calibrator Type 4231 or custom calibrator. The
calibration process automatically detects the calibration level when
Sound Calibrator Type 4231 is used
Electrical: Uses internally generated electrical signal combined with a
typed-in value of microphone sensitivity
Calibration History: Up to 20 of the last calibrations made are listed and
can be viewed on the instrument
EXCITATION T2
Interrupted Noise: Measurements are started manually and can be
automatically stored on completion of measurement
Number of Decays per Measurement: 1 to 100, ensemble averaged
into one decay
Impulse: Manual start of first measurement. When level (say from starter
pistol) exceeds the user-selected trigger level, the decay is recorded and
backwards integration performed (Schroeder method). The trigger can
then be armed automatically for measuring at the next position
Signal Recording: Recording of the Z-weighted measured signal can be
done at each position*
Measurement Status
On Screen: Information such as overload, awaiting trigger and
running/paused are displayed on screen as icons or text
Traffic Light: Red, yellow and green LEDs show measurement status
and instantaneous overload as follows:
• Yellow LED flashing every 5 s = stopped, ready to measure
• Green LED flashing slowly = awaiting trigger or calibration signal
• Green LED on constantly = measuring
• Yellow LED flashing slowly = paused, measurement not stored
• Red LED flashing quickly = intermittent overload, calibration failed
*
Signal Recording requires an SD card or USB stick for data storage and a license
for Signal Recording Option BZ-7226
Signal Monitoring
Input signal A-, C- or Z-weighted can be monitored using an
earphone/headphones connected to the headphone socket
Headphone Signal: Input signal can be monitored using this socket with
headphones/earphones
Gain Adjustment: –60 dB to 60 dB
Voice Annotations
Voice annotations can be attached to the building acoustics project and to
measurements at each position
Playback: Playback of voice annotations or signal recordings can be
listened to using earphone/headphones connected to the headphone
socket
Gain Adjustment: –60 dB to 0 dB
Text & Image Annotations
Text and image (Type 2270 only) annotations can be attached to the
building acoustics project and to measurements at each position
Data Management
Project Template: Defines the display and measurement setups
Project: Measurement data for all positions defined in source room (L1)
and in receiving room (L2, B2 and T2) are stored with the Project
Template
Re-use of data: Data for L1, B2 or T2 in one project can be re-used in
another project
Job: Projects are organised in Jobs
Explorer facilities for easy management of data (copy, cut, paste, delete,
rename, view data, open project, create job, set default project name)
Specifications – Signal Recording Option BZ-7226
Signal Recording Option BZ-7226 is enabled with a separate license. It
works with all the software for Type 2250/2270: Sound Level Meter,
Frequency Analysis, Logging Software, Enhanced Logging Software and
Reverberation Time Software
For data storage, Signal Recording requires either:
• SD Card
• USB Memory Stick
RECORDED SIGNAL
A-, B-, C- or Z-weighted signal from the measurement transducer
AUTOMATIC GAIN CONTROL
The average level of the signal is kept within a 40 dB range, or the gain
can be fixed
PLAYBACK
Playback of signal recordings can be listened to using the
earphone/headphones connected to the headphone socket
14
SAMPLING RATE AND PRE-RECORDING
The signal is buffered for the pre-recording of the signal. This allows the
beginning of events to be recorded even if they are only detected later.
Sampling
Rate (kHz)
Maximum
Pre-recording (s)
Sound
Quality
Memory
(KB/s)
8
470
Low
16
16
230
Fair
32
24
150
Medium
48
48
70
High
96
RECORDING FORMAT
The recording format is 16- or 24-bit wave files (extension .wav) attached
to the data in the project, easily played-back afterwards on a PC using
BZ-5503. Calibration information is stored in the .wav file, allowing
PULSE to analyse the recordings
Specifications – PULSE Reflex Building Acoustics Type 8780
PULSE Reflex Building Acoustics is the software package for postprocessing and reporting of building acoustics measurements made with
Type 2250/2270.
In addition, PULSE Reflex Building Acoustics provides functionality to
manage and maintain Type 2250/2270:
TYPE 2250/2270 SOFTWARE UPGRADES AND LICENSES
PULSE Reflex Building Acoustics controls Type 2250/2270 software
upgrades and licensing of the Type 2250/2270 applications
ON-LINE DISPLAY OF TYPE 2250/2270 DATA
Measurements on Type 2250/2270 can be controlled from the PC and
displayed on-line with the PC, using the same user interface on the PC
as on Type 2250/2270
INTERFACE TO TYPE 2250/2270
USB ver. 2.0, LAN Ethernet connection
• DVD drive
RECOMMENDED PC
• Gen Intel® Core™ i7 3 GHz processor or better
• 8 GB RAM
• 250 GB Solid State Drive (SSD) with 20 GB free space or better
• DVD-RW drive
• 1 Gbit Ethernet network
• Microsoft® Windows® 8 Pro (x64), Windows® 7 SP1 (x32 and x64) or
Windows® XP Professional (SP3)
• Microsoft® Office 2007 (SP2), Office 2010 (SP2) (x32) or Office 2013
Specifications – Qualifier Type 7830
STANDARDS
See Tables 1 and 2 under Building Acoustics Measurement Standards on
page 8
LANGUAGES
English, French and German
VIEWS
Result Level Views: A collection of views showing the resulting single
values, reduction curve and underlying average curves (L1, L2, B2 and
T20/T30)
Average Level Views: Each of the parameters (L1, L2 and B2) has a
corresponding view showing all of the measurement curves included in
the average calculation and a view of the resulting average curve.
In T20/T30 Average mode, it is possible to see all of the T20/T30s
included in the average calculation. In Ensemble Average mode, it is
possible to see the averaged 3D and averaged single frequency decay
curves. Both modes gives the user the ability to see the resulting T20/T30
spectrum
Position Level Views: Each of the level measurements (L1, L2 and B2)
can be viewed as a spectrum. In addition, the T2 reverberation
measurement can be viewed as 3D-multispectra and as single frequency
decay curves. Furthermore it is possible to see the calculated T20/T30
spectrum
Data Sheets: All of the measurement and the most relevant intermediate
and final results can be viewed as values in a table (not decays)
CURSOR READ-OUT:
All curves have cursor read-out
MANUAL INPUT
Allows graphical input and modification of the regression line in
reverberation decay curves. Calculated sound reduction curves can also
be adjusted graphically (The impact on the single value index is shown
simultaneously). To give maximum flexibility, position, average and
calculated data can be overridden by manually inputting data in the data
sheets
CALCULATIONS
Supports calculation of insulation and reverberation tasks. Insulation
calculations include airborne and impact sound insulation (lab/field). In
addition, airborne facade calculation is supported.
REPORT GENERATION
Based on document templates it is possible to make reports conforming
to the supported standards
OUTPUT
Relevant views and sheets can be printed or exported to the clipboard.
Text or graphs may be transferred to word processors in .rtf (Rich Text
Format)
HELP
On-line context-sensitive and user-guide
DATA TRANSFER
• Via USB using Measurement Partner Suite BZ-5503
MINIMUM PC
• Pentium® III (or newer)
• 256 MB RAM
• SVGA graphics display/adaptor
• Sound card
• CD-ROM drive
• Mouse
• USB
• PC card slot (for data transfer)
• Windows® XP, Windows Vista® or Windows® 7
15
Ordering Information
Accessories for upgrading a BZ-7228-200 or BZ-7228-300 kit to a
2-channel building acoustics kit:
• Prepolarized Free-field 1/2″ Microphone Type 4189
• Microphone Preamplifier ZC-0032
• Dual 10-pole Adaptor JP-1041
• Microphone Extension Cable AO-0697-D-100, 10-pin LEMO, 10 m
(33 ft)
• 2-Channel Option BZ-7229
Software and Accessories Available Separately
SOFTWARE MODULES
BZ-7228
Building Acoustics Software for Types 2250 and 2270
BZ-7228-100
Upgrade of BZ-7227 Reverberation Time software to
BZ-7228 Building Acoustics Software
BZ-7229
2-channel Option Type 2270
BZ-7223
Frequency Analysis Software
BZ-7224
Logging Software
BZ-7225
Enhanced Logging Software
BZ-7225-UPG
Upgrade from Logging Software BZ-7224 to Enhanced
Logging Software BZ-7225 (does not include memory
card)
BZ-7226
Signal Recording Option
BZ-7227
Reverberation Time Software
BZ-7230
FFT Analysis Software
BZ-7231
Tone Assessment Option
BZ-7234
Low Frequency Option
PC SOFTWARE
BZ-5503-A
BZ-5503-B
BZ-5503-C
Type 7830
Type 8780
Brüel & Kjær supplies a wide range of microphones and microphone
accessories. Please contact your local Brüel & Kjær office for more
information regarding the different types and their use, or visit the website
at www.bksv.com.
INTERFACING
AO-1449-D-010
UL-0250
LAN Cable
USB to RS–232 Converter
SOUND SOURCES
Type 4292-L
OmniPower Sound Source
Type 4295
OmniSource Sound Source
Type 4224
Portable Battery & Mains Powered Sound Source
Type 3207
Tapping Machine
Type 2734-A
Power Amplifier
For further information on sound sources and accessories please refer to
the ‘Sound Sources for Building Acoustics’ product data, BP 1689.
Service Products
ACCREDITED CALIBRATION
2250-J-CEI
Initial Calibration
2250-J-CEF
Periodic Calibration
2270-K-CEI
Initial Calibration
2270-K-CEF
Periodic Calibration
HARDWARE MAINTENANCE
2250/2270-EW1 Extended Warranty, one year extension
(Types 2250/2270)
Measurement Partner Suite, Logging Module
Measurement Partner Suite, Spectrum Module
Measurement Partner Suite, .WAV file analysis module
Qualifier
PULSE Reflex Building Acoustics
TRADEMARKS
Microsoft, Windows, Excel and Windows Vista are registered trademarks of Microsoft Corporation in the United States and/or other countries · Pentium is a registered
trademark and Core a trademark of Intel Corporation or its subsidiaries in the United States and/or other countries · JavaScript is a registered trademark of Sun
Microsystems Inc. · Speakon is a registered trademark of Neutrik AG
Brüel & Kjær reserves the right to change specifications and accessories without notice. © Brüel & Kjær. All rights reserved.
HEADQUARTERS: Brüel & Kjær Sound & Vibration Measurement A/S · DK-2850 Nærum · Denmark
Telephone: +45 7741 2000 · Fax: +45 4580 1405 · www.bksv.com · [email protected]
Local representatives and service organisations worldwide
2014-02
Building Acoustics Kit for single channel airborne or
impact sound insulation, including the same items as
BZ-7228-200 and:
• Tapping Machine Type 3207
• Battery Kit UA-1477 for Type 3207
BP 2190 – 16
BZ-7228-300
MEASUREMENT ACCESSORIES
Type 3923
Rotating Microphone Boom
Type 4231
Sound Level Calibrator
AO-0440-D-015 Signal Cable, LEMO to BNC, 1.5 m (5 ft)
AO-0646
Sound Cable, LEMO to Minijack, 1.5 m (5 ft)
AO-0697-030
Microphone Extension Cable, 10-pin LEMO, 3 m (10 ft)
AO-0697-100
Microphone Extension Cable, 10-pin LEMO, 10 m
(33 ft)
AR-0199
Flat Cable, 10-pin LEMO, 0.5 m (1.64 ft)
JP-1041
Dual 10-pole Adaptor
KE-0449
Flight case for OmniPower Sound Source Type 4292-L
UA-0587
Tripod
UA-0801
Lightweight Tripod
UA-1317
1/2″ Microphone Holder
UA-1404
Outdoor Microphone Kit
UL-1009
SD Memory Card for Hand-held Analyzers
UL-1017
SDHC Memory Card for Hand-held Analyzers
ZG-0444
Charger for Battery Pack QB-0061
ËBP-2190---,Î
BUILDING ACOUSTICS KITS
BZ-7228-200
Building Acoustics Kit for single-channel airborne
sound insulation, including:
• Building Acoustics Software BZ-7228
• Tripod for Type 2250 UA-0801
• Power Amplifier Type 2734-A
• OmniPower Sound Source Type 4292-L (tripod and carrying bag
KE-0462 included)
• Carrying bag KE-0364 for Type 4292-L Tripod
• Signal Cable AO-0523-D-100, Triaxial LEMO to XLR3M, 10 m (33 ft)
• Speaker Cable AQ-0673, Speakon® 4-pin (M) to Speakon 4-pin
(M),10 m (33 ft)
NOTE: Flight case KE-0449 for OmniPower sound source must be
purchased separately