1
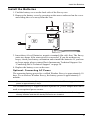
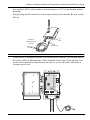
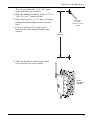
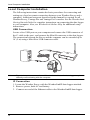
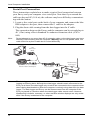
Vantage Pro2™
Weather Envoy Manual
For Vantage Pro2™ , Vantage Pro2 Plus™ , and Vantage Vue
Weather Stations
®
Davis Instruments, 3465 Diablo Avenue, Hayward, CA 94545-2778 U.S.A. • 510-732-9229 • www.davisnet.com
Welcome to the Weather Envoy! . . . . . . . . . . . . . . . . . . . . . . . . . . . 1
Preparing the Envoy . . . . . . . . . . . . . . . . . . . . . . . . . . . . . . . . . . 2
Install the Data Logger . . . . . . . . . . . . . . . . . . . . . . . . . . . . . . . . 2
Install the Batteries . . . . . . . . . . . . . . . . . . . . . . . . . . . . . . . . . . . 5
Mount Your Weather Envoy . . . . . . . . . . . . . . . . . . . . . . . . . . . 8
Local Computer Installation . . . . . . . . . . . . . . . . . . . . . . . . . . . . 10
Software Installation and Setup . . . . . . . . . . . . . . . . . . . . . . . . . . . . 13
Installing the Software . . . . . . . . . . . . . . . . . . . . . . . . . . . . . . . . . . . 13
Running the Software . . . . . . . . . . . . . . . . . . . . . . . . . . . . . . . . . . . . 13
Troubleshooting Guide. . . . . . . . . . . . . . . . . . . . . . . . . . . . . . . . . . . 15
Communications Problems. . . . . . . . . . . . . . . . . . . . . . . . . . . . . 15
Program Problems . . . . . . . . . . . . . . . . . . . . . . . . . . . . . . . . . . . 19
Contacting Davis Technical Support . . . . . . . . . . . . . . . . . . . . . 20
Appendix A: Weather Data . . . . . . . . . . . . . . . . . . . . . . . . . . . . . . . 21
Appendix B: Specifications . . . . . . . . . . . . . . . . . . . . . . . . . . . . . . . 28
FCC Part 15 Class B Registration Warning
This equipment has been tested and found to comply with the limits for a Class B digital device, pursuant to
Part 15 of the FCC Rules. These limits are designed to provide reasonable protection against harmful interference in a residential installation. This equipment generates, uses, and can radiate radio frequency energy and,
if not installed and used in accordance with the instructions, may cause harmful interference to radio communications.
However, there is no guarantee that interference will not occur in a particular installation. If this equipment
does cause harmful interference to radio or television reception, which can be determined by turning the
equipment on and off, the user is encouraged to try to correct the interference by one or more of the following
measures:
• Reorient or relocate the receiving antenna.
• Increase the separation between the equipment and receiver.
• Connect the equipment into an outlet on a circuit different from that to which the receiver is connected.
• Consult the dealer or an experienced radio/TV technician for help.
Changes or modification not expressly approved in writing by Davis Instruments may void the warranty and
void the user's authority to operate this equipment.
FCC ID: IR2DWW6312IC: 378810-6312
This product complies with the essential protection requirements of the EC EMC Directive 2004/
108/EC; Low Voltage Directive 2006/95/EC; and Eco-Design Directive 2005/32/EC>0.5 watt noload adapter.
Weather Envoy Manual
Document Part Number: 07395.281
For Vantage Pro2 Weather Envoys # 6316 & 6316C
Rev. E, 2/1/11
Weather Envoy and Vantage Vue are registered trademarks of Davis Instruments Corp.,
™
Hayward, CA.
Vantage Pro2 is a trademark of Davis Instruments Corp., Hayward, CA.
© Davis Instruments Corp. 2011. All rights reserved.
Information in this document subject to change without notice.Davis Instruments Quality Management System
is ISO 9001 certified.
®
3465 Diablo Avenue, Hayward, CA 94545-2778 U.S.A.
510-732-9229 • Fax: 510-732-9188
E-mail: [email protected] • www.davisnet.com
Welcome to the Weather Envoy!
The Davis Instruments’ Weather Envoy®
provides a way of getting weather data
from your Vantage Pro2™ or Vantage Vue
weather station into your Windows XP,
Vista, or 7; or Macintosh (OS X) computer
using our WeatherLink® software.
The Weather Envoy includes the data
collection and logging functions of the
Vantage consoles, but in a smaller package
that can be placed next to your computer, or
in a field installation. It can be used to free your wireless console from the
need to be near the computer, or it can be used in place of either a wired or
cabled console. Both cabled and wireless versions are available. Used with our
WeatherLink software and data logger, the Weather Envoy allows you to view,
store, plot, analyze, export, share, and print your weather data.
Contents
Before continuing, please be sure your Weather Envoy package includes the
following:
• Weather Envoy
• Two #6 x 1'' screws for wall mounting
• AC-power adapter
Required for Operation
You will also need the following Davis weather products to use your Envoy:
All Weather Envoys:
• Any version of WeatherLink for Vantage Pro2 and Vantage Vue, Windows
version 5.2 or later (#6510USB, 6510SER, 6540, 6544, 6550, 6555, 6560),
Mac OS X version 5.01 or later (#6520)
Wireless Weather Envoy:
• Wireless Vantage Pro2, Vantage Pro2 Plus, or Vantage Vue weather station
(#6152, 6153, 6162, 6163, 6250) or just the wireless ISS (#6322, 6323,
6327, 6328, 6357)
Cabled Weather Envoy:
• Cabled Vantage Pro2 or Vantage Pro2 Plus weather station ISS (#6322C
and 6327C; included with 6252C, 6162C)
1
Hardware Installation
Hardware Installation
The Weather Envoy can be installed and connected to a computer via USB,
serial or remote connection to a computer via a modem. It can also be
connected via a router using WeatherLink IP (# 6555).
Local Connection Windows Computer Requirements
WeatherLink is compatible with computers using a USB, serial port or IP
connection running the following platforms: Windows XP, Vista, or 7.
Your Weather Envoy and WeatherLink also require the following for a local
Windows computer connection.
• Windows-compatible display
• One free serial port or USB Port.
Ethernet Connection Windows Computer Requirements
WeatherLinkIP is a simple way to post data directly to the Internet using your
Weather Envoy.
• Broadband Router with one free port.
• An “Always-on” connection to the Internet — A high speed DSL or cable
internet connection that maintains constant connection to the internet.
Local Connection Macintosh Computer Requirements
Your Weather Envoy requires the following for a local Macintosh computer
connection:
• Macintosh computer running Mac OS X v10 or newer with at least
5 MB of free disk space.
• One free USB Port
Preparing the Envoy
Perform the following procedures to prepare your Envoy for operation. These
steps are described in detail later in the manual.
• Install the data logger
• Install the batteries and optional AC power source
• Mount your Envoy
• Connect Envoy to WeatherLink software
• Test using WeatherLink software
• Set up the Envoy using WeatherLink software
Install the Data Logger
Installing the data logger supplied with WeatherLink is the first step in preparing the Weather Envoy to transmit data to the WeatherLink software.
2
Install the Data Logger
CAUTION: Plugging or unplugging the data logger while power is applied to the Envoy can
lock up or damage the logger. The WeatherLink data logger must be installed
before you install the batteries or plug in the AC power adapter.
Note:
Make sure the logger is plugged in firmly and completely.
1. Remove the three screws from the back of the Envoy case.
2. Separate the case halves to expose the data logger connector.
3
Install the Data Logger
3. Carefully insert the data logger (Serial, USB or IP) into the connector slot,
making sure to push the data logger firmly into place.
USB
Data Logger
Serial
Data Logger
Data Logger
Cable Channel
Data Logger
Cable Channel
WeatherLinkIP
Data Logger
Data Logger
Cable Channel
Inserting the Serial, USB or IP data logger into the Envoy
4. Rejoin the case halves, making sure the data logger cable passes through the
cable channel.
5. Fasten using the three screws you removed in step 1.
4
Install the Batteries
Install the Batteries
1. Find the battery cover on the back side of the Envoy case.
2. Remove the battery cover by pressing on the arrow embossed on the cover
and sliding the cover away from the case.
3. Insert three AA-cell batteries, negative terminal (flat side) first. The Envoy
emits two beeps if the start-up test is successful. If you do not hear two
beeps, check your battery orientation and reinstall the batteries. If you hear
no beeps again, please contact Davis Instruments Technical Support. See
“Contacting Davis Technical Support” on page 20.
4. Replace the battery cover on the case.
Optional: Connecting AC Power
The operating battery power for a cabled Weather Envoy is approximately 10
days. For a wireless Weather Envoy, the battery power is approximately 5
months.
Note:
For a wireless Weather Envoy connected to a WeatherLinkIP data logger, the battery
power is approximately 2 days.
The Weather Envoy is supplied with an optional AC power adapter that can be
used as an optional power source.
Note:
If installing the optional AC power supply, make sure the WeatherLink Data Logger is
already installed and that the backup batteries are installed.
5
Optional: Adding an External Temperature Probe (Wireless Envoy Only)
1. Locate the power adapter jack on the end of the Envoy case. It’s next to the
data logger output cable.
RJ Jack
Insert Power
Adaper
Plug and rotate
to fit
RJ Connector
from Cabled ISS or
Optional External
Temperature
Probe
2. Insert the power adapter plug into the power jack.
Optional: Connecting a Cabled Envoy to the Integrated Sensor Suite (ISS)
Refer to the figure shown above “Connecting AC Power”.
1. Insert the modular plug into the ISS jack on the Envoy case.
Note:
You won’t be able to test the connection between the Envoy and the ISS until you
have finished installing the WeatherLink software.
Optional: Adding an External Temperature Probe
(Wireless Envoy Only)
Your wireless Weather Envoy has a built-in temperature-humidity sensor as
well as the barometer. The temperature and humidity are reported as “Inside
Temperature” and “Inside Humidity.”
In some instances, such as when your Envoy is mounted outside in a shelter,
the temperature inside the shelter is of little interest. You may replace the
built-in temperature-humidity sensor with an external temperature probe, with
a 25’ (7.6 m) cable, which can be used to measure the temperature of air,
water, or soil. The External Temperature Probe with RJ connector comes in
6
Optional: Adding an External Temperature Probe (Wireless Envoy Only)
two models: 6475 (with stainless steel housing) or 6477 (with durable plastic
housing).
Simply plug the RJ connector of the temperature probe into the RJ jack on the
Envoy.
External
Temperature
Sensor
Note:
RJ
Jack
RJ
Connector
Note: It may take several minutes for the temperature reading to stabilize.
If the Envoy is mounted outside in a weather-proof shelter, you should thread
the probe cable up through one of the channels in the base of the shelter. See
your shelter manual for instructions on how to secure the cable and make a
weather-proof seal.
Weather ENVOY
7
Mount Your Weather Envoy
Mount Your Weather Envoy
You can place your Envoy on your desktop, install it on a wall near your computer, or install it with the optional Multi-Purpose Shelter (7728). Here are
some guidelines for placing your Weather Envoy.
Envoy Location
You should place the Envoy in a location where it is easily accessible and can
be easily connected to a computer (or router if using WeatherLinkIP). For
more accurate readings, follow these suggestions:
• Avoid placing the Envoy in direct sunlight. This may cause erroneous
inside temperature and humidity readings and may damage the unit.
• Avoid placing the Envoy near radiators or heating/air conditioning ducts.
• If you are mounting the Envoy on a wall, choose an interior wall. Avoid
exterior walls that tend to heat up or cool down depending on the weather.
The range of the radio transmission that the Envoy can receive from the wireless ISS depends on several factors. Try to position the Envoy as close to the
transmitting weather station as possible for best results.
Typical maximum ranges are:
• Line of sight: 1000 feet (300 m).
• Under most conditions: 200 - 400 feet (60 - 120 m).
Other range and transmission considerations include:
• Range may be reduced by walls, ceilings, trees, foliage, a metal roof or
other large metal structures or objects such as aluminum siding, metal
ducts, and metal appliances, such as refrigerators.
• Frequency interferers also reduce transmission distance. Cordless phones
(900 Mhz) are a common example of frequency interference.
• Transmission between wireless units may be obscured by something
unidentifiable, or by some obstacle that can’t be worked around.
Note:
For best results, orient the ISS antenna and the Envoy antenna so that the orientation and angles of the antennas are parallel to each other.
For better reception over greater distances or for weaker signals, consider
using a Wireless Repeater (#7626 or 7627) or Long-Range Repeaters (#7653
or 7654) to strengthen the signal or increase the distance between your ISS and
the Envoy.
Wall Mounting the Envoy
1. Use the provided wall mounting template on the next page as an example of
hole spacing and alignment when installing your Envoy.
2. Use the template as a guideline for the hole markings on the wall where you
want to mount the Envoy, and use a pencil to mark the location for the two
mounting screws.
8
Mount Your Weather Envoy
The screws should be 3.25'' (82.5 mm)
apart and lined up vertically.
3. Drill the marked locations with a 3/32'' or
7/64'' (2.2 to 2.7 mm) drill bit.
4. Drive the two #6 x 1'' (3.5 mm x 25 mm)
pan head self-threading screws into the
wall.
5. Leave at least a 1/8'' (3 mm) space
between the wall and the heads of the
screws.
Drill 3/32"
or 7/64"
(~2.2 to 2.7mm)
Holes
3.25"
(82.55mm)
6. Slide the keyholes on the back of the
case over the two screw heads.
#6 X 1"
Pan-Head
Screws
9
Local Computer Installation
Local Computer Installation
The following instructions contain the basic procedures for connecting and
setting up a local or remote connection between your Weather Envoy and a
computer. Additional setup not described in this manual is required for all
Weather Envoy, Vantage Pro and Vantage Pro2 consoles. See the WeatherLink
Getting Started Guide for complete instructions on connecting the data logger
to your computer. Also, see WeatherLink Online Help for additional setup
instructions.
USB Connection
Locate a free USB port on your computer and connect the USB connector of
the 8’ cable to the port., and connect the Mini-B connector to the data logger.
The connection between the Envoy and the computer can be extended up to
16' (5 m) using a Mini-B-to-USB connector cable.
Note:
Do not attempt to use more than a 16' extension cable, or the data logger may have
difficulty communicating with the computer.
IP Connection
1. Locate the Weather Envoy with the WeatherLinkIP data logger attached.
2. Remove power, both AC and battery.
3. Connect one end of the Ethernet cable to the WeatherLinkIP data logger.
10
Local Computer Installation
4. Locate a free Ethernet port on your broadband or DSL router and connect
the cable to the port.
5. Reconnect the AC adapter.
Note: An Envoy using a WeatherLinkIP data logger requires use of the AC-power adapter.
Battery power can be used for short-term backup power in the event of a power outage,
but an Envoy with WeatherLinkIP should use the AC-power adapter as its main source of
power.
The Weather Envoy beeps two times, occurring within one second of each
other. On power-up, the IP data logger will negotiate its connection with
the router.
6. Write down the Device ID and Key located on the side of the
WeatherLinkIP data logger for further use.
The Device ID (DID) and Key uniquely identify your data logger on the
WeatherLink Network (www.weatherlink.com). They are both required to
create a login on WeatherLink.com and are used to connect the
WeatherLinkIP data logger to the software.
Note: Because WeatherLinkIP is continuously uploading current weather information to the
www.weatherlink.com, leave the WeatherLinkIP and Envoy connected to your router at all
times.
11
Local Computer Installation
Serial Port Connection
These instructions explain how to make a typical local connection between
your Envoy and your computer via a serial port. Note that if you extend the
cable run beyond 48' (14.4 m), the software may have difficulty communicating with the station.
1. Locate a free serial port on the back of your computer and connect the blue
DB9 adapter to the port, then connect the 8’ cable to the adapter.
2. Plug the short cable coming from the data logger into the 8' cable.
The connection between the Envoy and the computer can be extended up to
40’ (12m) using a Davis Standard 4-conductor extension cable (#7876040).
Note:
Do not attempt to use more than 40' of extension cable, or the data logger may have
difficulty communicating with the computer. Warning: Do not use phone cable. Our
cable looks like a phone cable but it is wired differently
9-Pin
Connector
(DB-9)
Optional 40' (12 m) 4-Conductor
Extension Cable and Coupler
Weather Envoy
Data Logger
8' (2.5 m) Cable
AC Power
Adapter
Note:
12
The data logger does not require a constant connection with a computer to continue
logging and storing data. Although the data logger should remain connected to the
Envoy at all times, the data logger only needs to be connected to the computer when
data is being downloaded or when the computer is actively using data from the data
logger. The data logger and Envoy can be disconnected from the computer if the
Envoy is placed in a location where the data logger cable cannot reach. However,
WeatherLink’s bulletin, summary, or other real-time window displays are only accessible if the Envoy is attached to the computer.
Installing the Software
Software Installation and Setup
Refer to the following procedure and the WeatherLink Getting Started Guide
to install the WeatherLink software on your computer. The instructions below
contain the basic procedures for running the WeatherLink software and setting
up a connection to your Weather Envoy. All information about the software is
included as an overview. Additional setup not featured in this manual is
required for all Weather Envoy, and Vantage Pro2 consoles. See WeatherLink
Online Help for complete setup instructions.
Note:
If you are installing a Davis specialized data logger (6540, 6544, 6550,6560) please
see the included addendum for complete installation instructions.
Installing the Software
Windows Computer Using USB, Serial, or IP Connection
Follow the steps below to install the WeatherLink software.
1. Place the WeatherLink software CD in your CD ROM drive.
The install program should start automatically. If the install program does
not start, select Run from the Start menu, type D:\SETUP (or the correct
letter for your CD ROM drive), and click OK to begin the installation.
2. Follow the on-screen prompts to complete the installation.
Macintosh Computer
1. Place the Install Disk in your CD ROM drive.
2. Copy “install.sit” from the CD to your desktop and open it.
3. The installation software will automatically extract itself.
4. Run “install.”
5. Follow the on-screen prompts to complete the installation.
Running the Software
To run the software, double-click the WeatherLink icon. See the WeatherLink
Getting Started Guide or the Weatherlink Online Help System for information
on running and configuring the software.
Set Transceiver
Use the Set Transceiver dialog box to view and/or configure your Weather
Envoy transmitter ID and repeater ID assignments and to control the
retransmit function.
Note:
Note: This dialog box is the only available tool for configuring the transmitter ID and
repeater ID settings on your Weather Envoy.
13
Running the Software
To set transceiver options:
1. Select Set Transceiver from the Setup menu. The Set Transceiver dialog
box displays.
2. Select a Station Type for each of the possible 8 transmitter IDs (“channels”)
the Envoy may be receiving. See the WeatherLink Online Help System for
more information on configuring the stations, the retransmit feature, and
configuring the Envoy for using repeaters.
14
Communications Problems
Troubleshooting Guide
The following section answers some of the most commonly asked questions
about WeatherLink® and the Weather Envoy. Please consult this guide and the
WeatherLink software Help before contacting Davis. Please see Contacting
Davis Technical Support on page 20 for more information.
Communications Problems
If you are having trouble establishing communication between WeatherLink and the Weather Envoy, start by checking the Enovy’s own diagnostics. Follow these steps:
Note:
The data logger uses non-volatile memory, so you won’t lose any data you’ve already
recorded.
1. Remove power, both AC and batteries. Remove any extension cables
that are in the system.
2. Unplug the data logger.
3. Wait at least two minutes, then plug the data logger back in. Make sure it is
plugged in firmly and completely.
4. On power up, you should hear two beeps, each of which occurs when the
Envoy passes one of its diagnostic tests. Each beep follows the previous after
about a second. The first beep tells you the processor is running. The second
beep verifies the installation of the data logger. If you do not hear two beeps,
contact Davis Instruments Technical Support.
5. If you hear both beeps, see Troubleshooting Serial Port Communication on
page 15 for instructions on checking your standard serial ports. See “Troubleshooting USB Communication” on page 17 if you are troubleshooting a
USB connection. See “Troubleshooting WeatherLinkIP Communication” on
page 18 if you are troubleshooting an TCP/IP connection.
Note:
Generally, if the loopback test identifies a serial port, your PC is not the problem.
Troubleshooting Serial Port Communication
•
•
Test the serial port using the loopback connector (the
short cable with a phone jack on one end and a red
plastic tip on the other) supplied with a serial port
Loopback
data logger. Use the Loopback button (as opposed to
connector
the Test button) in the Communications Port dialog
box to test and find the correct serial port connection.
If a loopback connector is not found, there is a problem with the port or the
computer. Use the loopback connector
Check the serial port adapter if using a serial port connection. Use only the
blue serial port adapter supplied with WeatherLink. Older models, or models not supplied in the WeatherLink connection kit, are not compatible.
15
Communications Problems
•
If the port settings or the loopback process identifies a serial port other
than the one selected, try again using that port.
1. If necessary, disconnect the cable from the blue serial adapter.
2. Insert the loopback connector into the adapter.
3. Select Communications Port from the Setup menu.
The Communications Port dialog box displays.
4. Click Loopback.
The software searches all standard ports and displays the COM port
number where the loopback connector is located.
The correct COM port is automatically selected
in the Communications Port dialog box. If the
loopback connector is not found on any COM
port, your serial port may not be working. If a
connection still does not exist or if the loopback
test identifies the same serial port you have
selected, eliminate the following possibilities:
16
Communications Problems
Note: Contact your PC vendor or technical support for more information on device difficulties.
•
•
•
•
Hardware device conflict—Check the Device Manager tab in the
Windows System Properties dialog box to ensure that Windows recognizes the selected COM port. Consult your computer’s documentation to
see how to access the System Properties dialog box.
The communication port uses a nonstandard device name— WeatherLink recognizes serial ports named COM1 through COM18 only.
Your serial port is defective.
The loopback connector or the WeatherLink blue serial adapter plug is
defective.
Note: See the WeatherLink Online Help if you are troubleshooting a Modem connection.
Troubleshooting USB Communication
•
•
•
•
•
Close the WeatherLink software.
Disconnect the USB cable from the Envoy.
Plug the cable back into the Envoy.
Open the WeatherLink software again.
Open the Communications Port dialog box. Select USB if USB is not
selected in the communications field and follow the prompts.
• Click Test to verify communication between the station and the software.
If the test is unsuccessful, either the station is malfunctioning or the drivers
for communicating with USB have not been installed successfully. To
verify that the driver is installed, look in Windows’ System Properties ->
Device Manager -> Universal Serial Bus Controllers and see if the
USBXpress Device is listed. If the driver is listed and there is still no
communication between the station and the computer, call Technical
Support. If the drivers are not listed, contact Technical Support for
instructions on installing the necessary drivers.
• If you are using a third party application that requires the USB connection
to emulate a com port connection, see WeatherLink Online Help for more
information or contact Technical Support.
17
Communications Problems
Troubleshooting WeatherLinkIP Communication
Note: An Envoy using a WeatherLinkIP data logger requires use of the AC-power adapter.
Battery power can be used for short-term backup power in the event of a power outage,
but an Envoy with WeatherLinkIP should use the AC-power adapter as its main source of
power.
1. See if you have a connection to the internet established. Verify that you can
access a website from a computer connected to the router or switch that the
WeatherLinkIP data logger is using.
2. Check the cable connection between your WeatherLinkIP data logger and
the broadband router. Check if the green light on the WeatherLink IP data
logger is on or blinking.
3. Leaving the data logger connected to your router, disconnect power from
both your router and your Envoy, both AC and batteries.
4. Return power to the router. Wait for at least one minute as the router reboots
and re-establishes connections.
5. Return AC power to the Envoy. On power up, you will hear two beeps.
6. Check if the green light on the WeatherLink IP data logger is on. If it is not
on, contact Technical Support.
7. For Weatherlink.com - Wait five minutes. Go to www.weatherlink.com
and register the WeatherLinkIP data logger using the Device ID and Key.
If you have already registered, check that your My Weather page is
currently being updated.
8. For WeatherLink Software - Open WeatherLink. Open the
Communications Port dialog box. Select TCP/IP if it is not already
selected. Select the communications type under TCP/IP you wish to use.
For Local Connections Only
•
In the Communications Port dialog box, select Local Device ID and
click Find. If the data logger is communicating on the network, the
Communications Settings dialog box displays the Device ID and IP
address of your data logger. If the dialog box does not display, check
connections and try again or contact Technical Support.
• Click Test to verify communication between the station and the software.
For Web Download Only
• In the Communications Port dialog box, verify that the User ID and
Password are the same User ID and Password you used when you created
your web account on www.weatherlink.com.
18
Program Problems
Program Problems
? The barometer graph on the Bulletin does not “fill in” completely.
When you first load the bulletin, the barometer graph will only fill in
completely when you have data in your database for the last six hours. Make
sure of the following:
• There is data in your database for the span of the barometer graph.
• The time and date of the stored barometer data is correct in your database.
• The time and date on the PC is correct.
• The time and date on the weather station are correct.
• In the Station Configuration dialog box, set the Download archive data
when Bulletin or Summary is started drop-down box to Always or to
Confirm each time.
? No wind direction reading (or dashes instead of a reading) appears in my database.
Be aware that if there is no wind speed when the direction is being sampled,
wind direction is not recorded. During intervals with very little wind speed, no
direction may be recorded.
Note: Because high wind speed is sampled more often, it is possible to have a high wind speed
but no wind speed or direction.
? WeatherLink says “No new data to download” but I know there’s data there. What
can I do?
The Vantage Pro2 system is smart enough to send only data it hasn’t already
sent to the computer. So, when you initiate a new download, the program will
retrieve the first record after the last record shown in the WeatherLink’s
Browse Window. Reboot and reseat the data logger. Follow the steps on
page 15, Communications Problems. Older data may still be in the data logger,
if you have not cleared its memory. To see how many of these older records
are stored in the logger, create a new station (File>New Station) and download
the data into this new database. Because there are no records stored in the
database you just created, WeatherLink will download everything it has stored.
Next, try clearing the archive memory using the clear dialog box. You will lose
any data not already downloaded in your archive memory, but all of your calibration numbers and alarm settings will remain intact. If this doesn’t work,
reboot your weather station (that is, remove and then restore all power to the
station).
? When viewing data, dashes appear in place of a value for functions other than wind
direction. Why?
If no data was recorded by a sensor (for example, the sensor was disconnected
or radio interference blocked reception), or if bad data was recorded for a
sensor (for example, the sensor was malfunctioning), the software dashes out
19
Contacting Davis Technical Support
the entry rather than showing invalid data. You can use the record editor to
correct these entries.
? The data I want to see, such as solar radiation, soil moisture, or Temp 2 does not
display. Why?
All optional sensors must be enabled in the Station Configuration dialog box
before the data will be displayed in WeatherLink. If you are not seeing data
from a sensor that is installed in your weather station, be sure check the
Station Configuration in the Setup Menu and make sure the sensor has been
selected.
Contacting Davis Technical Support
If you have questions about the Envoy, or encounter problems installing or
operating the Envoy, please contact Davis Technical Support.
(510) 732-7814 – Monday – Friday, 7:00 a.m. – 5:30 p.m. Pacific Time.
(510) 670-0589 – Technical Support Fax.
[email protected] – E-mail to Technical Support.
[email protected] – General e-mail.
www.davisnet.com – Copies of User Manuals are available on the
“Support” page. Watch for FAQs and other updates. Subscribe to the
e-newsletter.
20
Appendix A: Weather Data
Refer to this appendix to learn more about the weather variables
measured and/or calculated by the Weather Envoy, by the Vantage Pro2
Integrated Sensor Suite (ISS), and by the optional Vantage Pro2 sensors.
Each section includes a brief discussion of the weather condition and a
listing of the various ways in which the unit displays or stores that
condition.
Note:
Some of the weather conditions require an optional sensor in order to measure or
calculate a value.
Wind
The anemometer measures wind speed and wind direction and is part of
the Integrated Sensor Suite (ISS).
Temperature
The Weather Envoy uses the ISS temperature sensor to measure the
outside air temperature. A second temperature sensor in the Weather
Envoy measures the inside air temperature. The Envoy’s inside
temperature sensor can be replaced with an external temperature probe.
You may use the probe to measure any other temperatures that are within
the sensor’s range, including the temperature of liquids such as water.
Apparent Temperatures
The Weather Envoy calculates four apparent temperature readings: wind
chill, heat index, the temperature/humidity/wind index (THW Index), and
the temperature/humidity/solar radiation/wind index (THSW Index).
Wind chill
Wind chill takes into account how the speed of the wind affects our
perception of the air temperature. Our bodies warm the surrounding air
molecules by transferring heat from the skin. If there’s no air movement,
this insulating layer of warm air molecules stays next to the body and
offers some protection from cooler air molecules. However, wind sweeps
that warm air surrounding the body away. The faster the wind blows, the
faster heat is carried away and the colder you feel. Wind has a warming
effect at higher temperatures
Note:
Wind chill is not calculated above 92° F (33° C).
Wind chill is not stored in archive memory. Wind chill is calculated
whenever it is displayed. Editing temperature or wind speed values
changes the wind chill value.
Note:
WeatherLink versions 5.1 and later use the Osczevski (1995) equation to calculate
wind chill. This is the adopted method used by the US National Weather Service.
21
Heat Index
The Heat Index uses the temperature and the relative humidity to
determine how hot the air actually “feels.” When humidity is low, the
apparent temperature will be lower than the air temperature, since
perspiration evaporates rapidly to cool the body. However, when
humidity is high (i.e., the air is saturated with water vapor) the apparent
temperature “feels” higher than the actual air temperature, because
perspiration evaporates more slowly.
Note:
Heat Index is equal to the air temperature at or below 0° F (-18° C) air temperature.
THW (Temperature - Humidity - Wind)
The THW Index uses humidity and temperature to calculate an apparent
temperature like Heat Index, but includes the cooling and heating effects
of wind on our perception of temperature.
THSW (Temperature - Humidity - Solar - Wind)
The THSW Index uses humidity and temperature like for the Heat Index,
but also includes the heating effects of sunshine and the cooling effects of
wind (like wind chill) to calculate an apparent temperature of what it
“feels” like out in the sun. The THSW Index requires a solar radiation
sensor.
Humidity
Humidity itself simply refers to the amount of water vapor in the air.
However, the total amount of water vapor that the air can contain varies
with air temperature and pressure. Relative humidity takes into account
these factors and offers a humidity reading which reflects the amount of
water vapor in the air as a percentage of the amount the air is capable of
holding. Relative humidity, therefore, is not actually a measure of the
amount of water vapor in the air, but a ratio of the air’s water vapor
content to its capacity. When we use the term humidity in the manual and
on the screen, we mean relative humidity.
It is important to realize that relative humidity changes with temperature,
pressure, and water vapor content. A parcel of air with a capacity for 10 g
of water vapor which contains 4 g of water vapor, the relative humidity
would be 40%. Adding 2 g more water vapor (for a total of 6 g) would
change the humidity to 60%. If that same parcel of air is then warmed so
that it has a capacity for 20 g of water vapor, the relative humidity drops
to 30% even though water vapor content does not change.
Relative humidity is an important factor in determining the amount of
evaporation from plants and wet surfaces since warm air with low
humidity has a large capacity to absorb extra water vapor.
Dew-Point
Dew point is the temperature to which air must be cooled for saturation
(100% relative humidity) to occur, providing there is no change in water
vapor content. The dew point is an important measurement used to
22
predict the formation of dew, frost, and fog. If dew point and temperature
are close together in the late afternoon when the air begins to turn colder,
fog is likely during the night. Dew point is also a good indicator of the
air’s actual water vapor content, unlike relative humidity, which takes the
air’s temperature into account. High dew point indicates high water vapor
content; low dew point indicates low water vapor content. In addition a
high dew point indicates a better chance of rain, severe thunderstorms,
and tornados.
You can also use dew point to predict the minimum overnight
temperature. Provided no new fronts are expected overnight and the
afternoon relative humidity is greater than or equal to 50%, the
afternoon’s dew point gives you an idea of what minimum temperature to
expect overnight, since the air can never get colder than the dew point.
Dew Point is equal to the air temperature when the Humidity is 100%.
Rain
Vantage Pro2 incorporates a tipping-bucket rain collector in the ISS that
measures 0.01'' for each tip of the bucket. A metric adapter can be
installed to measure 0.2 mm for each tip of the bucket.Your station logs
rain data in the same units it is measured in and converts the logged totals
into the selected display units (inches or millimeters) at the time it is
displayed. Converting at display time reduces possible compounded
rounding errors over time.
Four separate variables track rain totals: “rain storm,” “daily rain,”
“monthly rain,” and “yearly rain.” Rain rate calculations are based on the
interval of time between each bucket tip, which is each 0.01'' rainfall
increment or 0.2 mm.
Barometric Pressure
The weight of the air that makes up our atmosphere exerts a pressure on
the surface of the earth. This pressure is known as atmospheric pressure.
Generally, the more air above an area, the higher the atmospheric
pressure, this means that atmospheric pressure changes with altitude. For
example, atmospheric pressure is greater at sea level than on a
mountaintop. To compensate for this difference and facilitate comparison
between locations with different altitudes, atmospheric pressure is
generally adjusted to the equivalent sea level pressure. This adjusted
pressure is known as barometric pressure. In reality, the Vantage Pro2
measures atmospheric pressure. When you enter your location’s altitude
in Setup Mode, the Vantage Pro2 stores the necessary offset value to
consistently translate atmospheric pressure into barometric pressure.
Barometric pressure also changes with local weather conditions, making
barometric pressure an extremely important and useful weather
forecasting tool. High pressure zones are generally associated with fair
weather while low pressure zones are generally associated with poor
weather. For forecasting purposes, however, the absolute barometric
23
pressure value is generally less important than the change in barometric
pressure. In general, rising pressure indicates improving weather
conditions while falling pressure indicates deteriorating weather
conditions
Solar Radiation
Note:
Requires that the Weather Envoy listens to station with optional solar radiation sensor attached (#6450, included on Vantage Pro2 Plus weather stations).
What we call “current solar radiation” is technically known as Global
Solar Radiation, a measure of the intensity of the sun’s radiation reaching
a horizontal surface. This irradiance includes both the direct component
from the sun and the reflected component from the rest of the sky. The
solar radiation reading gives a measure of the amount of solar radiation
hitting the solar radiation sensor at any given time, expressed in Watts/sq.
m (W/m2).
UV (Ultra Violet) Radiation
Note:
Requires optional UV sensor (#6490, included on Vantage Pro2 Plus weather
stations).
Energy from the sun reaches the earth as visible, infrared, and ultraviolet
(UV) rays. Exposure to UV rays can cause numerous health problems,
such as sunburn, skin cancer, skin aging, cataracts, and can suppress the
immune system. The Weather Envoy can help analyze the changing
levels of UV radiation and can advise of situations where exposure is
particularly unacceptable.
CAUTION: Be aware that the UV sensor readings do not take into account UV reflected off
snow, sand, or water, which can significantly increase the amount of UV to which
you are exposed. Nor do the readings take into account the dangers of prolonged
exposure to UV radiation. The readings do not suggest that any amount of exposure is safe or healthful. Do not use the UV readings to determine the amount of
UV radiation to which you expose yourself. Scientific evidence suggests that UV
exposure should be avoided and that even low UV doses can be harmful.
WeatherLink displays UV readings in two scales: MEDs and UV Index.
UV MEDs (Minimum Erythemal Dose) is defined as the amount of
sunlight exposure necessary to induce a barely perceptible redness of the
skin within 24 hours after sun exposure. In other words, exposure to 1
MED will result in a reddening of the skin. Because different skin types
burn at different rates, 1 MED for persons with very dark skin is different
from 1 MED for persons with very light skin.
Both the U.S. Environmental Protection Agency (EPA) and Environment
Canada have developed skin type categories correlating characteristics of
skin with rates of sunburn.
24
TABLE A-1: EPA SKIN PHOTOTYPESTABLEA-2: ENVIRONMENT CANADA SKIN
Skin Phototype
Skin color
Tanning & Sunburn history
1 - Never tans,
always burns
Pale or milky white;
alabaster
Develops red sunburn; painful
swelling, skin peels
2 - Sometimes
tans, usually burns
Very light brown;
sometimes freckles
Usually burns, pinkish or red coloring
appears;
can gradually develop light brown tan
3 - Usually tans,
sometimes burns
Light tan; brown, or
olive;
distinctly pigmented
Rarely burns; shows moderately rapid
tanning response
4 - Always tans;
rarely burns
Brown, dark brown, or
black
Rarely burns; shows very rapid
tanning response
TYPES AND REACTION TO THE SUN.
Skin Type
Skin Color
History of Tanning & Sunburning
I
White
Always burns easily, never tans
II
White
Always burns easily, tans minimally
III
Light Brown
Burns moderately, tans gradually
IV
Moderate Brown
Burns minimally, tans well
V
Dark Brown
Burns rarely, tans profusely
VI
Black
Never burns, deep pigmentation
Developed by T. B. Fitzpatrick of the Harvard Medical School. More about the
Fitzpatrick Skin Types is available in: Fitzpatrick TB. Editorial: the validity and
practicality of sun-reactive skin types I through VI. Arch Dermatol 1988; 124:869-871
25
I
1
Skin Phototype (EPA)
II
2
All Burn
III
Some Burn
IV
3
V
Skin Type (Environment Canada)
UV Dose that Causes Sunburn
4
VI
20
40
1
2
60
80
3
UV Dose (MEDs)
2
120 mJ/cm
100
4
5
6
UV Dose and Sunburn - Use this plot to estimate the MED dose leading to sunburn. A
person with Type II (Environment Canada) skin type might choose 0.75 MED as the
maximum for the day; in contrast, a person with Type V (Environment Canada) Skin Type
might consider 2.5 MEDs a reasonable dose for the day. NOTE: the Weather Envoy
assumes a Fitzpatrick (Environment Canada) Skin Type of II.
UV Index
Weather Envoy can also record UV Index, an intensity measurement first
defined by Environment Canada and since been adopted by the World
Meteorological Organization. UV Index assigns a number between 0 and 16
to the current UV intensity. The US EPA categorizes the Index values as
shown below. The lower the number, the lower the danger of sunburn. The
Index value published by the U.S. National Weather Service is a forecast of
the next day’s noontime UV intensity. The Index value displayed in WeatherLink is the result of a real-time measurement.
TABLE A-3: UV INDEX
Index
Values
26
Exposure
Category
0-2
Minimal
3-4
Low
5-6
Moderate
7-9
High
10+
Very High
EvapoTranspiration (ET)
Note:
Requires optional solar radiation sensor (#6450, included on Vantage Pro2 or Vantage Pro2 Plus weather stations).
EvapoTranspiration (ET) is a measurement of the amount of water vapor
returned to the air in a given area. It combines the amount of water vapor
returned through evaporation (from wet vegetation surfaces and the
stoma of leaves) with the amount of water vapor returned through
transpiration (exhaling of moisture through plant skin) to arrive at a total.
Effectively, ET is the opposite of rainfall, and it is expressed in the same
units of measure (Inches, millimeters).
The Weather Envoy uses air temperature, relative humidity, average wind
speed, and solar radiation data to estimate ET which is calculated once
per hour on the hour.
Leaf Wetness
Note:
Leaf Wetness is only available with the wireless Weather Envoy using the optional
Leaf and Soil Moisture/Temperature station (#6345) with a Leaf Wetness sensor
(#6420).
Leaf wetness provides an indication of whether the surface of foliage in
the area of the sensor is wet or dry by indicating how wet the surface of
the sensor is. The leaf wetness reading ranges from 0 (dry) to 15.
Soil Moisture
Note:
Soil Moisture is only available with the wireless Weather Envoy using the optional
Leaf and Soil Moisture/Temperature station (#6345) with a Soil Moisture sensor
(#6440).
Soil Moisture, as the name suggests, is a measure of the moisture content
of the soil. Soil moisture is measured on a scale of 0 to 200 centibars, and
can help choose times to water crops. The soil moisture sensor measures
the vacuum created in the soil by the lack of moisture. A high soil
moisture reading indicates dryer soil; a lower soil moisture reading means
wetter soil.
Time
The Weather Envoy has a clock and a calendar for tracking time and date.
The calendar automatically adjusts for daylight saving time in most of
North America and Europe (and allows manual adjustment elsewhere)
and for leap years providing you have entered the correct year, latitude
and longitude, and daylight savings settings in the Setup Mode.
27
Appendix B: Specifications
General
Operating Temperature. . . . . . . . . . . .+0° to +140°F (-18° to +60°C)
Storage Temperature . . . . . . . . . . . . .-22° to +158°F (-30° to +70°C)
Current Draw, Wireless . . . . . . . . . . .0.90 mA average, 20 mA peak, (plus 0.125
mA for each optional wireless transmitter in
use) at 4 to 6 VDC
Current Draw, Cabled . . . . . . . . . . . .10 mA average, 15 mA peak at 4 to 6 VDC
AC Power Adapter . . . . . . . . . . . . . . .5 VDC, 200 mA, regulated
Batteries . . . . . . . . . . . . . . . . . . . . . .3 AA-cells
Battery Life, Wireless . . . . . . . . . . . . .up to 4 months
Battery Life, Cabled . . . . . . . . . . . . . .up to 1 month
Connectors . . . . . . . . . . . . . . . . . . . . .Modular RJ-11
Cable Type . . . . . . . . . . . . . . . . . . . . .4-conductor, 26 AWG
Housing Material. . . . . . . . . . . . . . . . .UV-resistant PVC plastic
Dimensions
Wireless (includes antenna) . . . .6.5" x 3.75" x 1.5" (165 mm x 95 mm x 38 mm)
Cabled . . . . . . . . . . . . . . . . . . . .6.5" x 3.75" x 1.5" (165 mm x 95 mm x 38 mm)
Weight (with batteries) . . . . . . . . . . . .0.58 lbs. (0.26 kg)
Communications (Wireless Models Only)
Transmit/Receive Frequency . . . . . . .US Models: 902-928 MHz FHSS, Overseas
Models: 868.0 - 868.6 MHz FHSS.
ID Codes Available . . . . . . . . . . . . . . .8
Output Power . . . . . . . . . . . . . . . . . . .902-928 MHz FHSS: FCC-certified low power,
less than 8 mW, no license required
868.0 - 868.6 MHz FHSS. CE-certified, less
than 8 mW, no license required
Range: Line of Sight . . . . . . . . . . . . . .up to 1000 feet (300 m)
Range: Through Walls . . . . . . . . . . . .200 to 400 feet (75 to 150 m)
Sensor Inputs
RF Filtering. . . . . . . . . . . . . . . . . . . . .RC low-pass filter on each signal line
Sensor Outputs
Inside Temperature (sensor located in Envoy)
Resolution and Units . . . . . . . . . .Current Data: 0.1°F or 1°F or 0.1°C or 1°C
(user-selectable) Historical Data and Alarms:
1°F or 1°C (user-selectable)
Range . . . . . . . . . . . . . . . . . . . . .+32° to +140°F (0° to +60°C)
Sensor Accuracy . . . . . . . . . . . . .±1°F (±0.5°C) up to 110°F (43°C), ±2°F
(±1°C) over 110°F (43°C)
Update Interval . . . . . . . . . . . . . .1 minute
Current Data . . . . . . . . . . . . . . . .Instant Reading (user adjustable); Daily and
Monthly High and Low
Historical Data. . . . . . . . . . . . . . .Hourly Readings; Daily and Monthly Highs
and Lows
Alarms. . . . . . . . . . . . . . . . . . . . .High and Low Thresholds from Instant
Reading
28
Barometric Pressure (sensor located in Envoy)
Resolution and Units . . . . . . . . . .0.01" Hg, 0.1 mm Hg, 0.1 hPa/mb (userselectable)
Corrected Range . . . . . . . . . . . . .26.00" to 32.00" Hg, 660.0 to 810.0 mm Hg,
880.0 to 1080.0 hPa/mb
Uncorrected Range . . . . . . . . . . .18.00" to 33.50" Hg, 457.0 to 850.0 mm Hg,
592.0 to 1130.0 hPa/mb
Elevation Range . . . . . . . . . . . . .-1500' to +15,300' (-460 m to 4670 m)
Uncorrected Reading Accuracy . .±0.03" Hg (±0.8 mm Hg, ±1.0 hPa/mb) (at
room temperature)
Sea-Level Reduction Equation . .United States Method employed prior to use
of current “R Factor” method
Equation Source . . . . . . . . . . . . .Smithsonian Meteorological Tables
Equation Accuracy . . . . . . . . . . .±0.01" Hg (±0.3 mm Hg, ±0.3 hPa/mb)
Elevation Accuracy Required. . . .±10’ (3m) to meet equation accuracy
specification
Overall Accuracy . . . . . . . . . . . . .±0.04" Hg (±1.0 mm Hg, ±1.4 hPa/mb)
Trend (change in 3 hours) . . . . . .Change ±0.6" (2 hPa/mb, 1.5 mm Hg) =
Rapidly
Change ±0.2" (.7hPa/mb, 0.5 mm Hg)= Slowly
Trend Indication . . . . . . . . . . . . .5 position arrow: Rising (rapidly or slowly),
Steady, or Falling (rapidly or slowly)
Update Interval . . . . . . . . . . . . . .1 minute
Current Data . . . . . . . . . . . . . . . .Instant, 15-min., and Hourly Reading; Daily,
Monthly, High and Low
Historical Data. . . . . . . . . . . . . . .15-min. and Hourly Reading; Daily, Monthly
Highs and Lows
Alarms. . . . . . . . . . . . . . . . . . . . .High Threshold from Current Trend for Storm
Clearing (Rising Trend
Low Threshold from Current Trend for Storm
Warning (Falling Trend)
Rising and Falling Alarms . . . . . .0.01 to 0.25" Hg (0.1 to 6.4 mm Hg, 0.1 to
8.5 hPa/mb)
Inside Relative Humidity (sensor located in Envoy)
Range . . . . . . . . . . . . . . . . . . . . .1 to 100% RH
Accuracy . . . . . . . . . . . . . . . . . . .±5%
Update Interval . . . . . . . . . . . . . .1 minute
Current Data . . . . . . . . . . . . . . . .Instant (user adjustable) and Hourly Reading;
Daily, Monthly High and Low
Historical Data. . . . . . . . . . . . . . .Hourly Readings; Daily, Monthly Highs and
Lows
Alarms. . . . . . . . . . . . . . . . . . . . .High and Low Threshold from Instant Reading
Clock
Resolution . . . . . . . . . . . . . . . . . .1 minute
Units . . . . . . . . . . . . . . . . . . . . . .Time: 12 or 24 hour format (user-selectable)
Date: US or International format (selectable)
Accuracy . . . . . . . . . . . . . . . . . . .±8 seconds/month
Adjustments . . . . . . . . . . . . . . . .Time: Automatic Daylight Savings Time (for
users in North America and Europe that
observe it in AUTO mode, MANUAL setting
available for all other areas) Date: Automatic
Leap Year
29
WeatherLink Tool bar Icons
Open
Station
Bulletin
Window
Download
Plot
Window
Strip Chart
Window
Yearly
Rainfall
Database
Window
Hot Keys
Alarm
Indication
Online
(Hang Up)
This Month’s
NOAA Summary
View
Help
Print
Window
Exit
Program
Strip Chart Window
ESC. . . . . . . Halt Redraw
Main Program Window
Ctrl-M . . . . . Make Default
Ctrl-A. . . . . . Set Alarms
Ctrl-P . . . . . Print Strip Chart
Ctrl-B. . . . . . View Bulletin
F1 . . . . . . . . Context-Sensitive Help
Ctrl-C. . . . . . Station Configuration
F3 . . . . . . . . Zoom In
Ctrl-G. . . . . . Degree-Days Report
F4 . . . . . . . . Zoom Out
Ctrl-H. . . . . . Hang Up
Ctrl-I. . . . . . . Communications Port Settings
Plot Window
ESC. . . . . . . Halt Redraw
Ctrl-J . . . . . . Automatic Download
Ctrl-D . . . . . Choose Date
Ctrl-K. . . . . . Walkthrough
Ctrl-M . . . . . Make Default
Ctrl-L . . . . . . Download
Ctrl-P . . . . . Print Plot
Ctrl-O. . . . . . Open Station
F1 . . . . . . . . Context-Sensitive Help
Ctrl-P . . . . . . Print Active Window
F3 . . . . . . . . Zoom In
Ctrl-Q. . . . . . Open Plot Window
F4 . . . . . . . . Zoom Out
Ctrl-R. . . . . . Yearly Rain Report
F9 . . . . . . . . Overlay Plots
Ctrl-S . . . . . . Open Strip Charts
F10 . . . . . . . Last Year Plot
Ctrl-T . . . . . . Set Time
Database Window
Ctrl-U. . . . . . Select Units
Ctrl-D . . . . . Choose Date
Ctrl-V . . . . . . View Download Log
Ctrl-N . . . . . Add Note
Ctrl-W . . . . . Browse Database
Ctrl-P . . . . . Print Records
Ctrl-Y . . . . . . View Summary
Enter. . . . . . Edit Record
Ctrl-Z . . . . . . Close Window
Delete . . . . . Delete Record
F1 . . . . . . . . . Context-Sensitive Help
F1 . . . . . . . . Context-Sensitive Help
F2 . . . . . . . . . Sunrise/Sunset Report
F7 . . . . . . . . . NOAA This Month
F8 . . . . . . . . . NOAA This Year
Yearly Rainfall Window
Enter. . . . . . Edit Year
Delete . . . . . Delete Year