1
Dell PowerEdge Configuration
Guide for the M I/O Aggregator
October 2013
Notes, Cautions, and Warnings
NOTE: A NOTE indicates important information that helps you make better use of your computer.
CAUTION: A CAUTION indicates either potential damage to hardware or loss of data and tells you how to avoid the
problem. indicates potential damage to hardware or loss of data if instructions are not followed.
WARNING: A WARNING indicates a potential for property damage, personal injury, or death.
Information in this publication is subject to change without notice.
© 2013 Dell Networking. All rights reserved.
Reproduction of these materials in any manner whatsoever without the written permission of Dell Inc. is strictly forbidden.
Trademarks used in this text: Dell™, the DELL logo, Dell Precision™, OptiPlex™, Latitude™, PowerEdge™, PowerVault™,
PowerConnect™, OpenManage™, EqualLogic™, KACE™, FlexAddress™ and Vostro™ are trademarks of Dell Inc. Intel, Pentium, Xeon,
Core™ and Celeron are registered trademarks of Intel Corporation in the U.S. and other countries. AMD is a registered trademark and AMD
Opteron™, AMD Phenom™, and AMD Sempron™ are trademarks of Advanced Micro Devices, Inc. Microsoft®, Windows®, Windows
Server®, MS-DOS® and Windows Vista® are either trademarks or registered trademarks of Microsoft Corporation in the United States and/or
other countries. Red Hat Enterprise Linux® and Enterprise Linux® are registered trademarks of Red Hat, Inc. in the United States and/or
other countries. Novell® is a registered trademark and SUSE ™ is a trademark of Novell Inc. in the United States and other countries.
Oracle® is a registered trademark of Oracle Corporation and/or its affiliates. Citrix®, Xen®, XenServer® and XenMotion® are either registered
trademarks or trademarks of Citrix Systems, Inc. in the United States and/or other countries. VMware®, Virtual SMP®, vMotion®, vCenter®,
and vSphere® are registered trademarks or trademarks of VMWare, Inc. in the United States or other countries.
Other trademarks and trade names may be used in this publication to refer to either the entities claiming the marks and names or their
products. Dell Inc. disclaims any proprietary interest in trademarks and trade names other than its own.
October 2013
1 About this Guide . . . . . . . . . . . . . . . . . . . . . . . . . . . . . . . . . . . . . . . . . . . . . . . . . . . 1
Objectives . . . . . . . . . . . . . . . . . . . . . . . . . . . . . . . . . . . . . . . . . . . . . . . . . . . . . . . . . . . . . 1
Audience . . . . . . . . . . . . . . . . . . . . . . . . . . . . . . . . . . . . . . . . . . . . . . . . . . . . . . . . . . . . . . 1
Conventions . . . . . . . . . . . . . . . . . . . . . . . . . . . . . . . . . . . . . . . . . . . . . . . . . . . . . . . . . . . . 2
Information Symbols . . . . . . . . . . . . . . . . . . . . . . . . . . . . . . . . . . . . . . . . . . . . . . . . . . . . . 2
Related Documents . . . . . . . . . . . . . . . . . . . . . . . . . . . . . . . . . . . . . . . . . . . . . . . . . . . . . . 2
2 Configuration Fundamentals . . . . . . . . . . . . . . . . . . . . . . . . . . . . . . . . . . . . . . . . . . 3
Accessing the Command Line . . . . . . . . . . . . . . . . . . . . . . . . . . . . . . . . . . . . . . . . . . . . . . 3
CLI Modes . . . . . . . . . . . . . . . . . . . . . . . . . . . . . . . . . . . . . . . . . . . . . . . . . . . . . . . . . . . . . 4
Navigating CLI Modes . . . . . . . . . . . . . . . . . . . . . . . . . . . . . . . . . . . . . . . . . . . . . . . . . 5
do Command . . . . . . . . . . . . . . . . . . . . . . . . . . . . . . . . . . . . . . . . . . . . . . . . . . . . . . . . . . . 6
Undoing Commands . . . . . . . . . . . . . . . . . . . . . . . . . . . . . . . . . . . . . . . . . . . . . . . . . . . . . 6
Obtaining Help . . . . . . . . . . . . . . . . . . . . . . . . . . . . . . . . . . . . . . . . . . . . . . . . . . . . . . . . . . 7
Entering and Editing Commands . . . . . . . . . . . . . . . . . . . . . . . . . . . . . . . . . . . . . . . . . . . . 8
Command History . . . . . . . . . . . . . . . . . . . . . . . . . . . . . . . . . . . . . . . . . . . . . . . . . . . . . . . 9
Filtering show Command Outputs . . . . . . . . . . . . . . . . . . . . . . . . . . . . . . . . . . . . . . . . . . . 9
Multiple Users in Configuration Mode . . . . . . . . . . . . . . . . . . . . . . . . . . . . . . . . . . . . . . . 11
3 Getting Started. . . . . . . . . . . . . . . . . . . . . . . . . . . . . . . . . . . . . . . . . . . . . . . . . . . . 13
Front Panel . . . . . . . . . . . . . . . . . . . . . . . . . . . . . . . . . . . . . . . . . . . . . . . . . . . . . . . . . . . 14
Port Numbering . . . . . . . . . . . . . . . . . . . . . . . . . . . . . . . . . . . . . . . . . . . . . . . . . . . . . . . . 14
Server-Facing Ports . . . . . . . . . . . . . . . . . . . . . . . . . . . . . . . . . . . . . . . . . . . . . . . . . 14
Uplink Ports . . . . . . . . . . . . . . . . . . . . . . . . . . . . . . . . . . . . . . . . . . . . . . . . . . . . . . . . 15
Stacking Ports . . . . . . . . . . . . . . . . . . . . . . . . . . . . . . . . . . . . . . . . . . . . . . . . . . . . . . 15
Port Configuration . . . . . . . . . . . . . . . . . . . . . . . . . . . . . . . . . . . . . . . . . . . . . . . . . . . 15
Console access . . . . . . . . . . . . . . . . . . . . . . . . . . . . . . . . . . . . . . . . . . . . . . . . . . . . . . . . 16
Serial Console . . . . . . . . . . . . . . . . . . . . . . . . . . . . . . . . . . . . . . . . . . . . . . . . . . . . . . 16
External Serial Port with a USB Connector . . . . . . . . . . . . . . . . . . . . . . . . . . . . . . . . 17
Boot Process . . . . . . . . . . . . . . . . . . . . . . . . . . . . . . . . . . . . . . . . . . . . . . . . . . . . . . . . . . 17
Configure a Host Name . . . . . . . . . . . . . . . . . . . . . . . . . . . . . . . . . . . . . . . . . . . . . . . . . . 22
Access the System Remotely . . . . . . . . . . . . . . . . . . . . . . . . . . . . . . . . . . . . . . . . . . . . . 22
Access the Aggregator Remotely . . . . . . . . . . . . . . . . . . . . . . . . . . . . . . . . . . . . . . . 23
Configure the Enable Password . . . . . . . . . . . . . . . . . . . . . . . . . . . . . . . . . . . . . . . . . . . 24
Configuration File Management . . . . . . . . . . . . . . . . . . . . . . . . . . . . . . . . . . . . . . . . . . . 25
Copy Files to and from the System . . . . . . . . . . . . . . . . . . . . . . . . . . . . . . . . . . . . . . 26
Save the Running-Configuration . . . . . . . . . . . . . . . . . . . . . . . . . . . . . . . . . . . . . . . 27
Restoring the Factory Default Settings . . . . . . . . . . . . . . . . . . . . . . . . . . . . . . . . . . . 28
View Files . . . . . . . . . . . . . . . . . . . . . . . . . . . . . . . . . . . . . . . . . . . . . . . . . . . . . . . . . 29
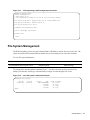
File System Management . . . . . . . . . . . . . . . . . . . . . . . . . . . . . . . . . . . . . . . . . . . . . . . . 31
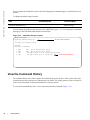
View the Command History . . . . . . . . . . . . . . . . . . . . . . . . . . . . . . . . . . . . . . . . . . . . . . . 32
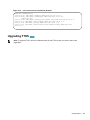
Upgrading FTOS . . . . . . . . . . . . . . . . . . . . . . . . . . . . . . . . . . . . . . . . . . . . . . . . . . . . . . . 33
| iii
www.dell.com | support.dell.com
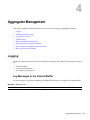
4 Aggregator Management. . . . . . . . . . . . . . . . . . . . . . . . . . . . . . . . . . . . . . . . . . . . 35
Logging . . . . . . . . . . . . . . . . . . . . . . . . . . . . . . . . . . . . . . . . . . . . . . . . . . . . . . . . . . . . . . 35
Log Messages in the Internal Buffer . . . . . . . . . . . . . . . . . . . . . . . . . . . . . . . . . . . . . 35
Disabling System Logging . . . . . . . . . . . . . . . . . . . . . . . . . . . . . . . . . . . . . . . . . . . . . 36
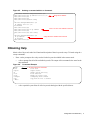
Send System Messages to a Syslog Server . . . . . . . . . . . . . . . . . . . . . . . . . . . . . . 36
Using a Unix System as a Syslog Server . . . . . . . . . . . . . . . . . . . . . . . . . . . . . . . . . 36
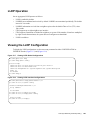
Changing System Logging Settings . . . . . . . . . . . . . . . . . . . . . . . . . . . . . . . . . . . . . . . . 37
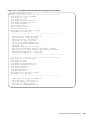
Displaying the Logging Buffer and Logging Configuration . . . . . . . . . . . . . . . . . . . . . . . . 38
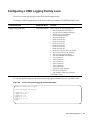
Configuring a UNIX Logging Facility Level . . . . . . . . . . . . . . . . . . . . . . . . . . . . . . . . . . . 39
Enabling Time Stamps on Syslog Messages . . . . . . . . . . . . . . . . . . . . . . . . . . . . . . . . . . 40
File Transfer Services . . . . . . . . . . . . . . . . . . . . . . . . . . . . . . . . . . . . . . . . . . . . . . . . . . . 40
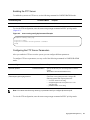
Configuration Task List for File Transfer Services . . . . . . . . . . . . . . . . . . . . . . . . . . . 40
Terminal Lines . . . . . . . . . . . . . . . . . . . . . . . . . . . . . . . . . . . . . . . . . . . . . . . . . . . . . . . . . 42
Telnet to Another Network Device . . . . . . . . . . . . . . . . . . . . . . . . . . . . . . . . . . . . . . . . . . 42
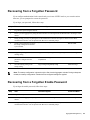
Recovering from a Forgotten Password . . . . . . . . . . . . . . . . . . . . . . . . . . . . . . . . . . . . . 43
Recovering from a Forgotten Enable Password . . . . . . . . . . . . . . . . . . . . . . . . . . . . . . . 43
Recovering from a Failed Start . . . . . . . . . . . . . . . . . . . . . . . . . . . . . . . . . . . . . . . . . . . . 44
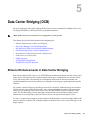
5 Data Center Bridging (DCB) . . . . . . . . . . . . . . . . . . . . . . . . . . . . . . . . . . . . . . . . . 47
Ethernet Enhancements in Data Center Bridging . . . . . . . . . . . . . . . . . . . . . . . . . . . . . . 47
Priority-Based Flow Control . . . . . . . . . . . . . . . . . . . . . . . . . . . . . . . . . . . . . . . . . . . 48
Enhanced Transmission Selection . . . . . . . . . . . . . . . . . . . . . . . . . . . . . . . . . . . . . . 52
Apply the DCB output policy to an interface. . . . . . . . . . . . . . . . . . . . . . . . . . . . . . . . 54
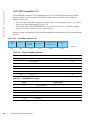
Data Center Bridging Exchange Protocol (DCBx) . . . . . . . . . . . . . . . . . . . . . . . . . . . 54
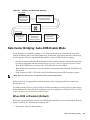
Data Center Bridging in a Traffic Flow . . . . . . . . . . . . . . . . . . . . . . . . . . . . . . . . . . . 54
Data Center Bridging: Auto-DCB-Enable Mode . . . . . . . . . . . . . . . . . . . . . . . . . . . . . . . . 55
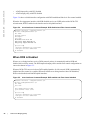
When DCB is Disabled (Default) . . . . . . . . . . . . . . . . . . . . . . . . . . . . . . . . . . . . . . . . 55
When DCB is Enabled . . . . . . . . . . . . . . . . . . . . . . . . . . . . . . . . . . . . . . . . . . . . . . . 56
Lossless Traffic Handling . . . . . . . . . . . . . . . . . . . . . . . . . . . . . . . . . . . . . . . . . . . . . 57
Enabling DCB on Next Reload . . . . . . . . . . . . . . . . . . . . . . . . . . . . . . . . . . . . . . . . . 57
Enabling Auto-DCB-Enable Mode on Next Reload . . . . . . . . . . . . . . . . . . . . . . . . . . 57
QoS dot1p Traffic Classification and Queue Assignment . . . . . . . . . . . . . . . . . . . . . . . . 58
How Priority-Based Flow Control is Implemented . . . . . . . . . . . . . . . . . . . . . . . . . . . . . . 59
How Enhanced Transmission Selection is Implemented . . . . . . . . . . . . . . . . . . . . . . . . . 59
ETS Operation with DCBx . . . . . . . . . . . . . . . . . . . . . . . . . . . . . . . . . . . . . . . . . . . . . 60
Bandwidth Allocation for DCBx CIN . . . . . . . . . . . . . . . . . . . . . . . . . . . . . . . . . . . . . 61
DCB Policies in a Switch Stack . . . . . . . . . . . . . . . . . . . . . . . . . . . . . . . . . . . . . . . . . . . . 61
DCBX Operation . . . . . . . . . . . . . . . . . . . . . . . . . . . . . . . . . . . . . . . . . . . . . . . . . . . . . . . 61
DCBx Operation . . . . . . . . . . . . . . . . . . . . . . . . . . . . . . . . . . . . . . . . . . . . . . . . . . . . 62
DCBx Port Roles . . . . . . . . . . . . . . . . . . . . . . . . . . . . . . . . . . . . . . . . . . . . . . . . . . . . 62
DCB Configuration Exchange . . . . . . . . . . . . . . . . . . . . . . . . . . . . . . . . . . . . . . . . . . 63
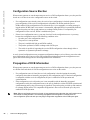
Configuration Source Election . . . . . . . . . . . . . . . . . . . . . . . . . . . . . . . . . . . . . . . . . . 64
Propagation of DCB Information . . . . . . . . . . . . . . . . . . . . . . . . . . . . . . . . . . . . . . . . 64
iv
|
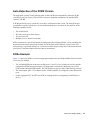
Auto-Detection of the DCBX Version . . . . . . . . . . . . . . . . . . . . . . . . . . . . . . . . . . . . 65
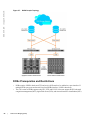
DCBx Example . . . . . . . . . . . . . . . . . . . . . . . . . . . . . . . . . . . . . . . . . . . . . . . . . . . . . 65
DCBx Prerequisites and Restrictions . . . . . . . . . . . . . . . . . . . . . . . . . . . . . . . . . . . . 66
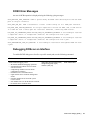
DCBX Error Messages . . . . . . . . . . . . . . . . . . . . . . . . . . . . . . . . . . . . . . . . . . . . . . . 67
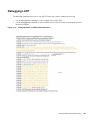
Debugging DCBx on an Interface . . . . . . . . . . . . . . . . . . . . . . . . . . . . . . . . . . . . . . . 67
Verifying DCB Configuration . . . . . . . . . . . . . . . . . . . . . . . . . . . . . . . . . . . . . . . . . . . . . . 68
Example: PFC and ETS Operation . . . . . . . . . . . . . . . . . . . . . . . . . . . . . . . . . . . . . . . . . 77
Hierarchical Scheduling in ETS Output Policies . . . . . . . . . . . . . . . . . . . . . . . . . . . . 81
6 Dynamic Host Configuration Protocol (DHCP) . . . . . . . . . . . . . . . . . . . . . . . . . . . 83
DHCP Overview . . . . . . . . . . . . . . . . . . . . . . . . . . . . . . . . . . . . . . . . . . . . . . . . . . . . . . . 83
DHCP Packet Format and Options . . . . . . . . . . . . . . . . . . . . . . . . . . . . . . . . . . . . . . 84
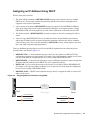
Assigning an IP Address Using DHCP . . . . . . . . . . . . . . . . . . . . . . . . . . . . . . . . . . . 85
DHCP Client . . . . . . . . . . . . . . . . . . . . . . . . . . . . . . . . . . . . . . . . . . . . . . . . . . . . . . . . . . 86
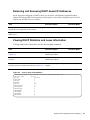
Releasing and Renewing DHCP-based IP Addresses . . . . . . . . . . . . . . . . . . . . . . . 87
Viewing DHCP Statistics and Lease Information . . . . . . . . . . . . . . . . . . . . . . . . . . . 87
Debugging DHCP Client Operation . . . . . . . . . . . . . . . . . . . . . . . . . . . . . . . . . . . . . . 88
How DHCP Client is Implemented . . . . . . . . . . . . . . . . . . . . . . . . . . . . . . . . . . . . . . 90
DHCP Client on a Management Interface . . . . . . . . . . . . . . . . . . . . . . . . . . . . . . . . 91
DHCP Client on a VLAN . . . . . . . . . . . . . . . . . . . . . . . . . . . . . . . . . . . . . . . . . . . . . . 92
DHCP Client Operation with Stacking . . . . . . . . . . . . . . . . . . . . . . . . . . . . . . . . . . . . 92
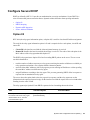
Configure Secure DHCP . . . . . . . . . . . . . . . . . . . . . . . . . . . . . . . . . . . . . . . . . . . . . . . . . 93
Option 82 . . . . . . . . . . . . . . . . . . . . . . . . . . . . . . . . . . . . . . . . . . . . . . . . . . . . . . . . . . 93
DHCP Snooping . . . . . . . . . . . . . . . . . . . . . . . . . . . . . . . . . . . . . . . . . . . . . . . . . . . . 94
Drop DHCP Packets on Snooped VLANs Only . . . . . . . . . . . . . . . . . . . . . . . . . . . . 96
Dynamic ARP Inspection . . . . . . . . . . . . . . . . . . . . . . . . . . . . . . . . . . . . . . . . . . . . . 97
Source Address Validation . . . . . . . . . . . . . . . . . . . . . . . . . . . . . . . . . . . . . . . . . . . . 99
7 FIP Snooping. . . . . . . . . . . . . . . . . . . . . . . . . . . . . . . . . . . . . . . . . . . . . . . . . . . . 103
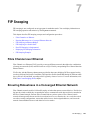
Fibre Channel over Ethernet . . . . . . . . . . . . . . . . . . . . . . . . . . . . . . . . . . . . . . . . . . . . . 103
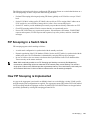
Ensuring Robustness in a Converged Ethernet Network . . . . . . . . . . . . . . . . . . . . . . . 103
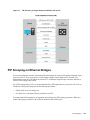
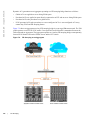
FIP Snooping on Ethernet Bridges . . . . . . . . . . . . . . . . . . . . . . . . . . . . . . . . . . . . . . . . 105
FIP Snooping in a Switch Stack . . . . . . . . . . . . . . . . . . . . . . . . . . . . . . . . . . . . . . . . . . . 107
How FIP Snooping is Implemented . . . . . . . . . . . . . . . . . . . . . . . . . . . . . . . . . . . . . . . . 107
FIP Snooping on VLANs . . . . . . . . . . . . . . . . . . . . . . . . . . . . . . . . . . . . . . . . . . . . . 108
FC-MAP Value . . . . . . . . . . . . . . . . . . . . . . . . . . . . . . . . . . . . . . . . . . . . . . . . . . . . 108
Bridge-to-FCF Links . . . . . . . . . . . . . . . . . . . . . . . . . . . . . . . . . . . . . . . . . . . . . . . . 108
Impact on other Software Features . . . . . . . . . . . . . . . . . . . . . . . . . . . . . . . . . . . . . 108
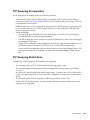
FIP Snooping Prerequisites . . . . . . . . . . . . . . . . . . . . . . . . . . . . . . . . . . . . . . . . . . 109
FIP Snooping Restrictions . . . . . . . . . . . . . . . . . . . . . . . . . . . . . . . . . . . . . . . . . . . . 109
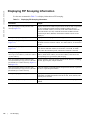
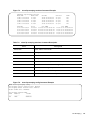
Displaying FIP Snooping Information . . . . . . . . . . . . . . . . . . . . . . . . . . . . . . . . . . . . . . 110
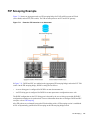
FIP Snooping Example . . . . . . . . . . . . . . . . . . . . . . . . . . . . . . . . . . . . . . . . . . . . . . . . . 117
Debugging FIP Snooping . . . . . . . . . . . . . . . . . . . . . . . . . . . . . . . . . . . . . . . . . . . . . . . 118
| v
www.dell.com | support.dell.com
8 Internet Group Management Protocol (IGMP). . . . . . . . . . . . . . . . . . . . . . . . . . . 119
IGMP Overview . . . . . . . . . . . . . . . . . . . . . . . . . . . . . . . . . . . . . . . . . . . . . . . . . . . . . . . 119
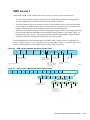
IGMP Version 2 . . . . . . . . . . . . . . . . . . . . . . . . . . . . . . . . . . . . . . . . . . . . . . . . . . . . 119
IGMP Version 3 . . . . . . . . . . . . . . . . . . . . . . . . . . . . . . . . . . . . . . . . . . . . . . . . . . . . 121
IGMP Snooping . . . . . . . . . . . . . . . . . . . . . . . . . . . . . . . . . . . . . . . . . . . . . . . . . . . . . . . 123
How IGMP Snooping is Implemented on an Aggregator . . . . . . . . . . . . . . . . . . . . 124
Disabling Multicast Flooding . . . . . . . . . . . . . . . . . . . . . . . . . . . . . . . . . . . . . . . . . . 124
Displaying IGMP Information . . . . . . . . . . . . . . . . . . . . . . . . . . . . . . . . . . . . . . . . . 124
9 Interfaces. . . . . . . . . . . . . . . . . . . . . . . . . . . . . . . . . . . . . . . . . . . . . . . . . . . . . . . 127
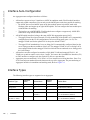
Interface Auto-Configuration . . . . . . . . . . . . . . . . . . . . . . . . . . . . . . . . . . . . . . . . . . . . . 128
Interface Types . . . . . . . . . . . . . . . . . . . . . . . . . . . . . . . . . . . . . . . . . . . . . . . . . . . . . . . 128
Viewing Interface Information . . . . . . . . . . . . . . . . . . . . . . . . . . . . . . . . . . . . . . . . . . . . 129
Disabling and Re-enabling a Physical Interface . . . . . . . . . . . . . . . . . . . . . . . . . . . . . . 131
Layer 2 Mode . . . . . . . . . . . . . . . . . . . . . . . . . . . . . . . . . . . . . . . . . . . . . . . . . . . . . . . . . 132
Management Interfaces . . . . . . . . . . . . . . . . . . . . . . . . . . . . . . . . . . . . . . . . . . . . . . . . . 132
Accessing an Aggregator . . . . . . . . . . . . . . . . . . . . . . . . . . . . . . . . . . . . . . . . . . . . 132
Configuring a Management Interface . . . . . . . . . . . . . . . . . . . . . . . . . . . . . . . . . . . 133
Configuring a Static Route for a Management Interface . . . . . . . . . . . . . . . . . . . . . 135
VLAN Membership . . . . . . . . . . . . . . . . . . . . . . . . . . . . . . . . . . . . . . . . . . . . . . . . . . . . 136
Default VLAN . . . . . . . . . . . . . . . . . . . . . . . . . . . . . . . . . . . . . . . . . . . . . . . . . . . . . 136
Port-Based VLANs . . . . . . . . . . . . . . . . . . . . . . . . . . . . . . . . . . . . . . . . . . . . . . . . . 137
VLANs and Port Tagging . . . . . . . . . . . . . . . . . . . . . . . . . . . . . . . . . . . . . . . . . . . . . 137
Configuring VLAN Membership . . . . . . . . . . . . . . . . . . . . . . . . . . . . . . . . . . . . . . . 138
Displaying VLAN Membership . . . . . . . . . . . . . . . . . . . . . . . . . . . . . . . . . . . . . . . . 139
Adding an Interface to a Tagged VLAN . . . . . . . . . . . . . . . . . . . . . . . . . . . . . . . . . . 140
Port Channel Interfaces . . . . . . . . . . . . . . . . . . . . . . . . . . . . . . . . . . . . . . . . . . . . . . . . . 141
Interface Range . . . . . . . . . . . . . . . . . . . . . . . . . . . . . . . . . . . . . . . . . . . . . . . . . . . . . . . 146
Bulk Configuration Examples . . . . . . . . . . . . . . . . . . . . . . . . . . . . . . . . . . . . . . . . . 146
Monitor and Maintain Interfaces . . . . . . . . . . . . . . . . . . . . . . . . . . . . . . . . . . . . . . . . . . 147
Maintenance Using TDR . . . . . . . . . . . . . . . . . . . . . . . . . . . . . . . . . . . . . . . . . . . . . 150
Flow Control Using Ethernet Pause Frames . . . . . . . . . . . . . . . . . . . . . . . . . . . . . . . . . 151
MTU Size . . . . . . . . . . . . . . . . . . . . . . . . . . . . . . . . . . . . . . . . . . . . . . . . . . . . . . . . . . . . 152
Auto-Negotiation on Ethernet Interfaces . . . . . . . . . . . . . . . . . . . . . . . . . . . . . . . . . . . . 153
Viewing Interface Information . . . . . . . . . . . . . . . . . . . . . . . . . . . . . . . . . . . . . . . . . . . . 156
Displaying Non-Default Configurations . . . . . . . . . . . . . . . . . . . . . . . . . . . . . . . . . . 156
10 iSCSI Optimization . . . . . . . . . . . . . . . . . . . . . . . . . . . . . . . . . . . . . . . . . . . . . . . 159
iSCSI Optimization Overview . . . . . . . . . . . . . . . . . . . . . . . . . . . . . . . . . . . . . . . . . . . . 159
Monitoring iSCSI Traffic Flows . . . . . . . . . . . . . . . . . . . . . . . . . . . . . . . . . . . . . . . . 160
Information Monitored in iSCSI Traffic Flows . . . . . . . . . . . . . . . . . . . . . . . . . . . . . 161
Detection and Auto configuration for Dell EqualLogic Arrays . . . . . . . . . . . . . . . . . 161
vi
|
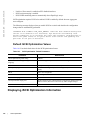
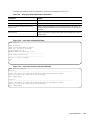
iSCSI Optimization: Operation . . . . . . . . . . . . . . . . . . . . . . . . . . . . . . . . . . . . . . . . 161
Default iSCSI Optimization Values . . . . . . . . . . . . . . . . . . . . . . . . . . . . . . . . . . . . . 162
11 Link Aggregation . . . . . . . . . . . . . . . . . . . . . . . . . . . . . . . . . . . . . . . . . . . . . . . . . 165
How the LACP is Implemented on an Aggregator . . . . . . . . . . . . . . . . . . . . . . . . . . . . . 165
Uplink LAG . . . . . . . . . . . . . . . . . . . . . . . . . . . . . . . . . . . . . . . . . . . . . . . . . . . . . . . 165
Server-Facing LAGs . . . . . . . . . . . . . . . . . . . . . . . . . . . . . . . . . . . . . . . . . . . . . . . . 166
LACP Modes . . . . . . . . . . . . . . . . . . . . . . . . . . . . . . . . . . . . . . . . . . . . . . . . . . . . . . 166
Auto-Configured LACP Timeout . . . . . . . . . . . . . . . . . . . . . . . . . . . . . . . . . . . . . . . 166
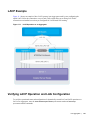
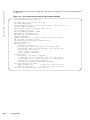
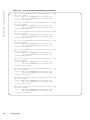
LACP Example . . . . . . . . . . . . . . . . . . . . . . . . . . . . . . . . . . . . . . . . . . . . . . . . . . . . . . . 167
Verifying LACP Operation and LAG Configuration . . . . . . . . . . . . . . . . . . . . . . . . . . . . 167
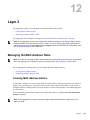
12 Layer 2 . . . . . . . . . . . . . . . . . . . . . . . . . . . . . . . . . . . . . . . . . . . . . . . . . . . . . . . . 173
Managing the MAC Address Table . . . . . . . . . . . . . . . . . . . . . . . . . . . . . . . . . . . . . . . . 173
Clearing MAC Address Entries . . . . . . . . . . . . . . . . . . . . . . . . . . . . . . . . . . . . . . . . 173
Displaying the MAC Address Table . . . . . . . . . . . . . . . . . . . . . . . . . . . . . . . . . . . . . 174
Network Interface Controller (NIC) Teaming . . . . . . . . . . . . . . . . . . . . . . . . . . . . . . . . . 174
MAC Address Station Move . . . . . . . . . . . . . . . . . . . . . . . . . . . . . . . . . . . . . . . . . . 175
MAC Move Optimization . . . . . . . . . . . . . . . . . . . . . . . . . . . . . . . . . . . . . . . . . . . . . 175
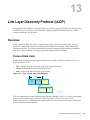
13 Link Layer Discovery Protocol (LLDP). . . . . . . . . . . . . . . . . . . . . . . . . . . . . . . . . 177
Overview . . . . . . . . . . . . . . . . . . . . . . . . . . . . . . . . . . . . . . . . . . . . . . . . . . . . . . . . . . . . 177
Protocol Data Units . . . . . . . . . . . . . . . . . . . . . . . . . . . . . . . . . . . . . . . . . . . . . . . . . 177
Optional TLVs . . . . . . . . . . . . . . . . . . . . . . . . . . . . . . . . . . . . . . . . . . . . . . . . . . . . . . . . 178
Management TLVs . . . . . . . . . . . . . . . . . . . . . . . . . . . . . . . . . . . . . . . . . . . . . . . . . 178
TIA-1057 (LLDP-MED) Overview . . . . . . . . . . . . . . . . . . . . . . . . . . . . . . . . . . . . . . . . . 180
TIA Organizationally Specific TLVs . . . . . . . . . . . . . . . . . . . . . . . . . . . . . . . . . . . . . 181
LLDP Operation . . . . . . . . . . . . . . . . . . . . . . . . . . . . . . . . . . . . . . . . . . . . . . . . . . . . . . . 185
Viewing the LLDP Configuration . . . . . . . . . . . . . . . . . . . . . . . . . . . . . . . . . . . . . . . . . . 185
Viewing Information Advertised by Adjacent LLDP Agents . . . . . . . . . . . . . . . . . . . . . . 186
Clearing LLDP Counters . . . . . . . . . . . . . . . . . . . . . . . . . . . . . . . . . . . . . . . . . . . . . . . . 188
Debugging LLDP . . . . . . . . . . . . . . . . . . . . . . . . . . . . . . . . . . . . . . . . . . . . . . . . . . . . . . 189
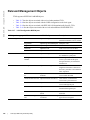
Relevant Management Objects . . . . . . . . . . . . . . . . . . . . . . . . . . . . . . . . . . . . . . . . . . . 190
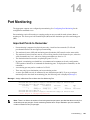
14 Port Monitoring . . . . . . . . . . . . . . . . . . . . . . . . . . . . . . . . . . . . . . . . . . . . . . . . . . 195
Important Points to Remember . . . . . . . . . . . . . . . . . . . . . . . . . . . . . . . . . . . . . . . . 195
Port Monitoring . . . . . . . . . . . . . . . . . . . . . . . . . . . . . . . . . . . . . . . . . . . . . . . . . . . . . . . 196
Configuring Port Monitoring . . . . . . . . . . . . . . . . . . . . . . . . . . . . . . . . . . . . . . . . . . . . . . 198
15 Simple Network Management Protocol (SNMP) . . . . . . . . . . . . . . . . . . . . . . . . . 201
Implementation Information . . . . . . . . . . . . . . . . . . . . . . . . . . . . . . . . . . . . . . . . . . . . . . 201
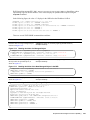
Configuring the Simple Network Management Protocol . . . . . . . . . . . . . . . . . . . . . . . . 201
| vii
www.dell.com | support.dell.com
Important Point to Remember . . . . . . . . . . . . . . . . . . . . . . . . . . . . . . . . . . . . . . . . . 201
Setting up SNMP . . . . . . . . . . . . . . . . . . . . . . . . . . . . . . . . . . . . . . . . . . . . . . . . . . . 202
Creating a Community . . . . . . . . . . . . . . . . . . . . . . . . . . . . . . . . . . . . . . . . . . . . . . 202
Read Managed Object Values . . . . . . . . . . . . . . . . . . . . . . . . . . . . . . . . . . . . . . . . . . . . 202
Displaying the Ports in a VLAN Using SNMP . . . . . . . . . . . . . . . . . . . . . . . . . . . . . . . . 204
Fetching Dynamic MAC Entries Using SNMP . . . . . . . . . . . . . . . . . . . . . . . . . . . . . . . . 205
Deriving Interface Indices . . . . . . . . . . . . . . . . . . . . . . . . . . . . . . . . . . . . . . . . . . . . . . . 207
Monitor Port-channels . . . . . . . . . . . . . . . . . . . . . . . . . . . . . . . . . . . . . . . . . . . . . . . . . . 209
Entity MIBS . . . . . . . . . . . . . . . . . . . . . . . . . . . . . . . . . . . . . . . . . . . . . . . . . . . . . . . . . . 210
SNMP Traps for Link Status and Stack Role . . . . . . . . . . . . . . . . . . . . . . . . . . . . . . . . . 212
16 Stacking . . . . . . . . . . . . . . . . . . . . . . . . . . . . . . . . . . . . . . . . . . . . . . . . . . . . . . . . 213
Overview . . . . . . . . . . . . . . . . . . . . . . . . . . . . . . . . . . . . . . . . . . . . . . . . . . . . . . . . . . . . 213
Stacking Aggregators . . . . . . . . . . . . . . . . . . . . . . . . . . . . . . . . . . . . . . . . . . . . . . . . . . 213
Stack Management Roles . . . . . . . . . . . . . . . . . . . . . . . . . . . . . . . . . . . . . . . . . . . . 214
Stack Master Election . . . . . . . . . . . . . . . . . . . . . . . . . . . . . . . . . . . . . . . . . . . . . . . 215
Failover Roles . . . . . . . . . . . . . . . . . . . . . . . . . . . . . . . . . . . . . . . . . . . . . . . . . . . . . 215
MAC Addressing . . . . . . . . . . . . . . . . . . . . . . . . . . . . . . . . . . . . . . . . . . . . . . . . . . . 216
Stacking LAG . . . . . . . . . . . . . . . . . . . . . . . . . . . . . . . . . . . . . . . . . . . . . . . . . . . . . 216
Stacking VLANs . . . . . . . . . . . . . . . . . . . . . . . . . . . . . . . . . . . . . . . . . . . . . . . . . . . 216
Stacking Port Numbers . . . . . . . . . . . . . . . . . . . . . . . . . . . . . . . . . . . . . . . . . . . . . . . . . 217
Configuring a Switch Stack . . . . . . . . . . . . . . . . . . . . . . . . . . . . . . . . . . . . . . . . . . . . . . 217
Stacking Prerequisites . . . . . . . . . . . . . . . . . . . . . . . . . . . . . . . . . . . . . . . . . . . . . . . 218
Cabling Stacked Switches . . . . . . . . . . . . . . . . . . . . . . . . . . . . . . . . . . . . . . . . . . . . 218
Accessing the CLI . . . . . . . . . . . . . . . . . . . . . . . . . . . . . . . . . . . . . . . . . . . . . . . . . . 219
Configuring and Bringing Up a Stack . . . . . . . . . . . . . . . . . . . . . . . . . . . . . . . . . . . 219
Adding a Stack Unit . . . . . . . . . . . . . . . . . . . . . . . . . . . . . . . . . . . . . . . . . . . . . . . . . 220
Resetting a Unit on a Stack . . . . . . . . . . . . . . . . . . . . . . . . . . . . . . . . . . . . . . . . . . . 221
Removing an Aggregator from a Stack and Restoring Quad Mode . . . . . . . . . . . . 221
Verifying a Stack Configuration . . . . . . . . . . . . . . . . . . . . . . . . . . . . . . . . . . . . . . . . . . . 222
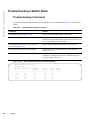
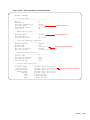
Troubleshooting a Switch Stack . . . . . . . . . . . . . . . . . . . . . . . . . . . . . . . . . . . . . . . . . . . 226
Troubleshooting Commands . . . . . . . . . . . . . . . . . . . . . . . . . . . . . . . . . . . . . . . . . . 226
Failure Scenarios . . . . . . . . . . . . . . . . . . . . . . . . . . . . . . . . . . . . . . . . . . . . . . . . . . 228
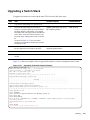
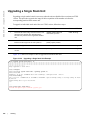
Upgrading a Switch Stack . . . . . . . . . . . . . . . . . . . . . . . . . . . . . . . . . . . . . . . . . . . . . . . 231
Upgrading a Single Stack Unit . . . . . . . . . . . . . . . . . . . . . . . . . . . . . . . . . . . . . . . . . . . . 232
17 Broadcast Storm Control . . . . . . . . . . . . . . . . . . . . . . . . . . . . . . . . . . . . . . . . . . . 233
Displaying Broadcast-Storm Control Status . . . . . . . . . . . . . . . . . . . . . . . . . . . . . . . . . . 233
Disabling Broadcast Storm Control . . . . . . . . . . . . . . . . . . . . . . . . . . . . . . . . . . . . . . . . 233
18 System Time and Date . . . . . . . . . . . . . . . . . . . . . . . . . . . . . . . . . . . . . . . . . . . . 235
Setting the Time for the Hardware Clock . . . . . . . . . . . . . . . . . . . . . . . . . . . . . . . . 235
viii
|
Setting the Time for the Software Clock . . . . . . . . . . . . . . . . . . . . . . . . . . . . . . . . . 236
Synchronizing the Hardware Clock Using the Software Clock . . . . . . . . . . . . . . . . 236
Setting the Time Zone . . . . . . . . . . . . . . . . . . . . . . . . . . . . . . . . . . . . . . . . . . . . . . . 237
Setting Daylight Savings Time . . . . . . . . . . . . . . . . . . . . . . . . . . . . . . . . . . . . . . . . 238
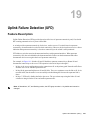
19 Uplink Failure Detection (UFD) . . . . . . . . . . . . . . . . . . . . . . . . . . . . . . . . . . . . . . 241
Feature Description . . . . . . . . . . . . . . . . . . . . . . . . . . . . . . . . . . . . . . . . . . . . . . . . . . . . 241
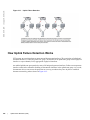
How Uplink Failure Detection Works
. . . . . . . . . . . . . . . . . . . . . . . . . . . . . . . . . . . . . . 242
UFD and NIC Teaming . . . . . . . . . . . . . . . . . . . . . . . . . . . . . . . . . . . . . . . . . . . . . . . . . 243
Important Points to Remember . . . . . . . . . . . . . . . . . . . . . . . . . . . . . . . . . . . . . . . . . . . 244
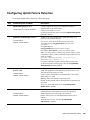
Configuring Uplink Failure Detection . . . . . . . . . . . . . . . . . . . . . . . . . . . . . . . . . . . . . . . 245
Clearing a UFD-Disabled Interface . . . . . . . . . . . . . . . . . . . . . . . . . . . . . . . . . . . . . . . . 246
Displaying Uplink Failure Detection . . . . . . . . . . . . . . . . . . . . . . . . . . . . . . . . . . . . . . . . 248
Sample Configuration: Uplink Failure Detection . . . . . . . . . . . . . . . . . . . . . . . . . . . . . . 251
20 Upgrade Procedures . . . . . . . . . . . . . . . . . . . . . . . . . . . . . . . . . . . . . . . . . . . . . . 253
21 Debugging and Diagnostics. . . . . . . . . . . . . . . . . . . . . . . . . . . . . . . . . . . . . . . . . 255
Debugging Aggregator Operation . . . . . . . . . . . . . . . . . . . . . . . . . . . . . . . . . . . . . . . . . 256
All interfaces on the Aggregator are operationally down . . . . . . . . . . . . . . . . . . . . . 256
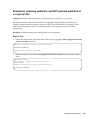
Broadcast, unknown multicast, and DLF packets switched at a very low rate . . . . 257
Flooded packets on all VLANs are received on a server . . . . . . . . . . . . . . . . . . . . 258
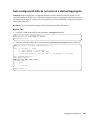
Auto-configured VLANs do not exist on a stacked Aggregator . . . . . . . . . . . . . . . . 259
Software show Commands . . . . . . . . . . . . . . . . . . . . . . . . . . . . . . . . . . . . . . . . . . . . . . 260
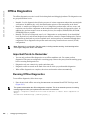
Offline Diagnostics . . . . . . . . . . . . . . . . . . . . . . . . . . . . . . . . . . . . . . . . . . . . . . . . . . . . . 262
Important Points to Remember . . . . . . . . . . . . . . . . . . . . . . . . . . . . . . . . . . . . . . . . 262
Running Offline Diagnostics . . . . . . . . . . . . . . . . . . . . . . . . . . . . . . . . . . . . . . . . . . 262
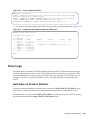
Trace Logs . . . . . . . . . . . . . . . . . . . . . . . . . . . . . . . . . . . . . . . . . . . . . . . . . . . . . . . . . . . 263
Auto Save on Crash or Rollover . . . . . . . . . . . . . . . . . . . . . . . . . . . . . . . . . . . . . . . 263
Show Hardware Commands . . . . . . . . . . . . . . . . . . . . . . . . . . . . . . . . . . . . . . . . . . . . . 264
Environmental Monitoring . . . . . . . . . . . . . . . . . . . . . . . . . . . . . . . . . . . . . . . . . . . . . . . 265
Recognize an Over-Temperature Condition . . . . . . . . . . . . . . . . . . . . . . . . . . . . . . 267
Troubleshoot an Over-Temperature Condition . . . . . . . . . . . . . . . . . . . . . . . . . . . . 267
Recognize an Under-Voltage Condition . . . . . . . . . . . . . . . . . . . . . . . . . . . . . . . . . 268
Troubleshoot an Under-Voltage Condition . . . . . . . . . . . . . . . . . . . . . . . . . . . . . . . 268
Buffer Tuning . . . . . . . . . . . . . . . . . . . . . . . . . . . . . . . . . . . . . . . . . . . . . . . . . . . . . . . . .269
Deciding to Tune Buffers . . . . . . . . . . . . . . . . . . . . . . . . . . . . . . . . . . . . . . . . . . . . . 271
Buffer Tuning Commands . . . . . . . . . . . . . . . . . . . . . . . . . . . . . . . . . . . . . . . . . . . . 271
Sample Buffer Profile Configuration . . . . . . . . . . . . . . . . . . . . . . . . . . . . . . . . . . . . 275
Troubleshooting Packet Loss . . . . . . . . . . . . . . . . . . . . . . . . . . . . . . . . . . . . . . . . . . . . 275
Displaying Drop Counters . . . . . . . . . . . . . . . . . . . . . . . . . . . . . . . . . . . . . . . . . . . . 276
Dataplane Statistics . . . . . . . . . . . . . . . . . . . . . . . . . . . . . . . . . . . . . . . . . . . . . . . . . 277
| ix
www.dell.com | support.dell.com
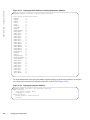
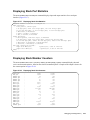
Displaying Stack Port Statistics . . . . . . . . . . . . . . . . . . . . . . . . . . . . . . . . . . . . . . . . 279
x
Displaying Stack Member Counters . . . . . . . . . . . . . . . . . . . . . . . . . . . . . . . . . . . . 279
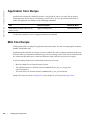
Application Core Dumps . . . . . . . . . . . . . . . . . . . . . . . . . . . . . . . . . . . . . . . . . . . . . . . . 280
Mini Core Dumps . . . . . . . . . . . . . . . . . . . . . . . . . . . . . . . . . . . . . . . . . . . . . . . . . . . . . . 280
TCP Dumps . . . . . . . . . . . . . . . . . . . . . . . . . . . . . . . . . . . . . . . . . . . . . . . . . . . . . . . . . . 282
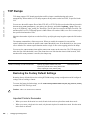
Restoring the Factory Default Settings . . . . . . . . . . . . . . . . . . . . . . . . . . . . . . . . . . 282
22 Standards Compliance . . . . . . . . . . . . . . . . . . . . . . . . . . . . . . . . . . . . . . . . . . . . 285
IEEE Compliance . . . . . . . . . . . . . . . . . . . . . . . . . . . . . . . . . . . . . . . . . . . . . . . . . . . . . 285
RFC and I-D Compliance . . . . . . . . . . . . . . . . . . . . . . . . . . . . . . . . . . . . . . . . . . . . . . . 286
MIB Location . . . . . . . . . . . . . . . . . . . . . . . . . . . . . . . . . . . . . . . . . . . . . . . . . . . . . . . . .290
|
1
About this Guide
Objectives
This guide describes the supported protocols and software features, and provides configuration instructions
and examples, for the Dell Networking M I/O Aggregator running FTOS version 8.3.17.4.
The M I/O Aggregator is installed in a Dell PowerEdge M1000e Enclosure. For information about how to
install and perform the initial switch configuration, refer to the Getting Started Guides on the Dell Support
website at http://support.dell.com/manuals.
Though this guide contains information about protocols, it is not intended to be a complete reference. This
guide is a reference for configuring protocols on Dell Networking systems. For complete information
about protocols, refer to other documentation, including IETF requests for comment (RFCs). The
instructions in this guide cite relevant RFCs, and Standards Compliance contains a complete list of the
supported RFCs and management information base files (MIBs).
Note: You can perform some of the configuration tasks described in this document by using either the
FTOS command line or the Chassis Management Controller (CMC) graphical interface. Tasks supported
by the CMC interface are shown with the CMC icon:
Audience
This document is intended for system administrators who are responsible for configuring and maintaining
networks and assumes you are knowledgeable in Layer 2 and Layer 3 networking technologies.
About this Guide | 1
www.dell.com | support.dell.com
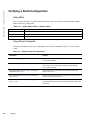
Conventions
This document uses the following conventions to describe command syntax:
Convention
Description
keyword
Keywords are in bold and must be entered in the CLI as listed.
parameter
Parameters are in italics and require a number or word to be entered in the CLI.
{X}
Keywords and parameters within braces must be entered in the CLI.
[X]
Keywords and parameters within brackets are optional.
x|y
Keywords and parameters separated by bar require you to choose one.
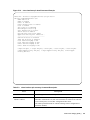
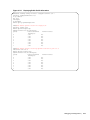
Information Symbols
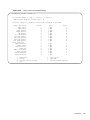
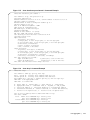
Table 1-1 describes symbols contained in this guide.
Table 1-1.
Information Symbols
Symbol
*
Meaning
Description
FTOS Behavior
This symbol informs you of an FTOS behavior. These behaviors are
inherent to the Dell Networking system or FTOS feature and are
non-configurable.
Exception
This symbol is a note associated with some other text on the page that is
marked with an asterisk.
Chassis Management
Controller (CMC)
user interface
This symbol indicates that you can also perform the specified
configuration task on an Aggregator by using the CMC graphical interface.
For information about how to access the CMC to configure an Aggregator,
refer to the Dell PowerEdge M1000e Enclosure Hardware Owner's
Manual or Dell Chassis Management Controller (CMC) User’s Guide on
the Dell Support website at http://support.dell.com/support/edocs/systems/
pem/en/index.htm.
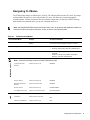
Related Documents
For more information about the Dell PowerEdge MI/O Aggregator MXL 10/40GbE Switch IO Module,
refer to the following documents:
•
•
•
2
|
Dell Networking FTOS Command Line Reference Guide for the M I/O Aggregator
Dell PowerEdge M I/O Aggregator Getting Started Guide
Release Notes for the M I/O Aggregator (FTOS version 8.3.17.3)
About this Guide
2
Configuration Fundamentals
The Dell Networking operating software (FTOS) command line interface (CLI) is a text-based interface
through which you can configure interfaces and protocols. The CLI is structured in modes for security and
management purposes. Different sets of commands are available in each mode, and you can limit user
access to modes using privilege levels.
In FTOS, after you enable a command, it is entered into the running configuration file. You can view the
current configuration for the whole system or for a particular CLI mode. To save the current configuration,
copy the running configuration to another location. For more information, refer to Save the
Running-Configuration.
Note: You can use the chassis management controller (CMC) out-of-band management interface to
access and manage an Aggregator using the FTOS command-line interface. For information about how to
access the CMC to configure an Aggregator, refer to the Dell Chassis Management Controller (CMC)
User's Guide on the Dell Support website at http://support.dell.com/support/edocs/systems/pem/en/
index.htm.
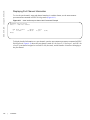
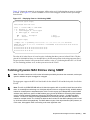
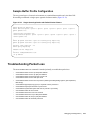
Accessing the Command Line
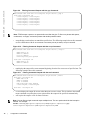
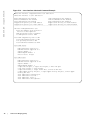
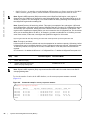
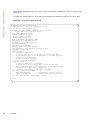
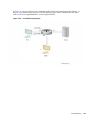
Access the command line through a serial console port or a Telnet session (Figure 2-1). When the system
successfully boots, enter the command line in EXEC mode.
Figure 2-1.
Logging into the System using Telnet
telnet 172.31.1.53
Trying 172.31.1.53...
Connected to 172.31.1.53.
Escape character is '^]'.
Login: username
Password:
FTOS>
EXEC mode prompt
Configuration Fundamentals | 3
www.dell.com | support.dell.com
CLI Modes
Different sets of commands are available in each mode. A command found in one mode cannot be
executed from another mode (with the exception of EXEC mode commands preceded by the command do;
for more information, refer to do Command and EXEC Privilege Mode commands).
The FTOS CLI is divided into three major mode levels:
•
•
•
EXEC mode is the default mode and has a privilege level of 1, which is the most restricted level. Only
a limited selection of commands is available, notably the show commands, which allow you to view
system information.
EXEC Privilege mode has commands to view configurations, clear counters, manage configuration
files, run diagnostics, and enable or disable debug operations. The privilege level is 15, which is
unrestricted. You can configure a password for this mode. For more information, refer to Configure the
Enable Password.
CONFIGURATION mode allows you to configure security features, time settings, set logging and
simple network management protocol (SNMP) functions, and static address resolution protocol (ARP)
and MAC addresses on the system.
Beneath CONFIGURATION mode are sub-modes that apply to interfaces, protocols, and features. the
following illustration shows this sub-mode command structure. When configuring the chassis for the first
time, the following two sub-CONFIGURATION modes are important:
•
•
INTERFACE sub-mode is the mode in which you configure Layer 2 and Layer 3 protocols and IP
services specific to an interface. An interface can be physical (management interface, 10-Gigabit
Ethernet, or 40-Gigabit Ethernet) or logical (Loopback, Null, port channel, or VLAN).
LINE sub-mode is the mode in which you configure the console and virtual terminal lines.
Note: At any time, entering a question mark (?) displays the available command options. For example,
when you are in CONFIGURATION mode, entering the question mark first lists all the available
commands, including the possible sub-modes.
Figure 2-2.
FTOS CLI Modes Supported on the Aggregator
EXEC
EXEC Privilege
CONFIGURATION
INTERFACE
10 GIGABIT ETHERNET
INTERFACE RANGE
MANAGEMENT ETHERNET
LINE
CONSOLE
VIRTUAL TERMINAL
MONITOR SESSION
4
|
Configuration Fundamentals
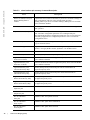
Navigating CLI Modes
The FTOS prompt changes to indicate the CLI mode. The following table lists the CLI mode, its prompt,
and information about how to access and exit this CLI mode. You must move linearly through the
command modes, with the exception of the end command, which takes you directly to EXEC Privilege
mode and the exit command moves you up one command mode level.
Note: Sub-CONFIGURATION modes all have the letters “conf” in the prompt with additional modifiers to
identify the mode and slot/port information. These are shown in the following table.
Table 2-1.
FTOS Command Modes
CLI Command Mode
Prompt
Access Command
EXEC
FTOS>
Access the router through the console or Telnet.
EXEC Privilege
FTOS#
•
•
From EXEC mode, enter the command enable.
From any other mode, enter the command end.
CONFIGURATION
FTOS(conf)#
•
From EXEC privilege mode, enter the command
configure.
From every mode except EXEC and EXEC
Privilege, enter the command exit.
•
LINE
INTERFACE modes
Note: Access the following modes from CONFIGURATION mode:
10 Gigabit Ethernet
Interface
FTOS(conf-if-te-0/1)#
interface
Interface Range
FTOS(conf-if-range)#
interface
Management Ethernet
Interface
FTOS(conf-if-ma-0/0)#
interface
Monitor Session
FTOS(conf-mon-sess)
monitor session
IP COMMUNITY-LIST
FTOS(conf-community-list)#
ip community-list
CONSOLE
FTOS(conf-line-console)#
line
VIRTUAL TERMINAL
FTOS(conf-line-vty)#
line
Configuration Fundamentals | 5
www.dell.com | support.dell.com
The following illustration shows how to change the command mode from CONFIGURATION mode to
INTERFACE configuration mode.
Figure 2-3.
Changing CLI Modes
FTOS(conf)# interface tengigabitethernet 1/2
FTOS(conf-if-te-1/2)#
New command prompt
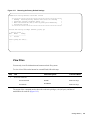
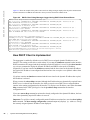
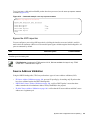
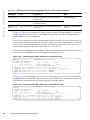
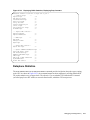
do Command
Enter an EXEC mode or EXEC privilege mode command from any CONFIGURATION mode (such as
CONFIGURATION, INTERFACE, etc.) without returning to EXEC mode by preceding the EXEC mode
command with the command do. The following example illustrates the do command.
Note: The following commands cannot be modified by the do command: enable, disable, exit, and configure.
Figure 2-4.
Using the do Command
FTOS(conf)#do show system brief
“do” form of show command
Stack MAC : 00:01:e8:00:ab:03
-- Stack Info -Unit UnitType
Status
ReqTyp
CurTyp
Version
Ports
-----------------------------------------------------------------------------------0
Member
not present
1
Management
online
I/O-Aggregator I/O-Aggregator 8-3-17-38
56
2
Member
not present
3
Member
not present
4
Member
not present
5
Member
not present
FTOS(conf)#
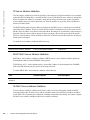
Undoing Commands
When you enter a command, the command line is added to the running configuration file. Disable a
command and remove it from the running-config by entering the original command preceded by the
command no. For example, to delete an ip address configured on an interface, use the no ip-address
ip-address command, as shown in the following example.
Note: Use the help or ? command as described in Obtaining Help to help you construct the no form of a
command.
6
|
Configuration Fundamentals
Figure 2-5.
Undoing a command with the no Command
FTOS(conf)# interface managementethernet 0/0
FTOS(conf-if-ma-0/0)# ip address 192.168.5.6/16
Assign an IP address
FTOS(conf-if-ma-0/0)#
FTOS(conf-if-ma-0/0)#
FTOS(conf-if-ma-0/0)#show config
!
interface ManagementEthernet 0/0
ip address 192.168.5.6/16
no shutdown
FTOS(conf-if-ma-0/0)#
Enter “no” form of IP address command
FTOS(conf-if-ma-0/0)# no ip address
FTOS(conf-if-ma-0/0)#
FTOS(conf-if-ma-0/0)# show config
!
interface ManagementEthernet 0/0
no ip address
Verify that the IP address was removed
no shutdown
FTOS(conf-if-ma-0/0)#
Obtaining Help
Obtain a list of keywords and a brief functional description of those keywords at any CLI mode using the ?
or help commands:
•
Enter ? at the prompt or after a keyword to list the keywords available in the current mode.
• ? after a prompt lists all of the available keywords. The output of this command is the same for the
help command.
Figure 2-6.
FTOS#?
start
capture
cd
clear
clock
configure
copy
--More--
•
?
? Command Example
“?” at prompt for list of commands
Start Shell
Capture Packet
Change current directory
Reset functions
Manage the system clock
Configuring from terminal
Copy from one file to another
after a partial keyword lists all of the keywords that begin with the specified letters.
Configuration Fundamentals | 7
www.dell.com | support.dell.com
Figure 2-7.
Keyword? Command Example
FTOS(conf)#cl?
clock
FTOS(conf)#cl
•
partial keyword plus “?” for matching keywords
A keyword followed by [space]? lists all of the keywords that can follow the specified keyword.
Figure 2-8.
Keyword ? Command Example
FTOS(conf)#clock ?
summer-time
timezone
FTOS(conf)#clock
keyword plus “[space]?” for compatible keywords
Configure summer (daylight savings) time
Configure time zone
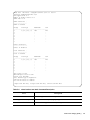
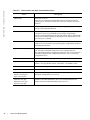
Entering and Editing Commands
When entering commands:
•
•
Table 2-2.
8
|
The CLI is not case sensitive.
You can enter partial CLI keywords.
• You must enter the minimum number of letters to uniquely identify a command. For example, cl
cannot be entered as a partial keyword because both the clock and class-map commands begin with
the letters “cl.” You can, however, enter clo as a partial keyword because only one command
begins with those three letters.
• The TAB key auto-completes keywords in commands.
• The UP and DOWN arrow keys display previously entered commands (refer to Command
History).
• The BACKSPACE and DELETE keys erase the previous letter.
• Key combinations are available to move quickly across the command line, refer to the following
table.
Short-Cut Keys and their Actions
Key Combination
Action
CNTL-A
Moves the cursor to the beginning of the command line.
CNTL-B
Moves the cursor back one character.
CNTL-D
Deletes the character at cursor.
CNTL-E
Moves the cursor to the end of the line.
CNTL-F
Moves the cursor forward one character.
CNTL-I
Completes a keyword.
CNTL-K
Deletes all characters from the cursor to the end of the command line.
CNTL-L
Re-enters the previous command.
CNTL-N
Return to more recent commands in the history buffer after recalling commands with CTRL-P or the
UP arrow key.
Configuration Fundamentals
Table 2-2.
Short-Cut Keys and their Actions (continued)
Key Combination
Action
CNTL-P
Recalls commands, beginning with the last command.
CNTL-R
Re-enters the previous command.
CNTL-U
Deletes the line.
CNTL-W
Deletes the previous word.
CNTL-X
Deletes the line.
CNTL-Z
Ends continuous scrolling of command outputs.
Esc B
Moves the cursor back one word.
Esc F
Moves the cursor forward one word.
Esc D
Deletes all characters from the cursor to the end of the word.
Command History
FTOS maintains a history of previously-entered commands for each mode. For example:
•
•
When you are in EXEC mode, the UP and DOWN arrow keys display the previously-entered EXEC
mode commands.
When you are in CONFIGURATION mode, the UP or DOWN arrows keys recall the
previously-entered CONFIGURATION mode commands.
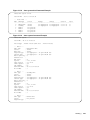
Filtering show Command Outputs
Filter the output of a show command to display specific information by adding | [except | find | grep | no-more
| save] specified_text after the command. The variable specified_text is the text for which you are filtering and
it IS case sensitive unless you use the ignore-case sub-option.
The grep command accepts an ignore-case sub-option that forces the search to be case-insensitive. For
example, the commands:
•
•
returns a search result with instances containing a capitalized “Ethernet,” such
as interface TenGigabitEthernet 0/0.
show run | grep ethernet would not return that search result because it only searches for instances
containing a non-capitalized “ethernet.”
show run | grep Ethernet
Executing the show run | grep Ethernet ignore-case command would return instances containing both
“Ethernet” and “ethernet.”
•
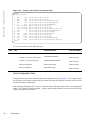
grep displays
only the lines containing specified text. The following example shows this command
used in combination with the do show stack-unit all stack-ports pfc details | grep 0 command.
Configuration Fundamentals | 9
www.dell.com | support.dell.com
Figure 2-9.
Filtering Command Outputs with the grep Command
FTOS(conf)#do show stack-unit
stack unit 0 stack-port all
0 Pause Tx pkts, 0 Pause
0 Pause Tx pkts, 0 Pause
0 Pause Tx pkts, 0 Pause
0 Pause Tx pkts, 0 Pause
0 Pause Tx pkts, 0 Pause
0 Pause Tx pkts, 0 Pause
all stack-ports all pfc details | grep 0
Rx
Rx
Rx
Rx
Rx
Rx
pkts
pkts
pkts
pkts
pkts
pkts
Note: FTOS accepts a space or no space before and after the pipe. To filter on a phrase with spaces,
underscores, or ranges, enclose the phrase with double quotation marks.
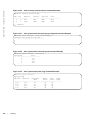
•
except displays text that does not match the specified text. The following example shows this command
used in combination with the do show stack-unit all stack-ports all pfc details | except 0 command.
Figure 2-10. Filtering Command Outputs with the except Command
FTOS(conf)#do show stack-unit all stack-ports all pfc details | except 0
Admin mode is On
Admin is enabled
Local is enabled
Link Delay 45556 pause quantum
stack unit 1 stack-port all
Admin mode is On
Admin is enabled
•
find displays the output of the show command beginning from the first occurrence of specified text. The
following example shows this command.
Figure 2-11.
Filtering Command Outputs with the find Command
FTOS(conf)#do show stack-unit all stack-ports all pfc details | find 0
stack unit 0 stack-port all
Admin mode is On
Admin is enabled
Local is enabled
Link Delay 45556 pause quantum
0 Pause Tx pkts, 0 Pause Rx pkts
stack unit 1 stack-port all
•
no-more displays the output all at once rather than one screen at a time. This is similar to the terminal
length command except that the no-more option affects the output of the specified command only.
•
save copies
the output to a file for future reference.
Note: You can filter a single command output multiple times. The save option should be the last option
entered. For example:
FTOS# command | grep regular-expression | except regular-expression | grep
other-regular-expression | find regular-expression | save
10
|
Configuration Fundamentals
Multiple Users in Configuration Mode
FTOS notifies all users in the event that there are multiple users logged into CONFIGURATION mode. A
warning message indicates the username, type of connection (console or vty), and in the case of a vty
connection, the IP address of the terminal on which the connection was established. For example:
•
On the system that telnets into the switch, the following example appears:
Message 1 Multiple Users in Configuration Mode Telnet Message
% Warning: The following users are currently configuring the system:
User "<username>" on line console0
•
On the system that is connected over the console, the following example appears:
Message 2 Multiple Users in Configuration Mode Telnet Message
% Warning: User "<username>" on line vty0 "10.11.130.2" is in configuration mode
If either of these messages appear, Dell Networking recommends coordinating with the users listed in the
message so that you do not unintentionally overwrite each other’s configuration changes.
Configuration Fundamentals | 11
12
|
Configuration Fundamentals
www.dell.com | support.dell.com
3
Getting Started
This chapter contains the following sections:
•
•
•
•
•
•
•
•
•
•
•
Front Panel
Port Numbering
Console access
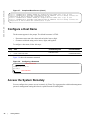
Boot Process
Configure a Host Name
Access the System Remotely
Configure the Enable Password
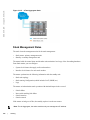
Configuration File Management
File System Management
View the Command History
Upgrading FTOS
When the boot process is complete, the console monitor displays the Dell Networking operating software
(FTOS) banner and EXEC mode prompt (Figure 3-3).
For details about using the command line interface (CLI), refer to the Accessing the Command Line
section in the Configuration Fundamentals chapter.
Getting Started | 13
www.dell.com | support.dell.com
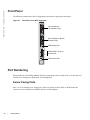
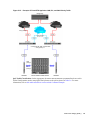
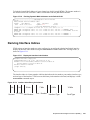
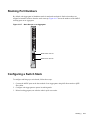
Front Panel
The following example shows the I/O Aggregator (also known as aggregator) front panel:
Figure 3-1.
Front Panel of the M I/O Aggregator
Flex IO Module in
Top Expansion Slot
Flex IO Module in Bottom
Expansion Slot
USB Storage Port
40GbE QSFP+ Ports on
Base Module
USB Console Port
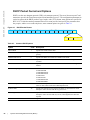
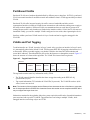
Port Numbering
When installed in a PowerEdge M1000e Enclosure, Aggregator ports are numbered 1 to 56 and consist of
internal server-facing ports, uplink ports, and stacking ports.
Server-Facing Ports
Ports 1 to 32 are internal server-facing ports, which can operate in either 1GbE or 10GbE mode and
connect to servers installed in the M1000e chassis over the midplane.
14
|
Getting Started
Uplink Ports
Ports 33 to 56 are external ports used for uplinks and numbered from the bottom to the top of the switch as
follows:
•
•
•
The two base module ports operate by default in standalone 4x10GbE mode and are numbered 33 to 36
and 37 to 40.
Ports on the 2-Port 40-GbE QSFP+ module operate only in 4x10GbE mode:
• In the bottom expansion slot, ports are numbered 41 to 44 and 45 to 48.
• In the top expansion slot, ports are numbered 49 to 52 and 53 to 56.
Ports on the 4-Port 10-GbE SFP+ and 4-Port 10GBASE-T modules operate only in 10GbE mode:
• In the bottom expansion slot, ports are numbered 41 to 44.
• In the top expansion slot, ports are numbered 49 to 52.
Stacking Ports
Stacking is supported only on the ports on the base module. When you configure the Aggregator for
stacking, the base module ports operate in 40GbE mode and are numbered 33 and 37. When configured for
stacking, the 40GbE base-module ports cannot be used for uplinks.
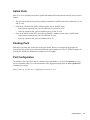
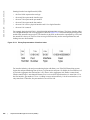
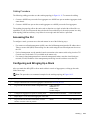
Port Configuration
To configure a port, specify the slot (0-5; default: 0) and port number (1 to 56) in the interface port-type
slot/port command, where slot is the unit number of the Aggregator displayed in the show system brief
command; for example:
FTOS(conf)# interface tengigabitethernet 0/4
Getting Started | 15
www.dell.com | support.dell.com
Figure 3-2.
Port Numbering on an Aggregator
2-Port 40-GbE QSFP+ FlexIO
Module (4x10GbE mode):
Ports 53 to 56 (top port)
Ports 49 to 52 (bottom port)
4-Port 10-GbE SFP+ or
4-Port 10GBASE-T FlexIO Module:
Ports 49 to 52 (4x10GbE mode)
2-Port 40-GbE QSFP+ FlexIO
Module (4x10GbE mode):
Ports 45 to 48 (top port)
Ports 41 to 44(bottom port)
4-Port 10-GbE SFP+ or
4-Port 10GBASE-T FlexIO Module:
Ports 41 to 44 (4x10GbE mode)
40GbE QSFP+ Port 37 (stacking)
or
Ports 37 to 40 (4x10GbE mode)
40GbE QSFP+ Port 33 (stacking)
or
Ports 33 to 36 (4x10GbE mode)
Console access
The Aggregator has two management ports available for system access: a serial console port and an
out-of-bounds (OOB) port.
Serial Console
A universal serial bus (USB) (A-Type) connector is located on the front panel. The USB can be defined as
an External Serial Console (RS-232) port, and is labeled on the Aggregator. The USB is on the lower side
of an installed Aggregator, as you face the I/O side of the M1000e chassis. For the console port pinout,
refer to the table in External Serial Port with a USB Connector.
To access the console port, follow these steps.
Step
16
|
Task
1
Connect the USB connector to the front panel. Use the RS-232 Serial Line cable to connect the Aggregator
console port to a terminal server.
2
Connect the other end of the cable to the DTE terminal server.
Getting Started
Step
Task (continued)
Note: Terminal settings on the console port cannot be changed in the software and are set as follows:
•
•
•
•
•
9600 baud rate
No parity
8 data bits
1 stop bit
No flow control
External Serial Port with a USB Connector
The following table lists the pin assignments.
Table 3-1.
Pin Assignments
USB Pin Number
Signal Name
Pin 1
RTS
Pin 2
RX
Pin 3
TX
Pin 4
CTS
Pin 5, 6
GND
RxD
Chassis GND
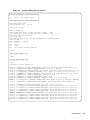
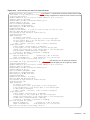
Boot Process
After you follow the instructions in the Installation Procedure in the Getting Started Guide, the Aggregator
boots up. The Aggregator with FTOS version 9.2.0.0 requires boot flash version 4.0.1.0 and boot selector
version 4.0.0.0. Figure 3-3 through Figure 3-7 show the completed boot process.
Getting Started | 17
www.dell.com | support.dell.com
Figure 3-3.
Completed Boot Process
syncing disks... done
unmounting file systems...
unmounting /f10/flash (/dev/ld0e)...
unmounting /usr (mfs:31)...
unmounting /lib (mfs:23)...
unmounting /f10 (mfs:20)...
unmounting /tmp (mfs:15)...
unmounting /kern (kernfs)...
unmounting / (/dev/md0a)... done
rebooting...
þ
NetLogic XLP Stage 1 Loader
Built by build at tools-sjc-01 on Fri Mar 16
Navasota IOM Boot Selector Label 4.0.0.0bt
9:03:43 2012
##############################################
#
#
#
x-loader: for Navasota board
#
#
#
##############################################
Nodes online: 1
GPIO 22 init'ed as an output
GPIO 23 init'ed as an output
I2C0 speed = 30 KHz, prescaler = 0x0377.
Initialized I2C0 Controller.
I2C1 speed = 100 KHz, prescaler = 0x0109.
Initialized I2C1 Controller.
DDR SPD: Node 0 Channel 0 Mem size = 2048 MB
DDR SPD: Node 0 DRAM frequency 666 MHz
DDR SPD: Node 0 CPU frequency 1200 MHz
RTT Norm:44
NBU0 DRAM BAR0 base: 00000000 limit: 0013f000 xlate: 00000001 node: 00000000 (
size:
320 MB)
NBU0 DRAM BAR1 base: 001d0000 limit: 0088f000 xlate: 00090001 node: 00000000 (
size: 1728 MB)
Modifying Default Flash Address map..Done
Initialized e.MMC Host Controller
Detected SD Card
BLC is 1 (preset 10)
Hit any key to stop autoboot: 0
F10 Boot Image selection
Reading the Boot Block Info...Passed !!
Images are OK A:0x0 B:0x0
Boot Selector set to Bootflash Partition A image...
Verifying Copyright Information..success for Image - 0
Boot Selector: Booting Bootflash Partition A image...
Copying stage-2 loader from 0xb6120000 to 0x8c100000(size = 0x100000)
F10 Boot Image selection DONE.
## Starting application at 0x8C100000 ...
U-Boot 2010.03-rc1(Dell Force10)
Built by antonyr at login-sjc-05 on Wed May
Navasota IOM Boot Label 4.0.1.0bt
DRAM:
18
|
2 GB
Getting Started
2
0:57:04 2012
0 MB ->
320 MB,
464 MB ->
2192 MB,
Figure 3-4.
Completed Boot Process (Contd.)
##########################################
#
#
#
u-boot: for Navasota board
#
#
#
##########################################
Initialized CPLD on CS3
Detected [XLP308 (Lite)
Rev A0]
CPLD reg 06 val 0xf7
This is a NAVASOTA ...
Initializing I2C0: speed = 30 KHz, prescaler = 0x0377 -- done.
Initializing I2C1: speed = 100 KHz, prescaler = 0x0109 -- done.
Initialized eMMC Host Controller
Detected SD Card
Now running in RAM - U-Boot [N64 ABI, Big-Endian] at: ffffffff8c100000
Flash: 256 MB
PCIE (B0:D01:F0) : Link up.
In:
serial
Out:
serial
Err:
serial
Net:
nae-0: PHY is Broadcom BCM54616S
--More-RELEASE IMAGE HEADER DATA :
---------------------------More-SOFTWARE IMAGE HEADER DATA :
-----------------------------More-Starting Dell Force10 application
00:00:15:
00:00:16:
00:00:18:
00:00:18:
00:00:18:
00:00:18:
00:00:20:
00:00:20:
00:00:22:
state
00:00:23:
%STKUNIT0-M:CP %RAM-6-ELECTION_ROLE: Stack unit 0 is transitioning to Management unit.
%STKUNIT0-M:CP %CHMGR-5-STACKUNITDETECTED: Stack unit 0 present
%STKUNIT0-M:CP %CHMGR-5-CHECKIN: Checkin from Stack unit 0 (type I/O-Aggregator, 56 ports)
%I/O-Aggregator:0 %LCMGR-5-IOM_STATE: Switch status of stack-unit 0 is set to Good
%STKUNIT0-M:CP %IFMGR-5-ASTATE_UP: Changed uplink state group Admin state to up: Group 1
%STKUNIT0-M:CP %CHMGR-5-STACKUNITUP: Stack unit 0 is up
%STKUNIT0-M:CP %CHMGR-5-SYSTEM_READY: System ready
%STKUNIT0-M:CP %IFMGR-5-OSTATE_UP: Changed interface state to up: Ma 0/0
%I/O-Aggregator:0 %POLLMGR-2-MODULE_POWER_STATE: Module 0 in unit 0 changed to POWER GOOD
%STKUNIT0-M:CP %CHMGR-0-TEMP_STATUS_CHANGE:
Unit 0 temperature state changed to 1.
00:00:24: %STKUNIT0-M:CP %RAM-5-STACK_STATE: Stack unit 0 is in Active State.
00:00:25: %I/O-Aggregator:0 %IFAGT-5-INSERT_OPTICS_QSFP: Optics QSFP inserted in
00:00:25: %I/O-Aggregator:0 %IFAGT-5-INSERT_OPTICS_QSFP: Optics QSFP inserted in
00:00:25: %I/O-Aggregator:0 %IFAGT-5-INSERT_OPTICS_QSFP: Optics QSFP inserted in
00:00:26: %I/O-Aggregator:0 %IFAGT-5-INSERT_OPTICS_QSFP: Optics QSFP inserted in
00:00:26: %STKUNIT0-M:CP %CHMGR-5-MODULE_INSERTED: SFP+ module has been inserted
optional slot 0
00:00:27: %I/O-Aggregator:0 %IFAGT-5-INSERT_OPTICS_PLUS: Optics SFP+ inserted in
00:00:28: %I/O-Aggregator:0 %IFAGT-5-INSERT_OPTICS_PLUS: Optics SFP+ inserted in
00:00:28: %I/O-Aggregator:0 %IFAGT-5-INSERT_OPTICS_PLUS: Optics SFP+ inserted in
00:00:28: %I/O-Aggregator:0 %IFAGT-5-INSERT_OPTICS_PLUS: Optics SFP+ inserted in
slot 0 port 33
slot 0 port 34
slot 0 port 35
slot 0 port 36
in stack-unit 0
slot
slot
slot
slot
0
0
0
0
port
port
port
port
41
42
43
44
Getting Started | 19
www.dell.com | support.dell.com
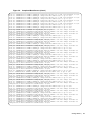
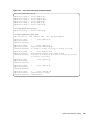
Figure 3-5.
20
Completed Boot Process (Contd.)
FTOS>00:00:30: %STKUNIT0-M:CP %IFMGR-5-IFM_ISCSI_ENABLE: iSCSI has been enabled causing flow control
to be enabled on all interfaces. EQL detection and enabling iscsi profile-compellent on an interface
may cause some automatic configurations to occur like jumbo frames on all ports and no storm control
on the port of detection
00:00:30: %STKUNIT0-M:CP %SEC-5-LOGIN_SUCCESS: Login successful for user on line console
00:00:31: %STKUNIT0-M:CP %SNMP-6-SNMP_WARM_START: Agent Initialized - SNMP WARM_START.
00:00:31: %STKUNIT0-M:CP %IFMGR-5-OSTATE_DN: Changed uplink state group state to down: Group 1
00:00:32: %STKUNIT0-M:CP %IFMGR-5-ASTATE_UP: Changed interface Admin state to up: Te 0/1
00:00:32: %STKUNIT0-M:CP %IFMGR-5-OSTATE_DN: Downstream interface set to UFD error-disabled: Te 0/1
00:00:43: %STKUNIT0-M:CP %IFMGR-5-ASTATE_UP: Changed interface Admin state to up: Te 0/2
00:00:44: %STKUNIT0-M:CP %IFMGR-5-OSTATE_DN: Downstream interface set to UFD error-disabled: Te 0/2
00:00:44: %STKUNIT0-M:CP %IFMGR-5-ASTATE_UP: Changed interface Admin state to up: Te 0/3
00:00:44: %STKUNIT0-M:CP %IFMGR-5-OSTATE_DN: Downstream interface set to UFD error-disabled: Te 0/3
00:00:45: %STKUNIT0-M:CP %IFMGR-5-ASTATE_UP: Changed interface Admin state to up: Te 0/4
00:00:45: %STKUNIT0-M:CP %IFMGR-5-OSTATE_DN: Downstream interface set to UFD error-disabled: Te 0/4
00:00:45: %STKUNIT0-M:CP %IFMGR-5-ASTATE_UP: Changed interface Admin state to up: Te 0/5
00:00:45: %STKUNIT0-M:CP %IFMGR-5-OSTATE_DN: Downstream interface set to UFD error-disabled: Te 0/5
00:00:46: %STKUNIT0-M:CP %IFMGR-5-ASTATE_UP: Changed interface Admin state to up: Te 0/6
00:00:46: %STKUNIT0-M:CP %IFMGR-5-OSTATE_DN: Downstream interface set to UFD error-disabled: Te 0/6
00:00:46: %STKUNIT0-M:CP %IFMGR-5-ASTATE_UP: Changed interface Admin state to up: Te 0/7
00:00:46: %STKUNIT0-M:CP %IFMGR-5-OSTATE_DN: Downstream interface set to UFD error-disabled: Te 0/7
00:00:47: %STKUNIT0-M:CP %IFMGR-5-ASTATE_UP: Changed interface Admin state to up: Te 0/8
00:00:47: %STKUNIT0-M:CP %IFMGR-5-OSTATE_DN: Downstream interface set to UFD error-disabled: Te 0/8
00:00:47: %STKUNIT0-M:CP %IFMGR-5-ASTATE_UP: Changed interface Admin state to up: Te 0/9
00:00:47: %STKUNIT0-M:CP %IFMGR-5-OSTATE_DN: Downstream interface set to UFD error-disabled: Te 0/9
00:00:48: %STKUNIT0-M:CP %IFMGR-5-ASTATE_UP: Changed interface Admin state to up: Te 0/10
00:00:48: %STKUNIT0-M:CP %IFMGR-5-OSTATE_DN: Downstream interface set to UFD error-disabled: Te 0/10
00:00:48: %STKUNIT0-M:CP %IFMGR-5-ASTATE_UP: Changed interface Admin state to up: Te 0/11
00:00:48: %STKUNIT0-M:CP %IFMGR-5-OSTATE_DN: Downstream interface set to UFD error-disabled: Te 0/11
00:00:49: %STKUNIT0-M:CP %IFMGR-5-ASTATE_UP: Changed interface Admin state to up: Te 0/12
00:00:49: %STKUNIT0-M:CP %IFMGR-5-OSTATE_DN: Downstream interface set to UFD error-disabled: Te 0/12
00:00:49: %STKUNIT0-M:CP %IFMGR-5-ASTATE_UP: Changed interface Admin state to up: Te 0/13
00:00:50: %STKUNIT0-M:CP %IFMGR-5-OSTATE_DN: Downstream interface set to UFD error-disabled: Te 0/13
00:00:50: %STKUNIT0-M:CP %IFMGR-5-ASTATE_UP: Changed interface Admin state to up: Te 0/14
00:00:50: %STKUNIT0-M:CP %IFMGR-5-OSTATE_DN: Downstream interface set to UFD error-disabled: Te 0/14
00:00:51: %STKUNIT0-M:CP %IFMGR-5-ASTATE_UP: Changed interface Admin state to up: Te 0/15
00:00:51: %STKUNIT0-M:CP %IFMGR-5-OSTATE_DN: Downstream interface set to UFD error-disabled: Te 0/15
00:00:51: %STKUNIT0-M:CP %IFMGR-5-ASTATE_UP: Changed interface Admin state to up: Te 0/16
00:00:51: %STKUNIT0-M:CP %IFMGR-5-OSTATE_DN: Downstream interface set to UFD error-disabled: Te 0/16
00:00:52: %STKUNIT0-M:CP %IFMGR-5-ASTATE_UP: Changed interface Admin state to up: Te 0/17
00:00:52: %STKUNIT0-M:CP %IFMGR-5-OSTATE_DN: Downstream interface set to UFD error-disabled: Te 0/17
00:00:52: %STKUNIT0-M:CP %IFMGR-5-ASTATE_UP: Changed interface Admin state to up: Te 0/18
00:00:52: %STKUNIT0-M:CP %IFMGR-5-OSTATE_DN: Downstream interface set to UFD error-disabled: Te 0/18
00:00:52 : IO-AGG [Active]: Informing IOM booted successfully to CMC : Passed
00:00:53: %STKUNIT0-M:CP %IFMGR-5-ASTATE_UP: Changed interface Admin state to up: Te 0/19
00:00:53: %STKUNIT0-M:CP %IFMGR-5-OSTATE_DN: Downstream interface set to UFD error-disabled: Te 0/19
00:00:53: %STKUNIT0-M:CP %IFMGR-5-ASTATE_UP: Changed interface Admin state to up: Te 0/20
00:00:53: %STKUNIT0-M:CP %IFMGR-5-OSTATE_DN: Downstream interface set to UFD error-disabled: Te 0/20
00:00:54: %STKUNIT0-M:CP %IFMGR-5-ASTATE_UP: Changed interface Admin state to up: Te 0/21
00:00:54: %STKUNIT0-M:CP %IFMGR-5-OSTATE_DN: Downstream interface set to UFD error-disabled: Te 0/21
00:00:54: %STKUNIT0-M:CP %IFMGR-5-ASTATE_UP: Changed interface Admin state to up: Te 0/22
00:00:55: %STKUNIT0-M:CP %IFMGR-5-OSTATE_DN: Downstream interface set to UFD error-disabled: Te 0/22
00:00:55: %STKUNIT0-M:CP %IFMGR-5-ASTATE_UP: Changed interface Admin state to up: Te 0/23
00:00:55: %STKUNIT0-M:CP %IFMGR-5-OSTATE_DN: Downstream interface set to UFD error-disabled: Te 0/23
00:00:56: %STKUNIT0-M:CP %IFMGR-5-ASTATE_UP: Changed interface Admin state to up: Te 0/24
00:00:56: %STKUNIT0-M:CP %IFMGR-5-OSTATE_DN: Downstream interface set to UFD error-disabled: Te 0/24
00:00:56: %STKUNIT0-M:CP %IFMGR-5-ASTATE_UP: Changed interface Admin state to up: Te 0/25
00:00:56: %STKUNIT0-M:CP %IFMGR-5-OSTATE_DN: Downstream interface set to UFD error-disabled: Te 0/25
00:00:57: %STKUNIT0-M:CP %IFMGR-5-ASTATE_UP: Changed interface Admin state to up: Te 0/26
00:00:57: %STKUNIT0-M:CP %IFMGR-5-OSTATE_DN: Downstream interface set to UFD error-disabled: Te 0/26
00:00:57: %STKUNIT0-M:CP %IFMGR-5-ASTATE_UP: Changed interface Admin state to up: Te 0/27
00:00:57: %STKUNIT0-M:CP %IFMGR-5-OSTATE_DN: Downstream interface set to UFD error-disabled: Te 0/27
00:00:58: %STKUNIT0-M:CP %IFMGR-5-ASTATE_UP: Changed interface Admin state to up: Te 0/28
00:00:58: %STKUNIT0-M:CP %IFMGR-5-OSTATE_DN: Downstream interface set to UFD error-disabled: Te 0/28
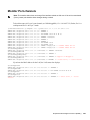
|
Getting Started
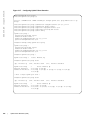
Figure 3-6.
Completed Boot Process (Contd.)
00:00:59: %STKUNIT0-M:CP %IFMGR-5-OSTATE_DN: Downstream interface set to UFD error-disabled: Te 0/29
00:00:59: %STKUNIT0-M:CP %IFMGR-5-ASTATE_UP: Changed interface Admin state to up: Te 0/30
00:00:59: %STKUNIT0-M:CP %IFMGR-5-OSTATE_DN: Downstream interface set to UFD error-disabled: Te 0/30
00:01:00: %STKUNIT0-M:CP %IFMGR-5-ASTATE_UP: Changed interface Admin state to up: Te 0/31
00:01:00: %STKUNIT0-M:CP %IFMGR-5-OSTATE_DN: Downstream interface set to UFD error-disabled: Te 0/31
00:01:00: %STKUNIT0-M:CP %IFMGR-5-ASTATE_UP: Changed interface Admin state to up: Te 0/32
00:01:00: %STKUNIT0-M:CP %IFMGR-5-OSTATE_DN: Downstream interface set to UFD error-disabled: Te 0/32
00:01:01: %STKUNIT0-M:CP %IFMGR-5-ASTATE_UP: Changed interface Admin state to up: Te 0/33
00:01:01: %STKUNIT0-M:CP %IFMGR-5-ASTATE_UP: Changed interface Admin state to up: Te 0/34
00:01:02: %STKUNIT0-M:CP %IFMGR-5-ASTATE_UP: Changed interface Admin state to up: Te 0/35
00:01:03: %STKUNIT0-M:CP %DIFFSERV-4-DSM_DCBX_ETS_RECO_TX_OVERRIDE: Port Role Change overrides
theconfiguration of ETS Recommend TLV transmitstatus: Te 0/33
00:01:03: %STKUNIT0-M:CP %DIFFSERV-4-DSM_DCBX_ETS_RECO_TX_OVERRIDE: Port Role Change overrides the
configuration of ETS Recommend TLV transmitstatus: Te 0/34
00:01:03: %STKUNIT0-M:CP %DIFFSERV-4-DSM_DCBX_ETS_RECO_TX_OVERRIDE: Port Role Change overrides the
configuration of ETS Recommend TLV transmitstatus: Te 0/35
00:01:03: %STKUNIT0-M:CP %IFMGR-5-ASTATE_UP: Changed interface Admin state to up: Te 0/36
00:01:03: %STKUNIT0-M:CP %IFMGR-5-ASTATE_UP: Changed interface Admin state to up: Te 0/37
00:01:04: %STKUNIT0-M:CP %DIFFSERV-4-DSM_DCBX_ETS_RECO_TX_OVERRIDE: Port Role Change overrides the
configuration of ETS Recommend TLV transmitstatus: Te 0/36
00:01:04: %STKUNIT0-M:CP %DIFFSERV-4-DSM_DCBX_ETS_RECO_TX_OVERRIDE: Port Role Change overrides the
configuration of ETS Recommend TLV transmitstatus: Te 0/37
00:01:04: %STKUNIT0-M:CP %IFMGR-5-ASTATE_UP: Changed interface Admin state to up: Te 0/38
00:01:04: %STKUNIT0-M:CP %DIFFSERV-4-DSM_DCBX_ETS_RECO_TX_OVERRIDE: Port Role Change overrides the
configuration of ETS Recommend TLV transmitstatus: Te 0/38
00:01:04: %STKUNIT0-M:CP %IFMGR-5-ASTATE_UP: Changed interface Admin state to up: Te 0/39
00:01:04: %STKUNIT0-M:CP %IFMGR-5-ASTATE_UP: Changed interface Admin state to up: Te 0/40
00:01:04: %STKUNIT0-M:CP %DIFFSERV-4-DSM_DCBX_ETS_RECO_TX_OVERRIDE: Port Role Change overrides the
configuration of ETS Recommend TLV transmitstatus: Te 0/39
00:01:04: %STKUNIT0-M:CP %DIFFSERV-4-DSM_DCBX_ETS_RECO_TX_OVERRIDE: Port Role Change overrides the
configuration of ETS Recommend TLV transmitstatus: Te 0/40
00:01:05: %STKUNIT0-M:CP %IFMGR-5-ASTATE_UP: Changed interface Admin state to up: Te 0/41
00:01:05: %STKUNIT0-M:CP %DIFFSERV-4-DSM_DCBX_ETS_RECO_TX_OVERRIDE: Port Role Change overrides the
configuration of ETS Recommend TLV transmitstatus: Te 0/41
00:01:05: %STKUNIT0-M:CP %IFMGR-5-ASTATE_UP: Changed interface Admin state to up: Te 0/42
00:01:06: %STKUNIT0-M:CP %IFMGR-5-ASTATE_UP: Changed interface Admin state to up: Te 0/43
00:01:06: %STKUNIT0-M:CP %DIFFSERV-4-DSM_DCBX_ETS_RECO_TX_OVERRIDE: Port Role Change overrides the
configuration of ETS Recommend TLV transmitstatus: Te 0/42
00:01:06: %STKUNIT0-M:CP %DIFFSERV-4-DSM_DCBX_ETS_RECO_TX_OVERRIDE: Port Role Change overrides the
configuration of ETS Recommend TLV transmitstatus: Te 0/43
00:01:06: %STKUNIT0-M:CP %IFMGR-5-ASTATE_UP: Changed interface Admin state to up: Te 0/44
00:01:07: %STKUNIT0-M:CP %DIFFSERV-4-DSM_DCBX_ETS_RECO_TX_OVERRIDE: Port Role Change overrides the
configuration of ETS Recommend TLV transmitstatus: Te 0/44
00:01:07: %STKUNIT0-M:CP %IFMGR-5-ASTATE_UP: Changed interface Admin state to up: Te 0/45
0:01:07: %STKUNIT0-M:CP %IFMGR-5-ASTATE_UP: Changed interface Admin state to up: Te 0/46
00:01:08: %STKUNIT0-M:CP %DIFFSERV-4-DSM_DCBX_ETS_RECO_TX_OVERRIDE: Port Role Change overrides the
configuration of ETS Recommend TLV transmitstatus: Te 0/45
00:01:08: %STKUNIT0-M:CP %DIFFSERV-4-DSM_DCBX_ETS_RECO_TX_OVERRIDE: Port Role Change overrides the
configuration of ETS Recommend TLV transmitstatus: Te 0/46
00:01:08: %STKUNIT0-M:CP %IFMGR-5-ASTATE_UP: Changed interface Admin state to up: Te 0/47
00:01:08: %STKUNIT0-M:CP %DIFFSERV-4-DSM_DCBX_ETS_RECO_TX_OVERRIDE: Port Role Change overrides the
configuration of ETS Recommend TLV transmitstatus: Te 0/47
00:01:09: %STKUNIT0-M:CP %IFMGR-5-ASTATE_UP: Changed interface Admin state to up: Te 0/48
00:01:09: %STKUNIT0-M:CP %DIFFSERV-4-DSM_DCBX_ETS_RECO_TX_OVERRIDE: Port Role Change overrides the
configuration of ETS Recommend TLV transmitstatus: Te 0/48
00:01:09: %STKUNIT0-M:CP %IFMGR-5-ASTATE_UP: Changed interface Admin state to up: Te 0/49
00:01:09: %STKUNIT0-M:CP %IFMGR-5-ASTATE_UP: Changed interface Admin state to up: Te 0/50
00:01:10: %STKUNIT0-M:CP %DIFFSERV-4-DSM_DCBX_ETS_RECO_TX_OVERRIDE: Port Role Change overrides the
configuration of ETS Recommend TLV transmitstatus: Te 0/49
00:01:10: %STKUNIT0-M:CP %DIFFSERV-4-DSM_DCBX_ETS_RECO_TX_OVERRIDE: Port Role Change overrides the
configuration of ETS Recommend TLV transmitstatus: Te 0/50
00:01:10: %STKUNIT0-M:CP %IFMGR-5-ASTATE_UP: Changed interface Admin state to up: Te 0/51
00:01:10: %STKUNIT0-M:CP %DIFFSERV-4-DSM_DCBX_ETS_RECO_TX_OVERRIDE: Port Role Change overrides the
configuration of ETS Recommend TLV transmitstatus: Te 0/51
00:01:10: %STKUNIT0-M:CP %IFMGR-5-ASTATE_UP: Changed interface Admin state to up: Te 0/52
00:01:10: %STKUNIT0-M:CP %IFMGR-5-ASTATE_UP: Changed interface Admin state to up: Te 0/53
00:01:11: %STKUNIT0-M:CP %DIFFSERV-4-DSM_DCBX_ETS_RECO_TX_OVERRIDE: Port Role Change overrides the
configuration of ETS Recommend TLV transmitstatus: Te 0/52
00:01:11: %STKUNIT0-M:CP %DIFFSERV-4-DSM_DCBX_ETS_RECO_TX_OVERRIDE: Port Role Change overrides the
configuration of ETS Recommend TLV transmitstatus: Te 0/53
Getting Started | 21
www.dell.com | support.dell.com
Figure 3-7.
Completed Boot Process (Contd.)
00:01:11: %STKUNIT0-M:CP %IFMGR-5-ASTATE_UP: Changed interface Admin state to
00:01:11: %STKUNIT0-M:CP %DIFFSERV-4-DSM_DCBX_ETS_RECO_TX_OVERRIDE: Port Role
configuration of ETS Recommend TLV transmitstatus: Te 0/54
00:01:11: %STKUNIT0-M:CP %IFMGR-5-ASTATE_UP: Changed interface Admin state to
00:01:11: %STKUNIT0-M:CP %DIFFSERV-4-DSM_DCBX_ETS_RECO_TX_OVERRIDE: Port Role
configuration of ETS Recommend TLV transmitstatus: Te 0/54
up: Te 0/54
Change overrides the
up: Te 0/54
Change overrides the
Configure a Host Name
The host name appears in the prompt. The default host name is FTOS.
•
•
Host names must start with a letter and end with a letter or digit.
Characters within the string can be letters, digits, and hyphens.
To configure a host name, follow this steps:
Step
1
Task
Command Syntax
Command Mode
Create a new host name.
hostname name
CONFIGURATION
Figure 3-8 shows the hostname command.
Figure 3-8.
Configuring a Hostname
Default Hostname
FTOS(conf)#hostname R1
R1(conf)#
New Hostname
Access the System Remotely
You can configure the system to access it remotely by Telnet. The Aggregator has a dedicated management
port and a management routing table that is separate from the IP routing table.
22
|
Getting Started
Access the Aggregator Remotely
Configuring the Aggregator for Telnet access is a three-step process:
1. Configure an IP address for the management port. Refer to Configure the Management Port IP
Address.
2. Configure a management route with a default gateway. Refer to Configure a Management Route.
3. Configure a username and password. Refer to Configure a Username and Password.
Configure the Management Port IP Address
Assign IP addresses to the management ports in order to access the system remotely. To configure the
management port IP address, follow these steps:
Step
1
2
Task
Command Syntax
Command Mode
Enter INTERFACE mode for the
Management port.
interface ManagementEthernet slot/port
CONFIGURATION
Assign an IP address to the
interface.
•
•
ip address ip-address/mask
•
•
3
Enable the interface.
slot: 0
port: 0
INTERFACE
ip-address: an address in dotted-decimal format
(A.B.C.D).
mask: a subnet mask in /prefix-length format (/
xx).
no shutdown
INTERFACE
You can also configure a management port to acquire its IP address dynamically from a DHCP server by
using the ip address dhcp command:
Task
Command Syntax
Command Mode
Acquire an IP address from the DHCP
server.
ip address dhcp
INTERFACE
Getting Started | 23
www.dell.com | support.dell.com
Configure a Management Route
Define a path from the system to the network from which you are accessing the system remotely.
Management routes are separate from IP routes and are only used to manage the system through the
management port.
To configure a management route, follow this step:
Step
1
Task
Command Syntax
Command Mode
Configure a management route to
the network from which you are
accessing the system.
management route ip-address/mask gateway
CONFIGURATION
•
•
•
ip-address: the network address in
dotted-decimal format (A.B.C.D).
mask: a subnet mask in /prefix-length format (/
xx).
gateway: the next hop for network traffic
originating from the management port.
Configure a Username and Password
Configure a system username and password to access the system remotely.
To configure a username and password, follow this step:
Step
1
Task
Command Syntax
Command Mode
Configure a username and
password to access the system
remotely.
username username password [encryption-type]
password
encryption-type specifies how you are inputting the
CONFIGURATION
password, is 0 by default, and is not required.
•
•
0 is for inputting the password in clear text.
7 is for inputting a password that is already
encrypted using a Type 7 hash. Obtaining the
encrypted password from the configuration of
another Dell Networking system.
Configure the Enable Password
Access EXEC Privilege mode using the enable command. EXEC Privilege mode is unrestricted by default.
Configure a password as a basic security measure. There are two types of enable passwords:
•
enable password
stores the password in the running/startup configuration using a DES encryption
method.
•
24
|
enable secret is stored in the running/startup configuration in using a stronger, MD5 encryption method.
Getting Started
Dell Networking recommends using the enable secret password.
To configure an enable password:
Task
Command Syntax
Command Mode
Create a password to
access EXEC Privilege
mode.
enable [password | secret] [level level] [encryption-type] password
CONFIGURATION
level is the privilege level, is 15 by default, and is not required.
encryption-type specifies how you are inputting the password, is 0 by
default, and is not required.
•
•
•
0 is for inputting the password in clear text.
7 is for inputting a password that is already encrypted using a
DES hash. Obtain the encrypted password from the configuration
file of another Dell Networking system. Can be used only for
enable password.
5 is for inputting a password that is already encrypted using an
MD5 hash. Obtain the encrypted password from the configuration
file of another Dell Networking system. Can be used only for
enable secret password.
Configuration File Management
You can store on and access files from various storage media. Rename, delete, and copy files on the system
from EXEC Privilege mode.
Note: Using flash memory cards in the system that have not been approved by Dell Networking can
cause unexpected system behavior, including a reboot.
Getting Started | 25
www.dell.com | support.dell.com
Copy Files to and from the System
The command syntax for copying files is similar to UNIX. The copy command uses the format copy
source-file-url destination-file-url.
Note: For a detailed description of the copy command, refer to the FTOS Command Line Reference
Guide.
•
•
To copy a local file to a remote system, combine the file-origin syntax for a local file location with the
file-destination syntax for a remote file location (Table 3-2).
To copy a remote file to a Dell Networking system, combine the file-origin syntax for a remote file
location with the file-destination syntax for a local file location (Table 3-2).
Table 3-2.
Forming a copy Command
source-file-url Syntax
destination-file-url Syntax
copy flash://filename
flash://filename
usbflash://filename
usbflash://filename
FTP server
copy ftp://username:password@{hostip |
hostname}/filepath/filename
ftp://username:password@{hostip | hostname}/
filepath/filename
TFTP server
copy tftp://{hostip | hostname}/filepath/
filename
tftp://{hostip | hostname}/filepath/filename
SCP server
copy scp://username:password@{hostip |
hostname}/filepath/filename
scp://username:password@{hostip | hostname}/
filepath/filename
Local File Location
Internal flash:
flash
USB flash:
usbflash
Remote File Location
Important Points to Remember
•
•
•
You may not copy a file from one remote system to another.
You may not copy a file from one location to the same location.
When copying to a server, you can only use a hostname if you configure a DNS server.
The following example shows using the copy command to save a file to an FTP server.
26
|
Getting Started
Figure 3-9.
Copying a file to a Remote System
Local Location
Remote Location
FTOS#copy flash://FTOS-EF-8.2.1.0.bin ftp://myusername:[email protected]//FTOS/FTOS-EF-8.2.1.0
!!!!!!!!!!!!!!!!!!!!!!!!!!!!!!!!!!!!!!!!!!!!!!!!!!!!!!!!!!!!!!!!!!!!!!!!!!!!!
27952672 bytes successfully copied
Figure 3-10 shows an example of using the copy command to import a file to the Dell Networking system
from an FTP server.
Figure 3-10. Copying a file from a Remote System
Remote Location
Local Location
FTOS#copy ftp://myusername:[email protected]//FTOS/FTOS-EF-8.2.1.0.bin flash://
Destination file name [FTOS-EF-8.2.1.0.bin.bin]:
!!!!!!!!!!!!!!!!!!!!!!!!!!!!!!!!!!!!!!!!!!!!!!!!!!!!!!!!!!!!!!!!
26292881 bytes successfully copied
Save the Running-Configuration
The running-configuration contains the current system configuration. Dell Networking recommends
copying your running-configuration to the startup-configuration. The system uses the startup-configuration
during boot-up to configure the system. The startup-configuration is stored in the internal flash on the IOM
by default, but you can save the startup-configuration to a USB flash device or on a remote server.
To save the running-configuration:
Task
Command Syntax
Command Mode
Save re-configured settings to the
startup configuration.
write memory
CONFIGURATION
Note: The following commands are the same format as those in Copy Files to and from the System on
page 26 but use the filenames startup-config and running-config. These commands assume that current
directory is the internal flash, which is the system default.
Task
Command Syntax
Command Mode
Save the running-configuration to:
the startup-configuration on the
internal flash
copy running-config startup-config
EXEC Privilege
Getting Started | 27
www.dell.com | support.dell.com
Task
Command Syntax
Command Mode
the usb flash on the IOM
copy running-config usbflash://filename
EXEC Privilege
an FTP server
copy running-config ftp://
username:password@{hostip | hostname}/filepath/
filename
EXEC Privilege
a TFTP server
copy running-config tftp://{hostip | hostname}/filepath/
filename
EXEC Privilege
an SCP server
copy running-config scp://
username:password@{hostip | hostname}/filepath/
filename
EXEC Privilege
Note: When copying to a server, you can only use a hostname if a DNS server is configured.
Restoring the Factory Default Settings
Restoring factory defaults deletes the existing NVRAM settings, startup configuration and all configured
settings such as stacking or fanout.
To restore the factory default settings, use the restore factory-defaults stack-unit {0-5 | all} {clear-all | nvram}
command in EXEC Privilege mode.
Caution: There is no undo for this command.
Important Points to Remember
•
•
•
•
When you restore all the units in a stack, all units in the stack are placed into stand-alone mode.
When you restore a single unit in a stack, only that unit is placed in stand-alone mode. No other units
in the stack are affected.
When you restore the units in stand-alone mode, the units remain in stand-alone mode after the
restoration.
After the restore is complete, the units power cycle immediately.
Figure 3-9 shows an example of using the restore factory-defaults command to restore the Factory
Default Settings.
28
|
Getting Started
Figure 3-11.
Restoring the Factory Default Settings
FTOS#restore factory-defaults stack-unit 0 nvram
***********************************************************************
* Warning - Restoring factory defaults will delete the existing
*
* persistent settings (stacking, fanout, etc.)
*
* After restoration the unit(s) will be powercycled immediately.
*
* Proceed with caution !
*
***********************************************************************
Proceed with factory settings? Confirm [yes/no]:yes
-- Restore status -Unit
Nvram
Config
-----------------------0
Success
Power-cycling the unit(s).
....
View Files
You can only view file information and content on local file systems.
To view a list of files on the internal or external Flash, follow this step:
Step
1
Task
Command Syntax
Command Mode
the internal flash
dir flash:
EXEC Privilege
the usbflash
dir usbflash:
EXEC Privilege
View a list of files on:
The output of the command dir also shows the read/write privileges, size (in bytes), and date of
modification for each file (Figure 3-12).
Getting Started | 29
www.dell.com | support.dell.com
Figure 3-12. Viewing a List of Files in the Internal Flash
FTOS#dir
Directory of flash:
1 drwx
2 drwx
3 drwx
4 drwx
5 d--6 -rwx
7 -rwx
8 -rwx
9 -rwx
10 -rwx
11 -rwx
12 -rwx
13 -rwx
14 -rwx
15 -rwx
--More--
4096
2048
4096
4096
4096
506724352
715651180
30670080
76
1
56839
150227
150227
561
149553
Jan
Jul
Apr
Apr
Apr
Apr
Apr
May
May
Jul
May
Jun
Jun
Jun
Jul
01
24
03
03
03
19
17
18
02
06
17
07
07
26
04
1980
2012
2012
2012
2012
2012
2012
2012
2012
2012
2012
2012
2012
2012
2012
00:00:00
09:46:34
20:25:02
20:25:02
20:25:02
23:32:02
23:17:30
04:42:06
05:37:42
07:30:44
01:05:24
16:57:24
17:31:52
06:36:46
04:27:48
+00:00
+00:00
+00:00
+00:00
+00:00
+00:00
+00:00
+00:00
+00:00
+00:00
+00:00
+00:00
+00:00
+00:00
+00:00
.
..
TRACE_LOG_DIR
CORE_DUMP_DIR
ADMIN_DIR
out3
out1
FTOS-nav_ascii.bin
dhcpBindConflict
testhttp
writefru
aaa
bbb
jumpstartcfg
startup-config.bak
To view the contents of a file, follow this step:
Step
1
Task
Command Syntax
Command Mode
contents of a file in the internal flash
show file flash://filename
EXEC Privilege
contents of a file in the usb flash
show file usbflash://filename
EXEC Privilege
running-configuration
show running-config
EXEC Privilege
startup-configuration
show startup-config
EXEC Privilege
View the:
View Configuration Files
Configuration files have three commented lines at the beginning of the file (Figure 3-13), to help you track
the last time any user made a change to the file, which user made the change(s), and when the file was last
saved to the startup-configuration.
In the running-configuration file, if there is a difference between the timestamp on the “Last configuration
change,” and “Startup-config last updated,” you have made changes that have not been saved and will not
be preserved upon a system reboot.
30
|
Getting Started
Figure 3-13. Tracking Changes with Configuration Comments
FTOS#show running-config
Current Configuration ...
! Version E8-3-17-38
! Last configuration change at Tue Jul 24 20:33:08 2012 by default
!
boot system stack-unit 1 primary tftp://10.11.9.21/dv-m1000e-2-b2
boot system stack-unit 1 default system: A:
boot system gateway 10.11.209.62
!
redundancy auto-synchronize full
!
service timestamps log datetime
!
hostname FTOS
!
--More--
File System Management
The Dell Networking system can use the internal Flash, USB Flash, or remote devices to store files. The
system stores files on the internal Flash by default, but you can configure it to store files elsewhere.
To view file system information:
Task
Command Syntax
Command Mode
View information about each file system.
show file-systems
EXEC Privilege
The output of the show file-systems command (Figure 3-14) shows the total capacity, amount of free
memory, file structure, media type, and read/write privileges for each storage device in use.
Figure 3-14. show file-systems Command Example
FTOS#show file-systems
Size(b)
2143281152
FTOS#
Free(b)
836878336
-
Feature
Type
FAT32 USERFLASH
network
network
network
Flags
rw
rw
rw
rw
Prefixes
flash:
ftp:
tftp:
scp:
Getting Started | 31
www.dell.com | support.dell.com
You can change the default file system so that file management commands apply to a particular device or
memory.
To change the default storage location:
Task
Command Syntax
Command Mode
Change the default directory.
cd directory
EXEC Privilege
You can change the default storage location to the USB Flash (Figure 3-15). File management commands
then apply to the USB Flash rather than the internal Flash.
Figure 3-15. Alternative Storage Location
FTOS#cd usbflash:
FTOS#copy running-config test
!
3998 bytes successfully copied
No File System Specified
FTOS#dir
Directory of usbflash:
1 drwx
2 drwx
3 -rwx
4 -rwx
4096
Jan 01 1980 00:00:00 +00:00 .
2048
May 02 2012 07:05:06 +00:00 ..
1272 Apr 29 2011 16:15:14 +00:00 startup-config
3998 May 11 2011 23:36:12 +00:00 test
File Saved to USB Flash
View the Command History
The command-history trace feature captures all commands entered by all users of the system with a time
stamp and writes these messages to a dedicated trace log buffer. The system generates a trace message for
each executed command. No password information is saved to the file.
To view the command-history trace, use the show command-history command (Figure 3-16).
32
|
Getting Started
Figure 3-16.
show command-history Command Example
FTOS# show command-history
[5/18 21:58:32]: CMD-(TEL0):[enable]by admin from vty0 (10.11.68.5)
[5/18 21:58:48]: CMD-(TEL0):[configure]by admin from vty0 (10.11.68.5)
- Repeated 1 time.
[5/18 21:58:57]: CMD-(TEL0):[interface port-channel 1]by admin from vty0 (10.11.68.5)
[5/18 21:59:9]: CMD-(TEL0):[show config]by admin from vty0 (10.11.68.5)
[5/18 22:4:32]: CMD-(TEL0):[exit]by admin from vty0 (10.11.68.5)
[5/18 22:4:41]: CMD-(TEL0):[show interfaces port-channel brief]by admin from vty0
(10.11.68.5)
Upgrading FTOS
Note: To upgrade FTOS, refer to the Release Notes for the FTOS version you want to load on the
Aggregator.
Getting Started | 33
34
|
Getting Started
www.dell.com | support.dell.com
4
Aggregator Management
This chapter explains the different protocols or services used to manage an Aggregator including:
•
•
•
•
•
•
•
•
Logging
Disabling System Logging
File Transfer Services
Terminal Lines
Telnet to Another Network Device
Recovering from a Forgotten Password
Recovering from a Forgotten Enable Password
Recovering from a Failed Start
Logging
FTOS tracks changes in the system using event and error messages. By default, FTOS logs these messages
on:
•
•
•
the internal buffer
console and terminal lines
any configured syslog servers
Log Messages in the Internal Buffer
All error messages, except those beginning with %BOOTUP (Message), are logged in the internal buffer.
Message 1 BootUp Events
%BOOTUP:RPM0:CP %PORTPIPE-INIT-SUCCESS: Portpipe 0 enabled
Aggregator Management | 35
www.dell.com | support.dell.com
Disabling System Logging
By default, logging is enabled and log messages are sent to the logging buffer, all terminal lines, console,
and syslog servers.
To enable and disable system logging:
Task
Command Syntax
Command Mode
Disable all logging except on the console.
no logging on
CONFIGURATION
Disable logging to the logging buffer.
no logging buffer
CONFIGURATION
Disable logging to terminal lines.
no logging monitor
CONFIGURATION
Disable console logging.
no logging console
CONFIGURATION
Send System Messages to a Syslog Server
To send system messages to a syslog server:
Task
Command Syntax
Command Mode
Specify the server to which you want to send system
messages. You can configure up to eight syslog servers.
logging {ip-address | hostname}
CONFIGURATION
Using a Unix System as a Syslog Server
Configure a UNIX system as a syslog server by adding the following lines to /etc/syslog.conf on the Unix
system and assigning write permissions to the file.
•
•
on a 4.1 BSD UNIX system, add the line: local7.debugging /var/log/log7.log
on a 5.7 SunOS UNIX system, add the line: local7.debugging /var/adm/ftos.log
In the lines above, local7 is the logging facility level and debugging is the severity level.
36
|
Aggregator Management
Changing System Logging Settings
You can change the default settings of the system logging by changing the severity level and the storage
location. The default is to log all messages up to debug level, that is, all system messages. By changing the
severity level in the logging commands, you control the number of system messages logged.
To change the severity level of messages logged to a syslog server, use any or all of the following
commands in CONFIGURATION mode:
Task
Command Syntax
Command Mode
Specify the minimum severity level for logging to the
logging buffer.
logging buffered level
CONFIGURATION
Specify the minimum severity level for logging to the
console.
logging console level
CONFIGURATION
Specify the minimum severity level for logging to
terminal lines.
logging monitor level
CONFIGURATION
Specifying the minimum severity level for logging to a
syslog server.
logging trap level
CONFIGURATION
Specify the minimum severity level for logging to the
syslog history table.
logging history level
CONFIGURATION
Task
Command Syntax
Command Mode
Specify the size of the logging buffer.
Note: When you decrease the buffer size, FTOS deletes
all messages stored in the buffer. Increasing the buffer
size does not affect messages in the buffer.
logging buffered size
CONFIGURATION
Specify the number of messages that FTOS saves to its
logging history table.
logging history size size
CONFIGURATION
To view the logging buffer and configuration, enter the show logging command in EXEC privilege mode
(Figure 4-1).
To view the logging configuration, enter the show running-config logging command in EXEC privilege mode
(Figure 4-2).
Aggregator Management | 37
www.dell.com | support.dell.com
Displaying the Logging Buffer and Logging Configuration
To display the current contents of the logging buffer and the logging settings for the system, enter the show
logging command in EXEC privilege mode (Figure 4-1).
Figure 4-1.
show logging Command Example
FTOS#show logging
Syslog logging: enabled
Console logging: level debugging
Monitor logging: level debugging
Buffer logging: level debugging, 58 Messages Logged, Size (40960 bytes)
Trap logging: level informational
Logging to 172.31.1.4
Logging to 172.16.1.162
Logging to 133.33.33.4
Logging to 10.10.10.4
Logging to 10.1.2.4
May 20 20:00:10: %STKUNIT0-M:CP %SYS-5-CONFIG_I: Configured from vty0 ( 10.11.68
.5 )by admin
May 20 19:57:45: %STKUNIT0-M:CP %SEC-3-AUTHENTICATION_ENABLE_SUCCESS: Enable pas
sword authentication success on vty0 ( 10.11.68.5 )
May 20 19:57:40: %STKUNIT0-M:CP %SEC-5-LOGIN_SUCCESS: Login successful for user
admin on vty0 (10.11.68.5)
May 20 19:37:08: %STKUNIT0-M:CP %SEC-5-LOGOUT: Exec session is terminated for us
er admin on line vty0 (10.11.68.5)
May 20 18:59:36: %STKUNIT0-M:CP %SYS-5-CONFIG_I: Configured from vty0 ( 10.11.68
.5 )by admin
May 20 18:45:44: %STKUNIT0-M:CP %SEC-3-AUTHENTICATION_ENABLE_SUCCESS: Enable pas
sword authentication success on vty0 ( 10.11.68.5 )
May 20 18:45:39: %STKUNIT0-M:CP %SEC-5-LOGIN_SUCCESS: Login successful for user
admin on vty0 (10.11.68.5)
May 20 17:18:08: %STKUNIT0-M:CP %SEC-5-LOGOUT: Exec session is terminated for us
er admin on line vty0 (10.11.68.5)
May 20 16:42:40: %STKUNIT0-M:CP %SYS-5-CONFIG_I: Configured from vty0 ( 10.11.68
.5 )by admin
- repeated 2 times
May 20 16:37:41: %STKUNIT0-M:CP %SEC-3-AUTHENTICATION_ENABLE_SUCCESS: Enable pas
sword authentication success on vty0 ( 10.11.68.5 )
May 20 16:37:28: %STKUNIT0-M:CP %SEC-5-LOGIN_SUCCESS: Login successful for user
admin on vty0 (10.11.68.5)
May 20 16:37:17: %STKUNIT0-M:CP %SEC-5-LOGOUT: Exec session is terminated for us
er admin on line vty0 (10.11.68.5)
May 20 16:37:08: %STKUNIT0-M:CP %SEC-3-AUTHENTICATION_ENABLE_SUCCESS: Enable pas
sword authentication success on vty0 ( 10.11.68.5 )
sword authentication success on vty0 ( 10.11.68.5 )
--More--
To view any changes made, use the show running-config logging command (Figure 4-2) in the EXEC
privilege mode.
38
|
Aggregator Management
Configuring a UNIX Logging Facility Level
You can save system log messages with a UNIX system logging facility.
To configure a UNIX logging facility level, use the following command in CONFIGURATION mode:
Command Syntax
Command Mode
Purpose
logging facility [facility-type]
CONFIGURATION
Specify one of the following parameters.
• auth (for authorization messages)
• cron (for system scheduler messages)
• daemon (for system daemons)
• kern (for kernel messages)
• local0 (for local use)
• local1 (for local use)
• local2 (for local use)
• local3 (for local use)
• local4 (for local use)
• local5 (for local use)
• local6 (for local use)
• local7 (for local use). This is the default.
• lpr (for line printer system messages)
• mail (for mail system messages)
• news (for USENET news messages)
• sys9 (system use)
• sys10 (system use)
• sys11 (system use)
• sys12 (system use)
• sys13 (system use)
• sys14 (system use)
• syslog (for syslog messages)
• user (for user programs)
• uucp (UNIX to UNIX copy protocol)
The default is local7.
To view non-default settings, use the show running-config logging command (Figure 4-3) in EXEC mode.
Figure 4-2.
show running-config logging Command Example
FTOS#show running-config logging
!
service timestamps log datetime
!
logging 172.16.1.162
logging 10.10.10.4
logging 10.1.2.4
logging 172.31.1.4
logging 133.33.33.4
FTOS#
Aggregator Management | 39
www.dell.com | support.dell.com
Enabling Time Stamps on Syslog Messages
By default, syslog messages do not include a time/date stamp stating when the error or message was
created.
To have FTOS include a timestamp with the syslog message, use the following command syntax in
CONFIGURATION mode:
Command Syntax
Command Mode
Purpose
service timestamps [log | debug] [datetime
[localtime] [msec] [show-timezone] | uptime]
CONFIGURATION
Add timestamp to syslog messages. Specify
the following optional parameters:
• datetime: You can add the keyword
localtime to include the localtime, msec,
and show-timezone. If you do not add the
keyword localtime, the time is UTC.
• uptime. To view time since last boot.
If neither parameter is specified, FTOS
configures uptime.
To view the configuration, enter the show running-config logging command in EXEC privilege mode.
To disable time stamping on syslog messages, enter the no service timestamps [log | debug] command.
File Transfer Services
With FTOS, you can configure the system to transfer files over the network using file transfer protocol
(FTP). One FTP application copies the system image files over an interface on to the system; however,
FTP is not supported on VLAN interfaces.
For more information about FTP, refer to RFC 959, File Transfer Protocol.
Configuration Task List for File Transfer Services
The following list includes the configuration tasks for file transfer services:
•
•
Enabling the FTP Server (mandatory)
Configuring the FTP Server Parameters (optional)
For a complete listing of FTP related commands, refer to RFC 959, File Transfer Protocol.
40
|
Aggregator Management
Enabling the FTP Server
To enable the system as an FTP server, use the following command in CONFIGURATION mode:
Command Syntax
Command Mode
Purpose
ftp-server enable
CONFIGURATION
Enable FTP on the system.
To view the FTP configuration, enter the show running-config ftp command in EXEC privilege mode
(Figure 4-3).
Figure 4-3.
show running-config ftp Command Example
FTOS#show running-config ftp
!
ftp-server enable
ftp-server username nairobi password 0 zanzibar
FTOS#
Configuring the FTP Server Parameters
After you enable the FTP server on the system, you can configure different parameters.
To configure FTP server parameters, use any or all of the following commands in CONFIGURATION
mode:
Command Syntax
Command Mode
Purpose
ftp-server topdir dir
CONFIGURATION
Specify the directory for users using FTP to reach the
system.
The default is the internal flash directory.
ftp-server username username
password [encryption-type] password
CONFIGURATION
Specify a user name for all FTP users and configure either
a plain text or encrypted password. Configure the
following optional and required parameters:
• username: Enter a text string
• encryption-type: Enter 0 for plain text or 7 for
encrypted text.
• password: Enter a text string.
Note: You cannot use the change directory (cd) command until you configure ftp-server topdir.
To view the FTP configuration, enter the show running-config ftp command in EXEC privilege mode.
Aggregator Management | 41
www.dell.com | support.dell.com
Terminal Lines
You can access the system remotely and restrict access to the system by creating user profiles. The terminal
lines on the system provide different means of accessing the system. The virtual terminal lines (VTY)
connect you through Telnet to the system.
Telnet to Another Network Device
To telnet to another device (Figure 4-4):
Task
Command Syntax
Command Mode
Telnet to the stack-unit.You do not need to configure the management port
on the stack-unit to be able to telnet to it.
telnet-peer-stack-unit
EXEC Privilege
Telnet to a device with an IPv4 address. If you do not enter an IP address,
FTOS enters a Telnet dialog that prompts you for one.
• Enter an IPv4 address in dotted decimal format (A.B.C.D)
telnet [ip-address]
EXEC Privilege
Figure 4-4.
Telnet to Another Network Device
FTOS#telnet 10.11.206.66
Trying 10.11.206.66...
Connected to 10.11.206.66.
Exit character is '^]'.
cmc-9MZ0TS1.localdomain login: root
Password:
Welcome to the CMC firmware version 4.30.X03.201207271729
$
42
|
Aggregator Management
Recovering from a Forgotten Password
If you configure authentication for the console and you exit out of EXEC mode or your console session
times out, you are prompted to re-enter the password.
If you forget your password, follow these steps:
Step
Task
Command Syntax
Command Mode
1
Log onto the system using the console.
2
Power-cycle the Aggregator by using the CMC interface or removing it from the M1000e and re-inserting it in the
chassis.
3
During bootup, press any key during the second countdown to abort the boot process and access the uBoot
command-line interface. You are placed at the Boot User command prompt.
4
Set the system parameters to ignore
the startup configuration when the
system reloads.
ignore startup-config
BOOT USER
5
Reload the system.
reload
BOOT USER
6
Copy startup-config.bak to the
running config.
copy flash://startup-config.bak running-config
EXEC Privilege
7
Remove all authentication
parameters configured for the
console.
no authentication login
no password
LINE
8
Save the running-config to the
startup-config.
copy running-config startup-config
EXEC Privilege
Note: The startup configuration is ignored only the first time the Aggregator reloads. During subsequent
reloads, the startup configuration is loaded and its configured settings are applied.
Recovering from a Forgotten Enable Password
If you forget the enable password, follow these steps:
Step
Task
Command Syntax
Command Mode
1
Log onto the system via console.
2
Power-cycle the Aggregator by using the CMC interface or removing it from the M1000e and re-inserting it in the
chassis.
3
During bootup, press any key during the second countdown to abort the boot process and access the uBoot
command-line interface. You are placed at the Boot User command prompt.
Aggregator Management | 43
www.dell.com | support.dell.com
Step
Task
Command Syntax
Command Mode
4
Set the system parameters to ignore
the enable password when the system
reloads.
ignore enable-password
BOOT USER
5
Reload the system.
reload
BOOT USER
6
Configure a new enable password.
copy flash://startup-config.bak running-config
EXEC Privilege
7
Configure a new enable password.
enable {secret | password)
CONFIGURATION
8
Save the running-config to the
startup-config.
copy running-config startup-config
EXEC Privilege
Note: The enable password is ignored only the first time the Aggregator reloads. If you do not reconfigure
the enable password before the session times out, you will be placed in EXEC mode and prompted to
enter the enable password again.
Recovering from a Failed Start
An Aggregator that does not start correctly might be attempting to boot from a corrupted FTOS image or
from a mis-specified location. In that case, you can restart the system and interrupt the boot process to
point the system to another boot location.
For more information about uBoot commands, refer to the Boot User chapter in the FTOS Command Line
Reference for the M IO Aggregator.
To recover from failed start, follow these steps:
Step
44
|
Task
Command Syntax
Command Mode
1
Log onto the system via console.
2
Power-cycle the Aggregator by using the CMC interface or removing it from the M1000e and re-inserting it in the
chassis.
3
During bootup, press any key during the second countdown to abort the boot process and access the uBoot
command-line interface. You are placed at the Boot User command prompt.
4
Reconfigure the default image paths to
be used to load the primary FTOS
image when the system reloads.
boot change primary
BOOT USER
5
Assign an IP address to the
management Ethernet interface.
interface management ethernet ip address
ip-address/mask
BOOT USER
6
Assign an IP address as the default
gateway for the system.
default-gateway ip-address
BOOT USER
7
Reload the system.
reload
BOOT USER
Aggregator Management
Figure 4-5.
Recovering from a Failed Start: Example
U-Boot 2010.03-rc1(Dell Force10)
Built by build at tools-sjc-01 on Thu May 31 23:53:38 2012
IOM Boot Label 4.0.1.0
DRAM:
2 GB
Initialized CPLD on CS3
Detected [XLP308 (Lite+) Rev A0]
Initializing I2C0: speed = 30 KHz, prescaler = 0x0377 -- done.
Initializing I2C1: speed = 100 KHz, prescaler = 0x0109 -- done.
Initialized eMMC Host Controller
Detected SD Card
Now running in RAM - U-Boot [N64 ABI, Big-Endian] at: ffffffff8c100000
Flash: 256 MB
PCIE (B0:D01:F0) : Link up.
PCIE (B0:D01:F1) : No Link.
In:
serial
Out:
serial
Err:
serial
Net:
nae-0: PHY is Broadcom BCM54616S
IOM MAC Addr: 00:1E:C9:F1:00:99
Hit any key to stop autoboot:
0
***** Welcome to Dell Force10 Boot Interface *****
Use "help" or "?" for more information.
BOOT_USER #
BOOT_USER # boot change primary
'-' = go to previous field;
boot device
file name
Server IP address
'.' = clear non-essential field
: tftp
: IOA
: 10.16.127.34
BOOT_USER #
BOOT_USER # interface management ethernet ip address
10.16.130.149/16
Management ethernet IP address: 10.16.130.149/16
BOOT_USER #
BOOT_USER # default-gateway 10.16.130.254
Gateway IP address 10.16.130.254
BOOT_USER #
BOOT_USER # reload
NetLogic XLP Stage 1 Loader
Built by build at tools-sjc-01 on Thu May 31 23:53:38 2012
IOM Boot Selector Label 4.0.0.0
Aggregator Management | 45
46
|
Aggregator Management
www.dell.com | support.dell.com
5
Data Center Bridging (DCB)
On an I/O Aggregator, data center bridging (DCB) features are auto-configured in standalone mode. You
can display information on DCB operation by using show commands.
Note: DCB features are not supported on an Aggregator in stacking mode.
This chapter describes the following data center bridging topics:
•
•
•
•
•
•
•
•
•
Ethernet Enhancements in Data Center Bridging
Data Center Bridging: Auto-DCB-Enable Mode
dcb enable auto-detect on-next-reload Command Example
How Priority-Based Flow Control is Implemented
How Enhanced Transmission Selection is Implemented
DCB Policies in a Switch Stack
DCBX Operation
Verifying DCB Configuration
Example: PFC and ETS Operation
Ethernet Enhancements in Data Center Bridging
Data center bridging (DCB) refers to a set of IEEE Ethernet enhancements that provide data centers with a
single, robust, converged network to support multiple traffic types, including local area network (LAN),
server, and storage traffic. Through network consolidation, DCB results in reduced operational cost,
simplified management, and easy scalability by avoiding the need to deploy separate application-specific
networks.
For example, instead of deploying an Ethernet network for LAN traffic, additional storage area networks
(SANs) to ensure lossless fibre-channel traffic, and a separate InfiniBand network for high-performance
inter-processor computing within server clusters, only one DCB-enabled network is required in a data
center. The Dell Networking switches that support a unified fabric and consolidate multiple network
infrastructures use a single input/output (I/O) device called a converged network adapter (CNA).
A CNA is a computer input/output device that combines the functionality of a host bus adapter (HBA) with
a network interface controller (NIC). Multiple adapters on different devices for several traffic types are no
longer required.
Data Center Bridging (DCB) | 47
www.dell.com | support.dell.com
Data center bridging satisfies the needs of the following types of data center traffic in a unified fabric:
•
•
•
LAN traffic consists of a large number of flows that are generally insensitive to latency requirements,
while certain applications, such as streaming video, are more sensitive to latency. Ethernet functions as
a best-effort network that may drop packets in case of network congestion. IP networks rely on
transport protocols (for example, TCP) for reliable data transmission with the associated cost of greater
processing overhead and performance impact.
Storage traffic based on Fibre Channel media uses the SCSI protocol for data transfer. This traffic
typically consists of large data packets with a payload of 2K bytes that cannot recover from frame loss.
To successfully transport storage traffic, data center Ethernet must provide no-drop service with
lossless links.
Servers use InterProcess Communication (IPC) traffic within high-performance computing clusters to
share information. Server traffic is extremely sensitive to latency requirements.
To ensure lossless delivery and latency-sensitive scheduling of storage and service traffic and I/O
convergence of LAN, storage, and server traffic over a unified fabric, IEEE data center bridging adds the
following extensions to a classical Ethernet network:
•
•
•
•
802.1Qbb - Priority-based Flow Control (PFC)
802.1Qaz - Enhanced Transmission Selection (ETS)
802.1Qau - Congestion Notification
Data Center Bridging Exchange (DCBx) protocol
Note: In FTOS version 8.3.17.x, only the PFC, ETS, and DCBx features are supported in data center
bridging.
Priority-Based Flow Control
In a data center network, priority-based flow control (PFC) manages large bursts of one traffic type in
multiprotocol links so that it does not affect other traffic types and no frames are lost due to congestion.
When PFC detects congestion on a queue for a specified priority, it sends a pause frame for the 802.1p
priority traffic to the transmitting device. In this way, PFC ensures that large amounts of queued LAN
traffic do not cause storage traffic to be dropped, and that storage traffic does not result in high latency for
high-performance computing (HPC) traffic between servers.
PFC enhances the existing 802.3x pause and 802.1p priority capabilities to enable flow control based on
802.1p priorities (classes of service). Instead of stopping all traffic on a link (as performed by the
traditional Ethernet pause mechanism), PFC pauses traffic on a link according to the 802.1p priority set on
a traffic type. You can create lossless flows for storage and server traffic while allowing for loss in case of
LAN traffic congestion on the same physical interface.
Figure 5-1 shows how PFC handles traffic congestion by pausing the transmission of incoming traffic with
dot1p priority 4.
48
|
Data Center Bridging (DCB)
Figure 5-1.
Priority-Based Flow Control
PFC is implemented as follows in the Dell Networking operating software (FTOS):
•
•
•
•
•
•
•
•
•
PFC supports buffering to receive data that continues to arrive on an interface while the remote system
reacts to the PFC operation.
PFC uses the DCB MIB IEEE802.1azd2.5 and the PFC MIB IEEE802.1bb-d2.2.
PFC is supported on specified 802.1p priority traffic (dot1p 0 to 7) and is configured per interface.
However, only two lossless queues are supported on an interface: one for FCoE converged traffic and
one for iSCSI storage traffic. Configure the same lossless queues on all ports.
A dynamic threshold handles intermittent traffic bursts and varies based on the number of PFC
priorities contending for buffers, while a static threshold places an upper limit on the transmit time of a
queue after receiving a message to pause a specified priority. PFC traffic is paused only after
surpassing both static and dynamic thresholds for the priority specified for the port.
By default, PFC is enabled when you enabled DCB. If you have not loaded FCoE_DCB_Config and
iSCSI_DCB_Config, DCB is disabled. When you enable DCB globally, you cannot simultaneously
enable TX and RX on the interface for flow control and link-level flow control is disabled.
Buffer space is allocated and de-allocated only when you configure a PFC priority on the port.
PFC delay constraints place an upper limit on the transmit time of a queue after receiving a message to
pause a specified priority.
By default, PFC is enabled on an interface with no dot1p priorities configured. You can configure the
PFC priorities if the switch negotiates with a remote peer using DCBx. During DCBx negotiation with
a remote peer:
• DCBx communicates with the remote peer by link layer discovery protocol (LLDP) type, length,
value (TLV) to determine current policies, such as PFC support and enhanced transmission
selection (ETS) BW allocation.
• If the negotiation succeeds and the port is in DCBx Willing mode to receive a peer configuration,
PFC parameters from the peer are used to configured PFC priorities on the port. If you enable the
link-level flow control mechanism on the interface, DCBx negotiation with a peer is not
performed.
• If the negotiation fails and you enable PFC on the port, any user-configured PFC input policies are
applied. If no PFC input policy has been previously applied, the PFC default setting is used (no
priorities configured). If you do not enable PFC on an interface, you can enable the 802.3x
link-level pause function. By default, the link-level flow pause is disabled when you disable DCBx
and PFC. If no PFC input policy has been applied on the interface, the default PFC settings are
used.
PFC supports buffering to receive data that continues to arrive on an interface while the remote system
reacts to the PFC operation.
Data Center Bridging (DCB) | 49
www.dell.com | support.dell.com
•
PFC uses the DCB MIB IEEE802.1azd2.5 and the PFC MIB IEEE802.1bb-d2.2.
If DCBx negotiation is not successful (for example, due to a version or TLV mismatch), DCBx is disabled
and you cannot enable PFC or ETS.
Configuring Priority-Based Flow Control
Priority-based flow control (PFC) provides a flow control mechanism based on the 802.1p priorities in
converged Ethernet traffic received on an interface and is enabled by default when you enable DCB.
As an enhancement to the existing Ethernet pause mechanism, PFC stops traffic transmission for specified
priorities (CoS values) without impacting other priority classes. Different traffic types are assigned to
different priority classes.
When traffic congestion occurs, PFC sends a pause frame to a peer device with the CoS priority values of
the traffic that is to be stopped. DCBx provides the link-level exchange of PFC parameters between peer
devices. PFC allows network administrators to create zero-loss links for SAN traffic that requires no-drop
service, while retaining packet-drop congestion management for LAN traffic.
To ensure complete no-drop service, apply the same DCB input policy with the same pause time and dot1p
priorities on all PFC-enabled peer interfaces.
To configure PFC and apply a PFC input policy to an interface, follow these steps.
Step
50
|
Task
Command
Syntax
Command Mode
1
Create a DCB input policy to apply pause or flow
control for specified priorities using a configured delay
time.
The maximum is 32 alphanumeric characters.
dcb-input
policy-name
CONFIGURATION
2
Configure the link delay used to pause specified priority
traffic.
One quantum is equal to a 512-bit transmission.
The range (in quanta) is from 712 to 65535.
The default is 45556 quantum in link delay.
pfc link-delay
value
DCB INPUT
POLICY
3
Configure the CoS traffic to be stopped for the specified
delay.
Enter the 802.1p values of the frames to be paused.
The range is from 0 to 7.
The default is none.
Maximum number of loss less queues supported on the
switch: 2.
Separate priority values with a comma. Specify a
priority range with a dash, for example: pfc priority
1,3,5-7.
pfc priority
priority-range
DCB INPUT
POLICY
Data Center Bridging (DCB)
Step
Task
Command
Syntax
Command Mode
4
Enable the PFC configuration on the port so that the
priorities are included in DCBx negotiation with peer
PFC devices.
The default is PCFC mode is on.
pfc mode on
DCB INPUT
POLICY
5
(Optional) Enter a text description of the input policy.
The maximum is 32 characters.
description
text
DCB INPUT
POLICY
6
Exit DCB input policy configuration mode.
exit
DCB INPUT
POLICY
7
Enter interface configuration mode.
interface type
slot/port
CONFIGURATION
8
Apply the input policy with the PFC configuration to an
ingress interface.
dcb-policy
input
policy-name
INTERFACE
9
Repeat Steps 1 to 8 on all PFC-enabled peer interfaces to ensure loss less traffic service.
FTOS Behavior: As soon as you apply a DCB policy with PFC enabled on an interface, DCBx starts
exchanging information with PFC-enabled peers. The IEEE802.1Qbb, Converged enhanced ethernet
(CEE) and CIN versions of PFC TLV are supported. DCBx also validates PFC configurations that are
received in TLVs from peer devices.
By applying a DCB input policy with PFC enabled, you enable PFC operation on ingress port traffic. To
achieve complete lossless handling of traffic, also enable PFC on all DCB egress ports or configure the
dot1p priority-queue assignment of PFC priorities to lossless queues (refer to Configuring Lossless
Queues).
To remove a DCB input policy, including the PFC configuration it contains, use the no dcb-input
policy-name command in INTERFACE Configuration mode. To disable PFC operation on an interface,
use the no pfc mode on command in DCB Input Policy Configuration mode. PFC is enabled (dcb
enable) and disabled (no dcb enable) as the global DCB operation.
You can enable any number of 802.1p priorities for PFC. Queues to which PFC priority traffic is mapped
are lossless by default. Traffic may be interrupted due to an interface flap (going down and coming up)
when you reconfigure the lossless queues for no-drop priorities in a PFC input policy and reapply the
policy to an interface.
To apply PFC, a PFC peer must support the configured priority traffic (as detected by DCBx).
To honor a PFC pause frame multiplied by the number of PFC-enabled ingress ports, the minimum link
delay must be greater than the round-trip transmission time the peer requires.
If you apply an input policy with PFC disabled (no pfc mode on):
Data Center Bridging (DCB) | 51
www.dell.com | support.dell.com
•
•
You can enable link-level flow control on the interface (refer to Ethernet Pause Frames). To delete the
input policy, first disable link-level flow control. PFC is then automatically enabled on the interface
because an interface is by default PFC-enabled.
PFC still allows you to configure lossless queues on a port to ensure no-drop handling of lossless
traffic (refer to Configuring Lossless Queues).
You cannot enable PFC and link-level flow control at the same time on an interface.
When you apply an input policy to an interface, an error message displays if:
•
•
•
The PFC dot1p priorities result in more than two lossless port queues globally on the switch.•
You already enabled link-level flow control. You cannot enable PFC and link-level flow control at the
same time on an interface.•
In a switch stack, configure all stacked ports with the same PFC configuration.
A DCB input policy for PFC applied to an interface may become invalid if you reconfigure dot1p-queue
mapping (refer to the Create Input Policy Maps section in the Quality of Service (QoS) chapter). This
situation occurs when the new dot1p-queue assignment exceeds the maximum number (2) of lossless
queues supported globally on the switch. In this case, all PFC configurations received from PFC-enabled
peers are removed and resynchronized with the peer devices.
Traffic may be interrupted when you reconfigure PFC no-drop priorities in an input policy or reapply the
policy to an interface.
Enhanced Transmission Selection
Enhanced transmission selection (ETS) supports optimized bandwidth allocation between traffic types in
multiprotocol (Ethernet, FCoE, SCSI) links.
ETS allows you to divide traffic according to its 802.1p priority into different priority groups (traffic
classes) and configure bandwidth allocation and queue scheduling for each group to ensure that each traffic
type is correctly prioritized and receives its required bandwidth. For example, you can prioritize
low-latency storage or server cluster traffic in a traffic class to receive more bandwidth and restrict
best-effort LAN traffic assigned to a different traffic class.
Although you can configure strict-priority queue scheduling for a priority group, ETS introduces flexibility
that allows the bandwidth allocated to each priority group to be dynamically managed according to the
amount of LAN, storage, and server traffic in a flow. Unused bandwidth is dynamically allocated to
prioritized priority groups. Traffic is queued according to its 802.1p priority assignment, while flexible
bandwidth allocation and the configured queue-scheduling for a priority group is supported.
Figure 5-2 shows how ETS allows you to allocate bandwidth when different traffic types are classed
according to 802.1p priority and mapped to priority groups.
52
|
Data Center Bridging (DCB)
Figure 5-2.
Enhanced Transmission Selection
ETS uses the following traffic groupings to select multiprotocol traffic for transmission:
•
•
•
•
Priority group: A group of 802.1p priorities used for bandwidth allocation and queue scheduling. All
802.1p priority traffic in a group must have the same traffic handling requirements for latency and
frame loss.
Group ID: A 4-bit identifier assigned to each priority group. The range is from 0 to 7.
Group bandwidth: Percentage of available bandwidth allocated to a priority group.
Group transmission selection algorithm (TSA): Type of queue scheduling a priority group uses.
In FTOS, ETS is implemented as follows:
•
•
•
•
ETS supports groups of 802.1p priorities that have:
• PFC enabled or disabled
• No bandwidth limit or no ETS processing
Bandwidth allocated by the ETS algorithm is made available after strict-priority groups are serviced. If
a priority group does not use its allocated bandwidth, the unused bandwidth is made available to other
priority groups so that the sum of the bandwidth use is 100%.If priority group bandwidth use exceeds
100%, all configured priority group bandwidth is decremented based on the configured percentage
ratio until all priority group bandwidth use is 100%. If priority group bandwidth usage is less than or
equal to 100% and any default priority groups exist, a minimum of 1% bandwidth use is assigned by
decreasing 1% of bandwidth from the other priority groups until priority group bandwidth use is 100%.
For ETS traffic selection, an algorithm is applied to priority groups using:
• Strict-priority shaping
• ETS shaping
• (Credit-based shaping is not supported.)
ETS uses the DCB MIB IEEE802.1azd2.5.
Configuring Enhanced Transmission Selection
Enhanced transmission selection (ETS) provides a way to optimize bandwidth allocation to outbound
802.1p classes of converged Ethernet traffic.
Data Center Bridging (DCB) | 53
www.dell.com | support.dell.com
Different traffic types have different service needs. Using ETS, you can create groups within an 802.1p
priority class to configure different treatment for traffic with different bandwidth, latency, and best-effort
needs.
For example, storage traffic is sensitive to frame loss; interprocess communication (IPC) traffic is
latency-sensitive. ETS allows different traffic types to coexist without interruption in the same converged
link by:•
•
•
Allocating a guaranteed share of bandwidth to each priority group.
Allowing each group to exceed its minimum guaranteed bandwidth if another group is not fully
using its allotted bandwidth.
To configure ETS and apply an ETS output policy to an interface, you must:
1.
Create a QoS output policy with ETS scheduling and bandwidth allocation settings.
2.
Create a priority group of 802.1p traffic classes.
3.
Configure a DCB output policy in which you associate a priority group with a QoS ETS output policy.
Apply the DCB output policy to an interface.
Data Center Bridging Exchange Protocol (DCBx)
The data center bridging exchange (DCBx) protocol is enabled by default on any switch on which PFC or
ETS are enabled. DCBx allows a switch to automatically discover DCB-enabled peers and exchange
configuration information. PFC and ETS use DCBx to exchange and negotiate parameters with peer
devices. DCBx capabilities include:
•
•
•
Discovery of DCB capabilities on peer-device connections
Determination of possible mismatch in DCB configuration on a peer link
Configuration of a peer device over a DCB link
DCBx requires the link layer discovery protocol (LLDP) to provide the path to exchange DCB parameters
with peer devices. Exchanged parameters are sent in organizationally specific type, length, values (TLVs)
in LLDP data units. For more information, refer to the Link Layer Discovery Protocol (LLDP) chapter.
The following LLDP TLVs are supported for DCB parameter exchange:
•
•
PFC parameters: PFC Configuration TLV and Application Priority Configuration TLV.
ETS parameters: ETS Configuration TLV and ETS Recommendation TLV.
Data Center Bridging in a Traffic Flow
Figure 5-3 shows how DCB handles a traffic flow on an interface.
54
|
Data Center Bridging (DCB)
Figure 5-3.
DCB PFC and ETS Traffic Handling
Ingress Traffic
Apply QoS traffic
classification using
dot1p priority and
map to queue
Apply PFC no-drop handling
for lossless queues of
ingress priority traffic
Switching
Egress Traffic
Map priority traffic
to ETS priority
groups
Apply ETS bandwidth
allocation and
scheduling to
priority-group traffic
Transmit ETS-handled
priority traffic
on egress queue
Data Center Bridging: Auto-DCB-Enable Mode
On an Aggregator in standalone, stacking, or VLT mode, the default mode of operation for data center
bridging on Ethernet ports is auto-DCB-enable mode. In this mode, Aggregator ports detect whether peer
devices support CEE or not, and enable DCBx and PFC or link-level flow control accordingly:
•
•
Interfaces come up with DCB disabled and link-level flow control enabled to control data transmission
between the Aggregator and other network devices (see Flow Control Using Ethernet Pause Frames).
When DCB is disabled on an interface, PFC, ETS, and DCBx are also disabled.
When DCBx protocol packets are received, interfaces automatically enable DCB and disable link-level
flow control.
DCB is required for PFC, ETS, DCBx, and FCoE initialization protocol (FIP) snooping to operate.
Note: Normally, interfaces do not flap when DCB is automatically enabled.
DCB processes VLAN-tagged packets and dot1p priority values. Untagged packets are treated with a
dot1p priority of 0.
For DCB to operate effectively, ingress traffic is classified according to its dot1p priority so that it maps to
different data queues. The dot1p-queue assignments used on an Aggregator are shown in Table 5-1 in dcb
enable auto-detect on-next-reload Command Example.
When DCB is Disabled (Default)
By default, Aggregator interfaces operate with DCB disabled and link-level flow control enabled. When an
interface comes up, it is automatically configured with:
•
Flow control enabled on input interfaces
Data Center Bridging (DCB) | 55
www.dell.com | support.dell.com
•
•
A DCB input policy with PFC disabled
A DCB output policy with ETS disabled
Figure 5-4 shows a default interface configuration with DCB enabled and link-level flow control enabled.
When the first Aggregator interface with DCB disabled receives an LLDP packet with a DCBx TLV
advertisement, DCB is enabled on the interface and on all uplink interfaces.
Figure 5-4.
show interfaces Command Example: DCB disabled and Flow Control enabled
FTOS#show interfaces tengigabitethernet 0/2
interface TenGigabitEthernet 0/2
mtu 12000
portmode hybrid
switchport
auto vlan
flowcontrol rx on tx off
dcb-policy input smux-dcb-in
dcb-policy output smux-dcb-out
!
protocol lldp
advertise management-tlv system-name
dcbx port-role auto-downstream
no shutdown
When DCB is Enabled
When a server-facing interface receives DCBx protocol packets, it automatically enables DCB and
disables link-level flow control. The DCB input and output policies and the flow control configuration are
removed as shown in Figure 5-5.
When no DCBx TLVs are received on a DCB-enabled interface for 180 seconds, DCB is automatically
disabled and flow control is re-enabled. When all 10GbE server-facing interfaces have DCB disabled,
DCB is also disabled on all 40GbE uplink interfaces.
Figure 5-5.
show interfaces Command Example: DCB enabled and Flow Control disabled
FTOS#show interfaces tengigabitethernet 0/2
interface TenGigabitEthernet 0/2
mtu 12000
auto vlan
!
port-channel-protocol LACP
port-channel 1 mode active
!
protocol lldp
advertise management-tlv system-name
dcbx port-role auto-downstream
no shutdown
56
|
Data Center Bridging (DCB)
Lossless Traffic Handling
In auto-DCB-enable mode, Aggregator ports operate with the auto-detection of DCBx traffic. At any
moment, some ports may operate with link-level flow control while others operate with DCB-based PFC
enabled.
As a result, lossless traffic is ensured only if traffic ingresses on a PFC-enabled port and egresses on
another PFC-enabled port.
Lossless traffic is not guaranteed when it is transmitted on a PFC-enabled port and received on a link-level
flow control-enabled port, or transmitted on a link-level flow control-enabled port and received on a
PFC-enabled port.
Enabling DCB on Next Reload
To configure the Aggregator so that all interfaces come up with DCB enabled and flow control disabled,
use the dcb enable on-next-reload command. You must save the configuration change and reload the switch
for DCB to be enabled on all interfaces. Internal PFC buffers are automatically configured.
Task
Command
Command Mode
Globally enable DCB on all interfaces
after next switch reload.
dcb enable
on-next-reload
CONFIGURATION
To reconfigure the Aggregator so that all interfaces come up with DCB disabled and link-level flow control
enabled, use the no dcb enable on-next-reload command. You must save the configuration change and
reload the switch for DCB to be disabled on all interfaces. PFC buffer memory is automatically freed.
Enabling Auto-DCB-Enable Mode on Next Reload
To configure the Aggregator so that all interfaces come up in auto-DCB-enable mode with DCB disabled
and flow control enabled, use the dcb enable aut-detect on-next-reload command. You must save the
configuration change and reload the switch for auto-DCB-enable mode to be enabled on all interfaces.
Task
Command
Command Mode
Globally enable auto-detection of DCBx
and auto-enabling of DCB on all
interfaces after switch reload.
dcb enable
auto-detect
on-next-reload
CONFIGURATION
Figure 5-6.
dcb enable auto-detect on-next-reload Command Example
FTOS#dcb enable auto-detect on-next-reload
Aug 25 18:47:50: %STKUNIT0-M:CP %DIFFSERV-6-DCB_ENABLE_CFG_ON_RELOAD: Global DCB will be
enabled on subsequent reload, PFC buffers will be reserved for all pfc ports and max loss
less queues supported for each stack unit. For the pfc-buffering change to take effect,
please save the config and reload the system.
Data Center Bridging (DCB) | 57
www.dell.com | support.dell.com
QoS dot1p Traffic Classification and Queue Assignment
DCB supports PFC, ETS, and DCBx to handle converged Ethernet traffic that is assigned to an egress
queue according to the following quality of service (QoS) methods:
•
•
Important: of two
Honor dot1p: dot1p priorities in ingress traffic are used at the port or global switch level.
Layer 2 class maps: dot1p priorities are used to classify traffic in a class map and apply a service
policy to an ingress port to map traffic to egress queues.
Note: Dell Networking does not recommend mapping all ingress traffic to a single queue when using PFC
and ETS. Ingress traffic classification using the service-class dynamic dot1p command (honor dot1p) is
recommended on all DCB-enabled interfaces. If you use L2 class maps to map dot1p priority traffic to
egress queues, take into account the default dot1p-queue assignments in Table 5-1 and the maximum
number of two lossless queues supported on a port.
Although FTOS allows you to change the default dot1p priority-queue assignments, DCB policies applied
to an interface may become invalid if dot1p-queue mapping is reconfigured. If the configured DCB policy
remains valid, the change in the dot1p-queue assignment is allowed. For DCB ETS enabled interfaces,
traffic destined to queue that is not mapped to any dot1p priority will be dropped.
Table 5-1.
dot1p Priority-Queue Assignment
dot1p Value in Incoming Frame
58
|
Egress Queue Assignment
0
0
1
0
2
0
3
1
4
2
5
3
6
3
7
3
Data Center Bridging (DCB)
How Priority-Based Flow Control is Implemented
Priority-based flow control provides a flow control mechanism based on the 802.1p priorities in converged
Ethernet traffic received on an interface and is enabled by default. As an enhancement to the existing
Ethernet pause mechanism, PFC stops traffic transmission for specified priorities (CoS values) without
impacting other priority classes. Different traffic types are assigned to different priority classes.
When traffic congestion occurs, PFC sends a pause frame to a peer device with the CoS priority values of
the traffic that needs to be stopped. DCBx provides the link-level exchange of PFC parameters between
peer devices. PFC creates zero-loss links for SAN traffic that requires no-drop service, while at the same
time retaining packet-drop congestion management for LAN traffic.
PFC is implemented on an Aggregator as follows:
•
•
•
•
•
•
If DCB is enabled, as soon as a DCB policy with PFC is applied on an interface, DCBx starts
exchanging information with PFC-enabled peers. The IEEE802.1Qbb, CEE and CIN versions of PFC
TLV are supported. DCBx also validates PFC configurations received in TLVs from peer devices.
To achieve complete lossless handling of traffic, enable PFC operation on ingress port traffic and on all
DCB egress port traffic.
All 802.1p priorities are enabled for PFC. Queues to which PFC priority traffic is mapped are lossless
by default. Traffic may be interrupted due to an interface flap (going down and coming up).
For PFC to be applied on an Aggregator port, the auto-configured priority traffic must be supported by
a PFC peer (as detected by DCBx).
A DCB input policy for PFC applied to an interface may become invalid if dot1p-queue mapping is
reconfigured (refer to Create Input Policy Maps). This situation occurs when the new dot1p-queue
assignment exceeds the maximum number (2) of lossless queues supported globally on the switch. In
this case, all PFC configurations received from PFC-enabled peers are removed and re-synchronized
with the peer devices.
FTOS does not support MACsec Bypass Capability (MBC).
How Enhanced Transmission Selection is Implemented
Enhanced transmission selection (ETS) provides a way to optimize bandwidth allocation to outbound
802.1p classes of converged Ethernet traffic. Different traffic types have different service needs. Using
ETS, groups within an 802.1p priority class are auto-configured to provide different treatment for traffic
with different bandwidth, latency, and best-effort needs.
For example, storage traffic is sensitive to frame loss; interprocess communication (IPC) traffic is
latency-sensitive. ETS allows different traffic types to coexist without interruption in the same converged
link.
Note: The IEEE 802.1Qaz, CEE, and CIN versions of ETS are supported.
ETS is implemented on an Aggregator as follows:
Data Center Bridging (DCB) | 59
www.dell.com | support.dell.com
•
•
•
•
•
•
•
•
Traffic in priority groups is assigned to strict-queue or WERR scheduling in an ETS output policy and
is managed using the ETS bandwidth-assignment algorithm. FTOS de-qeues all frames of
strict-priority traffic before servicing any other queues. A queue with strict-priority traffic can starve
other queues in the same port.
ETS-assigned bandwidth allocation and scheduling apply only to data queues, not to control queues.
FTOS supports hierarchical scheduling on an interface. FTOS control traffic is redirected to control
queues as higher priority traffic with strict priority scheduling. After control queues drain out, the
remaining data traffic is scheduled to queues according to the bandwidth and scheduler configuration
in the ETS output policy. The available bandwidth calculated by the ETS algorithm is equal to the link
bandwidth after scheduling non-ETS higher-priority traffic.
By default, equal bandwidth is assigned to each port queue and each dot1p priority in a priority group.
By default, equal bandwidth is assigned to each priority group in the ETS output policy applied to an
egress port. The sum of auto-configured bandwidth allocation to dot1p priority traffic in all ETS
priority groups is 100%.
dot1p priority traffic on the switch is scheduled according to the default dot1p-queue mapping. dot1p
priorities within the same queue should have the same traffic properties and scheduling method.
A priority group consists of 802.1p priority values that are grouped together for similar bandwidth
allocation and scheduling, and that share the same latency and loss requirements. All 802.1p priorities
mapped to the same queue should be in the same priority group.
• By default:
— All 802.1p priorities are grouped in priority group 0.
— 100% of the port bandwidth is assigned to priority group 0. The complete bandwidth is
equally assigned to each priority class so that each class has 12 to 13%.
• The maximum number of priority groups supported in ETS output policies on an interface is equal
to the number of data queues (4) on the port. The 802.1p priorities in a priority group can map to
multiple queues.
A DCB output policy is created to associate a priority group with an ETS output policy with
scheduling and bandwidth configuration, and applied on egress ports.
• The ETS configuration associated with 802.1p priority traffic in a DCB output policy is used in
DCBx negotiation with ETS peers.
• When an ETS output policy is applied to an interface, ETS-configured scheduling and bandwidth
allocation take precedence over any auto-configured settings in the QoS output policies.
• ETS is enabled by default with the default ETS configuration applied (all dot1p priorities in the
same group with equal bandwidth allocation).
ETS Operation with DCBx
In DCBx negotiation with peer ETS devices, ETS configuration is handled as follows:
•
•
•
•
60
|
ETS TLVs are supported in DCBx versions CIN, CEE, and IEEE2.5.
ETS operational parameters are determined by the DCBX port-role configurations.
ETS configurations received from TLVs from a peer are validated.
In case of a hardware limitation or TLV error:
• DCBx operation on an ETS port goes down.
Data Center Bridging (DCB)
•
•
New ETS configurations are ignored and existing ETS configurations are reset to the previously
configured ETS output policy on the port or to the default ETS settings if no ETS output policy
was previously applied.
ETS operates with legacy DCBx versions as follows:
• In the CEE version, the priority group/traffic class group (TCG) ID 15 represents a non-ETS
priority group. Any priority group configured with a scheduler type is treated as a strict-priority
group and is given the priority-group (TCG) ID 15.
• The CIN version supports two types of strict-priority scheduling:
— Group strict priority: Allows a single priority flow in a priority group to increase its
bandwidth usage to the bandwidth total of the priority group. A single flow in a group can
use all the bandwidth allocated to the group.
— Link strict priority: Allows a flow in any priority group to increase to the maximum link
bandwidth.
CIN supports only the default dot1p priority-queue assignment in a priority group.
Bandwidth Allocation for DCBx CIN
After an ETS output policy is applied to an interface, if the DCBX version used in your data center
network is CIN, a QoS output policy is automatically configured to overwrite the default CIN bandwidth
allocation. This default setting divides the bandwidth allocated to each port queue equally between the
dot1p priority traffic assigned to the queue.
DCB Policies in a Switch Stack
A DCB input policy with PFC and ETS configuration is applied to all stacked ports in a switch stack or on
a stacked switch.
DCBX Operation
The data center bridging exchange protocol (DCBx) is used by DCB devices to exchange configuration
information with directly connected peers using the link layer discovery protocol (LLDP) protocol. DCBx
can detect the misconfiguration of a peer DCB device, and optionally, configure peer DCB devices with
DCB feature settings to ensure consistent operation in a data center network.
DCBx is a prerequisite for using DCB features, such as priority-based flow control (PFC) and enhanced
traffic selection (ETS), to exchange link-level configurations in a converged Ethernet environment. DCBx
is also deployed in topologies that support lossless operation for FCoE or iSCSI traffic. In these scenarios,
all network devices are DCBX-enabled (DCBX is enabled end-to-end).
The following versions of DCBx are supported on an Aggregator: CIN, CEE, and IEEE2.5.
DCBx requires the LLDP to be enabled on all DCB devices.
Data Center Bridging (DCB) | 61
www.dell.com | support.dell.com
DCBx Operation
DCBx performs the following operations:
•
•
•
•
Discovers DCB configuration (such as PFC and ETS) in a peer device.
Detects DCB misconfiguration in a peer device; that is, when DCB features are not compatibly
configured on a peer device and the local switch. Misconfiguration detection is feature-specific
because some DCB features support asymmetric configuration.
Reconfigures a peer device with the DCB configuration from its configuration source if the peer
device is willing to accept configuration.
Accepts the DCB configuration from a peer if a DCBx port is in “willing” mode to accept a peer’s
DCB settings and then internally propagates the received DCB configuration to its peer ports.
DCBx Port Roles
The following DCBx port roles are auto-configured on an Aggregator to propagate DCB configurations
learned from peer DCBx devices internally to other switch ports:
•
•
62
|
Auto-upstream: The port advertises its own configuration to DCBx peers and receives its configuration
from DCBx peers (ToR or FCF device). The port also propagates its configuration to other ports on the
switch.
The first auto-upstream that is capable of receiving a peer configuration is elected as the configuration
source. The elected configuration source then internally propagates the configuration to auto-downstream ports. A port that receives an internally propagated configuration overwrites its local configuration with the new parameter values.
When an auto-upstream port (besides the configuration source) receives and overwrites its configuration with internally propagated information, one of the following actions is taken:
• If the peer configuration received is compatible with the internally propagated port configuration,
the link with the DCBx peer is enabled.
• If the received peer configuration is not compatible with the currently configured port
configuration, the link with the DCBx peer port is disabled and a syslog message for an
incompatible configuration is generated. The network administrator must then reconfigure the peer
device so that it advertises a compatible DCB configuration.
The configuration received from a DCBx peer or from an internally propagated configuration is not
stored in the switch’s running configuration.
On a DCBx port in an auto-upstream role, the PFC and application priority TLVs are enabled. ETS recommend TLVs are disabled and ETS configuration TLVs are enabled.
Auto-downstream - The port advertises its own configuration to DCBx peers but is not willing to
receive remote peer configuration. The port always accepts internally propagated configurations from
a configuration source. An auto-downstream port that receives an internally propagated configuration
overwrites its local configuration with the new parameter values.
When an auto-downstream port receives and overwrites its configuration with internally propagated
information, one of the following actions is taken:
• If the peer configuration received is compatible with the internally propagated port configuration,
the link with the DCBx peer is enabled.
Data Center Bridging (DCB)
•
If the received peer configuration is not compatible with the currently configured port
configuration, the link with the DCBx peer port is disabled and a syslog message for an
incompatible configuration is generated. The network administrator must then reconfigure the peer
device so that it advertises a compatible DCB configuration.
The internally propagated configuration is not stored in the switch's running configuration.
On a DCBx port in an auto-downstream role, all PFC, application priority, ETS recommend, and ETS
configuration TLVs are enabled.
Default DCBx port role: Uplink ports are auto-configured in an auto-upstream role. Server-facing ports
are auto-configured in an auto-downstream role.
Note: On a DCBx port, application priority TLV advertisements are handled as follows:
- The application priority TLV is transmitted only if the priorities in the advertisement match the configured
PFC priorities on the port.
- On auto-upstream and auto-downstream ports:
- If a configuration source is elected, the ports send an application priority TLV based on the application
priority TLV received on the configuration-source port. When an application priority TLV is received on the
configuration-source port, the auto-upstream and auto-downstream ports use the internally propagated
PFC priorities to match against the received application priority. Otherwise, these ports use their locally
configured PFC priorities in application priority TLVs.
- If no configuration source is configured, auto-upstream and auto-downstream ports check to see that
the locally configured PFC priorities match the priorities in a received application priority TLV.
DCB Configuration Exchange
On an Aggregator, the DCBx protocol supports the exchange and propagation of configuration information
for the following DCB features.
•
•
Enhanced transmission selection (ETS)
Priority-based flow control (PFC)
DCBX uses the following methods to exchange DCB configuration parameters:
•
•
Asymmetric: DCB parameters are exchanged between a DCBx-enabled port and a peer port without
requiring that a peer port and the local port use the same configured values for the configurations to be
compatible. For example, ETS uses an asymmetric exchange of parameters between DCBx peers.
Symmetric: DCB parameters are exchanged between a DCBx-enabled port and a peer port with the
requirement that each configured parameter value is the same for the configurations to be compatible.
For example, PFC uses an symmetric exchange of parameters between DCBx peers.
Data Center Bridging (DCB) | 63
www.dell.com | support.dell.com
Configuration Source Election
When an auto-upstream or auto-downstream port receives a DCB configuration from a peer, the port first
checks to see if there is an active configuration source on the switch.
•
•
If a configuration source already exists, the received peer configuration is checked against the local
port configuration. If the received configuration is compatible, the DCBx marks the port as
DCBx-enabled. If the configuration received from the peer is not compatible, a warning message is
logged and the DCBX frame error counter is incremented. Although DCBx is operationally disabled,
the port keeps the peer link up and continues to exchange DCBx packets. If a compatible peer
configuration is later received, DCBx is enabled on the port.
If there is no configuration source, a port may elect itself as the configuration source. A port may
become the configuration source if the following conditions exist:
• No other port is the configuration source.
• The port role is auto-upstream.
• The port is enabled with link up and DCBx enabled.
• The port has performed a DCBx exchange with a DCBx peer.
• The switch is capable of supporting the received DCB configuration values through either a
symmetric or asymmetric parameter exchange.
A newly elected configuration source propagates configuration changes received from a peer to the other
auto-configuration ports. Ports receiving auto-configuration information from the configuration source
ignore their current settings and use the configuration source information.
Propagation of DCB Information
When an auto-upstream or auto-downstream port receives a DCB configuration from a peer, the port acts
as a DCBx client and checks if a DCBx configuration source exists on the switch.
•
•
If a configuration source is found, the received configuration is checked against the currently
configured values that are internally propagated by the configuration source. If the local configuration
is compatible with the received configuration, the port is enabled for DCBx operation and
synchronization.
If the configuration received from the peer is not compatible with the internally propagated
configuration used by the configuration source, the port is disabled as a client for DCBx operation and
synchronization and a syslog error message is generated. The port keeps the peer link up and continues
to exchange DCBx packets. If a compatible configuration is later received from the peer, the port is
enabled for DCBx operation.
Note: When a configuration source is elected, all auto-upstream ports other than the configuration source
are marked as willing disabled. The internally propagated DCB configuration is refreshed on all
auto-configuration ports and each port may begin configuration negotiation with a DCBx peer again.
64
|
Data Center Bridging (DCB)
Auto-Detection of the DCBX Version
The Aggregator operates in auto-detection mode so that a DCBx port automatically detects the DCBx
version on a peer port. Legacy CIN and CEE versions are supported in addition to the standard IEEE
version 2.5 DCBX.
A DCBx port detects a peer version after receiving a valid frame for that version. The local DCBx port
reconfigures to operate with the peer version and maintains the peer version on the link until one of the
following conditions occurs:
•
•
•
•
The switch reboots.
The link is reset (goes down and up).
The peer times out.
Multiple peers are detected on the link.
DCBx operations on a port are performed according to the auto-configured DCBx version, including fast
and slow transmit timers and message formats. If a DCBx frame with a different version is received, a
syslog message is generated and the peer version is recorded in the peer status table. If the frame cannot be
processed, it is discarded and the discard counter is incremented.
DCBx Example
Figure 5-7 shows how DCBx is used on an Aggregator installed in a PowerEdge M1000e chassis in which
servers are also installed.
•
•
•
The external 40GbE ports on the base module (ports 33 and 37) of two switches are used for uplinks
configured as DCBx auto-upstream ports. The Aggregator is connected to third-party, top-of-rack
(ToR) switches through 40GbE uplinks. The ToR switches are part of a Fibre Channel storage network.
The internal ports (ports 1-32) connected to the 10GbE backplane are configured as auto-downstream
ports.
On the Aggregator, PFC and ETS use DCBx to exchange link-level configuration with DCBx peer
devices.
Data Center Bridging (DCB) | 65
www.dell.com | support.dell.com
Figure 5-7.
DCBX Sample Topology
DCBx Prerequisites and Restrictions
•
•
66
|
DCBx requires LLDP in both send (TX) and receive (RX) mode to be enabled on a port interface. If
multiple DCBx peer ports are detected on a local DCBx interface, LLDP is shut down.
The CIN version of DCBx supports only PFC, ETS, and FCOE; it does not support iSCSI, backward
congestion management (BCN), logical link down (LLD), and network interface virtualization (NIV).
Data Center Bridging (DCB)
DCBX Error Messages
An error in DCBx operation is displayed using the following syslog messages:
LLDP_MULTIPLE_PEER_DETECTED: DCBX is operationally disabled after detecting more than one DCBX
peer on the port interface.
LLDP_PEER_AGE_OUT: DCBX is disabled as a result of LLDP timing out on a DCBX peer interface.
DSM_DCBX_PEER_VERSION_CONFLICT: A local port expected to receive the IEEE, CIN, or CEE version
in a DCBX TLV from a remote peer but received a different, conflicting DCBX version.
DSM_DCBX_PFC_PARAMETERS_MATCH and DSM_DCBX_PFC_PARAMETERS_MISMATCH: A local DCBX port received
a compatible (match) or incompatible (mismatch) PFC configuration from a peer.
DSM_DCBX_ETS_PARAMETERS_MATCH and DSM_DCBX_ETS_PARAMETERS_MISMATCH: A local DCBX port received
a compatible (match) or incompatible (mismatch) ETS configuration from a peer.
LLDP_UNRECOGNISED_DCBX_TLV_RECEIVED: A local DCBX port received an unrecognized DCBX TLV from
a peer.
Debugging DCBx on an Interface
To enabled DCBX debug traces for all or a specific control path, use the following command:
Task
Command
Command Mode
Enable DCBx debugging, where:
• all: Enables all DCBx debugging operations.
• auto-detect-timer: Enables traces for DCBx
auto-detect timers.
• config-exchng: Enables traces for DCBx
configuration exchanges.
• fail: Enables traces for DCBx failures.
• mgmt: Enables traces for DCBx management
frames.
• resource: Enables traces for DCBx system
resource frames.
• sem: Enables traces for the DCBx state machine.
• tlv: Enables traces for DCBx TLVs.
debug dcbx {all | auto-detect-timer |
config-exchng | fail | mgmt |
resource | sem | tlv}
EXEC PRIVILEGE
Data Center Bridging (DCB) | 67
www.dell.com | support.dell.com
Verifying DCB Configuration
Use the show commands in Table 5-2 to display DCB configurations and statistics.
Table 5-2.
Displaying DCB Configurations
Command
Output
show dcb [stack-unit unit-number] (Figure 5-8) Displays data center bridging status, number of PFC-enabled ports, and
number of PFC-enabled queues. On the master switch in a stack, you can
specify a stack-unit number. Valid values: 0 to 5.
show interface port-type slot/port pfc statistics
(Figure 5-9)
Displays counters for the PFC frames received and transmitted (by dot1p
priority class) on an interface.
show interface port-type slot/port pfc {summary Displays the PFC configuration applied to ingress traffic on an interface,
| detail} (Figure 5-10)
including priorities and link delay.
To clear PFC TLV counters on all ports or a specified port, use the clear pfc
counters {stack-unit unit-number | tengigabitethernet slot/port} command.
show interface port-type slot/port ets {summary Displays the ETS configuration applied to egress traffic on an interface,
| detail} (Figure 5-11 and Figure 5-11)
including priority groups with priorities and bandwidth allocation.
To clear ETS TLV counters on all ports or a specified port, enter the clear
ets counters stack-unit unit-number command.
Figure 5-8.
show dcb Command Example
FTOS# show dcb
stack-unit 0 port-set 0
DCB Status : Enabled
PFC Port Count : 56 (current), 56 (configured)
PFC Queue Count : 2 (current), 2 (configured)
Figure 5-9.
show interface pfc statistics Command Example
FTOS#show interfaces tengigabitethernet 0/3 pfc
Interface TenGigabitEthernet 0/3
statistics
Priority
Rx XOFF Frames
Rx Total Frames
Tx Total Frames
------------------------------------------------------------------------------0
0
0
0
1
0
0
0
2
0
0
0
3
0
0
0
4
0
0
0
5
0
0
0
6
0
0
0
7
0
0
0
68
|
Data Center Bridging (DCB)
Figure 5-10. show interfaces pfc detail Command Example
FTOS# show interfaces tengigabitethernet 0/49 pfc detail
Interface TenGigabitEthernet 0/49
Admin mode is on
Admin is enabled
Remote is enabled
Remote Willing Status is enabled
Local is enabled
Oper status is recommended
PFC DCBX Oper status is Up
State Machine Type is Feature
TLV Tx Status is enabled
PFC Link Delay 45556 pause quanta
Application Priority TLV Parameters :
-------------------------------------FCOE TLV Tx Status is disabled
ISCSI TLV Tx Status is disabled
Local FCOE PriorityMap is 0x8
Local ISCSI PriorityMap is 0x10
Remote FCOE PriorityMap is 0x8
Remote ISCSI PriorityMap is 0x8
0 Input TLV pkts, 1 Output TLV pkts, 0 Error pkts, 0 Pause Tx pkts, 0 Pause Rx pkts
0 Input Appln Priority TLV pkts, 1 Output Appln Priority TLV pkts, 0 Error Appln
Priority TLV Pkts
Table 5-3.
show interface pfc summary Command Description
Field
Description
Interface
Interface type with stack-unit and port number.
Admin mode is on
Admin is enabled
PFC Admin mode is on or off with a list of the configured PFC priorities.
When PFC admin mode is on, PFC advertisements are enabled to be sent and
received from peers; received PFC configuration takes effect.
The admin operational status for a DCBx exchange of PFC configuration is
enabled or disabled.
Data Center Bridging (DCB) | 69
www.dell.com | support.dell.com
Table 5-3.
70
show interface pfc summary Command Description
Field
|
Description
Remote is enabled, Priority list
Remote Willing Status is
enabled
Operational status (enabled or disabled) of peer device for DCBx exchange of
PFC configuration with a list of the configured PFC priorities.
Willing status of peer device for DCBx exchange (Willing bit received in PFC
TLV): enabled or disabled.
Local is enabled
DCBx operational status (enabled or disabled) with a list of the configured
PFC priorities.
Operational status (local port)
Port state for current operational PFC configuration:
Init: Local PFC configuration parameters were exchanged with peer.
Recommend: Remote PFC configuration parameters were received from peer.
Internally propagated: PFC configuration parameters were received from
configuration source.
PFC DCBx Oper status
Operational status for exchange of PFC configuration on local port: match
(up) or mismatch (down).
State Machine Type
Type of state machine used for DCBx exchanges of PFC parameters:
Feature - for legacy DCBx versions; Symmetric - for an IEEE version.
TLV Tx Status
Status of PFC TLV advertisements: enabled or disabled.
PFC Link Delay
Link delay (in quanta) used to pause specified priority traffic.
Application Priority TLV:
FCOE TLV Tx Status
Status of FCoE advertisements in application priority TLVs from local DCBx
port: enabled or disabled.
Application Priority TLV:
ISCSI TLV Tx Status
Status of ISCSI advertisements in application priority TLVs from local DCBx
port: enabled or disabled.
Application Priority TLV:
Local FCOE Priority Map
Priority bitmap used by local DCBx port in FCoE advertisements in
application priority TLVs.
Application Priority TLV:
Local ISCSI Priority Map
Priority bitmap used by local DCBx port in ISCSI advertisements in
application priority TLVs.
Application Priority TLV:
Remote FCOE Priority Map
Priority bitmap received from the remote DCBx port in FCoE advertisements
in application priority TLVs.
Application Priority TLV:
Remote ISCSI Priority Map
Priority bitmap received from the remote DCBx port in iSCSI advertisements
in application priority TLVs.
PFC TLV Statistics:
Input TLV pkts
Number of PFC TLVs received.
PFC TLV Statistics:
Output TLV pkts
Number of PFC TLVs transmitted.
PFC TLV Statistics:
Error pkts
Number of PFC error packets received.
PFC TLV Statistics:
Pause Tx pkts
Number of PFC pause frames transmitted.
PFC TLV Statistics:
Pause Rx pkts
Number of PFC pause frames received
Data Center Bridging (DCB)
Table 5-3.
show interface pfc summary Command Description
Field
Description
Input Appln Priority TLV pkts
Number of Appln Priority TLVs received.
Output Appln Priority TLV pkts
Number of Appln Priority TLVs transmitted.
Error Appln Priority TLV pkts
Number of Appln Priority error packets received.
Data Center Bridging (DCB) | 71
www.dell.com | support.dell.com
Figure 5-11.
72
|
show interface ets detail Command Example
Data Center Bridging (DCB)
FTOS# show interfaces tengigabitethernet 0/34 ets
Interface TenGigabitEthernet 0/34
Max Supported PG is 4
Number of Traffic Classes is 8
Admin mode is on
detail
Admin Parameters :
-----------------Admin is enabled
PG-grp
Priority#
Bandwidth
TSA
-----------------------------------------------0
0,1,2,3,4,5,6,7
100%
ETS
1
2
3
4
5
6
7
Remote Parameters :
------------------Remote is disabled
Local Parameters :
-----------------Local is enabled
PG-grp
Priority#
Bandwidth
TSA
-----------------------------------------------0
0,1,2,3,4,5,6,7
100%
ETS
1
2
3
4
5
6
7
Oper status is init
ETS DCBX Oper status is Down
Reason: Port Shutdown
State Machine Type is Asymmetric
Conf TLV Tx Status is enabled
Reco TLV Tx Status is enabled
0 Input Conf TLV Pkts, 0 Output Conf TLV Pkts, 0 Error Conf TLV Pkts
Table 5-4.
show interface ets detail Command Description
Field
Description
Interface
Interface type with stack-unit and port number.
Max Supported TC Group
Maximum number of priority groups supported.
Number of Traffic Classes
Number of 802.1p priorities currently configured.
Data Center Bridging (DCB) | 73
www.dell.com | support.dell.com
Table 5-4.
74
show interface ets detail Command Description
Field
|
Description
Admin mode
ETS mode: on or off.
When on, the scheduling and bandwidth allocation configured in an ETS
output policy or received in a DCBx TLV from a peer can take effect on an
interface.
Admin Parameters
ETS configuration on local port, including priority groups, assigned dot1p
priorities, and bandwidth allocation.
Remote Parameters
ETS configuration on remote peer port, including Admin mode (enabled if a
valid TLV was received or disabled), priority groups, assigned dot1p
priorities, and bandwidth allocation. If the ETS Admin mode is enabled on the
remote port for DCBx exchange, the Willing bit received in ETS TLVs from
the remote peer is included.
Local Parameters
ETS configuration on local port, including Admin mode (enabled when a
valid TLV is received from a peer), priority groups, assigned dot1p priorities,
and bandwidth allocation.
Operational status (local port)
Port state for current operational ETS configuration:
Init: Local ETS configuration parameters were exchanged with peer.
Recommend: Remote ETS configuration parameters were received from peer.
Internally propagated: ETS configuration parameters were received from
configuration source.
ETS DCBx Oper status
Operational status of ETS configuration on local port: match or mismatch.
State Machine Type
Type of state machine used for DCBx exchanges of ETS parameters:
Feature - for legacy DCBx versions; Asymmetric - for an IEEE version.
Conf TLV Tx Status
Status of ETS Configuration TLV advertisements: enabled or disabled.
Reco TLV Tx Status
Status of ETS Recommendation TLV advertisements: enabled or disabled.
Input Conf TLV pkts
Output Conf TLV pkts
Error Conf TLV pkts
Number of ETS Configuration TLVs received and transmitted, and number of
ETS Error Configuration TLVs received.
Input Reco TLV pkts
Output Reco TLV pkts
Error Reco TLV pkts
Number of ETS Recommendation TLVs received and transmitted, and
number of ETS Error Recommendation TLVs received.
Data Center Bridging (DCB)
Figure 5-12. show stack-unit all stack-ports all pfc details Command Example
FTOS# show stack-unit all
stack-ports all pfc details
stack unit 0 stack-port all
Admin mode is On
Admin is enabled, Priority list is 4-5
Local is enabled, Priority list is 4-5
Link Delay 45556 pause quantum
0 Pause Tx pkts, 0 Pause Rx pkts
stack unit 1 stack-port all
Admin mode is On
Admin is enabled, Priority list is 4-5
Local is enabled, Priority list is 4-5
Link Delay 45556 pause quantum
0 Pause Tx pkts, 0 Pause Rx pkts
Figure 5-13. show stack-unit all stack-ports all ets details Command Example
FTOS# show stack-unit all
stack-ports all ets details
Stack unit 0 stack port all
Max Supported TC Groups is 4
Number of Traffic Classes is 1
Admin mode is on
Admin Parameters:
-------------------Admin is enabled
TC-grp
Priority#
Bandwidth
TSA
-----------------------------------------------0
0,1,2,3,4,5,6,7
100%
ETS
1
2
3
4
5
6
7
8
Stack unit 1 stack port all
Max Supported TC Groups is 4
Number of Traffic Classes is 1
Admin mode is on
Admin Parameters:
-------------------Admin is enabled
TC-grp
Priority#
Bandwidth
TSA
-----------------------------------------------0
0,1,2,3,4,5,6,7
100%
ETS
1
2
3
4
5
6
7
8
-
Data Center Bridging (DCB) | 75
www.dell.com | support.dell.com
Figure 5-14. show interface dcbx detail Command Example
FTOS# show interface tengigabitethernet 0/49 dcbx detail
FTOS# show interface te 0/49 dcbx detail
E-ETS Configuration TLV enabled
e-ETS Configuration TLV disabled
R-ETS Recommendation TLV enabled
r-ETS Recommendation TLV disabled
P-PFC Configuration TLV enabled
p-PFC Configuration TLV disabled
F-Application priority for FCOE enabled
f-Application Priority for FCOE disabled
I-Application priority for iSCSI enabled
i-Application Priority for iSCSI disabled
-----------------------------------------------------------------------------------------Interface TenGigabitEthernet 0/49
Remote Mac Address 00:00:00:00:00:11
Port Role is Auto-Upstream
DCBX Operational Status is Enabled
Is Configuration Source? TRUE
Local DCBX Compatibility mode is CEE
Local DCBX Configured mode is CEE
Peer Operating version is CEE
Local DCBX TLVs Transmitted: ErPfi
Local DCBX Status
----------------DCBX Operational Version is 0
DCBX Max Version Supported is 0
Sequence Number: 2
Acknowledgment Number: 2
Protocol State: In-Sync
Peer DCBX Status:
---------------DCBX Operational Version is 0
DCBX Max Version Supported is 255
Sequence Number: 2
Acknowledgment Number: 2
4 Input PFC TLV pkts, 8 Output PFC TLV pkts, 0 Error PFC pkts
0 PFC Pause Tx pkts, 0 Pause Rx pkts
4 Input PG TLV Pkts, 8 Output PG TLV Pkts, 0 Error PG TLV Pkts
0 Input Appln Priority TLV pkts, 1 Output Appln Priority TLV pkts, 0 Error Appln
Priority TLV Pkts
Total DCBX Frames transmitted 27
Total DCBX Frames received 6
Total DCBX Frame errors 0
Total DCBX Frames unrecognized 0
76
|
Data Center Bridging (DCB)
Example: PFC and ETS Operation
Table 5-5.
show interface dcbx detail Command Description
Field
Description
Interface
Interface type with chassis slot and port number.
Port-Role
Configured DCBx port role: auto-upstream or auto-downstream.
DCBx Operational Status
Operational status (enabled or disabled) used to elect a configuration source
and internally propagate a DCB configuration. The DCBx operational status is
the combination of PFC and ETS operational status.
Configuration Source
Specifies whether the port serves as the DCBx configuration source on the
switch: true (yes) or false (no).
Local DCBx Compatibility
mode
DCBx version accepted in a DCB configuration as compatible. In
auto-detection mode, a port can only operate on a DCBx version supported on
the remote peer.
Local DCBx Configured mode
DCBx version configured on the port: CEE, CIN, IEEE v2.5, or Auto (port
auto-configures to use the DCBx version received from a peer).
Peer Operating version
DCBx version that the peer uses to exchange DCB parameters.
Local DCBx TLVs Transmitted
Transmission status (enabled or disabled) of advertised DCB TLVs (see TLV
code at the top of the show command output).
Local DCBx Status:
DCBx Operational Version
DCBx version advertised in Control TLVs.
Local DCBx Status:
DCBX Max Version Supported
Highest DCBx version supported in Control TLVs.
Local DCBx Status:
Sequence Number
Sequence number transmitted in Control TLVs.
Local DCBx Status:
Acknowledgment Number
Acknowledgement number transmitted in Control TLVs
Local DCBx Status:
Protocol State
Current operational state of DCBx protocol: Waiting for ACK or IN-SYNC.
Peer DCBx Status:
DCBX Operational Version
DCBx version advertised in Control TLVs received from peer device.
Peer DCBx Status:
DCBx Max Version Supported
Highest DCBx version supported in Control TLVs received from peer device.
Peer DCBx Status:
Sequence Number
Sequence number transmitted in Control TLVs received from peer device.
Peer DCBx Status:
Acknowledgment Number
Acknowledgement number transmitted in Control TLVs received from peer
device.
Total DCBx Frames transmitted
Number of DCBX frames sent from local port.
Total DCBx Frames received
Number of DCBx frames received from remote peer port.
Data Center Bridging (DCB) | 77
www.dell.com | support.dell.com
Table 5-5.
show interface dcbx detail Command Description
Field
Description
Total DCBX Frame errors
Number of DCBx frames with errors received.
Total DCBX Frames
unrecognized
Number of unrecognizable DCBx frames received.
PFC TLV Statistics:
Input PFC TLV pkts
Number of PFC TLVs received.
Output PFC TLV pkts
Number of PFC TLVs transmitted.
Error PFC pkts
Number of PFC error packets received.
PFC Pause Tx pkts
Number of PFC pause frames transmitted.
PFC Pause Rx pkts
Number of PFC pause frames received.
PG TLV Statistics:
Input PG TLV pkts
Number of PG TLVs received.
Output PG TLV pkts
Number of PG TLVs transmitted.
Error PG TLV pkts
Number of PG error packets received.
Application Priority TLV Statistics:
Input Appln Priority TLV pkts
Number of Application TLVs received.
Output Appln Priority TLV pkts
Number of Application TLVs transmitted.
Error Appln Priority TLV pkts
Number of Application TLV error packets received.
This section contains examples of DCB input and output policies applied on an interface.
In the example shown in Figure 5-15 for an Aggregator:
•
•
•
78
|
Incoming SAN traffic is configured for priority-based flow control.
Outbound LAN, IPC, and SAN traffic is mapped into three ETS priority groups and configured for
enhanced traffic selection (bandwidth allocation and scheduling).
One lossless queue is used.
Data Center Bridging (DCB)
Figure 5-15. Example: PFC and ETS Applied to LAN, IPC, and SAN Priority Traffic
dot1p priority 3
dot1p priority
0, 1, 2, 4, 5
Converged LAN, SAN, and IPC traffic
dot1p priority 0-7
SAN
priority 3
IPC
priority 4
QoS Traffic Classification: On the Aggregator, the service-class dynamic dot1p command has been used in
Global Configuration mode to map ingress dot1p frames to the queues shown in Table 5-6. For more
information, refer to dcb enable auto-detect on-next-reload Command Example.
Data Center Bridging (DCB) | 79
www.dell.com | support.dell.com
Table 5-6.
Example: dot1p-Queue Assignment
dot1p Value in Incoming Frame
Queue Assignment
0
0
1
0
2
0
3
1
4
2
5
3
6
3
7
3
Lossless SAN traffic with dot1p priority 3 is assigned to queue 1. Other traffic types are assigned the
802.1p priorities shown in Table 5-7 and the bandwidth allocations shown in Table 5-8.
Table 5-7.
Example: dot1p-priority class group Assignment
dot1p Value in Incoming Frame
80
|
Priority Group Assignment
0
LAN
1
LAN
2
LAN
3
SAN
4
IPC
5
LAN
6
LAN
7
LAN
Data Center Bridging (DCB)
Table 5-8.
Example: priority group-bandwidth Assignment
Priority Group
Bandwidth Assignment
IPC
5%
SAN
50%
LAN
45%
Hierarchical Scheduling in ETS Output Policies
On an Aggregator, ETS supports up to three levels of hierarchical scheduling. For example, ETS output
policies with the following configurations can be applied:
•
•
•
Priority group 1 assigns traffic to one priority queue with 20% of the link bandwidth and strict-priority
scheduling.
Priority group 2 assigns traffic to one priority queue with 30% of the link bandwidth.
Priority group 3 assigns traffic to two priority queues with 50% of the link bandwidth and
strict-priority scheduling.
In this example, ETS bandwidth allocation and scheduler behavior is as follows:
•
Unused bandwidth usage: Normally, if there is no traffic or unused bandwidth for a priority group, the
bandwidth allocated to the group is distributed to the other priority groups according to the bandwidth
percentage allocated to each group. However, when three priority groups with different bandwidth
allocations are used on an interface:
• If priority group 3 has free bandwidth, it is distributed as follows: 20% of the free bandwidth to
priority group 1 and 30% of the free bandwidth to priority group 2.
• If priority group 1 or 2 has free bandwidth, (20 + 30)% of the free bandwidth is distributed to
priority group 3. Priority groups 1 and 2 retain whatever free bandwidth remains up to the (20+
30)%.
•
Strict-priority groups: If two priority groups have strict-priority scheduling, traffic assigned from the
priority group with the higher priority-queue number is scheduled first. However, when three priority
groups are used and two groups have strict-priority scheduling (such as groups 1 and 3 in the example),
the strict priority group whose traffic is mapped to one queue takes precedence over the strict priority
group whose traffic is mapped to two queues.
Therefore, in the example, scheduling traffic to priority group 1 (mapped to one strict-priority queue) takes
precedence over scheduling traffic to priority group 3 (mapped to two strict-priority queues).
Data Center Bridging (DCB) | 81
82
|
Data Center Bridging (DCB)
www.dell.com | support.dell.com
Skippy812
6
Dynamic Host Configuration Protocol (DHCP)
The Aggregator is auto-configured to operate as a DHCP client. The DHCP server, DHCP relay agent, and
secure DHCP features are not supported.
DHCP Overview
Dynamic host configuration protocol (DHCP) is an application layer protocol that dynamically assigns IP
addresses and other configuration parameters to network end-stations (hosts) based on configuration
policies determined by network administrators. DHCP:
•
•
relieves network administrators of manually configuring hosts, which can be a tedious and error-prone
process when hosts often join, leave, and change locations on the network.
reclaims IP addresses that are no longer in use to prevent address exhaustion.
DHCP is based on a client-server model. A host discovers the DHCP server and requests an IP address, and
the server either leases or permanently assigns one. There are three types of devices that are involved in
DHCP negotiation:
•
•
•
DHCP Server—a network device offering configuration parameters to the client.
DHCP Client—a network device requesting configuration parameters from the server.
Relay agent—an intermediary network device that passes DHCP messages between the client and
server when the server is not on the same subnet as the host.
Note: The DHCP server and relay agent features are not supported on an Aggregator.
Dynamic Host Configuration Protocol (DHCP) | 83
www.dell.com | support.dell.com
DHCP Packet Format and Options
DHCP uses the user datagram protocol (UDP) as its transport protocol. The server listens on port 67 and
transmits to port 68; the client listens on port 68 and transmits to port 67. The configuration parameters are
carried as options in the DHCP packet in type, length, value (TLV) format; many options are specified in
RFC 2132. To limit the number parameters that servers must provide, hosts specify the parameters that
they require, and the server sends only those; some common options are given in Table 6-1.
Figure 6-1.
op
DHCP Packet Format
htype
hlen
hops
xid
flags
secs
ciaddr
yiaddr
siaddr
giaddr
chaddr
sname
Code
Table 6-1.
84
|
options
file
Length
Value
Common DHCP Options
Option
Code
Description
Subnet Mask
1
Specifies the clients subnet mask.
Router
3
Specifies the router IP addresses that may serve as the client’s default
gateway.
Domain Name Server
6
Specifies the DNS servers that are available to the client.
Domain Name
15
Specifies the domain name that client should use when resolving hostnames
via DNS.
IP Address Lease Time
51
Specifies the amount of time that the client is allowed to use an assigned IP
address.
DHCP Message Type
53
1: DHCPDISCOVER
2: DHCPOFFER
3: DHCPREQUEST
4: DHCPDECLINE
5: DHCPACK
6: DHCPNACK
7: DHCPRELEASE
8: DHCPINFORM
Parameter Request List
55
Clients use this option to tell the server which parameters it requires. It is a
series of octets where each octet is DHCP option code.
Renewal Time
58
Specifies the amount of time after the IP address is granted that the client
attempts to renew its lease with the original server.
Rebinding Time
59
Specifies the amount of time after the IP address is granted that the client
attempts to renew its lease with any server, if the original server does not
respond.
End
255
Signals the last option in the DHCP packet.
Dynamic Host Configuration Protocol (DHCP)
Assigning an IP Address Using DHCP
When a client joins a network:
1. The client initially broadcasts a DHCPDISCOVER message on the subnet to discover available
DHCP servers. This message includes the parameters that the client requires and might include
suggested values for those parameters.
2. Servers unicast or broadcast a DHCPOFFER message in response to the DHCPDISCOVER that
offers to the client values for the requested parameters. Multiple servers might respond to a single
DHCPDISCOVER; the client might wait a period of time and then act on the most preferred offer.
3. The client broadcasts a DHCPREQUEST message in response to the offer, requesting the offered
values.
4. After receiving a DHCPREQUEST, the server binds the clients’ unique identifier (the hardware
address plus IP address) to the accepted configuration parameters and stores the data in a database
called a binding table. The server then broadcasts a DHCPACK message, which signals to the client
that it may begin using the assigned parameters.
There are additional messages that are used in case the DHCP negotiation deviates from the process
described above and shown in Figure 6-2.
•
•
•
•
Figure 6-2.
DHCPDECLINE—A client sends this message to the server in response to a DHCPACK if the
configuration parameters are unacceptable, for example, if the offered address is already in use. In this
case, the client starts the configuration process over by sending a DHCPDISCOVER.
DHCPINFORM—A client uses this message to request configuration parameters when it assigned an
IP address manually rather than with DHCP. The server responds by unicast.
DHCPNAK—A server sends this message to the client if it is not able to fulfill a DHCPREQUEST,
for example, if the requested address is already in use. In this case, the client starts the configuration
process over by sending a DHCPDISCOVER.
DHCPRELEASE—A DHCP client sends this message when it is stopped forcefully to return its IP
address to the server.
Assigning Network Parameters using DHCP
Client
Relay Agent
Server
1. DHCPDISCOVER
2. DHCPOFFER
3. DHCPREQUEST
4. DHCPACK
Dynamic Host Configuration Protocol (DHCP) | 85
www.dell.com | support.dell.com
FTOS Behavior: DHCP is implemented in FTOS based on RFC 2131 and 3046.
DHCP Client
An Aggregator is auto-configured to operate as a DHCP client. The DHCP client functionality is enabled
only on the default VLAN and the management interface.
A DHCP client is a network device that requests an IP address and configuration parameters from a DHCP
server. On an Aggregator, the DHCP client functionality is implemented as follows:
•
•
86
|
The public out-of-band management (OOB) interface and default VLAN 1 are configured, by default,
as a DHCP client to acquire a dynamic IP address from a DHCP server.
You can override the DHCP-assigned address on the OOB management interface by manually configuring an IP address using the CLI or CMC interface. If no user-configured IP address exists for the
OOB interface exists and if the OOB IP address is not in the startup configuration, the Aggregator will
automatically obtain it using DHCP.
You can also manually configure an IP address for the VLAN 1 default management interface using
the CLI. If no user-configured IP address exists for the default VLAN management interface exists and
if the default VLAN IP address is not in the startup configuration, the Aggregator will automatically
obtain it using DHCP.
The default VLAN 1 with all ports configured as members is the only L3 interface on the Aggregator.
When the default management VLAN has a DHCP-assigned address and you reconfigure the default
VLAN ID number, the Aggregator:
• Sends a DHCP release to the DHCP server to release the IP address.
• Sends a DHCP request to obtain a new IP address. The IP address assigned by the DHCP server is
used for the new default management VLAN.
Dynamic Host Configuration Protocol (DHCP)
Releasing and Renewing DHCP-based IP Addresses
On an Aggregator configured as a DHCP client, you can release a dynamically-assigned IP address
without removing the DHCP client operation on the interface. You can later manually acquire a new IP
address from the DHCP server as follows:
Task
Command Syntax
Command Mode
Release a dynamically-acquired IP address while retaining
the DHCP client configuration on the interface.
release dhcp interface type slot/port
EXEC Privilege
Acquire a new IP address with renewed lease time from a
DHCP server.
renew dhcp interface type slot/port
EXEC Privilege
Viewing DHCP Statistics and Lease Information
To display DHCP client information, enter the following show commands:
Task
Command Syntax
Command Mode
Display statistics about DHCP client interfaces
(Figure 6-3).
show ip dhcp client statistics
interface type slot/port
EXEC Privilege
Clear DHCP client statistics on a specified or on all
interfaces.
clear ip dhcp client statistics {all |
interface type slot/port}
EXEC Privilege
Display lease information about the dynamic IP address
currently assigned to a DHCP client interface (Figure 6-4).
show ip dhcp lease [interface type
slot/port]
EXEC Privilege
Figure 6-3.
show ip dhcp client statistics
FTOS# show ip dhcp client statistics interface tengigabitethernet 0/0
Interface Name
Ma 0/0
Message
Received
DHCPOFFER
0
DHCPACK
0
DHCPNAK
0
Message
Sent
DHCPDISCOVER
13
DHCPREQUEST
0
DHCPDECLINE
0
DHCPRELEASE
0
DHCPREBIND
0
DHCPRENEW
0
DHCPINFORM
0
Dynamic Host Configuration Protocol (DHCP) | 87
www.dell.com | support.dell.com
Figure 6-4.
show ip dhcp lease
FTOS# show ip dhcp
Interface
=========
Ma 0/0
Vl 1
Lease-IP Def-Router
======== =========
0.0.0.0/0 0.0.0.0
10.1.1.254/24
0.0.0.0
ServerId
========
0.0.0.0
10.1.1.1
Renew Time
==========
----NA----
Rebind Time
========
----NA----
08-26-2011 16:21:50
08-27-2011 01:33:39
State
=====
INIT
Lease Obtnd At
==============
-----NA-----
Lease Expires At
================
----NA----
BOUND
08-26-2011 04:33:39
08-27-2011 04:33:39
Debugging DHCP Client Operation
To enable debug messages for DHCP client operation, enter the following debug commands:
Task
Command Syntax
Command Mode
Enable the display of log messages for all DHCP packets
sent and received on DHCP client interfaces.
[no] debug ip dhcp client packets
[interface type slot/port]
EXEC Privilege
Enable the display of log messages for the following
events on DHCP client interfaces:
• IP address acquisition
• IP address release
• Renewal of IP address and lease time
• Release of an IP address
[no] debug ip dhcp client events
[interface type slot/port]
EXEC Privilege
Figure 6-5 shows an example of the packet- and event-level debug messages displayed for the packet transmissions
and state transitions on a DHCP client interface.
88
|
Dynamic Host Configuration Protocol (DHCP)
Figure 6-5.
DHCP Client: Debug Messages Logged during DHCP Client Enabling/Disabling
FTOS (conf-if-Ma-0/0)# ip address dhcp
1w2d23h: %STKUNIT0-M:CP %DHCLIENT-5-DHCLIENT-LOG: DHCLIENT_DBG_EVT: Interface Ma 0/0 :DHCP ENABLE CMD
Received in state START
1w2d23h: %STKUNIT0-M:CP %DHCLIENT-5-DHCLIENT-LOG: DHCLIENT_DBG_EVT: Interface Ma 0/0 :Transitioned to
state SELECTING
1w2d23h: %STKUNIT0-M:CP %DHCLIENT-5-DHCLIENT-LOG: DHCLIENT_DBG_PKT: DHCP DISCOVER sent in Interface
Ma 0/0
1w2d23h: %STKUNIT0-M:CP %DHCLIENT-5-DHCLIENT-LOG: DHCLIENT_DBG_PKT: Received DHCPOFFER packet in
Interface Ma 0/0 with Lease-ip:10.16.134.250, Mask:255.255.0.0,Server-Id:10.16.134.249
1w2d23h: %STKUNIT0-M:CP %DHCLIENT-5-DHCLIENT-LOG: DHCLIENT_DBG_EVT: Interface Ma 0/0 :Transitioned to
state REQUESTING
1w2d23h: %STKUNIT0-M:CP %DHCLIENT-5-DHCLIENT-LOG: DHCLIENT_DBG_PKT:DHCP REQUEST sent in Interface
Ma 0/0
1w2d23h: %STKUNIT0-M:CP %DHCLIENT-5-DHCLIENT-LOG: DHCLIENT_DBG_PKT:Received DHCPACK packet in Interface
Ma 0/0 with Lease-IP:10.16.134.250, Mask:255.255.0.0,DHCP REQUEST sent in Interface Ma 0/0
1w2d23h: %STKUNIT0-M:CP %DHCLIENT-5-DHCLIENT-LOG: DHCLIENT_DBG_EVT: Interface Ma 0/0 :Transitioned to
state BOUND
FTOS(conf-if-ma-0/0)# no ip address
FTOS(conf-if-ma-0/0)#1w2d23h: %STKUNIT0-M:CP %DHCLIENT-5-DHCLIENT-LOG: DHCLIENT_DBG_EVT: Interface
Ma 0/0 :DHCP DISABLE CMD Received in state SELECTING
1w2d23h: %STKUNIT0-M:CP %DHCLIENT-5-DHCLIENT-LOG: DHCLIENT_DBG_EVT: Interface Ma 0/0 :Transitioned to
state START
1w2d23h: %STKUNIT0-M:CP %DHCLIENT-5-DHCLIENT-LOG: DHCLIENT_DBG_EVT: Interface Ma 0/0 :DHCP DISABLED CMD
sent to FTOS in state START
FTOS# release dhcp int Ma 0/0
FTOS#1w2d23h: %STKUNIT0-M:CP %DHCLIENT-5-DHCLIENT-LOG: DHCLIENT_DBG_EVT: Interface Ma 0/0 :DHCP RELEASE
CMD Received in state BOUND
1w2d23h: %STKUNIT0-M:CP %DHCLIENT-5-DHCLIENT-LOG: DHCLIENT_DBG_PKT: DHCP RELEASE sent in Interface
Ma 0/0
1w2d23h: %STKUNIT0-M:CP %DHCLIENT-5-DHCLIENT-LOG: DHCLIENT_DBG_EVT: Interface Ma 0/0 :Transitioned to
state STOPPED
1w2d23h: %STKUNIT0-M:CP %DHCLIENT-5-DHCLIENT-LOG: DHCLIENT_DBG_EVT: Interface Ma 0/0 :DHCP IP RELEASED
CMD sent to FTOS in state STOPPED
FTOS# renew dhcp int Ma 0/0
FTOS#1w2d23h: %STKUNIT0-M:CP %DHCLIENT-5-DHCLIENT-LOG: DHCLIENT_DBG_EVT: Interface Ma 0/0 :DHCP RENEW
CMD Received in state STOPPED
1w2d23h: %STKUNIT0-M:CP %DHCLIENT-5-DHCLIENT-LOG: DHCLIENT_DBG_EVT: Interface Ma 0/0 :Transitioned to
state SELECTING
1w2d23h: %STKUNIT0-M:CP %DHCLIENT-5-DHCLIENT-LOG: DHCLIENT_DBG_PKT: DHCP DISCOVER sent in Interface
Ma 0/0
1w2d23h: %STKUNIT0-M:CP %DHCLIENT-5-DHCLIENT-LOG: DHCLIENT_DBG_PKT: Received DHCPOFFER packet in
Interface Ma 0/0 with Lease-Ip:10.16.134.250, Mask:255.255.0.0,Server-Id:10.16.134.249
Dynamic Host Configuration Protocol (DHCP) | 89
www.dell.com | support.dell.com
Figure 6-6 shows an example of the packet- and event-level debug messages displayed for the packet transmissions
and state transitions on a DHCP client interface when you release and renew a DHCP client.
Figure 6-6.
DHCP Client: Debug Messages Logged during DHCP Client Release/Renew
FTOS# release dhcp interface managementethernet 0/0
May 27 15:55:22: %STKUNIT0-M:CP %DHCLIENT-5-DHCLIENT-LOG:
DHCP RELEASE CMD Received in state BOUND
May 27 15:55:22: %STKUNIT0-M:CP %DHCLIENT-5-DHCLIENT-LOG:
DHCP RELEASE sent in Interface Ma 0/0
May 27 15:55:22: %STKUNIT0-M:CP %DHCLIENT-5-DHCLIENT-LOG:
Transitioned to state STOPPED
May 27 15:55:22: %STKUNIT0-M:CP %DHCLIENT-5-DHCLIENT-LOG:
DHCP IP RELEASED CMD sent to FTOS in state STOPPED
DHCLIENT_DBG_EVT: Interface Ma 0/0 :
DHCLIENT_DBG_PKT:
DHCLIENT_DBG_EVT: Interface Ma 0/0 :
DHCLIENT_DBG_EVT: Interface Ma 0/0 :
FTOS# renew dhcp interface tengigabitethernet 0/1
FTOS#May 27 15:55:28: %STKUNIT0-M:CP %DHCLIENT-5-DHCLIENT-LOG: DHCLIENT_DBG_EVT: Interface Ma 0/0 :
DHCP RENEW CMD Received in state STOPPED
May 27 15:55:31: %STKUNIT0-M:CP %DHCLIENT-5-DHCLIENT-LOG: DHCLIENT_DBG_EVT: Interface Ma 0/0 :
Transitioned to state SELECTING
May 27 15:55:31: %STKUNIT0-M:CP %DHCLIENT-5-DHCLIENT-LOG: DHCLIENT_DBG_PKT:
DHCP DISCOVER sent in Interface Ma 0/0
May 27 15:55:31: %STKUNIT0-M:CP %DHCLIENT-5-DHCLIENT-LOG: DHCLIENT_DBG_PKT:
Received DHCPOFFER packet in Interface Ma 0/0 with Lease-Ip:10.16.134.250,
Mask:255.255.0.0,Server-Id:10.16.134.249
How DHCP Client is Implemented
The Aggregator is enabled by default to receive DHCP server-assigned dynamic IP addresses on an
interface. This setting persists after a switch reboot. If you enter the shutdown command on the interface,
DHCP transactions are stopped and the dynamically-acquired IP address is saved. Use the show interface
type slot/port command to display the dynamic IP address and DHCP as the mode of IP address
assignment. If you later enter the no shutdown command and the lease timer for the dynamic IP address
has expired, the IP address is unconfigured and the interface tries to acquire a new dynamic address from
DHCP server.
If you later enter the no shutdown command and the lease timer for the dynamic IP address has expired,
the IP address is released.
When you enter the release dhcp command, although the IP address that was dynamically-acquired from a
DHCP server is released from an interface, the ability to acquire a new DHCP server-assigned address
remains in the running configuration for the interface. To acquire a new IP address, enter either the renew
dhcp command at the EXEC privilege level or the ip address dhcp command at the interface
configuration level.
If you enter renew dhcp command on an interface already configured with a dynamic IP address, the lease
time of the dynamically acquired IP address is renewed.
Important: To verify the currently configured dynamic IP address on an interface, enter the show ip dhcp
lease command. The show running-configuration command output only displays ip address dhcp;
the currently assigned dynamic IP address is not displayed.
90
|
Dynamic Host Configuration Protocol (DHCP)
DHCP Client on a Management Interface
The following conditions apply on a management interface that operates as a DHCP client:
•
•
•
•
•
•
•
The management default route is added with the gateway as the router IP address received in the
DHCP ACK packet. This is required to send and receive traffic to and from other subnets on the
external network. This route is added irrespective both when the DHCP client and server are in the
same or different subnets.
The management default route is deleted if the management IP address is released like other management routes added by the DHCP client.
If "ip route for 0.0.0.0" is present or added later, it will take precedence.
Management routes added by a DHCP client are displayed with Route Source as DHCP in show ip
management route and show ip management-route dynamic command output.
If a static IP route configured with the ip route command replaces a management route added by the
DHCP client and then if the statically-configured IP route is removed (no ip route command), the
management route added by DHCP is automatically re-installed. The management routes added by the
DHCP client must be manually deleted.
If a management route added by the DHCP client is removed or replaced by the same
statically-configured management route, it is not re-installed unless you release the DHCP IP address
and renew it on the management interface.
A management route added by the DHCP client has higher precedence over the same
statically-configured management route. If a dynamically-acquired management route added by the
DHCP client overwrites a static management route, the static route is not removed from the running
configuration.
Management routes added by the DHCP client are not added to the running configuration.
Note: Management routes added by the DHCP client include the specific routes to reach a DHCP server
in a different subnet and the default management route.
Dynamic Host Configuration Protocol (DHCP) | 91
www.dell.com | support.dell.com
DHCP Client on a VLAN
The following conditions apply on a VLAN that operates as a DHCP client:
•
•
The default VLAN 1 with all ports auto-configured as members is the only L3 interface on the
Aggregator.
When the default management VLAN has a DHCP-assigned address and you reconfigure the default
VLAN ID number, the Aggregator:
• Sends a DHCP release to the DHCP server to release the IP address.
• Sends a DHCP request to obtain a new IP address. The IP address assigned by the DHCP server is
used for the new default management VLAN.
DHCP Client Operation with Stacking
The DHCP client daemon runs only on the master unit and handles all DHCP packet transactions. The
DHCP client running on the master unit periodically synchronizes the lease file with the standby unit.
When a stack failover occurs, the new master requests the same DHCP server-assigned IP address on
DHCP client interfaces. On non-bound interfaces, the new master re-initiates a DHCP packet transaction
by sending a DHCP discovery packet.
92
|
Dynamic Host Configuration Protocol (DHCP)
Configure Secure DHCP
DHCP as defined by RFC 2131 provides no authentication or security mechanisms. Secure DHCP is a
suite of features that protects networks that use dynamic address allocation from spoofing and attacks.
•
•
•
•
Option 82
DHCP Snooping
Dynamic ARP Inspection
Source Address Validation
Option 82
RFC 3046 (the relay agent information option, or Option 82) is used for class-based IP address assignment.
The code for the relay agent information option is 82 and is comprised of two sub-options, circuit ID and
remote ID.
•
•
Circuit ID is the interface on which the client-originated message is received.
Remote ID identifies the host from which the message is received. The value of this sub-option is the
MAC address of the relay agent that adds Option 82.
The DHCP relay agent inserts Option 82 before forwarding DHCP packets to the server. The server can
use this information to:
•
•
•
track the number of address requests per relay agent; restricting the number of addresses available per
relay agent that can harden a server against address exhaustion attacks.
associate client MAC addresses with a relay agent to prevent offering an IP address to a client spoofing
the same MAC address on a different relay agent.
assign IP addresses according to the relay agent. This prevents generating DHCP offers in response to
requests from an unauthorized relay agent.
The server echoes the option back to the relay agent in its response, and the relay agent can use the
information in the option to forward a reply out the interface on which the request was received rather than
flooding it on the entire VLAN.
The relay agent strips Option 82 from DHCP responses before forwarding them to the client:
Task
Command Syntax
Command Mode
Insert Option 82 into DHCP packets.
For routers between the relay agent
and the DHCP server, enter the
trust-downstream option.
ip dhcp relay information-option
[trust-downstream]
CONFIGURATION
Dynamic Host Configuration Protocol (DHCP) | 93
www.dell.com | support.dell.com
DHCP Snooping
DHCP snooping protects networks from spoofing. In the context of DHCP snooping, all ports are either
trusted or untrusted. By default, all ports are untrusted. Trusted ports are ports through which attackers
cannot connect. Manually configure ports connected to legitimate servers and relay agents as trusted.
When you enable DHCP snooping, the relay agent builds a binding table—using DHCPACK messages—
containing the client MAC address, IP addresses, IP address lease time, port, VLAN ID, and binding type.
Every time the relay agent receives a DHCPACK on an trusted port, it adds an entry to the table.
The relay agent then checks all subsequent DHCP client-originated IP traffic (DHCPRELEASE,
DHCPNACK, and DHCPDECLINE) against the binding table to ensure that the MAC-IP address pair is
legitimate, and that the packet arrived on the correct port. Packets that do not pass this check are dropped.
This check-point prevents an attacker from spoofing a client and declining or releasing the real client’s
address. Server-originated packets (DHCPOFFER, DHCPACK, DHCPNACK) that arrive on an untrusted
port are also dropped. This check-point prevents an attacker from impostering as a DHCP server to
facilitate a man-in-the-middle (MITM) attack.
Binding table entries are deleted when a lease expires, or the relay agent encounters a DHCPRELEASE,
DHCPNACK, DHCPDECLINE.
FTOS Behavior: Introduced in FTOS version 7.8.1.0, DHCP snooping was available for Layer 3 only
and dependent on DHCP relay agent (ip helper-address). FTOS version 8.2.1.0 extends DHCP
snooping to Layer 2. You do not have to enable relay agent to snoop on Layer 2 interfaces.
FTOS Behavior: Binding table entries are deleted when a lease expires or when the relay agent
encounters a DHCPRELEASE. The switch maintains a list of snooped VLANs. When the binding table
is exhausted, DHCP packets are dropped on snooped VLANs, while these packets are forwarded
across non-snooped VLANs. Because DHCP packets are dropped, no new IP address assignments
are made. However, DHCPRELEASE and DHCPDECLINE packets are allowed so that the DHCP
snooping table can decrease in size. After the table usage falls below the maximum limit of 4000
entries, new IP address assignments are allowed.
Note: DHCP server packets are dropped on all untrusted interfaces of a system configured for DHCP
snooping. To prevent these packets from being dropped, configure ip dhcp snooping trust on the
server-connected port.
Enable DCHP Snooping
To enable DCHP snooping, follow these steps:
Step
94
|
Task
Command Syntax
Command Mode
1
Enable DHCP snooping globally.
ip dhcp snooping
CONFIGURATION
2
Specify ports connected to DHCP servers as trusted.
ip dhcp snooping trust
INTERFACE
3
Enable DHCP snooping on a VLAN.
ip dhcp snooping vlan
CONFIGURATION
Dynamic Host Configuration Protocol (DHCP)
Add a Static Entry in the Binding Table
To add a static entry in the binding table, follow this step:
Task
Command Syntax
Command Mode
Add a static entry in the binding table.
ip dhcp snooping binding mac
EXEC Privilege
Clear the Binding Table
To clear the binding table, follow this step:
Task
Command Syntax
Command Mode
Delete all of the entries in the binding
table
clear ip dhcp snooping binding
EXEC Privilege
Display the Contents of the Binding Table
To display the contents of the binding table, follow this step:
Task
Command Syntax
Command Mode
Display the contents of the binding
table.
show ip dhcp snooping
EXEC Privilege
Dynamic Host Configuration Protocol (DHCP) | 95
www.dell.com | support.dell.com
To view the DHCP snooping statistics, use the show ip dhcp snooping command (Figure 6-7).
Figure 6-7.
Command example: show ip dhcp snooping
FTOS#show ip dhcp snooping
IP
IP
IP
IP
DHCP
DHCP
DHCP
DHCP
Snooping
Snooping Mac Verification
Relay Information-option
Relay Trust Downstream
:
:
:
:
Disabled.
Disabled.
Disabled.
Enabled.
Database write-delay (In minutes)
: 0
DHCP packets information
Relay Information-option packets
Relay Trust downstream packets
Snooping packets
: 0
: 0
: 0
Packets received on snooping disabled L3 Ports
Snooping packets processed on L2 vlans
: 0
DHCP Binding File Details
Invalid File
Invalid Binding Entry
Binding Entry lease expired
FTOS#
: 0
: 0
: 0
: 0
Drop DHCP Packets on Snooped VLANs Only
Binding table entries are deleted when a lease expires or the relay agent encounters a DHCPRELEASE.
Starting with FTOS Release 8.2.1.1, line cards maintain a list of snooped VLANs. When the binding table
fills, DHCP packets are dropped only on snooped-VLANs, while such packets are forwarded across
non-snooped VLANs. Because DHCP packets are dropped, no new IP address assignments are made.
However, DHCP release and decline packets are allowed so that the DHCP snooping table can decrease in
size. After the table usage falls below the max limit of 4000 entries, new IP address assignments are
allowed.
96
|
Dynamic Host Configuration Protocol (DHCP)
To view the number of entries in the table, use the show ip dhcp snooping binding command. This output
displays the snooping binding table created using the ACK packets from the trusted port (Figure 6-8).
Figure 6-8.
Command example: show ip dhcp snooping binding
FTOS#show ip dhcp snooping binding
Codes :
S - Static D - Dynamic
IP Address
MAC Address
Expires(Sec) Type VLAN
Interface
========================================================================
10.1.1.251
00:00:4d:57:f2:50
172800
D
Vl 10
Te 0/2
10.1.1.252
00:00:4d:57:e6:f6
172800
D
Vl 10
Te 0/1
10.1.1.253
00:00:4d:57:f8:e8
172740
D
Vl 10
Te 0/3
10.1.1.254
00:00:4d:69:e8:f2
172740
D
Vl 10
Te 0/50
Total number of Entries in the table : 4
Dynamic ARP Inspection
Dynamic address resolution protocol (ARP) inspection prevents ARP spoofing by forwarding only ARP
frames that have been validated against the DHCP binding table.
ARP is a stateless protocol that provides no authentication mechanism. Network devices accepts ARP
request and replies from any device. ARP replies are accepted even when no request was sent. If a client
receives an ARP message for which a relevant entry already exists in its ARP cache, it overwrites the
existing entry with the new information.
The lack of authentication in ARP makes it vulnerable to spoofing. ARP spoofing is a technique attackers
use to inject false IP to MAC mappings into the ARP cache of a network device. It is used to launch
man-in-the-middle (MITM), and denial-of-service (DoS) attacks, among others.
A spoofed ARP message is one in which the MAC address in the sender hardware address field and the IP
address in the sender protocol field are strategically chosen by the attacker. For example, in an MITM
attack, the attacker sends a client an ARP message containing the attacker’s MAC address and the
gateway’s IP address. The client then thinks that the attacker is the gateway and sends all internet-bound
packets to it. Likewise, the attacker sends the gateway an ARP message containing the attacker’s MAC
address and the client’s IP address. The gateway then thinks that the attacker is the client and forwards all
packets addressed to the client to it. As a result, the attacker is able to sniff all packets to and from the
client.
Other attacks using ARP spoofing include:
•
•
broadcast—an attacker can broadcast an ARP reply that specifies FF:FF:FF:FF:FF:FF as the gateway’s
MAC address, resulting in all clients broadcasting all internet-bound packets.
MAC flooding—an attacker can send fraudulent ARP messages to the gateway until the ARP cache is
exhausted, after which, traffic from the gateway is broadcast.
Dynamic Host Configuration Protocol (DHCP) | 97
www.dell.com | support.dell.com
•
denial of service—an attacker can send fraudulent ARP messages to a client to associate a false MAC
address with the gateway address, which blackholes all internet-bound packets from the client.
Note: Dynamic ARP inspection (DAI) uses entries in the L2SysFlow CAM region, a sub-region of
SystemFlow. One CAM entry is required for every DAI-enabled VLAN. You can enable DAI on up to 16
VLANs on a system. You can configure 10 to 16 DAI-enabled VLANs by allocating more CAM space to
the L2SysFlow region before enabling DAI.
Note: SystemFlow has 102 entries by default. This region is comprised of two sub-regions: L2Protocol
and L2SystemFlow. L2Protocol has 87 entries; L2SystemFlow has 15 entries. Six L2SystemFlow entries
are used by Layer 2 protocols, leaving 9 for DAI. L2Protocol can have a maximum of 100 entries. This
region must be expanded to capacity before you can increase the size of L2SystemFlow. This is relevant
when you are enabling DAI on VLANs. If, for example, you want to enable DAI on 16 VLANs, you need
seven more entries; in this case, reconfigure the SystemFlow region for 122 entries:
layer-2 eg-acl value fib value frrp value ing-acl value learn value l2pt value qos value system-flow 122
Note: The logic is as follows:
L2Protocol has 87 entries by default and must be expanded to its maximum capacity, 100 entries, before
L2SystemFlow can be increased; therefore 13 more L2Protocol entries are required. L2SystemFlow has
15 entries by default, but only nine are for DAI; to enable DAI on 16 VLANs, seven more entries are
required:
87 L2Protocol + 13 additional L2Protocol + 15 L2SystemFlow + 7 additional L2SystemFlow equals 122.
Step
Task
1
Enable DHCP snooping.
2
Validate ARP frames against the
DHCP snooping binding table.
Command Syntax
Command Mode
arp inspection
INTERFACE VLAN
Note: Dynamic ARP Inspection (DAI) may sometimes filter ARP traffic from valid clients in the DHCP
snooping binding table.
To view the number of entries in the ARP database, use the show arp inspection database command
(Figure 6-9).
Figure 6-9.
Command example: show arp inspection database
FTOS#show arp inspection database
Protocol
Address
Age(min) Hardware Address
Interface
VLAN CPU
---------------------------------------------------------------------------Internet
10.1.1.251
00:00:4d:57:f2:50
Te 0/2
Vl 10 CP
Internet
10.1.1.252
00:00:4d:57:e6:f6
Te 0/1
Vl 10 CP
Internet
10.1.1.253
00:00:4d:57:f8:e8
Te 0/3
Vl 10 CP
Internet
10.1.1.254
00:00:4d:69:e8:f2
Te 0/50
Vl 10 CP
FTOS#
98
|
Dynamic Host Configuration Protocol (DHCP)
To see how many valid and invalid ARP packets have been processed, use the show arp inspection statistics
command (Figure 6-10).
Figure 6-10. Command example: show arp inspection database
FTOS#show arp inspection statistics
Dynamic ARP Inspection (DAI) Statistics
--------------------------------------Valid ARP Requests
Valid ARP Replies
Invalid ARP Requests
Invalid ARP Replies
FTOS#
:
:
:
:
0
1000
1000
0
Bypass the ARP Inspection
You can configure a port to skip ARP inspection by defining the interface as trusted, which is useful in
multi-switch environments. ARPs received on trusted ports bypass validation against the binding table. All
ports are untrusted by default.
Task
Command Syntax
Command Mode
Specify an interface as trusted so that ARPs are not
validated against the binding table.
arp inspection-trust
INTERFACE
FTOS Behavior: Introduced in FTOS version 8.2.1.0, DAI was available for Layer 3 only. FTOS
version 8.2.1.1 extends DAI to Layer 2.
Source Address Validation
Using the DHCP binding table, FTOS can perform three types of source address validation (SAV):
•
•
•
IP Source Address Validation on page 100: prevents IP spoofing by forwarding only IP packets that
have been validated against the DHCP binding table.
DHCP MAC Source Address Validation on page 100: verifies a DHCP packet’s source hardware
address matches the client hardware address field (CHADDR) in the payload.
IP+MAC Source Address Validation on page 100: verifies that the IP source address and MAC source
address are a legitimate pair.
Dynamic Host Configuration Protocol (DHCP) | 99
www.dell.com | support.dell.com
IP Source Address Validation
IP source address validation prevents IP spoofing by forwarding only IP packets that have been validated
against the DHCP binding table. A spoofed IP packet is one in which the IP source address is strategically
chosen to disguise the attacker. For example, using ARP spoofing, an attacker can assume a legitimate
client’s identity and receive traffic addressed to it. Then the attacker can spoof the client’s IP address to
interact with other clients.
The DHCP binding table associates addresses assigned by the DHCP servers, with the port on which the
requesting client is attached. When you enable IP source address validation on a port, the system verifies
that the source IP address is one that is associated with the incoming port. If an attacker is impostering as a
legitimate client, the source address appears on the wrong ingress port and the system drops the packet.
Likewise, if the IP address is fake, the address will not be on the list of permissible addresses for the port,
and the packet is dropped.
To enable IP source address validation, follow this step:
Task
Command Syntax
Command Mode
Enable IP Source Address Validation
ip dhcp source-address-validation
INTERFACE
DHCP MAC Source Address Validation
DHCP MAC source address validation validates a DHCP packet’s source hardware address against the
client hardware address field (CHADDR) in the payload.
FTOS Release 8.2.1.1 ensures that the packet’s source MAC address is checked against the CHADDR
field in the DHCP header only for packets from snooped VLANs.
To enable DHCP MAC source address validation, follow this step:
Task
Command Syntax
Command Mode
Enable DHCP MAC Source Address
Validation.
ip dhcp snooping verify mac-address
CONFIGURATION
IP+MAC Source Address Validation
IP source address validation validates the IP source address of an incoming packet against the DHCP
snooping binding table. IP+MAC source address validation ensures that the IP source address and MAC
source address are a legitimate pair, rather than validating each attribute individually. You cannot configure
IP+MAC source address validation with IP source address validation.
100
|
Dynamic Host Configuration Protocol (DHCP)
To enable IP+MAC source address validation, follow these steps:
Step
Task
Command Syntax
Command Mode
1
Allocate at least one FP block to the
ipmacacl CAM region.
cam-acl l2acl
CONFIGURATION
2
Save the running-config to the
startup-config.
copy running-config startup-config
EXEC Privilege
3
Reload the system.
reload
EXEC Privilege
4
Enable IP+MAC Source Address
Validation.
ip dhcp source-address-validation ipmac
INTERFACE
FTOS creates an ACL entry for each IP+MAC address pair in the binding table and applies it to the
interface.
To display the IP+MAC ACL, follow this step:
Task
Command Syntax
Command Mode
Display the IP+MAC ACL for an
interface for the entire system.
show ip dhcp snooping source-address-validation
[interface]
EXEC Privilege
Dynamic Host Configuration Protocol (DHCP) | 101
www.dell.com | support.dell.com
102
|
Dynamic Host Configuration Protocol (DHCP)
7
FIP Snooping
FIP snooping is auto-configured on an Aggregator in standalone mode. You can display information on
FIP snooping operation and statistics by entering show commands.
This chapter describes FIP snooping concepts and configuration procedures:
•
•
•
•
•
•
•
Fibre Channel over Ethernet
Ensuring Robustness in a Converged Ethernet Network
FIP Snooping on Ethernet Bridges
FIP Snooping in a Switch Stack
How FIP Snooping is Implemented
Displaying FIP Snooping Information
FIP Snooping Example
Fibre Channel over Ethernet
Fibre Channel over Ethernet (FCoE) provides a converged Ethernet network that allows the combination
of storage-area network (SAN) and LAN traffic on a Layer 2 link by encapsulating Fibre Channel data into
Ethernet frames.
FCoE works with the Ethernet enhancements provided in data center bridging (DCB) to support lossless
(no-drop) SAN and LAN traffic. In addition, DCB provides flexible bandwidth sharing for different traffic
types, such as LAN and SAN, according to 802.1p priority classes of service. For more information, refer
to the Data Center Bridging (DCB) chapter.
Ensuring Robustness in a Converged Ethernet Network
Fibre Channel networks used for SAN traffic employ switches that operate as trusted devices. End devices
log into the switch to which they are attached in order to communicate with other end devices attached to
the Fibre Channel network. Because Fibre Channel links are point-to-point, a Fibre Channel switch
controls all storage traffic that an end device sends and receives over the network. As a result, the switch
can enforce zoning configurations, ensure that end devices use their assigned addresses, and secure the
network from unauthorized access and denial-of-service attacks.
FIP Snooping | 103
www.dell.com | support.dell.com
To ensure similar Fibre Channel robustness and security with FCoE in an Ethernet cloud network, the
Fibre Channel over Ethernet initialization protocol (FIP) establishes virtual point-to-point links between
FCoE end-devices (server ENodes and target storage devices) and FCoE forwarders (FCFs) over transit
FCoE-enabled bridges.
Ethernet bridges commonly provide access control list (ACLs) that can emulate a point-to-point link by
providing the traffic enforcement required to create a Fibre Channel-level of robustness. In addition, FIP
serves as a Layer 2 protocol to:
•
•
Operate between FCoE end-devices and FCFs over intermediate Ethernet bridges to prevent
unauthorized access to the network and achieve the required security.
Allow transit Ethernet bridges to efficiently monitor FIP frames passing between FCoE end-devices
and an FCF, and use the FIP snooping data to dynamically configure ACLs on the bridge to only
permit traffic authorized by the FCF.
FIP enables FCoE devices to discover one another, initialize and maintain virtual links over an Ethernet
network, and access storage devices in a storage area network. FIP satisfies the Fibre Channel requirement
for point-to-point connections by creating a unique virtual link for each connection between an FCoE
end-device and an FCF via a transit switch.
FIP provides functionality for discovering and logging in to an FCF. After discovering and logging in, FIP
allows FCoE traffic to be sent and received between FCoE end-devices (ENodes) and the FCF. FIP uses its
own EtherType and frame format. Figure 7-1 shows the communication that occurs between an ENode
server and an FCoE switch (FCF).
FIP performs the following functions:
•
•
•
•
104
|
FIP virtual local area network (VLAN) discovery: FCoE devices (ENodes) discover the FCoE VLANs
on which to transmit and receive FIP and FCoE traffic.
FIP discovery: FCoE end-devices and FCFs are automatically discovered.
Initialization: FCoE devices perform fabric login (FLOGI) and fabric discovery (FDISC) to create a
virtual link with an FCoE switch.
Maintenance: A valid virtual link between an FCoE device and an FCoE switch is maintained and the
link termination logout (LOGO) functions properly.
FIP Snooping
Figure 7-1.
FIP discovery and login between an ENode and an FCF
FIP Snooping on Ethernet Bridges
In a converged Ethernet network, intermediate Ethernet bridges can snoop on FIP packets during the login
process on an FCF. Then, using ACLs, a transit bridge can permit only authorized FCoE traffic to be
transmitted between an FCoE end-device and an FCF. An Ethernet bridge that provides these functions is
called a FIP snooping bridge (FSB).
On a FIP snooping bridge, ACLs are created dynamically as FIP login frames are processed. The ACLs are
installed on switch ports configured for the following port modes:
•
•
ENode mode for server-facing ports
FCF mode for a trusted port directly connected to an FCF
You must enable FIP snooping on an Aggregator and configure the FIP snooping parameters. When you
enable FIP snooping, all ports on the switch by default become ENode ports.
FIP Snooping | 105
www.dell.com | support.dell.com
Dynamic ACL generation on an Aggregator operating as a FIP snooping bridge functions as follows:
•
•
•
•
Global ACLs are applied on server-facing ENode ports.
Port-based ACLs are applied on ports directly connected to an FCF and on server-facing ENode ports.
Port-based ACLs take precedence over global ACLs.
FCoE-generated ACLs take precedence over user-configured ACLs. A user-configured ACL entry
cannot deny FCoE and FIP snooping frames.
Figure 7-2 shows an Aggregator used as a FIP snooping bridge in a converged Ethernet network. The ToR
switch operates as an FCF for FCoE traffic. Converged LAN and SAN traffic is transmitted between the
ToR switch and an Aggregator. The Aggregator operates as a lossless FIP snooping bridge to transparently
forward FCoE frames between the ENode servers and the FCF switch.
Figure 7-2.
106
|
FIP Snooping
FIP Snooping on an Aggregator
The following sections describe how to configure the FIP snooping feature on a switch that functions as a
FIP snooping bridge so that it can perform the following functions:
•
•
•
•
•
Perform FIP snooping (allowing and parsing FIP frames) globally on all VLANs or on a per-VLAN
basis.
Set the FCoE MAC address prefix (FC-MAP) value used by an FCF to assign a MAC address to an
FCoE end-device (server ENode or storage device) after a server successfully logs in.
Set the FCF mode to provide additional port security on ports that are directly connected to an FCF.
Check FIP snooping-enabled VLANs to ensure that they are operationally active.
Process FIP VLAN discovery requests and responses, advertisements, solicitations, FLOGI/FDISC
requests and responses, FLOGO requests and responses, keep-alive packets, and clear virtual-link
messages.
FIP Snooping in a Switch Stack
FIP snooping supports switch stacking as follows:
•
•
•
A switch stack configuration is synchronized with the standby stack unit.
Dynamic population of the FCoE database (ENode, Session, and FCF tables) is synchronized with the
standby stack unit. The FCoE database is maintained by snooping FIP keep-alive messages.
In case of a failover, the new master switch starts the required timers for the FCoE database tables.
Timers run only on the master stack unit.
Note: While technically possible to run FIP Snooping and Stacking concurrently, Dell Networking
recommends a SAN design utilize two redundant FCoE network paths versus stacking. This avoids a
single point of failure to the SAN and provides a guaranteed latency. The overall latency could easily rise
above desired SAN limits if a link level failure redirects traffic over the stacking backplane.
How FIP Snooping is Implemented
As soon as the Aggregator is activated in an M1000e chassis as a switch-bridge, existing VLAN-specific
and FIP snooping auto-configurations are applied. The Aggregator snoops FIP packets on VLANs enabled
for FIP snooping and allows legitimate sessions. By default, all FCoE and FIP frames are dropped unless
specifically permitted by existing FIP snooping-generated ACLs.
FIP Snooping | 107
www.dell.com | support.dell.com
FIP Snooping on VLANs
FIP snooping is enabled globally on an Aggregator on all VLANs:
•
•
•
•
FIP frames are allowed to pass through the switch on the enabled VLANs and are processed to
generate FIP snooping ACLs.
FCoE traffic is allowed on VLANs only after a successful virtual-link initialization (fabric login
FLOGI) between an ENode and an FCF. All other FCoE traffic is dropped.
At least one interface is auto-configured for FCF (FIP snooping bridge-FCF) mode on a FIP
snooping-enabled VLAN. Multiple FCF trusted interfaces are auto-configured in a VLAN.
A maximum of eight VLANS are supported for FIP snooping on an Aggregator. FIP snooping
processes FIP packets in traffic only from the first eight incoming VLANs.
FC-MAP Value
The FC-MAP value that is applied globally by the Aggregator on all FCoE VLANs to authorize FCoE
traffic is auto-configured.
The FC-MAP value is used to check the FC-MAP value for the MAC address assigned to ENodes in
incoming FCoE frames. If the FC-MAP value does not match, FCoE frames are dropped. A session
between an ENode and an FCF is established by the switch-bridge only when the FC-MAP value on the
FCF matches the FC-MAP value on the FIP snooping bridge.
Bridge-to-FCF Links
A port directly connected to an FCF is auto-configured in FCF mode. Initially, all FCoE traffic is blocked;
only FIP frames are allowed to pass.
FCoE traffic is allowed on the port only after a successful FLOGI request/response and confirmed use of
the configured FC-MAP value for the VLAN.
Impact on other Software Features
FIP snooping affects other software features on an Aggregator as follows:
•
•
•
108
|
MAC address learning: MAC address learning is not performed on FIP and FCoE frames, which are
denied by ACLs dynamically created by FIP snooping on server-facing ports in ENode mode.
MTU auto-configuration: MTU size is set to mini-jumbo (2500 bytes) when a port is in Switchport
mode, the FIP snooping feature is enabled on the switch, and FIP snooping is enabled on all or
individual VLANs.
Link aggregation group (LAG): FIP snooping is supported on port channels on ports on which PFC
mode is on (PFC is operationally up).
FIP Snooping
FIP Snooping Prerequisites
On an Aggregator, FIP snooping requires the following conditions:
•
•
A FIP snooping bridge requires DCBX and PFC to be enabled on the switch for lossless Ethernet
connections (refer to Data Center Bridging (DCB)). Dell recommends that you also enable ETS; ETS
is recommended but not required.
DCBX and PFC mode are auto-configured on Aggregator ports and FIP snooping is operational on the
port. If the PFC parameters in a DCBX exchange with a peer are not synchronized, FIP and FCoE
frames are dropped on the port.
VLAN membership:
• The Aggregator auto-configures the VLANs which handle FCoE traffic. You can reconfigure
VLAN membership on a port (vlan tagged command).
• Each FIP snooping port is auto-configured to operate in Hybrid mode so that it accepts both tagged
and untagged VLAN frames.
• Tagged VLAN membership is auto-configured on each FIP snooping port that sends and receives
FCoE traffic and has links with an FCF, ENode server, or another FIP snooping bridge.
The default VLAN membership of the port should continue to operate with untagged frames. FIP
snooping is not supported on a port that is configured for non-default untagged VLAN membership.
FIP Snooping Restrictions
The following restrictions apply to FIP snooping on an Aggregator:
•
•
•
•
The maximum number of FCoE VLANs supported on the Aggregator is eight.
The maximum number of FIP snooping sessions (including NPIV sessions) supported per ENode
server is 16.
In a full FCoE N port ID virtualization (NPIV) configuration, 16 sessions (one FLOGI + fifteen NPIV
sessions) are supported per ENode. In an FCoE NPV configuration, only one session is supported per
ENode.
The maximum number of FCFs supported per FIP snooping-enabled VLAN is four.
Links to other FIP snooping bridges on a FIP snooping-enabled port (bridge-to-bridge links) are not
supported on the Aggregator.
FIP Snooping | 109
www.dell.com | support.dell.com
Displaying FIP Snooping Information
Use the show commands in Table 7-1 to display information on FIP snooping.
Table 7-1.
Displaying FIP Snooping Information
Command
Output
show fip-snooping sessions [interface vlan
vlan-id] (Figure 7-3)
Displays information on FIP-snooped sessions on all VLANs or a specified
VLAN, including the ENode interface and MAC address, the FCF
interface and MAC address, VLAN ID, FCoE MAC address and FCoE
session ID number (FC-ID), worldwide node name (WWNN) and the
worldwide port name (WWPN). Information on NPIV sessions is also
displayed.
show fip-snooping config (Figure 7-4)
Displays the FIP snooping status and configured FC-MAP values.
show fip-snooping enode [enode-mac-address]
(Figure 7-5)
Displays information on the ENodes in FIP-snooped sessions, including
the ENode interface and MAC address, FCF MAC address, VLAN ID and
FC-ID.
show fip-snooping fcf [fcf-mac-address]
(Figure 7-6)
Displays information on the FCFs in FIP-snooped sessions, including the
FCF interface and MAC address, FCF interface, VLAN ID, FC-MAP
value, FKA advertisement period, and number of ENodes connected.
clear fip-snooping database interface vlan
Clears FIP snooping information on a VLAN for a specified FCoE MAC
vlan-id {fcoe-mac-address | enode-mac-address address, ENode MAC address, or FCF MAC address, and removes the
corresponding ACLs generated by FIP snooping.
| fcf-mac-address}
Displays statistics on the FIP packets snooped on all interfaces, including
show fip-snooping statistics [interface vlan
vlan-id | interface port-type port/slot | interface VLANs, physical ports, and port channels.
port-channel port-channel-number] (Figure 7-7
and Figure 7-8)
110
|
clear fip-snooping statistics [interface vlan
vlan-id | interface port-type port/slot | interface
port-channel port-channel-number]
Clears the statistics on the FIP packets snooped on all VLANs, a specified
VLAN, or a specified port interface.
show fip-snooping system (Figure 7-9)
Display information on the status of FIP snooping on the switch (enabled
or disabled), including the number of FCoE VLANs, FCFs, ENodes, and
currently active sessions.
show fip-snooping vlan (Figure 7-10)
Display information on the FCoE VLANs on which FIP snooping is
enabled.
FIP Snooping
Figure 7-3.
show fip-snooping sessions Command Example
FTOS#show fip-snooping sessions
Enode MAC
Enode Intf
aa:bb:cc:00:00:00
Te 0/42
aa:bb:cc:00:00:00
Te 0/42
aa:bb:cc:00:00:00
Te 0/42
aa:bb:cc:00:00:00
Te 0/42
aa:bb:cc:00:00:00
Te 0/42
FCoE MAC
0e:fc:00:01:00:01
0e:fc:00:01:00:02
0e:fc:00:01:00:03
0e:fc:00:01:00:04
0e:fc:00:01:00:05
Table 7-2.
FC-ID
01:00:01
01:00:02
01:00:03
01:00:04
01:00:05
FCF MAC
aa:bb:cd:00:00:00
aa:bb:cd:00:00:00
aa:bb:cd:00:00:00
aa:bb:cd:00:00:00
aa:bb:cd:00:00:00
FCF Intf
Te 0/43
Te 0/43
Te 0/43
Te 0/43
Te 0/43
Port WWPN
31:00:0e:fc:00:00:00:00
41:00:0e:fc:00:00:00:00
41:00:0e:fc:00:00:00:01
41:00:0e:fc:00:00:00:02
41:00:0e:fc:00:00:00:03
VLAN
100
100
100
100
100
Port WWNN
21:00:0e:fc:00:00:00:00
21:00:0e:fc:00:00:00:00
21:00:0e:fc:00:00:00:00
21:00:0e:fc:00:00:00:00
21:00:0e:fc:00:00:00:00
show fip-snooping sessions Command Description
Field
Description
ENode MAC
MAC address of the ENode.
ENode Interface
Slot/ port number of the interface connected to the ENode.
FCF MAC
MAC address of the FCF.
FCF Interface
Slot/ port number of the interface to which the FCF is connected.
VLAN
VLAN ID number used by the session.
FCoE MAC
MAC address of the FCoE session assigned by the FCF.
FC-ID
Fibre Channel ID assigned by the FCF.
Port WWPN
Worldwide port name of the CNA port.
Port WWNN
Worldwide node name of the CNA port.
Figure 7-4.
show fip-snooping config Command Example
FTOS# show fip-snooping config
FIP Snooping Feature enabled Status: Enabled
FIP Snooping Global enabled Status: Enabled
Global FC-MAP Value: 0X0EFC00
FIP Snooping enabled VLANs
VLAN
Enabled
FC-MAP
----------------100
TRUE
0X0EFC00
FIP Snooping | 111
www.dell.com | support.dell.com
Figure 7-5.
show fip-snooping enode Command Example
FTOS# show fip-snooping enode
Enode MAC
Enode Interface
----------------------d4:ae:52:1b:e3:cd
Te 0/11
Table 7-3.
FCF MAC
------54:7f:ee:37:34:40
Description
ENode MAC
MAC address of the ENode.
ENode Interface
Slot/ port number of the interface connected to the ENode.
FCF MAC
MAC address of the FCF.
VLAN
VLAN ID number used by the session.
FC-ID
Fibre Channel session ID assigned by the FCF.
show fip-snooping fcf Command Example
FTOS# show fip-snooping fcf
FCF MAC
FCF Interface
------------------54:7f:ee:37:34:40
Po 22
Table 7-4.
VLAN
---100
FC-MAP
-----0e:fc:00
FKA_ADV_PERIOD
-------------4000
No. of Enodes
------------2
show fip-snooping fcf Command Description
Field
|
FC-ID
----62:00:11
show fip-snooping enode Command Description
Field
Figure 7-6.
112
VLAN
---100
Description
FCF MAC
MAC address of the FCF.
FCF Interface
Slot/port number of the interface to which the FCF is connected.
VLAN
VLAN ID number used by the session.
FC-MAP
FC-Map value advertised by the FCF.
ENode Interface
Slot/ number of the interface connected to the ENode.
FKA_ADV_PERIOD
Period of time (in milliseconds) during which FIP keep-alive advertisements
are transmitted.
No of ENodes
Number of ENodes connected to the FCF.
FC-ID
Fibre Channel session ID assigned by the FCF.
FIP Snooping
Figure 7-7.
show fip-snooping statistics (VLAN and port) Command Example
FTOS# show fip-snooping statistics interface vlan 100
Number of Vlan Requests
Number of Vlan Notifications
Number of Multicast Discovery Solicits
Number of Unicast Discovery Solicits
Number of FLOGI
Number of FDISC
Number of FLOGO
Number of Enode Keep Alive
Number of VN Port Keep Alive
Number of Multicast Discovery Advertisement
Number of Unicast Discovery Advertisement
Number of FLOGI Accepts
Number of FLOGI Rejects
Number of FDISC Accepts
Number of FDISC Rejects
Number of FLOGO Accepts
Number of FLOGO Rejects
Number of CVL
Number of FCF Discovery Timeouts
Number of VN Port Session Timeouts
Number of Session failures due to Hardware Config
FTOS(conf)#
:0
:0
:2
:0
:2
:16
:0
:9021
:3349
:4437
:2
:2
:0
:16
:0
:0
:0
:0
:0
:0
:0
FTOS# show fip-snooping statistics int tengigabitethernet 0/11
Number of Vlan Requests
:1
Number of Vlan Notifications
:0
Number of Multicast Discovery Solicits
:1
Number of Unicast Discovery Solicits
:0
Number of FLOGI
:1
Number of FDISC
:16
Number of FLOGO
:0
Number of Enode Keep Alive
:4416
Number of VN Port Keep Alive
:3136
Number of Multicast Discovery Advertisement
:0
Number of Unicast Discovery Advertisement
:0
Number of FLOGI Accepts
:0
Number of FLOGI Rejects
:0
Number of FDISC Accepts
:0
Number of FDISC Rejects
:0
Number of FLOGO Accepts
:0
Number of FLOGO Rejects
:0
Number of CVL
:0
Number of FCF Discovery Timeouts
:0
Number of VN Port Session Timeouts
:0
Number of Session failures due to Hardware Config
:0
FIP Snooping | 113
www.dell.com | support.dell.com
Figure 7-8.
114
show fip-snooping statistics (port channel) Command Example
FTOS# show fip-snooping statistics interface port-channel 22
Number of Vlan Requests
:0
Number of Vlan Notifications
:2
Number of Multicast Discovery Solicits
:0
Number of Unicast Discovery Solicits
:0
Number of FLOGI
:0
Number of FDISC
:0
Number of FLOGO
:0
Number of Enode Keep Alive
:0
Number of VN Port Keep Alive
:0
Number of Multicast Discovery Advertisement
:4451
Number of Unicast Discovery Advertisement
:2
Number of FLOGI Accepts
:2
Number of FLOGI Rejects
:0
Number of FDISC Accepts
:16
Number of FDISC Rejects
:0
Number of FLOGO Accepts
:0
Number of FLOGO Rejects
:0
Number of CVL
:0
Number of FCF Discovery Timeouts
:0
Number of VN Port Session Timeouts
:0
Number of Session failures due to Hardware Config
:0
|
FIP Snooping
Table 7-5.
show fip-snooping statistics Command Descriptions
Field
Description
Number of Vlan Requests
Number of FIP-snooped VLAN request frames received on the interface.
Number of VLAN Notifications
Number of FIP-snooped VLAN notification frames received on the interface.
Number of Multicast Discovery
Solicits
Number of FIP-snooped multicast discovery solicit frames received on the
interface.
Number of Unicast Discovery
Solicits
Number of FIP-snooped unicast discovery solicit frames received on the
interface.
Number of FLOGI
Number of FIP-snooped FLOGI request frames received on the interface.
Number of FDISC
Number of FIP-snooped FDISC request frames received on the interface.
Number of FLOGO
Number of FIP-snooped FLOGO frames received on the interface.
Number of ENode Keep Alives
Number of FIP-snooped ENode keep-alive frames received on the interface.
Number of VN Port Keep Alives
Number of FIP-snooped VN port keep-alive frames received on the interface.
Number of Multicast Discovery
Advertisements
Number of FIP-snooped multicast discovery advertisements received on the
interface.
Number of Unicast Discovery
Advertisements
Number of FIP-snooped unicast discovery advertisements received on the
interface.
Number of FLOGI Accepts
Number of FIP FLOGI accept frames received on the interface.
Number of FLOGI Rejects
Number of FIP FLOGI reject frames received on the interface.
Number of FDISC Accepts
Number of FIP FDISC accept frames received on the interface.
Number of FDISC Rejects
Number of FIP FDISC reject frames received on the interface.
Number of FLOGO Accepts
Number of FIP FLOGO accept frames received on the interface.
Number of FLOGO Rejects
Number of FIP FLOGO reject frames received on the interface.
Number of CVLs
Number of FIP clear virtual link frames received on the interface.
Number of FCF Discovery
Timeouts
Number of FCF discovery timeouts that occurred on the interface.
Number of VN Port Session
Timeouts
Number of VN port session timeouts that occurred on the interface.
Number of Session failures due
to Hardware Config
Number of session failures due to hardware configuration that occurred on the
interface.
FIP Snooping | 115
www.dell.com | support.dell.com
Figure 7-9.
show fip-snooping system Command Example
FTOS# show fip-snooping system
Global Mode
FCOE VLAN List (Operational)
FCFs
Enodes
Sessions
:
:
:
:
:
Enabled
1, 100
1
2
17
Note: NPIV sessions are included in the number of FIP-snooped sessions displayed.
Figure 7-10. show fip-snooping vlan Command Example
FTOS# show fip-snooping vlan
* = Default VLAN
VLAN
---*1
100
FC-MAP
-----0X0EFC00
FCFs
---1
Enodes
-----2
Sessions
-------17
Note: NPIV sessions are included in the number of FIP-snooped sessions displayed.
Raja: Can be re
116
|
FIP Snooping
FIP Snooping Example
Figure 7-11 shows an Aggregator used as a FIP snooping bridge for FCoE traffic between an ENode
(server blade) and an FCF (ToR switch). The ToR switch operates as an FCF and FCoE gateway.
Figure 7-11.
Example: FIP Snooping on an Aggregator
In Figure 7-11, DCBX and PFC are enabled on the Aggregator (FIP snooping bridge) and on the FCF ToR
switch. On the FIP snooping bridge, DCBX is configured as follows:
•
•
A server-facing port is configured for DCBX in an auto-downstream role.
An FCF-facing port is configured for DCBX in an auto-upstream or configuration-source role.
The DCBX configuration on the FCF-facing port is detected by the server-facing port and the DCB PFC
configuration on both ports is synchronized. For more information about how to configure DCBX and PFC
on a port, refer to FIP Snooping.
After FIP packets are exchanged between the ENode and the switch, a FIP snooping session is established.
ACLS are dynamically generated for FIP snooping on the FIP snooping bridge/switch.
FIP Snooping | 117
www.dell.com | support.dell.com
Debugging FIP Snooping
To enable debug messages for FIP snooping events, enter the debug fip-snooping command.
Task
Command
Command Mode
Enable FIP snooping debugging on for all or a
specified event type, where:
all enables all debugging options.
acl enables debugging only for ACL-specific events.
error enables debugging only for error conditions.
ifm enables debugging only for IFM events.
info enables debugging only for information events.
ipc enables debugging only for IPC events.
rx enables debugging only for incoming packet
traffic.
debug fip-snooping [all | acl | error |
ifm | info | ipc | rx]
EXEC PRIVILEGE
To turn off debugging event messages, enter the no debug fip-snooping command.
118
|
FIP Snooping
8
Internet Group Management Protocol (IGMP)
On an Aggregator, IGMP snooping is auto-configured. You can display information on IGMP by using
show commands.
Multicast is based on identifying many hosts by a single destination IP address. Hosts represented by the
same IP address are a multicast group. The internet group management protocol (IGMP) is a Layer 3
multicast protocol that hosts use to join or leave a multicast group. Multicast routing protocols (such as
protocol-independent multicast [PIM]) use the information in IGMP messages to discover which groups
are active and to populate the multicast routing table.
This chapter contains the following sections:
•
•
IGMP Overview
IGMP Snooping
IGMP Overview
IGMP has three versions. Version 3 obsoletes and is backwards-compatible with version 2; version 2
obsoletes version 1.
IGMP Version 2
IGMP version 2 improves upon version 1 by specifying IGMP Leave messages, which allows hosts to
notify routers that they no longer care about traffic for a particular group. Leave messages reduce the
amount of time that the router takes to stop forwarding traffic for a group to a subnet (leave latency) after
the last host leaves the group. In version 1 hosts quietly leave groups, and the router waits for a query
response timer several times the value of the query interval to expire before it stops forwarding traffic.
To receive multicast traffic from a particular source, a host must join the multicast group to which the
source is sending traffic. A host that is a member of a group is called a “receiver.” A host may join many
groups, and may join or leave any group at any time. A host joins and leaves a multicast group by sending
an IGMP message to its IGMP querier. The querier is the router that surveys a subnet for multicast
receivers and processes survey responses to populate the multicast routing table.
IGMP messages are encapsulated in IP packets (Figure 8-1).
Internet Group Management Protocol (IGMP) | 119
www.dell.com | support.dell.com
Figure 8-1.
IGMP Version 2 Packet Format
Preamble
IHL
Version
(4)
TOS
(0xc0)
Total Length
Start Frame
Delimiter
Destination MAC
Flags
Frag Offset
Source MAC
TTL
(1)
Protocol
(2)
Padding
IP Packet
Ethernet Type
Header
Checksum
Src IP Addr
Dest IP Addr
FCS
Options
(Router Alert)
Type
Padding
Max. Response
Time
8 bits
Code: 0x11:
0x12:
0x16:
0x17:
Membership Query
IGMP version 1 Membership Report
IGMP version 2 Membership Report
IGMP Leave Group
IGMP Packet
Checksum
Group Address
16 bits
May be zero and ignored by hosts for
general queries or contain a group
address for group-specific queries
fnC0069mp
Joining a Multicast Group
There are two ways that a host may join a multicast group: it may respond to a general query from its
querier, or it may send an unsolicited report to its querier.
•
•
Responding to an IGMP Query
• One router on a subnet is elected as the querier. The querier periodically multicasts (to
all-multicast-systems address 224.0.0.1) a general query to all hosts on the subnet.
• A host that wants to join a multicast group responds with an IGMP membership report that
contains the multicast address of the group it wants to join (the packet is addressed to the same
group). If multiple hosts want to join the same multicast group, only the report from the first host
to respond reaches the querier, and the remaining hosts suppress their responses (for how the delay
timer mechanism works, refer to IGMP Snooping).
• The querier receives the report for a group and adds the group to the list of multicast groups
associated with its outgoing port to the subnet. Multicast traffic for the group is then forwarded to
that subnet.
Sending an Unsolicited IGMP Report
• A host does not have to wait for a general query to join a group. It may send an unsolicited IGMP
membership report, also called an IGMP Join message, to the querier.
Leaving a Multicast Group
•
•
•
120
|
A host sends a membership report of type 0x17 (IGMP Leave message) to the all routers multicast
address 224.0.0.2 when it no longer cares about multicast traffic for a particular group.
The querier sends a group-specific query to determine whether there are any remaining hosts in the
group. There must be at least one receiver in a group on a subnet for a router to forward multicast
traffic for that group to the subnet.
Any remaining hosts respond to the query according to the delay timer mechanism (refer to IGMP
Snooping). If no hosts respond (because there are none remaining in the group), the querier waits a
specified period and sends another query. If it still receives no response, the querier removes the group
from the list associated with forwarding port and stops forwarding traffic for that group to the subnet.
Internet Group Management Protocol (IGMP)
IGMP Version 3
Conceptually, IGMP version 3 behaves the same as version 2. However, there are differences:
•
Version 3 adds the ability to filter by multicast source, which helps the multicast routing protocols
avoid forwarding traffic to subnets where there are no interested receivers.
To enable filtering, routers must keep track of more state information, that is, the list of sources that
must be filtered. An additional query type, the group-and-source-specific query, keeps track of state
changes, while the group-specific and general queries still refresh existing state.
Reporting is more efficient and robust. Hosts do not suppress query responses (non-suppression helps
track state and enables the immediate-leave and IGMP snooping features), state-change reports are
retransmitted to insure delivery, and a single membership report bundles multiple statements from a
single host, rather than sending an individual packet for each statement.
•
•
To accommodate these protocol enhancements, the IGMP version 3 packet structure is different from
version 2. Queries (Figure 8-2) are still sent to the all-systems address 224.0.0.1, but reports (Figure 8-3)
are sent to all the IGMP version 3-capable multicast routers address 244.0.0.22.
Figure 8-2.
IGMP version 3 Membership Query Packet Format
Max. Response
Code
Type
(0x11)
Checksum
Group Address
Reserved
Version
(4)
IHL
Source addresses to be
filtered
Query Interval derived
from this value
Number of times that a
router or receiver transmits
a query or report to insure
that it is received
Code: 0x11: Membership Query
Source Addresses
Number of
Sources
Querier's Query
Interval Code
Querier Robustness
Value
(2)
Bit flag that when set to
1 suppresses router query
response timer updates
Maximum Response Time
derived from this value
Figure 8-3.
S
Number of source addresses
to be filtered
fnC0070mp
IGMP version 3 Membership Report Packet Format
TOS
(0xc0)
Total Length
Flags
Frag Offset
TTL
(1)
Protocol
(2)
Header
Checksum
Type
Reserved
Src IP Addr
Checksum
Dest IP Addr
(224.0.0.22)
Options
(Router Alert)
Reserved
IGMP Packet
Padding
Number of Group
Records
Group Record 1
Group Record 2
Group Record N
Value used by IGMP to calculate
multicast reception state
Record Type
0x12: IGMP version 1 Membership Report
0x16: IGMP version 2 Membership Report
0x17: IGMP Leave Group
0x22: IGMP version 3 Membership Report
Auxiliary Data
Length
(0)
Length of Auxiliary
Data field
Number of
Sources
Multicast Address
Source
Addresses
Group address to which
the group record pertains
Number of source addresses
Range: 1-6
to be filtered
Code: 1: Current state is Include
2: Current state is Exclude
3: State change to Include
4: State change to Exclude
5: Allow new sources and no state change
6: Block old sources and no state change
Auxiliary Data
None defined in RFC 3376
Source addresses
to be filtered
fnC0071mp
Internet Group Management Protocol (IGMP) | 121
www.dell.com | support.dell.com
Joining and Filtering Groups and Sources
Figure 8-4 shows how multicast routers maintain the group and source information from unsolicited
reports.
1. The first unsolicited report from the host indicates that it wants to receive traffic for group 224.1.1.1.
2. The host’s second report indicates that it is only interested in traffic from group 224.1.1.1, source
10.11.1.1. Include messages prevent traffic from all other sources in the group from reaching the
subnet, so before recording this request, the querier sends a group-and-source query to verify that there
are no hosts interested in any other sources. The multicast router must satisfy all hosts if they have
conflicting requests. For example, if another host on the subnet is interested in traffic from 10.11.1.3,
the router cannot record the include request. There are no other interested hosts, so the request is
recorded. At this point, the multicast routing protocol prunes the tree to all but the specified sources.
3. The host’s third message indicates that it is only interested in traffic from sources 10.11.1.1 and
10.11.1.2. Because this request again prevents all other sources from reaching the subnet, the router
sends another group-and-source query so that it can satisfy all other hosts. There are no other interested
hosts, so the request is recorded.
Figure 8-4.
IGMP Membership Reports: Joining and Filtering
Membership Reports: Joining and Filtering
3
Interface Multicast Group Filter Source Source
Address Timer Mode
Timer
1/1
224.1.1.1 GMI Exclude
None
1/1
224.1.1.1
Include
10.11.1.1 GMI
1/1
224.1.1.1
Include
10.11.1.1 GMI
IGMP Group-and-Source
Specific Query
Non-Querier
Querier
Type: 0x11
Group Address: 244.1.1.1
Number of Sources: 1
Source Address: 10.11.1.1
1/1
10.11.1.2 GMI
2
Change to Include
Type: 0x22
Number of Group Records: 1
Record Type: 3
Number of Sources: 1
Multicast Address: 224.1.1.1
Source Address: 10.11.1.1
State-change reports retransmitted
Query Robustness Value-1 times at
Unsolicited Report Interval
Type: 0x22
Number of Group Records: 1
Record Type: 4
Number of Sources: 0
Multicast Address: 224.1.1.1
Type: 0x22
Number of Group Records: 1
Record Type: 5
Number of Sources: 1
Multicast Address: 224.1.1.1
Source Address: 10.11.1.2
IGMP Join message
Allow New
4
fnC0072mp
122
|
Internet Group Management Protocol (IGMP)
1
Leaving and Staying in Groups
Figure 8-5 shows how multicast routers track and refresh state changes in response to group-and-specific
and general queries.
1. Host 1 sends a message indicating it is leaving group 224.1.1.1 and that the included filter for 10.11.1.1
and 10.11.1.2 are no longer necessary.
2. The querier, before making any state changes, sends a group-and-source query to see if any other host
is interested in these two sources; queries for state-changes are retransmitted multiple times. If any are
interested, they respond with their current state information and the querier refreshes the relevant state
information.
3. Separately in Figure 8-5, the querier sends a general query to 224.0.0.1.
4. Host 2 responds to the periodic general query so the querier refreshes the state information for that
group.
Figure 8-5.
IGMP Membership Queries: Leaving and Staying in Groups
Membership Queries: Leaving and Staying
Non-Querier
Querier
Interface Multicast Group Filter Source Source
Address Timer Mode
Timer
1/1
224.1.1.1
Include
10.11.1.1 LQMT
10.11.1.2 LQMT
Non-querier builds identical table
and waits Other Querier Present
Interval to assume Querier role
1/1
2/1
224.2.2.2 GMI Exclude None
IGMP Group-and-Source
Specific Query
Type: 0x11
Group Address: 224.1.1.1
Number of Sources: 2
Source Address: 10.11.1.1, 10.11.1.2
1
2
Queries retransmitted Last Member
Query Count times at Last Member
Query Interval
Type: 0x17
Number of Group Records: 1
Record Type: 6
Number of Sources: 2
Multicast Address: 224.1.1.1
Source Addresses: 10.11.1.1, 10.11.1.2
3
Type: 0x11
Group Address: 224.0.0.1
Number of Sources: 0
Type: 0x22
Number of Group Records: 1
Record Type: 2
Number of Sources: 0
Multicast Address: 224.2.2.2
4
IGMP General
Membership Query
IGMP Membership Report
IGMP Leave message
Host 1
Host 2
IGMP Snooping
IGMP snooping is auto-configured on an Aggregator.
Multicast packets are addressed with multicast MAC addresses, which represent a group of devices rather
than one unique device. Switches forward multicast frames out of all ports in a VLAN by default, even if
there are only a small number of interested hosts, resulting in a waste of bandwidth. IGMP snooping
enables switches to use information in IGMP packets to generate a forwarding table that associates ports
with multicast groups so that received multicast frames are forwarded only to interested receivers.
Internet Group Management Protocol (IGMP) | 123
www.dell.com | support.dell.com
How IGMP Snooping is Implemented on an Aggregator
•
•
•
•
•
•
•
•
•
•
IGMP snooping is enabled by default on the switch.
FTOS supports version 1, version 2, and version 3 hosts.
FTOS IGMP snooping is based on the IP multicast address (not on the Layer 2 multicast MAC
address). IGMP snooping entries are stored in the Layer 3 flow table instead of in the Layer 2
forwarding information base (FIB).
FTOS IGMP snooping is based on draft-ietf-magma-snoop-10.
IGMP snooping is supported on all M I/O Aggregator stack members.
A maximum of 8k groups and 4k virtual local area networks (VLAN) are supported.
IGMP snooping is not supported on the default VLAN interface.
Flooding of unregistered multicast traffic is enabled by default.
Queries are not accepted from the server side ports and are only accepted from the uplink LAG.
Reports and Leaves are flooded by default to the uplink LAG irrespective of whether it is an mrouter
port or not.
Disabling Multicast Flooding
If the switch receives a multicast packet that has an IP address of a group it has not learned (unregistered
frame), the switch floods that packet out of all ports on the VLAN. To disable multicast flooding on all
VLAN ports, enter the no ip igmp snooping flood command in global configuration mode.
When multicast flooding is disabled, unregistered multicast data traffic is forwarded to only multicast
router ports on all VLANs. If there is no multicast router port in a VLAN, unregistered multicast data
traffic is dropped.
Displaying IGMP Information
Use the show commands in Table 8-1 to display information on IGMP. If you specify a group address or
interface:
• Enter a group address in dotted decimal format; for example, 225.0.0.0.
• Enter an interface in one of the following formats: tengigabitethernet slot/port,
port-channel port-channel-number, or vlan vlan-number.
Table 8-1.
Displaying IGMP Information
Command
Output
show ip igmp groups [group-address [detail] |
detail | interface [group-address [detail]]
(Figure 8-6)
Displays information on IGMP groups.
show ip igmp interface [interface] (Figure 8-7)
Displays IGMP information on IGMP-enabled interfaces.
show ip igmp snooping mrouter [vlan
vlan-number] (Figure 8-8)
Displays information on IGMP-enabled multicast router (mrouter)
interfaces.
clear ip igmp groups [group-address | interface] Clears IGMP information for group addresses and IGMP-enabled
interfaces.
124
|
Internet Group Management Protocol (IGMP)
Figure 8-6.
show ip igmp groups Command Example
FTOS# show ip igmp groups
Total Number of Groups: 2
IGMP Connected Group Membership
Group Address
Interface
226.0.0.1
Vlan 1500
226.0.0.1
Vlan 1600
FTOS#show ip igmp groups detail
Interface
Group
Uptime
Expires
Router mode
Last reporter
Last reporter mode
Last report received
Group source list
Source address
1.1.1.2
Member Ports: Po 1
Vlan 1500
226.0.0.1
00:00:21
Never
INCLUDE
1.1.1.2
INCLUDE
IS_INCL
Interface
Group
Uptime
Expires
Router mode
Last reporter
Last reporter mode
Last report received
Group source list
Source address
1.1.1.2
Member Ports: Po 1
FTOS#
Vlan 1600
226.0.0.1
00:00:04
Never
INCLUDE
1.1.1.2
INCLUDE
IS_INCL
Mode
INCLUDE
INCLUDE
Uptime
00:00:21
Expires
00:01:48
Uptime
00:00:04
Expires
00:02:05
Uptime
Expires
00:00:19 Never
00:00:02 Never
Last Reporter
1.1.1.2
1.1.1.2
Internet Group Management Protocol (IGMP) | 125
www.dell.com | support.dell.com
Figure 8-7.
show ip igmp interface Command Example
FTOS# show ip igmp interface
Vlan 2 is up, line protocol is down
Inbound IGMP access group is not set
Interface IGMP group join rate limit is not set
IGMP snooping is enabled on interface
IGMP Snooping query interval is 60 seconds
IGMP Snooping querier timeout is 125 seconds
IGMP Snooping last member query response interval is 1000 ms
IGMP snooping fast-leave is disabled on this interface
IGMP snooping querier is disabled on this interface
Vlan 3 is up, line protocol is down
Inbound IGMP access group is not set
Interface IGMP group join rate limit is not set
IGMP snooping is enabled on interface
IGMP Snooping query interval is 60 seconds
IGMP Snooping querier timeout is 125 seconds
IGMP Snooping last member query response interval is 1000 ms
IGMP snooping fast-leave is disabled on this interface
IGMP snooping querier is disabled on this interface
--More--
Figure 8-8.
show ip igmp snooping mrouter Command Example
"FTOS# show ip igmp snooping mrouter
Interface Router Ports
Vlan 1000 Po 128
FTOS#
126
|
Internet Group Management Protocol (IGMP)
9
Interfaces
This chapter describes the auto-configuration of 1 Gigabit (1GbE) and 10 Gigabit Ethernet (10GbE)
interfaces (physical and logical) on an I/O Aggregator.
Basic Interface Configuration:
•
•
•
•
•
•
•
•
Interface Auto-Configuration
Interface Types
Viewing Interface Information
Disabling and Re-enabling a Physical Interface
Layer 2 Mode
Management Interfaces
VLAN Membership
Port Channel Interfaces
Advanced Interface Configuration:
•
•
•
•
•
Monitor and Maintain Interfaces
Flow Control Using Ethernet Pause Frames
MTU Size
Auto-Negotiation on Ethernet Interfaces
Viewing Interface Information
Interfaces | 127
www.dell.com | support.dell.com
Interface Auto-Configuration
An Aggregator auto-configures interfaces as follows:
•
•
•
•
All interfaces operate as layer 2 interfaces at 10GbE in standalone mode. FlexIO module interfaces
support only uplink connections. You can only use the 40GbE ports on the base module for stacking.
• By default, the two fixed 40GbE ports on the base module operate in 4x10GbE mode with
breakout cables and support up to eight 10GbE uplinks. You can configure the base-module ports
as 40GbE links for stacking.
• The interfaces on a 40GbE QSFP+ FlexIO module auto-configure to support only 10GbE SFP+
connections using 4x10GbE breakout cables.
All 10GbE uplink interfaces belong to the same 10GbE link aggregation group (LAG).
• The tagged Virtual Local Area Network (VLAN) membership of the uplink LAG is automatically
configured based on the VLAN configuration of all server-facing ports (ports 1 to 32). The
untagged VLAN used for the uplink LAG is always the default VLAN 1.
• The tagged VLAN membership of a server-facing LAG is automatically configured based on the
server-facing ports that are members of the LAG. The untagged VLAN of a server-facing LAG is
auto-configured based on the untagged VLAN to which the lowest numbered server-facing port in
the LAG belongs.
All interfaces are auto-configured as members of all (4094) VLANs and untagged VLAN 1. All
VLANs are up and can send or receive layer 2 traffic. You can use the Command Line Interface (CLI)
or CMC interface to configure only the required VLANs on a port interface.
Aggregator ports are numbered 1 to 56. Ports 1 to 32 are internal server-facing interfaces. Ports 33 to
56 are external ports numbered from the bottom to the top of the Aggregator. For port numbering of
Aggregator interfaces in standalone and stacking mode, Refer to Figure 3-2.
Interface Types
The following interface types are supported on an Aggregator.
128
|
Interface Type
Supported
Modes
Default Mode
Requires
Creation
Default State
Physical
L2
10GbE uplink
No
No Shutdown (enabled)
Management
L3
L3
No
No Shutdown (enabled)
Port Channel
L2
L2
No
L2 - No Shutdown (enabled)
Default VLAN
L2 and L3
L2 and L3
(VLAN 1)
No
L2 - No Shutdown (enabled)
L3 - No Shutdown (enabled)
Non-default VLANs
(VLANs 2 - 4094)
L2 and L3
L2 and L3
Yes
L2 - No Shutdown (enabled)
L3 - No Shutdown (enabled)
Interfaces
Viewing Interface Information
To view interface status and auto-configured parameters use show commands.
The show interfaces command in EXEC mode lists all configurable interfaces on the chassis and has options
to display the interface status, IP and MAC addresses, and multiple counters for the amount and type of
traffic passing through the interface. If you configure a port channel interface, the show interfaces command
lists the interfaces configured in the port channel.
Note: To end output from the system, such as the output from the show interfaces command, enter
CTRL+C and the Dell Networking operating system (FTOS) returns to the command prompt.
Note: The CLI output may be incorrectly displayed as 0 (zero) for the Rx/Tx power values. Perform an
simple network management protocol (SNMP) query to obtain the correct power information.
Figure 9-1 shows the configuration and status information for one interface.
Figure 9-1.
show interfaces Command Example (Partial)
FTOS#show interface tengig 1/16
TenGigabitEthernet 1/16 is up, line protocol is up
Hardware is DellForce10Eth, address is 00:01:e8:00:ab:01
Current address is 00:01:e8:00:ab:01
Server Port AdminState is Up
Pluggable media not present
Interface index is 71635713
Internet address is not set
Mode of IP Address Assignment : NONE
DHCP Client-ID :tenG2730001e800ab01
MTU 12000 bytes, IP MTU 11982 bytes
LineSpeed 1000 Mbit
Flowcontrol rx off tx off
ARP type: ARPA, ARP Timeout 04:00:00
Last clearing of "show interface" counters 11:04:02
Queueing strategy: fifo
Input Statistics:
0 packets, 0 bytes
0 64-byte pkts, 0 over 64-byte pkts, 0 over 127-byte pkts
0 over 255-byte pkts, 0 over 511-byte pkts, 0 over 1023-byte pkts
0 Multicasts, 0 Broadcasts
0 runts, 0 giants, 0 throttles
0 CRC, 0 overrun, 0 discarded
Output Statistics:
14856 packets, 2349010 bytes, 0 underruns
0 64-byte pkts, 4357 over 64-byte pkts, 8323 over 127-byte pkts
2176 over 255-byte pkts, 0 over 511-byte pkts, 0 over 1023-byte pkts
12551 Multicasts, 2305 Broadcasts, 0 Unicasts
0 throttles, 0 discarded, 0 collisions, 0 wreddrops
Rate info (interval 299 seconds):
Input 00.00 Mbits/sec,
0 packets/sec, 0.00% of line-rate
Output 00.00 Mbits/sec,
0 packets/sec, 0.00% of line-rate
Time since last interface status change: 11:01:23
Interfaces | 129
www.dell.com | support.dell.com
To view which interfaces are enabled for Layer 3 data transmission use the show ip interfaces brief command
in EXEC Privilege mode. In Figure 9-2, the TenGigabitEthernet interface 1/5 is in Layer 3 mode because
an IP address has been assigned to it and the interface’s status is operationally up.
Figure 9-2.
show ip interfaces brief Command Example (Partial)
FTOS#show ip interface brief
Interface
IP-Address
TenGigabitEthernet 1/1
unassigned
TenGigabitEthernet 1/2
unassigned
TenGigabitEthernet 1/3
unassigned
TenGigabitEthernet 1/4
unassigned
TenGigabitEthernet 1/5
unassigned
TenGigabitEthernet 1/6
unassigned
TenGigabitEthernet 1/7
unassigned
TenGigabitEthernet 1/8
unassigned
TenGigabitEthernet 1/9
unassigned
--More--
OK
NO
NO
NO
NO
YES
NO
NO
NO
NO
Method
None
None
None
None
None
None
None
None
None
Status
up
up
up
up
up
up
up
up
up
Protocol
down
down
down
down
up
down
down
down
down
To view only configured interfaces use the show interfaces configured command in EXEC Privilege mode.
To determine which physical interfaces are available, use the show running-config command in EXEC mode.
This command displays all physical interfaces available on the switch (Figure 9-3).
Figure 9-3.
show running-config Command Example (Partial)
FTOS#show running config
Current Configuration ...
! Version E8-3-17-38
! Last configuration change at Tue Jul 24 20:48:55 2012 by default
!
boot system stack-unit 1 primary tftp://10.11.9.21/dv-m1000e-2-b2
boot system stack-unit 1 default system: A:
boot system gateway 10.11.209.62
!
redundancy auto-synchronize full
!
service timestamps log datetime
!
hostname FTOS
!
username root password 7 d7acc8a1dcd4f698 privilege 15
mac-address-table aging-time 300
!
stack-unit 1 provision I/O-Aggregator
!
stack-unit 1 port 33 portmode quad
!
stack-unit 1 port 37 portmode quad
--More--
130
|
Interfaces
Disabling and Re-enabling a Physical Interface
By default, all port interfaces on an Aggregator are operationally enabled (no shutdown) to send and
receive Layer 2 traffic. You can reconfigure a physical interface to shut it down by entering the shutdown
command. To re-enable the interface, enter the no shutdown command.
Step
1
2
Command Syntax
Command Mode
Purpose
interface interface
CONFIGURATION
Enter the keyword interface followed by the type of interface and
slot/port information:
• For a 10GbE interface, enter the keyword TenGigabitEthernet
followed by the slot/port numbers; for example, interface
tengigabitethernet 0/56.
• For the management interface on a stack-unit, enter the
keyword ManagementEthernet followed by the slot/port
numbers; for example, interface managementethernet 0/33.
shutdown
INTERFACE
Enter the shutdown command to disable the interface.
To confirm that the interface is enabled, use the show config command in INTERFACE mode.
To leave INTERFACE mode, use the exit command or end command.
You cannot delete a physical interface.
The management IP address on the D-fabric provides a dedicated management access to the system.
The switch interfaces support Layer 2 and Layer 3 traffic over the 100/1000/10000, 10-Gigabit, and
40-Gigabit Ethernet interfaces. These interfaces can also become part of virtual interfaces such as VLANs
or port channels.
For more information about VLANs, refer to VLANs and Port Tagging. For more information about port
channels, refer to Port Channel Interfaces.
FTOS Behavior: The Aggregator uses a single MAC address for all physical interfaces.
Interfaces | 131
www.dell.com | support.dell.com
Layer 2 Mode
On an Aggregator, physical interfaces, port channels, and VLANs auto-configure to operate in Layer 2
mode. Figure 9-4 shows the basic configuration found in a Layer 2 interface.
Note: Layer 3 (network) mode is not supported on Aggregator physical interfaces, port channels, and
VLANs. Only management interfaces operate in Layer 3 mode.
Figure 9-4.
show config Command Example of a Layer 2 Interface
FTOS(conf-if-te-1/1)#show config
!
interface TenGigabitEthernet 1/1
mtu 12000
portmode hybrid
switchport
auto vlan
!
protocol lldp
advertise management-tlv system-name
dcbx port-role auto-downstream
no shutdown
FTOS(conf-if-te-1/1)#
To view the interfaces in Layer 2 mode, use the show interfaces switchport command in EXEC mode.
Management Interfaces
An Aggregator auto-configures with a DHCP-based IP address for in-band management on VLAN 1 and
remote out-of-band (OOB) management.
The IOM management interface has both a public IP and private IP address on the internal Fabric D
interface. The public IP address is exposed to the outside world for WebGUI configurations/WSMAN and
other proprietary traffic. You can statically configure the public IP address or obtain the IP address
dynamically using the dynamic host configuration protocol (DHCP).
Accessing an Aggregator
You can access the Aggregator using:
•
•
•
•
132
|
Internal RS-232 using the chassis management controller (CMC). Telnet into CMC and do a connect -b
switch-id to get console access to corresponding IOM.
External serial port with a universal serial bus (USB) connector (front panel): connect using the IOM
front panel USB serial line to get console access (Labeled as USB B).
Telnet/others using the public IP interface on the fabric D interface.
CMC through the private IP interface on the fabric D interface.
Interfaces
The Aggregator supports the management ethernet interface as well as the standard interface on any
front-end port. You can use either method to connect to the system.
Configuring a Management Interface
On the Aggregator, the dedicated management interface provides management access to the system.You
can configure this interface with FTOS, but the configuration options on this interface are limited. You
cannot configure gateway addresses and IP addresses if it appears in the main routing table of FTOS. In
addition, the proxy address resolution protocol (ARP) is not supported on this interface.
For additional management access, IOM supports the default VLAN (VLAN 1) L3 interface in addition to
the public fabric D management interface. You can assign the IP address for the VLAN 1 default
management interface using the setup wizard or through the CLI.
If you do not configure the default VLAN 1 in the startup configuration using the wizard or CLI, by
default, the VLAN 1 management interface gets its IP address using DHCP.
To configure a management interface, use the following command in CONFIGURATION mode:
Command Syntax
Command Mode
Purpose
interface Managementethernet interface
CONFIGURATION
Enter the slot and the port (0).
Slot range: 0-0
To configure an IP address on a management interface, use either of the following commands in
MANAGEMENT INTERFACE mode:
Command Syntax
Command Mode
Purpose
ip address ip-address mask
INTERFACE
Configure an IP address and mask on the
interface.
• ip-address mask: enter an address in
dotted-decimal format (A.B.C.D), the
mask must be in /prefix format (/x)
ip address dhcp
INTERFACE
Acquire an IP address from the DHCP server.
To access the management interface from another LAN, you must configure the management route
command to point to the management interface.
There is only one management interface for the whole stack.
You can manage the Aggregator from any port. Configure an IP address for the port using the ip address
command. Enable the IP address for the port using the no shutdown command. You can use the description
command from INTERFACE mode to note that the interface is the management interface. There is no
separate management routing table, so you must configure all routes in the IP routing table (use the ip route
command).
Interfaces | 133
www.dell.com | support.dell.com
To display the configuration for a given port, use the show interface command from EXEC Privilege mode
(Figure 9-5).
To display the routing table for a given port, use the show ip route command from EXEC Privilege mode.
Figure 9-5.
FTOS#show interface tengigabit 0/4
TenGigabitEthernet 0/4 is up, line protocol is up
Port is part of Port-channel 1
Hardware is DellForce10Eth, address is 00:01:e8:e1:e1:c1
Current address is 00:01:e8:e1:e1:c1
Server Port AdminState is Up
Pluggable media not present
Interface index is 34935553
Internet address is not set
Mode of IP Address Assignment : NONE
DHCP Client-ID :tenG1330001e8e1e1c1
MTU 12000 bytes, IP MTU 11982 bytes
LineSpeed 10000 Mbit
Flowcontrol rx off tx off
ARP type: ARPA, ARP Timeout 04:00:00
Last clearing of "show interface" counters 00:10:18
Queueing strategy: fifo
Input Statistics:
202 packets, 24015 bytes
103 64-byte pkts, 20 over 64-byte pkts, 52 over 127-byte pkts
27 over 255-byte pkts, 0 over 511-byte pkts, 0 over 1023-byte pkts
163 Multicasts, 39 Broadcasts
0 runts, 0 giants, 0 throttles
0 CRC, 0 overrun, 0 discarded
Output Statistics:
356 packets, 80597 bytes, 0 underruns
36 64-byte pkts, 34 over 64-byte pkts, 44 over 127-byte pkts
242 over 255-byte pkts, 0 over 511-byte pkts, 0 over 1023-byte pkts
271 Multicasts, 85 Broadcasts, 0 Unicasts
0 throttles, 0 discarded, 0 collisions, 0 wreddrops
Rate info (interval 299 seconds):
Input 00.00 Mbits/sec,
0 packets/sec, 0.00% of line-rate
Output 00.00 Mbits/sec,
0 packets/sec, 0.00% of line-rate
Time since last interface status change: 00:10:23
FTOS#
134
Viewing Management Routes
|
Interfaces
Configuring a Static Route for a Management Interface
When an IP address used by a protocol and a static management route exists for the same prefix, the
protocol route takes precedence over the static management route.
To configure a static route for the management port, use the following command in CONFIGURATION
mode:
Command Syntax
Command Mode
Purpose
management route ip-address mask
{forwarding-router-address |
ManagementEthernet slot/port}
CONFIGURATION
Assign a static route to point to the management
interface or forwarding router.
To view the configured static routes for the management port, use the show ip management-route command
in EXEC privilege mode (Figure 9-6).
Figure 9-6.
show ip management-route Command Example
FTOS#show ip management-route all
Destination
----------1.1.1.0/24
172.16.1.0/24
172.31.1.0/24
Gateway
------172.31.1.250
172.31.1.250
ManagementEthernet 1/0
State
----Active
Active
Connected
FTOS#
Interfaces | 135
www.dell.com | support.dell.com
VLAN Membership
A virtual LAN (VLANs) is a logical broadcast domain or logical grouping of interfaces in a LAN in which
all data received is kept locally and broadcast to all members of the group. In Layer 2 mode, VLANs move
traffic at wire speed and can span multiple devices. FTOS supports up to 4093 port-based VLANs and one
default VLAN, as specified in IEEE 802.1Q.
VLANs provide the following benefits:
•
•
Improved security because you can isolate groups of users into different VLANs
Ability to create one VLAN across multiple devices
On an Aggregator in standalone mode, all ports are configured by default as members of all (4094)
VLANs, including the default VLAN. All VLANs operate in Layer 2 mode. You can reconfigure the
VLAN membership for individual ports by using the vlan tagged or vlan untagged commands in
INTERFACE configuration mode (Configuring VLAN Membership). Physical interfaces and port
channels can be members of VLANs.
Note: You can assign a static IP address to default VLAN 1 using the ip address command. To assign a
different VLAN ID to the default VLAN, use the default vlan-id vlan-id command.
If you configure an Aggregator to operate in stacking mode, only the default VLAN is supported. All ports
are automatically configured as untagged members of default VLAN 1. To configure additional VLANs in
stacking mode, use the vlan tagged and vlan untagged commands.
Table 9-1 lists the defaults for VLANs in FTOS.
Table 9-1.
VLAN Defaults on FTOS
Feature
Default
Mode
Layer 2 (no IP address is assigned)
Default VLAN ID
VLAN 1
Default VLAN
When an Aggregator boots up, all interfaces are up in Layer 2 mode and placed in the default VLAN as
untagged interfaces. Only untagged interfaces can belong to the default VLAN.
By default, VLAN 1 is the default VLAN. To change the default VLAN ID, use the default vlan-id command
in CONFIGURATION mode. You cannot delete the default VLAN.
136
|
Interfaces
Port-Based VLANs
Port-based VLANs are a broadcast domain defined by different ports or interfaces. In FTOS, a port-based
VLAN can contain interfaces from different stack units within the chassis. FTOS supports 4094 port-based
VLANs.
Port-based VLANs offer increased security for traffic, conserve bandwidth, and allow switch
segmentation. Interfaces in different VLANs do not communicate with each other, adding some security to
the traffic on those interfaces. Different VLANs can communicate between each other by means of IP
routing. Because traffic is only broadcast or flooded to the interfaces within a VLAN, the VLAN conserves
bandwidth. Finally, you can have multiple VLANs configured on one switch, thus segmenting the device.
Interfaces within a port-based VLAN must be in Layer 2 mode and can be tagged or untagged in the
VLAN ID.
VLANs and Port Tagging
To add an interface to a VLAN, it must be in Layer 2 mode. After you place an interface in Layer 2 mode,
it is automatically placed in the default VLAN. FTOS supports IEEE 802.1Q tagging at the interface level
to filter traffic. When you enable tagging, a tag header is added to the frame after the destination and
source MAC addresses. That information is preserved as the frame moves through the network. Figure 9-7
shows the structure of a frame with a tag header. The VLAN ID is inserted in the tag header.
Figure 9-7.
Tagged Frame Format
Ethernet
Preamble
Source
Address
Tag
Header
Protocol
Type
Data
6 octets
6 octets
4 octets
2 octets
45 - 1500 octets
Frame
Check
Sequence
4 octets
FN00001B
Destination
Address
The tag header contains some key information used by FTOS:
•
•
The VLAN protocol identifier identifies the frame as tagged according to the IEEE 802.1Q
specifications (2 bytes).
Tag control information (TCI) includes the VLAN ID (2 bytes total). The VLAN ID can have 4,096
values, but two are reserved.
Note: The insertion of the tag header into the Ethernet frame increases the size of the frame to more than
the 1518 bytes specified in the IEEE 802.3 standard. Some devices that are not compliant with IEEE 802.3
may not support the larger frame size.
Information contained in the tag header allows the system to prioritize traffic and to forward information to
ports associated with a specific VLAN ID. Tagged interfaces can belong to multiple VLANs, while
untagged interfaces can belong only to one VLAN.
Interfaces | 137
www.dell.com | support.dell.com
Configuring VLAN Membership
By default, all Aggregator ports are member of all (4094) VLANs, including the default untagged VLAN
1. You can use the CLI or CMC interface to reconfigure VLANs only on server-facing interfaces (1 to 32)
so that an interface has membership only in specified VLANs.
To assign an Aggregator interface in Layer 2 mode to a specified group of VLANs, use the vlan tagged and
vlan untagged commands. To view which interfaces are tagged or untagged and to which VLAN they
belong, use the show vlan command (Displaying VLAN Membership).
To reconfigure an interface as a member of only specified tagged VLANs, enter the vlan tagged command
in INTERFACE mode:
Command Syntax
Command Mode
Purpose
vlan tagged {vlan-id | vlan-range}
INTERFACE
Add the interface as a tagged member of one or more
VLANs, where:
vlan-id specifies a tagged VLAN number. Range: 2-4094
vlan-range specifies a range of tagged VLANs. Separate
VLAN IDs with a comma; specify a VLAN range with a
dash; for example, vlan tagged 3,5-7.
To reconfigure an interface as a member of only specified untagged VLANs, enter the vlan untagged
command in INTERFACE mode:
Command Syntax
Command Mode
Purpose
vlan untagged {vlan-id | vlan-range}
INTERFACE
Add the interface as an untagged member of one or more
VLANs, where:
vlan-id specifies an untagged VLAN number.
Range: 2-4094
vlan-range specifies a range of untagged VLANs.
Separate VLAN IDs with a comma; specify a VLAN
range with a dash; for example, vlan tagged 3,5-7.
When you delete a VLAN (using the no vlan vlan-id command), any interfaces assigned to the VLAN are
assigned to the default VLAN as untagged interfaces.
If you configure additional VLAN membership and save it to the startup configuration, the new VLAN
configuration is activated following a system reboot.
FTOS Behavior: When two or more server-facing ports with VLAN membership are configured in a
LAG based on the NIC teaming configuration in connected servers learned via LACP, the resulting
LAG is a tagged member of all the configured VLANs and an untagged member of the VLAN to which
the port with the lowest port ID belongs.
For example, if port 0/3 is an untagged member of VLAN 2 and port 0/4 is an untagged member of
VLAN 3, the resulting LAG consisting of the two ports is an untagged member of VLAN 2 and a tagged
member of VLAN 3.
138
|
Interfaces
Displaying VLAN Membership
To view the configured VLANs, enter the show vlan command in EXEC privilege mode:
Figure 9-8.
show vlan Command Example
FTOS#show vlan
Codes: * - Default VLAN, G - GVRP VLANs, R - Remote Port Mirroring VLANs, P - Primary, C Community, I - Isolated
Q: U - Untagged, T - Tagged
x - Dot1x untagged, X - Dot1x tagged
G - GVRP tagged, M - Vlan-stack, H - VSN tagged
i - Internal untagged, I - Internal tagged, v - VLT untagged, V - VLT tagged
*
NUM
1
20
1002
FTOS#
Status
Inactive
Active
Active
Description
Q Ports
U Po32()
U Te 0/3,5,13,53-56
T Te 0/3,13,55-56
Note: A VLAN is active only if the VLAN contains interfaces and those interfaces are operationally up. In
Figure 9-8, VLAN 1 is inactive because it does not contain any interfaces. The other VLANs listed contain
enabled interfaces and are active.
In a VLAN, the shutdown command stops Layer 3 (routed) traffic only. Layer 2 traffic continues to pass
through the VLAN. If the VLAN is not a routed VLAN (that is, configured with an IP address), the shutdown
command has no affect on VLAN traffic.
Interfaces | 139
www.dell.com | support.dell.com
Adding an Interface to a Tagged VLAN
Figure 9-9 shows an example of how to add a tagged interface (Te1/7) to a VLAN (VLAN 2).
Figure 9-9.
Adding an Interface to Another VLAN
FTOS(conf-if-te-1/7)# vlan tagged 2
FTOS(conf-if-te-1/7)# exit
FTOS(conf)# exit
FTOS# show vlan id 2
Enter the vlan tagged command to add interface Te 1/7 to VLAN 2.
Enter the show vlan command to verify that interface Te 1/7 is a
tagged member of VLAN 2.
Codes: * - Default VLAN, G - GVRP VLANs, R - Remote Port Mirroring VLANs, P - Primary, C - Community,
I - Isolated
Q: U - Untagged, T - Tagged
x - Dot1x untagged, X - Dot1x tagged
G - GVRP tagged, M - Vlan-stack, H - VSN tagged
i - Internal untagged, I - Internal tagged, v - VLT untagged, V - VLT tagged, C - CMC tagged
NUM
2
Status
Active
Description
Q
U
T
T
Ports
Po1(Te 0/7,18)
Po128(Te 0/50-51)
Te 1/7
FTOS(conf-if-te-1/7)
Except for hybrid ports, only a tagged interface can be a member of multiple VLANs. You can assign
hybrid ports to two VLANs if the port is untagged in one VLAN and tagged in all others.
Note: When you remove a tagged interface from a VLAN (using the no vlan tagged command), it remains
tagged only if it is a tagged interface in another VLAN. If you remove the tagged interface from the only
VLAN to which it belongs, the interface is placed in the default VLAN as an untagged interface.
140
|
Interfaces
Adding an Interface to an Untagged VLAN
To move an untagged interfaces from the default VLAN to another VLAN, use the vlan untagged command
as shown in Figure 9-10.
Figure 9-10. Moving an Untagged Interface to Another VLAN
FTOS(conf)# interface tengigabit 0/16
Enter the vlan untagged command to
FTOS(conf-if-te-0/16)# vlan untagged 4
as an untagged member of VLAN 4.
FTOS(conf-if-te-0/16)# exit
FTOS(conf)# exit
FTOS#00:23:49: %STKUNIT0-M:CP %SYS-5-CONFIG_I: Configured from console
add interface Te 0/16
Enter the show vlan command to verify that interface Te 0/16
is an untagged member of VLAN 4.
FTOS# show vlan id 4
Codes: * - Default VLAN, G - GVRP VLANs, R - Remote Port Mirroring VLANs, P - Primary,
C - Community, I - Isolated
Q: U - Untagged, T - Tagged
x - Dot1x untagged, X - Dot1x tagged
G - GVRP tagged, M - Vlan-stack, H - VSN tagged
i - Internal untagged, I - Internal tagged, v - VLT untagged, V - VLT tagged, C - CMC tagged
NUM
4
Status
Active
Description
Q
U
T
T
Ports
Po1(Te 0/16)
Po128(Te 0/33,39,51,56)
Te 0/1-15,17-32
FTOS#
Port Channel Interfaces
On an Aggregator, port channels are auto-configured as follows:
•
•
All 10GbE uplink interfaces (ports 33 to 56) are auto-configured to belong to the same 10GbE port
channel (LAG 128).
Server-facing interfaces (ports 1 to 32) auto-configure in LAGs (1 to 127) according to the NIC
teaming configuration on the connected servers.
Port channel interfaces support link aggregation, as described in IEEE Standard 802.3ad. .
Note: A port channel may also be referred to as a link aggregation group (LAG).
Interfaces | 141
www.dell.com | support.dell.com
Port Channel Definition and Standards
Link aggregation is defined by IEEE 802.3ad as a method of grouping multiple physical interfaces into a
single logical interface—a link aggregation group (LAG) or port channel. A LAG is “a group of links that
appear to a MAC client as if they were a single link” according to IEEE 802.3ad. In FTOS, a LAG is
referred to as a port channel interface.
A port channel provides redundancy by aggregating physical interfaces into one logical interface. If one
physical interface goes down in the port channel, another physical interface carries the traffic.
Port Channel Benefits
A port channel interface provides many benefits, including easy management, link redundancy, and
sharing.
Port channels are transparent to network configurations and can be modified and managed as one interface.
For example, you configure one IP address for the group and that IP address is used for all routed traffic on
the port channel.
With this feature, you can create larger-capacity interfaces by utilizing a group of lower-speed links. For
example, you can build a 40-Gigabit interface by aggregating four 10-Gigabit Ethernet interfaces together.
If one of the four interfaces fails, traffic is redistributed across the three remaining interfaces.
Port Channel Implementation
An Aggregator supports only port channels that are dynamically configured using the link aggregation
control protocol (LACP). For more information, refer to Link Aggregation. Statically-configured port
channels are not supported.
Table 9-2 lists the number of port channels per platform.
Table 9-2.
Number of Port Channels per Platform
Platform
M IO Aggregator
Port-channels
Members/Channel
128
16
As soon as a port channel is auto-configured, FTOS treats it like a physical interface. For example, IEEE
802.1Q tagging is maintained while the physical interface is in the port channel.
Member ports of a LAG are added and programmed into hardware in a predictable order based on the port
ID, instead of in the order in which the ports come up. With this implementation, load balancing yields
predictable results across switch resets and chassis reloads.
A physical interface can belong to only one port channel at a time.
Each port channel must contain interfaces of the same interface type/speed.
142
|
Interfaces
Port channels can contain a mix of 1000 or 10000 Mbps Ethernet interfaces. The interface speed (100,
1000, or 10000 Mbps) used by the port channel is determined by the first port channel member that is
physically up. FTOS disables the interfaces that do not match the interface speed set by the first channel
member. That first interface may be the first interface that is physically brought up or was physically
operating when interfaces were added to the port channel. For example, if the first operational interface in
the port channel is a TenGigabit Ethernet interface, all interfaces at 1000 Mbps are kept up, and all 100/
1000/10000 interfaces that are not set to 1000 Mbps speed or auto negotiate are disabled.
1GbE and 10GbE Interfaces in Port Channels
When both Gigabit and TenGigabitEthernet interfaces are added to a port channel, the interfaces must
share a common speed. When interfaces have a configured speed different from the port channel speed, the
software disables those interfaces.
The common speed is determined when the port channel is first enabled. At that time, the software checks
the first interface listed in the port channel configuration. If that interface is enabled, its speed
configuration becomes the common speed of the port channel. If the other interfaces configured in that port
channel are configured with a different speed, FTOS disables them.
For example, if four interfaces (TenGig 0/1, 0/2, 0/3 and 0/4) in which TenGig 0/1and TenGig 0/2 are set to
speed 1000 Mb/s and the TenGig 0/3 and TenGig0/4 are set to 10000 Mb/s, with all interfaces enabled, and
you add them to a port channel by entering channel-member tengigabitethernet 0/1-4 while in port channel
interface mode, and FTOS determines if the first interface specified (TenGig 0/0) is up. After it is up, the
common speed of the port channel is 1000 Mb/s. FTOS disables those interfaces configured with speed
10000 Mb/s or whose speed is 10000 Mb/s as a result of auto-negotiation.
In this example, you can change the common speed of the port channel by changing its configuration so the
first enabled interface referenced in the configuration is a 1000 Mb/s speed interface. You can also change
the common speed of the port channel by setting the speed of the TenGig 0/1 interface to 1000 Mb/s.
Uplink Port Channel: VLAN Membership
The tagged VLAN membership of the uplink LAG is automatically configured based on the VLAN
configuration of all server-facing ports (ports 1 to 32).
The untagged VLAN used for the uplink LAG is always the default VLAN 1.
Server-Facing Port Channel: VLAN Membership
The tagged VLAN membership of a server-facing LAG is automatically configured based on the
server-facing ports that are members of the LAG.
The untagged VLAN of a server-facing LAG is auto-configured based on the untagged VLAN to which
the lowest numbered server-facing port in the LAG belongs.
Interfaces | 143
www.dell.com | support.dell.com
Displaying Port Channel Information
To view the port channel’s status and channel members in a tabular format, use the show interfaces
command in EXEC Privilege mode (Figure 9-11).
port-channel brief
Figure 9-11.
show interfaces port-channel brief Command Example
FTOS#show int port brief
Codes: L - LACP Port-channel
LAG
1
FTOS#
Mode Status
L2 down
Uptime
00:00:00
Ports
Te 0/16
(Down)
To display detailed information on a port channel, enter the show interfaces port-channel command in EXEC
Privilege mode. Figure 9-12 shows the port channel’s mode (L2 for Layer 2, L3 for Layer 3, and L2L3 for
a Layer 2 port channel assigned to a routed VLAN), the status, and the number of interfaces belonging to
the port channel.
144
|
Interfaces
Figure 9-12.
show interface port-channel Command Example
FTOS#show interface port-channel
Port-channel 1 is a dynamically-created port channel based on the
Port-channel 1 is up, line protocol is up
NIC teaming configuration in connected servers learned via LACP.
Created by LACP protocol
Hardware address is 00:1e:c9:f1:03:58, Current address is 00:1e:c9:f1:03:58
Interface index is 1107755009
Minimum number of links to bring Port-channel up is 1
Internet address is not set
Mode of IP Address Assignment : NONE
DHCP Client-ID :lag1001ec9f10358
MTU 12000 bytes, IP MTU 11982 bytes
LineSpeed 50000 Mbit
Members in this channel: Te 1/2(U) Te 1/3(U) Te 1/4(U) Te 1/5(U) Te 1/7(U)
ARP type: ARPA, ARP Timeout 04:00:00
Last clearing of "show interface" counters 00:13:56
Queueing strategy: fifo
Input Statistics:
836 packets, 108679 bytes
412 64-byte pkts, 157 over 64-byte pkts, 135 over 127-byte pkts
132 over 255-byte pkts, 0 over 511-byte pkts, 0 over 1023-byte pkts
836 Multicasts, 0 Broadcasts
0 runts, 0 giants, 0 throttles, 0 CRC, 0 overrun, 0 discarded
Output Statistics:
9127965 packets, 3157378990 bytes, 0 underruns
0 64-byte pkts, 133 over 64-byte pkts, 3980 over 127-byte pkts
9123852 over 255-byte pkts, 0 over 511-byte pkts, 0 over 1023-byte pkts
4113 Multicasts, 9123852 Broadcasts, 0 Unicasts
0 throttles, 0 discarded, 0 collisions, 0 wreddrops
Rate info (interval 299 seconds):
Input 00.00 Mbits/sec,
1 packets/sec, 0.00% of line-rate
Output 34.00 Mbits/sec,
12318 packets/sec, 0.07% of line-rate
Time since last interface status change: 00:13:49
Port-channel 128 is the default port channel to
assigned by default.
Port-channel 128 is up, line protocol is up
which all uplink ports are
Created by LACP protocol
Hardware address is 00:1e:c9:f1:03:58, Current address is 00:1e:c9:f1:03:58
Interface index is 1107755136
Minimum number of links to bring Port-channel up is 1
Internet address is not set
Mode of IP Address Assignment : NONE
DHCP Client-ID :lag128001ec9f10358
MTU 12000 bytes, IP MTU 11982 bytes
LineSpeed 10000 Mbit
Members in this channel: Te 1/49(U)
ARP type: ARPA, ARP Timeout 04:00:00
Last clearing of "show interface" counters 00:14:06
Queueing strategy: fifo
Input Statistics:
476 packets, 33180 bytes
414 64-byte pkts, 33 over 64-byte pkts, 29 over 127-byte pkts
0 over 255-byte pkts, 0 over 511-byte pkts, 0 over 1023-byte pkts
476 Multicasts, 0 Broadcasts
0 runts, 0 giants, 0 throttles, 0 CRC, 0 overrun, 0 discarded
Output Statistics:
9124688 packets, 3156959396 bytes, 0 underruns
0 64-byte pkts, 30 over 64-byte pkts, 804 over 127-byte pkts
9123854 over 255-byte pkts, 0 over 511-byte pkts, 0 over 1023-byte pkts
834 Multicasts, 9123854 Broadcasts, 0 Unicasts
0 throttles, 0 discarded, 0 collisions, 0 wreddrops
Rate info (interval 299 seconds):
Input 00.00 Mbits/sec,
1 packets/sec, 0.00% of line-rate
Output 34.00 Mbits/sec,
12314 packets/sec, 0.36% of line-rate
Time since last interface status change: 00:13:57
Interfaces | 145
www.dell.com | support.dell.com
Interface Range
An interface range is a set of interfaces to which other commands may be applied, and may be created if
there is at least one valid interface within the range. Bulk configuration excludes from configuring any
non-existing interfaces from an interface range. A default VLAN may be configured only if the interface
range being configured consists of only VLAN ports.
The interface range command allows you to create an interface range allowing other commands to be
applied to that range of interfaces.
The interface range prompt offers the interface (with slot and port information) for valid interfaces. The
maximum size of an interface range prompt is 32. If the prompt size exceeds this maximum, it displays (...)
at the end of the output.
Note: Non-existing interfaces are excluded from interface range prompt.
Note: When creating an interface range, interfaces appear in the order they were entered and are not
sorted.
To display all interfaces that have been validated under the interface range context, use the show range
command in Interface Range mode.
To display the running configuration only for interfaces that are part of interface range, use the show
command in Interface Range mode.
configuration
Bulk Configuration Examples
The following are examples of using the interface range command for bulk configuration:
• Create a Single-Range
• Create a Multiple-Range
• Exclude a Smaller Port Range
• Overlap Port Ranges
• Commas
Create a Single-Range
Figure 9-13.
Creating a Single-Range Bulk Configuration
FTOS(conf)# interface range tengigabitethernet 0/1 - 23
FTOS(conf-if-range-te-0/1-23)# no shutdown
FTOS(conf-if-range-te-0/1-23)#
146
|
Interfaces
Create a Multiple-Range
Figure 9-14.
Creating a Multiple-Range Prompt
FTOS(conf)#interface range tengigabitethernet 0/5 - 10 , tengigabitethernet 0/1 , vlan 1
FTOS(conf-if-range-te-0/5-10,te-0/1,vl-1)#
Exclude a Smaller Port Range
If the interface range has multiple port ranges, the smaller port range is excluded from the prompt.
Figure 9-15.
Interface Range Prompt Excluding a Smaller Port Range
FTOS(conf)#interface range tengigabitethernet 2/0 - 23 , tengigab 2/1 - 10
FTOS(conf-if-range-te-2/0-23)#
Overlap Port Ranges
If overlapping port ranges are specified, the port range is extended to the smallest start port number and
largest end port number.
Figure 9-16.
Interface Range Prompt Including Overlapping Port Ranges
FTOS(conf)#inte ra tengig 2/1 - 11 , tengig 2/1 - 23
FTOS(conf-if-range-te-2/1-23)#
Commas
The example below shows how to use commas to add different interface types to the range, enabling all
Ten Gigabit Ethernet interfaces in the range 0/1 to 0/23 and both Ten Gigabit Ethernet interfaces 1/1 and 1/
2.
Figure 9-17.
Multiple-Range Bulk Configuration Gigabit Ethernet and Ten-Gigabit Ethernet
FTOS(conf-if)# interface range tengigabitethernet 0/1 - 23, tengigabitethernet 1/1 - 2
FTOS(conf-if-range-te-0/1-23)# no shutdown
FTOS(conf-if-range-te-0/1-23)#
Monitor and Maintain Interfaces
Interfaces | 147
www.dell.com | support.dell.com
You can display interface statistics with the monitor interface command. This command displays an
ongoing list of the interface status (up/down), number of packets, traffic statistics, etc.
Command Syntax
Command Mode
Purpose
monitor interface interface
EXEC Privilege
View interface statistics. Enter the type of interface and slot/
port information:
• For a 1GbE interface, enter the keyword GigabitEthernet
followed by the slot/port numbers; for example, interface
gigabitethernet 0/12.
• For a 10GbE interface, enter the keyword
TenGigabitEthernet followed by the slot/port numbers;
for example, interface tengigabitethernet 0/44.
The information displays in a continuous run, refreshes every two seconds by default (Figure 9-18). Use
the following keys to manage the output.
m - Change mode
c - Clear screen
l - Page up
a - Page down
T - Increase refresh interval (by 1 second)
t - Decrease refresh interval (by 1 second)
q - Quit
148
|
Interfaces
Figure 9-18.
monitor interface Command Example
FTOS#monitor interface tengig 3/1
Dell Force10 uptime is 1 day(s), 4 hour(s), 31 minute(s)
Monitor time: 00:00:00
Refresh Intvl.: 2s
Interface: TenGig 3/1, Disabled, Link is Down, Linespeed is 1000 Mbit
Traffic statistics:
Input bytes:
Output bytes:
Input packets:
Output packets:
64B packets:
Over 64B packets:
Over 127B packets:
Over 255B packets:
Over 511B packets:
Over 1023B packets:
Error statistics:
Input underruns:
Input giants:
Input throttles:
Input CRC:
Input IP checksum:
Input overrun:
Output underruns:
Output throttles:
m
l
T
q
-
Current
0
0
0
0
0
0
0
0
0
0
0
0
0
0
0
0
0
0
0
0
Rate
Bps
Bps
pps
pps
pps
pps
pps
pps
pps
pps
Delta
0
0
0
0
0
0
0
0
0
0
0
0
0
0
0
0
0
0
0
0
0
0
0
0
0
0
pps
pps
pps
pps
pps
pps
pps
pps
0
0
0
0
0
0
0
0
Change mode
Page up
Increase refresh interval
Quit
c - Clear screen
a - Page down
t - Decrease refresh interval
Interfaces | 149
www.dell.com | support.dell.com
Maintenance Using TDR
The time domain reflectometer (TDR) is supported on all Dell Networking switch/routers. TDR is an
assistance tool to resolve link issues that helps detect obvious open or short conditions within any of the
four copper pairs. TDR sends a signal onto the physical cable and examines the reflection of the signal that
returns. By examining the reflection, TDR is able to indicate whether there is a cable fault (when the cable
is broken, becomes unterminated, or if a transceiver is unplugged).
TDR is useful for troubleshooting an interface that is not establishing a link, that is, when the link is
flapping or not coming up. Do not use TDR on an interface that is passing traffic. When a TDR test is run
on a physical cable, it is important to shut down the port on the far end of the cable. Otherwise, it may lead
to incorrect test results.
Note: TDR is an intrusive test. Do not run TDR on a link that is up and passing traffic.
To test the condition of cables on 100/1000/10000 BASE-T modules, following these steps using the
tdr-cable-test command.
Step
1
2
150
|
Command Syntax
Command Mode
Usage
tdr-cable-test tengigabitethernet <slot>/
<port>
EXEC Privilege
To test for cable faults on the
TenGigabitEthernet cable.
• Between two ports, you must not start the
test on both ends of the cable.
• Enable the interface before starting the
test.
• The port must be enabled to run the test or
the test prints an error message.
show tdr tengigabitethernet <slot>/<port>
EXEC Privilege
Displays TDR test results.
Interfaces
Flow Control Using Ethernet Pause Frames
An Aggregator auto-configures to operate in auto-DCB-enable mode (Refer to Data Center Bridging:
Auto-DCB-Enable Mode). In this mode, Aggregator ports detect whether peer devices support converged
enhanced Ethernet (CEE) or not, and enable DCBX and PFC or link-level flow control accordingly:
•
•
Interfaces come up with DCB disabled and link-level flow control enabled to control data transmission
between the Aggregator and other network devices.
When DCB is disabled on an interface, PFC, ETS, and DCBX are also disabled.
When DCBX protocol packets are received, interfaces automatically enable DCB and disable
link-level flow control.
DCB is required for PFC, ETS, DCBX, and FCoE initialization protocol (FIP) snooping to operate.
Link-level flow control uses Ethernet pause frames to signal the other end of the connection to pause data
transmission for a certain amount of time as specified in the frame. Ethernet pause frames allow for a
temporary stop in data transmission. A situation may arise where a sending device may transmit data faster
than a destination device can accept it. The destination sends a pause frame back to the source, stopping the
sender’s transmission for a period of time.
The globally assigned 48-bit Multicast address 01-80-C2-00-00-01 is used to send and receive pause
frames. To allow full duplex flow control, stations implementing the pause operation instruct the MAC to
enable reception of frames with a destination address equal to this multicast address.
The pause frame is defined by IEEE 802.3x and uses MAC Control frames to carry the pause commands.
Ethernet pause frames are supported on full duplex only. The only configuration applicable to half duplex
ports is rx off tx off.
Note that if a port is over-subscribed, Ethernet Pause Frame flow control does not ensure no loss behavior.
The following error message appears when trying to enable flow control when half duplex is already
configured:
Can’t configure flowcontrol when half duplex is configure, config ignored.
The following error message appears when trying to enable half duplex and flow control configuration is
on:
Can’t configure half duplex when flowcontrol is on, config ignored.
Interfaces | 151
www.dell.com | support.dell.com
MTU Size
The Aggregator auto-configures interfaces to use a maximum MTU size of 12,000 bytes.
If a packet includes a Layer 2 header, the difference in bytes between the link MTU and IP MTU must be
enough to include the Layer 2 header. For example, for VLAN packets, if the IP MTU is 1400, the link
MTU must be no less than 1422:
1400-byte IP MTU + 22-byte VLAN Tag = 1422-byte link MTU
The MTU range is 592-12000, with a default of 1554.
Table 9-3 lists the various Layer 2 overheads found in FTOS and the number of bytes.
Table 9-3.
Difference between Link MTU and IP MTU
Layer 2 Overhead
Difference between Link MTU and IP MTU
Ethernet (untagged)
18 bytes
VLAN Tag
22 bytes
Untagged Packet with VLAN-Stack Header
22 bytes
Tagged Packet with VLAN-Stack Header
26 bytes
Link MTU and IP MTU considerations for port channels and VLANs are as follows.
Port Channels:
•
•
All members must have the same link MTU value and the same IP MTU value.
The port channel link MTU and IP MTU must be less than or equal to the link MTU and IP MTU
values configured on the channel members.
For example, if the members have a link MTU of 2100 and an IP MTU 2000, the port channel’s MTU
values cannot be higher than 2100 for link MTU or 2000 bytes for IP MTU.
VLANs:
•
•
•
All members of a VLAN must have the same IP MTU value.
Members can have different link MTU values. Tagged members must have a link MTU 4 bytes higher
than untagged members to account for the packet tag.
The VLAN link MTU and IP MTU must be less than or equal to the link MTU and IP MTU values
configured on the VLAN members.
For example, the VLAN contains tagged members with a link MTU of 1522 and an IP MTU of 1500 and
untagged members with a link MTU of 1518 and an IP MTU of 1500. The VLAN’s Link MTU cannot be
higher than 1518 bytes and its IP MTU cannot be higher than 1500 bytes.
152
|
Interfaces
Auto-Negotiation on Ethernet Interfaces
Setting Speed and Duplex Mode of Ethernet Interfaces
By default, auto-negotiation of speed and duplex mode is enabled on 1GbE and 10GbE Ethernet interfaces
on an Aggregator.
The local interface and the directly connected remote interface must have the same setting.
Auto-negotiation is the easiest way to accomplish these settings, as long as the remote interface is capable
of auto-negotiation.
Note: As a best practice, Dell Networking recommends keeping auto-negotiation enabled.
Auto-negotiation should only be disabled on switch ports that attach to devices not capable of supporting
negotiation or where connectivity issues arise from interoperability issues.
For 100/1000/10000 Ethernet interfaces, the negotiation auto command is tied to the speed command.
Auto-negotiation is always enabled when the speed command is set to 1000 or auto. In FTOS, the speed
1000 command is an exact equivalent of speed auto 1000 in IOS.
To discover whether the remote and local interface require manual speed synchronization, and to manually
synchronize them if necessary, follow these steps (also refer to Figure 9-20 on page 154).
Step
Task
Command Syntax
Command Mode
1
Determine the local interface status. Refer
to Figure 9-19.
show interfaces [interface] status
EXEC Privilege
2
Determine the remote interface status.
[Use the command on the remote system
that is equivalent to the above command.]
EXEC
EXEC Privilege
3
Access CONFIGURATION mode.
config
EXEC Privilege
4
Access the port.
interface interface slot/port
CONFIGURATION
5
Set the local port speed.
speed {100 | 1000 | 10000 | auto}
INTERFACE
6
Optionally, set full- or half-duplex.
duplex {half | full}
INTERFACE
7
Disable auto-negotiation on the port. If the
speed is set to 1000, you do not need to
disable auto-negotiation
no negotiation auto
INTERFACE
8
Verify configuration changes.
show config
INTERFACE
Note: The show interfaces status command (Figure 9-19) displays link status, but not administrative status.
For link and administrative status, use the show ip interface [interface | brief] [configuration] command.
Interfaces | 153
www.dell.com | support.dell.com
Figure 9-19.
show interfaces status Command Example
FTOS#show interfaces status
Port
Description Status
Te 0/1
Down
Te 0/2
Down
Te 0/3
Down
Te 0/4
Down
Te 0/5
Down
Te 0/6
Down
Te 0/7
Down
Te 0/8
Down
Te 0/9
Down
Te 0/10
Down
Te 0/11
Down
Te 0/12
Down
Te 0/13
Down
[output omitted]
Speed
Auto
Auto
Auto
Auto
Auto
Auto
Auto
Auto
Auto
Auto
Auto
Auto
Auto
Duplex
Auto
Auto
Auto
Auto
Auto
Auto
Auto
Auto
Auto
Auto
Auto
Auto
Auto
Vlan
--------------
In Figure 9-19, several ports display “Auto” in the Speed field, including port 0/1. In Figure 9-20, the
speed of port 0/1 is set to 100 Mb and then its auto-negotiation is disabled.
Figure 9-20.
Setting Port Speed Example
FTOS#configure
FTOS(conf)#interface tengig 0/1
FTOS(conf-if-te-0/1)#speed 1000
FTOS(conf-if-te-0/1)#no negotiation auto
FTOS(conf-if-te-0/1)#show config
!
interface TenGigabitEthernet 0/1
no ip address
speed 1000
duplex full
no shutdown
Setting Auto-Negotiation Options
The negotiation auto command provides a mode option for configuring an individual port to forced master/
forced slave after you enable auto-negotiation.
Caution: Ensure that only one end of the node is configured as forced-master and the other is configured as
forced-slave. If both are configured the same (that is, both as forced-master or both as forced-slave), the show
interface command flaps between an auto-neg-error and forced-master/slave states.
Table 9-4. Auto-Negotiation, Speed, and Duplex Settings on Different Optics
Command
154
|
Interfaces
mode
10GbaseT
module
10G SFP+
optics
1G SFP optics
Copper SFP 1000baseT
Comments
Not supported Not supported
(Error message is
(Error
message is thrown)
(% Error: Speed 100
thrown)
not supported on this
(% Error:
Speed 100 not interface, config
supported on ignored Te 0/49)
this interface,
config
ignored Te 0/
49)
Not supportedNot supported
% Error: Speed
100 not
supported on
this interface,
interface-config Supported
mode
interface-config Supported
mode
Supported
Supported
Supported
Supported
Not Supported
Not supported
negotiation auto
interface-config Supported
mode
duplex half
interface-config Supported
mode
Not supported Not supported
(Should some
error message
be thrown?)
CLI not
CLI not available
available
duplex full
interface-config Supported
mode
CLI not
available
speed 100
interface-config Supported
mode
speed auto
interface-config Supported
mode
speed 1000
speed 10000
CLI not available
Not supported
Not supported
Error messages
not thrown
wherever it says
not supported
Error messages
not thrown
wherever it says
not supported
Error messages
not thrown
wherever it says
not supported
Invalid Input
error- CLI not
available
Invalid Input
error-CLI not
available
Interfaces | 155
www.dell.com | support.dell.com
Figure 9-21 shows the auto-negotiation options.
Figure 9-21.
Setting Auto-Negotiation Options
FTOS(conf)# int tengig 0/1
FTOS(conf-if-te-0/1)#neg auto
FTOS(conf-if-autoneg)# ?
end
Exit from configuration mode
exit
Exit from autoneg configuration mode
mode
Specify autoneg mode
no
Negate a command or set its defaults
show
Show autoneg configuration information
FTOS(conf-if-autoneg)#mode ?
forced-master
Force port to master mode
forced-slave
Force port to slave mode
FTOS(conf-if-autoneg)#
Viewing Interface Information
Displaying Non-Default Configurations
The show [ip | running-config] interfaces configured command allows you to display only interfaces that
have non-default configurations are displayed.
Figure 9-22 shows the possible show commands that have the configured keyword available.
Figure 9-22.
FTOS#show
FTOS#show
FTOS#show
FTOS#show
FTOS#show
FTOS#show
FTOS#show
156
|
Interfaces
show Commands with configured Keyword Examples
interfaces configured
interfaces tengigabitEthernet 0 configured
ip interface configured
ip interface tengigabitEthernet 1 configured
ip interface brief configured
running-config interfaces configured
running-config interface tengigabitEthernet 1 configured
In EXEC mode, the show interfaces switchport command displays only interfaces in Layer 2 mode and their
relevant configuration information. The show interfaces switchport command (Figure 9-23) displays the
interface, whether the interface supports IEEE 802.1Q tagging or not, and the VLANs to which the
interface belongs.
Figure 9-23. show interfaces switchport Command Example
FTOS#show interfaces switchport
Name: TenGigabitEthernet 13/0
802.1QTagged: True
Vlan membership:
Vlan
2
Name: TenGigabitEthernet 13/1
802.1QTagged: True
Vlan membership:
Vlan
2
Name: TenGigabitEthernet 13/2
802.1QTagged: True
Vlan membership:
Vlan
2
Name: TenGigabitEthernet 13/3
802.1QTagged: True
Vlan membership:
Vlan
2
--More--
Interfaces | 157
www.dell.com | support.dell.com
Clearing Interface Counters
The counters in the show interfaces command are reset by the clear counters command. This command does
not clear the counters captured by any SNMP program.
To clear the counters, use the following command in EXEC Privilege mode:
Command Syntax
Command Mode
Purpose
clear counters [interface]
EXEC Privilege
Clear the counters used in the show interface commands for all
VRRP groups, VLANs, and physical interfaces or selected ones.
Without an interface specified, the command clears all interface
counters.
• (OPTIONAL) Enter the following interface keywords and slot/
port or number information:
• For a Loopback interface, enter the keyword loopback followed
by a number from 0 to 16383.
• For a Port Channel interface, enter the keyword port-channel
followed by a number from 1 to 128.
• For a 10-Gigabit Ethernet interface, enter the keyword
TenGigabitEthernet followed by the slot/port numbers.
• For a VLAN, enter the keyword vlan followed by a number
from 1 to 4094.
When you enter this command, you must confirm that you want FTOS to clear the interface counters for
that interface (Figure 9-24).
Figure 9-24.
Clearing an Interface
FTOS#clear counters tengig 0/0
Clear counters on TenGigabitEthernet 0/0 [confirm]
FTOS#
158
|
Interfaces
10
iSCSI Optimization
An Aggregator enables internet small computer system interface (iSCSI) optimization with default iSCSI
parameter settings (Default iSCSI Optimization Values) and is auto-provisioned to support:
•
•
Detection and Auto configuration for Dell EqualLogic Arrays
iSCSI Optimization: Operation
To display information on iSCSI configuration and sessions, you can use show commands.
iSCSI optimization enables quality-of-service (QoS) treatment for iSCSI traffic.
iSCSI Optimization Overview
iSCSI is a TCP/IP-based protocol for establishing and managing connections between IP-based storage
devices and initiators in a storage area network (SAN).
iSCSI optimization enables the network switch to auto-detect Dell’s iSCSI storage arrays and triggers
self-configuration of several key network configurations that enables optimization of the network for better
storage traffic throughput.
iSCSI optimization provides a means of monitoring iSCSI sessions and applying QoS policies on iSCSI
traffic. When enabled, iSCSI optimization allows a switch to monitor (snoop) the establishment and
termination of iSCSI connections. The switch uses the snooped information to detect iSCSI sessions and
connections established through the switch.
iSCSI optimization allows you to reduce deployment time and management complexity in data centers. In
a data center network, Dell EqualLogic and Compellent iSCSI storage arrays are connected to a converged
Ethernet network using the data center bridging exchange protocol (DCBx) through stacked and/or
non-stacked Ethernet switches.
iSCSI session monitoring over virtual link trunking (VLT) synchronizes the iSCSI session information
between the VLT peers, allowing session information to be available in both VLT peers.
iSCSI optimization functions as follows:
•
•
•
Auto-detection of EqualLogic storage arrays — the switch detects any active EqualLogic array
directly attached to its ports.
Manual configuration to detect Compellent storage arrays where auto-detection is not supported.
Automatic configuration of switch ports after detection of storage arrays.
iSCSI Optimization | 159
www.dell.com | support.dell.com
•
•
•
•
If you configured flow-control, iSCSI uses the current configuration. If you did not configure
flow-control, iSCSI auto-configures flow control.
iSCSI monitoring sessions — the switch monitors and tracks active iSCSI sessions in connections on
the switch, including port information and iSCSI session information.
iSCSI QoS — A user-configured iSCSI class of service (CoS) profile is applied to all iSCSI traffic.
Classifier rules are used to direct the iSCSI data traffic to queues that can be given preferential QoS
treatment over other data passing through the switch. Preferential treatment helps to avoid session
interruptions during times of congestion that would otherwise cause dropped iSCSI packets.
iSCSI DCBx TLVs are supported.
Figure 10-1 shows iSCSI optimization between servers in an M1000e enclosure and a storage array in
which an Aggregator connects installed servers (iSCSI initiators) to a storage array (iSCSI targets) in a
SAN network. iSCSI optimization running on the Aggregator is configured to use dot1p priority-queue
assignments to ensure that iSCSI traffic in these sessions receives priority treatment when forwarded on
Aggregator hardware.
Figure 10-1. iSCSI Optimization Example
Monitoring iSCSI Traffic Flows
The switch snoops iSCSI session-establishment and termination packets by installing classifier rules that
trap iSCSI protocol packets to the CPU for examination. Devices that initiate iSCSI sessions usually use
well-known TCP ports 3260 or 860 to contact targets. The switch identifies IP packets to or from these
ports as iSCSI traffic.
You can configure the switch to monitor traffic for additional port numbers or a combination of port
numbers and target IP addresses, and you can remove the well-known port numbers from monitoring.
160
|
iSCSI Optimization
Information Monitored in iSCSI Traffic Flows
iSCSI optimization examines the following data in packets and uses the data to track the session and create
the classifier entries that enable QoS treatment:
•
•
•
•
•
•
•
Initiator’s IP Address
Target’s IP Address
ISID (Initiator defined session identifier)
Initiator’s IQN (iSCSI qualified name)
Target’s IQN
Initiator’s TCP Port
Target’s TCP Port
If no iSCSI traffic is detected for a session during a user-configurable aging period, the session data clears.
Detection and Auto configuration for Dell EqualLogic Arrays
The iSCSI optimization feature includes auto-provisioning support with the ability to detect directly
connected Dell EqualLogic storage arrays and automatically reconfigure the switch to enhance storage
traffic flows.
The Aggregator uses the link layer discovery protocol (LLDP) to discover Dell EqualLogic devices on the
network. LLDP is enabled by default. For more information about LLDP, refer to Link Layer Discovery
Protocol (LLDP).
The following message displays the first time a Dell EqualLogic array is detected and describes the
configuration changes that are automatically performed:
%STKUNIT0-M:CP %IFMGR-5-IFM_ISCSI_AUTO_CONFIG: This switch is being configured
for optimal conditions to support iSCSI traffic which will cause some automatic
configuration to occur including jumbo frames and flow-control on all ports; no
storm control to be enabled on the port of detection.
The following syslog message is generated the first time an EqualLogic array is detected:
%STKUNIT0-M:CP %LLDP-5-LLDP_EQL_DETECTED: EqualLogic Storage Array detected on
interface Te 1/43
•
•
•
At the first detection of an EqualLogic array, a maximum transmission unit (MTU) of 12000 is enabled
on all ports and port-channels (if it is has not already been enabled).
Spanning-tree portfast is enabled on the interface identified by LLDP if the port is in L2 mode.
Unicast storm control is disabled on the interface identified by LLDP.
iSCSI Optimization: Operation
When the Aggregator auto-configures with iSCSI enabled, the following occurs:
iSCSI Optimization | 161
www.dell.com | support.dell.com
•
•
•
Link-level flow control is enabled on PFC disabled interfaces.
iSCSI session snooping is enabled.
iSCSI LLDP monitoring starts to automatically detect EqualLogic arrays.
iSCSI optimization requires LLDP to be enabled. LLDP is enabled by default when an Aggregator
auto-configures.
The following message displays when you enable iSCSI on a switch and describes the configuration
changes that are automatically performed:
%STKUNIT0-M:CP %IFMGR-5-IFM_ISCSI_ENABLE: iSCSI has been enabled causing flow
control to be enabled on all interfaces. EQL detection and enabling iscsi
profile-compellent on an interface may cause some automatic configurations to
occur like jumbo frames on all ports and no storm control and spanning tree
port-fast on the port of detection.
Default iSCSI Optimization Values
Table 10-1 Lists the default values for the iSCSI optimization feature.
Table 10-1.
iSCSI Optimization: Default Parameters
Parameter
Default Value
iSCSI Optimization global setting
Enabled
iSCSI CoS mode (802.1p priority queue
mapping)
Enabled: dot1p priority 4 without the remark setting
iSCSI CoS Treatment
iSCSI packets are queued based on dot1p instead of DSCP values.
VLAN priority tag
iSCSI flows are assigned by default to dot1p priority 4 without the remark
setting.
DSCP
None: user-configurable.
Remark
Not configured.
iSCSI session aging time
10 minutes
iSCSI optimization target ports
iSCSI well-known ports 3260 and 860 are configured as default (with no IP
address or name) but can be removed as any other configured target.
iSCSI session monitoring
Enabled. The CAM allocation for iSCSI by default is set to two.
Displaying iSCSI Optimization Information
162
|
iSCSI Optimization
To display information on iSCSI optimization, use the show commands in Table 10-2 t
Table 10-2.
Displaying iSCSI Optimization Information
Command
Output
show iscsi (Figure 10-2)
Displays the currently configured iSCSI settings.
show iscsi sessions (Figure 10-3)
Displays information on active iSCSI sessions on the switch.
show iscsi sessions detailed [session isid]
(Figure 10-4)
Displays detailed information on active iSCSI sessions on the switch. To
display detailed information on specified iSCSi session, enter the session’s
iSCSi ID.
show run iscsi
Displays all globally-configured non-default iSCSI settings in the current
FTOS session.
Figure 10-2. show iscsi Command Example
FTOS# show isci
iSCSI is enabled
iSCSI session monitoring is enabled
iSCSI COS : dot1p is 4 no-remark
Session aging time: 10
Maximum number of connections is 256
-----------------------------------------------iSCSI Targets and TCP Ports:
-----------------------------------------------TCP Port
Target IP Address
3260
860
Figure 10-3. show iscsi sessions Command Example
FTOS# show isci sessions
Session 0:
----------------------------------------------------------------------------------------Target: iqn.2001-05.com.equallogic:0-8a0906-0e70c2002-10a0018426a48c94-iom010
Initiator: iqn.1991-05.com.microsoft:win-x9l8v27yajg
ISID: 400001370000
Session 1:
----------------------------------------------------------------------------------------Target: iqn.2001-05.com.equallogic:0-8a0906-0f60c2002-0360018428d48c94-iom011
Initiator: iqn.1991-05.com.microsoft:win-x9l8v27yajg
ISID: 400001370000.
iSCSI Optimization | 163
www.dell.com | support.dell.com
Figure 10-4. show iscsi sessions detailed Command Example
164
FTOS# show isci sessions detailed
Session 0
:
----------------------------------------------------------------------------Target:iqn.2010-11.com.ixia:ixload:iscsi-TG1
Initiator:iqn.2010-11.com.ixia.ixload:initiator-iscsi-2c
Up Time:00:00:01:28(DD:HH:MM:SS)
Time for aging out:00:00:09:34(DD:HH:MM:SS)
ISID:806978696102
Initiator
Initiator
Target
Target
Connection
IP Address
TCP Port
IP Address
TCPPort
ID
10.10.0.44
33345
10.10.0.101
3260
0
Session 1
:
----------------------------------------------------------------------------Target:iqn.2010-11.com.ixia:ixload:iscsi-TG1
Initiator:iqn.2010-11.com.ixia.ixload:initiator-iscsi-35
Up Time:00:00:01:22(DD:HH:MM:SS)
Time for aging out:00:00:09:31(DD:HH:MM:SS)
ISID:806978696102
Initiator
Initiator
Target
Target
Connection
IP Address
TCP Port
IP Address
TCPPort
ID
10.10.0.53
33432
10.10.0.101
3260
0
|
iSCSI Optimization
11
Link Aggregation
The I/O Aggregator auto-configures with link aggregation groups (LAGs) as follows:
•
•
All uplink ports are automatically configured in a single port channel (LAG 128).
Server-facing LAGs are automatically configured if you configure server for link aggregation control
protocol (LACP)-based NIC teaming (Network Interface Controller (NIC) Teaming).
No manual configuration is required to configure Aggregator ports in the uplink or a server-facing LAG.
Note: Static LAGs are not supported on the Aggregator.
How the LACP is Implemented on an Aggregator
The LACP provides a means for two systems (also called partner systems) to exchange information
through dynamic negotiations to aggregate two or more ports with common physical characteristics to
form a link aggregation group.
Note: A link aggregation group is referred to as a port channel by the Dell Networking operating software
(FTOS)
A LAG provides both load-sharing and port redundancy across stack units. An Aggregator supports LACP
for auto-configuring dynamic LAGs. Use CLI commands to display LACP information, clear port-channel
counters, and debug LACP operation for auto-configured LAG on an Aggregator.
The FTOS implementation of LACP is based on the standards specified in the IEEE 802.3: "Carrier sense
multiple access with collision detection (CSMA/CD) access method and physical layer specifications.”
LACP functions by constantly exchanging custom MAC protocol data units (PDUs) across local area
network (LAN) Ethernet links. The protocol packets are only exchanged between ports that you configure
as LACP-capable.
Uplink LAG
When the Aggregator powers on, all uplink ports are configured in a single LAG (LAG 128).
Link Aggregation | 165
www.dell.com | support.dell.com
Server-Facing LAGs
Server-facing ports are configured as individual ports by default. If you configure a server NIC in
standalone, stacking, or VLT mode for LACP-based NIC teaming, server-facing ports are automatically
configured as part of dynamic LAGs. The LAG range 1 to127 is reserved for server-facing LAGs.
After the Aggregator receives LACPDU from server-facing ports, the information embedded in the
LACPDU (remote-system ID and port key) is used to form a server-facing LAG. The LAG/port-channel
number is assigned based on the first available number in the range from 1 to 127. For each unique remote
system-id and port-key combination, a new LAG is formed and the port automatically becomes a member
of the LAG.
All ports with the same combination of system ID and port key automatically become members of the
same LAG. Ports are automatically removed from the LAG if the NIC teaming configuration on a
server-facing port changes or if the port goes operationally down. Also, a server-facing LAG is removed
when the last port member is removed from the LAG.
The benefit of supporting a dynamic LAG is that the Aggregator's server-facing ports can toggle between
participating in the LAG or acting as individual ports based on the dynamic information exchanged with a
server NIC. LACP supports the exchange of messages on a link to allow their LACP instances to:
•
•
•
•
Reach agreement on the identity of the LAG to which the link belongs.
Attach the link to that LAG.
Enable the transmission and reception functions in an orderly manner.
Detach the link from the LAG if one of the partner stops responding.
LACP Modes
The Aggregator supports only LACP active mode as the default mode of operation. In active mode, a port
interface is considered to be not part of a LAG but rather in an active negotiating state.
A port in active mode automatically initiates negotiations with other ports by sending LACP packets. If
you configure server-facing ports for LACP-based NIC teaming, LACP negotiations take place to
aggregate the port in a dynamic LAG. If you do not configure server-facing ports for LACP-based NIC
teaming, a port is treated as an individual port in the active negotiating state.
Auto-Configured LACP Timeout
LACP PDUs are exchanged between port channel (LAG) interfaces to maintain LACP sessions. LACP
PDUs are transmitted at a slow or fast transmission rate, depending on the LACP timeout value configured
on the partner system.
The timeout value is the amount of time that a LAG interface waits for a PDU from the partner system
before bringing the LACP session down. The default timeout is long-timeout (30 seconds) and is not
user-configurable on the Aggregator.
166
|
Link Aggregation
LACP Example
Figure 11-1 shows an example of how LACP operates in an Aggregator stack by auto-configuring the
uplink LAG 128 for the connection to a top of rack (ToR) switch and a server-facing LAG for the
connection to an installed server that you configured for LACP-based NIC teaming.
Figure 11-1.
LACP Operation on an Aggregator
Verifying LACP Operation and LAG Configuration
To verify the operational status and configuration of a dynamically created LAG, and LACP operation on a
LAG on an Aggregator, enter the show interfaces port-channel port-channel-number and show lacp
port-channel-number commands.
Link Aggregation | 167
www.dell.com | support.dell.com
The show outputs in this section for uplink LAG 128 and server-facing LAG 1 refer to the example shown
in Figure 11-1.
168
Figure 11-2.
show interfaces port-channel 128 Command Example
FTOS# show interfaces port-channel 128
Port-channel 128 is up, line protocol is up
Created by LACP protocol
Hardware address is 00:01:e8:e1:e1:c1, Current address is 00:01:e8:e1:e1:c1
Interface index is 1107755136
Minimum number of links to bring Port-channel up is 1
Internet address is not set
Mode of IP Address Assignment : NONE
DHCP Client-ID :lag1280001e8e1e1c1
MTU 12000 bytes, IP MTU 11982 bytes
LineSpeed 40000 Mbit
Members in this channel: Te 0/41(U) Te 0/42(U) Te 0/43(U) Te 0/44(U)
ARP type: ARPA, ARP Timeout 04:00:00
Last clearing of "show interface" counters 00:11:50
Queueing strategy: fifo
Input Statistics:
182 packets, 17408 bytes
92 64-byte pkts, 0 over 64-byte pkts, 90 over 127-byte pkts
0 over 255-byte pkts, 0 over 511-byte pkts, 0 over 1023-byte pkts
182 Multicasts, 0 Broadcasts
0 runts, 0 giants, 0 throttles
0 CRC, 0 overrun, 0 discarded
Output Statistics:
2999 packets, 383916 bytes, 0 underruns
5 64-byte pkts, 214 over 64-byte pkts, 2727 over 127-byte pkts
53 over 255-byte pkts, 0 over 511-byte pkts, 0 over 1023-byte pkts
2904 Multicasts, 95 Broadcasts, 0 Unicasts
0 throttles, 0 discarded, 0 collisions, 0 wreddrops
Rate info (interval 299 seconds):
Input 00.00 Mbits/sec,
0 packets/sec, 0.00% of line-rate
Output 00.00 Mbits/sec,
4 packets/sec, 0.00% of line-rate
Time since last interface status change: 00:11:42
|
Link Aggregation
Figure 11-3.
show lacp 128 Command Example
FTOS# show lacp 128
Port-channel 128 admin up, oper up, mode lacp
Actor
System ID: Priority 32768, Address 0001.e8e1.e1c3
Partner System ID: Priority 32768, Address 0001.e88b.253d
Actor Admin Key 128, Oper Key 128, Partner Oper Key 128, VLT Peer Oper Key 128
LACP LAG 128 is an aggregatable link
LACP LAG 128 is a normal LAG
A
E
I
L
O
-
Active LACP, B - Passive LACP, C - Short Timeout, D - Long Timeout
Aggregatable Link, F - Individual Link, G - IN_SYNC, H - OUT_OF_SYNC
Collection enabled, J - Collection disabled, K - Distribution enabled
Distribution disabled, M - Partner Defaulted, N - Partner Non-defaulted,
Receiver is in expired state, P - Receiver is not in expired state
Port Te 0/41 is enabled, LACP is enabled and mode is lacp
Port State: Bundle
Actor
Admin: State ADEHJLMP Key 128 Priority 32768
Oper: State ADEGIKNP Key 128 Priority 32768
Partner Admin: State BDFHJLMP Key 0 Priority 0
Oper: State ACEGIKNP Key 128 Priority 32768
Port Te 0/42 is enabled, LACP is enabled and mode is lacp
Port State: Bundle
Actor
Admin: State ADEHJLMP Key 128 Priority 32768
Oper: State ADEGIKNP Key 128 Priority 32768
Partner Admin: State BDFHJLMP Key 0 Priority 0
Oper: State ACEGIKNP Key 128 Priority 32768
Port Te 0/43 is enabled, LACP is enabled and mode is lacp
Port State: Bundle
Actor
Admin: State ADEHJLMP Key 128 Priority 32768
Oper: State ADEGIKNP Key 128 Priority 32768
Partner Admin: State BDFHJLMP Key 0 Priority 0
Oper: State ACEGIKNP Key 128 Priority 32768
Port Te 0/44 is enabled, LACP is enabled and mode is lacp
Port State: Bundle
Actor
Admin: State ADEHJLMP Key 128 Priority 32768
Oper: State ADEGIKNP Key 128 Priority 32768
Partner Admin: State BDFHJLMP Key 0 Priority 0
Oper: State ACEGIKNP Key 128 Priority 32768
Port Te 0/45 is disabled, LACP is disabled and mode is lacp
Port State: Bundle
Actor
Admin: State ADEHJLMP Key 128 Priority 32768
Oper: State ADEHJLMP Key 128 Priority 32768
Partner is not present
Port Te 0/46 is disabled, LACP is disabled and mode is lacp
Port State: Bundle
Actor
Admin: State ADEHJLMP Key 128 Priority 32768
Oper: State ADEHJLMP Key 128 Priority 32768
Partner is not present
Port Te 0/47 is disabled, LACP is disabled and mode is lacp
Port State: Bundle
Actor
Admin: State ADEHJLMP Key 128 Priority 32768
Oper: State ADEHJLMP Key 128 Priority 32768
Partner is not present
Link Aggregation | 169
www.dell.com | support.dell.com
Figure 11-4.
show lacp 128 Command Example (Continued)
Port Te 0/48 is disabled, LACP is disabled and mode is lacp
Port State: Bundle
Actor
Admin: State ADEHJLMP Key 128 Priority 32768
Oper: State ADEHJLMP Key 128 Priority 32768
Partner is not present
Port Te 0/49 is disabled, LACP is disabled and mode is lacp
Port State: Bundle
Actor
Admin: State ADEHJLMP Key 128 Priority 32768
Oper: State ADEHJLMP Key 128 Priority 32768
Partner is not present
Port Te 0/50 is disabled, LACP is disabled and mode is lacp
Port State: Bundle
Actor
Admin: State ADEHJLMP Key 128 Priority 32768
Oper: State ADEHJLMP Key 128 Priority 32768
Partner is not present
Port Te 0/51 is disabled, LACP is disabled and mode is lacp
Port State: Bundle
Actor
Admin: State ADEHJLMP Key 128 Priority 32768
Oper: State ADEHJLMP Key 128 Priority 32768
Partner is not present
Port Te 0/52 is disabled, LACP is disabled and mode is lacp
Port State: Bundle
Actor
Admin: State ADEHJLMP Key 128 Priority 32768
Oper: State ADEHJLMP Key 128 Priority 32768
Partner is not present
Port Te 0/53 is disabled, LACP is disabled and mode is lacp
Port State: Bundle
Actor
Admin: State ADEHJLMP Key 128 Priority 32768
Oper: State ADEHJLMP Key 128 Priority 32768
Partner is not present
Port Te 0/54 is disabled, LACP is disabled and mode is lacp
Port State: Bundle
Actor
Admin: State ADEHJLMP Key 128 Priority 32768
Oper: State ADEHJLMP Key 128 Priority 32768
Partner is not present
Port Te 0/55 is disabled, LACP is disabled and mode is lacp
Port State: Bundle
Actor
Admin: State ADEHJLMP Key 128 Priority 32768
Oper: State ADEHJLMP Key 128 Priority 32768
Partner is not present
Port Te 0/56 is disabled, LACP is disabled and mode is lacp
Port State: Bundle
Actor
Admin: State ADEHJLMP Key 128 Priority 32768
Oper: State ADEHJLMP Key 128 Priority 32768
Partner is not present
170
|
Link Aggregation
Figure 11-5.
show interfaces port-channel 1 Command Example
FTOS# show interfaces port-channel 1
Port-channel 1 is up, line protocol is up
Created by LACP protocol
Hardware address is 00:01:e8:e1:e1:c1, Current address is 00:01:e8:e1:e1:c1
Interface index is 1107755009
Minimum number of links to bring Port-channel up is 1
Internet address is not set
Mode of IP Address Assignment : NONE
DHCP Client-ID :lag10001e8e1e1c1
MTU 12000 bytes, IP MTU 11982 bytes
LineSpeed 10000 Mbit
Members in this channel: Te 0/12(U)
ARP type: ARPA, ARP Timeout 04:00:00
Last clearing of "show interface" counters 00:12:41
Queueing strategy: fifo
Input Statistics:
112 packets, 18161 bytes
0 64-byte pkts, 46 over 64-byte pkts, 37 over 127-byte pkts
29 over 255-byte pkts, 0 over 511-byte pkts, 0 over 1023-byte pkts
59 Multicasts, 53 Broadcasts
0 runts, 0 giants, 0 throttles
0 CRC, 0 overrun, 0 discarded
Output Statistics:
135 packets, 19315 bytes, 0 underruns
0 64-byte pkts, 79 over 64-byte pkts, 32 over 127-byte pkts
24 over 255-byte pkts, 0 over 511-byte pkts, 0 over 1023-byte pkts
93 Multicasts, 42 Broadcasts, 0 Unicasts
0 throttles, 0 discarded, 0 collisions, 0 wreddrops
Rate info (interval 299 seconds):
Input 00.00 Mbits/sec,
0 packets/sec, 0.00% of line-rate
Output 00.00 Mbits/sec,
0 packets/sec, 0.00% of line-rate
Time since last interface status change: 00:12:38
Figure 11-6.
show lacp 1 Command Example
FTOS# show lacp 1
Port-channel 1 admin up, oper up, mode lacp
Actor
System ID: Priority 32768, Address 0001.e8e1.e1c3
Partner System ID: Priority 65535, Address 24b6.fd87.d8ac
Actor Admin Key 1, Oper Key 1, Partner Oper Key 33, VLT Peer Oper Key 1
LACP LAG 1 is an aggregatable link
LACP LAG 1 is a normal LAG
A
E
I
L
O
-
Active LACP, B - Passive LACP, C - Short Timeout, D - Long Timeout
Aggregatable Link, F - Individual Link, G - IN_SYNC, H - OUT_OF_SYNC
Collection enabled, J - Collection disabled, K - Distribution enabled
Distribution disabled, M - Partner Defaulted, N - Partner Non-defaulted,
Receiver is in expired state, P - Receiver is not in expired state
Port Te 0/12 is enabled, LACP is enabled and mode is lacp
Port State: Bundle
Actor
Admin: State ADEHJLMP Key 1 Priority 32768
Oper: State ADEGIKNP Key 1 Priority 32768
Partner Admin: State BDFHJLMP Key 0 Priority 0
Oper: State ADEGIKNP Key 33 Priority 255
Link Aggregation | 171
172
|
Link Aggregation
www.dell.com | support.dell.com
12
Layer 2
The Aggregator supports CLI commands to manage the MAC address table:
•
•
Clearing MAC Address Entries
Displaying the MAC Address Table
The Aggregator auto-configures with support for Network Interface Controller (NIC) Teaming.
Note: On an Aggregator, all ports are configured by default as members of all (4094) VLANs, including
the default VLAN. All VLANs operate in Layer 2 mode. You can reconfigure the VLAN membership for
individual ports by using the vlan tagged or vlan untagged commands in INTERFACE configuration mode.
See VLAN Membership for more information.
Managing the MAC Address Table
Note: The tasks for managing the MAC address table that are described in this section can be performed
only if the Aggregator is configured to operate in stacking mode. See Configuring a Switch Stack.
On an Aggregator in stacking mode, you can manage the MAC address table by:
•
•
Clearing MAC Address Entries
Displaying the MAC Address Table
Clearing MAC Address Entries
Learned MAC addresses are entered in the table as dynamic entries, which means that they are subject to
aging. For any dynamic entry, if no packet arrives on the switch with the MAC address as the source or
destination address within the timer period, the address is removed from the table. The default aging time
is 1800 seconds.
You can manually clear the MAC address table of dynamic entries by using the clear mac-address-table
dynamic command.
Note: On an Aggregator, you cannot manually configure static MAC addresses. A static entry is not
subject to aging.
Layer 2 | 173
www.dell.com | support.dell.com
Task
Command Syntax
Command Mode
Clear a MAC address table of dynamic entries.
• address deletes the specified entry
• all deletes all dynamic entries
• interface deletes all entries for the specified
interface
• vlan deletes all entries for the specified VLAN
clear mac-address-table dynamic
{address | all | interface | vlan}
EXEC Privilege
Displaying the MAC Address Table
To display the contents of the MAC address table, use the show mac-address-table command:
Task
Command Syntax
CommandMode
Display the contents of the MAC address table.
• address displays the specified entry.
• aging-time displays the configured aging-time.
• count displays the number of dynamic and static entries
for all VLANs, and the total number of entries.
• dynamic displays only dynamic entries
• interface displays only entries for the specified interface.
• static displays only static entries.
• vlan displays only entries for the specified VLAN.
show mac-address-table [address |
aging-time [vlan vlan-id]| count |
dynamic | interface | static | vlan]
EXEC Privilege
Network Interface Controller (NIC) Teaming
NIC teaming is a feature that allows multiple network interface cards in a server to be represented by one
MAC address and one IP address in order to provide transparent redundancy, balancing, and to fully utilize
network adapter resources.
Support for NIC teaming is auto-configured on the Aggregator, including support for:
•
•
MAC Address Station Move
MAC Address Station Move
Figure 12-1 shows a topology where two NICs have been teamed together. In this case, if the primary NIC
fails, traffic switches to the secondary NIC, because they are represented by the same set of addresses.
174
|
Layer 2
Figure 12-1. Redundant NICs with NIC Teaming
X
Port 0/1
MAC: A:B:C:D
A:B
IP: 1.1.1.1
k
Active Lin
Port 0/5
fnC0025mp
MAC Address Station Move
When you use NIC teaming, consider that the server MAC address is originally learned on Port 0/1 of the
switch (Figure 12-2). If the NIC fails, the same MAC address is learned on Port 0/5 of the switch. The
MAC address is disassociated with the one port and re-associated with another in the ARP table; in other
words, the ARP entry is “moved”. The Aggregator is auto-configured to support MAC Address station
moves.
Figure 12-2. MAC Address Station Move
X
MAC: A:B:C:D
A:B
IP: 1.1.1.1
Port 0/1
Move MAC
address
k
Active Lin
Port 0/5
fnC0026mp
mac-address-table station-move refresh-arp
configured at time of NIC teaming
MAC Move Optimization
Station-move detection takes 5000ms because this is the interval at which the detection algorithm runs.
Layer 2 | 175
176
|
Layer 2
www.dell.com | support.dell.com
13
Link Layer Discovery Protocol (LLDP)
An Aggregator auto-configures to support the link layer discovery protocol (LLDP) for the auto-discovery
of network devices. You can use CLI commands to display acquired LLDP information, clear LLDP
counters, and debug LACP operation.
Overview
LLDP—defined by IEEE 802.1AB—is a protocol that enables a local area network (LAN) device to
advertise its configuration and receive configuration information from adjacent LLDP-enabled LAN
infrastructure devices. The collected information is stored in a management information base (MIB) on
each device, and is accessible via a simple network management protocol (SNMP).
Protocol Data Units
Configuration information is exchanged in the form of type, length, value (TLV) segments. Figure 13-1
shows the Chassis ID TLV.
•
•
•
Type—Indicates the type of field that a part of the message represents.
Length—Indicates the size of the value field (in bytes).
Value—Indicates the data for this part of the message.
Figure 13-1. Type, Length, Value (TLV) Segment
TLV Header
TLV Type
(1-127)
7 bits
TLV Length
9 bits
Value
0-511 octets
Chassis ID Sub-type
Chassis ID
fnC0057mp
1 octet
1- 255 octets
TLVs are encapsulated in a frame called an LLDP data unit (LLDPDU) (Figure 13-2), which is transmitted
from one LLDP-enabled device to its LLDP-enabled neighbors. LLDP is a one-way protocol.
LLDP-enabled devices (LLDP agents) can transmit and/or receive advertisements, but they cannot solicit
and do not respond to advertisements.
Link Layer Discovery Protocol (LLDP) | 177
www.dell.com | support.dell.com
There are five types of TLVs (Table 13-1). All types are mandatory in the construction of an LLDPDU
except Optional TLVs. You can configure the inclusion of individual Optional TLVs.
Table 13-1.
Type
Type, Length, Value (TLV) Types
TLV
Description
0
End of LLDPDU
Marks the end of an LLDPDU.
1
Chassis ID
The Chassis ID TLV is a mandatory TLV that identifies the chassis containing the IEEE
802 LAN station associated with the transmitting LLDP agent.
2
Port ID
The Port ID TLV is a mandatory TLV that identifies the port component of the MSAP
identifier associated with the transmitting LLDP agent.
3
Time to Live
The Time To Live TLV indicates the number of seconds that the recipient LLDP agent
considers the information associated with this MSAP identifier to be valid.
—
Optional
Includes sub-types of TLVs that advertise specific configuration information. These
sub-types are Management TLVs, IEEE 802.1, IEEE 802.3, and TIA-1057
Organizationally Specific TLVs.
Figure 13-2. LLDPDU Frame
Start Frame
Delimiter
Preamble
Destination MAC
(01:80:C2:00:00:0E)
TLV 1
Chassis ID
Source MAC
TLV 2
Port ID
Ethernet Type
(0x88CC)
TLV 3
Port Description
TLV 4
System Name
LLDPDU
Padding
TLV 6
TLV 7
TLV 5
System Description System Capabilities Management Addr
FCS
TLV 127
Organizationally Specific
TLV 0
End of LLDPDU
fnC0047mp
Optional TLVs
The Dell Networking operating software (FTOS) supports the following optional TLVs:
•
•
•
Management TLVs
IEEE 802.1 and 802.3 Organizationally Specific TLVs
TIA-1057 Organizationally Specific TLVs
Management TLVs
A Management TLV is an Optional TLVs sub-type. This kind of TLV contains essential management
information about the sender. The five types are described in Table 13-2.
178
|
Link Layer Discovery Protocol (LLDP)
Organizationally Specific TLVs
Organizationally specific TLVs can be defined by a professional organization or a vendor. They have two
mandatory fields (Figure 13-3) in addition to the basic TLV fields (Figure 13-1):
•
Organizationally Unique Identifier (OUI)—a unique number assigned by the IEEE to an organization
or vendor.
OUI Sub-type—These sub-types indicate the kind of information in the following data field. The
sub-types are determined by the owner of the OUI.
•
Figure 13-3. Organizationally Specific TLV
TLV Type
(127)
TLV Length
Organizationally
Unique ID
(OUI)
Organizationally
Defined Sub-type
Organizationally Specific
Data
3 octets
1 octet
0 - 507 octets
fnC0052mp
7 bits
9 bits
IEEE Organizationally Specific TLVs
Eight TLV types have been defined by the IEEE 802.1 and 802.3 working groups (Table 13-2) as a basic
part of LLDP; the IEEE OUI is 00-80-C2. You can configure an Aggregator to advertise any or all of these
TLVs.
Table 13-2.
Optional TLV Types
Type TLV
Description
Optional TLVs
4
Port description
A user-defined alphanumeric string that describes the port. FTOS does not
currently support this TLV.
5
System name
A user-defined alphanumeric string that identifies the system.
6
System description
A user-defined alphanumeric string that describes the system.
7
System capabilities
An optional TLV that identifies the primary functions of the system and
whether or not these primary functions are enabled; for example, repeater,
bridge, WLAN access point, router, telephone, DOCSIS cable device, end
station only).
8
Management address
Indicates the network address of the management interface. FTOS does not
currently support this TLV.
IEEE 802.1 Organizationally Specific TLVs
127
Port-VLAN ID
On Dell Networking systems, indicates the untagged VLAN to which a port
belongs.
127
Port and Protocol VLAN ID
On Dell Networking systems, indicates the tagged VLAN to which a port
belongs (and the untagged VLAN to which a port belongs if the port is in
hybrid mode).
127
VLAN Name
Indicates the user-defined alphanumeric string that identifies the VLAN.
127
Protocol Identity
Indicates the protocols that the port can process. FTOS does not currently
support this TLV.
Link Layer Discovery Protocol (LLDP) | 179
www.dell.com | support.dell.com
Table 13-2.
Optional TLV Types
Type TLV
Description
IEEE 802.3 Organizationally Specific TLVs
127
MAC/PHY Configuration/Status
Indicates the capability and current setting of the duplex status and bit rate, and
whether the current settings are the result of auto-negotiation. This TLV is not
available in the FTOS implementation of LLDP, but is available and mandatory
(non-configurable) in the LLDP-MED implementation.
127
Power via MDI
Dell Networking supports the LLDP-MED protocol, which recommends that
Power via MDI TLV is not implemented, and therefore Dell Networking
implements Extended Power via MDI TLV only.
127
Link Aggregation
Indicates whether the link is capable of being aggregated, whether it is currently
in a LAG, and the port identification of the LAG. FTOS does not currently
support this TLV.
127
Maximum Frame Size
Detects mis-configurations or incompatibility between two stations with
different maximum supported frame sizes.
TIA-1057 (LLDP-MED) Overview
Link layer discovery protocol—media endpoint discovery (LLDP-MED)—as defined by ANSI/
TIA-1057— provides additional organizationally specific TLVs so that endpoint devices and network
connectivity devices can advertise their characteristics and configuration information; the OUI for the
Telecommunications Industry Association (TIA) is 00-12-BB.
•
•
LLDP-MED Endpoint Device—any device that is on an IEEE 802 LAN network edge can
communicate using IP and uses the LLDP-MED framework.
LLDP-MED Network Connectivity Device—any device that provides access to an IEEE 802 LAN
to an LLDP-MED endpoint device and supports IEEE 802.1AB (LLDP) and TIA-1057 (LLDP-MED).
The Dell Networking system is an LLDP-MED network connectivity device.
With regard to connected endpoint devices, LLDP-MED provides network connectivity devices with the
ability to:
•
•
•
•
manage inventory
manage Power over Ethernet (PoE)
identify physical location
identify network policy
LLDP-MED is designed for, but not limited to, voice over IP (VoIP) endpoints.
180
|
Link Layer Discovery Protocol (LLDP)
TIA Organizationally Specific TLVs
The Dell Networking system is an LLDP-MED Network Connectivity Device (Device Type 4). Network
connectivity devices are responsible for:
•
•
transmitting an LLDP-MED capabilities TLV to endpoint devices
storing the information that endpoint devices advertise
Table 13-3 list the five types of TIA-1057 Organizationally Specific TLVs.
Table 13-3.
Type
TIA-1057 (LLDP-MED) Organizationally Specific TLVs
Sub-type
TLV
Description
127
1
LLDP-MED Capabilities
Indicates:
• whether the transmitting device supports LLDP-MED
• what LLDP-MED TLVs it supports
• LLDP device class
127
2
Network Policy
Indicates the application type, VLAN ID, Layer 2 Priority, and
DSCP value
127
3
Location Identification
Indicates the physical location of the device expressed in one of
three possible formats:
• Coordinate Based LCI
• Civic Address LCI
• Emergency Call Services ELIN
127
4
Extended Power via MDI
Indicates power requirements, priority, and power status
Inventory Management TLVs
Implementation of this set of TLVs is optional in LLDP-MED
devices. None or all TLVs must be supported. FTOS does not
currently support these TLVs.
127
5
Inventory - Hardware Revision
Indicates the hardware revision of the LLDP-MED device.
127
6
Inventory - Firmware Revision
Indicates the firmware revision of the LLDP-MED device.
127
7
Inventory - Software Revision
Indicates the software revision of the LLDP-MED device.
127
8
Inventory - Serial Number
Indicates the device serial number of the LLDP-MED device.
127
9
Inventory - Manufacturer Name
Indicates the manufacturer of the LLDP-MED device.
127
10
Inventory - Model Name
Indicates the model of the LLDP-MED device.
127
11
Inventory - Asset ID
Indicates a user specified device number to manage inventory.
127
12-255
Reserved
—
Link Layer Discovery Protocol (LLDP) | 181
www.dell.com | support.dell.com
LLDP-MED Capabilities TLV
The LLDP-MED Capabilities TLV communicates the types of TLVs that the endpoint device and the
network connectivity device support. LLDP-MED network connectivity devices must transmit the
Network Policies TLV.
•
•
The value of the LLDP-MED Capabilities field in the TLV is a 2 octet bitmap (Figure 13-4), each bit
represents an LLDP-MED capability (Table 13-4).
The possible values of the LLDP-MED Device Type is listed in Table 13-5. The Dell Networking
system is a Network Connectivity device, which is Type 4.
When you enable LLDP-MED in FTOS (using the advertise med command), the system begins transmitting
this TLV.
Figure 13-4. LLDP-MED Capabilities TLV
TLV Type
(127)
Organizationally Organizationally
Unique ID
Defined Sub-type
(00-12-BB)
(1)
TLV Length
(7)
LLDP-MED Capabilites
(00000000 00001111)
LLDP-MED Device
Type
(4)
fnC0053mp
7 bits
3 octets
9 bits
Table 13-4.
1 octet
2 octets
FTOS LLDP-MED Capabilities
Bit Position
TLV
FTOS Support
0
LLDP-MED Capabilities
Yes
1
Network Policy
Yes
2
Location Identification
Yes
3
Extended Power via MDI-PSE
Yes
4
Extended Power via MDI-PD
No
5
Inventory
No
6-15
reserved
No
Table 13-5.
LLDP-MED Device Types
Value
|
Device Type
0
Type Not Defined
1
Endpoint Class 1
2
Endpoint Class 2
3
Endpoint Class 3
4
Network Connectivity
5-255
182
1 octet
Link Layer Discovery Protocol (LLDP)
Reserved
LLDP-MED Network Policies TLV
A network policy in the context of LLDP-MED is a device’s virtual local area network (VLAN)
configuration and associated Layer 2 and Layer 3 configurations, specifically:
•
•
•
•
VLAN ID
VLAN tagged or untagged status
Layer 2 priority
DSCP value
The application type is represented by an integer (the Type integer in Table 13-6), which indicates a device
function for which a unique network policy is defined. An individual LLDP-MED Network Policy TLV is
generated for each application type that you specify with the FTOS command line interface (CLI).
Note: With regard to Table 13-6, signaling is a series of control packets that are exchanged between an
endpoint device and a network connectivity device to establish and maintain a connection. These signal
packets might require a different network policy than the media packets for which a connection is made. In
this case, configure the signaling application.
Table 13-6.
Type
Network Policy Applications
Application
Description
0
Reserved
1
Voice
Specify this application type for dedicated IP telephony handsets and other appliances
supporting interactive voice services.
2
Voice Signaling
Specify this application type only if voice control packets use a separate network
policy than voice data.
3
Guest Voice
Specify this application type for a separate limited voice service for guest users with
their own IP telephony handsets and other appliances supporting interactive voice
services.
4
Guest Voice Signaling
Specify this application type only if guest voice control packets use a separate network
policy than voice data.
5
Softphone Voice
Softphone is a computer program that enables IP telephony on a computer, rather than
using a phone. Specify this application type for this type of endpoint device.
6
Video Conferencing
Specify this application type for dedicated video conferencing and other similar
appliances supporting real-time interactive video.
7
Streaming Video
Specify this application type for broadcast or multicast based video content distribution
and other similar applications supporting streaming video services. This does not
include video applications relying on TCP with buffering.
8
Video Signaling
Specify this application type only if video control packets use a separate network
policy than video data.
9-255 Reserved
—
—
Link Layer Discovery Protocol (LLDP) | 183
www.dell.com | support.dell.com
Figure 13-5. LLDP-MED Policies TLV
TLV Type
(127)
7 bits
TLV Length
(8)
9 bits
Organizationally Organizationally
Unique ID
Defined Sub-type
(00-12-BB)
(2)
3 octets
1 octet
Application Type
(0-255)
1 octet
U
T
X
(0)
3 bits
VLAN ID
(0-4095)
L2 Priority
(0-7)
DSCP Value
(0-63)
12 bits
3 bits
6 bits
Extended Power via MDI TLV
The Extended Power via MDI TLV enables advanced power over Ethernet (PoE) management between
LLDP-MED endpoints and network connectivity devices (Figure 13-6). Advertise the Extended Power via
MDI on all ports that are connected to an 802.3af powered, LLDP-MED endpoint device.
•
•
•
•
Power Type—there are two possible power types: power sourcing entity (PSE) or power device (PD).
The Dell Networking system is a PSE, which corresponds to a value of 0, based on the TIA-1057
specification.
Power Source—there are two possible power sources: Primary and Backup. The Dell Networking
system is a Primary Power Source, which corresponds to a value of 1, based on the TIA-1057
specification.
Power Priority—there are three possible priorities: Low, High, and Critical. On Dell Networking
systems, the default power priority is High, which corresponds to a value of 2 based on the TIA-1057
specification. You can configure a different power priority through the CLI. Dell Networking also
honors the power priority value sent by the powered device. However, the CLI configuration takes
precedence.
Power Value—Dell Networking advertises the maximum amount of power that can be supplied on the
port. By default it is 15.4W, which corresponds to a Power Value of 130, based on the TIA-1057
specification. You can advertise a different Power Value using the max-milliwatts option with the power
inline auto | static command. Dell Networking also honors the power value (power requirement) sent by
the powered device when the port is configured for power inline auto.
Figure 13-6. Extended Power via MDI TLV
TLV Type
(127)
TLV Length
(7)
Organizationally Organizationally
Unique ID
Defined Sub-type
(00-12-BB)
(4)
Power Type
(0)
Power Source
(1)
Power Priority
(2)
2 bits
4 bits
Power Value
(130)
fnC0056mp
7 bits
184
|
9 bits
3 octets
Link Layer Discovery Protocol (LLDP)
1 octet
2 bits
2 octets
LLDP Operation
On an Aggregator, LLDP operates as follows:
•
•
•
•
•
•
LLDP is enabled by default.
LLDPDUs are transmitted and received by default. LLDPDUs are transmitted periodically. The default
interval is 30 seconds.
LLDPDU information received from a neighbor expires after the default Time to Live (TTL) value:
120 seconds.
FTOS supports up to eight neighbors per interface.
FTOS supports a maximum of 8000 total neighbors per system. If the number of interfaces multiplied
by eight exceeds the maximum, the system does not configure more than 8000.
LLDP is not hitless.
Viewing the LLDP Configuration
To display the LLDP configuration, use the show config command in either CONFIGURATION or
INTERFACE mode (Figure 13-7) and (Figure 13-8).
Figure 13-7. Viewing LLDP Global Configurations
R1(conf)#protocol lldp
R1(conf-lldp)#show config
!
protocol lldp
advertise dot1-tlv port-protocol-vlan-id port-vlan-id
advertise dot3-tlv max-frame-size
advertise management-tlv system-capabilities system-description
hello 10
no disable
R1(conf-lldp)#
Figure 13-8. Viewing LLDP Interface Configurations
R1(conf)#interface tengigabitethernet 1/31
R1(conf-if-te-1/31)#show config
!
interface TenGigabitEthernet 1/31
no ip address
!
no shutdown
R1(conf-if-te-1/31)#protocol lldp
R1(conf-if-te-1/31-lldp)#show config
!
protocol lldp
R1(conf-if-te-1/31-lldp)#
Link Layer Discovery Protocol (LLDP) | 185
www.dell.com | support.dell.com
Viewing Information Advertised by Adjacent LLDP Agents
186
|
To display brief information about adjacent devices, use the show lldp neighbors command (Figure 13-9). To
display all of the information that neighbors are advertising, use the show lldp neighbors detail command
(Figure 13-10).
Figure 13-9. Viewing Brief Information Advertised by Adjacent LLDP Agents
R1(conf-if-te-1/31)#do show lldp neighbors
Loc PortID
Rem Host Name
Rem Port Id
Rem Chassis Id
------------------------------------------------------------------------Te 0/2
Te 0/3
-
Link Layer Discovery Protocol (LLDP)
00:00:c9:b1:3b:82
00:00:c9:ad:f6:12
00:00:c9:b1:3b:82
00:00:c9:ad:f6:12
Figure 13-10.
Viewing All Information Advertised by Adjacent LLDP Agent
FTOS#show lldp neighbors detail
========================================================================
Local Interface Te 0/2 has 1 neighbor
Total Frames Out: 16843
Total Frames In: 17464
Total Neighbor information Age outs: 0
Total Multiple Neighbors Detected: 0
Total Frames Discarded: 0
Total In Error Frames: 0
Total Unrecognized TLVs: 0
Total TLVs Discarded: 0
Next packet will be sent after 16 seconds
The neighbors are given below:
----------------------------------------------------------------------Remote Chassis ID Subtype: Mac address (4)
Remote Chassis ID: 00:00:c9:b1:3b:82
Remote Port Subtype: Mac address (3)
Remote Port ID: 00:00:c9:b1:3b:82
Local Port ID: TenGigabitEthernet 0/2
Locally assigned remote Neighbor Index: 7
Remote TTL: 120
Information valid for next 105 seconds
Time since last information change of this neighbor: 1d21h56m
Remote System Desc: Emulex OneConnect 10Gb Multi function Adapter
Existing System Capabilities: Station only
Enabled System Capabilities: Station only
--------------------------------------------------------------------------========================================================================
Local Interface Te 0/3 has 1 neighbor
Total Frames Out: 39165
Total Frames In: 40650
Total Neighbor information Age outs: 0
Total Multiple Neighbors Detected: 0
Total Frames Discarded: 0
Total In Error Frames: 0
Total Unrecognized TLVs: 0
Total TLVs Discarded: 0
Next packet will be sent after 4 seconds
The neighbors are given below:
----------------------------------------------------------------------Remote Chassis ID Subtype: Mac address (4)
Remote Chassis ID: 00:00:c9:ad:f6:12
Remote Port Subtype: Mac address (3)
Remote Port ID: 00:00:c9:ad:f6:12
Local Port ID: TenGigabitEthernet 0/3
Link Layer Discovery Protocol (LLDP) | 187
www.dell.com | support.dell.com
Clearing LLDP Counters
188
|
You can clear LLDP statistics that are maintained on an Aggregator for LLDP counters for frames
transmitted to and received from neighboring devices on all or a specified physical interface.
To clear LLDP counters, enter the clear lldp counters command.
Command Syntax
Command Mode
Purpose
clear lldp counters [interface]
EXEC Privilege
Clear counters for LLDP frames sent to and received from
neighboring devices on all Aggregator interfaces or on a
specified interface.
interface specifies a 10GbE uplink port in the format:
tenGigabitEthernet slot/port.
Link Layer Discovery Protocol (LLDP)
Debugging LLDP
The debug lldp command allows you to view the TLVs that your system is sending and receiving.
•
•
Use the debug lldp brief command to view a readable version of the TLVs.
Use the debug lldp detail command to view a readable version of the TLVs plus a hexadecimal version of
the entire LLDPDU.
Figure 13-11.
debug lldp detail—LLDPDU Packet Dissection
Link Layer Discovery Protocol (LLDP) | 189
www.dell.com | support.dell.com
Relevant Management Objects
FTOS supports all IEEE 802.1AB MIB objects.
•
•
•
•
Table 13-7.
Table 13-7 lists the objects associated with received and transmitted TLVs.
Table 13-8 lists the objects associated with the LLDP configuration on the local agent.
Table 13-9 lists the objects associated with IEEE 802.1AB Organizationally Specific TLVs.
Table 13-10 lists the objects associated with received and transmitted LLDP-MED TLVs.
LLDP Configuration MIB Objects
MIB Object Category
LLDP Variable
LLDP MIB Object
Description
LLDP Configuration
adminStatus
lldpPortConfigAdminStatus
Whether the local LLDP agent is
enabled for transmit, receive, or both
msgTxHold
lldpMessageTxHoldMultiplier Multiplier value
msgTxInterval
lldpMessageTxInterval
Transmit Interval value
rxInfoTTL
lldpRxInfoTTL
Time to Live for received TLVs
txInfoTTL
lldpTxInfoTTL
Time to Live for transmitted TLVs
Basic TLV Selection
LLDP Statistics
mibBasicTLVsTxEnable lldpPortConfigTLVsTxEnable Indicates which management TLVs
are enabled for system ports
mibMgmtAddrInstanceT lldpManAddrPortsTxEnable
xEnable
The management addresses defined
for the system and and the ports
through which they are enabled for
transmission
statsAgeoutsTotal
Total number of times that a
neighbors information is deleted on
the local system due to an rxInfoTTL
timer expiration
lldpStatsRxPortAgeoutsTotal
statsFramesDiscardedTot lldpStatsRxPortFramesDiscar
al
dedTotal
Total number of LLDP frames
received then discarded
statsFramesInErrorsTotal lldpStatsRxPortFramesErrors
Total number of LLDP frames
received on a port with errors
statsFramesInTotal
lldpStatsRxPortFramesTotal
Total number of LLDP frames
received through the port
statsFramesOutTotal
lldpStatsTxPortFramesTotal
Total number of LLDP frames
transmitted through the port
statsTLVsDiscardedTotal lldpStatsRxPortTLVsDiscarde Total number of TLVs received then
dTotal
discarded
statsTLVsUnrecognizedT lldpStatsRxPortTLVsUnrecog Total number of all TLVs the local
otal
nizedTotal
agent does not recognize
190
|
Link Layer Discovery Protocol (LLDP)
Table 13-8.
LLDP System MIB Objects
TLV Type
TLV Name
TLV Variable
System
LLDP MIB Object
1
Chassis ID
chassis ID subtype
Local
lldpLocChassisIdSubtype
Remote
lldpRemChassisIdSubtype
Local
lldpLocChassisId
Remote
lldpRemChassisId
Local
lldpLocPortIdSubtype
Remote
lldpRemPortIdSubtype
Local
lldpLocPortId
Remote
lldpRemPortId
Local
lldpLocPortDesc
Remote
lldpRemPortDesc
Local
lldpLocSysName
Remote
lldpRemSysName
Local
lldpLocSysDesc
Remote
lldpRemSysDesc
Local
lldpLocSysCapSupported
Remote
lldpRemSysCapSupported
Local
lldpLocSysCapEnabled
Remote
lldpRemSysCapEnabled
Local
lldpLocManAddrLen
Remote
lldpRemManAddrLen
Local
lldpLocManAddrSubtype
Remote
lldpRemManAddrSubtype
Local
lldpLocManAddr
Remote
lldpRemManAddr
Local
lldpLocManAddrIfSubtype
Remote
lldpRemManAddrIfSubtype
Local
lldpLocManAddrIfId
Remote
lldpRemManAddrIfId
Local
lldpLocManAddrOID
Remote
lldpRemManAddrOID
chassid ID
2
Port ID
port subtype
port ID
4
5
6
7
8
Port Description
System Name
System Description
System Capabilities
Management Address
port description
system name
system description
system capabilities
enabled capabilities
management address length
management address subtype
management address
interface numbering subtype
interface number
OID
Link Layer Discovery Protocol (LLDP) | 191
www.dell.com | support.dell.com
Table 13-9.
LLDP 802.1 Organizationally Specific TLV MIB Objects
TLV Type
TLV Name
TLV Variable
System
LLDP MIB Object
127
Port-VLAN ID
PVID
Local
lldpXdot1LocPortVlanId
Remote
lldpXdot1RemPortVlanId
127
Port and Protocol
VLAN ID
port and protocol VLAN supported Local
port and protocol VLAN enabled
PPVID
127
VLAN Name
VID
VLAN name length
VLAN name
Table 13-10.
|
Remote
lldpXdot1RemProtoVlanSupported
Local
lldpXdot1LocProtoVlanEnabled
Remote
lldpXdot1RemProtoVlanEnabled
Local
lldpXdot1LocProtoVlanId
Remote
lldpXdot1RemProtoVlanId
Local
lldpXdot1LocVlanId
Remote
lldpXdot1RemVlanId
Local
lldpXdot1LocVlanName
Remote
lldpXdot1RemVlanName
Local
lldpXdot1LocVlanName
Remote
lldpXdot1RemVlanName
LLDP-MED System MIB Objects
TLV Sub-Type TLV Name
TLV Variable
System
LLDP-MED MIB Object
1
LLDP-MED Capabilities
Local
lldpXMedPortCapSupported
lldpXMedPortConfigTLVsTx
Enable
Remote
lldpXMedRemCapSupported,
lldpXMedRemConfigTLVsTx
Enable
Local
lldpXMedLocDeviceClass
Remote
lldpXMedRemDeviceClass
LLDP-MED
Capabilities
LLDP-MED Class Type
192
lldpXdot1LocProtoVlanSupported
Link Layer Discovery Protocol (LLDP)
Table 13-10.
LLDP-MED System MIB Objects
TLV Sub-Type TLV Name
TLV Variable
System
LLDP-MED MIB Object
2
Application Type
Local
lldpXMedLocMediaPolicyApp
Type
Remote
lldpXMedRemMediaPolicyAp
pType
Local
lldpXMedLocMediaPolicyUnk
nown
Remote
lldpXMedLocMediaPolicyUnk
nown
Local
lldpXMedLocMediaPolicyTag
ged
Remote
lldpXMedLocMediaPolicyTag
ged
Local
lldpXMedLocMediaPolicyVla
nID
Remote
lldpXMedRemMediaPolicyVl
anID
Local
lldpXMedLocMediaPolicyPrio
rity
Remote
lldpXMedRemMediaPolicyPri
ority
Local
lldpXMedLocMediaPolicyDsc
p
Remote
lldpXMedRemMediaPolicyDs
cp
Local
lldpXMedLocLocationSubtype
Remote
lldpXMedRemLocationSubtyp
e
Local
lldpXMedLocLocationInfo
Remote
lldpXMedRemLocationInfo
Network Policy
Unknown Policy Flag
Tagged Flag
VLAN ID
L2 Priority
DSCP Value
3
Location Identifier
Location Data Format
Location ID Data
Link Layer Discovery Protocol (LLDP) | 193
www.dell.com | support.dell.com
Table 13-10.
LLDP-MED System MIB Objects
TLV Sub-Type TLV Name
TLV Variable
System
LLDP-MED MIB Object
4
Power Device Type
Local
lldpXMedLocXPoEDeviceTyp
e
Remote
lldpXMedRemXPoEDeviceTy
pe
Local
lldpXMedLocXPoEPSEPower
Source,
lldpXMedLocXPoEPDPowerS
ource
Remote
lldpXMedRemXPoEPSEPowe
rSource,
lldpXMedRemXPoEPDPower
Source
Local
lldpXMedLocXPoEPDPowerP
riority,
lldpXMedLocXPoEPSEPortP
DPriority
Remote
lldpXMedRemXPoEPSEPowe
rPriority,
lldpXMedRemXPoEPDPower
Priority
Local
lldpXMedLocXPoEPSEPortPo
werAv,
lldpXMedLocXPoEPDPower
Req
Remote
lldpXMedRemXPoEPSEPowe
rAv,
lldpXMedRemXPoEPDPower
Req
Extended Power via
MDI
Power Source
Power Priority
Power Value
194
|
Link Layer Discovery Protocol (LLDP)
14
Port Monitoring
The Aggregator supports user-configured port monitoring. See Configuring Port Monitoring for the
configuration commands to use.
Port monitoring copies all incoming or outgoing packets on one port and forwards (mirrors) them to
another port. The source port is the monitored port (MD) and the destination port is the monitoring port
(MG).
Important Points to Remember
•
•
•
•
•
•
•
•
Port monitoring is supported on physical ports only; virtual local area network (VLAN) and
port-channel interfaces do not support port monitoring.
The monitored (source, MD) and monitoring ports (destination, MG) must be on the same switch.
The monitored (source) interface must be a server-facing interface in the format slot/port, where the
valid slot numbers are 0 or 1 and server-facing port numbers are from 1 to 32.
The destination interface must be an uplink port (ports 33 to 56).
In general, a monitoring port should have no ip address and no shutdown as the only configuration;
FTOS permits a limited set of commands for monitoring ports. To display these commands, use the
command ?.
A monitoring port may not be a member of a VLAN.
There may only be one destination port in a monitoring session.
A source port (MD) can only be monitored by one destination port (MG). If you try to assign a
monitored port to more than one monitoring port, the following error is displayed (Message 1).
Message 1 Assign a Monitored Port to More than One Monitoring Port
FTOS(conf)#mon ses 1
FTOS(conf-mon-sess-1)#source tengig 0/1 destination tengig 0/33 direction both
FTOS(conf-mon-sess-1)#do show monitor session
SessionID
Source
Destination
Direction
Mode
Type
-------------------------------------1
TenGig 0/1
TenGig 0/33
both
interface
Port-based
FTOS(conf-mon-sess-1)#mon ses 2
FTOS(conf-mon-sess-2)#source tengig 0/1 destination tengig 0/33 direction both
% Error: MD port is already being monitored.
Note: There is no limit to the number of monitoring sessions per system, provided that there are only four
destination ports per port-pipe. If each monitoring session has a unique destination port, the maximum
number of session is four per port-pipe.
Port Monitoring | 195
www.dell.com | support.dell.com
Port Monitoring
The Aggregator supports multiple source-destination statements in a monitor session, but there may only
be one destination port in a monitoring session (Message 2).
Message 2 One Destination Port in a Monitoring Session Error Message
% Error: Only one MG port is allowed in a session.
The number of source ports supported in a port pipe is equal to the number of physical ports in the port
pipe. Multiple source ports may have up to four different destination ports (Message 3).
In Figure 14-1, ports 0/13, 0/14, 0/15, and 0/16 all belong to the same port-pipe. These ports mirror traffic
to four different destinations (0/33, 0/34 0/35, and 0/37). Another source port from the same port-pipe (for
example, 0/17) does not support a new destination (for example, 0/40). If you attempt to configure another
destination, an error message is displayed (Message 3). However, you can configure another monitoring
session that uses one of previously configured destination ports.
Figure 14-1. Number of Monitoring Ports
FTOS#show mon session
SessionID
Source
Destination
Direction
Mode
Type
-------------------------------------0
TenGig 0/13
TenGig 0/33
rx
interface
Port-based
10
TenGig 0/14
TenGig 0/34
rx
interface
Port-based
20
TenGig 0/15
TenGig 0/35
rx
interface
Port-based
30
TenGig 0/16
TenGig 0/37
rx
interface
Port-based
FTOS(conf)# monitor session 300
FTOS(conf-mon-sess-300)# source tengig 0/17 destination tengig 0/40 direction tx
% Error: Exceeding max MG ports for this MD port pipe.
FTOS(conf-mon-sess-300)#
FTOS(conf-mon-sess-300)# source tengig 0/17 destination tengig 0/33 direction tx
FTOS(conf-mon-sess-300)# do show monitor session
SessionID
Source
Destination
Direction
Mode
Type
-------------------------------------0
TenGig 0/13
TenGig 0/33
rx
interface
Port-based
10
TenGig 0/14
TenGig 0/34
rx
interface
Port-based
20
TenGig 0/15
TenGig 0/35
rx
interface
Port-based
30
TenGig 0/16
TenGig 0/37
rx
interface
Port-based
300
TenGig 0/17
TenGig 0/33
tx
interface
Port-based
FTOS(conf-mon-sess-300)#
196
|
Port Monitoring
Figure 14-2 shows ports 0/25 and 0/26 that belong to port pipe 1 with a maximum of four destination ports.
Figure 14-2. Number of Monitoring Ports
FTOS(conf-mon-sess-300)#do show mon session
SessionID
Source
Destination
-----------------------0
TenGig 0/13
TenGig 0/33
10
TenGig 0/14
TenGig 0/34
20
TenGig 0/15
TenGig 0/35
30
TenGig 0/16
TenGig 0/37
100
TenGig 0/25
TenGig 0/38
110
TenGig 0/26
TenGig 0/39
300
TenGig 0/17
TenGig 0/33
FTOS(conf-mon-sess-300)#
Direction
--------rx
rx
rx
rx
tx
tx
tx
Mode
Type
------interface
Port-based
interface
Port-based
interface
Port-based
interface
Port-based
interface
Port-based
interface
Port-based
interface
Port-based
A source port may only be monitored by one destination port (Message 3), but a destination port may
monitor more than one source port.
Message 3 One Destination Port in a Monitoring Session Error Message
% Error: Exceeding max MG ports for this MD port pipe.
Message 4 One Destination Port per Source Port Error Message
% Error: MD port is already being monitored.
FTOS Behavior: All monitored frames are tagged if the configured monitoring direction is transmit
(TX), regardless of whether the monitored port is a Layer 2 or Layer 3 port.
- If the source port is a Layer 2 port, the frames are tagged with the VLAN ID of the VLAN to which the
port belongs.
- If the source port is a Layer 3 port, the frames are tagged with VLAN ID 4095.
- If the source port is in a Layer 3 VLAN, the frames are tagged with the corresponding Layer 3 VLAN
ID.
For example, in the configuration source tengig 1/1 destination tengig 1/41 direction tx, if the source
port 1/1 is an untagged member of any VLAN, all monitored frames that the destination port 1/41
receives are tagged with the VLAN ID of the source port.
Port Monitoring | 197
www.dell.com | support.dell.com
Configuring Port Monitoring
To configure port monitoring, use the following example:
Step
Task
Command Syntax
Command Mode
1
Verify that the intended monitoring port has no
configuration other than no shutdown (Figure 14-3).
show interface
EXEC Privilege
2
Create a monitoring session using the command monitor
session from CONFIGURATION mode (Figure 14-3).
monitor session
CONFIGURATION
3
Specify the source and destination port and direction of
traffic (Figure 14-3).
source
MONITOR SESSION
Note: By default, all uplink ports are assigned to port-channel (LAG) 128 and the destination port in a port
monitoring session must be an uplink port. When you configure the destination port using the source
command, the destination port is removed from LAG 128. To display the uplink ports currently assigned to
LAG 128, enter the show lag 128 command.
To display information on currently configured port-monitoring sessions, use the show monitor session
command from EXEC Privilege mode (Figure 14-3).
Figure 14-3. Displaying Port-based Monitoring
FTOS(conf)# monitor session 0
FTOS(conf-mon-sess-0)# source tengig 1/1 dest tengig 1/42 direction rx
FTOS(conf-mon-sess-0)#exit
FTOS(conf)# do show monitor session 0
SessionID
Source
Destination
Direction
Mode
----------------------------------0
TenGig 1/1
TenGig 1/42
rx
interface
FTOS(conf)#
198
|
Port Monitoring
Type
---Port-based
In Figure 14-4, the host and server are exchanging traffic which passes through the uplink interface 1/1.
Port 1/1 is the monitored port and port 1/42 is the destination port, which is configured to only mirror
traffic received on tengigabitethernet 1/1 (host-originated traffic).
Figure 14-4. Port Monitoring Example
/42
Port Monitoring | 199
200
|
Port Monitoring
www.dell.com | support.dell.com
15
Simple Network Management Protocol (SNMP)
Network management stations use the simple network management protocol (SNMP) to retrieve or alter
management data from network elements. A datum of management information is called a managed
object; the value of a managed object can be static or variable. Network elements store managed objects in
a database called a management information base (MIB).
MIBs are hierarchically structured and use object identifiers to address managed objects, but managed
objects also have a textual name called an object descriptor.
Note: An I/O Aggregator supports standard and private SNMP MIBs, including Get operations in
supported MIBs.
Implementation Information
•
The Dell Networking Operating System (FTOS) supports SNMP version 1 as defined by RFC 1155,
1157, and 1212, SNMP version 2c as defined by RFC 1901.
Configuring the Simple Network Management Protocol
Note: The configurations in this chapter use a UNIX environment with net-snmp version 5.4. This is only
one of many RFC-compliant SNMP utilities you can use to manage the Aggregator using SNMP. Also,
these configurations use SNMP version 2c.
Configuring SNMP version 1 or version 2 requires only a single step:
1. Create a community. See page 202.
Note: IOA supports only Read-only mode.
Important Point to Remember
•
Typically, 5-second timeout and 3-second retry values on an SNMP server are sufficient for both local
area network (LAN) and wide area network (WAN) applications. If you experience a timeout with
these values, increase the timeout value to greater than 3 seconds and increase the retry value to greater
than 2 on your SNMP server.
Simple Network Management Protocol (SNMP) | 201
www.dell.com | support.dell.com
Setting up SNMP
FTOS supports SNMP version 1 and version 2 which are community-based security models. The primary
difference between the two versions is that version 2 supports two additional protocol operations (informs
operation and snmpgetbulk query) and one additional object (counter64 object).
Creating a Community
For SNMPv1 and SNMPv2, you must create a community to enable the community-based security in
FTOS. The management station generates requests to either retrieve or alter the value of a management
object and is called the SNMP manager. A network element that processes SNMP requests is called an
SNMP agent. An SNMP community is a group of SNMP agents and managers that are allowed to interact.
Communities are necessary to secure communication between SNMP managers and agents; SNMP agents
do not respond to requests from management stations that are not part of the community.
FTOS enables SNMP automatically when you create an SNMP community and displays Message 1. You
must specify whether members of the community may retrieve values in Read-Only mode. Read-write
access is not supported.
To create an SNMP community:
Task
Command
Command Mode
Choose a name for the community.
snmp-server community name ro
CONFIGURATION
Message 1 SNMP Enabled
22:31:23: %STKUNIT0-M:CP %SNMP-6-SNMP_WARM_START: Agent Initialized - SNMP WARM_START.
View your SNMP configuration using the show running-config snmp command from EXEC Privilege
mode, as shown in Figure 15-1.
Figure 15-1. Creating an SNMP Community
FTOS(conf)#snmp-server community my-snmp-community ro
22:31:23: %STKUNIT0-M:CP %SNMP-6-SNMP_WARM_START: Agent Initialized - SNMP WARM_START.
FTOS#do show running-config snmp
!
snmp-server community mycommunity ro
FTOS#
Read Managed Object Values
You may only retrieve (read) managed object values if your management station is a member of the same
community as the SNMP agent.
202
|
Simple Network Management Protocol (SNMP)
Dell Networking supports RFC 4001, Textual Conventions for Internet Work Addresses that defines values
representing a type of internet address. These values display for ipAddressTable objects using the
snmpwalk command.
In the following figure, the value “4” displays in the OID before the IP address for IPv4.
>snmpwalk -v 2c -c public 10.11.195.63 1.3.6.1.2.1.4.34
IP-MIB::ip.34.1.3.1.4.1.1.1.1 = INTEGER: 1107787778
IP-MIB::ip.34.1.3.1.4.2.1.1.1 = INTEGER: 1107787779
IP-MIB::ip.34.1.3.2.16.254.128.0.0.0.0.0.0.2.1.232.255.254.139.5.8 = INTEGER: 1107787778
IP-MIB::ip.34.1.4.1.4.1.1.1.1 = INTEGER: 1
IP-MIB::ip.34.1.4.1.4.2.1.1.1 = INTEGER: 1
IP-MIB::ip.34.1.4.2.16.0.1.0.0.0.0.0.0.0.0.0.0.0.0.0.1 = INTEGER: 1
There are several UNIX SNMP commands that read data:
Task
Command
Read the value of a single managed object,
as shown in Figure 15-2.
snmpget -v version -c community agent-ip {identifier.instance |
descriptor.instance}
Figure 15-2. Reading the Value of a Managed Object
> snmpget -v 2c -c mycommunity 10.11.131.161 sysUpTime.0
DISMAN-EVENT-MIB::sysUpTimeInstance = Timeticks: (32852616) 3 days, 19:15:26.16
> snmpget -v 2c -c mycommunity 10.11.131.161 .1.3.6.1.2.1.1.3.0
DISMAN-EVENT-MIB::sysUpTimeInstance = Timeticks: (32856932) 3 days, 19:16:09.32
Read the value of the managed object
directly below the specified object, as
shown in Figure 15-3.
snmpgetnext -v version -c community agent-ip {identifier.instance |
descriptor.instance}
Figure 15-3. Reading the Value of the Next Managed Object in the MIB
> snmpgetnext -v 2c -c mycommunity 10.11.131.161 .1.3.6.1.2.1.1.3.0
SNMPv2-MIB::sysContact.0 = STRING:
> snmpgetnext -v 2c -c mycommunity 10.11.131.161 sysContact.0
SNMPv2-MIB::sysName.0 = STRING:
Read the value of many objects at once, as
shown in Figure 15-4.
snmpwalk -v version -c community agent-ip {identifier.instance |
descriptor.instance}
Figure 15-4. Reading the Value of Many Managed Objects at Once
>snmpwalk -v 2c -c public 10.16.130.148 .1.3.6.1.2.1.1
SNMPv2-MIB::sysDescr.0 = STRING: Dell Force10 OS
Operating System Version: 1.0
Application Software Version: E8-3-17-46
Series: I/O-Aggregator
Copyright (c) 1999-2012 by Dell Inc. All Rights Reserved.
Build Time: Sat Jul 28 03:20:24 PDT 2012
SNMPv2-MIB::sysObjectID.0 = OID: SNMPv2-SMI::enterprises.6027.1.4.2
DISMAN-EVENT-MIB::sysUpTimeInstance = Timeticks: (77916) 0:12:59.16
SNMPv2-MIB::sysContact.0 = STRING:
SNMPv2-MIB::sysName.0 = STRING: FTOS
SNMPv2-MIB::sysLocation.0 = STRING:
SNMPv2-MIB::sysServices.0 = INTEGER: 4
>
Simple Network Management Protocol (SNMP) | 203
www.dell.com | support.dell.com
Displaying the Ports in a VLAN Using SNMP
FTOS identifies VLAN interfaces using an interface index number that is displayed in the show interface
as shown in Figure 15-5.
vlan output,
Figure 15-5. Identifying the VLAN Interface Index Number
FTOS(conf)#do show interface vlan 10
Vlan 10 is down, line protocol is down
Address is 00:01:e8:cc:cc:ce, Current address is 00:01:e8:cc:cc:ce
Interface index is 1107787786
Internet address is not set
MTU 1554 bytes, IP MTU 1500 bytes
LineSpeed auto
ARP type: ARPA, ARP Timeout 04:00:00
Last clearing of "show interface" counters 00:12:42
Queueing strategy: fifo
Time since last interface status change: 00:12:42
To display the ports in a VLAN, send an snmpget request for the object dot1qStaticEgressPorts using the
interface index as the instance number, as shown in Figure 15-6.
Figure 15-6. Display the Ports in a VLAN in SNMP
> snmpget -v2c -c mycommunity 10.11.131.185 .1.3.6.1.2.1.17.7.1.4.3.1.2.1107787786
SNMPv2-SMI::mib-2.17.7.1.4.3.1.2.1107787786 = Hex-STRING:
00 00 00 00 00 00 00 00 00 00 00 00 00 00 00 00
00 00 00 00 00 00 00 00 00 00 00 00 00 00 00 00
00 00 00 00 00 00 00 00 00 00 00 00 00 00 00 00
00 00 00 00 00 00 00 00 00
The table that the Aggregator system sends in response to the snmpget request is a table that contains
hexadecimal (hex) pairs, each pair representing a group of eight ports.
•
Seven hex pairs represents a stack unit. Seven pairs accommodates the greatest number of ports
available on an Aggregator, 56 ports. The last stack unit is assigned eight pairs; the eighth pair is
unused.
The first hex pair, 00 in Figure 15-6, represents ports 1-7 in Stack Unit 0. The next pair to the right
represents ports 8-15. To resolve the hex pair into a representation of the individual ports, convert the hex
pair to binary. Consider the first hex pair 00, which resolves to 0000 0000 in binary:
•
204
|
Each position in the eight-character string is for one port, starting with Port 1 at the left end of the
string, and ending with Port 8 at the right end. A 0 indicates that the port is not a member of the
VLAN; a 1 indicates VLAN membership.
Simple Network Management Protocol (SNMP)
Figure 15-6 shows the output for an Aggregator. All hex pairs are 00, indicating that no ports are assigned
to VLAN 10. In Figure 15-7, Port 0/2 is added to VLAN 10 as untagged. And the first hex pair changes
from 00 to 04.
Figure 15-7. Displaying Ports in a VLAN using SNMP
[Dell Force10 system output]
FTOS(conf)#do show vlan id 10
Codes:
Q: U x G NUM
10
* - Default VLAN, G - GVRP VLANs
Untagged, T - Tagged
Dot1x untagged, X - Dot1x tagged
GVRP tagged, M - Vlan-stack
Status
Inactive
Description
Q Ports
U Tengig 0/2
[Unix system output]
> snmpget -v2c -c mycommunity 10.11.131.185 .1.3.6.1.2.1.17.7.1.4.3.1.2.1107787786
SNMPv2-SMI::mib-2.17.7.1.4.3.1.2.1107787786 = Hex-STRING: 40 00 00 00 00 00 00 00 00 00 00
00 00 00 00 00
00 00 00 00 00 00 00 00 00 00 00 00 00 00 00 00
00 00 00 00 00 00 00 00 00 00 00 00 00 00 00 00
00 00 00 00 00 00 00 00 00
The value 40 is in the first set of seven hex pairs, indicating that these ports are in Stack Unit 0. The hex
value 40 is 0100 0000 in binary. As described above, the left-most position in the string represents Port 1.
The next position from the left represents Port 2 and has a value of 1, indicating that Port 0/2 is in VLAN
10. The remaining positions are 0, so those ports are not in the VLAN.
Fetching Dynamic MAC Entries Using SNMP
Note: The table contains none of the other information provided by the show vlan command, such as port
speed or whether the ports are tagged or untagged.
The Aggregator supports the RFC 1493 dot1d table for the default VLAN and the dot1q table for all other
VLANs.
Note: The 802.1q Q-BRIDGE MIB defines VLANs with regard to 802.1d, as 802.1d itself does not define
them. As a switchport must belong to a VLAN (the default VLAN or a configured VLAN), all MAC address
learned on a switchport are associated with a VLAN. For this reason, the Q-Bridge MIB is used for MAC
address query. Moreover, specific to MAC address query, dot1dTpFdbTable is indexed by MAC address
only for a single forwarding database, while dot1qTpFdbTable has two indices —VLAN ID and MAC
address —to allow for multiple forwarding databases and considering that the same MAC address is
learned on multiple VLANs. The VLAN ID is added as the first index so that MAC addresses can be read
by VLAN and sorted lexicographically. The MAC address is part of the object identifier (OID) instance, so
in this case, lexicographic order is according to the most significant octet.
Simple Network Management Protocol (SNMP) | 205
www.dell.com | support.dell.com
Table 15-1.
MIB Objects for Fetching Dynamic MAC Entries in the Forwarding Database
MIB Object
OID
dot1dTpFdbTable .1.3.6.1.2.1.17.4.3
Description
MIB
List the learned unicast MAC addresses on the
default VLAN.
Q-BRIDGE MIB
dot1qTpFdbTable .1.3.6.1.2.1.17.7.1.2. List the learned unicast MAC addresses on
2
non-default VLANs.
dot3aCurAggFdb
Table
.1.3.6.1.4.1.6027.3.2. List the learned MAC addresses of aggregated
1.1.5
links (LAG).
F10-LINK-AGGREGATION
-MIB
In Figure 15-8, R1 has one dynamic MAC address, learned off of port TenGigabitEthernet 1/21, which is a
member of the default VLAN, VLAN 1. The SNMP walk returns the values for dot1dTpFdbAddress,
dot1dTpFdbPort, and dot1dTpFdbStatus.
Each object is comprised of an OID concatenated with an instance number. In the case of these objects, the
instance number is the decimal equivalent of the MAC address; derive the instance number by converting
each hex pair to its decimal equivalent. For example, the decimal equivalent of E8 is 232, and so the
instance number for MAC address 00:01:e8:06:95:ac is 0.1.232.6.149.172.
The value of dot1dTpFdbPort is the port number of the port off which the system learns the MAC address.
In this case, of TenGigabitEthernet 1/21, the manager returns the integer 118.
Figure 15-8. Fetching Dynamic MAC Addresses on the Default VLAN
-----------------------------MAC Addresses on Dell Force10
System------------------------------FTOS#show mac-address-table
VlanId
Mac Address
Type
Interface
State
1
00:01:e8:06:95:ac
Dynamic Tengig 1/21
Active
------------------------------Query from Management Station------------------------------->snmpwalk -v 2c -c techpubs 10.11.131.162 .1.3.6.1.2.1.17.4.3.1
SNMPv2-SMI::mib-2.17.4.3.1.1.0.1.232.6.149.172 = Hex-STRING: 00 01 E8 06 95 AC
SNMPv2-SMI::mib-2.17.4.3.1.2.0.1.232.6.149.172 = INTEGER: 118
SNMPv2-SMI::mib-2.17.4.3.1.3.0.1.232.6.149.172 = INTEGER: 3
In Figure 15-9, TenGigabitEthernet 1/21 is moved to VLAN 1000, a non-default VLAN. Use the objects
dot1qTpFdbTable to fetch the MAC addresses learned on non-default VLANs. The instance number is the
VLAN number concatenated with the decimal conversion of the MAC address.
Figure 15-9. Fetching Dynamic MAC Addresses on Non-default VLANs
-----------------------------MAC Addresses on Dell Force10
System------------------------------FTOS#show mac-address-table
VlanId
Mac Address
Type
Interface
State
1000
00:01:e8:06:95:ac
Dynamic Tengig 1/21
Active
------------------------------Query from Management Station------------------------------->snmpwalk -v 2c -c techpubs 10.11.131.162 .1.3.6.1.2.1.17.7.1.2.2.1
SNMPv2-SMI::mib-2.17.7.1.2.2.1.2.1000.0.1.232.6.149.172 = INTEGER: 118
SNMPv2-SMI::mib-2.17.7.1.2.2.1.3.1000.0.1.232.6.149.172 = INTEGER: 3
206
|
Simple Network Management Protocol (SNMP)
To fetch the learned MAC address of a port-channel use dot3aCurAggFdbTable. The instance number is
the decimal conversion of the MAC address concatenated with the port-channel number.
Figure 15-10.
Fetching Dynamic MAC Addresses on the Default VLAN
-----------------------------MAC Addresses on Dell Force10
System------------------------------FTOS(conf)#do show mac-address-table
VlanId
Mac Address
Type
Interface
State
1000
00:01:e8:06:95:ac
Dynamic Po 1
Active
------------------------------Query from Management Station------------------------------->snmpwalk -v 2c -c techpubs 10.11.131.162 .1.3.6.1.4.1.6027.3.2.1.1.5
SNMPv2-SMI::enterprises.6027.3.2.1.1.5.1.1.1000.0.1.232.6.149.172.1 = INTEGER: 1000
SNMPv2-SMI::enterprises.6027.3.2.1.1.5.1.2.1000.0.1.232.6.149.172.1 = Hex-STRING: 00 01 E8
06 95 AC
SNMPv2-SMI::enterprises.6027.3.2.1.1.5.1.3.1000.0.1.232.6.149.172.1 = INTEGER: 1
SNMPv2-SMI::enterprises.6027.3.2.1.1.5.1.4.1000.0.1.232.6.149.172.1 = INTEGER: 1
Deriving Interface Indices
FTOS assigns an interface number to each (configured or unconfigured) physical and logical interface.
Display the interface index number using the show interface command from EXEC Privilege mode, as
shown in Figure 15-11.
Figure 15-11.
Display the Interface Index Number
FTOS#show interface tengig 1/21
TenGigabitEthernet 1/21 is up, line protocol is up
Hardware is Dell Force10Eth, address is 00:01:e8:0d:b7:4e
Current address is 00:01:e8:0d:b7:4e
Interface index is 72925242
[output omitted]
The interface index is a binary number with bits that indicate the slot number, port number, interface type,
and card type of the interface. FTOS converts this binary index number to decimal, and displays it in the
show interface command output.
Figure 15-12.
1 bit
Interface Index Binary Calculations
1 bit
5 bits
Unused P/L Flag Slot Number
7 bits
4 bits
Port Number
Interface Type
14 bits
Card Type
Simple Network Management Protocol (SNMP) | 207
www.dell.com | support.dell.com
Starting from the least significant bit (LSB):
•
•
•
•
•
•
the first 14 bits represent the card type
the next 4 bits represent the interface type
the next 7 bits represent the port number
the next 5 bits represent the slot number
the next 1 bit is 0 for a physical interface and 1 for a logical interface
the next 1 bit is unused
For example, the index 44634369 is 10101010010001000100000001 in binary. The binary interface index
for TenGigabitEthernet 0/41 of an Aggregator is shown in Figure 15-13. Notice that the physical/logical bit
and the final, unused bit are not given. The interface is physical, so this must be represented by a 0 bit, and
the unused bit is always 0. These two bits are not given because they are the most significant bits, and
leading zeros are often omitted.
Figure 15-13.
Binary Representation of Interface Index
For interface indexing, slot and port numbering begins with binary one. If the Dell Networking system
begins slot and port numbering from 0, binary 1 represents slot and port 0. In S4810, the first interface is 0/
0, but in the Aggregator the first interface is 0/1. Hence, in the Aggregator 0/0s Ifindex is unused and
Ifindex creation logic is not changed. Because Zero is reserved for logical interfaces, it starts from 1. For
the first interface, port number is set to 1. Adding it causes an increment by 1 for the next interfaces, so it
only starts from 2.Therefore, the port number is set to 42 for 0/41.
208
|
Simple Network Management Protocol (SNMP)
Monitor Port-channels
Note: The interface index does not change if the interface reloads or fails over. If the unit is renumbered
(for any reason) the interface index changes during a reload.
To check the status of a Layer 2 port-channel, use f10LinkAggMib (.1.3.6.1.4.1.6027.3.2). Below, Po 1 is a
switchport and Po 2 is in Layer 3 mode.
[senthilnathan@lithium ~]$ snmpwalk -v 2c -c public 10.11.1.1 .1.3.6.1.4.1.6027.3.2.1.1
SNMPv2-SMI::enterprises.6027.3.2.1.1.1.1.1.1 = INTEGER: 1
SNMPv2-SMI::enterprises.6027.3.2.1.1.1.1.1.2 = INTEGER: 2
SNMPv2-SMI::enterprises.6027.3.2.1.1.1.1.2.1 = Hex-STRING: 00 01 E8 13 A5 C7
SNMPv2-SMI::enterprises.6027.3.2.1.1.1.1.2.2 = Hex-STRING: 00 01 E8 13 A5 C8
SNMPv2-SMI::enterprises.6027.3.2.1.1.1.1.3.1 = INTEGER: 1107755009
SNMPv2-SMI::enterprises.6027.3.2.1.1.1.1.3.2 = INTEGER: 1107755010
SNMPv2-SMI::enterprises.6027.3.2.1.1.1.1.4.1 = INTEGER: 1
SNMPv2-SMI::enterprises.6027.3.2.1.1.1.1.4.2 = INTEGER: 1
SNMPv2-SMI::enterprises.6027.3.2.1.1.1.1.5.1 = Hex-STRING: 00 00
SNMPv2-SMI::enterprises.6027.3.2.1.1.1.1.5.2 = Hex-STRING: 00 00
SNMPv2-SMI::enterprises.6027.3.2.1.1.1.1.6.1 = STRING: "Tengig 5/84 " << Channel member for Po1
SNMPv2-SMI::enterprises.6027.3.2.1.1.1.1.6.2 = STRING: "Tengig 5/85 " << Channel member for Po2
dot3aCommonAggFdbIndex
SNMPv2-SMI::enterprises.6027.3.2.1.1.6.1.1.1107755009.1 = INTEGER: 1107755009
dot3aCommonAggFdbVlanId
SNMPv2-SMI::enterprises.6027.3.2.1.1.6.1.2.1107755009.1 = INTEGER: 1
dot3aCommonAggFdbTagConfig
SNMPv2-SMI::enterprises.6027.3.2.1.1.6.1.3.1107755009.1 = INTEGER: 2 (Tagged 1 or Untagged 2)
dot3aCommonAggFdbStatus
SNMPv2-SMI::enterprises.6027.3.2.1.1.6.1.4.1107755009.1 = INTEGER: 1 << Status active, 2 – status inactive
If you learn the MAC address for the LAG, the LAG status also displays.
dot3aCurAggVlanId
SNMPv2-SMI::enterprises.6027.3.2.1.1.4.1.1.1.0.0.0.0.0.1.1
dot3aCurAggMacAddr
SNMPv2-SMI::enterprises.6027.3.2.1.1.4.1.2.1.0.0.0.0.0.1.1
dot3aCurAggIndex
SNMPv2-SMI::enterprises.6027.3.2.1.1.4.1.3.1.0.0.0.0.0.1.1
dot3aCurAggStatus
SNMPv2-SMI::enterprises.6027.3.2.1.1.4.1.4.1.0.0.0.0.0.1.1
inactive
= INTEGER: 1
= Hex-STRING: 00 00 00 00 00 01
= INTEGER: 1
= INTEGER: 1 << Status active, 2 – status
Simple Network Management Protocol (SNMP) | 209
www.dell.com | support.dell.com
For L3 LAG, you do not have this support.
SNMPv2-MIB::sysUpTime.0 = Timeticks: (8500842) 23:36:48.42
SNMPv2-MIB::snmpTrapOID.0 = OID: IF-MIB::linkDown
IF-MIB::ifIndex.33865785 = INTEGER: 33865785
SNMPv2-SMI::enterprises.6027.3.1.1.4.1.2 = STRING: "OSTATE_DN: Changed interface state to down: Tengig 0/
0"
2010-02-10 14:22:39 10.16.130.4 [10.16.130.4]:
SNMPv2-MIB::sysUpTime.0 = Timeticks: (8500842) 23:36:48.42
SNMPv2-MIB::snmpTrapOID.0 = OID: IF-MIB::linkDown
IF-MIB::ifIndex.1107755009 = INTEGER: 1107755009
SNMPv2-SMI::enterprises.6027.3.1.1.4.1.2 = STRING: "OSTATE_DN: Changed interface state to down: Po 1"
2010-02-10 14:22:40 10.16.130.4 [10.16.130.4]:
SNMPv2-MIB::sysUpTime.0 = Timeticks: (8500932) 23:36:49.32
SNMPv2-MIB::snmpTrapOID.0 = OID:
IF-MIB::linkUp IF-MIB::ifIndex.33865785 = INTEGER: 33865785
SNMPv2-SMI::enterprises.6027.3.1.1.4.1.2 =
STRING: "OSTATE_UP: Changed interface state to up: Tengig 0/0"
2010-02-10 14:22:40 10.16.130.4 [10.16.130.4]:
SNMPv2-MIB::sysUpTime.0 = Timeticks: (8500934) 23:36:49.34
SNMPv2-MIB::snmpTrapOID.0 = OID:
IF-MIB::linkUp IF-MIB::ifIndex.1107755009 = INTEGER: 1107755009
SNMPv2-SMI::enterprises.6027.3.1.1.4.1.2 = STRING: "OSTATE_UP: Changed interface state to up: Po 1"
Entity MIBS
The Entity MIB provides a mechanism for presenting hierarchies of physical entities using SNMP tables.
The Entity MIB contains the following groups, which describe the physical elements and logical elements
of a managed system. The following tables are implemented for the Aggregator.
•
Physical Entity: A physical entity or physical component represents an identifiable physical resource
within a managed system. Zero or more logical entities may utilize a physical resource at any given
time. Determining which physical components are represented by an agent in the EntPhysicalTable is
an implementation-specific matter. Typically, physical resources (for example, communications ports,
backplanes, sensors, daughter-cards, power supplies, and the overall chassis), which you can manage
via functions associated with one or more logical entities, are included in the MIB.
•
Containment Tree: Each physical component may be modeled as contained within another physical
component. A containment-tree is the conceptual sequence of entPhysicalIndex values that uniquely
specifies the exact physical location of a physical component within the managed system. It is
generated by following and recording each entPhysicalContainedIn instance up the tree towards the
root, until a value of zero indicating no further containment is found.
Figure 15-14.
Sample Entity MIBS outputs
FTOS#show inventory optional-module
Unit Slot
Expected
Inserted
Next Boot
Status/Power(On/Off)
-----------------------------------------------------------------------1
0
SFP+
SFP+
AUTO
Good/On
1
1
QSFP+
QSFP+
AUTO
Good/On
* - Mismatch
FTOS#
210
|
Simple Network Management Protocol (SNMP)
The status of the MIBS is as follows:
$ snmpwalk -c public -v 2c 10.16.130.148 1.3.6.1.2.1.47.1.1.1.1.2
SNMPv2-SMI::mib-2.47.1.1.1.1.2.1 = ""
SNMPv2-SMI::mib-2.47.1.1.1.1.2.2 = STRING: "PowerConnect I/O-Aggregator"
SNMPv2-SMI::mib-2.47.1.1.1.1.2.3 = STRING: "Module 0"
SNMPv2-SMI::mib-2.47.1.1.1.1.2.4 = STRING: "Unit: 0 Port 1 10G Level"
SNMPv2-SMI::mib-2.47.1.1.1.1.2.5 = STRING: "Unit: 0 Port 2 10G Level"
SNMPv2-SMI::mib-2.47.1.1.1.1.2.6 = STRING: "Unit: 0 Port 3 10G Level"
SNMPv2-SMI::mib-2.47.1.1.1.1.2.7 = STRING: "Unit: 0 Port 4 10G Level"
SNMPv2-SMI::mib-2.47.1.1.1.1.2.8 = STRING: "Unit: 0 Port 5 10G Level"
SNMPv2-SMI::mib-2.47.1.1.1.1.2.9 = STRING: "Unit: 0 Port 6 10G Level"
SNMPv2-SMI::mib-2.47.1.1.1.1.2.10 = STRING: "Unit: 0 Port 7 10G Level"
SNMPv2-SMI::mib-2.47.1.1.1.1.2.11 = STRING: "Unit: 0 Port 8 10G Level"
SNMPv2-SMI::mib-2.47.1.1.1.1.2.12 = STRING: "Unit: 0 Port 9 10G Level"
SNMPv2-SMI::mib-2.47.1.1.1.1.2.13 = STRING: "Unit: 0 Port 10 10G Level"
SNMPv2-SMI::mib-2.47.1.1.1.1.2.14 = STRING: "Unit: 0 Port 11 10G Level"
SNMPv2-SMI::mib-2.47.1.1.1.1.2.15 = STRING: "Unit: 0 Port 12 10G Level"
SNMPv2-SMI::mib-2.47.1.1.1.1.2.16 = STRING: "Unit: 0 Port 13 10G Level"
SNMPv2-SMI::mib-2.47.1.1.1.1.2.17 = STRING: "Unit: 0 Port 14 10G Level"
SNMPv2-SMI::mib-2.47.1.1.1.1.2.18 = STRING: "Unit: 0 Port 15 10G Level"
SNMPv2-SMI::mib-2.47.1.1.1.1.2.19 = STRING: "Unit: 0 Port 16 10G Level"
SNMPv2-SMI::mib-2.47.1.1.1.1.2.20 = STRING: "Unit: 0 Port 17 10G Level"
SNMPv2-SMI::mib-2.47.1.1.1.1.2.21 = STRING: "Unit: 0 Port 18 10G Level"
SNMPv2-SMI::mib-2.47.1.1.1.1.2.22 = STRING: "Unit: 0 Port 19 10G Level"
SNMPv2-SMI::mib-2.47.1.1.1.1.2.23 = STRING: "Unit: 0 Port 20 10G Level"
SNMPv2-SMI::mib-2.47.1.1.1.1.2.24 = STRING: "Unit: 0 Port 21 10G Level"
SNMPv2-SMI::mib-2.47.1.1.1.1.2.25 = STRING: "Unit: 0 Port 22 10G Level"
SNMPv2-SMI::mib-2.47.1.1.1.1.2.26 = STRING: "Unit: 0 Port 23 10G Level"
SNMPv2-SMI::mib-2.47.1.1.1.1.2.27 = STRING: "Unit: 0 Port 24 10G Level"
SNMPv2-SMI::mib-2.47.1.1.1.1.2.28 = STRING: "Unit: 0 Port 25 10G Level"
SNMPv2-SMI::mib-2.47.1.1.1.1.2.29 = STRING: "Unit: 0 Port 26 10G Level"
SNMPv2-SMI::mib-2.47.1.1.1.1.2.30 = STRING: "Unit: 0 Port 27 10G Level"
SNMPv2-SMI::mib-2.47.1.1.1.1.2.31 = STRING: "Unit: 0 Port 28 10G Level"
SNMPv2-SMI::mib-2.47.1.1.1.1.2.32 = STRING: "Unit: 0 Port 29 10G Level"
SNMPv2-SMI::mib-2.47.1.1.1.1.2.33 = STRING: "Unit: 0 Port 30 10G Level"
SNMPv2-SMI::mib-2.47.1.1.1.1.2.34 = STRING: "Unit: 0 Port 31 10G Level"
SNMPv2-SMI::mib-2.47.1.1.1.1.2.35 = STRING: "Unit: 0 Port 32 10G Level"
SNMPv2-SMI::mib-2.47.1.1.1.1.2.36 = STRING: "40G QSFP+ port"
SNMPv2-SMI::mib-2.47.1.1.1.1.2.37 = STRING: "Unit: 0 Port 33 40G Level"
SNMPv2-SMI::mib-2.47.1.1.1.1.2.41 = STRING: "40G QSFP+ port"
SNMPv2-SMI::mib-2.47.1.1.1.1.2.42 = STRING: "Unit: 0 Port 37 40G Level"
SNMPv2-SMI::mib-2.47.1.1.1.1.2.46 = STRING: "Optional module 0"
SNMPv2-SMI::mib-2.47.1.1.1.1.2.56 = STRING: "Optional module 1"
SNMPv2-SMI::mib-2.47.1.1.1.1.2.57 = STRING: "4-port 10GE 10BASE-T (XL) "
SNMPv2-SMI::mib-2.47.1.1.1.1.2.58 = STRING: "Unit: 0 Port 49 10G Level"
SNMPv2-SMI::mib-2.47.1.1.1.1.2.59 = STRING: "Unit: 0 Port 50 10G Level"
SNMPv2-SMI::mib-2.47.1.1.1.1.2.60 = STRING: "Unit: 0 Port 51 10G Level"
SNMPv2-SMI::mib-2.47.1.1.1.1.2.61 = STRING: "Unit: 0 Port 52 10G Level"
SNMPv2-SMI::mib-2.47.1.1.1.1.2.66 = STRING: "PowerConnect I/O-Aggregator"
SNMPv2-SMI::mib-2.47.1.1.1.1.2.67 = STRING: "Module 0"
SNMPv2-SMI::mib-2.47.1.1.1.1.2.68 = STRING: "Unit: 1 Port 1 10G Level"
SNMPv2-SMI::mib-2.47.1.1.1.1.2.69 = STRING: "Unit: 1 Port 2 10G Level"
SNMPv2-SMI::mib-2.47.1.1.1.1.2.70 = STRING: "Unit: 1 Port 3 10G Level"
SNMPv2-SMI::mib-2.47.1.1.1.1.2.71 = STRING: "Unit: 1 Port 4 10G Level"
SNMPv2-SMI::mib-2.47.1.1.1.1.2.72 = STRING: "Unit: 1 Port 5 10G Level"
SNMPv2-SMI::mib-2.47.1.1.1.1.2.73 = STRING: "Unit: 1 Port 6 10G Level"
SNMPv2-SMI::mib-2.47.1.1.1.1.2.74 = STRING: "Unit: 1 Port 7 10G Level"
SNMPv2-SMI::mib-2.47.1.1.1.1.2.75 = STRING: "Unit: 1 Port 8 10G Level"
SNMPv2-SMI::mib-2.47.1.1.1.1.2.76 = STRING: "Unit: 1 Port 9 10G Level"
SNMPv2-SMI::mib-2.47.1.1.1.1.2.77 = STRING: "Unit: 1 Port 10 10G Level"
SNMPv2-SMI::mib-2.47.1.1.1.1.2.78 = STRING: "Unit: 1 Port 11 10G Level"
SNMPv2-SMI::mib-2.47.1.1.1.1.2.79 = STRING: "Unit: 1 Port 12 10G Level"
SNMPv2-SMI::mib-2.47.1.1.1.1.2.80 = STRING: "Unit: 1 Port 13 10G Level"
Simple Network Management Protocol (SNMP) | 211
www.dell.com | support.dell.com
SNMPv2-SMI::mib-2.47.1.1.1.1.2.81 = STRING: "Unit: 1 Port 14 10G Level"
SNMPv2-SMI::mib-2.47.1.1.1.1.2.82 = STRING: "Unit: 1 Port 15 10G Level"
SNMPv2-SMI::mib-2.47.1.1.1.1.2.83 = STRING: "Unit: 1 Port 16 10G Level"
SNMPv2-SMI::mib-2.47.1.1.1.1.2.84 = STRING: "Unit: 1 Port 17 10G Level"
SNMPv2-SMI::mib-2.47.1.1.1.1.2.85 = STRING: "Unit: 1 Port 18 10G Level"
SNMPv2-SMI::mib-2.47.1.1.1.1.2.86 = STRING: "Unit: 1 Port 19 10G Level"
SNMPv2-SMI::mib-2.47.1.1.1.1.2.87 = STRING: "Unit: 1 Port 20 10G Level"
SNMPv2-SMI::mib-2.47.1.1.1.1.2.88 = STRING: "Unit: 1 Port 21 10G Level"
SNMPv2-SMI::mib-2.47.1.1.1.1.2.89 = STRING: "Unit: 1 Port 22 10G Level"
SNMPv2-SMI::mib-2.47.1.1.1.1.2.90 = STRING: "Unit: 1 Port 23 10G Level"
SNMPv2-SMI::mib-2.47.1.1.1.1.2.91 = STRING: "Unit: 1 Port 24 10G Level"
SNMPv2-SMI::mib-2.47.1.1.1.1.2.92 = STRING: "Unit: 1 Port 25 10G Level"
SNMPv2-SMI::mib-2.47.1.1.1.1.2.93 = STRING: "Unit: 1 Port 26 10G Level"
SNMPv2-SMI::mib-2.47.1.1.1.1.2.94 = STRING: "Unit: 1 Port 27 10G Level"
SNMPv2-SMI::mib-2.47.1.1.1.1.2.95 = STRING: "Unit: 1 Port 28 10G Level"
SNMPv2-SMI::mib-2.47.1.1.1.1.2.96 = STRING: "Unit: 1 Port 29 10G Level"
SNMPv2-SMI::mib-2.47.1.1.1.1.2.97 = STRING: "Unit: 1 Port 30 10G Level"
SNMPv2-SMI::mib-2.47.1.1.1.1.2.98 = STRING: "Unit: 1 Port 31 10G Level"
SNMPv2-SMI::mib-2.47.1.1.1.1.2.99 = STRING: "Unit: 1 Port 32 10G Level"
SNMPv2-SMI::mib-2.47.1.1.1.1.2.100 = STRING: "40G QSFP+ port"
SNMPv2-SMI::mib-2.47.1.1.1.1.2.101 = STRING: "Unit: 1 Port 33 40G Level"
SNMPv2-SMI::mib-2.47.1.1.1.1.2.105 = STRING: "40G QSFP+ port"
SNMPv2-SMI::mib-2.47.1.1.1.1.2.106 = STRING: "Unit: 1 Port 37 40G Level"
SNMPv2-SMI::mib-2.47.1.1.1.1.2.110 = STRING: "Optional module 0"
SNMPv2-SMI::mib-2.47.1.1.1.1.2.111 = STRING: "4-port 10GE SFP+ (XL) "
SNMPv2-SMI::mib-2.47.1.1.1.1.2.112 = STRING: "Unit: 1 Port 41 10G Level"
SNMPv2-SMI::mib-2.47.1.1.1.1.2.113 = STRING: "Unit: 1 Port 42 10G Level"
SNMPv2-SMI::mib-2.47.1.1.1.1.2.114 = STRING: "Unit: 1 Port 43 10G Level"
SNMPv2-SMI::mib-2.47.1.1.1.1.2.115 = STRING: "Unit: 1 Port 44 10G Level"
SNMPv2-SMI::mib-2.47.1.1.1.1.2.120 = STRING: "Optional module 1"
SNMP Traps for Link Status and Stack Role
To enable SNMP traps for link status changes, use the snmp-server enable traps snmp linkdown linkup
command.
To enable SNMP traps for stacking, use the snmp-server enable traps stack command.
212
|
Simple Network Management Protocol (SNMP)
16
Stacking
Overview
An Aggregator auto-configures to operate in standalone mode. To use an Aggregator in a stack, you must
manually configure it using the CLI to operate in stacking mode.
Stacking is supported only on the 40GbE ports on the base module. Stacking is limited to six Aggregators
in the same or different m1000e chassis. To configure a stack, you must use the CLI.
Stacking provides a single point of management for high availability and higher throughput.
This chapter contains the following sections:
•
•
•
•
•
•
•
Stacking Aggregators
Stacking Port Numbers
Configuring a Switch Stack
Verifying a Stack Configuration
Troubleshooting a Switch Stack
Upgrading a Switch Stack
Upgrading a Single Stack Unit
Stacking Aggregators
A stack of Aggregators operates as a virtual chassis with management units (primary and standby) and
member units. The Dell Networking operating software (FTOS) elects a primary (master) and secondary
(standby) management unit. The forwarding database resides on the master switch; the standby unit
maintains a synchronized local copy. Each unit in the stack makes forwarding decisions based on their
local copy.
Figure 16-15 shows an example of how you can stack two Aggregators. The Aggregators are connected to
operate as a single stack in a ring topology using only the 40GbE ports on the base modules.
Stacking | 213
www.dell.com | support.dell.com
Figure 16-15.
A Two-Aggregator Stack
Stack Management Roles
The stack elects the management units for the stack management:
•
•
Stack master: primary management unit
Standby: secondary management unit
The master holds the control plane and the other units maintain a local copy of the forwarding databases.
From Stack master you can configure:
•
•
System-level features that apply to all stack members
Interface-level features for each stack member
The master synchronizes the following information with the standby unit:
•
•
•
Stack unit topology
Stack running Configuration (which includes LACP, SNMP, etc.)
Logs
The master switch maintains stack operation with minimal impact in the event of:
•
•
•
•
Switch failure
Inter-switch stacking link failure
Switch insertion
Switch removal
If the master switch goes off line, the standby replaces it as the new master.
Note: For the Aggregator, the entire stack has only one management IP address.
214
|
Stacking
Stack Master Election
The stack elects a master and standby unit at bootup time based on MAC address. The unit with the higher
MAC value becomes master.
To view which switch is the stack master, use the show system command. Figure 16-16 shows sample
output from an established stack.
A change in the stack master occurs when:
•
•
•
You power down the stack master or bring the master switch offline.
A failover of the master switch occurs.
You disconnect the master switch from the stack.
Note: When a stack reloads and all the units come up at the same time; for example, when all units boot up
from flash, all units participate in the election and the master and standby are chosen based on the MAC
address. When the units do not boot up at the same time; for example, some units are powered down just
after reloading and powered up later to join the stack, they do not participate in the election process, even
though the units that boot up late may have a higher priority configured. This happens because the master
and standby have already been elected; therefore, the unit that boots up late joins only as a member. Also,
when an up and running standalone unit or stack is merged with another stack, based on election, the
losing stack reloads and the master unit of the winning stack becomes the master of the merged stack.
To ensure a fully synchronized bootup, it is possible to reset individual units to force them to give up the
management role; or reload the whole stack from the command line interface (CLI).
Figure 16-16.
Displaying the Stack Master
FTOS# show system
brief
Stack MAC : 00:1e:c9:f1:00:9b
-- Stack Info -Unit UnitType
Status
ReqTyp
CurTyp
Version
Ports
-----------------------------------------------------------------------------------0
Management
online
I/O-Aggregator I/O-Aggregator 8-3-17-46
56
1
Standby
online
I/O-Aggregator I/O-Aggregator 8-3-17-46
56
2
Member
not present
3
Member
not present
4
Member
not present
5
Member
not present
FTOS#
Failover Roles
If the stack master fails (for example, powered off), it is removed from the stack topology. The standby unit
detects the loss of peering communication and takes ownership of the stack management, switching from
standby to master. The lack of a standby unit triggers an election within the remaining units for a standby
role.
After the former master switch recovers, despite having a higher priority or MAC address, it does not
recover its master role but instead take the next available role.
Stacking | 215
www.dell.com | support.dell.com
MAC Addressing
All port interfaces in the stack use the MAC address of the management interface on the master switch.
The MAC address of the chassis in which the master Aggregator is installed is used as the stack MAC
address.
The stack continues to use the master’s chassis MAC address even after a failover. The MAC address is not
refreshed until the stack is reloaded and a different unit becomes the stack master.
Stacking LAG
When you use multiple links between stack units, FTOS automatically bundles them in a stacking link
aggregation group (LAG) to provide aggregated throughput and redundancy. The stacking LAG is
established automatically and transparently by FTOS (without user configuration) after peering is detected
and behaves as follows:
•
•
The stacking LAG dynamically aggregates; it can lose link members or gain new links.
Shortest path selection inside the stack: if multiple paths exist between two units in the stack, the
shortest path is used.
Stacking VLANs
When you configure an Aggregator to operate in stacking mode (Configuring and Bringing Up a Stack),
VLANs are reconfigured as follows:
•
•
If an Aggregator port belonged to all 4094 VLANs in standalone mode (default), all VLAN
membership is removed and the port is assigned only to default VLAN 1. You must configure
additional VLAN membership as necessary.
If you had manually configured an Aggregator port to belong to one or more VLANs (non-default) in
standalone mode, the VLAN configuration is retained in stacking mode only on the master switch.
When you reconfigure an Aggregator from stacking to standalone mode:
•
•
216
|
Stacking
Aggregator ports that you manually configured for VLAN membership in stacking mode retain their
VLAN configuration in standalone mode.
To restore the default auto-VLAN mode of operation (in which all ports are members of all 4094
VLANs) on a port, enter the auto vlan command; for example:
FTOS(conf)# interface tengigabitethernet 0/2
FTOS(conf-if-te-0/2)# auto vlan
Stacking Port Numbers
By default, each Aggregator in Standalone mode is numbered stack-unit 0. Stack-unit numbers are
assigned to member switches when the stack comes up. Figure 16-17 shows the numbers of the 40GbE
stacking ports on an Aggregator.
Figure 16-17.
Stack Groups on an Aggregator
Stack Unit 0 / Port 37
Stack Unit 0 / Port 33
Configuring a Switch Stack
To configure and bring up a switch stack, follow these steps:
1. Connect the 40GbE ports on the base module of two Aggregators using 40G direct attach or QSFP
fibre cables.
2. Configure each Aggregator to operate in stacking mode.
3. Reload each Aggregator, one after the other in quick succession.
Stacking | 217
www.dell.com | support.dell.com
Stacking Prerequisites
Before you cable and configure a stack of Aggregators, review the following prerequisites:
•
•
•
•
•
•
All Aggregators in the stack must be powered up with the initial or startup configuration before you
attach the cables.
All stacked Aggregators must run the same FTOS version. The minimum FTOS version required is
8.3.17.0. To check the FTOS version that a switch is running, use the show version command. To
download an FTOS version, go to http://support.dell.com.
Stacking is supported only with other Aggregators. A maximum of six Aggregators is supported in a
single stack. You cannot stack the Aggregator with MXL 10/40GbE Switches or another type of
switch.
A maximum of two stack groups (40GbE ports) is supported on a stacked Aggregator.
Interconnect the stack units by following the instructions in Cabling Stacked Switches.
You cannot stack a Standalone IOA and a PMUX.
Cabling Stacked Switches
Before you configure Aggregators in a stack, connect the 40G direct attach or QSFP cables and
transceivers to connect 40GbE ports on two Aggregators in the same chassis or across chassis.
Cabling Restrictions
The following restrictions apply when setting up a stack of Aggregators:
•
•
•
Only daisy-chain or ring topologies are supported; star and full mesh topologies are not supported.
Stacking is supported only on 40GbE links by connecting 40GbE ports on the base module. Stacking is
not supported on 10GbE ports or 4x10GbE ports.
Use only QSFP transceivers and QSFP or direct attach cables (purchased separately) to connect
stacking ports.
Cabling Redundancy
Connect the units in a stack with two or more stacking cables to avoid a stacking port or cable failure.
Removing one of the stacked cables between two stacked units does not trigger a reset.
218
|
Stacking
Cabling Procedure
The following cabling procedure uses the stacking topology in Figure 16-15. To connect the cabling:
1. Connect a 40GbE base port on the first Aggregator to a 40GbE base port on another Aggregator in the
same chassis.
2. Connect a 40GbE base port on the second Aggregator to a 40GbE port on the first Aggregator.
The resulting ring topology allows the entire stack to function as a single switch with resilient fail-over
capabilities. If you do not connect the last switch to the first switch (Step 4), the stack operates in a daisy
chain topology with less resiliency. Any failure in a non-edge stack unit causes a split stack.
Accessing the CLI
To configure a stack, you must access the stack master in one of the following ways:
•
•
•
For remote out-of-band management (OOB), enter the OOB management interface IP address into a
Telnet or secure shell (SSH) client and log in to the switch using the user ID and password to access
the CLI.
For local management, use the attached console connection to the master switch to log in to the CLI.
Console access to the stack CLI is available on the master only.
For remote in-band management from a network management station, enter the virtual local area
network (VLAN) IP address of the management port and log in to the switch to access the CLI.
Configuring and Bringing Up a Stack
After you attach the 40G QSFP or direct attach cables in a stack of Aggregators, to bring up the stack,
follow these steps.
Note: The procedure uses command examples for the stacking topology in Figure 16-15.
Step
Task
Command Syntax
Command Mode
1
Set up a connection to the CLI on an Aggregator as described in Accessing the CLI.
2
Log on to the CLI and enter Global Configuration mode.
Login: username
Password: *****
FTOS> enable
FTOS# configure
---
3
Configure the Aggregator to operate in stacking mode.
stack-unit 0 iom-mode stack
CONFIGURATION
4
Repeat Steps 1 to 3 on the second Aggregator in the stack.
5
Log on to the CLI and reboot each switch, one after
another, in as short a time as possible.
reload
EXEC PRIVILEGE
Stacking | 219
www.dell.com | support.dell.com
Note: If the stacked switches all reboot at approximately the same time, the switch with the highest MAC address is
automatically elected as the master switch. The switch with the next highest MAC address is elected as standby. As
each switch joins the stack, it is assigned the lowest available stack-unit number from 0 to 5. The default
configuration of each stacked switch is stored in the running configuration of the stack. The stack-unit ID numbers
are retained after future stack reloads.
To verify the stack-unit number assigned to each switch in the stack, use the show system brief command
(Figure 16-18).
Adding a Stack Unit
You can add a new unit to an existing stack both when the unit has no stacking ports (stack groups)
configured and when the unit already has stacking ports configured. If the units to be added to the stack
have been previously used, they are assigned the smallest available unit ID in the stack.
To add a standalone Aggregator to a stack, follow these steps:
Step
Task
Command Syntax
Command Mode
1
Power on the switch.
2
Attach QSFP or direct attach cables to connect 40GbE ports on the switch to one or more switches in the stack.
3
Log on to the CLI and enter global configuration mode.
Login: username
Password: *****
FTOS> enable
FTOS# configure
---
4
Configure the Aggregator to operate in stacking mode.
stack-unit 0 iom-mode
stack
CONFIGURATION
5
Reload the switch. FTOS automatically assigns a number to the
new unit and adds it as member switch in the stack. The new
unit synchronizes its running and startup configurations with the
stack.
reload
EXEC Privilege
If an Aggregator is already configured to operate in stacking mode, simply attach QSFP or direct attach
cables to connect 40GbE ports on the base module of each stacked Aggregator. The new unit synchronizes
its running and startup configurations with the stack.
FTOS Behavior: When you add a new Aggregator to a stack:
• If the new unit has been configured with a stack number that is already assigned to a stack member, the stack avoids a numbering conflict by assigning the new switch the first available stack
number.
• If the stack has been provisioned for the stack number that is assigned to the new unit, the
pre-configured provisioning must match the switch type. If there is a conflict between the provisioned switch type and the new unit, a mismatch error message is displayed.
220
|
Stacking
Resetting a Unit on a Stack
Use the following reset commands to reload any of the member units or the standby in a stack. If you try to
reset the stack master, an error message is displayed: Reset of master unit is not allowed.
Task
Command Syntax
Command Mode
Reload a stack unit from the master switch
reset stack-unit unit-number
EXEC Privilege
Reset a stack-unit when the unit is in a problem state.
reset stack-unit unit-number
hard
EXEC Privilege
Removing an Aggregator from a Stack and Restoring Quad
Mode
To remove an Aggregator from a stack and return the 40GbE stacking ports to 4x10GbE quad mode:
Step
Task
Command Syntax
Command Mode
1
Disconnect the stacking cables from the unit. The unit can be powered on or off and can be online or offline.
2
Log on to the CLI and enter Global Configuration mode.
Login: username
Password: *****
FTOS> enable
FTOS# configure
---
3
Configure the Aggregator to operate in standalone mode.
stack-unit 0 iom-mode
standalone
CONFIGURATION
4
Log on to the CLI and reboot each switch, one after
another, in as short a time as possible.
reload
EXEC PRIVILEGE
When the reload completes, the base-module ports comes up in 4x10GbE (quad) mode. The switch
functions in standalone mode but retains the running and startup configuration that was last synchronized
by the master switch while it operated as a stack unit.
Stacking | 221
www.dell.com | support.dell.com
Verifying a Stack Configuration
Using LEDs
Table 16-2 lists the status of a stacked switch according to the color of the System Status light emitting
diodes (LEDs) on its front panel.
Table 16-2.
System Status LED on a Stacked Switch
Color
Meaning
Blue
The switch is operating as the stack master or as a standalone unit.
Off
The switch is a member or standby unit.
Amber
The switch is booting or a failure condition has occurred.
Using Show Commands
To display information on the stack configuration, use the show commands in Table 16-3 on the master
switch.
Table 16-3.
Displaying Stack Configurations
Command
Output
show system [brief] (Figure 16-18 and Figure 16-19)
Displays stacking roles (master, standby, and member units) and
the stack MAC address.
show inventory optional-module (Figure 16-20)
Displays the FlexIO modules currently installed in expansion
slots 0 and 1 on a switch and the expected module logically
provisioned for the slot.
show system stack-unit unit-number stack-group
configured (Figure 16-21)
Displays the stack groups allocated on a stacked switch. The
range is from 0 to 5.
show system stack-unit unit-number stack-group
Displays the port numbers that correspond to the stack groups on
a switch. The range is from 0 to 5.
(Figure 16-22)
show system stack-ports [status | topology]
(Figure 16-23)
222
|
Stacking
Displays the type of stack topology (ring or daisy chain) with a
list of all stacked ports, port status, link speed, and peer stack-unit
connection.
Figure 16-18.
show system brief Command Example
FTOS# show system
brief
StStack MAC : 00:1e:c9:f1:00:9b
-- Stack Info -Unit UnitType
Status
ReqTyp
CurTyp
Version
Ports
-----------------------------------------------------------------------------------0
Management
online
I/O-Aggregator I/O-Aggregator 8-3-17-46
56
1
Standby
online
I/O-Aggregator I/O-Aggregator 8-3-17-46
56
2
Member
not present
3
Member
not present
4
Member
not present
5
Member
not present
Figure 16-19.
show system Command Example
FTOS# show system
Stack MAC : 00:1e:c9:f1:00:9b
Reload Type : normal-reload [Next boot : normal-reload]
-- Unit 0 -Unit Type
Status
Next Boot
Required Type
Current Type
Master priority
Hardware Rev
Num Ports
Up Time
FTOS Version
Jumbo Capable
POE Capable
Burned In MAC
No Of MACs
:
:
:
:
:
:
:
:
:
:
:
:
:
:
Management Unit
online
online
I/O-Aggregator - 34-port GE/TE (XL)
I/O-Aggregator - 34-port GE/TE (XL)
0
-- Unit 1 -Unit Type
Status
Next Boot
Required Type
Current Type
Master priority
Hardware Rev
Num Ports
Up Time
FTOS Version
Jumbo Capable
POE Capable
Burned In MAC
No Of MACs
:
:
:
:
:
:
:
:
:
:
:
:
:
:
Standby Unit
online
online
I/O-Aggregator - 34-port GE/TE (XL)
I/O-Aggregator - 34-port GE/TE (XL)
0
-- Unit 2 -Unit Type
Status
Required Type
: Member Unit
: not present
:
56
2 hr, 41 min
8-3-17-46
yes
no
00:1e:c9:f1:00:9b
3
56
2 hr, 27 min
8-3-17-46
yes
no
00:1e:c9:f1:04:82
3
Stacking | 223
www.dell.com | support.dell.com
Figure 16-20.
show inventory optional-module Command Example
FTOS# show inventory optional-module
Unit Slot
Expected
Inserted
Next Boot
Power
----------------------------------------------------------------0
0
SFP+
SFP+
AUTO
Good
0
1
QSFP+
QSFP+
AUTO
Good
* - Mismatch
Figure 16-21.
show system stack-unit stack-group configured Command Example
FTOS# show system stack-unit 1 stack-group configured
Configured stack groups in stack-unit 1
-----------------------------------------0
1
Figure 16-22.
show system stack-unit stack-group Command Example
FTOS# show system stack-unit 1 stack-group
Stack group
Ports
-----------------------------------0
1/33
1
1/37
4
1/49
5
1/53
Figure 16-23.
show system stack-ports (ring) Command Example
FTOS# show system stack-ports
Topology: Ring
Interface Connection
Link Speed
Admin
Link
Trunk
(Gb/s)
Status
Status
Group
-----------------------------------------------------------------0/33
1/33
40
up
up
0/37
1/37
40
up
up
1/33
0/33
40
up
up
1/37
0/37
40
up
up
224
|
Stacking
Figure 16-24.
show system stack-ports (daisy chain) Command Example
FTOS# show system stack-ports
Topology: Daisy chain
Interface Connection
Link Speed
Admin
Link
Trunk
(Gb/s)
Status
Status
Group
-----------------------------------------------------------------0/33
40
up
down
0/37
1/37
40
up
up
1/33
40
up
down
1/37
0/37
40
up
up
Stacking | 225
www.dell.com | support.dell.com
Troubleshooting a Switch Stack
Troubleshooting Commands
To perform troubleshooting operations on a switch stack, use the commands in Table 16-4 on the master
switch.
Table 16-4.
Troubleshooting Stack Commands
Command
Output
show system stack-ports (Figure 16-25)
Displays the status of stacked ports on stack units.
show redundancy (Figure 16-26)
Displays the master standby unit status, failover configuration,
and result of the last master-standby synchronization; allows you
to verify the readiness for a stack failover.
show hardware stack-unit unit-number stack-port
Displays input and output flow statistics on a stacked port.
port-number (Figure 16-25)
clear hardware stack-unit unit-number counters
Clears statistics on the specified stack unit. Valid stack-unit
numbers are 0 to 5.
show system stack-unit unit-number iom-mode
Displays the current operational mode of the Aggregator
(standalone or stacking) and the mode in which the Aggregator
will operate at the next reload.
Figure 16-25.
show system stack-ports Command Example
FTOS# show system stack-ports
Topology: Ring
Interface Connection
Link Speed
Admin
Link
Trunk
(Gb/s)
Status
Status
Group
-----------------------------------------------------------------0/33
1/33
40
up
up
0/37
1/37
40
up
up
1/33
0/33
40
up
up
1/37
0/37
40
up
up
226
|
Stacking
Figure 16-26.
show redundancy Command Example
FTOS#show redundancy
-- Stack-unit Status ------------------------------------------------Mgmt ID:
0
Stack-unit ID:
0
Stack-unit Redundancy Role:
Primary
Stack-unit State:
Active
Stack-unit SW Version:
E8-3-17-46
Link to Peer:
Up
Indicates master unit
-- PEER Stack-unit Status ------------------------------------------------Stack-unit State:
Standby
Peer stack-unit ID:
1
Stack-unit SW Version:
E8-3-17-46
Indicates standby unit
-- Stack-unit Redundancy Configuration ------------------------------------------------Primary Stack-unit:
mgmt-id
0
Auto Data Sync:
Full
Failover Type:
Hot Failover
Auto reboot Stack-unit:
Enabled
Auto failover limit:
3 times in 60 minutes
Failover type with redundancy
-- Stack-unit Failover Record ------------------------------------------------Failover Count:
0
Last failover timestamp:
None
Last failover Reason:
None
Last failover type:
None
-- Last Data Block Sync Record: ------------------------------------------------Stack Unit Config:
succeeded Sep 03 1993
Start-up Config:
succeeded Sep 03 1993
Runtime Event Log:
succeeded Sep 03 1993
Running Config:
succeeded Sep 03 1993
ACL Mgr:
succeeded Sep 03 1993
LACP:
no block sync done
STP:
no block sync done
SPAN:
no block sync done
09:36:52
09:36:52
09:36:52
09:36:52
09:36:52
Last synch of startup configuration
Stacking | 227
www.dell.com | support.dell.com
Figure 16-27.
FTOS# show
show hardware stack-unit stack-port Command Example
hardware stack-unit 1 stack-port 33
Input Statistics:
7934 packets, 1049269 bytes
0 64-byte pkts, 7793 over 64-byte pkts, 100 over 127-byte pkts
0 over 255-byte pkts, 7 over 511-byte pkts, 34 over 1023-byte pkts
70 Multicasts, 0 Broadcasts
0 runts, 0 giants, 0 throttles
0 CRC, 0 overrun, 0 discarded
Output Statistics:
438 packets, 270449 bytes, 0 underruns
0 64-byte pkts, 57 over 64-byte pkts, 181 over 127-byte pkts
54 over 255-byte pkts, 0 over 511-byte pkts, 146 over 1023-byte pkts
72 Multicasts, 0 Broadcasts, 221 Unicasts
0 throttles, 0 discarded, 0 collisions, 0 wredDrops
Rate info (interval 45 seconds):
Input 00.00 Mbits/sec,
0 packets/sec, 0.00% of line-rate
Output 00.00 Mbits/sec,
0 packets/sec, 0.00% of line-rate
Failure Scenarios
The following sections describe some of the common fault conditions that can happen in a switch stack and
how they are resolved.
Stack Member Fails
Problem: A unit that is not the stack master fails in an operational stack.
Resolution: If a stack member fails in a daisy chain topology, a split stack occurs. If a member unit fails in
a ring topology, traffic is re-routed over existing stack links.
The following syslog messages are generated when a member unit fails:
FTOS#May 31 01:46:17: %STKUNIT3-M:CP %IPC-2-STATUS: target stack unit 4 not responding
May 31 01:46:17: %STKUNIT3-M:CP %CHMGR-2-STACKUNIT_DOWN: Major alarm: Stack unit 4 down - IPC
timeout
FTOS#May 31 01:46:17: %STKUNIT3-M:CP %IFMGR-1-DEL_PORT: Removed port: Te 4/1-32,41-48, Fo 4/
49,53
FTOS#May 31 01:46:18: %STKUNIT5-S:CP %IFMGR-1-DEL_PORT: Removed port: Te 4/1-32,41-48, Fo 4/
49,53
Unplugged Stacking Cable
Problem: A stacking cable is unplugged from a member switch. The stack loses half of its bandwidth from
the disconnected switch.
Resolution: Intra-stack traffic is re-routed on a another link using the redundant stacking port on the
switch. A recalculation of control plane and data plane connections is performed.
228
|
Stacking
Master Switch Fails
Problem: The master switch fails due to a hardware fault, software crash, or power loss.
Resolution: A failover procedure begins:
1.
Keep-alive messages from the Aggregator master switch time out after 60 seconds and the switch is
removed from the stack.
2. The standby switch takes the master role. Data traffic on the new master switch is uninterrupted.
Protocol traffic is managed by the control plane.
3. A member switch is elected as the new standby. Data traffic on the new standby is uninterrupted. The
control plane prepares for operation in Warm Standby mode.
Stack-Link Flapping Error
Problem/Resolution: Stacked Aggregators monitor their own stack ports and disable any stack port that
flaps five times within 10 seconds. If the stacking ports that flap are on the master or standby,
KERN-2-INT error messages note the units (Figure 16-28).
To re-enable a downed stacking port, power cycle the stacked switch on which the port is installed.
Figure 16-28.
Recovering from a Stack-Link Flapping Error
--------------------------------------MANAGMENT UNIT----------------------------------------Error: Stack Port 49 has flapped 5 times within 10 seconds.Shutting down this stack port now.
Error: Please check the stack cable/module and power-cycle the stack.
10:55:20: %STKUNIT1-M:CP %KERN-2-INT: Error: Stack Port 50 has flapped 5 times within 10
seconds.Shutting down this stack port now.
10:55:20: %STKUNIT1-M:CP %KERN-2-INT: Error: Please check the stack cable/module and
power-cycle the stack.
---------------------------------------STANDBY UNIT-----------------------------------------10:55:18: %STKUNIT1-M:CP %KERN-2-INT: Error: Stack Port 50 has flapped 5 times within 10
seonds.Shutting down this stack port now.
10:55:18: %STKUNIT1-M:CP %KERN-2-INT: Error: Please check the stack cable/module
and power-cycle the stack.
Master Switch Recovers from Failure
Problem: The master switch recovers from a failure after a reboot and rejoins the stack as the standby unit
or member unit. Protocol and control plane recovery requires time before the switch is fully online.
Resolution: When the entire stack is reloaded, the recovered master switch becomes the master unit of the
stack.
Stacking | 229
www.dell.com | support.dell.com
Stack Unit in Card-Problem State Due to Incorrect FTOS Version
Problem: A stack unit enters a Card-Problem state because the switch has a different FTOS version than
the master unit (Figure 16-29). The switch does not come online as a stack unit.
Resolution: To restore a stack unit with an incorrect FTOS version as a member unit, disconnect the
stacking cables on the switch and install the correct FTOS version. Then add the switch to the stack as
described in Adding a Stack Unit. To verify that the problem has been resolved and the stacked switch is
back online, use the show system brief command (Figure 16-30).
Figure 16-29.
Card Problem Error - Different FTOS Versions
FTOS#show system brief
Stack MAC : 00:1e:c9:f1:00:9b
-- Stack Info -Unit UnitType
Status
ReqTyp
CurTyp
Version
Ports
-----------------------------------------------------------------------------------0
Management
online
I/O-Aggregator I/O-Aggregator 8-3-17-46
56
1
Standby
card problem
I/O-Aggregator unknown
56
2
Member
not present
3
Member
not present
4
Member
not present
5
Member
not present
Figure 16-30.
Card Problem Error - Different FTOS Versions: Resolved
FTOS#show system brief
Stack MAC : 00:1e:c9:f1:04:82
-- Stack Info -Unit UnitType
Status
ReqTyp
CurTyp
Version
Ports
-----------------------------------------------------------------------------------0
Management
online
I/O-Aggregator I/O-Aggregator 8-3-17-52
56
1
Standby
online
I/O-Aggregator I/O-Aggregator 8-3-17-52
56
2
Member
not present
3
Member
not present
4
Member
not present
5
Member
not present
Stack Unit in Card-Problem State Due to Configuration Mismatch
Problem: A stack unit enters a card-problem state because there is a configuration mismatch between the
logical provisioning stored for the stack-unit number on the master switch and the newly added unit with
the same number.
Resolution: From the master switch, reload the stack by entering the reload command in EXEC Privilege
mode. When the stack comes up, the card problem will be resolved
230
|
Stacking
Upgrading a Switch Stack
To upgrade all switches in a stack with the same FTOS version, follow these steps:
Step
Task
Command Syntax
Command Mode
1
Copy the new FTOS image to a network server.
2
Download the FTOS image by accessing an
interactive CLI that requests the server IP address
and image filename, and prompts you to upgrade
all member stack units. Specify the system partition
on the master switch into which you want to copy
the FTOS image. Valid partition values are a: and
b:.
As shown in Figure 16-31, the system then
prompts you to upgrade all member units with the
new FTOS version.
upgrade system {flash: | ftp: | scp: |
tftp: | usbflash:} partition
EXEC Privilege
3
Reboot all stack units to load the FTOS image from
the same partition on all switches in the stack.
boot system stack-unit
all primary system partition
CONFIGURATION
4
Save the configuration.
write memory
EXEC Privilege
5
Reload the stack unit to activate the new FTOS
version.
reload
CONFIGURATION
Figure 16-31 shows an example of how to upgrade all switches in a stack, including the master switch.
Figure 16-31.
Upgrading all Stacked Switches Example
FTOS# upgrade system ftp: A:
Address or name of remote host []: 10.11.200.241
Source file name []: //FTOS-XL-8.3.17.0.bin
User name to login remote host: ftp
Password to login remote host:
!!!!!!!!!!!!!!!!!!!!!!!!!!!!!!!!!!!!!!!!!!!!!!!!!!!!!!!!!!!!!!!!!
Erasing IOM Primary Image, please wait
.!.................................................................................
...................................Writing.........................................
...................................................................................
...................................................................................
31972272 bytes successfully copied
System image upgrade completed successfully.
Upgrade system image for all stack-units [yes/no]: yes
!!!!!!!!!!!!!!!!!!!!!!!!!!!!!!!!!!!!!!!!!!!!!!!!!!!!!!!!!!!!!!!!!!!!!!!!!!!!!!!!!!!!!!!!!!!!!!!!!!!!!!
!
Image upgraded to all
FTOS# configure
FTOS(conf)# boot system stack-unit all primary system: A:
FTOS(conf)# end
FTOS# write memory
Jan 3 14:01:48: %STKUNIT0-M:CP %FILEMGR-5-FILESAVED: Copied running-config to startup-config
in flash by default
Synchronizing data to peer Stack-unit
!!!!
FTOS# reload
Proceed with reload [confirm yes/no]: yes
Stacking | 231
www.dell.com | support.dell.com
Upgrading a Single Stack Unit
Upgrading a single stacked switch is necessary when the unit was disabled due to an incorrect FTOS
version. This procedure upgrades the image in the boot partition of the member unit from the
corresponding partition in the master unit.
To upgrade an individual stack unit with a new FTOS version, follow these steps:
Step
Task
Command Syntax
Command Mode
Download the FTOS image from the master's boot
partition to the member unit, and upgrade the
relevant boot partition in the single stack-member
unit.
upgrade system stack-unit
EXEC Privilege
2
Reboot the stack unit from the master switch to
load the FTOS image from the same partition.
boot system stack-unit unit-number
primary system partition
CONFIGURATION
3
Save the configuration.
write memory
EXEC Privilege
4
Reset the stack unit to activate the new FTOS
version.
power-cycle stack-unit unit-number
EXEC Privilege
1
unit-number partition
Figure 16-32 shows an example of how to upgrade an individual stack unit.
Figure 16-32.
Upgrading a Single Stack Unit Example
FTOS# upgrade system stack-unit 1 A:
!!!!!!!!!!!!!!!!!!!!!!!!!!!!!!!!!!!!!!!!!!!!!!!!!!!!!!!!!!!!!!!!!!!!!!!!!!!!!!!!!!!!!!!!!!!!!!!!!!!!!!
!!!!!!!!!!!!!!!!!!!!!!!!!!!!!!!!!!!!!!!!!!!!!!!!!!!!!!!!!!!!!!!!!!!!!!!!!!!!!!!!!!!!!!!!!!!!!!!!!!!!!!
!!!!!!!!!!!!!!!!!!!!!!!!!!!!!!!!!!!!!!!!!!!!!!!!!!!!!!!!!!!!!!!!!!!!!!!!!!!!!!!!!!!!!!!!!!!!!!!!!!!!!!
!!!!!!!!!!!!!!!!!!!!!!
Image upgraded to Stack unit 1
FTOS# configure
FTOS(conf)# boot system stack-unit 1 primary system: A:
FTOS(conf)# end
FTOS#Jan 3 14:27:00: %STKUNIT0-M:CP %SYS-5-CONFIG_I: Configured from console
FTOS# write memory
Jan 3 14:27:10: %STKUNIT0-M:CP %FILEMGR-5-FILESAVED: Copied running-config to startup-config in flash
by default
Synchronizing data to peer Stack-unit
!!!!
....
FTOS# power-cycle stack-unit 1
Proceed with power-cycle? Confirm [yes/no]:yes
232
|
Stacking
17
Broadcast Storm Control
On the Aggregator, the broadcast storm control feature is enabled by default on all ports, and disabled on a
port when an iSCSI storage device is detected. Broadcast storm control is re-enabled as soon as the
connection with an iSCSI device ends.
Broadcast traffic on Layer 2 and Layer 3 interfaces is limited or suppressed during a broadcast storm. You
can view the status of a broadcast-storm control operation by using the show io-aggregator broadcast
storm-control status command. You can disable broadcast storm control by using the no io-aggregator
broadcast storm-control command.
FTOS Behavior: If broadcast traffic exceeds 1000 Mbps, the Aggregator limits it to 1000 Mbps per
port-pipe.
Displaying Broadcast-Storm Control Status
To display the status of a current storm control operation, enter the following command:
Task
Command
Command Mode
Display status (enabled/disabled) of broadcast storm
control and the traffic limit applied.
show io-aggregator broadcast
storm-control status
EXEC Privilege
Disabling Broadcast Storm Control
To disable broadcast storm control on an Aggregator, enter the following command:
Task
Command
Command Mode
Disable broadcast storm control.
no io-aggregator broadcast
storm-control
CONFIGURATION
To re-enable broadcast storm control, enter the io-aggregator broadcast storm-control command.
Broadcast Storm Control | 233
234
|
Broadcast Storm Control
www.dell.com | support.dell.com
18
System Time and Date
The Aggregator auto-configures the hardware and software clocks with the current time and date. If
necessary, you can manually set and maintain the system time and date using the CLI commands described
in this chapter.
•
•
•
•
•
•
Setting the Time for the Hardware Clock
Setting the Time for the Software Clock
Synchronizing the Hardware Clock Using the Software Clock
Setting the Time Zone
Setting Daylight Savings Time
Setting Daylight Savings Time
Setting the Time for the Hardware Clock
To set the time and date for the hardware clock, use the following command:
Command Syntax
Command Mode
Purpose
calendar set time month day year
EXEC Privilege
Set the hardware clock to the current time and date.
• time: Enter the time in hours:minutes:seconds.
For the hour variable, use the 24-hour format, for
example, 17:15:00 is 5:15 pm.
• month: Enter the name of one of the 12 months in
English.You can enter the name of a day to
change the order of the display to time day month
year.
• day: Enter the number of the day. Range: 1 to 31.
You can enter the name of a month to change the
order of the display to time day month year
• year: Enter a four-digit number as the year.
Range: 1993 to 2035.
FTOS#calendar set 12:11:00 21 may 2012
FTOS#
System Time and Date | 235
www.dell.com | support.dell.com
Setting the Time for the Software Clock
You can change the order of the month and day parameters to enter the time and date as time day month
year. You cannot delete the software clock.
The software clock runs only when the software is up. The clock restarts, based on the hardware clock,
when the switch reboots. To set the time and date for the software clock, use the following command:
Command Syntax
Command Mode
Purpose
clock set time month day year
EXEC Privilege
Set the system software clock to the current time and
date.
• time: Enter the time in hours:minutes:seconds.
For the hour variable, use the 24-hour format, for
example, 17:15:00 is 5:15 pm.
• month: Enter the name of one of the 12 months in
English. You can enter the name of a day to
change the order of the display to time day month
year.
• day: Enter the number of the day. Range: 1 to 31.
You can enter the name of a month to change the
order of the display to time day month year
• year: Enter a four-digit number as the year.
Range: 1993 to 2035.
FTOS#clock set 12:11:00 21 may 2012
FTOS#
Synchronizing the Hardware Clock Using the Software Clock
The Aggregator allows you to synchronize the hardware clock with the time setting on the
software clock. Perform this operation only if you are sure that the hardware clock is inaccurate
and the software clock is correct.
Note: You cannot undo the result of this operation by entering the no form of the command.
To set the hardware clock according to the time on the software clock, enter the clock
update-calendar command.
236
|
Command Syntax
Command Mode
Purpose
clock update-calendar
EXEC Privilege
Reset the hardware clock to the current time and date
on the software clock.
System Time and Date
Setting the Time Zone
Universal time coordinated (UTC) is the time standard based on the International Atomic Time standard,
commonly known as Greenwich Mean time. When determining system time, you must include the
differentiator between the UTC and your local timezone. For example, San Jose, CA is the Pacific
Timezone with a UTC offset of -8.
To set the timezone, use the following command:
Command Syntax
Command Mode
Purpose
clock timezone timezone-name offset
CONFIGURATION
Set the clock to the appropriate timezone.
timezone-name: Enter the name of the timezone. Do
not use spaces.
offset: Enter one of the following:
• a number from 1 to 23 as the number of hours in
addition to UTC for the timezone.
• a minus sign (-) followed by a number from 1 to
23 as the number of hours.
FTOS#conf
FTOS(conf)#clock timezone Pacific -8
FTOS#
System Time and Date | 237
www.dell.com | support.dell.com
Setting Daylight Savings Time
FTOS supports setting the system to daylight savings time once or on a recurring basis every year.
Setting Daylight Saving Time Once
Set a date (and time zone) on which to convert the switch to daylight savings time on a one-time basis.
To set daylight saving time once, use the following command:
Command Syntax
Command Mode
Purpose
clock summer-time time-zone date
start-month start-day start-year
start-time end-month end-day
end-year end-time [offset]
CONFIGURATION
Set the clock to the appropriate timezone and daylight
savings time.
• time-zone: Enter the three-letter name for the time
zone. This name is displayed in the show clock
output.
• start-month: Enter the name of one of the 12 months
in English. You can enter the name of a day to change
the order of the display to time day month year
• start-day: Enter the number of the day. Range: 1 to
31. You can enter the name of a month to change the
order of the display to time day month year.
• start-year: Enter a four-digit number as the year.
Range: 1993 to 2035
• start-time: Enter the time in hours:minutes. For the
hour variable, use the 24-hour format, example, 17:15
is 5:15 pm.
• end-month: Enter the name of one of the 12 months in
English. You can enter the name of a day to change
the order of the display to time day month year.
• end-day: Enter the number of the day. Range: 1 to 31.
You can enter the name of a month to change the
order of the display to time day month year.
• end-year: Enter a four-digit number as the year.
Range: 1993 to 2035.
• end-time: Enter the time in hours:minutes. For the
hour variable, use the 24-hour format, example, 17:15
is 5:15 pm.
• offset: (OPTIONAL) Enter the number of minutes to
add during the summer-time period. Range: 1 to1440.
Default: 60 minutes
FTOS(conf)#clock summer-time pacific date Mar 14 2012 00:00 Nov 7 2012 00:00
FTOS(conf)#
238
|
System Time and Date
Setting Recurring Daylight Saving Time
Set a date (and time zone) on which to convert the switch to daylight savings time on a specific day every
year.
If you have already set daylight savings for a one-time setting, you can set that date and time as the
recurring setting using the clock summer-time time-zone recurring command.
To set a recurring daylight saving time, use the following command:
Command Syntax
Command Mode
Purpose
clock summer-time time-zone
recurring start-week start-day
start-month start-time end-week
end-day end-month end-time [offset]
CONFIGURATION
Set the clock to the appropriate timezone and adjust to
daylight savings time every year.
• time-zone: Enter the three-letter name for the time
zone. This name is displayed in the show clock
output.
• start-week: (OPTIONAL) Enter one of the following
as the week that daylight savings begins and then
enter values for start-day through end-time:
• week-number: Enter a number from 1-4 as the
number of the week in the month to start daylight
savings time.
• first: Enter this keyword to start daylight savings time
in the first week of the month.
• last: Enter this keyword to start daylight savings time
in the last week of the month.
• start-month: Enter the name of one of the 12 months
in English. You can enter the name of a day to change
the order of the display to time day month year.
• start-day: Enter the number of the day. Range: 1 to
31. You can enter the name of the month to change
the order of the display to time day month year.
• start-year: Enter a four-digit number as the year.
Range: 1993 to 2035
• start-time: Enter the time in hours:minutes. For the
hour variable, use the 24-hour format, example, 17:15
is 5:15 pm.
System Time and Date | 239
www.dell.com | support.dell.com
Command Syntax
Command Mode
Purpose
•
•
•
•
•
•
•
•
•
end-week: If you entered a start-week, enter one of
the following as the week that daylight savings ends:
week-number: enter a number from 1 to 4 as the
number of the week to end daylight savings time.
first: enter the keyword first to end daylight savings
time in the first week of the month.
last: enter the keyword last to end daylight savings
time in the last week of the month.
end-month: Enter the name of one of the 12 months in
English. You can enter the name of a day to change
the order of the display to time day month year.
end-day: Enter the number of the day. Range: 1 to 31.
You can enter the name of a day to change the order
of the display to time day month year.
end-year: Enter a four-digit number as the year.
Range: 1993 to 2035.
end-time: Enter the time in hours:minutes. For the
hour variable, use the 24-hour format, example, 17:15
is 5:15 pm.
offset: (OPTIONAL) Enter the number of minutes to
add during the summer-time period. Range: 1 to1440.
Default: 60 minutes
FTOS(conf)#clock summer-time pacific recurring Mar 14 2012 00:00 Nov 7 2012 00:00
FTOS(conf)#
Note: If you enter <CR> after entering the recurring command parameter, and you have already set a one-time
daylight saving time/date, the system uses that time and date as the recurring setting.
FTOS(conf)#clock summer-time pacific recurring ?
<1-4>
Week number to start
first
Week number to start
last
Week number to start
<cr>
FTOS(conf)#clock summer-time pacific recurring
FTOS(conf)#
240
|
System Time and Date
19
Uplink Failure Detection (UFD)
Feature Description
Uplink Failure Detection (UFD) provides detection of the loss of upstream connectivity and, if used with
NIC teaming, automatic recovery from a failed link.
A switch provides upstream connectivity for devices, such as servers. If a switch loses its upstream
connectivity, downstream devices also lose their connectivity. However, the devices do not receive a direct
indication that upstream connectivity is lost since connectivity to the switch is still operational.
UFD allows a switch to associate downstream interfaces with upstream interfaces. When upstream
connectivity fails, the switch disables the downstream links. Failures on the downstream links allow
downstream devices to recognize the loss of upstream connectivity.
For example, in Figure 19-1 Switches S1 and S2 both have upstream connectivity to Router R1 and
downstream connectivity to the server. UFD operation is shown in Steps A through C:
•
•
•
In Step A, the server configuration uses the connection to S1 as the primary path. Network traffic flows
from the server to S1 and then upstream to R1.
In Step B, the upstream link between S1 and R1 fails. The server continues to use the link to S1 for its
network traffic, but the traffic is not successfully switched through S1 because the upstream link is
down.
In Step C, UFD on S1 disables the link to the server. The server then stops using the link to S1 and
switches to using its link to S2 to send traffic upstream to R1.
Note: In Standalone, VLT, and Stacking modes, the UFD group number is 1 by default and cannot be
changed.
Uplink Failure Detection (UFD) | 241
www.dell.com | support.dell.com
Figure 19-1. Uplink Failure Detection
How Uplink Failure Detection Works
UFD creates an association between upstream and downstream interfaces. The association of uplink and
downlink interfaces is called an uplink-state group. An interface in an uplink-state group can be a physical
interface or a port-channel (LAG) aggregation of physical interfaces.
An enabled uplink-state group tracks the state of all assigned upstream interfaces. Failure on an upstream
interface results in the automatic disabling of downstream interfaces in the uplink-state group. As a result,
downstream devices can execute the protection or recovery procedures they have in place to establish
alternate connectivity paths as shown in Figure 19-2.
242
|
Uplink Failure Detection (UFD)
Figure 19-2. Uplink Failure Detection Example
If only one of the upstream interfaces in an uplink-state group goes down, a specified number of
downstream ports associated with the upstream interface are put into a link-down state. This number is
user-configurable and is calculated by the ratio of upstream port bandwidth to downstream port bandwidth
in the same uplink-state group. This calculation ensures that there are no traffic drops due to insufficient
bandwidth on the upstream links to the routers/switches.
By default, if all upstream interfaces in an uplink-state group go down, all downstream interfaces in the
same uplink-state group are put into a link-down state.
Using UFD, you can configure the automatic recovery of downstream ports in an uplink-state group when
the link status of an upstream port changes. The tracking of upstream link status does not have a major
impact on CPU usage.
UFD and NIC Teaming
Uplink Failure Detection on a switch can be used with network adapter teaming on a server (see Network
Interface Controller (NIC) Teaming) to implement a rapid failover solution. For example, in Figure 19-2
the switch/router with UFD detects the uplink failure and automatically disables the associated
downstream link port to the server. The server with NIC teaming detects the disabled link and
automatically switches over to the backup link in order to continue to transmit traffic upstream.
Uplink Failure Detection (UFD) | 243
www.dell.com | support.dell.com
Important Points to Remember
When you configure Uplink Failure Detection, the following conditions apply:
•
You can configure up to sixteen uplink-state groups. By default, no uplink-state groups are created.
An uplink-state group is considered to be operationally up if it has at least one upstream interface in
the link-up state.
An uplink-state group is considered to be operationally down if it has no upstream interfaces in the
link-up state. No uplink-state tracking is performed when a group is disabled or in an operationally
down state.
•
You can assign physical port or port-channel interfaces to an uplink-state group.
You can assign an interface to only one uplink-state group. Each interface assigned to an uplink-state
group must be configured as either an upstream or downstream interface, but not both.
You can assign individual member ports of a port channel to the group. An uplink-state group can contain either the member ports of a port channel or the port channel itself, but not both.
If you assign a port channel as an upstream interface, the port channel interface enters a link-down
state when the number of port-channel member interfaces in a link-up state drops below the configured
Minimum Number of Members parameter.
•
If one of the upstream interfaces in an uplink-state group goes down, either a user-configurable set of
downstream ports or all the downstream ports in the group are put in an operationally down state with
an UFD Disabled error. The order in which downstream ports are disabled is from the lowest
numbered port to the highest.
If one of the upstream interfaces in an uplink-state group that was down comes up, the set of UFD-disabled downstream ports (which were previously disabled due to this upstream port going down) are
brought up and the UFD Disabled error is cleared.
•
If an uplink-state group is disabled, the downstream interfaces are not disabled regardless of the state
of the upstream interfaces.
If an uplink-state group has no upstream interfaces assigned, downstream interfaces will not be disabled.
•
To enable the debug messages for events related to a specified uplink-state group or all groups, enter
the debug uplink-state-group [group-id] command, where group-id is 1 to 16.
To turn off debugging event messages, enter the no debug uplink-state-group [group-id] command.
For an example of debug log messages, see Message 1.
244
|
Uplink Failure Detection (UFD)
Configuring Uplink Failure Detection
To configure Uplink Failure Detection, follow these steps:
Step
1
Command Syntax and Mode
Description
uplink-state-group group-id
Creates an uplink-state group and enabling the tracking of
upstream links on the switch/router.
Valid group-id values are 1 to 16.
Command Mode: CONFIGURATION
To delete an uplink-state group, enter the no uplink-state-group
group-id command.
2
{upstream | downstream} interface
Assigns a port or port-channel to the uplink-state group as an
upstream or downstream interface.
Command Mode:
UPLINK-STATE-GROUP
For interface, enter one of the following interface types:
10-Gigabit Ethernet: tengigabitethernet {slot/port |slot/
port-range}
40-Gigabit Ethernet:
fortygigabitethernet {slot/port |slot/port-range}
Port channel: port-channel {1-512 | port-channel-range}
Where port-range and port-channel-range specify a range of ports
separated by a dash (-) and/or individual ports/port channels in any
order; for example:
upstream tengigabitethernet 1/1-2,5,9,11-12
downstream port-channel 1-3,5
A comma is required to separate each port and port-range entry.
To delete an interface from the group, enter the no {upstream |
downstream} interface command.
3
downstream disable links
{number | all}
(Optional) Configures the number of downstream links in the
uplink-state group that will be disabled (Oper Down state) if one
upstream link in the group goes down.
Command Mode:
UPLINK-STATE-GROUP
number specifies the number of downstream links to be brought
down. Range: 1 to 1024.
all brings down all downstream links in the group.
Default: No downstream links are disabled when an upstream link
goes down.
To revert to the default setting, enter the no downstream
disable links command.
4
downstream auto-recover
Command Mode:
UPLINK-STATE-GROUP
(Optional) Enables auto-recovery so that UFD-disabled
downstream ports in the uplink-state group come up when a
disabled upstream port in the group comes back up.
Default: Auto-recovery of UFD-disabled downstream ports is
enabled.
To disable auto-recovery, enter the no downstream
auto-recover command.
Uplink Failure Detection (UFD) | 245
www.dell.com | support.dell.com
Step
5
Command Syntax and Mode
Description
defer-timer seconds
Specifies the time (in seconds) to wait for the upstream port
channel (LAG 128) to come back up before server ports are
brought down. The range is from 1 to 120.
Command Mode:
UPLINK-STATE-GROUP
6
description text
(Optional) Enters a text description of the uplink-state group.
Maximum length: 80 alphanumeric characters.
Command Mode:
UPLINK-STATE-GROUP
7
no enable
(Optional) Disables upstream-link tracking without deleting the
uplink-state group.
Command Mode:
UPLINK-STATE-GROUP
Default: Upstream-link tracking is automatically enabled in an
uplink-state group.
To re-enable upstream-link tracking, enter the enable command.
Clearing a UFD-Disabled Interface
You can manually bring up a downstream interface in an uplink-state group that has been disabled by UFD
and is in a UFD-disabled error state. To re-enable one or more disabled downstream interfaces and clear
the UFD-disabled error state, enter the following command:
Command Syntax
Description
clear ufd-disable {interface interface |
uplink-state-group group-id}
Re-enables a downstream interface on the switch/router that is in a
UFD-disabled error state so that it can send and receive traffic.
Command Mode: EXEC mode
For interface, enter one of the following interface types:
10-Gigabit Ethernet: tengigabitethernet {slot/port |slot/port-range}
40-Gigabit Ethernet:
fortygigabitethernet {slot/port |slot/port-range}
Port channel: port-channel {1-512 | port-channel-range}
Where port-range and port-channel-range specify a range of ports
separated by a dash (-) and/or individual ports/port channels in any
order; for example:
tengigabitethernet 1/1-2,5,9,11-12
port-channel 1-3,5
A comma is required to separate each port and port-range entry.
uplink-state-group group-id re-enables all UFD-disabled
downstream interfaces in the group. Valid values are 1 to 16.
246
|
Uplink Failure Detection (UFD)
Message 1 shows the Syslog messages displayed when you clear the UFD-disabled state from all disabled
downstream interfaces in an uplink-state group by entering the clear ufd-disable uplink-state-group
group-id command. All downstream interfaces return to an operationally up state.
Message 1 Syslog Messages before and after entering clear ufd-disable uplink-state-group Command
00:10:12:
00:10:12:
00:10:12:
00:10:12:
00:10:12:
00:10:12:
00:10:13:
3
00:10:13:
Te 0/4
00:10:13:
Te 0/5
00:10:13:
Te 0/6
00:10:13:
00:10:13:
00:10:13:
%STKUNIT0-M:CP
%STKUNIT0-M:CP
%STKUNIT0-M:CP
%STKUNIT0-M:CP
%STKUNIT0-M:CP
%STKUNIT0-M:CP
%STKUNIT0-M:CP
%IFMGR-5-ASTATE_DN:
%IFMGR-5-ASTATE_DN:
%IFMGR-5-ASTATE_DN:
%IFMGR-5-OSTATE_DN:
%IFMGR-5-OSTATE_DN:
%IFMGR-5-OSTATE_DN:
%IFMGR-5-OSTATE_DN:
Changed
Changed
Changed
Changed
Changed
Changed
Changed
interface Admin state to
interface Admin state to
interface Admin state to
interface state to down:
interface state to down:
interface state to down:
uplink state group state
down: Te 0/1
down: Te 0/2
down: Te 0/3
Te 0/1
Te 0/2
Te 0/3
to down: Group
%STKUNIT0-M:CP %IFMGR-5-OSTATE_DN: Downstream interface set to UFD error-disabled:
%STKUNIT0-M:CP %IFMGR-5-OSTATE_DN: Downstream interface set to UFD error-disabled:
%STKUNIT0-M:CP %IFMGR-5-OSTATE_DN: Downstream interface set to UFD error-disabled:
%STKUNIT0-M:CP %IFMGR-5-OSTATE_DN: Changed interface state to down: Te 0/4
%STKUNIT0-M:CP %IFMGR-5-OSTATE_DN: Changed interface state to down: Te 0/5
%STKUNIT0-M:CP %IFMGR-5-OSTATE_DN: Changed interface state to down: Te 0/6
FTOS(conf-if-range-te-0/1-3)#do clear ufd-disable uplink-state-group 3
00:11:50: %STKUNIT0-M:CP
error-disabled: Te 0/4
00:11:51: %STKUNIT0-M:CP
error-disabled: Te 0/5
00:11:51: %STKUNIT0-M:CP
error-disabled: Te 0/6
00:11:51: %STKUNIT0-M:CP
00:11:51: %STKUNIT0-M:CP
00:11:51: %STKUNIT0-M:CP
%IFMGR-5-OSTATE_UP: Downstream interface cleared from UFD
%IFMGR-5-OSTATE_UP: Downstream interface cleared from UFD
%IFMGR-5-OSTATE_UP: Downstream interface cleared from UFD
%IFMGR-5-OSTATE_UP: Changed interface state to up: Te 0/4
%IFMGR-5-OSTATE_UP: Changed interface state to up: Te 0/5
%IFMGR-5-OSTATE_UP: Changed interface state to up: Te 0/6
Uplink Failure Detection (UFD) | 247
www.dell.com | support.dell.com
Displaying Uplink Failure Detection
To display information on the Uplink Failure Detection feature, enter any of the following show
commands:
Show Command Syntax
Description
show uplink-state-group [group-id] [detail]
Displays status information on a specified uplink-state group or all
groups. Valid group-id values are 1 to 16.
Command Mode: EXEC
detail displays additional status information on the upstream and
downstream interfaces in each group (see Figure 19-3).
show interfaces interface
Command Mode: EXEC
Displays the current status of a port or port-channel interface assigned
to an uplink-state group.
interface specifies one of the following interface types:
10-Gigabit Ethernet: Enter tengigabitethernet slot/port.
40-Gigabit Ethernet: Enter fortygigabitethernet slot/port.
Port channel: Enter port-channel {1-512}.
If a downstream interface in an uplink-state group has been disabled
(Oper Down state) by uplink-state tracking because an upstream port
went down, the message error-disabled[UFD] is displayed in the
output (see Figure 19-4).
show running-config uplink-state-group
[group-id]
Displays the current configuration of all uplink-state groups
(Figure 19-5) or a specified group (Figure 19-6).
Command Mode: EXEC
Valid group-id values are 1 to 16.
Or
show configuration
Command Mode: UPLINK-STATE-GROUP
248
|
Uplink Failure Detection (UFD)
Figure 19-3.
show uplink-state-group Command Output
FTOS# show uplink-state-group
Uplink
Uplink
Uplink
Uplink
Uplink
Uplink
State
State
State
State
State
State
Group:
Group:
Group:
Group:
Group:
Group:
1
3
5
6
7
16
Status:
Status:
Status:
Status:
Status:
Status:
Enabled, Up
Enabled, Up
Enabled, Down
Enabled, Up
Enabled, Up
Disabled, Up
FTOS# show uplink-state-group 16
Uplink State Group: 16 Status: Disabled, Up
FTOS#show uplink-state-group detail
(Up): Interface up
(Dwn): Interface down
Uplink State Group
: 1
Upstream Interfaces
:
Downstream Interfaces :
(Dis): Interface disabled
Status: Enabled, Up
Uplink State Group
: 3
Status: Enabled, Up
Upstream Interfaces
: Tengig 0/46(Up) Tengig 0/47(Up)
Downstream Interfaces : Te 13/0(Up) Te 13/1(Up) Te 13/3(Up) Te 13/5(Up) Te 13/6(Up)
Uplink State Group
: 5
Status: Enabled, Down
Upstream Interfaces
: Tengig 0/0(Dwn) Tengig 0/3(Dwn) Tengig 0/5(Dwn)
Downstream Interfaces : Te 13/2(Dis) Te 13/4(Dis) Te 13/11(Dis) Te 13/12(Dis) Te 13/13(Dis)
Te 13/14(Dis) Te 13/15(Dis)
Uplink State Group
: 6
Upstream Interfaces
:
Downstream Interfaces :
Status: Enabled, Up
Uplink State Group
: 7
Upstream Interfaces
:
Downstream Interfaces :
Status: Enabled, Up
Uplink State Group
: 16
Status: Disabled, Up
Upstream Interfaces
: Tengig 0/41(Dwn) Po 8(Dwn)
Downstream Interfaces : Tengig 0/40(Dwn)
Uplink Failure Detection (UFD) | 249
www.dell.com | support.dell.com
Figure 19-4.
show interfaces Command: UFD Output
FTOS#show interfaces tengigabitethernet 7/45
TenGigabitEthernet 7/45 is up, line protocol is down (error-disabled[UFD])
Hardware is Dell Force10Eth, address is 00:01:e8:32:7a:47
Current address is 00:01:e8:32:7a:47
Interface index is 280544512
Internet address is not set
MTU 1554 bytes, IP MTU 1500 bytes
LineSpeed 1000 Mbit, Mode auto
Flowcontrol rx off tx off
ARP type: ARPA, ARP Timeout 04:00:00
Last clearing of "show interface" counters 00:25:46
Queueing strategy: fifo
Input Statistics:
0 packets, 0 bytes
0 64-byte pkts, 0 over 64-byte pkts, 0 over 127-byte pkts
0 over 255-byte pkts, 0 over 511-byte pkts, 0 over 1023-byte pkts
0 Multicasts, 0 Broadcasts
0 runts, 0 giants, 0 throttles
0 CRC, 0 overrun, 0 discarded
Output Statistics:
0 packets, 0 bytes, 0 underruns
0 64-byte pkts, 0 over 64-byte pkts, 0 over 127-byte pkts
0 over 255-byte pkts, 0 over 511-byte pkts, 0 over 1023-byte pkts
0 Multicasts, 0 Broadcasts, 0 Unicasts
0 throttles, 0 discarded, 0 collisions
Rate info (interval 299 seconds):
Input 00.00 Mbits/sec,
0 packets/sec, 0.00% of line-rate
Output 00.00 Mbits/sec,
0 packets/sec, 0.00% of line-rate
Time since last interface status change: 00:01:23
Figure 19-5.
show running-config uplink-state-group Command: UFD Output
FTOS#show running-config uplink-state-group
!
uplink-state-group 1
no enable
downstream TenGigabitEthernet 0/0
upstream TenGigabitEthernet 0/1
FTOS#
Figure 19-6.
show configuration Command: UFD Output
FTOS(conf-uplink-state-group-16)# show configuration
!
uplink-state-group 16
no enable
description test
downstream disable links all
downstream TengigabitEthernet 0/40
upstream TengigabitEthernet 0/41
upstream Port-channel 8
250
|
Uplink Failure Detection (UFD)
Sample Configuration: Uplink Failure Detection
Figure 19-7 shows a sample configuration of Uplink Failure Detection on a switch/router in which you:
•
•
•
•
•
•
Configure uplink-state group 3.
Add downstream links TenGigabitethernet 0/1, 0/2, 0/5, 0/9, 0/11, and 0/12.
Configure two downstream links to be disabled if an upstream link fails.
Add upstream links TenGigabitethernet 0/3 and 0/4.
Add a text description for the group.
Verify the configuration with various show commands.
Uplink Failure Detection (UFD) | 251
www.dell.com | support.dell.com
Figure 19-7. Configuring Uplink Failure Detection
FTOS(conf)#uplink-state-group 3
FTOS(conf-uplink-state-group-3)#
00:23:52: %STKUNIT0-M:CP %IFMGR-5-ASTATE_UP: Changed uplink state group Admin state to up:
Group 3
FTOS(conf-uplink-state-group-3)#downstream tengigabitethernet 0/1-2,5,9,11-12
FTOS(conf-uplink-state-group-3)#downstream disable links 2
FTOS(conf-uplink-state-group-3)#upstream tengigabitethernet 0/3-4
FTOS(conf-uplink-state-group-3)#description Testing UFD feature
FTOS(conf-uplink-state-group-3)#show config
!
uplink-state-group 3
description Testing UFD feature
downstream disable links 2
downstream TenGigabitEthernet 0/1-2,5,9,11-12
upstream TenGigabitEthernet 0/3-4
FTOS#show running-config uplink-state-group
!
uplink-state-group 3
description Testing UFD feature
downstream disable links 2
downstream TenGigabitEthernet 0/1-2,5,9,11-12
upstream TenGigabitEthernet 0/3-4
FTOS#show uplink-state-group 3
Uplink State Group: 3
Status: Enabled, Up
FTOS#show uplink-state-group detail
(Up): Interface up
(Dwn): Interface down
(Dis): Interface disabled
Uplink State Group
: 3
Status: Enabled, Up
Upstream Interfaces
: Te 0/3(Up) Te 0/4(Up)
Downstream Interfaces : Te 0/1(Up) Te 0/2(Up) Te 0/5(Up) Te 0/9(Up) Te 0/11(Up)
Te 0/12(Up)
< After a single uplink port fails >
FTOS#show uplink-state-group detail
(Up): Interface up
(Dwn): Interface down
(Dis): Interface disabled
Uplink State Group
: 3
Status: Enabled, Up
Upstream Interfaces
: Te 0/3(Dwn) Te 0/4(Up)
Downstream Interfaces : Te 0/1(Dis) Te 0/2(Dis) Te 0/5(Up) Te 0/9(Up) Te 0/11(Up)
Te 0/12(Up)
252
|
Uplink Failure Detection (UFD)
20
Upgrade Procedures
To view the requirements for upgrading the Dell Networking operating software (FTOS) on an Aggregator,
refer to the FTOS Release Notes for the M I/O Aggregator. Follow the procedures in the FTOS Release
Notes for the software version you wish to upgrade to.
Direct any questions or concerns about FTOS upgrades to the Dell Networking Technical Support Center.
You can reach technical support:
•
•
•
On the Web: www.force10networks.com/support/
By email: [email protected]
By phone: US and Canada: 866.965.5800, International: 408.965.5800
Upgrade Procedures | 253
254
|
Upgrade Procedures
www.dell.com | support.dell.com
21
Debugging and Diagnostics
The chapter contains the following sections:
•
•
•
•
•
•
•
•
•
•
•
•
Debugging Aggregator Operation
Software show Commands
Offline Diagnostics
Trace Logs
Show Hardware Commands
Environmental Monitoring
Buffer Tuning
Troubleshooting Packet Loss
Application Core Dumps
Mini Core Dumps
TCP Dumps
Restoring the Factory Default Settings
Debugging and Diagnostics | 255
www.dell.com | support.dell.com
Debugging Aggregator Operation
This section describes common troubleshooting procedures to use for error conditions that may arise
during Aggregator operation.
All interfaces on the Aggregator are operationally down
Symptom: All Aggregator interfaces are down.
Resolution: Ensure that port channel 128 is up and that the Aggregator-facing port channel on the
top-of-rack switch is correctly configured.
Steps to Take:
1. Verify that uplink port-channel 128 i s up (show interfaces port-channel 128 brief command) and
display the status of member ports (show uplink-state-group 1 detail command).
FTOS#show interfaces port-channel 128 brief
Codes: L - LACP Port-channel
L
LAG
128
Mode
L2L3
Status
up
Uptime
17:36:24
Ports
Te 0/33
Te 0/35
Te 0/36
Te 0/39
Te 0/51
Te 0/53
Te 0/54
Te 0/56
(Up)
(Up)
(Up)
(Up)
(Up)
(Up)
(Up)
(Up)
FTOS#show uplink-state-group 1 detail
(Up): Interface up
Uplink State Group
Defer Timer
Upstream Interfaces
Downstream Interfaces
(Dwn): Interface down
:
:
:
:
1
10
Po
Te
Te
Te
Te
Te
Te
Te
(Dis): Interface disabled
Status: Enabled, Up
sec
128(Up)
0/1(Up) Te 0/2(Up) Te 0/3(Dwn) Te 0/4(Dwn) Te 0/5(Up)
0/6(Dwn) Te 0/7(Dwn) Te 0/8(Up) Te 0/9(Up) Te 0/10(Up)
0/11(Dwn) Te 0/12(Dwn) Te 0/13(Up) Te 0/14(Dwn) Te 0/15(Up)
0/16(Up) Te 0/17(Dwn) Te 0/18(Dwn) Te 0/19(Dwn) Te 0/20(Dwn)
0/21(Dwn) Te 0/22(Dwn) Te 0/23(Dwn) Te 0/24(Dwn) Te 0/25(Dwn)
0/26(Dwn) Te 0/27(Dwn) Te 0/28(Dwn) Te 0/29(Dwn) Te 0/30(Dwn)
0/31(Dwn) Te 0/32(Dwn)
2. Verify that the downstream port channel in the top-of-rack switch that connects to the Aggregator is
configured correctly.
256
|
Debugging and Diagnostics
Broadcast, unknown multicast, and DLF packets switched at
a very low rate
Symptom: Broadcast, unknown multicast, and DLF packets are switched at a very low rate.
By default, broadcast storm control is enabled on an Aggregator and rate limits the transmission of
broadcast, unknown multicast, and DLF packets to 1Gbps. This default behavior is designed to avoid
unnecessarily flooding these packets on all (4094) VLANs on all Aggregator interfaces (default
configuration).
Resolution: Disable broadcast storm control globally on the Aggregator.
Steps to Take:
1. Display the current status of broadcast storm control on the Aggregator (show io-aggregator broadcast
storm-control status command).
FTOS#show io-aggregator broadcast storm-control status
Storm-Control Enabled
Broadcast Traffic limited to 1000 Mbps
2. Disable broadcast storm control (no io-aggregator broadcast storm-control command) and re-display its
status.
FTOS#config terminal
FTOS(conf)#no io-aggregator broadcast storm-control
FTOS(conf)#end
FTOS#show io-aggregator broadcast storm-control status
Storm-Control Disabled
Debugging and Diagnostics | 257
www.dell.com | support.dell.com
Flooded packets on all VLANs are received on a server
Symptom: All packets flooded on all VLANs on an Aggregator are received on a server, even if the server
is configured as a member of only a subset of VLANs. This behavior happens because all Aggregator ports
are, by default, members of all (4094) VLANs.
Resolution: Configure a port that is connected to the server with restricted VLAN membership.
Steps to Take:
1. Display the current port mode for Aggregator L2 interfaces (show interfaces switchport interface
command).
FTOS#show interfaces switchport tengigabitethernet 0/1
Codes:
U
x
G
i
-
Untagged, T - Tagged
Dot1x untagged, X - Dot1x tagged
GVRP tagged, M - Trunk, H - VSN tagged
Internal untagged, I - Internal tagged, v - VLT untagged, V - VLT tagged
Name: TenGigabitEthernet 0/1
802.1QTagged: Hybrid
SMUX port mode: Auto VLANs enabled
Vlan membership:
Q
Vlans
U
1
T
2-4094
Native VlanId:
1
2. Assign the port to a specified group of VLANs (vlan tagged command) and re-display the port mode
status.
FTOS(conf)#interface tengigabitethernet 0/1
FTOS(conf-if-te-0/1)#vlan tagged 2-5,100,4010
FTOS(conf-if-te-0/1)#
FTOS#show interfaces switchport tengigabitethernet 0/1
Codes:
U
x
G
i
-
Untagged, T - Tagged
Dot1x untagged, X - Dot1x tagged
GVRP tagged, M - Trunk, H - VSN tagged
Internal untagged, I - Internal tagged, v - VLT untagged, V - VLT tagged
Name: TenGigabitEthernet 0/1
802.1QTagged: Hybrid
SMUX port mode: Admin VLANs enabled
Vlan membership:
Q
Vlans
U
1
T
2-5,100,4010
Native VlanId:
258
|
1
Debugging and Diagnostics
Auto-configured VLANs do not exist on a stacked Aggregator
Symptom: When an Aggregator is configured and used in a stack, traffic does not flow and the VLAN
auto-configuration on all ports is lost. This behavior happens because an Aggregator in stacking mode does
not support auto-configured VLANs. Only VLANs that were previously manually configured are retained
on the master stack unit.
Resolution: You must manually configure VLAN membership on each stack-unit port.
Steps to Take:
1. Configure VLAN membership on individual ports (vlan tagged command).
FTOS(conf)# interface tengigabitethernet 0/1
FTOS(conf-if-te-0/1)#vlan tagged 2-5,100,4010
FTOS(conf-if-te-0/1)#
2. Verify the manually configured VLAN membership (show interfaces switchport interface command).
FTOS#show interfaces switchport tengigabitethernet 0/1
Codes:
U
x
G
i
-
Untagged, T - Tagged
Dot1x untagged, X - Dot1x tagged
GVRP tagged, M - Trunk, H - VSN tagged
Internal untagged, I - Internal tagged, v - VLT untagged, V - VLT tagged
Name: TenGigabitEthernet 0/1
802.1QTagged: Hybrid
SMUX port mode: Admin VLANs enabled
Vlan membership:
Q
Vlans
U
1
T
2-5,100,4010
Native VlanId:
1
Debugging and Diagnostics | 259
www.dell.com | support.dell.com
Software show Commands
Use the show version and show system stack-unit 0 commands as a part of troubleshooting an
Aggregator’s software configuration in a standalone or stacking scenario.
Table 21-1.
Software show Commands
Command
Description
show version
Display the current version of FTOS software running on an Aggregator.
show system stack-unit 0
Display software configuration on an Aggregator in stacking mode.
Figure 21-1.
show version Command Example
FTOS#show version
Dell Force10 Real Time Operating System oftware
Dell Force10 Operating System Version: 1.0
Dell Force10 Application Software Version: E8-3-17-24
Copyright (c) 1999-2012 by Dell Inc. All Rights Reserved.
Build Time: Thu Jul 5 11:20:28 PDT 2012
Build Path: /sites/sjc/work/build/buildSpaces/build05/E8-3-17/SW/SRC/Cp_src/Tacacs
st-sjc-m1000e-3-72 uptime is 17 hour(s), 1 minute(s)
System image file is "st-sjc-m1000e-3-c2"
System Type: I/O-Aggregator
Control Processor: MIPS RMI XLP with 2147483648 bytes of memory.
256M bytes of boot flash memory.
1 34-port GE/TE (XL)
56 Ten GigabitEthernet/IEEE 802.3 interface(s)
260
|
Debugging and Diagnostics
Figure 21-2. show system stack-unit 0 Command Example
FTOS#show system stack-unit 0
-- Unit 0 -Unit Type
: Management Unit
Status
: online
Next Boot
: online
Required Type
: I/O-Aggregator - 34-port GE/TE (XL)
Current Type
: I/O-Aggregator - 34-port GE/TE (XL)
Master priority : 0
Hardware Rev
:
Num Ports
: 56
Up Time
: 17 hr, 8 min
FTOS Version
: 8-3-17-15
Jumbo Capable
: yes
POE Capable
: no
Boot Flash
: A: 4.0.1.0 [booted]
B: 4.0.1.0bt
Boot Selector
: 4.0.0.0
Memory Size
: 2147483648 bytes
Temperature
: 64C
Voltage
: ok
Switch Power
: GOOD
Product Name
: I/O Aggregator
Mfg By
: DELL
Mfg Date
: 2012-05-01
Serial Number
: TW282921F00038
Part Number
: 0NVH81
Piece Part ID
: TW-0NVH81-28292-1F0-0038
PPID Revision
:
Service Tag
: N/A
Expr Svc Code
: N/A
PSOC FW Rev
: 0xb
ICT Test Date
: 0-0-0
ICT Test Info
: 0x0
Max Power Req
: 31488
Fabric Type
: 0x3
Fabric Maj Ver : 0x1
Fabric Min Ver : 0x0
SW Manageability: 0x4
HW Manageability: 0x1
Max Boot Time
: 3 minutes
Link Tuning
: unsupported
Auto Reboot
: enabled
Burned In MAC
: 00:1e:c9:f1:03:42
No Of MACs
: 3
Debugging and Diagnostics | 261
www.dell.com | support.dell.com
Offline Diagnostics
The offline diagnostics test suite is useful for isolating faults and debugging hardware.The diagnostics tests
are grouped into three levels:
•
•
•
Level 0—Level 0 diagnostics check for the presence of various components and perform essential path
verifications. In addition, they verify the identification registers of the components on the board.
Level 1—A smaller set of diagnostic tests. Level 1 diagnostics perform status, self-test, access, and
read/write tests for all the components on the board and test their registers for appropriate values. In
addition, they perform extensive tests on memory devices (for example, SDRAM, flash, NVRAM,
EEPROM) wherever possible.
Level 2—The full set of diagnostic tests. Level 2 diagnostics are used primarily for on-board MAC
level, Physical level, and external loopback tests and more extensive component diagnostics. Various
components on the board are put into loopback mode, and test packets are transmitted through those
components. These diagnostics also perform snake tests using virtual local area network (VLAN)
configurations.
Note: Diagnostic is not allowed in Stacking mode, including member stacking. Avoid stacking before
executing the diagnostic tests in the chassis.
Important Points to Remember
•
•
•
•
You can only perform offline diagnostics on an offline standalone unit. You cannot perform
diagnostics if the ports are configured in a stacking group. Remove the port(s) from the stacking group
before executing the diagnostic test.
Diagnostics only test connectivity, not the entire data path.
Diagnostic results are stored on the flash of the unit on which you performed the diagnostics.
When offline diagnostics are complete, the unit or stack member reboots automatically.
Running Offline Diagnostics
To run offline diagnostics, follow these steps:
1. Place the unit in the offline state using the offline stack-unit command from EXEC Privilege mode
(Figure 22-3).
The system reboots when the off-line diagnostics complete. This is an automatic process. A warning
message appears when you implement the offline stack-unit command.
Warning - Diagnostic execution will cause stack-unit to reboot after completion of
diags.
Proceed with Offline-Diags [confirm yes/no]:y
262
|
Debugging and Diagnostics
Figure 21-3. Taking a Stack Unit Offline
FTOS#offline stack-unit 2
Warning - Diagnostic execution will cause stack-unit to reboot after completion of diags.
Proceed with Offline-Diags [confirm yes/no]:y
5w6d12h: %STKUNIT0-M:CP %CHMGR-2-STACKUNIT_DOWN: Stack unit 2 down - stack unit offline
5w6d12h: %STKUNIT0-M:CP %IFMGR-1-DEL_PORT: Removed port: Tengig 2/1-48
FTOS#5w6d12h: %STKUNIT1-S:CP %IFMGR-1-DEL_PORT: Removed port: Tengig 2/1-48
2. Use the show system brief command from EXEC Privilege mode to confirm offline status (Figure 22-4).
Figure 21-4. Verifying the Offline/Online Status of a Stack Unit
FTOS#show system brief | no-more
Stack MAC : 00:01:e8:00:ab:03
-- Stack Info -Unit UnitType
Status
ReqTyp
CurTyp
Version
Ports
-----------------------------------------------------------------------------------0
Member
not present
1
Management
online
I/O-Aggregator I/O-Aggregator 8-3-17-38
56
2
Member
not present
3
Member
not present
4
Member
not present
5
Member
not present
FTOS#
Trace Logs
In addition to the syslog buffer, the Dell Networking operating software (FTOS) buffers trace messages
which are continuously written by various FTOS software tasks to report hardware and software events
and status information. Each trace message provides the date, time, and name of the FTOS process. All
messages are stored in a ring buffer and can be saved to a file either manually or automatically upon
failover.
Auto Save on Crash or Rollover
Exception information on Master or Standby units is stored in the flash:/TRACE_LOG_DIR directory.
This directory contains files that save trace information when there has been a task crash or timeout.
On a Master unit, you can reach the TRACE_LOG_DIR files by file transfer protocol (FTP) or by using
the show file command from the flash://TRACE_LOG_DIR directory.
Debugging and Diagnostics | 263
www.dell.com | support.dell.com
On a Standby unit, you can reach the TRACE_LOG_DIR files only by using the show file command from
the flash://TRACE_LOG_DIR directory.
Note: Non-management Member units do not support this functionality.
Figure 21-5. Command Example
FTOS#dir flash://TRACE_LOG_DIR
Directory of flash:/TRACE_LOG_DIR
1
2
3
drwx
drwx
-rwx
4096
4096
100583
Jan 17 2011 15:02:16 +00:00 .
Jan 01 1980 00:00:00 +00:00 ..
Feb 11 2011 20:41:36 +00:00 failure_trace0_RPM0_CP
flash: 2143281152 bytes total (2069291008 bytes free)
Show Hardware Commands
The show hardware command tree consists of EXEC Privilege commands used with the Aggregator. These
commands display information from a hardware sub-component and from hardware-based feature tables.
Table 22-2 lists the show hardware commands available as of the latest FTOS version.
Note: Use the show hardware commands only under the guidance of Dell Networking Technical Assistance
Center.
Table 21-2.
show hardware Commands
Command
Description
show hardware stack-unit {0-5} cpu management View the internal interface status of the stack-unit CPU port which
statistics
connects to the external management interface.
show hardware stack-unit {0-5} cpu data-plane
statistics
View the driver-level statistics for the data-plane port on the CPU for the
specified stack-unit. It provides insight into the packet types entering the
CPU to see whether CPU-bound traffic is internal (IPC traffic) or network
control traffic, which the CPU must process.
show hardware stack-unit {0-5} buffer total-buffer View the modular packet buffers details per stack unit and the mode of
allocation.
264
|
show hardware stack-unit {0-5} buffer unit {0-1}
total-buffer
View the modular packet buffers details per unit and the mode of
allocation.
show hardware stack-unit {0-5} buffer unit {0-1}
port {1-64 | all} buffer-info
View the forwarding plane statistics containing the packet buffer usage per
port per stack unit.
show hardware stack-unit {0-5} buffer unit {0-1}
port {1-64} queue {0-14 | all} buffer-info
View the forwarding plane statistics containing the packet buffer statistics
per COS per port.
Debugging and Diagnostics
Table 21-2.
show hardware Commands
Command
Description
show hardware stack-unit {0-5} cpu party-bus
statistics
View input and output statistics on the party bus, which carries
inter-process communication traffic between CPUs.
show hardware stack-unit {0-5} drops unit {0-0}
port {33-56}
View the ingress and egress internal packet-drop counters, MAC counters
drop, and FP packet drops for the stack unit on per port basis. It assists in
identifying the stack unit/port pipe/port that may experience internal drops.
show hardware stack-unit {0-5} stack-port
{33-56}
View the input and output statistics for a stack-port interface.
show hardware stack-unit {0-5 unit {0-0} counters View the counters in the field processors of the stack unit.
show hardware stack-unit {0-5} unit {0-0} details
View the details of the FP devices and Hi gig ports on the stack-unit.
show hardware stack-unit {0-5} unit {0-0}
execute-shell-cmd {command}
Execute a specified bShell commands from the CLI without going into the
bShell.
show hardware stack-unit {0-5} unit {0-0}
ipmc-replication
View the Multicast IPMC replication table from the bShell.
show hardware stack-unit {0-5} unit {0-0}
port-stats [detail]
View the internal statistics for each port-pipe (unit) on per port basis.
show hardware stack-unit {0-5} unit {0-0} register View the stack-unit internal registers for each port-pipe.
show hardware stack-unit {0-5} unit {0-0}
table-dump {table name}
View the tables from the bShell through the CLI without going into the
bShell.
Environmental Monitoring
Aggregator components use environmental monitoring hardware to detect transmit power readings,
receive power readings, and temperature updates. To receive periodic power updates, you must enable the
enable optic-info-update interval command. The output in Figure 22-6 shows the environment status.
Debugging and Diagnostics | 265
www.dell.com | support.dell.com
Figure 21-6. show interfaces transceiver Command Example
FTOS#show int ten 0/49 transceiver
SFP is present
SFP 49 Serial Base ID fields
SFP 49 Id
= 0x03
SFP 49 Ext Id
= 0x04
SFP 49 Connector
= 0x07
SFP 49 Transceiver Code
= 0x00 0x00 0x00 0x01 0x20 0x40 0x0c 0x01
SFP 49 Encoding
= 0x01
SFP 49 BR Nominal
= 0x0c
SFP 49 Length(9um)
Km
= 0x00
SFP 49 Length(9um)
100m
= 0x00
SFP 49 Length(50um)
10m
= 0x37
SFP 49 Length(62.5um) 10m
= 0x1e
SFP 49 Length(Copper) 10m
= 0x00
SFP 49 Vendor Rev
=
SFP 49 Laser Wavelength
= 850 nm
SFP 49 CheckCodeBase
= 0x78
SFP 49 Serial Extended ID fields
SFP 49 Options
= 0x00 0x12
SFP 49 BR max
= 0
SFP 49 BR min
= 0
SFP 49 Vendor SN
= P11C0B0
SFP 49 Datecode
= 020919
SFP 49 CheckCodeExt
= 0xb6
SFP 49 Diagnostic Information
===================================
SFP 49 Rx Power measurement type
===================================
SFP 49 Temp High Alarm threshold
SFP 49 Voltage High Alarm threshold
SFP 49 Bias High Alarm threshold
SFP 49 TX Power High Alarm threshold
SFP 49 RX Power High Alarm threshold
SFP 49 Temp Low Alarm threshold
SFP 49 Voltage Low Alarm threshold
SFP 49 Bias Low Alarm threshold
SFP 49 TX Power Low Alarm threshold
SFP 49 RX Power Low Alarm threshold
===================================
SFP 49 Temp High Warning threshold
SFP 49 Voltage High Warning threshold
SFP 49 Bias High Warning threshold
SFP 49 TX Power High Warning threshold
SFP 49 RX Power High Warning threshold
SFP 49 Temp Low Warning threshold
SFP 49 Voltage Low Warning threshold
SFP 49 Bias Low Warning threshold
SFP 49 TX Power Low Warning threshold
SFP 49 RX Power Low Warning threshold
===================================
SFP 49 Temperature
SFP 49 Voltage
SFP 49 Tx Bias Current
SFP 49 Tx Power
SFP 49 Rx Power
===================================
SFP 49 Data Ready state Bar
SFP 49 Rx LOS state
SFP 49 Tx Fault state
266
|
Debugging and Diagnostics
= Average
=
=
=
=
=
=
=
=
=
=
100.000C
5.000V
100.000mA
5.000mW
5.000mW
-50.000C
0.000V
0.000mA
0.000mW
0.000mW
=
=
=
=
=
=
=
=
=
=
100.000C
5.000V
100.000mA
5.000mW
5.000mW
-50.000C
0.000V
0.000mA
0.000mW
0.000mW
=
=
=
=
=
40.844C
3.169V
0.000mA
0.000mW
0.227mW
= False
= False
= False
Recognize an Over-Temperature Condition
An over-temperature condition occurs for one of two reasons:
•
•
The card genuinely is too hot.
A sensor has malfunctioned.
Inspect cards adjacent to the one reporting condition to discover the cause.
•
•
If directly adjacent cards are not a normal temperature, suspect a genuine overheating condition.
If directly adjacent cards are a normal temperature, suspect a faulty sensor.
When the system detects a genuine over-temperature condition, it powers off the card. To recognize this
condition, look for the system messages in Message 1.
Message 1 Over Temperature Condition System Messages
CHMGR-2-MAJOR_TEMP: Major alarm: chassis temperature high (temperature reaches or exceeds threshold of
[value]C)
CHMGR-2-TEMP_SHUTDOWN_WARN: WARNING! temperature is [value]C; approaching shutdown threshold of [value]C
To view the programmed alarm thresholds levels, including the shutdown value, use the show alarms
threshold command (Figure 22-7).
Figure 21-7. show alarms threshold Command Example
FTOS#show alarms threshold
-- Temperature Limits (deg C) ---------------------------------------------------------------------------BelowNormal
Normal
Elevated
Critical
Trip/Shutdown
Unit0
<=40
41
71
81
86
FTOS#
Troubleshoot an Over-Temperature Condition
To troubleshoot an over-temperature condition:
1. Use the show environment commands to monitor the temperature levels.
2. Check air flow through the system. Ensure the air ducts are clean and that all fans are working
correctly.
3. After the software has determined that the temperature levels are within normal limits, the card can be
re-powered safely. To bring the stack unit back online, use the power-on command in EXEC mode.
In addition, Dell Networking requires that you install blanks in all slots without a line card to control
airflow for adequate system cooling.
Debugging and Diagnostics | 267
www.dell.com | support.dell.com
Figure 21-8. show environment Command Example
FTOS#show environment
-- Unit Environment Status -Unit Status
Temp
Voltage
--------------------------------------------------------------------------* 0
online
71C
ok
* Management Unit
-- Thermal Sensor Readings (deg C) -Unit Sensor0 Sensor1 Sensor2 Sensor3 Sensor4 Sensor5 Sensor6 Sensor7 Sensor8
Sensor9
----------------------------------------------------------------------------------------------0
45
43
66
61
66
62
70
65
67
71
Note: Exercise care when removing a card; if it has exceeded the major or shutdown thresholds, the card
could be hot to the touch
Recognize an Under-Voltage Condition
If the system detects an under-voltage condition, it sends an alarm. To recognize this condition, look for the
system messages in Message 2.
Message 2 Under-Voltage Condition System Messages
%CHMGR-1-CARD_SHUTDOWN: Major alarm: Line card 2 down - auto-shutdown due to under voltage
Message 2 indicates that the specified card is not receiving enough power. In response, the system first
shuts down Power over Ethernet (PoE).
Troubleshoot an Under-Voltage Condition
To troubleshoot an under-voltage condition, check that the correct number of power supplies are installed
and their Status light emitting diodes (LEDs) are lit.
268
|
Debugging and Diagnostics
The simple network management protocol (SNMP) traps and OIDs in Table 22-3 provide information
about environmental monitoring hardware and hardware components.
Table 21-3.
SNMP Traps and OIDs
OID String
OID Name
Description
chSysPortXfpRecvPower
OID to display the receiving power of the connected
optics.
chSysPortXfpTxPower
OID to display the transmitting power of the
connected optics.
chSysPortXfpRecvTemp
OID to display the Temperature of the connected
optics.
Receiving power
.1.3.6.1.4.1.6027.3.10.1.2.5.1.6
Transmitting power
.1.3.6.1.4.1.6027.3.10.1.2.5.1.8
Temperature
.1.3.6.1.4.1.6027.3.10.1.2.5.1.7
Note: These OIDs are only generated if you enable
the CLI enable optic-info-update-interval is enabled
command.
Hardware MIB Buffer Statistics
.1.3.6.1.4.1.6027.3.16.1.1.4
fpPacketBufferTable
View the modular packet buffers details per stack
unit and the mode of allocation.
.1.3.6.1.4.1.6027.3.16.1.1.5
fpStatsPerPortTable
View the forwarding plane statistics containing the
packet buffer usage per port per stack unit.
.1.3.6.1.4.1.6027.3.16.1.1.6
fpStatsPerCOSTable
View the forwarding plane statistics containing the
packet buffer statistics per COS per port.
Buffer Tuning
Buffer tuning allows you to modify the way your switch allocates buffers from its available memory and
helps prevent packet drops during a temporary burst of traffic. The application-specific integrated circuit
(ASICs) implement the key functions of queuing, feature lookups, and forwarding lookups in the
hardware.
•
Forwarding processor (FP) ASICs provide Ethernet MAC functions, queueing and buffering, as well
as store feature and forwarding tables for hardware-based lookup and forwarding decisions. 10G and
40G interfaces use different FPs.
You can tune buffers at three locations (Figure 22-9).
1. CSF – Output queues going from the CSF.
2. FP Uplink—Output queues going from the FP to the CSF IDP links.
3. Front-End Link—Output queues going from the FP to the front-end PHY.
Debugging and Diagnostics | 269
www.dell.com | support.dell.com
All ports support eight queues, four for data traffic and four for control traffic. All eight queues are tunable.
Physical memory is organized into cells of 128 bytes. The cells are organized into two buffer pools—a
dedicated buffer and a dynamic buffer.
•
•
Dedicated buffer is reserved memory that cannot be used by other interfaces on the same ASIC or by
other queues on the same interface. This buffer is always allocated, and no dynamic recarving takes
place based on changes in interface status. Dedicated buffers introduce a trade-off. They provide each
interface with a guaranteed minimum buffer to prevent an overused and congested interface from
starving all other interfaces. However, this minimum guarantee means the buffer manager does not
reallocate the buffer to an adjacent congested interface, which means that in some cases, memory is
underused.
Dynamic buffer is shared memory that is allocated as needed, up to a configured limit. Using dynamic
buffers provides the benefit of statistical buffer sharing. An interface requests dynamic buffers when
its dedicated buffer pool is exhausted. The buffer manager grants the request based on three
conditions:
• The number of used and available dynamic buffers.
• The maximum number of cells that an interface can occupy.
• Available packet pointers (2k per interface). Each packet is managed in the buffer using a unique
packet pointer. Thus, each interface can manage up to 2k packets.
You can configure dynamic buffers per port on both 1G and 10G FPs and per queue on CSFs. By default,
the FP dynamic buffer allocation is 10 times oversubscribed. For the 48-port 1G card:
•
•
•
Dynamic Pool= Total Available Pool(16384 cells) – Total Dedicated Pool = 5904 cells
Oversubscription ratio = 10
Dynamic Cell Limit Per port = 59040/29 = 2036 cells
Figure 21-9. Buffer Tuning Points
CSF Unit 3
1
IDP Switch Links
2
FP Unit 1
3
Front-end Links
PHY
270
|
Debugging and Diagnostics
PHY
Deciding to Tune Buffers
Dell Networking recommends exercising caution when configuring any non-default buffer settings, as
tuning can significantly affect system performance. The default values work for most cases.
As a guideline, consider tuning buffers if traffic is very bursty (and coming from several interfaces). In this
case:
•
•
•
Reduce the dedicated buffer on all queues/interfaces.
Increase the dynamic buffer on all interfaces.
Increase the cell pointers on a queue that you are expecting will receive the largest number of packets.
Buffer Tuning Commands
To tune the buffers, use the following commands:
Task
Command
Command Mode
Define a buffer profile for the FP queues.
buffer-profile fp fsqueue
CONFIGURATION
Define a buffer profile for the CSF queues.
buffer-profile csf csqueue
CONFIGURATION
Change the dedicated buffers on a physical 1G
interface.
buffer dedicated
BUFFER PROFILE
Change the maximum amount of dynamic buffers
an interface can request.
buffer dynamic
BUFFER PROFILE
Change the number of packet-pointers per queue.
buffer packet-pointers
BUFFER PROFILE
Apply the buffer profile to a CSF to FP link.
buffer csf linecard
CONFIGURATION
FTOS Behavior: If you attempt to apply a buffer profile to a non-existent port-pipe, FTOS displays the
following message. However, the configuration still appears in the running-config.
%DIFFSERV-2-DSA_BUFF_CARVING_INVALID_PORT_SET: Invalid FP port-set 2 for linecard 2. Valid
range of port-set is <0-1>
Configuration changes take effect immediately and appear in the running configuration. Because under
normal conditions all ports do not require the maximum possible allocation, the configured dynamic
allocations can exceed the actual amount of available memory; this is called oversubscription. If you
choose to oversubscribe the dynamic allocation, a burst of traffic on one interface might prevent other
interfaces from receiving the configured dynamic allocation, which causes packet loss.
Debugging and Diagnostics | 271
www.dell.com | support.dell.com
You cannot allocate more than the available memory for the dedicated buffers. If the system determines
that the sum of the configured dedicated buffers allocated to the queues is more than the total available
memory, the configuration is rejected, returning a syslog message similar to the following.
Table 21-4.
Buffer Allocation Error
00:04:20: %S50N:0 %DIFFSERV-2-DSA_DEVICE_BUFFER_UNAVAILABLE: Unable to allocate dedicated buffers for
stack-unit 0, port pipe 0, egress port 25 due to unavailability of cells
FTOS Behavior: When you remove a buffer-profile using the no buffer-profile [fp | csf] command from
CONFIGURATION mode, the buffer-profile name still appears in the output of show buffer-profile [detail |
summary].
After a stack unit is reset, the buffer profile correctly returns to the default values, but the profile name
remains. Remove it from the show buffer-profile [detail | summary] command output by using the no buffer
[fp-uplink |csf] stack-unit port-set buffer-policy command from CONFIGURATION mode and the no
buffer-policy command from INTERFACE mode.
Display the allocations for any buffer profile using the show commands in Figure 22-11. Display the
default buffer profile using the show buffer-profile {summary | detail} command from EXEC Privilege mode
(Figure 22-10).
Figure 21-10.
Display the Default Buffer Profile
FTOS#show buffer-profile detail interface tengigabitethernet 0/1
Interface Tengig 0/1
Buffer-profile Dynamic buffer 194.88 (Kilobytes)
Queue#
Dedicated Buffer
Buffer Packets
(Kilobytes)
0
2.50
256
1
2.50
256
2
2.50
256
3
2.50
256
4
9.38
256
5
9.38
256
6
9.38
256
7
9.38
256
272
|
Debugging and Diagnostics
Figure 21-11.
Displaying Buffer Profile Allocations
FTOS#show running-config interface tengigabitethernet 2/0 !
interface TenGigabitEthernet 2/0
no ip address
mtu 9252
switchport
no shutdown
buffer-policy myfsbufferprofile
FTOS#show buffer-profile detail int tengig 0/10
Interface Tengig 0/10
Buffer-profile fsqueue-fp
Dynamic buffer 1256.00 (Kilobytes)
Queue#
Dedicated Buffer
Buffer Packets
(Kilobytes)
0
3.00
256
1
3.00
256
2
3.00
256
3
3.00
256
4
3.00
256
5
3.00
256
6
3.00
256
7
3.00
256
FTOS#show buffer-profile detail fp-uplink stack-unit 0 port-set 0
Linecard 0 Port-set 0
Buffer-profile fsqueue-hig
Dynamic Buffer 1256.00 (Kilobytes)
Queue#
Dedicated Buffer
Buffer Packets
(Kilobytes)
0
3.00
256
1
3.00
256
2
3.00
256
3
3.00
256
4
3.00
256
5
3.00
256
6
3.00
256
7
3.00
256
Debugging and Diagnostics | 273
www.dell.com | support.dell.com
Using a Pre-Defined Buffer Profile
FTOS provides two pre-defined buffer profiles, one for single-queue (for example, non-QoS) applications,
and one for four-queue (for example, QoS) applications.
Task
Command
Mode
Apply one of two pre-defined buffer profiles for all port
pipes in the system.
buffer-profile global [1Q|4Q]
CONFIGURATION
You must reload the system for the global buffer profile to take effect (Message 3).
Message 3 Reload After Applying Global Buffer Profile
% Info: For the global pre-defined buffer profile to take effect, please save the config and reload the
system.
FTOS Behavior: After you configure buffer-profile global 1Q, Message 3 is displayed during every
bootup. Only one reboot is required for the configuration to take effect; afterwards this bootup
message may be ignored.
FTOS Behavior: The buffer profile does not returned to the default, 4Q. If you configure 1Q, save the
running-config to the startup-config, and then delete the startup-config and reload the chassis. The
only way to return to the default buffer profile is to remove the 1Q profile configured and then reload
the chassis.
The buffer-profile global command fails if you have already applied a custom buffer profile on an interface.
Message 4 Global Buffer Profile Error
% Error: User-defined buffer profile already applied. Failed to apply global pre-defined buffer profile.
Please remove all user-defined buffer profiles.
Similarly, when you configure buffer-profile global, you cannot not apply a buffer profile on any single
interface.
Message 5 Global Buffer Profile Error
% Error: Global pre-defined buffer profile already applied. Failed to apply user-defined buffer profile
on interface Tengig 0/1. Please remove global pre-defined buffer profile.
If the default buffer profile (4Q) is active, FTOS displays an error message instructing you to remove the
default configuration using the no buffer-profile global command.
274
|
Debugging and Diagnostics
Sample Buffer Profile Configuration
The two general types of network environments are sustained data transfers and voice/data. Dell
Networking recommends a single-queue approach for data transfers (Figure 22-12).
Figure 21-12.
Single Queue Application with Default Packet Pointers
!
buffer-profile fp fsqueue-fp
buffer dedicated queue0 3 queue1 3 queue2 3 queue3 3 queue4 3 queue5 3 queue6 3 queue7 3
buffer dynamic 1256
!
buffer-profile fp fsqueue-hig
buffer dedicated queue0 3 queue1 3 queue2 3 queue3 3 queue4 3 queue5 3 queue6 3 queue7 3
buffer dynamic 1256
!
buffer fp-uplink stack-unit 0 port-set 0 buffer-policy fsqueue-hig
buffer fp-uplink stack-unit 0 port-set 1 buffer-policy fsqueue-hig
!
Interface range tengig 0/1 - 48
buffer-policy fsqueue-fp
FTOS#sho run int Tengig 0/10
!
interface TenGigabitEthernet 0/10
no ip address
Troubleshooting Packet Loss
The show hardware stack-unit command is intended primarily to troubleshoot packet loss.
•
•
•
•
show hardware stack-unit 0-5 cpu data-plane statistics
show hardware stack-unit 0-5 cpu party-bus statistics
show hardware stack-unit 0-5 drops unit 0-0 port 1-56
show hardware stack-unit 0-5 stack-port 33-56
•
show hardware stack-unit 0-5 unit 0-0 {counters | details | port-stats [detail] | register | ipmc-replication |
table-dump}:
•
•
•
•
•
•
•
•
show hardware {layer2| layer3} {eg acl | in acl} stack-unit 0-5 port-set 0-0
show hardware layer3 qos stack-unit 0-5 port-set 0-0
show hardware system-flow layer2 stack-unit 0-5 port-set 0-1 [counters]
clear hardware stack-unit 0-5 counters
clear hardware stack-unit 0-5 unit 0-0 counters
clear hardware stack-unit 0-5 cpu data-plane statistics
clear hardware stack-unit 0-5 cpu party-bus statistics
clear hardware stack-unit 0-5 stack-port 33-56
Debugging and Diagnostics | 275
www.dell.com | support.dell.com
Displaying Drop Counters
The show hardware stack-unit 0–11 drops [unit 0 [port 0–63]] command assists in identifying which stack unit,
port pipe, and port is experiencing internal drops (Figure 22-13) and (Figure 22-14).
Figure 21-13.
Displaying Drop Counter Statistics
FTOS#show hardware stack-unit 0 drops
UNIT No: 0
Total Ingress Drops :0
Total IngMac Drops :0
Total Mmu Drops :0
Total EgMac Drops :0
Total Egress Drops :0
UNIT No: 1
Total Ingress Drops :0
Total IngMac Drops :0
Total Mmu Drops :0
Total EgMac Drops :0
Total Egress Drops :0
FTOS#show hardware stack-unit 0 drops unit 0
Port# :Ingress Drops :IngMac Drops :Total Mmu Drops :EgMac Drops :Egress
Drops
1 0 0 0 0 0
2 0 0 0 0 0
3 0 0 0 0 0
4 0 0 0 0 0
5 0 0 0 0 0
6 0 0 0 0 0
7 0 0 0 0 0
8 0 0 0 0 0
Display drop counters with the show hardware stack-unit drops unit port command (Figure 22-14).
276
|
Debugging and Diagnostics
Figure 21-14.
Displaying Buffer Statistics, Displaying Drop Counters
FTOS#show hardware stack-unit
--- Ingress Drops
--Ingress Drops
IBP CBP Full Drops
PortSTPnotFwd Drops
IPv4 L3 Discards
Policy Discards
Packets dropped by FP
(L2+L3) Drops
Port bitmap zero Drops
Rx VLAN Drops
0 drops unit 0 port 1
:
:
:
:
:
:
:
:
:
30
0
0
0
0
14
0
16
0
--- Ingress MAC counters--Ingress FCSDrops
Ingress MTUExceeds
: 0
: 0
--- MMU Drops
HOL DROPS
TxPurge CellErr
Aged Drops
: 0
: 0
: 0
---
--- Egress MAC counters--Egress FCS Drops
: 0
--- Egress FORWARD PROCESSOR Drops
IPv4 L3UC Aged & Drops
: 0
TTL Threshold Drops
: 0
INVALID VLAN CNTR Drops
: 0
L2MC Drops
: 0
PKT Drops of ANY Conditions
: 0
Hg MacUnderflow
: 0
TX Err PKT Counter
: 0
---
Dataplane Statistics
The show hardware stack-unit cpu data-plane statistics command provides insight into the packet types coming
to the CPU. As shown in Figure 22-15, the command output has been augmented, providing detailed RX/
TX packet statistics on a per-queue basis. The objective is to see whether CPU-bound traffic is internal
(so-called party bus or IPC traffic) or network control traffic, which the CPU must process.
Debugging and Diagnostics | 277
www.dell.com | support.dell.com
Figure 21-15.
Displaying Buffer Statistics, Displaying Dataplane Statistics
FTOS#show hardware stack-unit 2 cpu data-plane statistics
bc pci driver statistics for device:
rxHandle
:0
noMhdr
:0
noMbuf
:0
noClus
:0
recvd
:0
dropped
:0
recvToNet
:0
rxError
:0
rxDatapathErr
:0
rxPkt(COS0)
:0
rxPkt(COS1)
:0
rxPkt(COS2)
:0
rxPkt(COS3)
:0
rxPkt(COS4)
:0
rxPkt(COS5)
:0
rxPkt(COS6)
:0
rxPkt(COS7)
:0
rxPkt(UNIT0)
:0
rxPkt(UNIT1)
:0
rxPkt(UNIT2)
:0
rxPkt(UNIT3)
:0
transmitted
:0
txRequested
:0
noTxDesc
:0
txError
:0
txReqTooLarge
:0
txInternalError :0
txDatapathErr
:0
txPkt(COS0)
:0
txPkt(COS1)
:0
txPkt(COS2)
:0
txPkt(COS3)
:0
txPkt(COS4)
:0
txPkt(COS5)
:0
txPkt(COS6)
:0
txPkt(COS7)
:0
txPkt(UNIT0)
:0
The show hardware stack-unit cpu party-bus statistics command displays input and output statistics on the party
bus, which carries inter-process communication traffic between CPUs (Figure 22-16).
Figure 21-16.
Displaying Party Bus Statistics
FTOS#sh hardware stack-unit 2 cpu party-bus statistics
Input Statistics:
27550 packets, 2559298 bytes
0 dropped, 0 errors
Output Statistics:
1649566 packets, 1935316203 bytes
0 errors
278
|
Debugging and Diagnostics
Displaying Stack Port Statistics
The show hardware stack-unit stack-port command displays input and output statistics for a stack-port
interface (Figure 22-17).
Figure 21-17.
Displaying Stack Unit Statistics
FTOS#show hardware stack-unit 2 stack-port 49
Input Statistics:
27629 packets, 3411731 bytes
0 64-byte pkts, 27271 over 64-byte pkts, 207 over 127-byte pkts
17 over 255-byte pkts, 56 over 511-byte pkts, 78 over 1023-byte pkts
0 Multicasts, 5 Broadcasts
0 runts, 0 giants, 0 throttles
0 CRC, 0 overrun, 0 discarded
Output Statistics:
1649714 packets, 1948622676 bytes, 0 underruns
0 64-byte pkts, 27234 over 64-byte pkts, 107970 over 127-byte pkts
34 over 255-byte pkts, 504838 over 511-byte pkts, 1009638 over 1023-byte pkts
0 Multicasts, 0 Broadcasts, 1649714 Unicasts
0 throttles, 0 discarded, 0 collisions
Rate info (interval 45 seconds):
Input 00.00 Mbits/sec,
2 packets/sec, 0.00% of line-rate
Output 00.06 Mbits/sec,
8 packets/sec, 0.00% of line-rate
FTOS#
Displaying Stack Member Counters
The show hardware stack-unit 0–5 {counters | details | port-stats [detail] | register} command displays internal
receive and transmit statistics, based on the selected command option. A sample of the output is shown for
the counters option in Figure 22-18.
Figure 21-18.
RIPC4.ge0
RUC.ge0
RDBGC0.ge0
RDBGC1.ge0
RDBGC5.ge0
RDBGC7.ge0
GR64.ge0
GR127.ge0
GR255.ge0
GRPKT.ge0
GRBYT.ge0
GRMCA.ge0
GRBCA.ge0
GT64.ge0
GT127.ge0
GT255.ge0
GT511.ge0
GTPKT.ge0
GTBCA.ge0
GTBYT.ge0
RUC.cpu0
TDBGC6.cpu0
Displaying Stack Unit Counters
:
:
:
:
:
:
:
:
:
:
:
:
:
:
:
:
:
:
:
:
:
:
1,202
1,224
34
366
16
18
5,176
1,566
4
1,602
117,600
366
12
4
964
4
1
973
1
71,531
972
1,584
+1,202
+1,217
+24
+235
+12
+12
+24
+1,433
+4
+1,461
+106,202
+235
+9
+3
+964
+4
+1
+972
+1
+71,467
+971
+1,449=
Debugging and Diagnostics | 279
www.dell.com | support.dell.com
Application Core Dumps
Application core dumps are disabled by default. A core dump file can be very large. Due to memory
requirements, the file can only be sent directly to an FTP server. It is not stored on the local flash. To
enable full application core dumps, use the following command:
Task
Command Syntax
Command Mode
Enable RPM core dumps and specify the
shutdown mode.
logging coredump server
CONFIGURATION
To undo this command, use the no logging coredump server command.
Mini Core Dumps
FTOS supports mini core dumps for application and kernel crashes. The mini core dump applies to Master,
Standby, and Member units.
Application and kernel mini core dumps are always enabled. The mini core dumps contain the stack space
and some other very minimal information that you can use to debug a crash. These files are small files and
are written into flash until space is exhausted. When the flash is full, the write process is stopped.
A mini core dump contains critical information in the event of a crash.
•
•
•
Mini core dump files are located in flash:/ (root dir).
The application mini core file name format is f10StkUnit<Stack_unit_no>.<Application
name>.acore.mini.txt.
The kernel mini core file name format is f10StkUnit<Stack_unit_no>.kcore.mini.txt.
Sample files names are shown in Figure 22-19 and a sample file text is shown in Figure 22-20.
280
|
Debugging and Diagnostics
Figure 21-19.
Mini application core file naming example
FTOS#dir
Directory of flash:
1
2
3
4
5
6
7
8
9
10
11
12
13
drwdrwx
drwd---rw-rw-rw-rw-rw-rw-rw-rw-rw-
16384
1536
512
512
8693
8693
156
156
156
156
156
156
156
Jan
Sep
Aug
Aug
Sep
Sep
Aug
Aug
Aug
Aug
Aug
Aug
Aug
01
03
07
07
03
03
28
28
28
28
31
29
31
1980
2009
2009
2009
2009
2009
2009
2009
2009
2009
2009
2009
2009
00:00:00
16:51:02
13:05:58
13:06:00
16:50:56
16:44:22
16:16:10
17:17:24
18:25:18
19:07:36
16:18:50
14:28:34
16:14:56
+00:00
+00:00
+00:00
+00:00
+00:00
+00:00
+00:00
+00:00
+00:00
+00:00
+00:00
+00:00
+00:00
.
..
TRACE_LOG_DIR
ADMIN_DIR
startup-config
startup-config.bak
f10StkUnit0.mrtm.acore.mini.txt
f10StkUnit0.vrrp.acore.mini.txt
f10StkUnit0.sysd.acore.mini.txt
f10StkUnit0.frrp.acore.mini.txt
f10StkUnit2.sysd.acore.mini.txt
f10StkUnit0.ipm1.acore.mini.txt
f10StkUnit0.acl.acore.mini.txt
flash: 3104256 bytes total (2959872 bytes free)
FTOS#
When a member or standby unit crashes, the mini core file gets uploaded to master unit. When the master
unit crashes, the mini core file is uploaded to new master. In the Aggregator, only the master unit has the
ability to upload the coredump.
Figure 21-20.
Mini core text file example
VALID MAGIC
------------------------PANIC STRING ----------------panic string is :<null>
----------------------STACK TRACE START--------------0035d60c <f10_save_mmu+0x120>:
00274f8c <panic+0x144>:
0024e2b0 <db_fncall+0x134>:
0024dee8 <db_command+0x258>:
0024d9c4 <db_command_loop+0xc4>:
002522b0 <db_trap+0x158>:
0026a8d0 <mi_switch+0x1b0>:
0026a00c <bpendtsleep>:
------------------------STACK TRACE END------------------------------------------FREE MEMORY--------------uvmexp.free = 0x2312
The panic string contains key information regarding the crash. Several panic string types exist, and they are
displayed in regular English text to allow easier understanding of the crash cause.
Debugging and Diagnostics | 281
www.dell.com | support.dell.com
TCP Dumps
TCP dump captures CPU bound control plane traffic to improve troubleshooting and system
manageability. When enabled, a TCP dump captures all the packets on the local CPU, as specified in the
CLI.
You can save the traffic capture files to flash, FTP, SCP, or TFTP. The files saved on the flash are located in
the flash://TCP_DUMP_DIR/Tcpdump_<time_stamp_dir>/ directory, and labeled tcpdump_*.pcap. There can
be up to 20 Tcpdump_<time_stamp_dir> directories. The file after 20 overwrites the oldest saved file. The
maximum file size for a TCP dump capture is 1MB. When a file reaches 1MB, a new file is created, up to
the specified total number of files.
Maximize the number of packets recorded in a file by specifying the snap-length to capture the file headers
only.
The tcpdump command has a finite run process. When you enable the command, it runs until the
capture-duration timer and/or the packet-count counter threshold is met. If no threshold is set, the system
uses a default of five minute capture-duration and/or a single 1k file as the stopping point for the dump.
You can use the capture-duration timer and the packet-count counter at the same time. The TCP dump stops
when the first of the thresholds is met. That means that even if the duration timer is 9000 seconds, if the
maximum file count parameter is met first, the dumps stop.
Task
Command Syntax
Command Mode
Enable a TCP dump for CPU bound traffic.
tcpdump cp [capture-duration time | filter
expression | max-file-count value | packet-count
value | snap-length value | write-to path]
CONFIGURATION
Restoring the Factory Default Settings
Restoring factory defaults deletes the existing NVRAM settings, startup configuration and all configured
settings such as stacking or fanout.
To restore the factory default settings, use the restore factory-defaults stack-unit {0-5 | all} {clear-all | nvram}
command in EXEC Privilege mode.
Caution: There is no undo for this command.
Important Points to Remember
•
•
282
|
When you restore all the units in a stack, all units in the stack are placed into stand-alone mode.
When you restore a single unit in a stack, only that unit is placed in stand-alone mode. No other units
in the stack are affected.
Debugging and Diagnostics
•
•
When you restore the units in stand-alone mode, the units remain in stand-alone mode after the
restoration.
After the restore is complete, the units power cycle immediately.
Figure 4-9 shows an example of using the restore factory-defaults command to restore the Factory
Default Settings.
Figure 21-21.
Restoring the Factory Default Settings
FTOS#restore factory-defaults stack-unit 0 nvram
***********************************************************************
* Warning - Restoring factory defaults will delete the existing
*
* persistent settings (stacking, fanout, etc.)
*
* After restoration the unit(s) will be powercycled immediately.
*
* Proceed with caution !
*
***********************************************************************
Proceed with factory settings? Confirm [yes/no]:yes
-- Restore status -Unit
Nvram
Config
-----------------------0
Success
Power-cycling the unit(s).
....
Debugging and Diagnostics | 283
284
|
Debugging and Diagnostics
www.dell.com | support.dell.com
22
Standards Compliance
This chapter contains the following sections:
•
•
•
IEEE Compliance
RFC and I-D Compliance
MIB Location
Note: Unless noted, when a standard cited here is listed as supported by Dell Networking operating
software (FTOS), FTOS also supports predecessor standards. One way to search for predecessor
standards is to use the http://tools.ietf.org/ website. Click on “Browse and search IETF documents”,
enter an RFC number, and inspect the top of the resulting document for obsolescence citations to related
RFCs.
IEEE Compliance
•
•
•
•
•
•
•
•
•
•
•
•
•
802.1AB — LLDP
802.1p — L2 Prioritization
802.1Q — VLAN Tagging, Double VLAN Tagging, GVRP
802.3ad — Link Aggregation with LACP
802.3ae — 10 Gigabit Ethernet (10GBASE-W, 10GBASE-X)
802.3ak — 10 Gigabit Ethernet (10GBASE-CX4)
802.3i — Ethernet (10BASE-T)
802.3x — Flow Control
802.1Qaz — Enhanced Transmission Selection
802.1Qbb — Priority-based Flow Control
ANSI/TIA-1057— LLDP-MED
SFF-8431 — SFP+ Direct Attach Cable (10GSFP+Cu)
MTU — 12,000 bytes
Standards Compliance | 285
www.dell.com | support.dell.com
286
RFC and I-D Compliance
The following standards are supported by FTOS on an Aggregator and are grouped by related protocol.
The columns showing support by platform indicate which version of FTOS first supports the standard.
General Internet Protocols
|
RFC#
Full Name
768
User Datagram Protocol
793
Transmission Control Protocol
854
Telnet Protocol Specification
959
File Transfer Protocol (FTP)
1321
The MD5 Message-Digest Algorithm
1350
The TFTP Protocol (Revision 2)
3164
The BSD syslog Protocol
draft-ietf-bfd-base-03
Bidirectional Forwarding Detection
Standards Compliance
General IPv4 Protocols
RFC#
Full Name
791
Internet Protocol
792
Internet Control Message Protocol
826
An Ethernet Address Resolution Protocol
1027
Using ARP to Implement Transparent Subnet Gateways
1042
A Standard for the Transmission of IP Datagrams over IEEE 802 Networks
1519
Classless Inter-Domain Routing (CIDR): an Address Assignment and Aggregation Strategy
1812
Requirements for IP Version 4 Routers
2131
Dynamic Host Configuration Protocol
3021
Using 31-Bit Prefixes on IPv4 Point-to-Point Links
Standards Compliance | 287
www.dell.com | support.dell.com
Network Management
288
|
RFC#
Full Name
1155
Structure and Identification of Management Information for TCP/IP-based Internets
1156
Management Information Base for Network Management of TCP/IP-based internets
1157
A Simple Network Management Protocol (SNMP)
1212
Concise MIB Definitions
1215
A Convention for Defining Traps for use with the SNMP
1493
Definitions of Managed Objects for Bridges [except for the dot1dTpLearnedEntryDiscards object]
1901
Introduction to Community-based SNMPv2
2011
SNMPv2 Management Information Base for the Internet Protocol using SMIv2
2012
SNMPv2 Management Information Base for the Transmission Control Protocol using SMIv2
2013
SNMPv2 Management Information Base for the User Datagram Protocol using SMIv2
2024
Definitions of Managed Objects for Data Link Switching using SMIv2
2570
Introduction and Applicability Statements for Internet Standard Management Framework
2571
An Architecture for Describing Simple Network Management Protocol (SNMP) Management
Frameworks
2572
Message Processing and Dispatching for the Simple Network Management Protocol (SNMP)
2574
User-based Security Model (USM) for version 3 of the Simple Network Management Protocol
(SNMPv3)
2575
View-based Access Control Model (VACM) for the Simple Network Management Protocol (SNMP)
2576
Coexistence Between Version 1, Version 2, and Version 3 of the Internet-standard Network
Management Framework
2578
Structure of Management Information Version 2 (SMIv2)
2579
Textual Conventions for SMIv2
2580
Conformance Statements for SMIv2
3416
Version 2 of the Protocol Operations for the Simple Network Management Protocol (SNMP)
3418
Management Information Base (MIB) for the Simple Network Management Protocol (SNMP)
ANSI/TIA-1057
The LLDP Management Information Base extension module for TIA-TR41.4 Media Endpoint
Discovery information
IEEE 802.1AB
Management Information Base module for LLDP configuration, statistics, local system data and
remote systems data components.
IEEE 802.1AB
The LLDP Management Information Base extension module for IEEE 802.1 organizationally defined
discovery information.
(LLDP DOT1 MIB and LLDP DOT3 MIB)
IEEE 802.1AB
The LLDP Management Information Base extension module for IEEE 802.3 organizationally defined
discovery information.
(LLDP DOT1 MIB and LLDP DOT3 MIB)
Standards Compliance
Network Management (continued)
RFC#
Full Name
ruzin-mstp-mib-02
(Traps)
Definitions of Managed Objects for Bridges with Multiple Spanning Tree Protocol
sFlow.org
sFlow Version 5
sFlow.org
sFlow Version 5 MIB
FORCE10-IF-EXT
ENSION-MIB
Force10 Enterprise IF Extension MIB (extends the Interfaces portion of the MIB-2 (RFC 1213) by
providing proprietary SNMP OIDs for other counters displayed in the “show interfaces” output)
FORCE10-LINKA
GG-MIB
Force10 Enterprise Link Aggregation MIB
FORCE10-COPY-C Force10 File Copy MIB (supporting SNMP SET operation)
ONFIG-MIB
FORCE10-MON-M Force10 Monitoring MIB
IB
FORCE10-PRODU Force10 Product Object Identifier MIB
CTS-MIB
FORCE10-SS-CHA Force10 S-Series Enterprise Chassis MIB
SSIS-MIB
FORCE10-SMI
Force10 Structure of Management Information
FORCE10-SYSTE
M-COMPONENTMIB
Force10 System Component MIB (enables the user to view CAM usage information)
FORCE10-TC-MIB Force10 Textual Convention
FORCE10-TRAP-A Force10 Trap Alarm MIB
LARM-MIB
FORCE10-FIPSNO Force10 FIP Snooping MIB (Based on T11-FCoE-MIB mentioned in FC-BB-5)
OPING-MIB
FORCE10-DCB-MI Force10 DCB MIB
B
IEEE 802.1Qaz
Management Information Base extension module for IEEE 802.1 organizationally defined discovery
information (LDP-EXT-DOT1-DCBX-MIB)
IEEE 802.1Qbb
Priority-based Flow Control module for managing IEEE 802.1Qbb
Standards Compliance | 289
www.dell.com | support.dell.com
MIB Location
290
|
Force10 MIBs are under the Force10 MIBs subhead on the Documentation page of iSupport:
https://www.force10networks.com/csportal20/KnowledgeBase/Documentation.aspx
You also can obtain a list of selected MIBs and their OIDs at the following URL:
https://www.force10networks.com/csportal20/MIBs/MIB_OIDs.aspx
Some pages of iSupport require a login. To request an iSupport account, go to:
https://www.force10networks.com/CSPortal20/Support/AccountRequest.aspx
If you have forgotten or lost your account information, contact Dell Networking TAC for assistance.
Standards Compliance