1
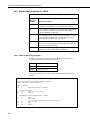
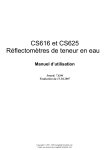
INSTRUCTION MANUAL CS616 and CS625 Water Content Reflectometers Revision: 2/14 C o p y r i g h t © 2 0 0 2 - 2 0 1 4 C a m p b e l l S c i e n t i f i c , I n c . Warranty “PRODUCTS MANUFACTURED BY CAMPBELL SCIENTIFIC, INC. are warranted by Campbell Scientific, Inc. (“Campbell”) to be free from defects in materials and workmanship under normal use and service for twelve (12) months from date of shipment unless otherwise specified in the corresponding Campbell pricelist or product manual. Products not manufactured, but that are re-sold by Campbell, are warranted only to the limits extended by the original manufacturer. Batteries, fine-wire thermocouples, desiccant, and other consumables have no warranty. Campbell's obligation under this warranty is limited to repairing or replacing (at Campbell's option) defective products, which shall be the sole and exclusive remedy under this warranty. The customer shall assume all costs of removing, reinstalling, and shipping defective products to Campbell. Campbell will return such products by surface carrier prepaid within the continental United States of America. To all other locations, Campbell will return such products best way CIP (Port of Entry) INCOTERM® 2010, prepaid. This warranty shall not apply to any products which have been subjected to modification, misuse, neglect, improper service, accidents of nature, or shipping damage. This warranty is in lieu of all other warranties, expressed or implied. The warranty for installation services performed by Campbell such as programming to customer specifications, electrical connections to products manufactured by Campbell, and product specific training, is part of Campbell’s product warranty. CAMPBELL EXPRESSLY DISCLAIMS AND EXCLUDES ANY IMPLIED WARRANTIES OF MERCHANTABILITY OR FITNESS FOR A PARTICULAR PURPOSE. Campbell is not liable for any special, indirect, incidental, and/or consequential damages.” Assistance Products may not be returned without prior authorization. The following contact information is for US and international customers residing in countries served by Campbell Scientific, Inc. directly. Affiliate companies handle repairs for customers within their territories. Please visit www.campbellsci.com to determine which Campbell Scientific company serves your country. To obtain a Returned Materials Authorization (RMA), contact CAMPBELL SCIENTIFIC, INC., phone (435) 227-9000. After an applications engineer determines the nature of the problem, an RMA number will be issued. Please write this number clearly on the outside of the shipping container. Campbell Scientific's shipping address is: CAMPBELL SCIENTIFIC, INC. RMA#_____ 815 West 1800 North Logan, Utah 84321-1784 For all returns, the customer must fill out a "Statement of Product Cleanliness and Decontamination" form and comply with the requirements specified in it. The form is available from our web site at www.campbellsci.com/repair. A completed form must be either emailed to [email protected] or faxed to (435) 227-9106. Campbell Scientific is unable to process any returns until we receive this form. If the form is not received within three days of product receipt or is incomplete, the product will be returned to the customer at the customer's expense. Campbell Scientific reserves the right to refuse service on products that were exposed to contaminants that may cause health or safety concerns for our employees. Table of Contents PDF viewers: These page numbers refer to the printed version of this document. Use the PDF reader bookmarks tab for links to specific sections. 1. Introduction ................................................................. 1 2. Cautionary Statements ............................................... 1 3. Initial Inspection ......................................................... 1 4. Overview ...................................................................... 1 5. Specifications ............................................................. 2 5.1 5.2 5.3 5.4 Dimensions........................................................................................... 3 Weight .................................................................................................. 3 Electrical Specifications ....................................................................... 3 Operational Details............................................................................... 4 6. Installation ................................................................... 4 6.1 6.2 6.3 6.4 Orientation ........................................................................................... 4 Potential Problems with Improper Insertion......................................... 4 Wiring .................................................................................................. 5 Datalogger Instructions and Programming........................................... 6 6.4.1 Measuring the CS616 Using CRBasic .......................................... 6 6.4.1.1 CS616 Sample CRBasic Program 1 ................................... 7 6.4.1.2 CS616 Sample CRBasic Program 2 ................................... 9 6.4.2 Measuring CS625 Output Using CR200(X) PeriodAvg Instruction................................................................................ 10 6.4.3 Sample Programs for CS625 ....................................................... 11 6.4.3.1 CS625 Sample Program 1 ................................................ 11 6.4.3.2 CS625 Sample Program 2 ................................................ 12 6.4.4 Measuring CS616 Using Edlog ................................................... 13 6.4.4.1 Using Edlog Instruction 138............................................. 13 6.4.4.2 Using Edlog Instruction 27 (Period Averaging) ............... 14 6.4.5 Sample Edlog Programs for CS616 ............................................ 16 6.4.5.1 CS616 Sample Edlog Program 1 ...................................... 16 6.4.5.2 CS616 Sample Edlog Program 2 ...................................... 17 6.4.5.3 CS616 Sample Edlog Program 3 ...................................... 18 6.4.5.4 CS616 Sample Edlog Program 4 ...................................... 19 6.4.5.5 CS616 Sample Edlog Program 5 ...................................... 21 7. The Water Content Reflectometer Method for Measuring Volumetric Water Content .................. 24 7.1 7.2 7.3 Description of Measurement Method ................................................. 24 Response Curves ................................................................................ 24 Calibration Equations ......................................................................... 27 i Table of Contents 7.4 Operating Range ................................................................................ 29 7.4.1 Soil Electrical Conductivity ....................................................... 29 7.4.2 Soil Organic Matter, Clay Content and Soil Bulk Density ......... 29 7.5 Error Sources in Water Content Reflectometer Measurement .......... 30 7.5.1 Probe-to-Probe Variability Error ................................................ 30 7.5.2 Insertion Error ............................................................................ 30 7.5.3 Signal Attenuation Error ............................................................ 30 7.6 Temperature Dependence and Correction ......................................... 31 8. Water Content Reflectometer User-Calibration ......32 8.1 8.2 8.3 8.4 8.5 Signal Attenuation in Conductive Soils and Need for Site-Specific Calibration ..................................................................................... 32 The User-Derived Calibration Equation ............................................ 33 Collecting Laboratory Data for Calibration ....................................... 34 Collecting Field Data for Calibration ................................................ 36 Calculations ....................................................................................... 38 9. Maintenance ..............................................................39 10. References .................................................................39 Appendix A. Discussion of Soil Water Content ......................... A-1 Figures 6-1. 6-2. 7-1. 7-2. 7-3. 7-4. CS616 Water Content Reflectometer .................................................. 5 CS625 Water Content Reflectometer .................................................. 5 CS616 and CS625 linear and quadratic calibrations derived from loam soil......................................................................................... 25 CS616 and CS625 response for low EC loam with bulk density 1.4 g cm-3, a low EC sandy clay loam with bulk density 1.6 g cm-3, and a high EC sandy clay loam with bulk density 1.6 g cm-3. ............................................................................................... 26 Difference in % volumetric water content between linear and quadratic forms of calibrations ...................................................... 28 Percent volumetric water content error corrected for by temperature correction equation..................................................... 32 Tables 6-1. 6-2. 6-3. 7-1. 7-2. CS616/625 wiring code. ......................................................................... 5 CS625 Sample Programs ...................................................................... 11 CS616 Sample Edlog Programs ............................................................ 16 Standard calibration coefficients for linear and quadratic forms. ......... 27 Calibration coefficients for sandy clay loam with bulk density 1.6 g cm-3 and electrical conductivity at saturation 0.4 dS m-1 for both linear and quadratic forms. ............................................................ 28 7-3. Calibration coefficients for sandy clay loam with bulk density 1.6 g cm-3 and electrical conductivity at saturation 0.75 dS m-1 for both linear and quadratic forms. .................................................... 28 ii CS616 and CS625 Water Content Reflectometers 1. Introduction The CS616 Water Content Reflectometer is an improved version of the CS615 Water Content Reflectometer. The CS625 is a modified CS616 for use with the Campbell Scientific CR200(X) series dataloggers. The difference between the CS616 and the CS625 is the output voltage level. Both water content reflectometers are designed to measure volumetric water content of soils or other porous media. The water content information is derived from the probe sensitivity to the dielectric constant of the medium surrounding the probe rods. Before installing the CS616 or CS625, please study • • 2. 3. 4. Section 2, Cautionary Statements Section 3, Initial Inspection Cautionary Statements • Although the CS616/CS625 is rugged, it should be handled as precision scientific instrument. • External RF sources can affect CS616/CS625 measurements. Consequently, the CS616/CS625 circuitry should be located away from significant sources of RF such as ac power lines and motors. • CS616/CS625 probes enabled simultaneously and within approximately 9 inches of each other can cause erratic measurements. If probes must be close to each other, configure the enable lines to the datalogger control ports so that the probes are not enabled simultaneously. Initial Inspection • Upon receipt of the CS616/CS625, inspect the packaging and contents for damage. File damage claims with the shipping company. • The model number and cable length are printed on a label at the connection end of the cable. Check this information against the shipping documents to ensure the expected product and cable length are received. Overview The CS616 output is a square wave output and can be connected to our CR800, CR850, CR1000, CR3000, CR5000, CR510, CR10X, and CR23X dataloggers. A special CS616 datalogger instruction is used to measure the probe output period which is converted to volumetric water content using calibration equations. Datalogger instructions for period averaging can also be used. 1 CS616 and CS625 Water Content Reflectometers The CS625 output is a square wave output and can be connected to Campbell Scientific CR200(X) series dataloggers. A CRBasic program using Period Averaging is used to measure the probe output period and convert to volumetric water content using calibration equations. The water content reflectometer consists of two stainless steel rods connected to a printed circuit board. A shielded four-conductor cable is connected to the circuit board to supply power, enable the probe, and monitor the pulse output. The circuit board is encapsulated in epoxy. High-speed electronic components on the circuit board are configured as a bistable multivibrator. The output of the multivibrator is connected to the probe rods which act as a wave guide. The travel time of the signal on the probe rods depends on the dielectric permittivity of the material surrounding the rods and the dielectric permittivity depends on the water content. Therefore, the oscillation frequency of the multivibrator is dependent on the water content of the media being measured. Digital circuitry scales the multivibrator output to an appropriate frequency for measurement with a datalogger. The water content reflectometer output is essentially a square wave. The probe output period ranges from about 14 microseconds with rods in air to about 42 microseconds with the rods completely immersed in typical tap water. A calibration equation converts period to volumetric water content. The CS616/CS625's cable can terminate in: • • 5. Pigtails that connect directly to a Campbell Scientific datalogger (option –PT). Connector that attaches to a prewired enclosure (option –PW). Refer to www.campbellsci.com/prewired-enclosures for more information. Specifications Features: • High accuracy and high precision • Fast response time • Designed for long-term unattended water content monitoring • Probe rods can be inserted from the surface or buried at any orientation to the surface CS616 Compatibility Dataloggers: 2 CR800 series CR1000 CR3000 CR5000 CR510 CR10X CR23X CS616 and CS625 Water Content Reflectometers CS625 Compatibility Dataloggers: CR200X series CR200 series Probe-to-Probe Variability: ±0.5% VWC in dry soil, ±1.5% VWC in typical saturated soil 5.1 5.2 5.3 Resolution: better than 0.1% volumetric water content Water Content Accuracy: ±2.5% VWC using standard calibration with bulk electrical conductivity ≤0.5 deciSiemen meter-1 (dS m-1) and bulk density ≤1.55 g cm-3 in measurement range 0% VWC to 50% VWC Precision: better than 0.1% volumetric water content Dimensions Rods: 300 mm (11.8 in) long, 3.2 mm (0.13 in) diameter, 32 mm (1.3 in) spacing Probe Head: 85 x 63 x 18 mm (3.3 x 2.5 x 0.7 in) Probe (without cable): 280 g (9.9 oz) Cable: 35 g m–1 (0.38 oz per ft) Weight Electrical Specifications Output CS616: CS625: Power: ±0.7 volt square wave with frequency dependent on water content 0 to 3.3 volt square wave with frequency dependent on water content 65 mA @ 12 Vdc when enabled, 45 µA quiescent Power Supply Requirements: 5 Vdc minimum, 18 Vdc maximum Enable Voltage: 4 Vdc minimum, 18 Vdc maximum Maximum Cable Length: 305 m (1000 ft) Electromagnetic Compatibility: The CS616/CS625 is Œ compliant with performance criteria available upon request. RF emissions are below EN55022 limits if the CS616/CS625 is enabled less than 0.6 ms and measurements are made at a 1 Hz (1 per second) or slower frequency. The CS616/CS625 meets EN61326 requirements for protection against electrostatic discharge and surge. 3 CS616 and CS625 Water Content Reflectometers 5.4 Operational Details The accuracy specification for the volumetric water content measurement using the CS616/CS625 probes is based on laboratory measurements in a variety of soils and over the water content range air dry to saturated. The soils were typically sandy loam and coarser. Silt and clay were present in some of the soils used to characterize accuracy. Resolution is the minimum change in the dielectric permittivity that can reliably be detected by the water content reflectometer. The CS616 or CS625 is typically used to measure soil volumetric water content. Precision describes the repeatability of a measurement. It is determined for the CS616 and CS625 by taking repeated measurements in the same material. The precision of the CS616/CS625 is better than 0.1 % volumetric water content. Soil Properties The water content reflectometer operation can be affected when the signal applied to the probe rods is attenuated. The probe will provide a well-behaved response to changing water content, even in attenuating soils or other media, but the response may be different than described by the standard calibration. Consequently, a unique calibration is required. Change in probe response can occur when soil bulk electrical conductivity is greater than 0.5 dS m-1. The major contributor to soil electrical conductivity is the presence of free ions in solution from dissolution of soil salts. Soil organic matter and some clays can also attenuate the signal. 6. Installation 6.1 Orientation The probe rods can be inserted vertically into the soil surface or buried at any orientation to the surface. A probe inserted vertically into a soil surface will give an indication of the water content in the upper 30 cm of soil. The probe can be installed horizontal to the surface to detect the passing of wetting fronts or other vertical water fluxes. A probe installed at an angle of 30 degrees with the surface will give an indication of the water content of the upper 15 cm of soil. 6.2 Potential Problems with Improper Insertion The method used for probe installation can affect the accuracy of the measurement. The probe rods should be kept as close to parallel as possible when installed to maintain the design wave guide geometry. The sensitivity of this measurement is greater in the regions closest to the rod surface than at distances away from the surface. Probes inserted in a manner which generates air voids around the rods will reduce the measurement accuracy. In most soils, the soil structure will recover from the disturbance during probe insertion. In some applications, installation can be improved by using the CS650G insertion guide tool. The CS650G is inserted into the soil and then removed. This makes proper installation of the water content reflectometer easier in dense or rocky soils. 4 CS616 and CS625 Water Content Reflectometers 6.3 Wiring TABLE 6-1. CS616/625 wiring code. NOTE color function datalogger connection red +12 V +12 V green output SE analog channel orange enable control port black signal ground G clear shield (power ground) G Both the black ground wire and the clear shield wire must be connected to datalogger ground. power Red output gnd Black output Green enable Orange drain/power gnd Clear FIGURE 6-1. CS616 Water Content Reflectometer power Red gnd Black output Green enable Orange drain/gnd Clear FIGURE 6-2. CS625 Water Content Reflectometer 5 CS616 and CS625 Water Content Reflectometers 6.4 Datalogger Instructions and Programming NOTE This section is for users who write their own programs. A datalogger program can be generated using Short Cut software. You do not need to read this section if using Short Cut. The output of the CS616 is a square wave with amplitude of ±0.7 Vdc and a frequency that is dependent on the dielectric constant of the material surrounding the probe rods. The CRBasic instruction CS616() is used by the CR800, CR850, CR1000, CR3000, and CR5000 dataloggers to measure the CS616 output period. Edlog Instruction 138 is specifically designed for the CR510, CR10X, and CR23X to measure the output period of the CS616. The period value is used in the calibration for water content. The period in air is approximately 14.7 microseconds, and the period in saturated soil with porosity 0.4 is approximately 31 microseconds. Edlog Instruction 27, Period Average, can also be used to measure CS616 output period. The output of the CS625 is a square wave with amplitude of 0 to 3.3 Vdc and a frequency that is dependent on the dielectric constant of the material surrounding the probe rods. The CRBasic instruction PeriodAvg() is used by the CR200(X) series dataloggers to measure the CS625 output period. The period value is used in the calibration for water content. The period in air is approximately 14.7 microseconds, and the period in saturated soil with porosity 0.4 is approximately 31 microseconds. 6.4.1 Measuring the CS616 Using CRBasic The CRBasic instruction CS616() is used by the CR800, CR850, CR1000 CR3000, and CR5000 dataloggers to measure the CS616 output period (in microseconds). The CS616() instruction is used to enable and measure a CS616 Water Content Reflectometer. CS616(Dest, Reps, SEChan, Port, MeasPerPort, Mult, Offset) Dest: The Dest parameter is the variable or variable array in which to store the results of the measurement. Dest must be dimensioned to at least the number of Reps. Reps: The Reps parameter is the number of measurements that should be made using this instruction. If Reps is greater than 1, Dest must be an array dimensioned to the size of Reps. SEChan: The SEChan parameter is the number of the single-ended channel on which to make the first measurement. If the Reps parameter is greater than 1, the additional measurements will be made on sequential channels. Port: The Port parameter is the control port that will be used to enable the CS616 sensor. 6 CS616 and CS625 Water Content Reflectometers Code 1 2 3 4 5 6 7 8 Description Control Port 1 Control Port 2 Control Port 3 Control Port 4 Control Port 5 Control Port 6 Control Port 7 Control Port 8 MeasPerPort: The MeasPerPort parameter is the number of control ports to be used to control the CS616 sensor(s). If Reps is set to 4, MeasPerPort = 4 will result in the same port being used for all measurements. MeasPerPort = 1 will result in four sequential ports being used for the measurements. MeasPerPort = 2 will result in one port being used for the first two measurements, and the next port being used for the next two measurements. Mult, Offset: The Mult and Offset parameters are each a constant, variable, array, or expression by which to scale the results of the measurement. 6.4.1.1 CS616 Sample CRBasic Program 1 The following CR1000 program uses the CS616() instruction to measure eight CS616 probes connected to the CR1000 datalogger. Although this example is for the CR1000, other CRBasic dataloggers are programmed similarly. Wiring for CRBasic Program Example 1 CS616 CR1000 CS616#1_Green 5H CS616#2_Green 5L CS616#3_Green 6H CS616#4_Green 6L #1,2,3,4_Orange C7 #1,2,3,4_Blk & Clear GND #1,2,3,4_Red 12 V CS616#5_Green 7H CS616#6_Green 7L CS616#7_Green 8H CS616#8_Green 8L #5,6,7,8_Orange C8 #5,6,7,8_Blk & Clear GND #5,6,7,8_Red 12 V Note: All CS616 “12V_Red” wires connected to CR1000 12 V terminal (user supplied common tie post may be required). 7 CS616 and CS625 Water Content Reflectometers CR1000 Program Example 1 'Declare Public and Dim Variables Public batt_volt Public Panel_temp Public Period (8) Public VWC (8) Public Flag (1) Dim I 'Declare Constants 'CS616 Default Calibration Constants const a0= -0.0663 const a1= -0.0063 const a2= 0.0007 'Flag logic constants const high = true const low = false 'Define Data Tables DataTable (Dat30min,1,-1) DataInterval (0,30,Min,10) Minimum (1,batt_volt,IEEE4,0,False) Average (1,Panel_temp,IEEE4,0) Sample (8,Period(),FP2) Sample (8,VWC(),FP2) EndTable 'Main Program BeginProg Scan (5,Sec,0,0) 'scan instructions every 5 sec Battery (Batt_volt) PanelTemp (Panel_temp,250) ' 'Set flag 1 High every 30 min (Note: User can manually set flag 1 high/low) If IfTime (0,30,min) Then flag (1) = high '+++++++++++++++++++++++++++ If Flag (1) = high Then 'measure 8ea CS616 probes on CR1000 CS616 (Period(1),4,9,7,4,1.0,0) 'measure 4ea CS616 probes, enable w/ C7 CS616 (Period(5),4,13,8,4,1.0,0) 'measure 4ea CS616 probes, enable w/ C8 ' For I=1 to 8 'convert CS616 period to Volumetric Water Content VWC(I)=a0 + al*Period(I) + a2*Period(I)^2 Next ' flag(1)= low 'set Flag 1 = Low ' EndIf '+++++++++++++++++++++++++++++++ ' CallTable Dat30min 'Call Output Tables NextScan EndProg 8 CS616 and CS625 Water Content Reflectometers 6.4.1.2 CS616 Sample CRBasic Program 2 The following CR1000 program uses the AM16/32-series multiplexer to measure 48 CS616 probes connected in the 4x16 configuration. The program also measures datalogger battery voltage and temperature. Wiring for CRBasic Program Example 2 CR1000 AM16/32-series (4x16) CS616* Control/Common Sensor Terminals C4 RES Odd H CS616#1_Green C5 CLK Odd L CS616#2_Green 12 V 12 V Gnd #1,2,3_Blk & Clear Gnd Gnd Even H CS616#3_Green 1H COM Odd H Even L #1,2,3_Orange 1L COM Odd L Gnd Gnd 2H COM Even H C6 COM Even L *Three sensors to each set of AM16/32 terminals. CR1000 Program Example 2 'Declare Public and Dim Variables Public batt_volt Public Panel_temp Public Period (48) Public VWC (48) Public Flag (1) Dim I 'Declare Constants 'CS616 Default Calibration Constants const a0= -0.0663 const a1= -0.0063 const a2= 0.0007 'Flag logic constants const high = true const low = false 'Define Data Tables DataTable (Dat30min,1,-1) DataInterval (0,30,Min,10) Minimum (1,batt_volt,FP2,0,False) Average (1,Panel_temp,FP2,0) Sample (48,Period(),FP2) Sample (48,VWC(),FP2) EndTable 9 CS616 and CS625 Water Content Reflectometers 'Main Program BeginProg Scan (5,Sec,0,0) 'scan instructions every 5 sec Battery (Batt_volt) PanelTemp (Panel_temp,250) ' 'Set flag 1 High every 30 min (Note: User can manually set flag 1 high/low) If IfTime (0,30,min) Then flag (1) = high '+++++++++++++++++++++++++++ If Flag (1) = high Then 'measure 48ea CS616 probes on AM16/32 in (4x16) mode PortSet (4,1) 'Set Mux Reset line High ' I=1 'Set sub scan loop counter SubScan (0,mSec,16) PulsePort (5,10000) 'Clock Mux CS616 (Period(I),3,1,6,3,1.0,0) 'Measure 3ea CS616 probes I=I+3 NextSubScan ' For I=1 to 48 'convert CS616 period to Volumetric Water Content VWC(I)=a0 + al*Period(I) + a2*Period(I)^2 Next ' PortSet (4,0) 'Set Mux Reset line Low flag (1) = low ' EndIf '+++++++++++++++++++++++++++++++ ' CallTable Dat30min 'Call Output Tables NextScan EndProg 6.4.2 Measuring CS625 Output Using CR200(X) PeriodAvg Instruction The PeriodAvg() instruction is used to measure the period (in microseconds) or the frequency (in kHz) of a signal on a single-ended channel. This instruction can be used to measure the CS625 Water Content Reflectometer. PeriodAvg(Dest, SEChan, Option, Cycles, Timeout, Port, Mult, Offset) Dest: The Dest parameter is a variable in which to store the results of the measurement. SEChan: The SEChan argument is the number of the single-ended channel on which to make the measurement. Valid options are analog channels 1 through 4. The green wire is connected to this channel number. Option: The Option parameter specifies whether to output the frequency or the period of the signal. Code Description 0 1 Period of the signal is returned (msec) Frequency of the signal is returned (Hz) Code 0 is typically used with the CS625 with a multiplier (see below) of 1. Cycles: The Cycles parameter specifies the number of cycles to average each scan. 10 CS616 and CS625 Water Content Reflectometers Timeout: The Timeout parameter is the maximum time duration, in milliseconds, that the datalogger will wait for the number of Cycles to be measured for the average calculation. An overrange value will be stored if the Timeout period is exceeded. A value of 1 is recommended if 10 is used for cycles parameter. Port: The Port parameter is the control port or analog channel that will be used to switch power to the CS625 Water Content Reflectometer. Valid options are: Code Description 0 C1 C2 3 4 5 P_SW None Control Port 1 Control Port 2 Analog Channel 3 Analog Channel 4 Analog Channel 5 Analog Channel 6/P_SW Mult, Offset: The Mult and Offset parameters are each a constant, variable, array, or expression by which to scale the results of the raw measurement. A multiplier value of 1 is recommended. 6.4.3 Sample Programs for CS625 TABLE 6-2. CS625 Sample Programs Sample Program Number Program Description 1 Measure volumetric water content with 4 CS625 hourly. Store average hourly readings to final storage every 4 hours. 2 Measure temperature with 109 probe and use the 109 temperature to correct the period for 1 CS625. Use standard calibration equation to convert temperature-corrected period to volumetric water content. Sensors are read hourly and average water content and temperature are written to storage every 4 hours. 6.4.3.1 CS625 Sample Program 1 Hourly measure temperature with 109 probe and volumetric water content with 4 CS625. Store average hourly readings to final storage every 4 hours. CS625 leads CR200(X) greens Single-Ended Channel 1 thru 4 (SE1-4) blacks associated grounds for SE1-4 oranges Control Port 1 (C1) reds SW Battery clears G 11 CS616 and CS625 Water Content Reflectometers 'CR200(X) program to read 4 CS625s 'Standard calibration is used to convert CS625 output 'period to volumetric water content. 'Sensors are read hourly and average water content are written to storage every 4 hours. 'Declare Variables Public period(4),vwc(4) Dim i 'Declare Constants Const a0=-0.0663 Const a1=-0.0063 Const a2=0.0007 'Define Data Tables DataTable (ofile,1,10) DataInterval (0,4,hr) Average (4,vwc,0) EndTable 'Main Program BeginProg Scan (1,hr) SWBatt (1) PeriodAvg (period(1),1,0,10,10,C1,1,0) PeriodAvg (period(2),2,0,10,10,C1,1,0) PeriodAvg (period(3),3,0,10,10,C1,1,0) PeriodAvg (period(4),4,0,10,10,C1,1,0) For i=1 To 4 vwc(i) = a0 + a1*period(i) + a2*period(i)^2 Next i CallTable ofile NextScan EndProg 6.4.3.2 CS625 Sample Program 2 Measure temperature with 109 probe and use the 109 temperature to correct the period for 1 CS625. Use standard calibration equation to convert temperaturecorrected period to volumetric water content. Sensors are read hourly and average water content and temperature are written to storage every 4 hours. 12 CS625 leads CR200(X) green Single-Ended Channel 1 (SE1) black ground for SE1 orange Control Port 1 (C1) red SW Battery clear G 109 leads CR200(X) black Switched excitation channel 1 (EX1) red Single-Ended Channel 5 (SE5) purple G clear G CS616 and CS625 Water Content Reflectometers 'CR200(X) program to read 1 109 temperature probe and 1 CS625. 'Use temperature to correct CS625 period. 'Standard calibration is used to convert CS625 output 'period to volumetric water content. 'Sensors are read hourly and average water content and 'temperature are written to storage every 4 hours. 'Declare Variables Public Tsoil Public uncorrected,corrected Public vwc 'Declare Constants 'Water content calibration constants Const a0=-0.0663 Const a1=-0.0063 Const a2=0.0007 'Temperature correction constants Const t0=0.526 Const t1=-0.052 Const t2=0.00136 'Reference temperature Const Tref=20 'Define Data Tables DataTable (ofile,1,10) DataInterval (0,4,hr) Average(1,Tsoil,0) Average (1,vwc,0) EndTable 'Main Program BeginProg Scan (1,hr) Therm109 (Tsoil,1,5,Ex1,1.0,0) SWBatt (1) PeriodAvg (uncorrected,1,0,10,10,C1,1,0) SWBatt (0) corrected=uncorrected+(Tref-Tsoil)*(t0+t1*uncorrected+t2*uncorrected^2) vwc = a0 + a1*corrected + a2*corrected^2 CallTable ofile NextScan EndProg 6.4.4 Measuring CS616 Using Edlog 6.4.4.1 Using Edlog Instruction 138 See Section 6.4.5.1, CS616 Sample Edlog Program 1, for example on using Instruction 138. 1: CS616 Water Content Reflectometer (P138) 1: 1 Reps 2: 00 SE Channel 3: 00 Control Port Code 4: 0000 Loc [ _________ ] 5: 1.0 Mult 6: 0.0 Offset Reps: Enter the number of CS616s that will be measured with the instruction. The sensors must be wired in consecutive channels. Each measurement uses the same multiplier and offset. The option chosen in parameter 3 will determine whether subsequent repetitions are enabled with the next higher control port or with the same control port. 13 CS616 and CS625 Water Content Reflectometers SE Chan: Enter the single-ended analog channel where the sensor’s green wire is connected. When Reps is greater than 1, this entry is the channel for the first CS616. Port: Enter an integer to specify the control port that will be used to enable the CS616 sensor. For the CR510, only C1 can be used to enable a CS616. Code Control Port Option X X specifies the first control port that will be used. Subsequent repetitions will be enabled with the next sequential control port. Control port 1 follows control port 8 in a sequence. 1X All repetitions will be enabled with a single specified control port. Simultaneously enabling several CS616s can result in exceeding power supply capacity. Loc: Enter the input location that will store the period measurement. The period output is in microseconds. An Input Location is a place in the datalogger's memory where a measurement is temporarily stored until it is used in intermediate storage, output, or overwritten. An input location is reserved for each measurement in the datalogger program. Additional locations can be created by the user. Mult: A factor that the input location value is multiplied by. Enter a 1 for probe output period in microseconds. A multiplier is often used for calibration or to convert the input location value to different units. Offset: A constant that is added to the input location value. An offset of 0 has no effect on the input location value. An offset is often used for calibration or to convert the data to different units. With a multiplier of 1 and an offset of 0, P138 returns the period in microseconds. 6.4.4.2 Using Edlog Instruction 27 (Period Averaging) See Section 6.4.5.2, CS616 Sample Edlog Program 2, for example on using Instruction 27. 1: Period Average (SE) (P27) 1: 1 Reps 2: 00 Range Option 3: 00 SE Channel 4: 0000 No. of Cycles 5: 0000 Timeout (units = 0.01 seconds) 6: 0000 Loc [ _________ ] 7: 1.0 Mult 8: 0.0 Offset 14 CS616 and CS625 Water Content Reflectometers Reps: Enter the number of CS616s that will be measured with the instruction. The sensors must be wired in consecutive channels. Each measurement uses the same multiplier and offset. Range Option: Enter 2-digit integer to choose output as period in microseconds and range. Suggested value for CS616 is 04. Code x1 x2 x3 x4 Max. Freq. 8 kHz @ 2 mV peak-to-peak 20 kHz @ 3 mV peak-to-peak 50 kHz @ 12 mV peak-to-peak 200 kHz @ 2 V peak-to-peak Where: x = 0 Output period in microseconds x = 1 Output frequency in kHz SE Chan: Enter the single-ended analog channel where the sensor green wire is connected. When Reps are greater than 1, this entry is the channel for the first CS616. No. of Cycles: Enter the number of cycles of the input signal the instruction uses to determine period. A value of 100 is recommended. Timeout: Enter the maximum amount of time for the no. of cycles to occur. A value of 1 (10 millisecond) is recommended. Loc: Enter the input location that will store the period measurement. The period output is in microseconds. An Input Location is a place in the datalogger's memory where a measurement is temporarily stored until it is used in intermediate storage, output, or overwritten. An input location is reserved for each measurement in the datalogger program. Additional locations can be created by the user. Mult: A factor that the input location value is multiplied by. A multiplier is often used for calibration or to convert the input location value to different units. Offset: A constant that is added to the input location value. An offset of 0 has no effect on the input location value. An offset is often used for calibration or to convert the data to different units. With a multiplier of 1 and an offset of 0, P27 returns the period in microseconds or frequency in kHz as selected by parameter 2. 15 CS616 and CS625 Water Content Reflectometers 6.4.5 Sample Edlog Programs for CS616 TABLE 6-3. CS616 Sample Edlog Programs Sample Program Number Program Description 1 Set Flag 1 to read output of one CS616 using CR10X instruction 138 and convert output period to volumetric water content 2 Every 5 minutes, measure CS616 output period using instruction 27 and convert to volumetric water content. Write hourly average to datalogger final storage. 3 Read datalogger battery voltage and 3 CS616s hourly. Convert CS616 period to volumetric water content. Write average of hourly readings to final storage every 4 hours. 4 Measure soil temperature and CS616 output period every 4 hours. Correct CS616 output period for temperature and write result to datalogger final storage. 5 Hourly, measure datalogger battery voltage, internal temperature and 48 CS616 probes using AM16/32 multiplexer. 6.4.5.1 CS616 Sample Edlog Program 1 Set Flag 1 to read output of one CS616 using CR10X instruction 138 and convert output period to volumetric water content CS616 CR10X green Single-Ended Channel 1 (SE1) orange Control Port 1 (C1) The red lead is connected to 12 Vdc and the black and shield are connected to ground. ;{CR10X} ; ;Set Flag 1 high for single water content reading. ;Result stored in input storage only ; *Table 1 Program 01: 1 Execution Interval (seconds) 1: If Flag/Port (P91) 1: 11 Do if Flag 1 is High 2: 30 Then Do 2: CS616 Water Content Reflectometer (P138) 1: 1 Reps 2: 1 SE Channel 3: 1 C1 is first of sequential Control Ports used 4: 1 Loc [ period ] 5: 1.0 Mult 6: 0.0 Offset 16 CS616 and CS625 Water Content Reflectometers 3: Polynomial (P55) 1: 1 Reps 2: 1 X Loc [ period 3: 2 F(X) Loc [ VWC 4: -0.0663 C0 5: -0.0063 C1 6: 0.0007 C2 7: 0.0 C3 8: 0.0 C4 9: 0.0 C5 4: Do (P86) 1: 21 5: ] ] Set Flag 1 Low End (P95) *Table 2 Program 02: 0.0000 Execution Interval (seconds) *Table 3 Subroutines End Program -Input Locations1 period 1 0 1 2 VWC 1 0 1 6.4.5.2 CS616 Sample Edlog Program 2 Every 5 minutes, measure CS616 output period using instruction 27 and convert to volumetric water content. Write hourly average to datalogger final storage. CS616 CR10X green Single-Ended Channel 1 (SE1) orange Control Port 1 (C1) The red lead is connected to 12 Vdc and the black and shield are connected to ground. ;{CR10X} ; *Table 1 Program 01: 300 Execution Interval (seconds) 1: Do (P86) 1: 41 ;Enable/Turn On the CS616 probe. Set Port 1 High 2: Period Average (SE) (P27) 1: 1 Reps 2: 4 200 kHz Max Freq @ 2 V Peak to Peak, Period Output 3: 1 SE Channel 4: 100 No. of Cycles 5: 1 Timeout (0.01 sec units) 6: 1 Loc [ period ] 7: 1.0 Mult 8: 0.0 Offset 17 CS616 and CS625 Water Content Reflectometers 3: Polynomial (P55) 1: 1 Reps 2: 1 X Loc [ period 3: 2 F(X) Loc [ vwc 4: -0.0663 C0 5: -0.0063 C1 6: 0.0007 C2 7: 0.0 C3 8: 0.0 C4 9: 0.0 C5 4: Do (P86) 1: 51 5: If 1: 2: 3: ] ] ;Turn Off CS616 probe Set Port 1 Low time is (P92) ;Turn On Data Storage every hour 0 Minutes (Seconds --) into a 60 Interval (same units as above) 10 Set Output Flag High (Flag 0) 6: Real Time (P77) ;Store a time stamp. 1: 1220 Year,Day,Hour/Minute (midnight = 2400) 7: Average (P71) ;Store the average VWC. 1: 1 Reps 2: 2 Loc [ vwc ] *Table 2 Program 02: 0.0000 Execution Interval (seconds) *Table 3 Subroutines End Program -Input Locations1 period 1 1 1 2 vwc 1 1 1 6.4.5.3 CS616 Sample Edlog Program 3 Read datalogger battery voltage and 3 CS616s hourly. CS616 enable wires are connected to sequential datalogger control ports for automatic incrementing. Convert CS616 period to volumetric water content. Write average of hourly readings to final storage every 4 hours. CS616x CR10X green Single-Ended Channel x (SEx) orange Control Port y (Cy) x = 1,2,3 for 3 CS616 outputs y = 6,7,8 for 3 CS616s enables The red leads are connected to 12Vdc and the blacks and shields are connected to ground. 18 CS616 and CS625 Water Content Reflectometers ;{CR10X} ; *Table 1 Program 01: 3600 Execution Interval (seconds) 1: Batt Voltage (P10) 1: 7 Loc [ batt ] 2: CS616 Water Content Reflectometer (P138) 1: 3 Reps 2: 1 SE Channel 3: 6 C6 is first of sequential Control Ports used 4: 1 Loc [ period_1 ] 5: 1.0 Mult 6: 0.0 Offset 3: Polynomial (P55) 1: 3 Reps 2: 1 X Loc [ period_1 3: 4 F(X) Loc [ vwc_1 4: -0.0663 C0 5: -0.0063 C1 6: 0.0007 C2 7: 0.0 C3 8: 0.0 C4 9: 0.0 C5 ; 4: If 1: 2: 3: ] ] time is (P92) 0000 Minutes (Seconds --) into a 240 Interval (same units as above) 10 Set Output Flag High (Flag 0) 5: Average (P71) 1: 4 Reps 2: 4 Loc [ vwc_1 ] *Table 2 Program 02: 0.0000 Execution Interval (seconds) *Table 3 Subroutines End Program -Input Locations1 period_1 5 1 1 2 period_2 9 1 1 3 period_3 17 1 1 4 vwc_1 5 1 1 5 vwc_2 9 1 1 6 vwc_3 17 1 1 7 batt 1 0 1 6.4.5.4 CS616 Sample Edlog Program 4 Measure soil temperature with 107 probe and CS616 output period every four hours. Correct CS616 output period for temperature and write result to datalogger final storage. 19 CS616 and CS625 Water Content Reflectometers Sensor lead CR10X CS616 green Single-Ended Channel 2 (SE2) CS616 orange Control Port 4 (C4) 107 red Single-Ended Channel 1 (SE1) 107 black Excitation 1 (E1) 107 purple Analog Ground (AG) 107 clear Ground (G) The CS616 red leads are connected to 12 Vdc and the blacks and shields are connected to ground. ;{CR10X} ; *Table 1 Program 01: 60 Execution Interval (seconds) ;set reference temperature for temperature correction 1: Z=F x 10^n (P30) 1: 20 F 2: 0 n, Exponent of 10 3: 2 Z Loc [ Tref ] 2: If 1: 2: 3: time is (P92) 0000 Minutes (Seconds --) into a 240 Interval (same units as above) 30 Then Do 3: Temp (107) (P11) 1: 1 Reps 2: 1 SE Channel 3: 1 Excite all reps w/E1 4: 1 Loc [ TSoil ] 5: 1.0 Mult 6: 0.0 Offset ;Measure soil temperature. 4: CS616 Water Content Reflectometer (P138) 1: 1 Reps 2: 2 SE Channel 3: 4 C4 is first of sequential Control Ports used 4: 3 Loc [ CS616 ] 5: 1.0 Mult 6: 0.0 Offset ;The following four instructions correct CS616 period for soil temperature ;The corrected period is stored as variable NewCS616. 5: Polynomial (P55) 1: 1 Reps 2: 3 X Loc [ CS616 ] 3: 4 F(X) Loc [ TempCS616 ] 4: 0.526 C0 5: -0.052 C1 6: 0.00136 C2 7: 0.0 C3 8: 0.0 C4 9: 0.0 C5 6: Z=X-Y (P35) 1: 2 2: 1 3: 5 20 X Loc [ Tref Y Loc [ TSoil Z Loc [ TFactor ] ] ] CS616 and CS625 Water Content Reflectometers 7: Z=X*Y (P36) 1: 5 2: 4 3: 4 X Loc [ TFactor ] Y Loc [ TempCS616 ] Z Loc [ TempCS616 ] 8: Z=X+Y (P33) 1: 3 2: 4 3: 6 X Loc [ CS616 ] Y Loc [ TempCS616 ] Z Loc [ NewCS616 ] 9: Polynomial (P55) ;Convert corrected probe period to water content. 1: 1 Reps 2: 6 X Loc [ NewCS616 ] 3: 7 F(X) Loc [ WaterCont ] 4: -0.0663 C0 5: -0.0063 C1 6: 0.0007 C2 7: 0.0 C3 8: 0.0 C4 9: 0.0 C5 10: Do (P86) 1: 10 Set Output Flag High (Flag 0) 11: Real Time (P77) ;Record time of measurement. 1: 0220 Day,Hour/Minute (midnight = 2400) 12: Sample (P70) storage. 1: 1 Reps 2: 7 Loc [ WaterCont ] 13: ;Write water content to datalogger final End (P95) *Table 2 Program 02: 0.0000 Execution Interval (seconds) *Table 3 Subroutines End Program -Input Locations1 TSoil 1 1 1 2 Tref 1 1 1 3 CS616 1 2 1 4 TempCS616 1 2 2 5 TFactor 1 1 1 6 NewCS616 1 1 1 7 WaterCont 1 1 1 6.4.5.5 CS616 Sample Edlog Program 5 Hourly, measure datalogger battery voltage, internal temperature and 48 CS616 probes. The AM16/32-series multiplexer slide switch on the top panel is set to 4X16. Can execute measurement sequence manually by setting Flag 1 high. 21 CS616 and CS625 Water Content Reflectometers Sensor lead AM16/32 CS616-1 green 1H CS616-2 green 1L CS616-3 green 2H CS616-1,2,3 orange 2L CS616-4 green 3H CS616-5 green 3L CS616-6 green 4H CS616-4,5,6 orange 4L ... … CS616-46 green 31H CS616-47 green 31L CS616-48 green 32H CS616-46,47,48 32L CR10X RES C1 CLK C2 COM ODD H SE1 COM ODD L SE2 COM EVEN H SE3 COM EVEN L C3 ;{CR10X} ; *Table 1 Program 01: 60 Execution Interval (seconds) 1: Batt Voltage (P10) ;Measure battery voltage 1: 1 Loc [ Bat_Volt ] 2: Internal Temperature (P17) 1: 2 Loc [ DL_Temp 3: If 1: 2: 3: ;Measure datalogger internal temperature ] time is (P92) ;Every 60 Minutes Start Multiplexer Measurement Loop 0 Minutes (Seconds --) into a 60 Interval (same units as above) 11 Set Flag 1 High 4: If Flag/Port (P91) ;User can start Measurement Loop by setting Flag 1 High 1: 11 Do if Flag 1 is High 2: 30 Then Do 5: Do (P86) 1: 41 ;Set control port 1 high (i.e. Reset Multiplexer) Set Port 1 High 6: Beginning of Loop (P87) 1: 0 Delay 2: 16 Loop Count 22 ;16 loops X 3ea CS616 measured/loop CS616 and CS625 Water Content Reflectometers 7: Step Loop Index (P90) 1: 3 Step 8: Do (P86) 1: 72 Pulse Port 2 ;Increment input locations by 3/loop pass ;Pulse control port 2 (i.e. Multiplier Clock) 9: CS616 Water Content Reflectometer (P138) ;Measure Period on 3ea CS616 1: 3 Reps 2: 1 SE Channel 3: 13 All reps use C3 4: 3 -- Loc [ Period_1 ] 5: 1.0 Mult 6: 0.0 Offset ;Note: Input "Loc" must be indexed "--" in a loop! How? Use the "F4" Key. 10: End (P95) 11: Do (P86) 1: 21 12: ;end of loop ;Set user flag 1 low Set Flag 1 Low End (P95) 13: Do (P86) 1: 51 ;Do Loop End instruction ;Set control port 1 "low" (i.e. Multiplexer Reset) Set Port 1 Low 14: Polynomial (P55) ;Convert 48ea Period measurements into water content 1: 48 Reps 2: 3 X Loc [ Period_1 ] 3: 52 F(X) Loc [ VWC_1 ] 4: -0.0663 C0 5: -0.0063 C1 6: 0.0007 C2 7: 0.0 C3 8: 0.0 C4 9: 0.0 C5 15: If time is (P92) ;Store hourly averages every 4 hours 1: 0 Minutes (Seconds --) into a 2: 240 Interval (same units as above) 3: 10 Set Output Flag High (Flag 0) 16: Real Time (P77) ;Data Storage time stamp 1: 1220 Year,Day,Hour/Minute (midnight = 2400) 17: Average (P71) ;Data Storage Average, Location 1 & 2 1: 2 Reps 2: 1 Loc [ Bat_Volt ] 18: Average (P71) ;Data Storage Average, Location 52,53,..99 1: 48 Reps 2: 52 Loc [ VWC_1 ] *Table 2 Program 02: 0.0000 Execution Interval (seconds) *Table 3 Subroutines End Program -Input Locations1 Bat_Volt 1 1 1 2 DL_Temp 1 1 1 3 Period_1 7 1 1 4 Period_2 11 1 1 . . 50 Period_48 19 1 0 51 _________ 0 0 0 52 VWC_1 5 1 1 23 CS616 and CS625 Water Content Reflectometers 53 VWC_2 . . 99 VWC_48 7. 9 1 1 17 1 1 The Water Content Reflectometer Method for Measuring Volumetric Water Content 7.1 Description of Measurement Method The water content reflectometer method for measuring soil water content is an indirect measurement that is sensitive to the dielectric permittivity of the material surrounding the probe rods. Since water is the only soil constituent that (1) has a high value for dielectric permittivity and (2) is the only component other than air that changes in concentration, a device sensitive to dielectric permittivity can be used to estimate volumetric water content The fundamental principle for CS616/CS625 operation is that an electromagnetic pulse will propagate along the probe rods at a velocity that is dependent on the dielectric permittivity of the material surrounding the line. As water content increases, the propagation velocity decreases because polarization of water molecules takes time. The travel time of the applied signal along 2 times the rod length is essentially measured. The applied signal travels the length of the probe rods and is reflected from the rod ends traveling back to the probe head. A part of the circuit detects the reflection and triggers the next pulse. The frequency of pulsing with the probe rods in free air is about 70 MHz. This frequency is scaled down in the water content reflectometer circuit output stages to a frequency easily measured by a datalogger. The probe output frequency or period is empirically related to water content using a calibration equation. 7.2 Response Curves FIGURE 7-1 shows calibration data collected during laboratory measurements in a loam soil with bulk density 1.4 g cm-3 and bulk electrical conductivity at saturation of 0.4 dS m-1. For this soil, the saturation bulk electrical conductivity of 0.4 dS m-1 corresponds to laboratory electrical conductivity using extraction methods of about 2 dS m-1. The response is accurately described over the entire water content range by a quadratic equation. However, in the typical water content range of about 10% to about 35% volumetric water content, the response can be described with slightly less accuracy by a linear calibration equation. The manufacturer supplied quadratic provides accuracy of ± 2.5% volumetric water content for soil electrical conductivity ≤ 0.5 dS m-1 and bulk density ≤ 1.55 g cm-3 in a measurement range of 0% VWC to 50% VWC. 24 Volumetric Water Content (fractional) CS616 and CS625 Water Content Reflectometers 0.4 0.3 0.2 0.1 0 16 18 20 calibration data linear fit quadratic fit 22 24 26 Output period (microseconds) 28 30 32 FIGURE 7-1. CS616 and CS625 linear and quadratic calibrations derived from loam soil 25 CS616 and CS625 Water Content Reflectometers Volumetric Water Content (fractional) FIGURE 7-2 compares the CS616/CS625 response in the FIGURE 7-1 loam soil to a higher density sandy clay loam for two different electrical conductivities. The bulk density for both sandy clay loam soils is 1.6 g cm-3. The electrical conductivity at saturation for the sandy clay loam labeled compacted soil is 0.4 dS m-1. The compacted soil, high EC had an electrical conductivity at saturation of 0.75 dS m-1. 0.3 0.2 0.1 0 16 18 20 22 24 26 28 30 32 34 CS616 output period (usec) low EC soil low EC, compacted soil high EC, compacted soil FIGURE 7-2. CS616 and CS625 response for low EC loam with bulk density 1.4 g cm-3, a low EC sandy clay loam with bulk density 1.6 g cm-3, and a high EC sandy clay loam with bulk density 1.6 g cm-3. The compacted soil response shows the effect of compaction and high clay content. The signal attenuation caused by compaction or high clay content causes an offset in the response as shown by the near-parallel curves at water contents above 10%. This is the effect of attenuation by the solid phase. The effect of increased electrical conductivity for the same soil is shown by the response curve high EC, compacted soil. Higher electrical conductivity causes a decrease in the slope of the response curve. This is the effect of attenuation by the solution phase. 26 CS616 and CS625 Water Content Reflectometers 7.3 Calibration Equations TABLE 7-1 lists the calibration coefficients derived in the Campbell Scientific soils laboratory. Both linear and quadratic forms are presented. The choice of linear or quadratic forms depends on the expected range of water content and accuracy requirements. These coefficients should provide accurate volumetric water content in mineral soils with bulk electrical conductivity less than 0.5 dS m-1, bulk density less than 1.55 g cm-3, and clay content less than 30%. TABLE 7-1. Standard calibration coefficients for linear and quadratic forms. Linear Quadratic C0 C1 C0 C1 C2 –0.4677 0.0283 –0.0663 –0.0063 0.0007 The linear equation is VWC = -0.4677+0.0283*period . The quadratic equation is VWC = -0.0663 - 0.0063*period + 0.0007*period2 . Period is in microseconds. The result of both calibration equations is volumetric water content on a fractional basis. Multiply by 100 to express in percent volumetric water content. FIGURE 7-3 shows the difference between the linear and quadratic calibration forms over the typical range. A CS616/CS625 output period of 16 microseconds is about 1.2% VWC and 32 microseconds is 44.9%. The linear calibration is within ± 2.7% VWC of the quadratic. The linear calibration underestimates water content at the wet and dry ends of the range and overestimates it by up to about 2.6 % VWC at about 20% VWC. 27 CS616 and CS625 Water Content Reflectometers FIGURE 7-3. Difference in % volumetric water content between linear and quadratic forms of calibrations The linear and quadratic coefficients for the sandy clay loam data in FIGURE 7-3 follow and can be used in similar soils. TABLE 7-2. Calibration coefficients for sandy clay loam with bulk density 1.6 g cm-3 and electrical conductivity at saturation 0.4 dS m-1 for both linear and quadratic forms. Linear Quadratic C0 C1 C0 C1 C2 –0.6200 0.0329 0.0950 –0.0211 0.0010 TABLE 7-3. Calibration coefficients for sandy clay loam with bulk density 1.6 g cm-3 and electrical conductivity at saturation 0.75 dS m-1 for both linear and quadratic forms. Linear 28 Quadratic C0 C1 C0 C1 C2 –0.4470 0.0254 –0.0180 –0.0070 0.0006 CS616 and CS625 Water Content Reflectometers 7.4 Operating Range 7.4.1 Soil Electrical Conductivity The quality of soil water measurements which apply electromagnetic fields to wave guides is affected by soil electrical conductivity. The propagation of electromagnetic fields in the configuration of the CS616/CS625 is predominantly affected by changing dielectric constant due to changing water content, but it is also affected by electrical conductivity. Free ions in soil solution provide electrical conduction paths which result in attenuation of the signal applied to the waveguides. This attenuation both reduces the amplitude of the high-frequency signal on the probe rods and reduces the bandwidth. The attenuation reduces oscillation frequency at a given water content because it takes a longer time to reach the oscillator trip threshold. It is important to distinguish between soil bulk electrical conductivity and soil solution electrical conductivity. Soil solution electrical conductivity refers to the conductivity of the solution phase of soil. Soil solution electrical conductivity, σsolution can be determined in the laboratory using extraction methods to separate the solution from the solid and then measuring the electrical conductivity of the extracted solution. The relationship between solution and bulk electrical conductivity can be described by (Rhoades et al., 1976) σ bulk = σ solution θ v Τ + σ solid with σbulk being the electrical conductivity of the bulk soil; σsolution , the soil solution; σsolid , the solid constituents; θv , the volumetric water content; and Τ, a soil-specific transmission coefficient intended to account for the tortuosity of the flow path as water content changes. See Rhoades et al., 1989 for a form of this equation which accounts for mobile and immobile water. This publication also discusses soil properties related to CS616/CS625 operation such as clay content and compaction. The above equation is presented here to show the relationship between soil solution electrical conductivity and soil bulk electrical conductivity. Most expressions of soil electrical conductivity are given in terms of solution conductivity or electrical conductivity from extract since it is constant for a soil. Bulk electrical conductivity increases with water content so comparison of the electrical conductivity of different soils must be at same water content. Discussion of the effects of soil electrical conductivity on CS616/CS625 performance will be on a soil solution or extract basis unless stated otherwise. When soil solution electrical conductivity values exceed 2 dS m-1, the response of the CS616/CS625 output begins to change. The slope decreases with increasing electrical conductivity. The probe will still respond to water content changes with good stability, but the calibration will have to be modified. (See Section 8, Water Content Reflectometer User-Calibration.) At electrical conductivity values greater than 5 dS m-1 the probe output can become unstable. 7.4.2 Soil Organic Matter, Clay Content and Soil Bulk Density The amount of organic matter and clay in a soil can alter the response of dielectric-dependent methods to changes in water content. This is apparent when mechanistic models are used to describe this measurement methodology. 29 CS616 and CS625 Water Content Reflectometers The electromagnetic energy introduced by the probe acts to re-orientate or polarize the water molecules. If other forces are acting on the polar water molecules, the force exerted by the applied signal will be less likely to polarize the molecules. This has the net effect of ‘hiding’ some of the water from the probe. Additionally, some clays sorb water interstitially and thus inhibit polarization by the applied field. Organic matter and some clays are highly polar. These solid constituents can affect CS616/CS625 response to water content change and require specific calibration. This affect is opposite to that of the ‘hiding’ effect. It would be convenient if the calibration of water content to CS616/CS625 output period could be adjusted according to some parameter of the soil which reflects the character of the signal attenuation. However, such a parameter has not been identified. The response of the water content reflectometer to changing water content has been shown to change for some soils when bulk density exceeds 1.5 g cm-3. The response to changing water content is still well behaved, but the slope will decrease with increasing bulk density. 7.5 Error Sources in Water Content Reflectometer Measurement 7.5.1 Probe-to-Probe Variability Error All manufactured CS616s/CS625s are checked in standard media. The limits for probe response in the standard media ensure accuracy of ± 2% volumetric water content. 7.5.2 Insertion Error The method used for probe insertion can affect the accuracy of the measurement. The probe rods should be kept as close to parallel as possible when inserted to maintain the design wave guide geometry. The sensitivity of this measurement is greater in the regions closest to the rod surface than at distances away from the surface. Probes inserted in a manner that generates air voids around the rods will indicate lower water content than actual. In some applications, installation can be improved by using insertion guides or a pilot tool. Campbell Scientific offers the CS650G insertion tool. 7.5.3 Signal Attenuation Error Section 7.1, Description of Measurement Method, presents a detailed description of CS616/CS625 operation. In summary, the CS616/CS625 is primarily sensitive to the dielectric permittivity of the material surrounding the probe rods. The propagation of electromagnetic energy along the probe rods depends on the dielectric properties of the medium. When the reflection of the applied signal from the end of the rods is detected by the CS616/CS625 circuit, another pulse is applied. The time between pulses depends on the propagation time, and the associated period is empirically related to volumetric water content. The applied signal is subject to attenuation from losses in the medium being measured. While this does not directly affect propagation time, it causes delays in detection of the reflected signal. Attenuation of the signal will occur 30 CS616 and CS625 Water Content Reflectometers if there are free ions in soil solution, polar solid constituents such as organic matter or some clay, or conductive mineral constituents. The general calibration equation for the CS616/CS625 will provide good results with attenuation equivalent to about 0.5 dS m-1 bulk electrical conductivity. Between 0.5 dS m-1 and 5 dS m-1, the CS616/CS625 will continue to give a well-behaved response to changes in water content but a soil specific calibration is required. See Section 8, Water Content Reflectomer User-Calibration, for calibration information. 7.6 Temperature Dependence and Correction The error in measured volumetric water content caused by the temperature dependence of the CS616/CS625 is shown in FIGURE 7-4. The magnitude of the temperature sensitivity changes with water content. Laboratory measurements were performed at various water contents and over the temperature range from 10°C to 40°C to derive a temperature correction for probe output period. The following equation can be used to correct the CS616/CS625 output period, τ uncorrected , to 20°C knowing the soil temperature, Tsoil . See sample datalogger programs. The temperature correction assumes that both the water content and temperature do not vary over the length of the probes rods. ( τ corrected ( Tsoil ) = τ uncorrected + ( 20 − Tsoil ) * 0.526 − 0.052 * τ uncorrected + 0.00136 * τ uncorrected 2 ) 31 CS616 and CS625 Water Content Reflectometers Water Content Error with Temperature 8 Water Content Error (%VWC) 6 4 2 0 2 4 10 15 20 Water Content = 30% Water Content = 12% 25 Soil Temperature (C) 30 35 40 FIGURE 7-4. Percent volumetric water content error corrected for by temperature correction equation 8. Water Content Reflectometer User-Calibration 8.1 Signal Attenuation in Conductive Soils and Need for SiteSpecific Calibration A shift in water content reflectometer response results if the applied signal is attenuated significantly. There is a voltage potential between the probe rods when a pulse is applied to them. If the material between the rods is electrically conductive, a path for current flow exists and the applied signal is attenuated. Since the parallel rod design in soil is inherently a lossy medium and attenuation is frequency dependent, both the amplitude of the reflection and the rise-time or bandwidth are affected. Instead of a relatively short rise-time return pulse, the rise-time is greater and the amplitude is less. The reflected signal must exceed a set amplitude before the next pulse is triggered. Reflections that are attenuated and have longer rise-times will take longer to be detected and trigger the next pulse leading to decreased frequency or increased period in conductive materials. 32 CS616 and CS625 Water Content Reflectometers Some clays are very polar and/or conductive and will also attenuate the applied signal. Additionally, if the clayey soil is compacted, increased bulk density, the conductivity is increased and the response is affected. Given the water content reflectometer response to changing water content in attenuating media changes as described above, the accuracy of the volumetric water content measurement can be optimized by characterizing the probe response in the specific medium to be measured. The result is a specific calibration equation for a particular medium. The precision and the resolution of the water content reflectometer measurement are not affected by attenuating media. Both precision and resolution are better than 0.1% volumetric water content. 8.2 The User-Derived Calibration Equation The probe output response to changing water content is well described by a quadratic equation, and, in many applications, a linear calibration gives required accuracy. Quadratic form: θ v ( τ ) = C 0 + C1 * τ + C 2 * τ 2 with θv , the volumetric water content (m3 m-3); τ, the CS616/CS625 period (microseconds); and Cn , the calibration coefficient. The standard calibration coefficients are derived from factory laboratory measurements using curve fitting of known volumetric water content to probe output period. Linear form: θ v ( τ ) = C 0 + C1 * τ with θv , the volumetric water content (m3 m-3); τ, the water content reflectometer period (microseconds); Co , the intercept; and C1 , the slope. Two data points from careful measurements can be enough to derive a linear calibration. A minimum of 3 data points is needed for a quadratic. With 3 evenly spaced water contents covering the expected range, the middle water content data point will indicate whether a linear or quadratic calibration equation is needed. Note from FIGURE 7-1 and FIGURE 7-2 that the calibration function describing the CS616/CS625 response to changing water content is always concave up. If calibration data suggests a different shape, there may be a problem with the data or method. 33 CS616 and CS625 Water Content Reflectometers 8.3 Collecting Laboratory Data for Calibration Water content reflectometer data needed for CS616/CS625 calibration are the CS616/CS625 output period (microseconds) and an independently determined volumetric water content. From this data, the probe response to changing water content can be described by a quadratic calibration equation of the form θ v ( τ ) = C 0 + C1 * τ + C 2 * τ 2 with θv being the volumetric water content (m3 m-3); τ, the CS616 period (microseconds); and Cn , the calibration coefficient (n = 0..2). The linear form is θ v ( τ ) = C 0 + C1 * τ with θv , the volumetric water content (m3 m-3); τ, the CS616 period (microseconds); Co , the intercept; and C1 , the slope. Required equipment: 1. CS616/CS625 connected to datalogger programmed to measure output period 2. Cylindrical sampling devices to determine sample volume for bulk density; for example, copper tubing of diameter ≥ 1 in. and length about 2 in. 3. Containers and scale to measure soil sample weight 4. Oven to dry samples (microwave oven can also be used) The calibration coefficients are derived from a curve fit of known water content and probe output period. The number of data sets needed to derive a calibration depends on whether the linear or quadratic form is being used and the accuracy requirement. Consider the expected range of soil water content while viewing FIGURE 7-1 and FIGURE 7-2. If the expected response is nearly linear, fewer laboratory measurements are needed to derive the calibration. A linear response is best described by data taken near the driest and wettest expected water contents. The measurement sensitive volume around the probe rods must be completely occupied by the calibration soil. Only soil should be in the region within 4 inches of the rod surface. The probe rods can be buried in a tray of soil that is dry or nearly dry. The soil will be homogeneous around the probe rods if it is poured around the rods while dry. Also, a 10 cm diameter PVC pipe with length about 35 cm can be closed at one end and used as the container. It is important that the bulk density of the soil used for calibration be similar to the bulk density of the undisturbed soil. Using dry soil without compaction will give a typical bulk density, 1.1 - 1.4 g cm-3. This is especially important when bulk density is greater than 1.55 g cm-3. Compaction of the calibration soil to similar bulk density may be necessary. 34 CS616 and CS625 Water Content Reflectometers The typically used method for packing a container of soil to uniform bulk density is to roughly separate the soil into three or more equal portions and add one portion to the container with compaction. Evenly place the first loose soil layer in the bottom of the container. Compact by tamping the surface to a level in the container that is correct for the target bulk density. Repeat for the remaining layers. Prior to placing successive layers, scarify the top of the existing compacted layer. The container to hold the soil during calibration should be large enough that the rods of the probe are no closer than about 4 in. from any container surface. Pack the container as uniformly as possible in bulk density with relatively dry soil (volumetric water content <10%). Probe rods can be buried in a tray or inserted into a column. When using a column, insert the rods carefully through surface until rods are completely surrounded by soil. Movement of rods from side-to-side during insertion can form air voids around rod surface and lead to measurement error. Collect the probe output period. Repeat previous step and this step 3 or 4 times. Determine volumetric water content by subsampling soil column after removing probe or using weight of column. If subsampling is used, remove soil from column and remix with samples used for water content measurement. Repack column. Water can then be added to the top of the container. It must be allowed to equilibrate. Cover the container during equilibration to prevent evaporation. The time required for equilibration depends on the amount of water added and the hydraulic properties of the soil. Equilibration can be verified by frequently observing the CS616/CS625 period output. When period is constant, equilibration is achieved. Collect a set of calibration data values and repeat the water addition procedure again if needed. With soil at equilibrium, record the CS616/CS625 period value. Take subsamples of the soil using containers of known volume. This is necessary for measurement of bulk density. Copper tubing of diameter ≥ 1 in. and length about 2 in. works well. The tubes can be pressed into the soil surface. It is good to take replicate samples. Three carefully handled samples will provide good results. The sample tubes should be pushed evenly into the soil. Remove the tube and sample and gently trim the ends of excess soil. Remove excess soil from outside of tube. Remove all the soil from tube to a tray or container of known weight that can be put in oven or microwave. Weigh and record the wet soil weight. Water is removed from the sample by heating with oven or microwave. Oven drying requires 24 hours at 105°C. Microwave drying typically takes 20 minutes depending on microwave power and sample water content. ASTM 35 CS616 and CS625 Water Content Reflectometers Method D4643-93 requires heating in microwave for 3 minutes, cooling in desiccator then weighing and repeating this process until weigh is constant. Gravimetric water content is calculated after the container weight is accounted for. θg = m wet − m dry m dry For the bulk density ρ bulk = m dry volume cylinder the dry weigh of the sample is divided by the sample tube volume. The volumetric water content is the product of the gravimetric water content and the bulk density θ v = θ g * ρ bulk The average water content for the replicates and the recorded CS616/CS625 period are one datum pair to be used for the calibration curve fit. 8.4 Collecting Field Data for Calibration Required equipment 1. CS616/CS625 connected to datalogger programmed to measure probe output period 2. Cylindrical sampling devices to determine sample volume for bulk density, e.g. copper tubing of diameter ≥ 1” and length about 2” 3. Containers and scale to measure soil sample weight 4. Oven to dry samples (microwave oven can also be used) Data needed for CS616/CS625 calibration are the CS616/CS625 output period (microseconds) and an independently determined volumetric water content. From this data, the probe response to changing water content can be described by a quadratic calibration equation of the form θ v ( τ ) = C 0 + C1 * τ + C 2 * τ 2 with θv being the volumetric water content (m3 m-3); τ , the CS616/CS625 period (microseconds); and Cn , the calibration coefficient (n = 0..2). The linear form is θ v ( τ ) = C 0 + C1 * τ 36 CS616 and CS625 Water Content Reflectometers with θv , the volumetric water content (m3 m-3); τ, the CS616/CS625 period (microseconds); Co , the intercept; and C1 , the slope. The calibration coefficients are derived from a curve fit of known water content and CS616/CS625 period. The number of data sets needed to derive a calibration depends on whether the linear or quadratic form is being used and the accuracy requirement. Consider the expected range of soil water content while viewing FIGURE 7-1 and FIGURE 7-2. If the expected response is nearly linear, fewer laboratory measurements are needed to derive the calibration. A linear response is best described by data taken near the driest and wettest expected water contents. Collecting measurements of CS616/CS625 period and core samples from the location where the probe is to be used will provide the best soil-specific calibration. However, intentionally changing water content in soil profiles can be difficult. A vertical face of soil can be formed with a shovel. If the CS616/CS625 is to be used within about 0.5 meters of the surface, the probe can be inserted into the face and water added to the surface with percolation. After adding water, monitor the CS616/CS625 output period to determine if the soil around the rods is at equilibrium. With soil at equilibrium, record the CS616/CS625 period value. Soil hydraulic properties are spatially variable. Obtaining measurements that are representative of the soil on a large scale requires multiple readings and sampling. The average of several core samples should be used to calculate volumetric water content. Likewise, the CS616/CS625 should be inserted at least 3 times into the soil recording the period values following each insertion and using the average. Remove the CS616/CS625 and take core samples of the soil where the probe rods were inserted. This is necessary for measurement of bulk density. Copper tubing of diameter ≥ 1” and length about 2” works well. The tubes can be pressed into the soil surface. It is good to take replicate samples at locations around the tray surface. Three carefully handled samples will provide good results. The sample tubes should be pushed evenly into the soil surface. Remove the tube and sample and gently trim the ends of excess soil. Remove excess soil from outside of tube. Remove all the soil from tube to a tray or container of known weight that can be put in oven or microwave. Weigh and record the wet soil weight. Water is removed from the sample by heating with oven or microwave. Oven drying requires 24 hours at 105 C. Microwave drying typically takes 20 minutes depending on microwave power and sample water content. ASTM Method D4643-93 requires heating in microwave for 3 minutes, cooling in desiccator then weighing and repeating this process until weigh is constant. 37 CS616 and CS625 Water Content Reflectometers Gravimetric water content is calculated after the container weight is accounted for. θg = m wet − m dry m dry For the bulk density, ρ bulk = m dry volume cylinder the dry weight of the sample is divided by the sample tube volume. The volumetric water content is the product of the gravimetric water content and the bulk density θ v = θ g * ρ bulk The average water content for the replicates and the recorded CS616 period are one datum pair to be used for the calibration curve fit. 8.5 Calculations The empty cylinders used for core sampling should be clean and both empty weight and volume are measured and recorded. For a cylinder, the volume is 2 d volume = π * * h 2 where d is the inside diameter of the cylinder and h is the height of the cylinder. During soil sampling it is important that the cores be completely filled with soil but not extend beyond the ends of the cylinder. Once soil core samples are obtained, place the soil-filled cylinder in a small tray of known empty weight. This tray will hold the core sample during drying in an oven. To obtain mwet, subtract the cylinder empty weight and the container empty weight from the weight of the soil filled cylinder in the tray. Remove all the soil from the cylinder and place this soil in the tray. Dry the samples using oven or microwave methods as described above. To obtain mdry, weigh the tray containing the soil after drying. Subtract tray weight for mdry. Calculate gravimetric water content, θg, using θg = 38 m wet − m dry m dry . CS616 and CS625 Water Content Reflectometers To obtain soil bulk density, use ρ bulk = m dry volume cylinder Volumetric water content is calculated using θ v = θ g * ρ bulk . 9. Maintenance The CS616/CS625 does not require periodic maintenance. 10. References Rhoades, J.D., P.A.C. Raats, and R.J. Prather. 1976. Effects of liquid-phase electrical conductivity, water content and surface conductivity on bulk soil electrical conductivity. Soil Sci. Soc. Am. J., 40: 651-653. Rhoades, J.D., N.A. Manteghi, P.J. Shouse, W.J. Alves. 1989. Soil electrical conductivity and soil salinity: New formulations and calibrations. Soil Sci. Soc. Am. J., 53:433-439. 39 CS616 and CS625 Water Content Reflectometers 40 Appendix A. Discussion of Soil Water Content The water content reflectometer measures volumetric water content. Soil water content is expressed on a gravimetric and a volumetric basis. To obtain the independently determined volumetric water content, gravimetric water content must first be measured. Gravimetric water content (θg) is the mass of water per mass of dry soil. It is measured by weighing a soil sample (mwet), drying the sample to remove the water, then weighing the dried soil (mdry). θg = m water m wet − m dry = m soil m dry Volumetric water content (θv) is the volume of liquid water per volume of soil. Volume is the ratio of mass to density (ρb) which gives: m water θ g * ρsoil volume water ρ = water = θv = m volume soil ρ water soil ρsoil The density of water is close to 1 and often ignored. Soil bulk density (ρbulk) is used for ρsoil and is the ratio of soil dry mass to sample volume. ρ bulk = m dry volume sample Another useful property, soil porosity (ε), is related to soil bulk density as shown by the following expression. ε = 1− ρ bulk ρsolid The term ρsolid is the density of the soil solid fraction and is approximately 2.65 g cm-3. Notes: A-1 Appendix A. Discussion of Soil Water Content A-2 Campbell Scientific Companies Campbell Scientific, Inc. (CSI) 815 West 1800 North Logan, Utah 84321 UNITED STATES www.campbellsci.com • [email protected] Campbell Scientific Africa Pty. Ltd. (CSAf) PO Box 2450 Somerset West 7129 SOUTH AFRICA www.csafrica.co.za • [email protected] Campbell Scientific Australia Pty. Ltd. (CSA) PO Box 8108 Garbutt Post Shop QLD 4814 AUSTRALIA www.campbellsci.com.au • [email protected] Campbell Scientific do Brasil Ltda. (CSB) Rua Apinagés, nbr. 2018 ─ Perdizes CEP: 01258-00 ─ São Paulo ─ SP BRASIL www.campbellsci.com.br • [email protected] Campbell Scientific Canada Corp. (CSC) 14532 – 131 Avenue NW Edmonton AB T5L 4X4 CANADA www.campbellsci.ca • [email protected] Campbell Scientific Centro Caribe S.A. (CSCC) 300 N Cementerio, Edificio Breller Santo Domingo, Heredia 40305 COSTA RICA www.campbellsci.cc • [email protected] Campbell Scientific Ltd. (CSL) Campbell Park 80 Hathern Road Shepshed, Loughborough LE12 9GX UNITED KINGDOM www.campbellsci.co.uk • [email protected] Campbell Scientific Ltd. (CSL France) 3 Avenue de la Division Leclerc 92160 ANTONY FRANCE www.campbellsci.fr • [email protected] Campbell Scientific Ltd. (CSL Germany) Fahrenheitstraße 13 28359 Bremen GERMANY www.campbellsci.de • [email protected] Campbell Scientific Spain, S. L. (CSL Spain) Avda. Pompeu Fabra 7-9, local 1 08024 Barcelona SPAIN www.campbellsci.es • [email protected] Please visit www.campbellsci.com to obtain contact information for your local US or international representative.


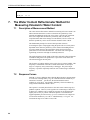
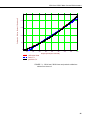
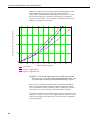

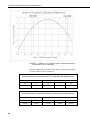

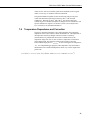


![Expanding Grain Model [EGM v1.0] - Illinois Institute of Technology](http://vs1.manualzilla.com/store/data/005895685_1-bff858b86f7bc344864531d7e5f7cd87-150x150.png)