1
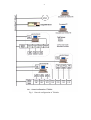
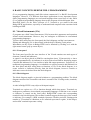
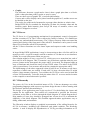
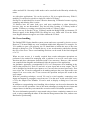
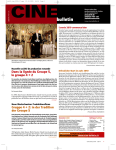
TELELABS
SCADA SYSTEM DEVELOPMENT - DESIGN STUDY
Prepared for: Prof. James Trevelyan
The University of Western Australia
Dept of Mechanical & Mat. Engineering
Prepared by: Enperit Pty Ltd
22 Cassidy Place
Murdoch WA 6150
Date: 29 June 2000
2
CONTENTS
1. Introduction
3
2. BridgeVIEW Environment
6
3. BridgeVIEW Engine
6
4. Tags
7
5. Servers
5.1. Device servers
5.2. OPC servers
5.3. Web server
9
9
10
10
6. DataSocket
11
7. Utilisation of distributed I/O
7.1. Network watchdog and start-up
7.2. Hot Plug and Play
11
12
13
8. Basic Concepts behind the G programming
8.1.Virtual Instruments
8.1.1. Front panel
8.1.2. Block diagram
8.1.3. Icon/connector
8.2. Structures
8.3. Arrays, clusters and plots
8.4. VI Server
8.5. VI hierarchy
8.6. Error handling
15
15
15
15
16
16
17
18
18
19
9. Human Machine Interface
9.1. Front panel
9.2. HMI G Wizard
9.3. Supporting functions
9.4. Polled and event-driven programming
20
20
21
21
21
10. Data logging and extraction
22
11. Alarm and events management
23
12. Video and audio
24
13. LabVIEW RT
25
14. Motion control and machine vision
26
15. Recommendations
27
3
1. INTRODUCTION
Since the inception of Internet there has been steady development of technologies for
Internet-enabled instrumentation.
Remote process monitoring was the first type of application in networked
instrumentation, growing in popularity since the early nineties. However it was the
remote control, collaboration and distributed computing which attracted most interest in
both industry and academic institutions.
The measurement, process control and automation industry has been historically slower
and cautious to standardise on newer technologies but new application domains using
Internet-enabled instrumentation have been pioneered in the industry and university
environments since mid-nineties.
This has been accompanied by maturing technologies like Java and Jini from Sun or
DataSocket from National Instruments.
The common layer of all modern software for measurement and automation is virtual
instrumentation. The concept of virtual instrumentation has been to create more
powerful, flexible and cost-effective instrumentation systems built around a PC using
software as the engine and interface. A virtual instrument can easily export and share its
data and information with other software applications since they often reside on the
same computer. This has been recognised well before Internet started to gain in
popularity.
One of the most successful data acquisition and control software systems utilising
virtual instrumentation has been LabVIEW – introduced by National Instruments twelve
years ago. There have been many products of this type since but none can rival its
popularity. Similarly to the success of the Web, large part of the LabVIEW success is
not so much the underlying technology that is so innovative, but rather the welldesigned graphical interface that makes it accessible. After all, almost everything
LabVIEW offers could be done in C or assembly code years before LabVIEW was
popular.
Most efforts to create these revolutionary tools went in to the development of an
intuitive, human-friendly interface. For the Web it meant a web browser application that
involved little more than just pointing and clicking on images or words of interest.
In the course of this design study we have come across two sites operating networked
engineering laboratories, one of them Web-accessible.
Apart of getting encouraged about the feasibility of Telelabs, we have also found that
we have, independently, made the same choice of measurement software – the
LabVIEW, however their implementations differ from our plans.
They use LabVIEW software on a desktop computer at each lab station, combined with
custom developed server software providing the remote access.
Using LabVIEW as a stand-alone platform seems to be satisfactory for a single lab
station. Telelabs have always been considered as a larger network of lab stations,
scalable according to the current requirements of the Engineering school.
System like that will benefit from centralised control. This will provide costeffectiveness (improving with the scale) and enable efficient management.
This approach is typical for the arrangement of an automated industrial plant and it is
only logical to consider the same type of automation software – SCADA.
4
While custom developed software may have some benefits, the use of an industry tested
and proven software platform minimises the problems commonly faced during
development stages and improves the operational reliability.
SCADA simplifies network connectivity and provides real time database, enabling
efficient processing and logging of experiment data, usage details, graphics generation
(charts etc) and alarm conditions management.
SCADA also provides convenient facilities for remote user terminals.
Since LabVIEW has been so universally accepted in modern lab instrumentation, the
use of it would make the implementation of Telelabs more attractive to other
universities.
National Instruments offer the BridgeVIEW SCADA software, which is a superset of
LabVIEW and is also called the LabVIEW for Industrial Automation.
The very comprehensive set of BridgeVIEW tools is well referenced in the manuals but
their selection and usage require an application-oriented approach.
The implementation of SCADA will depend on the overall system architecture, which
in turn may need to be modified for better utilisation of BridgeVIEW.
The general system configuration, shown on the following page, is the basis for the
development of the Telelabs architecture.
This scheme is based on maximum utilisation of distributed I/Os, taking advantage of
their modularity, network connectivity and ease of integration into BridgeVIEW
environment.
If a station requires higher performance control, dedicated software can be run locally
and specialised hardware can be used if needed. Because BridgeVIEW is a full OPC
client, it can communicate with any OPC server available on the market today.
Each station is equipped with it’s own GUI, which can be reproduced on a remote
monitor(s).
The development of Telelabs will also involve integration of accompanying software
dedicated to the stations hardware, video and audio.
The aim of this study is to provide a platform for development of automated lab
experiments and for the remote Internet access and resource allocation scheme.
5
Fig.1. General configuration of Telelabs.
6
2. BRIDGEVIEW ENVIRONMENT
BridgeVIEW combines high performance monitoring and control with wide range of
data acquisition on the Windows NT/2000/9x operating systems.
The BridgeVIEW system contains three sets of multithreaded processes: the user
process (HMI application), the BridgeVIEW Engine and industrial automation device
servers. These processes interact through a client-server relationship.
The user process displays the user interface and executes blocks of code called VIs
(Virtual Instruments) that are defined for control algorithms, supervisory control,
analysis and visual presentation.
The user process is based on LabVIEW, and if required, LabVIEW functions can be
utilised directly, bypassing the Engine.
The event-driven Engine maintains the real time database, communicates with device
servers and performs: data acquisition, engineering unit scaling, and alarm processing,
alarm and event logging, historical data collection and trending.
Device servers are the applications that communicate with the I/O devices such as PLCs
and plug-in cards. There are dedicated servers for different device manufacturers and
communication networks.
BridgeVIEW is build around the G - the highly productive, industry proven graphical
programming language of LabVIEW.
BridgeVIEW includes conventional program development tools for G. They enable
setting breakpoints, animating program execution to see how data passes through the
program and single-stepping through the diagram to make debugging and program
development easier.
The developer and user are further assisted by several ‘wizards’ for Configuration, HMI
and Front Panel.
BridgeVIEW uses a combination of tags, events, and data. A tag is a connection to a
real-world I/O point, while an event is anything that happens to a tag or to the
BridgeVIEW Engine in general.
Access to most BridgeVIEW utilities and the BridgeVIEW Engine can be configured on
a per-user basis.
3. BRIDGEVIEW ENGINE
The BridgeVIEW Engine is the heart of the BridgeVIEW system. It runs as a separate
process, independent of HMI applications. This minimizes interference between the
Engine and any HMI. The BridgeVIEW Engine manages the Real-Time Database
(RTDB), which contains information about all the tags in the system.
It reads values from the various device servers. These values are scaled and compared
with their alarm limits. If a tag is in an alarm state, the Engine generates appropriate
events and logs them to disk.
The RTDB is an in-memory snapshot of the state of all tags in the system. If a tag value
changes more than its update deadband, or its alarm state changes, the RTDB is
7
updated. Along with tag values, the RTDB also stores status, date, time, and alarm
information.
These tasks can be customized by configuring each tag with the Tag Configuration
Editor.
When any G application that accesses the BridgeVIEW Real-Time Database is invoked,
the BridgeVIEW Engine launches automatically, opening either the configuration (.scf)
most recently edited or the one the application selects programmatically. Launching the
BridgeVIEW Engine brings up the Engine Manager display. The Engine Manager is a
window into the BridgeVIEW Engine, through which some of the behaviour of the
BridgeVIEW Engine can be controlled.
Some more sophisticated applications may require control over portions of the
BridgeVIEW environment from the applications. The System VIs palette provides
mechanisms to programmatically control the BridgeVIEW Engine. It includes functions
that control actions such as launching and shutting down the Engine, enabling and
disabling logging and so on.
4. TAGS
A tag is a data value in the BridgeVIEW Engine. Tags are used to monitor I/O points, to
store a result of a calculation based on other tags, or to monitor tags on another
BridgeVIEW Engine.
All data used with Telelabs will be tagged. This will include not only the I/Os of all lab
experiments but also the data used in system management.
Before running BridgeVIEW application a tag configuration must be specified.
BridgeVIEW provides the Tag Configuration Editor, which assist in configuration of all
tags in the system and all parameters of the BridgeVIEW Engine.
The Tag Configuration Editor records all tag information and Engine parameters and
stores this information in a BridgeVIEW Configuration File with the extension .scf
(SCADA Configuration File). The BridgeVIEW Engine reads this file to determine all
of the configuration parameters for execution.
The .scf file does not contain any information about the VIs in user’s HMI. In fact, it is
not specific to a single user application. Multiple user applications can run concurrently
as long as they use the same set of tags, but only one .scf file can be loaded and running
in the BridgeVIEW Engine at a time.
When a tag is configured with the Tag Configuration Editor, a type of the tag is defined
along with several attributes, each of which have an effect on Engine operation.
Tags can be of the following types: input, output, input/output or memory.
Memory tags are tags not connected directly to I/O points, they exist only in the
BridgeVIEW RTDB. Memory tags are used to log historical data and event information
on data that is either a software-generated value or a combination of values from
different I/O tag readings or perform alarm calculations.
A network tag is a tag remotely connected to any type of tag on another BridgeVIEW
Engine.
Tag attributes are classified as either static or dynamic. Static attributes require
restarting the Engine for the tag change to have an effect. Dynamic attributes allow for
the Tag Configuration Editor to change the tag attribute in a running Engine.
Tag attributes can be separated into five categories: general, connection, operations,
scaling, and alarms.
8
w General Attributes
General attributes include data type, maximum length for string and bit array tags,
and the name, description, and the group of the tag.
The BridgeVIEW system supports four types of tags: analogue, discrete, string, and
bit array.
Analogue tags have continuous values with a specified range (such as 0.0 to 100.0).
Discrete tags have values that are either ON (1) or OFF (0).
Bit array tags are comprised of up to 32 bits, each of which can have an ON (1) or
OFF (0) state.
String tags consist of ASCII characters or binary data and can be of any length.
w Connection Attributes
I/O connection attributes describe where the Engine sends or receives values for the
tag and how to access that data. Connection includes the following tag attributes:
access rights (input only, output only, input/output or memory), server name, I/O
group name, item name and access path (for OPC servers).
Memory tags are not connected to a real world I/O point. They provide more
complex monitoring, alarming, or control.
w Operation Attributes
Operation attributes describe additional functionality that the Engine performs on a
tag or its values. These operations include tasks such as setting initial values,
updating the RTDB and enabling logging operations.
w Scaling Attributes
Scaling describes the type of linear scaling to be performed on a tag when
communicating with a device server, and the expected engineering range and units
for the tag. Only analogue (numeric) and Bit Array tags have scaling attributes.
w Alarm Attributes
Alarm attributes define abnormal process conditions for a given tag. Alarm limits
can be set for each tag. Each alarm limit has a priority associated with it to
determine the severity of the alarm. Detailed system error and event messages are
logged to a system log file.
A tag value is acquired and/or controlled by a device server that communicates with the
BridgeVIEW Engine and can be read or set by a VI in a HMI application. If, like for
Telelabs, BridgeVIEW Engine is required to monitor a large number of I/O points in a
system, the Tag Configuration Editor provides the Configuration Wizard, which helps
to automatically generate tags from server information. Server configuration utilities
enable to define devices and items for the I/O points the servers monitor and control.
With the Configuration Wizard tags from these items can be created automatically.
When the tags are created, the tag name, data type, I/O group, I/O connection, and
scaling parameters are determined by the server information for each server item. The
remaining tag parameters are determined by the default tag parameter settings.
The BridgeVIEW Engine uses Update Deadband and Log Deadband values to eliminate
unnecessary processing on minor data value changes. In process instrumentation,
deadband is the range through which an input signal can vary without initiating an
observable change in output signal. Deadband allows defining a significant change,
usually expressed in percent of full scale. Although the term deadband generally applies
only to analogue tags, other tag types have a limited type of deadband.
OPC servers support deadbands but not all servers do.
9
The general configuration of all configured tags in the system can be viewed with the
Tag Browser. The Tag Browser is a useful tool for checking how a tag is configured
while building HMI VIs and changing the loaded configuration file.
The Tag Monitor allows monitoring the value, unit, timestamp, alarm state, and status
for selected tags in the system, as well as writing the value to an output or input/output
tag. Upon the first launch of the Tag Monitor, a tag selection dialog box displays all the
tags configured in the currently selected tag configuration file.
BridgeVIEW has a special data type called the tag data type that is aware of the
available tag names and tag group names contained in the current .scf file. All
BridgeVIEW functions that can operate on tags or tag groups use the tag data type. The
tag data type is marked with a valve glyph. Constants and wires in the block diagram
carrying this tag information are displayed in purple. Tag controls, indicators and
constants also can be contained in arrays - many BridgeVIEW VIs operate on arrays of
tags. Tag groups are distinguished from individual tags in the list by a folder glyph.
5. SERVERS
BridgeVIEW supports several types of servers including OPC Servers, DDE Servers,
and National Instruments standard Industrial Automation (IA) Device Servers.
OPC Servers are written to the OPC Foundation OPC Data Access specification and are
provided by many companies. A DDE Server is any server that supports the DDE
Server interface.
There are two implementations of IA Device Servers: VI-based and DLL-based. The
DLL-based servers are also known as IAK Device Servers. IAK device servers allow
communication resources, devices and items to be directly created and configured from
the Tag Configuration Editor.
5.1. Device servers
Device servers pass real-world tag values to the BridgeVIEW Engine in real time. Each
server monitors the device items and encapsulates all device- and hardware-specific
details, thus establishing a device-independent I/O layer for BridgeVIEW. The device
servers also handle and report communications and device errors to BridgeVIEW.
Each device server is a stand-alone component that might include a configuration utility
as well as the run-time application that communicates with the BridgeVIEW Engine.
Industrial automation device servers are not built into the BridgeVIEW Engine itself.
These servers are written to a National Instruments standard client/server Applications
Programming Interface (API) for communicating with the BridgeVIEW Engine and the
Common Configuration Database.
When BridgeVIEW runs an application, it determines from the tag configuration (.scf)
file which servers are needed, and which items are needed from those servers.
BridgeVIEW launches each server it needs, and notifies each one to monitor the specific
items of interest. After that they run in the background, reading selected input items and
writing them on demand.
For each input item, the device server passes the value, the timestamp of when the item
was sampled, and status information to the BridgeVIEW Engine.
10
Output items are written on demand only when the BridgeVIEW Engine passes a new
output value to the server.
The update rates and deadband servers use for monitoring items can be configured as
part of tag configuration. A server completes operation only when the BridgeVIEW
Engine shuts down.
BridgeVIEW includes the NI-DAQ Server, an IA Device Server that supports National
Instruments data acquisition boards.
When a device server is installed it must be registered with BridgeVIEW or its
configuration utility must be run. This information is written to the Common
Configuration Database, where BridgeVIEW obtains the server information.
BridgeVIEW also includes a Device Server Development Kit which allows creating
device servers for any custom hardware device, using either LabVIEW or C.
5.2. OPC servers
BridgeVIEW can communicate with any server implementing the OPC Foundation
OPC Server interface, a Microsoft COM-based standard (OLE for Process Control).
BridgeVIEW automatically finds all OPC Servers installed in the system and searches
the network for OPC servers on other machines.
Unlike device servers, OPC servers do not store information in the Common
Configuration Database, rather BridgeVIEW reads any available information about
server capabilities and items from the server directly.
Each BridgeVIEW I/O Group created in the Tag Configuration Editor is automatically
mapped to an OPC Group in the OPC Server with the same attributes. A BridgeVIEW
tag can be connected to an OPC Server item by selecting the server and entering the
item name along with other parameters needed such as the access path.
OPC Servers have an optional interface called the Server Browse Address Space
Interface. If a server supports this interface, BridgeVIEW can query it to find which
items are available from the server and display them in the item list when the server is
selected in the Tag Configuration.
5.3. Web Server
With the Web Server in LabVIEW VI front panels can be published on the Web along
with HTML documents. The built-in Web Server is intended for users that need to make
the panels of their running VIs visible on the Internet, but do not require sophisticated
security features nor want to control VIs through the Internet.
11
6. DATASOCKET
Although a variety of different technologies exist today to share data between
applications, such as TCP/IP and DDE, most of these tools are not targeted for live data
transfer.
For example, with TCP/IP, code needs to be written to convert measurement data into
an unstructured stream of bytes in the broadcasting application, as well as code to parse
the stream of bytes back into its original form in subscribing applications.
DataSocket, a new programming technology based on TCP/IP, simplifies live data
exchange between different applications on one computer or between computers
connected via a network. It automates the data stream conversion between the
broadcaster and subscriber.
DataSocket consists of two pieces – the DataSocket Application Programming Interface
(API) and the DataSocket Server.
The DataSocket API presents a single interface for communicating with multiple data
types from multiple languages.
DataSocket transfers data in a self-describing format that can represent data in an
unlimited number of formats, including strings, scalars, Booleans, and waveforms. The
DataSocket read and write operations transparently convert measurements to and from
the underlying byte streams, eliminating the need to write complicated parsing code.
Furthermore, using the DataSocket data format, user-definable attributes can be
associated with data. For example a time stamp and a sampling rate can be associated
with an array.
DataSocket Server, based on URLs for connecting, simplifies Internet communication
by managing TCP/IP programming for the user.
The DataSocket API is implemented as an ActiveX control, set of LabVIEW VIs and a
LabWindows/CVI C library, so it can be used in almost any programming environment.
The same DataSocket API can be used in programs to read data items on HTTP servers,
FTP servers, local files, OPC servers and DSTP servers.
7. UTILISATION OF DISTRIBUTED I/Os
To a large extent the control of the lab stations will be based on distributed I/Os
comprising of National Instruments FieldPoint devices. The FieldPoint devices
resemble I/O modules of a PLC, covering the same range of functions.
FieldPoint modules communicate with the central controller using a network module,
which can serve a bank of up to 9 modules. In a lightly loaded network, with minimum
output filtering, inputs update rate in the range of single milliseconds seem to be
achievable.
The FP-1600 network module connects directly to a 10 Mbps or 100 Mbps Ethernet
network. It automatically detects the speed of the connection and configures itself
accordingly.
The FP-1600 provides a high-speed local bus for communication to the I/O modules in
the bank. The high-speed local bus has low overhead that enables fast response to
commands from the host computer.
12
The FieldPoint software includes the Explorer configuration utility as well as
BridgeVIEW server and LabVIEW VIs for easy integration into BridgeVIEW system.
These software components manage the low-level communications and hardware
details, simplifying programmatic access to I/O channels.
FieldPoint Explorer is used to configure the programmable settings of the FieldPoint
hardware, such as the input range of an analogue input module, watchdog timer settings,
or the power-up values of output modules.
I/O items (which represent one or more physical I/O channels) are defined from the
Explorer. It also provides a user interface from which values of these I/O items can be
interactively read and written to verify that the FieldPoint system has been correctly
installed and configured.
The I/O Items configured in the FieldPoint Explorer become available to the
BridgeVIEW server when the configuration data is exported from FieldPoint Explorer
into the BridgeVIEW common configuration database (CCDB).
From within BridgeVIEW, the Tag Configuration Wizard imports this configuration
information, creating a tag for every I/O item configured in the FieldPoint Explorer.
These tags are immediately accessible through the BridgeVIEW real-time database.
A set of VIs provide communication between I/O items configured in the FieldPoint
Explorer and applications developed using the LabVIEW graphical programming
environment.
In order to operate on the network, the FP-1600 has to be provided with several
parameters:
_ IP address
Typically represented as four numbers separated by periods (for example,
130.164.55.112).
_ Subnet mask
A code that helps the network device determine whether another device is on the
same network or a different network. 255.255.255.0 is the most common subnet
mask.
_ Time Server IP
The IP address of a networked computer that runs the National Instruments Time
Service. This is usually the IP address of the computer that FieldPoint software runs
on.
7.1. Network watchdog and start-up
The FP-1600 can detect unexpected periods of network inactivity and respond to them
in a user-defined way. The network watchdog timer feature enables system guarding
against failures in the network connection, cables, or host computer, and to put the
channel outputs in a user-defined state (the watchdog state) if such failures do occur.
The watchdog output values can be set to be different from the power-up output values.
FieldPoint Explorer software is used to set up the watchdog parameters: data value for
each channel, data enable/disable status for each channel, enabled/disabled status for
each I/O module and timeout value for the bank.
13
Telelabs applications will require that, on start-up, the system’s I/O modules power up
with user-specified configuration and output levels rather than factory default settings.
The SnapShot feature provides a single-step method to store the current state of
FieldPoint bank for use as the power-up state of the bank. The SnapShot stores all the
following information in a single step:
_ Attribute and range settings of each channel
_ Output values of each channel
_ Watchdog data values of each channel
_ Watchdog data enabled (or disabled) status for each channel
_ Watchdog enabled (or disabled) status of each module
The FP-1600 provides an alternative method to define power-up states that allows
storing the SnapShot information with more flexibility.
The Programmable Power-Up State feature enables the user to define the power-up
configuration on a module-by-module basis.
On power-up the FP-1600 runs a test suite to verify its own operational status - the
power-on self test (POST). The test, taking several seconds, is non-invasive and
therefore does not affect the operation of the network, nor does it affect any of field
wiring connected to the terminal bases in the bank. If the self-test suite fails, the FP1600 does not participate in the network communication traffic, eliminating potential
conflicts with the other banks in your network. The FP-1600 indicates POST failure
through the POWER and STATUS LEDs.
7.2. Hot Plug and Play
With the HotPnP feature, I/O modules can be removed or inserted into the FieldPoint
terminal bases while power is on, even if the system is already engaged in network
activity. This will help to perform maintenance and development activities on a single
lab station without the need to bring the network down or special isolation.
On power-up, the FP-1600 automatically uploads an electronic data sheet (EDS) from
each I/O module in its bank. The FP-1600 then configures each I/O module in the bank
to factory default settings in the module’s EDS, or in the stored SnapShot settings if the
SnapShot feature is enabled.
When a new I/O module is inserted, the FP-1600 automatically uploads the EDS and
configures the I/O module to factory default settings in the module’s EDS, or to stored
SnapShot settings if the SnapShot feature is enabled. This configuration is
accomplished without any intervention from the host computer or software.
While one or more new or replacement I/O modules in a bank are being serviced by the
HotPnP feature, the other I/O modules in the bank remain fully operational and
accessible on the network without any interruptions. As soon as the FP-1600 configures
the new or replacement I/O module through the HotPnP service, that I/O module
becomes automatically accessible on the network.
When an I/O module is removed, the FP-1600 does not undertake any special course of
action for the bank. The central server could be unaware that the I/O module is missing,
and might continue to send commands to this module. Each command returns an error
14
response, but the FP-1600 remembers the commands sent to the missing I/O module.
When a new I/O module is connected in place of the one that was removed, the FP-1600
first verifies that the replacement I/O module is compatible with the one that was
removed. If the I/O module is the same as, or is compatible with, the one removed, the
FP-1600 configures the replacement I/O module with its predecessor’s configuration
and output value settings. It also applies the effects of any commands sent by the host
computer while the I/O module was missing.
If the replacement module is incompatible with the one that was removed, the FP-1600
looks at the information stored in the SnapShot. If the SnapShot is enabled and the
replacement module is compatible with the information in the SnapShot, the FP-1600
configures the replacement module with the SnapShot configuration. Otherwise, the FP1600 configures the replacement module to factory default settings.
15
8. BASIC CONCEPTS BEHIND THE G PROGRAMMING
G is a programming language, much like various commercial C or BASIC development
languages. However, G is different from those applications in one important respect.
Other programming languages are text-based languages that create lines of code, while
G is a graphical programming language that creates programs in block diagram form.
Described below are the basic concepts of G, essential to get started with most
BridgeVIEW applications, especially to understand and complete tasks associated with
building an HMI.
8.1. Virtual Instruments (VIs)
G programs are called Virtual Instruments (VIs) because their appearance and operation
imitate actual instruments. However, they are analogous to functions in conventional
programming languages.
VIs have three main parts: the front panel, the block diagram, and the icon/connector.
Editing and debugging Vis is done mainly with the help of floating Tools palette.
Information on any object in BridgeVIEW can be obtained by clicking on it with the
right mouse button (pop up on an object).
8.1.1. Front panel
The front panel specifies the user interface of the VI and contains two main types of
elements: controls and indicators.
A control is an object placed on HMI for entering data into a VI interactively or into a
subVI programmatically. An indicator is an object placed on HMI for displaying output.
Controls and indicators in G are similar to input and output parameters, respectively, in
traditional programming languages. An alternative to placing controls and indicators on
the front panel and then wiring them to functions or VIs on the block diagram, is to
create controls or indicators directly from the block diagram, however controls or
indicators can not be deleted from the block diagram.
8.1.2. Block diagram
The block diagram supplies a pictorial solution to a programming problem. The block
diagram consists of the executable code that is created for the VI using nodes, terminals,
and wires.
A node in BridgeVIEW is any object with inputs/outputs.
Terminals are regions on a VI or function through which data passes. Terminals are
analogous to parameters in text-based programming languages. Each time a new control
or indicator is created on the front panel, BridgeVIEW creates the corresponding
terminal in the block diagram. The terminal symbols suggest the data type of the control
or indicator. For example, a DBL terminal represents a double-precision, floating-point
number; a TF terminal is a Boolean, an I16 terminal represents a regular, 16-bit integer;
and an ABC terminal represents a string.
16
A wire is a data path between nodes. Wires are coloured according to the kind of data
each wire carries. Blue wires carry integers, orange wires carry floating-point numbers,
green wires carry Booleans, and pink wires carry strings.
The block diagram toolbar contains additional options for debugging VIs.
8.1.3. Icon/connector
VIs use a hierarchical and modular structure. They can be used as top-level programs, or
as subprograms within other programs.
The icon/connector allows a VI to be used as a subVI in the block diagram of another
VI. The icon/connector pane of a VI works like a graphical parameter list so that other
VIs can pass data to it as a subVI. A subVI is much like a subroutine in text-based
programming languages. A subVI node is analogous to a subroutine call. Any VI that
has an icon and a connector can be used as a subVI in another VI.
8.2. Structures
A structure is a program element controlling the flow of data in a VI.
G has five structures: the While Loop, the For Loop, the Case structure, the Sequence
structure, and the Formula Node.
w While Loops
A While Loop is a structure that repeats a section of code until a condition is met. It
is comparable to a Do-While Loop in traditional programming language.
The While Loop is a resizable box used to execute the diagram inside it until the
Boolean value passed to the conditional terminal (an input terminal) is FALSE.
The VI checks the conditional terminal at the end of each iteration therefore, the
While Loop always executes at least once. The iteration terminal is an output
numeric terminal that outputs the number of times the loop has executed starting at
zero.
w For Loops
A For Loop executes a section of code a defined number of times. It is resizable,
and, like the While Loop, is not dropped on the block diagram immediately. Instead,
a small icon representing the For Loop appears in the block diagram, and can be
sized and positioned.
w Case Structure
Both Case and Sequence structures can have multiple subdiagrams, configured like a
deck of cards, of which only one is visible at a time. At the top of each structure
border is the subdiagram display window, which contains a diagram identifier in the
centre and decrement and increment buttons at each side. The diagram identifier
indicates which subdiagram currently is displayed.
The Case structure is a conditional branching control structure, which executes a
subdiagram based on the value of a certain input.
For Case structures, a diagram identifier is a list of values which select the
subdiagram. This depends on the value of an integer, Boolean, string, or enum value
wired to the external side of the selection terminal or selector.
17
w Sequence structure
Sequence structure is a program control structure that executes its subdiagrams in
numeric order with the number of the frame in the sequence (0 to n –1) shown in the
diagram identifier.
In conventional programming languages, the program statements execute in the
order in which they appear. In data flow programming, a node executes when data is
available at all of the node inputs, although sometimes it is necessary to execute one
node before another. G uses the Sequence structure as a method to control the order
in which nodes execute.
w
Formula Node
The Formula Node is a resizable box that can be used to enter a complicated formula
instead of creating block diagram subsections. The operators and functions available
inside the Formula Node are listed in the Help window for the Formula Node.
Polymorphism is the ability of a function to adjust to input data of different types,
dimensions, or representations. G functions are polymorphic to different degrees. Some
functions might accept numeric and Boolean inputs, others might accept a combination
of any other data types.
8.3. Arrays, clusters and plots
w Arrays
An array is a collection of data elements that are all the same type. An array has one
31
or more dimensions and up to 2 elements per dimension. Each array element is
accessible through its index in the range 0 to n – 1, where n is the number of
elements in the array.
Array controls, constants and indicators on the front panel or block diagram are
created by combining an empty array shell with a numeric, Boolean, string, or
cluster. An array element cannot be another array, chart, or graph.
For Loop and While Loop structures can index and accumulate arrays at their
boundaries automatically. These capabilities collectively are called auto-indexing.
G has many functions to manipulate arrays. These functions include Replace Array
Element, Search 1D Array, Sort 1D Array, Reverse 1D Array, Multiply Array
Elements, Array Size, Array Subset and Index Array.
w Clusters
A cluster is a statically sized collection of data elements of the same or different
types. A cluster is analogous to a struct in C. By using clusters, subVIs require fewer
connection terminals.
w Charts
A chart is a numeric plotting indicator which is updated with new data periodically.
There are two types of charts: waveform chart (or real-time trend) and intensity
chart. Features available for customising charts include: a scrollbar, a legend, a
palette, a digital display, and representation of scales with respect to time.
Chart can be produced in three modes: strip chart, scope chart, and sweep chart
(default).
18
w Graphs
The difference between a graph and a chart is that a graph plots data as a block,
while a chart plots data point by point, or array by array.
There are three types of graphs: XY, waveform and intensity.
Cursors and a cursor display can be placed on all the graphs in G, and the cursor can
be labelled on the plot.
The scales of a graph can be formatted to represent either absolute or relative time.
BridgeVIEW has two methods for displaying 3D data: the intensity chart and the
intensity graph. Both intensity plots accept 2D arrays of numbers, where each
number is mapped to a colour.
8.4. VI Server
The VI Server is a G programming mechanism for programmatic control of properties
and the execution of VIs. The VI Server allows the control of when a VI is loaded into
memory, run, and unloaded from memory. The VI Server Property Node can control the
opening and closing of the front panel of the called VI. Parameters can be passed to and
data received from the called VIs dynamically.
All the VI Server functions use error cluster inputs and outputs to make error handling
easier.
In larger BridgeVIEW applications, it may be inconvenient to have all of the subVIs in
memory at once. A typical example could be a number of VIs that act as user interfaces
(HMIs) for several subsystems within one process.
One solution might be to have a top-level VI, which serves as a menu that has each of
these subVIs in its diagram. This VI contains a set of Booleans such that when the user
presses a button on the front panel, the proper subVI is executed. The diagram builds an
array of Booleans and checks the array for any TRUE values. The index of the TRUE
value is passed into a Case structure and each case contains the appropriate subVI.
The disadvantage of the above approach is that all subVIs are in memory at all times,
regardless of which ones are needed. If each subVI is large, the main menu VI might
require a large amount of memory. To avoid that, the VI Server can be used to load and
execute VIs dynamically. To do this, both, the name of the VI to access and its location
on the computer or network must be specified.
8.5. VI hierarchy
The power of G lies in the hierarchical nature of VIs. G has an advantage over other
programming languages with respect to top-down design because it allows starting with
the final user interface then animating it.
The design of an application starts at the top-level VI with defining the inputs and
outputs for the application. Then subVIs are constructed to perform the necessary
operations on the data as it flows through the block diagram. If a block diagram has a
large number of icons, they should be groupped into a lower-level VI to maintain the
simplicity of the block diagram. This modular approach makes applications easy to
debug, understand, and maintain.
The Hierarchy window displays a graphical representation of the calling hierarchy for
all VIs in memory, including type definitions and global variables. The Hierarchy
window is used to display the dependencies of VIs by providing information on VI
19
callers and subVIs. Currently visible nodes can be searched in the Hierarchy window by
name.
As with other applications, Vis can be saved to a file in a regular directory. With G,
multiple Vis can be also saved in a single file called a VI library.
Saving VIs as individual files is more effective than using VI libraries because copying,
renaming, and deleting files is easier.
VI libraries have the same load, save, and open capabilities as other directories,
however, they are not hierarchical. They do not allow creating a VI library inside of
another VI library or creating a new directory inside a VI library, either.
There is no way to list the VIs in a VI library outside the BridgeVIEW environment. VI
libraries appear in the BridgeVIEW file dialog box as a folder with VI on the folder
icon. Regular directories appear as a folder without the VI label.
8.6. Error handling
The BridgeVIEW Engine handles system events and errors reported by device servers.
However, VIs must handle any error conditions within their diagrams. For example, if a
VI is unable to open a file properly, the VI should halt or inform the user of the error
through a dialog box. The VI should also try to use an alternative path before alerting
the user of the error. These error-handling decisions can be made in the block diagram
of a VI.
When an error occurs, it is usually required that certain subsequent operations are
performed. One method for managing such a problem is to test for errors after every
function and place subsequent functions inside Case structures. However, this method
can complicate the diagrams and ultimately hide the purpose of the application.
An alternative approach, recommended by NI, is to incorporate error handling in the
subVIs that perform I/O. Each VI can have an error input and an error output. The VI
can be designed to check the error input to see if an error has occurred previously. If an
error exists, the VI can be configured to do nothing and pass the error input to the error
output. If no error exists, the VI can execute the operation and pass the result to the
error output.
With the preceding technique, several VIs can be wired together, connecting error
inputs and outputs to propagate errors from one VI to the next. At the end of the series
of VIs, the Simple Error Handler VI can be used to display a dialog box if an error
occurs.
In addition to encapsulating error handling, this technique can be used to determine the
order of several I/O operations. One of the main advantages in using the error input and
output clusters is that they can control the execution order of dissimilar operations.
The error information generally is represented using a cluster containing a numeric error
code, a string containing the name of the function that generated the error, and an error
Boolean for quick testing.
20
9. HUMAN MACHINE INTERFACE
An HMI is the interface through which an operator interacts with the BridgeVIEW
system and with the outside environment, that BridgeVIEW monitors and controls.
BridgeVIEW includes a set of VIs to control the HMI, access the Real-Time Database
and Citadel, perform calculations and logic, and switch between different displays.
HMIs operate on tags but all the G programming techniques are applicable.
The development of an HMI application starts with configuration of tags followed by
creation of the front panel interface and the block diagram. The HMI G Wizard is a
comprehensive tool for building block diagrams.
9.1. Front panel
The front panel design involves the layout of the user interface objects such as real-time
trend displays, alarms and events displays, numeric indicators and automation symbols.
Tag Attributes VIs allow programmatic control of attributes for the front panel controls
or indicators, or display configuration information on the HMI. Setting attributes
programmatically for front panel controls and indicators is an alternative to changing
attribute through the various front panel pop-up menus or by typing into various control
and indicator fields. Handling attributes programmatically is most useful when the same
indicator or control is used for different tags.
BridgeVIEW controls and indicators can be customised with the Control Editor to
change their default appearance on the front panel. These controls can be saved for use
in other VIs. Programmatically, they function the same as standard BridgeVIEW
controls.
The Control Editor has two modes: the Edit mode and the Customize mode. The Edit
mode allows popping up on a control and manipulating its settings. The Customize
mode is used to move the individual components of a control around with respect to
each other.
Graphics can be imported from other programs for use as background pictures, as items
in ring controls, or parts of other front panel controls. A picture must be first loaded into
the BridgeVIEW clipboard. Once a picture is in the BridgeVIEW clipboard, it can be
pasted as a static picture on the front panel.
Picture importing options are also included in the Control Editor. Picture files supported
include EMF, BMP, and WMF files.
It may be convenient to divide the HMI into several panels so the operator can navigate
through them using buttons on the screen. The Panel G Wizard helps generating the
panel navigation system for operators. With the Panel G Wizard, code can be attached
to buttons that, when pressed by the operator, will open the VIs.
21
9.2. HMI G Wizard
The HMI G Wizard provides an easy interface for generating repetitive pieces of
diagram code. The HMI G Wizard can be an immense help in building tag monitoring
and control loops.
The HMI G Wizard invoked on a numeric control can associate an analogue output tag
value with that control. The colours and blink options under alarm conditions can be set,
the updates specified to happen only when the control value changes.
A similar action on a numeric indicator can associate an analogue input tag value with
that indicator.
The HMI G Wizard invoked on a Boolean control can associate a discrete output tag
value or an alarm acknowledgement state (Alarm Acknowledgement) with that control.
The HMI G Wizard associates a front panel control or indicator with a tag, and
generates the necessary Wizard subdiagram for a configuration specified by the user
.
When the HMI G Wizard has created a block diagram, there is an association between
the front panel object and the generated Wizard subdiagram. The association is
protected by a Wizard lock, which prevents the user from editing the Wizard
subdiagram. Once the Wizard lock is released, the association is broken and the Wizard
no longer identifies the subdiagram as being created by it.
9.3. Supporting functions
The functionality of a HMI can be extended by comprehensive Mathematic palette,
Signal Processing palette and the Picture Control VI Library.
The Picture Control VIs include drawing operations that can be used to create diagrams
and build images dynamically. They help creating new front panel displays such as
specialized bar graphs, pie charts, or Smith charts. The VIs allow displaying and
animating arbitrary objects such as robot arms, test equipment, or a two-dimensional
display of a real-world process.
HiQ and MATLAB scripts can be loaded and edited into block diagram code so
LabVIEW works with their advanced functionality, which helps organizing and
visualizing real-world math, science, and engineering problems.
There is a script node that works similarly to the formula node. This script node can be
placed on a block diagram and accept a script written according to the syntax of HiQ or
MATLAB.
HiQ 4.1 or MATLAB 5.0 or later are required to use this feature successfully.
9.4. Polled and event-driven programming
It is not necessary to use a separate loop for each Tags or Alarms and Events VI. This
can be cumbersome to program for a large number of tag reads, although using the HMI
G Wizard makes it easy to build separate loops quickly. The alternative is to poll the
database for several tags at regularly timed intervals. Usually one While Loop is needed
in the diagram to poll the front panel controls to monitor what the operator is doing. By
polling, monitoring of HMI controls can be combined with the reading in of tag values
and alarm states.
22
When the timeout input is left unwired, all Read Tag VIs read the BridgeVIEW
database immediately by default.
Event-driven programming means the diagram waits for one or more events to happen
and, as each event occurs, the part of the program waiting on that event is executed.
In G, applications can be developed that wait on different events and do operations in
parallel by using multiple While Loops in the diagram.
In a multiple-loop application, some initialisation code should be added before
executing the loops, and some cleanup or shutdown code after all the loops finish
executing. The Sequence structure can be used for this purpose.
The initialisation code should be placed in the first frame of the Sequence structure, all
the loops in the second frame of the Sequence structure, and the shutdown code in the
final Sequence. This guarantees that none of the loops start execution until the
initialisation code is complete and that all loops complete execution before the
shutdown code is executed.
Dataflow programming can also be used to enforce sequential operation. In some cases,
the diagram might be easier to read using this technique.
10. DATA LOGGING AND EXTRACTION
A view of data over time is called a trend. Trends can display real-time or historical
data.
A real-time trend is a display of tag values as they are collected in real time over a
relatively short period of time. A real-time trend can be displayed in the HMI by using
the Trend Tags VI or the HMI G Wizard.
A historical trend is a display of tag values that have been logged to disk, usually over a
relatively long period of time. A historical trend can be displayed in the HMI by using
the Get Historical Tag List VI and Read Historical Trend VI from the block diagram or
by the HMI G Wizard. Historical data can also be viewed by launching the HTV utility.
Citadel is a high performance historical database. With Citadel, BridgeVIEW can log
tags while continually servicing data queries.
In order to log historical data the selected tags have to have historical logging enabled, a
path for the historical database has to be configured and the historical logging turned on
for the BridgeVIEW Engine.
There are two methods for viewing historical data that has been logged to disk. One
method is to use the Historical Data VIs and the other is to use the Historical Trend
Viewer (HTV).
BridgeVIEW also includes the Citadel ODBC driver that has special commands to
perform data transforms, helping to retrieve, manipulate, and analyse historical data
automatically from outside the BridgeVIEW environment.
ODBC is a standard developed by Microsoft. It defines the mechanisms for accessing
data resident in database management systems (DBMSs). Virtually all Windows-based
applications can retrieve data from a database supporting ODBC. Microsoft Query,
Excel and Access can be directly used with Citadel.
23
Because Citadel allows simultaneous real-time access by multiple applications, the
ODBC Driver can retrieve data from the Citadel database even while BridgeVIEW is
running. There is no need to interrupt data collection in order to query the database. In
fact, the ODBC Driver allows multiple ODBC applications to perform Structured Query
Language (SQL) queries simultaneously.
The ODBC driver presents Citadel data to other applications as a Threads table. The
table contains a field or column for each data member logged to the Citadel database.
User queries can include special commands that perform data transforms, making it
easy to manipulate and analyse historical data. These data transforms allow direct
calculation and retrieval of complex information from the database such as averages and
standard deviations.
There are several VIs , which can be used in a HMI to manipulate data logged in Citadel
files. These VIs access disk files and do not require the BridgeVIEW Engine to be
running. These VIs can be used to browse files, extract the information in a format that
can be displayed in a Historical Trend indicator, or export the data to a spreadsheet file
format.
11. ALARMS AND EVENTS MANAGEMENT
An alarm is an abnormal process condition pertaining to a tag. In BridgeVIEW, alarms
are generated based on changes in a tag value or status. An event is something that
happens within the BridgeVIEW system. Events can be divided into two groups: those
that pertain to individual tags and those that pertain to the overall BridgeVIEW system.
An example of a tag event is a change of alarm state for a tag. Examples of system
events include a user logging on, the Engine starting up, or historical logging being
turned on.
For analogue tags, an alarm state can be of type HI_HI (very high), HI, LO, or LO_LO
(very low). For all data types (analogue, discrete, bit array, and string), if the server
returns a bad status, and alarming is enabled for that, the tag goes into Bad Status alarm.
All data types except string also support alarms based on tag value. If an analogue tag
exceeds a preconfigured alarm limit, one of these alarms can occur. Discrete and bit
array tags are either not in alarm or in alarm.
The severity of an alarm is indicated by the alarm priority. Priorities range from 1
(lowest) to 15 (highest). The alarms displayed in the HMI can be filtered by group or
tag names, priority and acknowledgement.
The acknowledgment status of alarms can be viewed in the Alarm Summary or Event
History Display. There are two modes for handling tags that were previously in alarm
but have returned to normal: Auto Acknowledge and User Must Acknowledge. These
modes are configured in the Tag Configuration Editor for each tag.
An alarm summary is a collection of all the alarms that currently exist in the system. In
addition, if a tag previously in alarm returns to normal but is unacknowledged, a
notification is posted in the alarm summary. Alarms can be reported to the HMI by
using the Alarm Summary Display and the Read Alarm Summary VI.
24
An event history is a collection of all the alarms and events pertaining to tag values that
have occurred in the BridgeVIEW system since the Engine was started. Recent events
can be reported to the HMI by using the Event History Display and by using the Read
Event History VI from the block diagram. The alarms displayed in the Event History
Display also can be filtered by group or tag names, priority and acknowledgment status.
12. VIDEO AND AUDIO
In order to enhance the quality and the safety of the experiment run on a remotely
controlled lab station, half duplex video and audio feedback will be provided to the user
for observation. The varying bandwidth of the Internet in general does not allow realtime response and realistically we cannot expect a better than 1/s frame rate for a
number of years. The quality of the video/audio feedback will be much higher in the
LAN environment, which can be explored for special type of demonstrations to
students.
The video feedback could be accomplished by adapting LabVIEW compatible machine
vision products from NI, however they do not carry sound and would be grossly underutilised.
The continuous development of webcam technologies suggest that adaptation of
standard videoconferencing software offers a solution which is both more viable
technically and far more cost-effective.
Videoconferencing has been developed under the H.320 umbrella standard which
specifies H.261 for video compression, H.221, H.230, and H.242 for communications,
control, and indication, G.711, G.722, and G.728 for audio signals, and several others
for specialized purposes.
The resolution of a H.261 video image is either 352x288 (known as CIF) or 176x144
(known as quarter-CIF or QCIF). The frame rate can be anything from 30 frames/
second and down. Configurations typically use a 2B or a 6B service, depending on the
desired cost and video quality. In a 2B call, a standard video phone can achieve 15
frames/second at CIF.
A 2B picture seems to be sufficient for remote presentations. Rapidly changing scenes
are not very well handled, but as soon as the picture calms down, the sharpness and
colour quality improves.
H.320 video/audio applications typically allocate 56kbps for audio.
The teleconferencing software would run on a PC located each lab station, in parallel to
the GUI, utilising the LAN to connect to the Central Server computer. A remote user
would obtain the picture and sound corresponding with the selected lab experiment
through the same DataSocket link.
The main sources of videoconferencing software are Intel and CineCom (Connectix).
Intel ProShare Video System 500 is the most comprehensive on the market today and
offers the highest versatility. It works with both ISDN and IP-based
(LAN/intranet/ATM over IP) networks and is independent on LAN physical layer.
The main features of ProShare are:
_ ITU H.323 videoconferencing on the LAN, H.323 bandwidth selectable from
56Kbps to 800Kbps
25
_
_
_
_
_
H.323 gatekeeper support
H.323 proxy/firewall support
ITU T.120 data conferencing
Audio codecs: G.711, G.723, G.728
Video codecs: H.261 FCIF/QCIF, H.263 FCIF/QCIF
ProShare uses dynamic bandwidth allocation for faster, more efficient data sharing, and
provides data sharing tools for exchanging data with other compliant endpoints.
The complete Intel ProShare Video System 500 kit includes camera, microphone and a
single ISDN/audio/video capture card.
The minimum supported platform is 166 MHz Pentium MMX, 32 MB RAM with
Windows9x (48 MB with NT), 80 MB hard disk space (plus 25 MB for caching in local
temp directory), one available PCI slot and one available IRQ for ISDN/audio/video
capture card.
13. LabVIEW RT
Most LabVIEW applications run on general-purpose operating systems like Windows
9x/NT. Some applications require deterministic real-time performance that Windows
9x/NT cannot guarantee.
National Instruments created LabVIEW RT to address the need for deterministic realtime performance in LabVIEW. These real time applications are executed on RT Series
boards, which combine data acquisition with the processing power of a computer.
If a crash occurs on the host PC’s operating system, the user interface is lost, and any
other communication between an embedded LabVIEW RT application and the host PC
cease. However, embedded LabVIEW RT applications continue to run, even after the
operating system crashes.
The host PC can be soft rebooted without disrupting embedded LabVIEW RT
applications. After rebooting the host PC’s communication with LabVIEW RT can be
reestablished.
The applications can also be designed to retrieve any data that was collected on the RT
Series board while the host PC was not in communication with the RT Series board.
LabVIEW RT can rival the real time operating systems providing POSIX compliant real
time control.
LabVIEW RT consists of two components: the RT Development System and the RT
Engine, which communicate with each other via the built-in communication channel.
The RT Development System initialises the board, downloads VIs to the RT Series
hardware, and provides a user interface for debugging LabVIEW RT applications. The
RT Engine runs on the RT Series hardware and executes the LabVIEW RT VIs in realtime.
There are indications that within the next six month LabVIEW RT will be able to be
downloaded to a FieldPoint Ethernet I/O bank.
26
14. MOTION CONTROL AND MACHINE VISION
The ability of BridgeVIEW to connect to hardware directly from LabVIEW opens up
the whole range of devices, which are not well handled by conventional SCADA
systems. The devices that are currently accessible from LabVIEW, of most significance
to Telelabs, include motion control and image processing systems.
The National Instruments motion product line offers a wide array of application
development tools for Windows NT/98/95. Software like pcRunner or FlexCommander,
available free of charge, assist in system set up. The ServoTune software simplifies the
setting of PID loop servo parameters.
A complete set of powerful motion functions are implemented as fully functional virtual
instruments. The Motion VI libraries for LabVIEW and BridgeVIEW include ready to
run, high-level, multiaxis control VIs.
The LabVIEW application development environment combined with the new National
Instruments interactive vision software – IMAQ Vision create a new approach, that
significantly reduces the time and cost involved in developing a vision application.
It allows for interactive tests of different vision functions with no programming, can
acquire and manage large numbers of images with an image browser.
IMAQ Vision functionality includes inspection, measurement and gauging, pattern
matching, colour matching, blob analysis, image enhancement.
27
15. RECOMMENDATIONS
Using BridgeVIEW as the central server application gives maximum flexibility in the
types of I/O that can be connected to, and in the mechanism of connection. All control
and status parameters ultimately pass through the BridgeVIEW database where they can
be centrally processed, alarmed, and logged to disk to provide a historical record.
To minimise software licensing requirements, most local and remote connections to the
BridgeVIEW database should be made from LabVIEW executables using DataSocket
technology.
Most of the lab experiments will not require a very high rate of input update. They will
be controlled by Ethernet enabled FieldPoint modules. These modules connect directly
to tags in the BridgeVIEW database via the BridgeVIEW FieldPoint Server. A single
FieldPoint bank could control multiple experiments. Each experiment will be controlled
by a dedicated LabVIEW executable running on the Central Server. There is a simple
mechanism for automatically creating FieldPoint I/Os as BridgeVIEW database tags.
Some surplus FieldPoint capacity should be installed, and all the I/Os, including unused
ones, be created as tags. The unused tags can be activated for diagnostic purposes.
Some lab experiments will require high performance control for high-speed data
acquisition, motion control or sophisticated real-time data analysis. These stations will
be controlled by a LabVIEW executable running on a local PC, operating specialised
hardware. This LabVIEW application will communicate setpoints, control parameters,
and status values to the central BridgeVIEW database via a transparent DataSocket
server running on the local PC. The data on the DataSocket server is linked to tags in
the BridgeVIEW database through a dedicated LabVIEW executable that runs in the
background on the central BridgeVIEW server.
The proposed arrangement of the system, as shown in Fig. 2, was presented to Icon
Technologies for physical evaluation. They were able to demonstrate a fully operational
system comprising of central BridgeVIEW server, a FieldPoint bank monitoring a
slowly changing voltage input, and a PC running a LabVIEW executable simulating a
PID loop. The demonstration code is available for the Telelabs project for further
development (implying that a BridgeVIEW licensing agreement is reached).
Icon Technologies have also recommended that the LabVIEW application and
DataSocket server on the local PC be invoked from the central server, using the VI
Server technology that is built-in to the LabVIEW environment.
The most efficient and cost-effective way to let students access the system is via
LabVIEW executables running DataSocket. Unlimited LabVIEW executables can be
created for students without any additional software license costs.
To enable remote DataSocket access, a LabVIEW executable will be run on the central
BridgeVIEW server that interfaced all the tags in the BridgeVIEW database to a local
DataSocket server. Students would connect to this DataSocket server from their remote
client applications. The remote clients could then write setpoints and control parameters
to the DataSocket server, and these would in turn be written to tags in the BridgeVIEW
database.
28
Remote or local user PC
with access to the network
LabVIEW executable
providing GUI for each lab experiment
via Data Socket
LabVIEW executable connecting all BridgeVIEW database
tags to a local DataSocket Server that can be accessed by
any DataSocket aware client on the network
BridgeVIEW
Professional Development System
BridgeVIEW
FieldPoint
Server
LabVIEW executable connecting
controller PC I/O points
to tags in BridgeVIEW database
via DataSocket
Local PC
FieldPoint
Ethernet distributed
I/O bank
Experiments
not requiring high rate
of input update
running a LabVIEW executable
that performs the local control.
It communicates with the central
server via DataSocket to receive set
points and pass status values
Experiment
requiring high performance
control
Fig. 2. Telelabs - functional arrangement.
29
In this scenario, there is no difference between the client application that runs locally on
the PC immediately adjacent to the experiment and the client application that runs on a
remote network PC (including an internet link). All client applications would simply
read and write values to the DataSocket server running on the central BridgeVIEW
server.
This provides the same GUI for all users and simplifies the development and
maintenance of client applications.
Although it is recommend that the clients be LabVIEW executables, any DataSocket
aware application could be used. All National Instruments software environments,
including LabWindows/CVI for C, ComponentWorks for Visual Basic, and
ComponetWorks++ for C++, are DataSocket aware, so could be used to create client
applications if there was some reason for doing so. In particular, ComponetWorks could
be used to create a client application as an ActiveX control, which could be run from
any ActiveX container environment, such as Microsoft’s Internet Explorer Browser.
To minimise network load raw data should only be passed back to the remote client if it
consists of a small number of scalar values. More extensive datasets should, wherever
possible, be processed locally, so that only processed results are passed back through
the BridgeVIEW database.
The BridgeVIEW database can also connect directly to any PLCs, RTUs etc that may be
used from time to time for any reason. The connection is direct to tags in the
BridgeVIEW database via National Instruments supplied devices servers, or via any
industry-standard OPC server interface.
When the network grows larger, technical staff should be able to carry out a range of
configuration and maintenance operations from multiple locations. To enable this a
number of BridgeVIEW Runtime licenses may be required for remote PCs to connect
directly to tags in the BridgeVIEW database running on the Central Server.
Client applications can be developed with two “levels” of access. One level would be
the normal student access. A second level (password protected or similar) would give
staff access to more I/O points for diagnostic purposes.
LabVIEW executables can be run on a variety of operating systems: Windows
2000/NT/9x, Mac OS, Linux, HP-UX, Solaris. However to produce a LabVIEW
executable, the compilation has to be performed in the same operating system as the
target. Icon Technologies have kindly offered help with access to LabVIEW
Development System for Mac OS.
BridgeVIEW requires Pentium-based computer running Windows NT/9x or 2000,
which is based on Windows NT.
At the launch of Windows 2000 Bill Gates quoted a study showing a Windows 95
system needed to be rebooted every two days, a Windows NT system - weekly but
Windows 2000 was still running after 90 days. This is at least an indication of a
substantial improvement in reliability, which combined with the familiar look of
Windows 98 makes Windows 2000 the best choice for the Central Server computer.
30
Microsoft has done an enormous amount of testing on Windows 2000, and supplied
independent tests, which reveal that Windows 2000 is faster than Windows 95and 98 on
systems with 64MB or more of memory. It offers performance comparable with
Windows NT 4.0 with 64MB of memory.
The Windows 2000 family includes Windows 2000 Server, Advanced Server and
Datacentre Server with extra networking and Internet features. They are potentially very
attractive to Telelabs but closer evaluation is required to allow an informed choice.