1
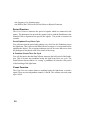
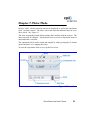
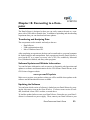
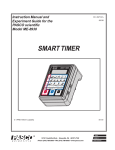
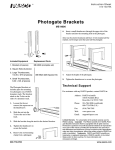
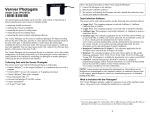
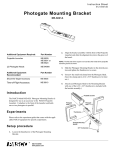
DataCollector designed by:
Thomas S. Narro
in conjunction with:
PRI
Darren Garnier
Copyright © 2009 CPO Science
9/09
Table of Contents
Introduction . . . . . . . . . . . . . . . . . . . . . . . . . . . . . . . . . . . . . . . . . . . . . . . . . . . . . . . . 1
Kit Contents . . . . . . . . . . . . . . . . . . . . . . . . . . . . . . . . . . . . . . . . . . . . . . . . . . . . . . . . 2
Getting Started . . . . . . . . . . . . . . . . . . . . . . . . . . . . . . . . . . . . . . . . . . . . . . . . . . . . . 3
Features of the DataCollector . . . . . . . . . . . . . . . . . . . . . . . . . . . . . . . . . . . . . . . . . . . . . . 3
Powering the DataCollector . . . . . . . . . . . . . . . . . . . . . . . . . . . . . . . . . . . . . . . . . . . . . . . 3
Port Identification . . . . . . . . . . . . . . . . . . . . . . . . . . . . . . . . . . . . . . . . . . . . . . . . . . . . . . . . 4
Using the DataCollector . . . . . . . . . . . . . . . . . . . . . . . . . . . . . . . . . . . . . . . . . . . . . . 5
Starting the DataCollector Application . . . . . . . . . . . . . . . . . . . . . . . . . . . . . . . . . . . . . . . 5
Icon Overview. . . . . . . . . . . . . . . . . . . . . . . . . . . . . . . . . . . . . . . . . . . . . . . . . . . . . . . . . . . 6
Data Collection Mode . . . . . . . . . . . . . . . . . . . . . . . . . . . . . . . . . . . . . . . . . . . . . . . . 9
Starting an Experiment . . . . . . . . . . . . . . . . . . . . . . . . . . . . . . . . . . . . . . . . . . . . . . . . . . . . 9
Data Collection: Meter Window . . . . . . . . . . . . . . . . . . . . . . . . . . . . . . . . . . . . . . . . . . . 10
Data Collection: Table Window. . . . . . . . . . . . . . . . . . . . . . . . . . . . . . . . . . . . . . . . . . . . 11
Data Collection: Graph Window . . . . . . . . . . . . . . . . . . . . . . . . . . . . . . . . . . . . . . . . . . . 12
Data Collection: Setup Window . . . . . . . . . . . . . . . . . . . . . . . . . . . . . . . . . . . . . . . . . . . 13
CPO Timer Mode. . . . . . . . . . . . . . . . . . . . . . . . . . . . . . . . . . . . . . . . . . . . . . . . . . . 17
Overview of Functions and Features . . . . . . . . . . . . . . . . . . . . . . . . . . . . . . . . . . . . . . . . 17
Interval Function . . . . . . . . . . . . . . . . . . . . . . . . . . . . . . . . . . . . . . . . . . . . . . . . . . . . . . . . 18
Frequency Function. . . . . . . . . . . . . . . . . . . . . . . . . . . . . . . . . . . . . . . . . . . . . . . . . . . . . . 18
Period Function. . . . . . . . . . . . . . . . . . . . . . . . . . . . . . . . . . . . . . . . . . . . . . . . . . . . . . . . . 19
Count Function . . . . . . . . . . . . . . . . . . . . . . . . . . . . . . . . . . . . . . . . . . . . . . . . . . . . . . . . . 19
Meter Mode . . . . . . . . . . . . . . . . . . . . . . . . . . . . . . . . . . . . . . . . . . . . . . . . . . . . . . . 20
Stopwatch Mode. . . . . . . . . . . . . . . . . . . . . . . . . . . . . . . . . . . . . . . . . . . . . . . . . . . . 21
Interval vs. Standard Mode . . . . . . . . . . . . . . . . . . . . . . . . . . . . . . . . . . . . . . . . . . . 22
Interval Mode . . . . . . . . . . . . . . . . . . . . . . . . . . . . . . . . . . . . . . . . . . . . . . . . . . . . . . . . . . 22
Standard Mode . . . . . . . . . . . . . . . . . . . . . . . . . . . . . . . . . . . . . . . . . . . . . . . . . . . . . . . . . 23
Choosing a Mode . . . . . . . . . . . . . . . . . . . . . . . . . . . . . . . . . . . . . . . . . . . . . . . . . . . . . . . 24
Connecting to a Computer . . . . . . . . . . . . . . . . . . . . . . . . . . . . . . . . . . . . . . . . . . . 26
Transferring and Analyzing Data . . . . . . . . . . . . . . . . . . . . . . . . . . . . . . . . . . . . . . . . . . . 26
Software Updates and Website Information . . . . . . . . . . . . . . . . . . . . . . . . . . . . . . . . . . 26
Updating the Software . . . . . . . . . . . . . . . . . . . . . . . . . . . . . . . . . . . . . . . . . . . . . . . . . . . 26
Warnings and Precautions . . . . . . . . . . . . . . . . . . . . . . . . . . . . . . . . . . . . . . . . . . . . 28
Chapter 1: Introduction
The CPO Science DataCollector is a device used to easily view and record data
from various sensors, including analog sensors from Fourier Systems and Vernier,
as well as photogates from CPO Science. Figure 1 shows the components used to
collect data in a typical experiment.
Sensors plug directly into the DataCollector, and the unit’s color touch-screen displays instant and accurate readings. During an experiment you can:
•
•
•
•
start and stop data collection
view live data
view a live graph of the data
view the experiment name and details
Once data has been collected, it can be analyzed in graph or table form directly on
the DataCollector. Or, data can be transferred to a computer for further analysis.
Figure 1: Data Collection Components
DATACOLLECTOR USER’S GUIDE
1
Chapter 2: Kit Contents
There are two different configurations of the DataCollector available. These are
summarized in the table below.
Table 1: DataCollector Kits
DataCollector 2
Solo
DataCollector 2
with Photogates
Part #792-1600
Part #792-1610
Includes:
• DataCollector
• hard carrying case
• AC adapter
• User's Guide
• stylus (2)
• USB cable
Includes:
• DataCollector
• hard carrying case
• AC adapter
• User's Guide
• stylus (2)
• USB cable
• CPO Science Photogates (2)
• red phone cord
• blue phone cord
2
Chapter 3: Getting Started
Use the following diagrams and information to familiarize yourself with the CPO
Science DataCollector.
Features of the DataCollector
Figure 2 shows the parts of the DataCollector.
Figure 2: DataCollector Parts
Powering the DataCollector
The DataCollector is powered by the CPO Science 9V power adapter (included).
Alternatively, it may be powered by a 9V battery. Using the power adapter is recommended, as battery life may be limited.
DATACOLLECTOR USER’S GUIDE
3
Figure 3: DataCollector Port Identification
Port Identification
The DataCollector has six ports on the rear of the enclosure, shown in Figure 3.
The analog ports are labeled Sensor 1 and Sensor 2. Most sensors will connect
through these ports.
The digital ports are labeled Photogate A and Photogate B, as they are primarily
intended for use with CPO Science Photogates. However, the CPO Science
Sound & Waves also connect through these ports. Connect to these ports with the
supplied phone cords. These are the same cords and photogates used with the CPO
Science Timer.
The USB port is used to connect the DataCollector to a computer to transfer data
with a USB cable (included). In addition to uploading and downloading experiment data, you can also download DataCollector software updates.
4
Chapter 4: Using the DataCollector
Starting the DataCollector Application
After powering on the DataCollector as described in the section “Powering the
DataCollector” on page 3, start the DataCollector application by pressing the Go
button on the enclosure for a few seconds. You will be greeted with the Home
Window, as shown in the figure below.
Figure 4: Home Window
From this window, you will access the four different modes of the DataCollector.
These modes will be discussed in detail in the following chapters:
•
•
•
•
Data Collection Mode - Collect, store and analyze data
CPO Timer Mode - Functions as a CPO Timer for photogate and Sound &
Wave experiments
Meter Mode - Displays live data
Stopwatch Mode - Used as a stopwatch only
DATACOLLECTOR USER’S GUIDE
5
Icon Overview
The following section summarizes the icons that are commonly used in the DataCollector.
At the bottom of the Home Window there is a toolbar (see Figure 4, page 5). The
icons in this toolbar are listed in Table 2, below.
Table 2: Home Window Toolbar Icons
Icon
Meaning
Returns to the previous window
Indicates a running experiment or a stopped one
Sets default preferences for DataCollector. Also
sets name of unit.
Access to help topics
Information about the DataCollector, including
software version number.
6
While conducting an experiment, a status bar is shown at the top of
the screen. The status bar contains buttons to easily access the Home and Help
Windows. It also displays a variety of indicators which are summarized in Table 3.
Table 3: Status Bar Icons
Icon
Meaning
Return to Home Window
Indicates an analog sensor is connected to “Sensor 1” port. Black indicates the sensor is used in
an active experiment. Gray indicates the sensor is
plugged in, but inactive.
Indicates an analog sensor is connected to “Sensor 2” port. Black indicates the sensor is used in
an active experiment. Gray indicates the sensor is
plugged in, but inactive.
Displays the rate for Standard Mode experiments.
The default rate is 1 Hz. For more information on
rates, see “Rate” on page 16.
Indicates the experiment is in Interval Mode.
Indicates a running experiment or a stopped one
Displays an experiment’s sample size. The
default sample size is 500 samples. For more
information on sample size, see “Samples” on
page 15.
DATACOLLECTOR USER’S GUIDE
7
Table 3: Status Bar Icons
Icon
Meaning
Indicates a continuous experiment. Data
collection continues until user manually stops
experiment. See “Rate” on page 16.
Indicates the data set is locked.
Indicates a digital sensor is connected to “Photogate A” port. Black indicates the sensor is used in
an active experiment. Gray indicates the sensor is
plugged in, but inactive.
Indicates a digital sensor is connected to “Photogate B” port. Black indicates the sensor is used in
an active experiment. Gray indicates the sensor is
plugged in, but inactive.
Access help topics
8
Chapter 5: Data Collection Mode
Data Collection Mode is used to collect, record and analyze data. After selecting
“Data Collection” from the Home Window, you are greeted with the following
screen (Figure 5).
Figure 5: Data Collection: Go! Window
Starting an Experiment
The DataCollector is designed so that you can immediately begin a new experiment by simply tapping “Go!”. Starting a new experiment in this manner utilizes
the default settings of the DataCollector. The experiment’s sampling rate and sample size are noted in the status bar. For more information on sample rate and size,
see “Samples” on page 15 and “Rate” on page 16.
If a special setup is required, select Setup at the bottom of the Go! Window. For
more information on settings see “Data Collection: Setup Window” on page 13.
DATACOLLECTOR USER’S GUIDE
9
Alternatively, you may choose to open an old experiment. This is done by tapping
Files at the bottom of the Go! Window.
Data Collection: Meter Window
Once an experiment begins in Data Collection Mode, the Meter Window appears
(Figure 6).
Figure 6: Data Collection: Meter Window
The Meter Window displays the current readings for active sensors. The clock at
the bottom of the window shows the amount of time elapsed for the current experiment.
In this example (Figure 6), two temperature probes are plugged in. The DataCollector is able to automatically identify the sensors and load default unit settings if
the sensors are plugged in at the time the experiment is started.
To stop an experiment, push the Go button on the enclosure. The time at the bottom of the screen will stop. The running man in the status bar will switch to a stop
sign, indicating the experiment has stopped.
When an experiment is stopped, the last readings are frozen and displayed in black
boxes at the right of the screen. The Meter Window will continue to show current
sensor readings.
10
To resume the experiment, push the Go button on the enclosure.
When the experiment is resumed, the last readings will disappear.
To switch to a different window within Data Collection Mode, tap the desired window tab at the bottom of the screen.
Data Collection: Table Window
The Table Window shows data in the current experiment (Figure 7). If the experiment is in-progress, data in the table is updated as it’s collected.
The row above the header row displays live data, similar to the Meter Window.
The rows below the header display collected data. Use the scroll bar or arrows at
the right of the screen to scroll through all data points.
It is possible to delete a row of data from the table. This is done by double tapping
on the row of data you wish to delete. You will then be prompted with a pop-up
window to confirm deletion. Note: Deletion is permanent and cannot be undone!
In the Table Window, you may determine how your data is graphed. At the bottom
of each column are three buttons labeled X, Y1, or Y2. To set a column as the data
source for the X-axis in the graph, tap the X button below that column. Follow the
same procedure for selecting the Y1 or Y2 data source. Although four columns of
data may be collected in the table, only two lines may be graphed at a time.
Figure 7: Data Collection: Table Window
DATACOLLECTOR USER’S GUIDE
11
Data Collection: Graph Window
The Graph Window (Figure 8) graphs data from the current experiment using settings from the Table Window. If the experiment is in-progress, the graph is plotted
as data is collected.
Figure 8: Data Collection: Graph Window
Two different lines may be graphed simultaneously. Using the Pointer, you may
select a point on a line and learn its precise coordinates. The points will appear in
the gray, pink and blue boxes at the right of the screen. The y-coordinate in the
pink box correlates with the pink line, and the y-coordinate in the blue box coordinates with the blue line. Only one x-coordinate may be selected at a time.
To quickly scroll through large areas of the graph, use the Pan tool. To scroll
through point-by-point, use the Scroll arrows.
Selecting the Full Screen icon changes the view so that the graph is enlarged. This
is shown in Figure 9. The toolbar floats in this view, so you may move it if it interferes with your graph. To return to the previous view, select the Normal Screen
icon.
12
Figure 9: Data Collection: Graph Window - Full Screen
Data Collection: Setup Window
In the Setup Window (Figure 10), you will see the settings for the current experiment. Should you wish to restart an experiment using these settings, press “Go!”.
If you would like to change the settings before starting a new experiment, press
“Modify”.
Figure 10: Data Collection: Setup Window
DATACOLLECTOR USER’S GUIDE
13
After selecting “Modify”, you will see the following window.
Figure 11: Data Collection: Modify Setup Window
From here, you can change the file name, select the experiment mode, change the
sampling rate and size, turn sensors on and off, and select units.
File name
The default file name is Experiment. Without renaming the files, the experiments
are numbered sequentially. To rename an experiment, double tap on the current
experiment name. This will open a keyboard window in which you can create a
new name. See Figure 12.
14
Figure 12: Data Collection: Rename Experiment Window
Mode
There are two different types of experiments you can run: Interval Mode or Standard Mode experiments. Interval Mode is the default setting. To change modes,
tap the down arrow to see the drop-down menu and make a mode selection.
Interval Mode experiments use photogates, or other digital sensors, to record time
intervals only. Standard Mode experiments record values from digital or analog
sensors on a regular basis. Refer to “Interval vs. Standard Mode” on page 23. for
more information on these modes.
Samples
“Samples” refers to the number of data points that will be recorded in the experiment. The experiment will run until the experiment is stopped manually, or until
the sample size is reached. In the DataCollector, the sample sizes range from 10 2,000. The default sample size is 500. Tap the down arrow to see the drop-down
menu and select your desired sample size.
If Continuous is selected, the DataCollector will continue to take measurements
until you stop the experiment. However, only the most recent 500 data points will
stay in the record.
DATACOLLECTOR USER’S GUIDE
15
Rate
The Rate setting controls how often the DataCollector takes measurements in
Standard Mode. The DataCollector has rates from 1 - 2,000 Hz. The default rate
setting is 1 Hz. Tap the down arrow to see the drop-down menu of sampling rates
and make a selection. The sampling rate is indicated in the status bar of Data Collection Mode.
If you are operating in Interval Mode, the rate will read “N/A”.
Sensor 1 & Sensor 2
The DataCollector automatically detects and identifies sensors when they are
plugged in. If a sensor is plugged into the Sensor 1 port, its name will appear next
to Sensor 1 in the Setup Window. The default units for the sensor will also appear.
The units can be changed by tapping the down arrow and selecting alternative
units.
To turn the sensor off, select “None” from the drop-down menu.
If no sensor is plugged in, it will read “None”.
Photogate A & Photogate B
The DataCollector automatically detects when photogates are plugged in. If a photogate is plugged into the Photogate A or Photogate B port, you may select the
function of the photogate from the drop-down menu. Or, you may select to turn
the photogate off by selecting “None”.
If you have chosen to operate in Standard Mode, you may select one of the following functions from the drop-down menu: Period, Frequency or Count. For
detailed information on these functions, see “CPO Timer Mode” on page 17.
If you have chosen to operate in Interval Mode, you must use the Interval function.
If no photogates are plugged in, “None” will be displayed.
16
Chapter 6: CPO Timer Mode
Overview of Functions and Features
CPO Timer Mode works like the CPO Timer for photogate and Sound & Wave
experiments. The photogate icon in the status bar indicates you are in CPO Timer
Mode.
There are four different functions in CPO Timer Mode: Interval (I), Frequency (f),
Period (p) and Count (#). The function is selected by tapping the desired function
button at the bottom of the screen. The current function is noted in the status bar.
See Figure 13.
Figure 13: CPO Timer Mode: Interval Function
DATACOLLECTOR USER’S GUIDE
17
The Reset button, at the bottom of the window, is used to clear all readings, and
resets the current value to zero.
The Memory button is a feature available only in Interval Function. Pressing
Memory shows the previous reading in a black box, to the right of the current reading. The memory reading is toggled on and off by tapping the Memory button.
Pressing Reset clears the values stored in the memory.
Similar to Memory, the Hold feature is used in Frequency, Period and Count
Functions. Pressing the Go button on the enclosure holds the value taken at the
instant the button is depressed, and displays it in a black box at the right of the
screen. The held value stays until either the reset button is hit or the Go button is
pressed again. Pressing the Go button again replaces the held value with a new
reading.
Interval Function
The Interval Function uses one or two photogates to record time intervals. This
window is displayed in Figure 13. There are three ways to use the Interval Function: using Photogate A only, using Photogate B only, or using both Photogate A
and Photogate B. These uses are depicted in Figure 14 on page 19.
Using only one photogate plugged into the Photogate A port, the DataCollector
records the time that photogate A’s beam was interrupted. The time measurement
begins when the light beam is broken in photogate A, and stops when the light
beam is unbroken again. This time is labeled TA.
Using only one photogate plugged into the Photogate B port, the DataCollector
records the time that photogates B’s beam was interrupted. This time is labeled
TB.
With two photogates plugged in, the DataCollector reports times for both photogates, as well as the time between interrupting photogate A’s beam and photogate
B’s beam.
18
Figure 14: Time Intervals and Photogates
Frequency Function
In CPO Timer Mode, the DataCollector can measure the frequency of anything
that breaks the light beams in the photogates regularly, or the frequency of signals
applied to the inputs, such as those from the CPO Sound & Waves machine. The
highest frequency that can be measured is 19,999 Hz and the lowest is 0.1 Hz. For
very low frequencies (<100 Hz) it is more accurate to use the Period Function,
measure the period (T), and invert (f = 1/T).
Frequency Function can also be used to measure:
• the angular speed of a rotating gear
DATACOLLECTOR USER’S GUIDE
19
• the frequency of a vibrating string
• the RPM of the CPO Science Electric Motor or Ripcord Generator
Period Function
The Period Function measures the period of signals which are connected to the
inputs. The photogates can provide the signals (such as with the Pendulum) or the
Sound & Waves experiment can provide the signals. The period is measured in
seconds.
Period Updates Every Other Cycle
You will notice that the period only updates every third time the Pendulum crosses
the light beam. This is because the DataCollector averages over two periods before
updating the display. The averaging technique corrects for errors that occur when
the photogate is not placed at the exact center of the swing.
A Pendulum Crosses Twice Per Cycle
You will also notice that the DataCollector measures the half period of the Pendulum. This is because the pendulum breaks the light beam twice per cycle. The
DataCollector does not know it is “seeing” a pendulum; all it knows is the period
of the breaking of the light beam.
Count Function
The Count Function counts whenever anything breaks the light beam, or sends a
signal. There are two independent counters: A and B. The counters can each count
up to 19,999.
20
Chapter 7: Meter Mode
In Meter Mode, current values for sensors are displayed, as well as the experiment
clock. No data is stored. The Meter icon in the status bar indicates that you are in
Meter Mode. See Figure 15.
The units are populated with default settings that corollate with the sensors. The
units can easily be changed. Tap the down arrow to access a drop-down menu of
units and make a selection.
The experiment clock can be started and stopped by either pressing the Go button
on the enclosure, or by tapping Start/Stop.
To reset the experiment clock to zero, tap the Reset icon.
Figure 15: Meter Mode
DATACOLLECTOR USER’S GUIDE
21
Chapter 8: Stopwatch Mode
In Stopwatch Mode, the DataCollector functions solely as a stopwatch. The Stopwatch icon in the status bar indicates you are in Stopwatch Mode.
The clock is started and stopped by either pressing the Go button on the enclosure,
or by tapping Start/Stop.
To reset the clock, tap Reset.
Figure 16: Stopwatch Mode
22
Chapter 9: Interval vs. Standard Mode
Interval Mode experiments use photogates, or other digital sensors, to record time
intervals only. Standard Mode experiments record values from digital or analog
sensors on a regular basis.
Interval Mode
Use Interval Mode to record time intervals with digital sensors such as photogates.
With Photogate A enabled, the DataCollector records the time that photogate A’s
beam was interrupted - this time is labeled TA. Photogate B is ignored.
With Photogate B enabled, the DataCollector records the time that photogate B’s
beam was interrupted - this time is labeled TB. Photogate A is ignored.
With Photogate A + Photogate B enabled, the DataCollector reports times for both
photogates, as well as the time between interrupting photogate A’s beam and photogate B’s beam. This third time is labeled TAB.
Standard Mode
Use Standard Mode to make frequency, period or count measurements with digital
sensors and/or make measurements with analog sensors.
The DataCollector records data until the selected number of samples has been
reached. However, if Samples is set to Continuous, the DataCollector will not stop
the current experiment on it's own - stop it by pressing the Go button on the enclosure.
IMPORTANT: In continuous mode, the experiment will
proceed until you stop it, but the DataCollector will only
record the most recent 500 data points.
Use the Rate setting to control how often the DataCollector takes measurements in
Standard Mode. You should set this sampling period to be larger than the typical
period you will measure with any sensor. For example: to measure a pendulum
with a characteristic period of 3 seconds, set the rate to at least 5 seconds/sample.
DATACOLLECTOR USER’S GUIDE
23
IMPORTANT: The DataCollector will record a maximum of
three sensors. If you choose to record two digital signals (Photogate A and B) in Standard Mode, you can only record data
from one analog sensor.
To use both analog sensors (Sensor 1 and Sensor 2), ensure that none is selected
for at least one of Photogate A or B.
For more information on selecting these settings, see “Data Collection: Setup Window” on page 13.
Choosing a Mode
Use Table 4 to help you decide between Interval and Standard Mode.
Table 4: Choosing between Interval and Standard Mode
If you want to...
Just...
...measure only intervals
with photogates
select Interval Mode.
...record frequencies,
periods, or counts with a
photogate
select Standard Mode. If applicable, select a sampling period that is larger than the typical period
you will measure.
...record data from one
analog sensors
select Standard Mode.
...record data from two
analog sensors
select Standard Mode, and ensure that none is
selected for at least one of Photogate A or B.
...look at data from sensors or photogates, but
not record it
use CPO Timer Mode or Meter Mode
24
Chapter 10: Connecting to a Computer
The DataCollector is designed so that you can easily connect the unit to a computer with a USB cable to transfer data. In addition to uploading and downloading
experiment data, you can download software updates.
Transferring and Analyzing Data
The components used to transfer and analyze data are:
•
•
•
DataCollector
USB synchronization cable
Mac or Windows-based PC
After completing an experiment, the data can be transferred to a personal computer
for further analysis and manipulation. Each experiment from the DataCollector is
saved on the PC as a comma separated value (CSV) file, readable by Microsoft
Excel, Mathworks Matlab, and many other programs.
Software Updates and Website Information
You can find more information, such as answers to frequently asked questions and
updates to software and documentation for the CPO Science DataCollector, at the
CPO Science Support website:
www.cpo.com/DCupdates
Make sure to register your product so that you will be notified when updates to the
software and documentation become available
Updating the Software
You can learn which version of software is loaded on your DataCollector by pressing the Information icon on the Home Window. If a more recent version is available, download it from CPO’s website, as noted above.
To load the updated software onto your DataCollector, first make sure your DataCollector is connected to a power supply. Then, connect your DataCollector to your
DATACOLLECTOR USER’S GUIDE
25
computer using the included USB cable. Your computer should automatically recognize the device.
Next, simply drag and drop the software file from its saved location onto the DataCollector.
Safely disconnect your DataCollector from the computer. The DataCollector will
automatically install the software updates.
26
Chapter 11: Warnings and Precautions
Please make note of the following warnings and precautions. Failure to follow
these guidelines can result in damage to your DataCollector and possibly bodily
harm.
IMPORTANT: Use only the 9V DC adapter with the DataCollector that has the CPO Science name/logo on it.
IMPORTANT: Do not over-tighten the thumbscrew on the
photogates. Over-tightening can flex the body of the photogate
enough that the light emitter and receiver twist out of alignment,
causing the photogate to malfunction.
WARNING: Do not plug any lines from the telephone system in
to the DataCollector’s Analog or Digital ports. Telephone rings
(also present with modems) generate large voltages that can
damage or destroy the DataCollector.
WARNING: Computer data cables have the same (RJ-11) connectors and look like the telephone cords used with photogates, but
are wired differently inside. Using a data cable will ruin the
photogates.
WARNING: When using the DataCollector, be sure not to exceed
the specifications on the voltage, current or other sensor(s) being
used. This can damage the sensor or cause serious injuries
DATACOLLECTOR USER’S GUIDE
27
Warranty Information
CPO Science warranties this instrument against defects in materials and
workmanship for a period of one year. Repair and/or replacement parts can
be obtained from CPO Science by sending the damaged or defective parts to:
CPO Science
80 Northwest Blvd.
Nashua, NH 03063
1-800-258-1302
support.cpo.com
Be sure to fill out the warranty card that came with your kit or register online
to receive important information and notification of software updates.