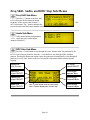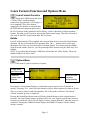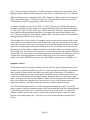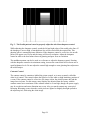
1
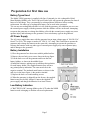
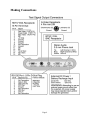
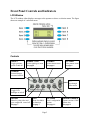
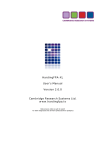
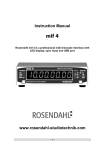
VP300
VideoPro
Multimedia Video Generator
Operation Manual
(Firmware version 2.00)
SENCORE, INC.
3200 Sencore Drive, Sioux Falls, SD 57107
Table of Contents
Specifications ................................................................................................................2
Battery Information and Installation .............................................................................3
Making Connections .....................................................................................................4
Front Panel Controls and Indicators ..............................................................................5
Signal Type, Format, and Pattern Menus ......................................................................6
Pattern Description and Usage ......................................................................................7
Gating Menu ................................................................................................................17
Test Menu ....................................................................................................................17
Sequence Sub-Menu...............................................................................................18
Burn-In Sub-Menu .................................................................................................18
Horizontal Frequency Shift Sub-Menu..................................................................19
Audio Sub-Menu ...................................................................................................19
DDC Step Sub-Menu .............................................................................................19
ColorPro Sub-Menu ...............................................................................................20
Options Menu ..............................................................................................................21
Learn Formats Menu ...................................................................................................21
Appendix A - Calibrating TV User Controls ...............................................................22
Brightness Control..................................................................................................22
Sharpness Control...................................................................................................23
Contrast Control.....................................................................................................24
Color Control..........................................................................................................25
Hue Control............................................................................................................26
Appendix B - Video Display White Balance Adjustment ...........................................28
Entire Contents Copyright ©2001
Sencore, Inc. All rights reserved
Page 1
Specifications
Video Formats:
Audio Outputs
Storage: 100 Total
Connector: 2.5mm stereo phone jack
See page 4 for wiring information
Factory Default Formats:
HDTV – 720p59, 720p60, 1080i25, 1080i29,
1080i30, 1080p50, 1080p59, 1080p60
SDTV – 480i29, 480i30, 480p59, 480p60
VESA/Mac – 38 standard formats from
640x350 to 1920x1440
NTSC – standard NTSC, luminance only NTSC
PAL – standard PALm, luminance only PALm
Signals:
Left - 1 kHz tone
Right - 2 kHz tone
User Interface
Display:
Buttons:
20x4 character backlit LCD
9 function buttons, 8 Menu buttons,
2 page scroll buttons.
See page 5 for more information.
Computer Interface
Patterns
Type:
White Raster, Black Raster, Crosshatch, Overscan,
Regulate, Window (8 IRE levels), Focus, Color Bar,
Split Bar, SMPTE Bar, Staircase, Checker, Pluge,
Multiburst, Ramp, ANSI Gray
Protocol:
VESA EDID/DDC Support
Reads a monitor's EDID data and displays a list of
VESA formats supported. DDC Step function cycles
through supported formats.
Horizontal Timing
Frequency:
Total Pixels:
Active Pixels:
1 kHz to 250 kHz
144 to 4096
16 to 4096
Battery Power Operation
Type:
Vertical Timing
Frequency:
Active Lines:
Scan Types:
RS-232, DTE, 9 pin D-sub
See page 4 for pinout
9600 Baud, 8-N-1, Xon/Xoff
1 Hz to 650 Hz
1 to 4096
Progressive, 2:1 Interlace
Use Time:
Four internal AA batteries.
1500 ma/H rated rechargeable NiMH
batteries supplied with unit.
8 hours with supplied NiMH batteries
when fully charged
Sync Types
AC Power Operation
Separate Digital Horizontal and Vertical Sync
Digital and Analog Composite Sync
Tri-level HDTV Sync
Type:
Video Outputs
Size and Weight
HDTV:
SDTV:
VESA/Mac:
NTSC:
PAL:
Size:
External Charger / Power Supply
supplied with unit
AC Input Range: 86 to 250 VAC @ 46 to 66 Hz
YPbPr, RGBHV
YPbPr, RGBHV
RGBHV
Composite, S-Video
Composite, S-Video
Weight:
Timing Accuracy: 2%
Connectors:
See diagram on page 4.
Page 2
5.5 x 8.25 x 2 inches
140 x 210 x 51 mm
4 lbs. w/ supplied batteries installed
Preparation for first time use
Battery Types Used
The Model VP300 generator is supplied with four (4) internal size AA rechargeable Nickel
Metal Hydride (NiMH) cells. These 1500 mA/H rated cells will operate the generator for about 8
hours on a full charge. They can normally be recharged about 1000 times before needing
replacement. No other type of rechargeable battery can be used in the generator!
You can use non-rechargeable alkaline AA cells with the generator, provided that you never use
the external power supply with the generator while the alkaline cells are in the unit. Attempting
to operate the generator or recharge the alkaline cells with the external power supply may cause
operator injury and/or damage to the generator! Never mix battery types in the generator.
AC Power Supply
The AC power supply that comes with the generator has an input voltage range of 100-240 VAC
from 47 to 63 Hz. The output is rated at 9.0 VDC @ 1.67 Amp. This is sufficient to operate the
generator and recharge the batteries at the same time. Attempting to operate the generator or
recharge the batteries with any other type of external power supply may cause operator injury
and/or damage to the generator!
Battery Installation
1) Place the generator face down on a suitable padded surface.
2) Remove the two back cover screws shown in the top figure.
3) Lift the back cover off the generator and locate the four
battery holders, as shown in the middle figure.
4) Install the batteries, making sure to match up their polarities
for each battery holder. The supplied batteries may not have
any printed polarity indication. The outer metal can is the
negative terminal. The insulated metal button, as shown in the
end view in the lower figure, is the positive terminal.
5) Replace the back cover and retaining screws.
6) When the generator is shipped from the factory, the supplied
batteries may not be fully charged. Connect the supplied AC
power supply and charge the batteries for at least 8 hours.
Low Battery Indication
A "BATTERY LOW" message blinks on the LCD when the NiMH
batteries need recharging or alkaline cells need replacement.
Page 3
Making Connections
Page 4
Front Panel Controls and Indicators
LCD Window
The LCD window either displays messages to the operator or shows a selection menu. The figure
shows an example of a selection menu.
Controls
ON/OFF
SIGNAL TYPE
FORMAT
PATTERN
Toggle generator
power on and off
Video signal types menu
See page 6
Video formats menu
See page 6
Video patterns menu
See page 6
CHARGE
External charger
connected when lit
+/Page through
menu screens
BACKLIGHT
Toggle LCD
backlight on and off
GATING
TEST
OPTIONS
LEARN FORMATS
Menu for gating video and
sync components on and off
See page 7
Menu of available
test functions
See page 7
Unit’s configuration
options
See page 11
Capture monitor’s DDC
format data
See page 11
Page 5
Signal Type, Format, and Pattern Menus
Signal Type Menu
Select one of the video types shown,
then press the FORMAT button to display a
menu list of matching formats. The format
list can be scrolled to select formats of other
video types.
NOTES:
VESA/Mac = Red, Green, Blue component color video per VESA and Apple standards.
(VGA connector used for all outputs)
NTSC/PAL = Composite color baseband video signal (BNC connector) and Separate
Luminance and Chrominance video signals (S Video connector) or RGB component video (VGA
connector) per NTSC and PAL standards
HDTV/SDTV YPbPr = Luminance plus color difference signals per EIA standards
HDTV/SDTV RGB = RGB component color video signals per EIA standards
USER = User defined video formats
Format Menu
Select from the list of all (factory
default and user defined) video formats stored
in the generator's memory. Use the +/buttons to page through the list. For the
future, custom editing software is planned to
allow you to add your own formats. A total of 100 video formats can be stored in the generator's
non-volatile memory. Unused locations are labeled on the format menu as being empty.
Pattern Menu
Select from the list of available
patterns. Use the +/- buttons to page through
the menu screens.
Page 6
Pattern Description and Usage
SMPTE Bar
Pattern Description: The upper two-thirds of the pattern consists of seven equal-width vertical
bars, with 75% white (gray) at left, followed by three primary and three seconday colors. Color
bars are at 100% saturation with 75% amplitude. Just below these bars is a section of short bars
containing the blues complement color for each of the large bars containing blue. Under those
color bars containing no blue (yellow, green, and red), the short bar is black. The bottom onefifth of the pattern consists of the following seven signals, starting from left to right; 1) -I, 2)
100% white, 3) -Q, 4) black, 5) slightly blacker than black (0 IRE for NTSC, -4 IRE for other
formats), 6) black, 7) slightly whiter than black (10 IRE for NTSC, +4 IRE for other formats).
Pattern Usage: Use to adjust color and hue through a blue filter with composite, S-video, or
YPbPr signal inputs. The bar transitions in the top part of the picture may be an advantage with
some on-screen-display formats. While viewing the pattern through a blue filter (Wratten 50),
adjust the color control for equal brightness white/blue bars. Adjust the hue control for equal
brightness cyan/magenta bars. Note: RGB input signals aren’t processed through a color
decoder, thus no color adjustments with an RGB input signal; also, YPbPr inputs may not have
both color and hue adjustments.
Also use this pattern to adjust a display’s black level at a medium APL. With the brightness
(black level) control first adjusted to a slightly higher than normal setting, reduce the brightness
control setting until the slightly blacker than black bar (under the large cyan bar) and the black
bar (under the large red bar) are both just black. The slightly whiter than black bar (under the
large blue bar) should still be slightly visible.
Pluge
Pattern Description: The Pluge pattern (Picture Line-Up Generator Eguipment – BBC
development) is arranged in four concentric rectangular zones. The innermost rectangle is fixed
Page 7
at black (7.5 IRE for NTSC, 0 IRE for other formats) and has a five-step gray scale positioned on
it. The second rectangular zone from the center alternates between two light levels, black and
slightly blacker than black (7.5/0 IRE for NTSC, 0/-4 IRE for other formats). The third
rectangular zone from the center is fixed at a light level slightly whiter than black (10 IRE). The
fourth, outer rectangular zone is fixed at black. The average picture level (APL) of this pattern is
very low.
Pattern Usage: Use this pattern to check the DC restoration (black clamping) performance of a
display device and to set the picture black level with a low APL pattern.
A display device with less than perfect DC restoration will exhibit alternating changes of
brightness in the outer two rectangular zones, due to the display’s inability to perfectly clamp
black to a fixed level. This can be seen especially well with the brightness (black level) control
adjusted to a slightly higher than normal setting. If the brightness level of the outer two
rectangular zones remain constant as the second zone from the center alternates between black
and blacker than black, the display has good DC restoration.
If a display has good DC restoration, its brightness (black level) control can be adjusted on either
a low APL or high APL pattern, with no change in black level as you switch from one pattern to
another. In that case, this pattern makes it very easy to accurately adjust the brightness control.
With the brightness (black level) control first adjusted to a slightly higher than normal setting,
reduce the brightness control setting until the brightness alternations in the second rectangular
zone from the center are just no longer visible. The third rectangular zone from the center should
still be visible as slightly whiter than black.
If a display device has less than perfect DC restoration, you will need to decide, based on the
primary use of the display, whether the black level should be adjusted on a pattern with low APL
or high APL. If the display will usually be viewed in a darkened room, adjust the brightness
control with a low APL pattern, such as this Pluge pattern. If the display will usually be viewed
in a bright room, adjust the brightness control with the pluge levels in a medium or high APL
pattern, such as the SMPTE Bar pattern or one of the Window patterns set to a high IRE level.
Needle
Pattern Description: This pattern is black on top and white on bottom with lines (needle pulses)
drawn from top to bottom on each side of the pattern, through the black/white transition.
Electrically, the needle pulse lines are the same width on the top and the bottom of the pattern. A
five-step gray scale is positioned on the center of the upper black pattern area. The top gray scale
block is 100% white.
Pattern Usage: This pattern makes it easy to detect whether scan velocity modulation (SVM) is
enabled on a display device. If SVM is enabled, the black lines on the bottom of the pattern will
be thicker than the white lines on the top of the pattern. It is also a good pattern for properly
adjusting the contrast/picture/white level control for maximum white luminance level. If the
Page 8
contrast/picture control is adjusted for a higher white level than the display device is capable of
producing properly, one of two distortion effects will be observed; blooming or raster distortion.
Blooming is especially prevalant in CRT displays and results in light from very bright pixels
(phosphors) spilling over to adjacent pixels. This causes bright picture areas to become
defocused and slightly larger than they should be. If a display blooms at high luminance levels,
as the contrast control is adjusted to maximum, the top, white block in this pattern’s gray scale
will become slightly wider than the gray blocks below it.
Raster distortion at high luminance levels are caused by high voltage power supply regulation
problems. If the contrast/picture control is adjusted for a higher white level than the display
power supply is capable of fully supporting on a short-term basis, the black lines on the bottom
of the pattern will hook or bend outward.
Ideally, for an acccurate picture, the contrast/picture control should be adjusted just below the
point at which either blooming or raster distortion is evident. This may result in an unacceptably
low white level for the picture, however, and a compromise white level adjustment may have to
be made between an accurate picture and a bright picture.
Staircase
Pattern Description: Eleven equal-width vertical bars step from black at the left (7.5 IRE for
NTSC, 0 IRE for all other formats) to 100 IRE white at the right.
Pattern Usage: Useful for visually checking gray-scale tracking performance of a display. Poor
performance is seen as a primary color tint (red, green, or blue), especially at the bright or dark
end of the pattern. Also useful for adjusting gray-scale tracking by eye, when a color analyzer is
not available. Adjust the display cutoff/bias controls for a neutral dark gray tone at the dark end
of the pattern. Adjust the display drive/gain controls for a neutral bright gray tone at the bright
end of the pattern. Also good as a reference input signal when troubleshooting and signal tracing
luminance or color amplifier problems within a display device.
Horizontal Staircase (H Stair)
Page 9
Pattern Description: Eleven equal-width horizontal bars step from 100 IRE white at the top of
the pattern to black at the bottom (7.5 IRE for NTSC, 0 IRE for all other formats), forming a
horizontal staircase.
Pattern Usage: Useful for visually checking gray-scale tracking performance of a display,
especially a projector with red and blue overdrive at the sides of the display, due to insufficient
correction for CRT side-to-side placement (with green in the center). Poor gray-scale tracking
performance is seen as a primary color tint (red, green, or blue), at the bright top or dark bottom
of the pattern. To avoid the effects of color overdrive at the sides of the display when checking
gray-scale tracking, observe the gray scale up and down only the very center of the display.
To check the effects of color overdrive at the sides of the display, observe by eye or use a color
analyzer to check the color at the left, center, and right end of one horizontal bar
Crosshatch
Pattern Description: 16 white horizontal lines and 12 white vertical lines forming square boxes
on black background (32 horizontal by 18 vertical lines in HD modes) with a white dot in the
center of each box.
Pattern Usage: Used to check and adjust convergence of red, green and blue pictures. The
horizontal and vertical lines are usually best observed to detect color fringing resulting from
misconvergence, and the dots are usually best observed to make fine adjustments.
Even if a display device provides an internally-generated crosshatch pattern for checking
convergence, it is often best to double-check the convergence with an externally-generated
pattern. Occasionally, a display’s convergence on an internally-generated pattern doesn’t match
its convergence on external input video signals.
Overscan
Pattern Description: 16 horizontal lines by 12 vertical lines crosshatch pattern (32 horizontal by
18 vertical lines in HD modes) with chevrons pointing outward at the center of each of the four
edges. Four tic marks at the center of each of the four edges mark 2.5%, 5%, 7.5% and 10%
Page 10
overscan. An “X” marks the electrical center of the pattern.
Pattern Usage: Used to check and adjust for the proper geometry of a display, including picture
centering, size, trapezoid (keystone) correction, pincushion (bow) correction, and linearity.
Horizontal and vertical centering controls should be adjusted to center the pattern on the display
screen. The chevrons at each of the four edges make it particularly easy to see whether there is
equal amount of overscan at the sides or at the top and bottom of the pattern.
The horizontal and vertical size controls should then be adjusted for the desired amount of either
overscan or underscan. If overscan is desired, a display should usually be adjusted for slightly
less than 5% overscan. The horizontal and vertical overscan should be adjusted to be an equal
percentage, as judged by the overscan tic marks.
Trapezoid correction control(s) should be adjusted to make the pattern’s edges parallel to the
edges of the display screen. The brighter crosses in the corners of the pattern should be adjusted
to be equal distances from the edges of the screen (don’t worry yet about the shape of the lines
between the crosses).
Pincushion correction controls should be adjusted to straighten the lines between the brighter
corner crosses. Use the edge of the display screen or a flexible straightedge, such as a yardstick,
to judge the straightness of the lines.
The horizontal linearity control should be adjusted to make the pattern boxes all the same width.
The vertical linearity control should be adjusted to make the pattern boxes all the same height.
Anamorphic
Pattern Description: 32 horizontal by 18 vertical lines crosshatch forming 16:9 aspect ratio
pattern. When viewed on display device with standard 4:3 aspect ratio, pattern will appear
stretched vertically, with crosshatch boxes forming tall rectangles. When pattern is displayed in
non-HD 4:3 format (e.g. NTSC, VESA, or SDTV), and then stretched to 16:9 aspect ratio with
display device’s anamorphic stretch feature, crosshatch boxes should form perfect squares.
Pattern Usage: Used to check the accuracy of display device’s anamorphic stretch feature. If
anamorphic stretch is working properly, and height and width are adjusted properly (check with
Overscan pattern), each crosshatch box should be a perfect square.
Page 11
Window1, Window2
Pattern Description: Centered white window on black background. Luminance levels of
Window1 and Window2 are independently adjustable from 100 IRE to 0 IRE in either 5 IRE or 1
IRE steps. Each window pattern includes pluge level bars at +4% and –4% to the left of the
white window.
Pattern Usage: Use the white window to measure chromaticity of a display device. This pattern
is preferable to using a full field white raster since the window pattern more closely duplicates
the average picture level (APL) of typical program material and doesn’t unnaturally stress
display circuits. When adjusting gray-scale tracking, one window can be set for low luminance
and the other window set for high luminance to quickly switch between adjusting cutoff controls
(low luminance) and drive controls (high luminance).
Raster
Pattern Description: Full field raster pattern. Pattern luminance level is adjustable from 100
IRE to 0 IRE in either 5 IRE or 1 IRE steps. Individual colors can be gated on or off (in the
Gating menu) to produce red, green, blue, cyan, magenta, and yellow rasters.
Pattern Usage: Use to check color purity and display chrominance uniformity. Color purity
problems are usually caused by slight magnetization of some part of a CRT display device, often
metallic CRT mounting brackets or the metallic CRT shadow mask, located just behind the
phosphor screen in a direct-view CRT. This can usually be seen as areas of color on a white
raster, but usually shows up better on a primary-color raster, especially red.
This pattern may also be useful in detecting red and blue overdrive at the sides of a projection
display, due to insufficient correction for CRT side-to-side placement.
Page 12
Color Bar
Pattern Description: Seven equal-width vertical bars with 75% white (gray) at left, followed by
three primary and three seconday colors. Color bars are at 100% saturation with 75% amplitude.
Individual colors can be gated on or off (in the Gating menu) to view only the red, green, or blue
components of the pattern.
Pattern Usage: Use as an overall check of a display device’s capability of producing fully
saturated primary and secondary colors. Especially helpful in detecting full or partial loss of
colors in an older display. Also good as a reference input signal when troubleshooting and signal
tracing color amplifier or color demodulator problems within a display device.
Split Bar
Pattern Description: Top one-fourth of the pattern is the same as the Color Bar pattern. Bottom
three-fourths of the pattern repeats the upper bars, except the bars are flipped from left to right.
This places all the bars containing blue above/below their complementary colors, similar to the
SMPTE Bar pattern. The major difference is that the bar transitions are in the top part of the
picture.
Pattern Usage: Use to adjust color and hue through a blue filter with composite, S-video, or
YPbPr signal inputs. The bar transitions in the top part of the picture may be an advantage with
some on-screen-display formats. While viewing the pattern through a blue filter (Wratten 50),
adjust the color control for equal brightness white/blue bars. Adjust the hue control for equal
brightness cyan/magenta bars. Note: RGB input signals aren’t processed through a color
decoder, thus no color adjustments; also, YPbPr inputs may not have both color and hue
adjustments.
Page 13
Focus
Pattern Description: Consists of capital letter “E”s and “M”s alternating across the screen.
Sometimes refered to as a MEME pattern. The closely spaced elements of these letters makes it
easy to judge the effects of focus adjustments.
Pattern Usage: Used as a reference signal for viewing the effects of focus adjustments across
the entire screen. Since it is difficult for CRT displays to achieve uniform focus across the entire
screen, multiple focus adjustments and/or compromise settings of the focus control(s) is
necessary to achieve acceptable focus. The focus adjustment method will be different depending
on the number of focus controls and whether the device is designed to display video or computer
data.
A video display with only one focus control should be adjusted for optimum focus at the center
of the screen (where most action occurs). A data display with only one focus control should be
adjusted for compromise focus between the center of the screen and the edges of the screen
(adjusting for sharpest focus at a midpoint usually works well).
A video or data display with two focus controls is usually adjusted for best center focus with one
of the controls and best edge focus with the other control.
Ramp
Pattern Description: Pattern makes smooth transition from 100% black on left to 100% white
on right. When electrical video signal is viewed at horizontal scan rate, it appears as linear ramp
from black level to white level.
Pattern Usage: Useful for visually checking gray-scale tracking performance of a display. Poor
performance is seen as a primary color tint (red, green, or blue) at one or more light levels. Also
checks the digitizing linearity of video signal processors. Poor performance is seen as vertical
bands which interrupt the smooth transition from black to white.
Page 14
Regulate
Pattern Description: A single pixel white border surrounds an interior picture area which
alternates between full white and full black.
Pattern Usage: Checks the regulation of CRT high-voltage and deflection power supply circuits.
The pattern alternately produces maximum and minimum CRT beam current. Ideally, these
current extremes should not cause the picture size to change. This can be judged by placing a
thumbnail next to one of the border lines to see the amount of displacement (avoids optical
effects from the alternating pattern). A one to two pixel shift is not noticeable in most picture
material to a typical viewer.
Checker
Pattern Description: Alternating picture areas of black and white in a checkerboard pattern.
Pattern Usage: Checks the regulation of CRT video drive power supply circuits. The pattern
produces abrupt, maximum changes in CRT video drive current. Ideally, this should not cause
the voltage supplied to the video drive circuits to change (good voltage regulation). If the power
supply does not have good regulation, it will cause softening or ringing of the vertical line
pattern transitions.
ANSI Gray
Page 15
Pattern Description: Pattern is an all white raster with two centered three-step gray scales. The
top gray scale steps are at 10%, 5%, and 0% while levels. The bottom gray scale steps are at
90%, 95%, and 100% while levels (from left to right).
Pattern Usage: This pattern can be used to check a display device’s ability to hold proper black
level at close to 100% APL. Check that you can see three separate levels of dark gray and black
in the top gray scale.
The pattern is primarily useful, however, in checking for peak-white clipping in fixed-panel
projectors (LCD, DLP, and D-ILA). In these devices, the projector bulb determines the
maximum amount of light output. If the contrast control is adjusted too high, not only the 100
IRE white levels, but also lower IRE signal levels will produce the same maximum light output
level. This will result in peak white clipping, with loss of high-brightness picture detail. Check
that you can see three separate levels of bright gray and white in the bottom gray scale. If the
brighter levels blend together, reduce the contrast control below the level of clipping.
Multiburst
Pattern Description: Pattern consists of five equal-width vertical segments. Vertical segments
are filled with alternating black and white stripes of one, two, three, four, and five pixel spacing
(right to left). This pixel spacing directly corresponds to the horizontal resolution of the format
being displayed. If, for example, the horizontal resolution of the current format is 640, the one
pixel spacing is such that, if it were continued across the entire screen, there would be 320 white
and 320 black stripes.
The exception to this is the 720 and 1080 HD formats, for which the 1920 pixel resolution, if
repeated across the screen, would result in a video signal frequency of 37 MHz, which exceeds
the SMPTE and EIA-specified format bandwidth of 30 MHz. In these formats, the stripes are at
two, four, six, eight, and ten pixel spacing.
Pattern Usage: Use to check a display device’s capability to produce sharply defined stripes, at
equal brightness, up to the format’s full resolution. This pattern is also useful in adjusting the
sharpness control. Starting with the sharpness control at its minimum setting, increase the control
until all five bursts are at equal brightness levels. Do not adjust the control high enough to cause
ghosting lines adjacent to the widest stripes.
Page 16
Gating and Test Menus
Gating Menu
Red color
signal ON/OFF*
Select Analog
Composite Sync
Green color
signal ON/OFF*
Select Digital
Composite Sync
Blue color
signal ON/OFF*
Select Digital
Separate Sync
Select HD RGB
sync polarity
Test signal
outputs ON/OFF
* Color gating is available on all patterns except Ramp for the Composite, S-Video, and RGB
outputs. Color gating is not available on the YpbPr (component) output.
Test Menu
Select special test operating functions.
Sequence
Sub-Menu
ColorPro
Sub-Menu
Burn-In
Sub-Menu
DDC Step
Sub-Menu
Freq Shift
Sub-Menu
Audio
Sub-Menu
Page 17
Sequence and Burn-In Sub-Menus
Sequence Sub-Menu
Press the +/- buttons to manually step through a sequence of defined tests. Each step
loads a given video format and test image. Menu buttons permit the operator to gate
video color information, change sync types and turn all signal outputs on and off. The firmware
includes a sample test sequence. For the future, custom editing software is planned to allow you
to create and download your own test sequences.
Red color
signal ON/OFF
Select analog
composite sync
Green color
signal ON/OFF
Select digital
composite sync
Blue color
signal ON/OFF
Select digital
separate sync
Line 1:
Line 2:
Line 3:
Line 4:
Name of Test Sequence currently running
Current step number in sequence
Video format used in current step
Pattern displayed in current step
Test signal
outputs ON/OFF
Burn-in Sub-Menu
Uses the Run/Stop menu button to cycle the generator automatically and continuously
through each of the video patterns for the current video format. Menu buttons permit you
to gate video color information, change sync types and turn all signal outputs on and off.
Red color
signal ON/OFF
Select analog
composite sync
Green color
signal ON/OFF
Select digital
composite sync
Blue color
signal ON/OFF
Select digital
separate sync
RUN/STOP
Burn-in Function
Line 1:
Line 2:
Line 3:
Line 4:
Name of Burn-In test currently running
Current step number in cycle
Video format used in current step
Pattern displayed in current step
Page 18
Test signal
outputs ON/OFF
Freq Shift, Audio, and DDC Step Sub-Menus
Freq Shift Sub-Menu
Press the +/- buttons to increase and
decrease the horizontal scanning
frequency of the current video format +/in 2% increments. The ^ pointer indicates the
percent deviation and the bottom number shows the actual frequency.
10%
Audio Sub-Menu
Audio menu buttons independently
toggle the stereo audio output
channels on and off.
DDC Step Sub-Menu
Press the + scroll button to step through the video formats in the list produced by the
Learn Formats function. Press the - scroll button to step through all the available
patterns. Pressing the Run menu button causes the generator to automatically cycle through all
patterns for every video format in the list. Pressing the Stop menu button restores manual
stepping.
RUN/STOP
Step Function
Test signal
outputs ON/OFF
Red color
signal ON/OFF
Select Digital
Separate Sync
Green color
signal ON/OFF
Select Digital
Composite Sync
Blue color
signal ON/OFF
Line 1: Video format used in current step
Line 2: Pattern displayed in current step
Page 19
Select Analog
Composite Sync
Color Pro Sub-Menu
ColorPro Sub-Menu
Uses the ColorPro probe to measure the chromaticity and luminance (brightness) of the
test CRT display. The ColorPro probe connects directly to the serial port on the
generator. Chromaticity is shown as C.I.E. x, y coordinates and the luminance (Y) can be shown
in units of either Foot-Lamberts or nits. The ColorPro needs to be over a fully lit white area of
the CRT screen for accurate readings. The Window or Raster patterns are suitable for use with
the ColorPro.
Initiates one
reading with the
ColorPro
Toggles between
footlamberts or
nits units
Error Codes: 1, 7 - ColorPro not seeing a usable test image.
5, 8 - Generator did not find a ColorPro probe.
2, 3, 6 - Probe malfunctioning.
Page 20
Learn Formats Function and Options Menu
Learn Formats Function
Reads back EDID format data from
a VESA® DDC-compliant display
connected to the generator's VGA output. A
list of standard VESA video formats
supported by the monitor is extracted from
the EDID data and compared against all of
the VESA formats in the generator's built-in library. A table is then built of all the matching
formats. This table can be viewed by pressing the Details menu button. This table of formats is
also used for the DDC Step function under the Test menu.
Details
Lists all of the matching VESA standard video formats from the last successful Learn Monitor
operation. The list is not modified if the operation fails. The +/_ buttons can be used to page
through the list if there are more than eight (8) learned formats. You cannot select the formats
using the menu buttons. However, you can go through all the formats using the DDC Step Test
function.
NOTE: It is possible that the display's EDID data will include non-VESA formats. These nonstandard formats will not be listed.
Options Menu
This menu is used for system level options.
Preset serial
port Baud rate
Clears all
current video
formats
Resets all video
formats to
factory defaults
Pressing the Clr Fmts button displays a confirmation request menu to clear all formats in
memory. Selecting “Yes” causes all video formats in factory default memory locations to be lost.
There is no way to abort or undo this operation. The LCD window will show "All Formats
Cleared" when the process is completed.
Pressing the ReloadFmts button restores all factory default formats to their original memory
locations. Any user formats in those locations will be lost. User formats saved in other memory
locations are unaffected. The LCD will display “Factory Formats Reloaded” when the process is
completed. Pressing the FORMAT button displays the FORMATS menu to list the restored
memory contents.
Page 21
Appendix A - Calibrating TV User Controls
The improved quality of today’s large screen TVs presents a challenge to the installation
technician. Even the slightest misadjustment of the TV user controls can cause the picture quality
to be significantly less than it could be. This section describes how to properly adjust the five
major user controls, using the Sencore VP300 Multimedia Video Generator, which provides the
patterns needed for user control calibration, as well as for white balance calibration and picture
geometry adjustment. The important TV user controls are (commonly used label listed first;
more accurate technical term in parentheses):
1.
2.
3.
4.
5.
Brightness (Black Level)
Contrast/Picture (White Level)
Sharpness
Tint (Chroma Hue)
Color (Chroma Saturation)
Brightness Control
The brightness control adjusts the light level of the darkest portions of a picture - that’s why this
control is more accurately called the black level control. When the black level is set too dark, the
subtle dark gray details of a scene are lost to black. When the black level is set too bright, the
darkest grays and deep blacks in the picture are all a lighter gray, which effectively lowers the
contrast ratio of the display, reducing picture quality.
The VP300 Pluge pattern, shown in Figure 1, provides a unique black level alignment signal that
was designed for easily adjusting the brightness control for proper black level.
NTSC
HDTV
7.5 /3.5 IRE
0 /- 4 IRE
7.5 IRE
0 IRE
10 IRE
10 IRE
7.5 IRE
0 IRE
Fig 1: The Pluge pattern is used to adjust the television brightness control for proper black
level.
Page 22
Note: The environment surrounding a TV affects the proper setting of the user controls. Room
lighting should be adjusted to the preferred level for movie viewing before the TV is calibrated.
When the Pluge pattern is selected with the NTSC format, the VP300 automatically displays an
NTSC pluge pattern with a 7.5 IRE black setup level. When an HDTV format is selected, the
VP300 displays an HDTV pluge pattern, without black setup.
To adjust the brightness control on an NTSC or HDTV display device with the Pluge pattern,
watch the second box from the inside, that is alternating between black and blacker-than-black
(7.5 IRE and 3.5 IRE in NTSC, 0 IRE and –4 IRE in non-NTSC formats). Adjust the brightness
control until the black and blacker-than-black levels appear the same and no flashing can be
seen. The outer 10 IRE box should still be slightly visible. The same method is used for HDTV,
although the pattern IRE levels are different.
If the brightness level of the outer two rectangular zones does not remain constant as the second
zone from the center alternates between black and blacker than black, the display has less than
perfect DC restoration. This can be seen especially well with the brightness (black level) control
adjusted to a slightly higher than normal setting. In this case, you will need to decide, based on
the primary use of the display, whether the black level should be adjusted on a pattern with low
APL or high APL. If the display will usually be viewed in a darkened room, adjust the brightness
control with a low APL pattern, such as the Pluge pattern. If the display will usually be viewed in
a bright room, adjust the brightness control with the pluge levels in a medium or high APL
pattern, such as the SMPTE Bar pattern or one of the Window patterns set to a high IRE level.
Sharpness Control
The sharpness control is designed to enhance the fine detail in a picture, independent of picture
content. It was originally introduced in color TVs with notch filter luma/chroma separation that
removed high frequency detail in the black and white portion of the picture. The sharpness
control was designed to put some of that detail back into the picture. Most modern TVs now use
a comb filter, which doesn’t lose the high frequency luminance detail. If a comb filter is used,
there is no longer a real need for the sharpness control, however, manufacturers find it difficult to
take away a feature that consumers have seen on sets for years. If the sharpness control is
improperly adjusted, it will either add picture distortion or reduce picture resolution.
The VP300 Needle pattern works very well for adjusting the sharpness control. The Needle
pattern contains white lines running through a black background and black lines running through
a white background. These lines are commonly referred to as needle pulses. To calibrate the
sharpness control, first turn the contrast control down to about mid-scale to make the white
portions of the pattern appear gray. This light level will best show sharpness-related picture
defects.
Page 23
Fig. 2 – The Needle pattern is used to properly adjust the television sharpness control.
While adjusting the sharpness control, watch the left and right edges of the needle pulse lines. If
the sharpness is set too high, a faint duplicate line will be seen beside the original line. This
ghosting affect is unwanted picture distortion. If the sharpness control is set too low, the needle
pulses will appear out of focus and the image will lose its resolution. Adjust the sharpness
control to achieve the best balance between ghosting and poor focus or resolution.
The multiburst pattern can also be used as a reference to adjust the sharpness control. Starting
with the sharpness control at its minimum setting, increase the control until all five bursts are at
equal brightness levels. Do not adjust the control high enough to cause ghosting lines adjacent to
the widest stripes.
Contrast Control
The contrast control is sometimes labeled the picture control, or is more accurately called the
white level control. This control adjusts the light level of the white or high luminance portions of
a scene. If the contrast control is set too low, the image is dim, the whites become dull and the
image loses its luster. For this reason, many displays are adjusted from the factory with the
contrast control set to maximum. If the contrast control is set too high, though, the power supply
may be overdriven and raster distortion may occur. Also, too much contrast may cause pixel
blooming. Blooming occurs when the screen pixels are lighted so brightly that light spreads to
the adjacent pixel, defocusing the white image.
Page 24
Fig 3: The Needle Pulse pattern is used to adjust the television contrast control for proper
white level.
The VP300 Needle Pulse pattern works also very well for adjusting the contrast control for
maximum light level while minimizing raster distortion or blooming. Adjust the contrast control
until the top white bar is the same width as the four gray bars under it. This will ensure that no
pixel blooming is occurring. Also, observe the needle pulses (vertical lines in the picture) as you
adjust the contrast control. These lines should be straight. If the contrast is set too high, the
display’s power supply may cause the needle pulses to bend. This line bending creates unwanted
picture distortion.
Ideally, for an acccurate picture, adjust the contrast/picture control just below the point at which
either blooming or raster distortion is evident. This may result in an unacceptably low white level
for the picture, however, and you may have to make a compromise white level adjustment
between an accurate picture and a bright picture. Brightness should be rechecked after the
contrast control is adjusted because the two controls may have some interaction.
Color And Tint Controls
The color and tint user controls should be adjusted last. These two controls should be adjusted
using the SMPTE color bar pattern. The easiest and most accurate method of adjusting the tint
and color controls is to view the SMPTE color bar pattern through a blue filter.
Color Control
Adjust the color control by comparing the intensity of the large top outside blue and white bars
with the intensity of the small bars below them. These bars are indicated in Figure 4. Adjust the
color control to make these bars appear the same light level, as viewed through a blue filter. To
double-check the color control adjustment, remove the blue filter and look at the yellow and red
Page 25
bars. These bars should appear very colorful without any signs of blooming into the adjacent
bars.
Large Outside Bar
Large Outside Bar
Small Center Bar
Small Center Bar
Fig 4: The SMPTE bar pattern blue and white bars are used to calibrate the television
color control.
Tint Control
Adjust the tint control by comparing the intensity of the cyan and magenta color bars through a
blue filter. These bars are indicated in Figure 5. Compare the light level of the large top cyan and
magenta bars with the small bars directly below each of them. Adjust the tint control to make
these bars appear the same light level, as viewed through a blue filter. To double-check the
adjustment, remove the blue filter and observe the yellow and cyan bars. If the tint is set too red,
the cyan bar will look green and the yellow bar will look orange. If the tint is set too green, the
cyan bar will look blue and the yellow bar will look green.
Page 26
Cyan Bar
Magenta Bar
Small Magenta
Small Cyan
Fig 5: The SMPTE bar pattern cyan and magenta bars are used to calibrate the television
tint control.
Remember that the user controls should be calibrated with the room lighting adjusted to the
preferred level for movie viewing. These controls should also be the final adjustments that are
made to the TV. If the TV white balance is calibrated, these five user controls will need to be recalibrated.
Page 27
Appendix B - Video Display White Balance Adjustment
Following is a general white balance (gray scale, color temperature) video display adjustment
procedure that will produce a properly adjusted display in most cases. If a service manual is
available for the display, however, use the manufacturer’s adjustment procedure.
White Balance Adjustment
1. In your color analyzer’s setup utility, select the white reference or CIE chromaticity
coordinates to which the display is to be adjusted.
Note: Most displays should be adjusted to the CIE D65 daylight standard (x =
0.313, y = 0.329) for best color accuracy with standard program material.
2. Adjust the brightness control to make blacks just black (use the Pluge pattern, or use the
pluge bars in the Window pattern) and adjust the contrast control for maximum brightness
without blooming or raster distortion (use the Needle pattern).
Fig. 1 - VP300 Pluge pattern
3. Select the VP300 Window1 pattern and adjust the pattern level for a low IRE level to
produce approximately 1-2 Ft-Lamberts of luminance in the center of the white window, as
measured with the color analyzer.
4. Leaving the cutoff control for the initially strongest color (as viewed on the dim CRT) at its
original or preset level, adjust the other two cutoff controls to obtain color balance at the
desired white reference.
Note: The ColorPro Delta RGB display indicates which is the strongest and
weakest color.
Page 28
5. Select the VP300 Window2 pattern and adjust the pattern level for 80-100 IRE. Most directview displays will track well up to 100 IRE, whereas many projection displays produce a
better compromise tracking when adjusted at a lower IRE level.
Fig. 2 - VP300 100 IRE Window pattern
6. Adjust the drive/gain controls to obtain color balance at high brightness.
Note: If only two drive controls are available, select the missing color as your reference
color in the ColorPro Delta RGB display window.
7. Re-select the Window1 pattern, readjust the pattern IRE level to produce approximately 1-2
footlamberts of luminance, and recheck/readjust the cutoff controls for the desired
chromaticity coordinates.
8. Repeat steps 5-7 until the display’s color temperature remains relatively constant (tracks)
over the full range of white window IRE levels.
Final User Control Adjustment
When the white balance adjustment is complete, perform a final adjustment of the display’s user
controls (brightness, contrast, sharpness, color, and hue), as outlined in Appendix A
Page 29
3200 Sencore Drive
Sioux Falls, SD 57107
Call 1-800-SENCORE (736-2673)
Innovatively designed
with your time in mind
Page 30