1
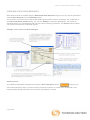
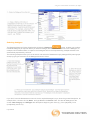
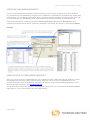
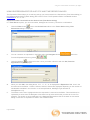
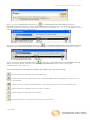
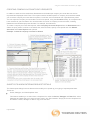
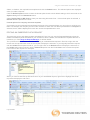
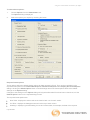
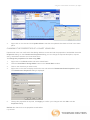
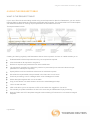
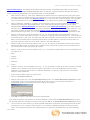
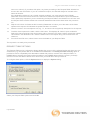
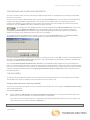
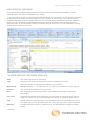
DATASTREAM
ADVANCE FOR OFFICE 5
USING EXCEL 2007
ISSUE 4
Datastream Advance for Office
CONTENTS
1 Using Ribbon based UI for AFO (in MS-Office 2007 and above)
3
2 Using Excel with DATASTREAM Advance for Office
5
Creating data requests in Excel
5
Creating static data requests
7
Selecting datatypes
8
Selecting lists
9
Selecting expressions
9
Creating time series requests
10
Using lists with time series requests
10
Using functions and expressions with time series requests
11
Selecting expressions
11
Selecting dates
12
Creating Expression using Intellisense feature
12
Using Expression Editor in Static and Time Series Dialogs
14
CREATING COMPANY accounts data requests
16
Shortcuts when entering request details
16
Format options
17
Format options for static and time series requests
17
Editing an embedded data request
18
Setting the Excel Add-In system options
19
3 Using lists
23
Creating a Local list from a set of codes (Datastream, ISINs, SEDOLs, etc) in Excel (for example from a back
office system)
23
4 Using Expressions
24
The Expression Picker
24
Using the Expression Builder
24
5 Using the Request Manager
26
Editing an embedded chart
26
Changing the properties of a chart using VBA
28
6 Using the Request Table
29
What is the Request Table?
29
Creating a set of requests
30
Request Table options
32
Upload List button
33
The Series Navigation button
33
Processing and Scheduling requests
34
The AFO Index
34
User created time series
35
The user created time series template:
35
Creating a user created time series
36
Editing an existing user created time series
37
Page 2 of 38
Using Excel with Datastream Advance for Office
1 USING RIBBON BASED UI FOR AFO (IN MS-OFFICE 2007 AND ABOVE)
When you install Datastream.xlam component, Datastream is available as an Add-In tab. Datastream provides
following facilities in the form of seven separate groups.
Figure: Datastream.xlam
Note
AdvanceOffice.xlam is also available in the installation folder. However, it is not the preferred
Office 2007 add-in as it does not contain links to Datastream Charting which provides extensive
interactive charting functionality.
Series Requests:
This group consists of three
buttons.
Create a one off or embedded request for a series or list and
datatype/expressions at one point in time.
Create a one off or embedded request for a series or list and
datatype/expressions over time.
Create requests for fundamentals information and view, update and edit
your embedded requests. This drop-down list contains following buttons:
1. Company Account Request: Request company fundamentals
information using a pre-specified format.
2. Request Manager: View, update and edit all requests in your
workbook.
3. Refresh Workbook: Refresh all the data and chart requests in
your workbook.
4. Resize Embedded Charts: Enable the resizing of embedded
charts in your workbook.
5. Datachannel Buttons - Hide: Hide all Datachannel buttons in your
workbook.
6. Datachannel Buttons – Show: View all Datachannel buttons in
your workbook.
7. Search for Dead Codes – Active Sheet: Search dead codes in
active sheet.
8. Search for Dead Codes – Workbook: Search dead codes in
active workbook.
Request Tables:
This group consists of three
buttons.
Open a new Request Table to create, manage and update spreadsheets
effectively with multiple Datastream requests. This drop-down list contain
following button:
1. Office 2003 Request Table: Open an Office 2003 Request Table
in Office 2007 from the New Request Table drop down.
Access a library of spreadsheets illustrating how the Datastream content
sets can be used in different range of workflows.
Upgrade spreadsheets with old DSDDE links, embedded requests or earlier
version request tables to the latest version.
Page 3 of 38
Using Excel with Datastream Advance for Office
Utilities:
This group consists of six buttons.
Find the series and datatype you require, using the extensive facilities
available in Navigator and return these values to your spreadsheet.
Create, calculate and select User Created Indices on your Datastream ID.
View and create the saved expressions on your Datastream ID.
Create a local, central system (l#), or User Created Index (x#) list from
Datastream, SEDOL or ISIN codes in a range of cells.
Create local lists using series from Navigator or Datastream lists or edit
your lists.
Open a new User Created Time Series Sheet to upload your own series to
commingle with Datastream series.
Charts:
This group consists of six buttons.
Note: This add-in tab is valid only for Datastream.xlam
Open new chart window.
Open new library window.
Open Chart Manager to refresh, edit, apply style, remove links, delete and
upload charts.
Get the latest charts associated to particular Templates in your current
spreadsheet.
Refresh selected / all charts with the latest data.
Open more chart pages (Key Indicators, Overview, Reports) in a new
window. This drop-down list contains following buttons:
Key Indicators: Open the Key Indicators page in a new window.
Overview: Open the Overview page in a new window.
Report: Open the Report page in a new window.
Options
Configure a range of settings and defaults to reflect your preferences.
Extranet
Access the Extranet for information on Datastream content and functionality
including details of the latest changes.
Help
Access Online help contents, Definitions, Contact Us link and Version
details.
Help:
Help Contents: View Datastream Advance for Office - Online help.
Help Definitions: View the syntax for Datastream functions and
expression language.
User Guide: View Datastream for Advance using Excel manual.
Contact Us: Access Thomson Reuters contact details.
About:
Advance for Office: View Advance for Office version details.
Charting for Office: View Datastream Charting version details.
Page 4 of 38
Using Excel with Datastream Advance for Office
2 USING EXCEL WITH DATASTREAM ADVANCE FOR OFFICE
CREATING DATA REQUESTS IN EXCEL
Datastream Advance for Office (AFO) enables you to create and issue data requests from within Excel, rather
than creating your data requests in Datastream and then embedding them in Excel. When you issue a request
from Excel, it is passed directly to Datastream, bypassing Datastream. The results are returned as dynamic,
refreshable objects. This means that your data requests can be saved and refreshed within Excel without having
to launch Datastream. The breadth of Datastream‟s historical data is available for use in your spreadsheets. Any
number of data requests can belong to a spreadsheet and be refreshed as a batch using the Request
Manager. See Using the Request Manager.
The data request creation facilities available in Datastream are also available in Excel.
Static Data
Time Series Data
Company Accounts
Series selection – including
Series selection – including
Series selection – including
Datastream equities, market indices, Datastream equities, market indices, Datastream equities, constituent lists
commodities, bonds, interest and
commodities, bonds, interest and
and Local Lists (that contain equities)
exchange rates, investment and unit exchange rates, investment and unit
trusts, warrants and economic series.trusts, warrants and economic series.
Local List selection – including
Local List selection – including
Company account formats – including
Datastream Local Lists, user created Datastream Local Lists, user created Datastream and Worldscope items.
mainframe lists and constituent lists. mainframe lists and constituent lists.
Datatype selection – static datatypes Datatype selection - time series
for Datastream, MSCI, I/B/E/S and datatypes for Datastream, MSCI,
FTSE.
I/B/E/S and FTSE.
Local List selection – including
Datastream Local Lists, user created
mainframe lists and constituent lists.
Expression selection - including
Expression selection – including
Datastream global and user created Datastream global and user created
expressions.
expressions.
Frequency of reported data including daily, weekly, monthly,
quarterly and yearly.
Currency Convertor - including
currency
Currency Convertor - including
currency.
Date of requested data.
Start and end dates for display
period.
Start and end dates for display
period with annualise option.
Format options - including selection Format options - including selection Format options - including row titles.
of column and row title and
of column and row title and
headings.
headings.
The Intellisense option enables you to see the functions and parameters available for the functions with links to
the help files.
The Editor option enables multiple series or datatypes/functions/expressions to be easily reviewed, edited and
extended with links to the metadata.
The hyperlink to Metadata option enables series codes to be linked to the Navigator classifications and
metadata pages. This also enables series that are now dead or inactive to be identified in your workbook via the
Search For Dead Codes menu options.
Page 5 of 38
Using Excel with Datastream Advance for Office
Page 6 of 38
Using Excel with Datastream Advance for Office
CREATING STATIC DATA REQUESTS
Static data requests are created using the Datastream Static Request dialog to enter your request parameters.
Choose Static Request from the Datastream menu
The minimum you need to do to create a static data request is select a series, a datatype, and a start date on
the Datastream Static Request dialog. You can then Submit the request to Datastream. The results are
displayed directly in the spreadsheet with row and column headings (if selected). The Refresh button enables
you to edit and refresh the embedded request.
Example - Three series and static datatypes
Selecting series
The Datastream Navigator, displayed by clicking the Series Navigation button,
enables you to
select individual series. When you select a series, the series mnemonic is copied to the Series field on the
Request dialog. Multiple selections are automatically separated by commas.
Page 7 of 38
Using Excel with Datastream Advance for Office
Selecting datatypes
The Datatype Mnemonic Picker, displayed by clicking the Datatypes
button, enables you to select
individual datatypes per request. When you select a datatype, the Datastream mnemonic for the Datatype, for
example, MV for Market Value, is copied to the Datatypes field on the Request dialog. Multiple selections are
automatically separated by commas.
The following example shows you how to search and select the Datastream equity datatype EPS (earnings per
share) by typing its mnemonic in the Datatype Mnemonic Picker.
If you don‟t know the Datastream mnemonic for the required datatype but you know the general description, for
example Price, choose to find by Name and type Price in the Search Field. This lists all datatypes for the
chosen Data Category and Datatype with descriptions beginning with Price (e.g. Price (adjusted), Price
(unadjusted), and so on).
Page 8 of 38
Using Excel with Datastream Advance for Office
Selecting lists
You can use lists stored on your PC (i.e. Local Lists) or remote lists stored on the Datastream host, rather than
selecting a number of individual series. These lists include:
Local Lists created in Datastream or Advance for Office, Datastream lists that have been downloaded onto
your PC for use in Datastream.
User lists (i.e. L#xxxx lists) that are stored on the Datastream host system.
Constituent lists; for example, LFTSE100. See Creating local lists.
To select a list, click the List Picker button
, on the Request dialog. When you use a list of series for
a data request, data is displayed for the selected datatypes for every series in the list in the order that they
appear in the list. Selecting a list from the List Picker copies the list code into the Series field. This could be a
list file for Local Lists (e.g. LNSABANK.LLT), a list code for mainframe lists (e.g. L#A74953) or a list mnemonic
for constituent lists (e.g. LNSABANK).
Example - User created list and 3 static datatypes
Selecting expressions
For static data requests, you can browse and select expressions stored on the Datastream host system. The
, on the Static Request
Static Request Expression Picker, displayed by clicking the Expression button
screen, can display all user created expressions or Datastream global expressions, or both. See Using
Expressions. A Refresh Grid button enables you to update the list of expressions held on your PC from the
Datastream host system.
Expressions can be used for static data requests where only one symbolic variable is used. For example,
PCH#(X,1Y) calculates the percentage change over one year where X is either a single series or a constituent of
a list that you select.
Page 9 of 38
Using Excel with Datastream Advance for Office
CREATING TIME SERIES REQUESTS
You can create time series requests for individual series (e.g. price indices, exchange rates, and expression,
etc.) as well as for your Datastream Local Lists, User created lists, and Datastream constituent lists. Unlike static
data requests, you can specify a time period which can start as far back as data is held for a specific stock right
up to the latest value. A Frequency format option enables you to define periodicity of the data required.
Time series requests are created by using the Time Series Request dialog from the Datastream menu,
supplying the required series (lists or expression), datatypes, time period, and frequency, and clicking Submit.
Example
USING LISTS WITH TIME SERIES REQUESTS
When you use a Local List, a Datastream list, or a constituent list with a static data request, between one and
ten datatypes are returned for each series in the list. When you use a Local List, a Datastream list, or a
constituent list with a time series request, a sequence of data (i.e. the time series datatype and frequency) is
returned for each constituent. See Creating local lists.
To indicate that you want a time series on each datatype that you enter, you must click the TS for each item in
list check box. This can be switched off in the options dialog.
Page 10 of 38
Using Excel with Datastream Advance for Office
USING FUNCTIONS AND EXPRESSIONS WITH TIME SERIES REQUESTS
Selecting expressions
For time series data requests, you can browse and select expressions stored on the Datastream host system.
The Time Series Data Request Expression Picker, displayed by clicking the Expression button
, on
the Time Series Request screen, can display all user created expressions or Datastream global expressions, or
both. See Using Expressions. A Refresh Grid button enables you to update the list of expressions held on your
PC from the Datastream host system.
Expressions can be used for time series requests where only one symbolic variable is used. For example,
PCH#(X,1Y) calculates the percentage change over one year where X is either a single series or a constituent of
a list that you select.
Example - Percentage change over one year of market index constituents
Page 11 of 38
Using Excel with Datastream Advance for Office
Selecting dates
Dates can be typed as either a fixed date format, that is dd/mm/yy, or as a number of days (D), weeks (W),
months (M), quarters (Q), or years (Y) ago from today, for example -3D which is three days ago from today.
Note
If the Date field is left blank, the last value (which may be prior to the date of the request) will be
retrieved. You can also enter TODAY in the Date field to retrieve the latest intraday values.
Latest Intraday prices are only available for European equities and indices where real time prices
are subscribed to.
CREATING EXPRESSION USING INTELLISENSE FEATURE
Intellisense automatically lists all the available Datastream functions. You can then select one by using the
arrow keys and hitting a completion character when the correct member function is highlighted.
There are two ways you can create or select an expression with Intellisense:
1.
Using Function Selector / Help.
2.
Writing directly in Text field, and selecting expression.
Using Function Selector for expression creation
1.
Choose Time Series Request or Static Request from the Datastream menu.
2.
Click Function Selector
3.
Select a function from the list, for example ABS# and click OK. Function arguments dialog box is then
displayed.
Page 12 of 38
button, The Function Help dialog is displayed.
Using Excel with Datastream Advance for Office
4.
Click OK, the expression is displayed in Datatypes / Expression text field
OR
If you know the function name already, then you can directly enter the function name in
Datatypes/Expressions text field, and can use
Note
button for completing the expression.
You can use Help on this function link for more details.
Using dropdown feature
1.
Choose Time Series Request or Static Request from the Datastream menu.
2.
Enter a function name, a dynamic dropdown list opens, select and enter the function from the list, for
example select and enter MAV#
3.
Expression parameter popup opens, as shown below
Note
Page 13 of 38
Using these buttons
overloaded.
you can see the details of different expression parameters
Using Excel with Datastream Advance for Office
USING EXPRESSION EDITOR IN STATIC AND TIME SERIES DIALOGS
The Expression Editor helps you to edit long strings you have entered in the Series/Lists (Time Series dialog) or
the Datatypes/Expressions (Static dialog) text boxes in Excel. The Expression Editor is available whether
Intellisense is “on‟” or “off”.
Expression Editor launched from the Series/Lists (Time Series dialog)
In a Time Series request, you can enter series, datatypes and currency conversion combinations.
1.
Click the Editor button
next to the Series/Lists textbox in the Times Series dialog. Edit
Series/Lists dialog is displayed.
2.
You can construct an expression in the Editor using the Navigator button
Function/Expression/Currency pickers
and/or the
.
3.
Click the fx button
to select a function. Once you select a function and click OK, Function
arguments dialog is displayed.
4.
When you click OK in the dialog above, if “X”, “Y”, “Z”, “A” is displayed the Expression field, then in the
text returned to the Editor - Series1, Series2, Series3, Series4 are displayed depending on the number of
substitutable variables in the function. In the example above, MAV#(X,1Y) is returned as
MAV#(Series1,1Y).
5.
The Series1 text is then highlighted when the expression is returned to the Editor. This should then be
replaced by a series from the Navigator. Note there is a tip below which tells you what to do next. For
example, you should not enter datatypes in the Datatypes/Expressions field in the static or time series
dialog if a function or expression is used in the Series/List field.
Page 14 of 38
Using Excel with Datastream Advance for Office
When you click the Expression Picker button
in the Edit Series/Lists (Time Series dialog) the
Expression Picker is displayed showing All the expressions on the ID. When you return the expression to
the Editor it returns the name of the Expression with symbolic placeholders “X”, “Y”, “Z”, “A” replaced by Series1,
Series2, Series3 or Series4, as appropriate.
But, when you click the Expression Picker button
in the Datatypes/Expressions (both Static and Time
Series dialog) the Expression Picker is displayed showing only those expressions with 1 symbolic variable.
When you click the Currency Picker button
available in the Times Series request, Datatype Currency
dialog is displayed. Select a Currency and click Apply Last/Selected button to apply currency like:
SERIES~Currency (Eg: BAY~AL).
Other functionalities in the Expression Editor (both Static and Time Series dialog)
- Click this button to delete the text in the Editor area.
- Click this button to view classifications and metadata displayed from the Navigator. For functions, this
button is not enabled.
- Click this button to replace the selected item in the Selector grid below the text in the Editor area.
- Click this button to add Editor text as new item in Selector.
- Click this button to delete item from Selector.
- Click these buttons to move items in the Selector up and down.
Page 15 of 38
Using Excel with Datastream Advance for Office
CREATING COMPANY ACCOUNTS DATA REQUESTS
In addition to static and time series data, Datastream and Worldscope company accounts data can also be
requested and displayed within Excel. The request creation facilities specific to company accounts data enable
you to retrieve company accounts data for equities, Local Lists, and constituents over a specified time period.
You can adjust the company accounts data over the time period, using the Annualise facility, for companies who
have moved their year-end dates. You can also select from a list of company accounts formats, including
Datastream and Worldscope preset formats. For example, financial ratios.
To create a company accounts data request, select Company Accounts Request from the Datastream menu.
Select an equity series, local list or constituent list, select a format, specify a time period and click Submit.
Annualise and Format Options are optional.
Example - Industrial company accounts for Alcatel
SHORTCUTS WHEN ENTERING REQUEST DETAILS
The data request dialogs have two features that enable you to speed up your typing of request parameters.
These are:
Series, datatype, and date dropdown lists
This feature enables you to select from a dropdown list, under the Series, Datatype and Date field, series,
datatypes and dates that you have previously used in one Excel session. Simply click on the dropdown list
and select a series, datatype or date to copy it into the field.
Page 16 of 38
Using Excel with Datastream Advance for Office
Select last request parameters
You can re-insert the parameters for any of your previously used requests by right clicking the mouse
over the Series Navigation button and selecting the request details from the displayed list, for example:
Selecting the request details from this list inserts all the details in the relevant fields. Click Submit to issue
the request.
FORMAT OPTIONS
Format options for static and time series requests
Format options are available on the Static Request and Time Series Request dialogs. These options enable
you to choose how to display the data and what you can do with it. Check the check boxes to select the options.
Page 17 of 38
Using Excel with Datastream Advance for Office
Select, or deselect, the required format options and click the Submit button. The selected options are displayed
when you make a request.
Click the Default Option button to return the format options back to their default settings, which are made on the
Options dialog from the Datastream menu.
Select Display Data as MS Chart to chart your data using Microsoft Chart - if the embed option is selected, a
Refresh button is placed in the chart.
Format options for company accounts requests
As company accounts request formats dictate the layout of the presented data, you can only turn on/off the row
titles. For example, the company account code numbers for each item. All data is presented as if Transpose is
selected, that is, data is displayed for each item across the spreadsheet in rows.
EDITING AN EMBEDDED DATA REQUEST
There are two ways to edit data requests embedded in Excel. You can use the Request Manager to view the
details of all data requests embedded in your worksheet, edit the details, and resubmit the requests that are of
interest to you. See Using the Request Manager, for further details.
The quickest and most convenient method of editing an embedded data request in Excel is to right-click the
mouse over the top left-hand corner of the request to display the edit menu. If you originally issued the request
with the Visible format option turned on, you can right-click on the Refresh button to display the edit menu. If
the Visible option was turned off, use the Comments option from the Excel View menu to locate the top lefthand corner of the request. For example:
When you have located the top left-hand corner of your embedded request, right-click to highlight the whole
request and display the edit menu.
Page 18 of 38
Using Excel with Datastream Advance for Office
Use the following options to edit the request:
Cut
Cuts the entire details of the embedded request to the Windows clipboard for pasting into other worksheets or
workbooks. Note that when using the Cut, and subsequent Paste options, only a copy of the data is pasted into
the new location or worksheet, not the underlying embedded request.
Copy
Copies the selected data request for pasting into other worksheets and workbooks. Note that only a copy of the
actual data is taken when this option is selected.
Editor…
Edit the actual parameters that make up your static, time series, and company accounts data requests. When
you select this option, a dialog is displayed for the type of request you are editing, with the details of the request.
The following example shows the editing dialog for a company accounts data request.
Make your changes and click Apply to save the changes without issuing the request, or click Submit to issue
your changes to Datastream straight away.
Refresh
Refreshes the selected data request with the latest Datastream values and data. It is used for ad hoc refreshing
of individual data requests.
AutoRefresh
This option switches on the AutoRefresh option for the selected data request. While AutoRefresh is selected,
the data request is refreshed every time the worksheet is opened.
SETTING THE EXCEL ADD-IN SYSTEM OPTIONS
System options are available for you to control the way you use the Excel Add-In and how data is presented.
These options include:
Request Format options
Menu options
Data options
For assistance on using Datastream's Excel functionality and content - use the Contact Us option on the
menus.
Page 19 of 38
Using Excel with Datastream Advance for Office
To select these options:
1.
Choose Options from the Datastream menu.
The Options dialog is displayed.
2.
Select the options you require by checking the boxes:
Request format options
These options define the default display options for data requests in Excel. They can be overridden by the
request format options on the Static Data Request, Time Series Request and Company Accounts Request
dialogs. Clicking the Default Option button on these dialogs returns the format options back to the default
settings on the Options dialog.
Changes to the settings on the Options dialog will only take effect after Excel has been re-launched, or if the
Default Option button on the request dialog is used.
The request format options are:
Row Titles - displays the series code at the head of each row for each series.
Col Titles - displays the datatype mnemonic at the top of each column.
Headings - displays a general heading for row and column titles, for example, the date of the request.
Page 20 of 38
Using Excel with Datastream Advance for Office
T1 code - displays Thomson ONE code for the requested series. It is available only when Datastream is
embedded in the Thomson ONE workstation and currently applies to the Equities only.
Transpose - displays individual time series data across the Excel spreadsheet in rows. This is particularly
useful if you are requesting data over very short time periods or lower reporting frequencies, that is
quarterly or yearly. The maximum number of columns that you can use in Excel 2003 and earlier is 255.
Hyperlink to metadata - Adds a hyperlink to the series code to link to the classifications and metadata pages from
Navigator for the series (also enable series that are now dead or inactive to be identified in your workbook)
Currency - displays an additional column with the title Currency and with the traded currency of each
selected series.
Annualise Data - adjusts company accounts data over the time period for companies that have moved their
end of year dates.
Embed as Refreshable Data - ensures that the request is embedded in Excel as a dynamic, refreshable
object when saved. If you do not select this option, the results of the request cannot be refreshed and will
remain as plain text/numbers.
Refresh Button - displays the Refresh button within the request result details. If you do not display this
button, you can refresh or edit the request by using the Request Manager from the Datastream menu.
Auto Refresh - enables you to refresh the embedded request automatically upon opening the spreadsheet.
Errors with AFO controls
Do not allow saving of workbooks – where an error has been detected in the workbook
Display Expression - According to the option selected, the Expression description or number is displayed in
the Static and Time Series request results.
Display Datatype - According to the option selected, the Datatype description or mnemonic is displayed in the
Static request results.
Menu options
Two menu options are available:
Fast Load - enables you to launch the Datastream Advance for Office Add-In for Excel, only when a
Datastream menu option has been selected. This option enables Excel to load more quickly upon start-up.
ShortCut - makes the Static Request, Time Series Request, Company Accounts Request and
Request Management options available from the Excel worksheet right mouse click menu.
Data options
The Not Available String field enables you to type the text that you want displayed in Excel when data is not
available from Datastream. For example, #N/A.
Embedded requests
Check this to suppress comments from being added to Data Channel requests.
Suppress Comments - removes row headings e.g. Date, Type, Currency etc.
Suppress error when AFO cannot write to cell - error message is not displayed when AFO cannot write to a
cell.
Cell referencing - is a method by which you refer to a cell or series of cells in a formula. It can be applied
only to embedded request.
Display message when updating to later version – When you open a Request Table saved in a previous
version of Datastream in a later version, an error message pops up.
Page 21 of 38
Using Excel with Datastream Advance for Office
Expression editing
Select the Show out of date warning to warn you when expressions have not been refreshed.
Intellisense – This option enables you to see the functions and parameters available for the functions with
links to the help files.
Function picker – This option enables you to search and pick the functions and parameters available.for
the functions with links to the help files.
Time series for Lists
Show confirmation dialog – When this option is ticked - a message box is displayed when a series identified as
a list is used and the time series for list tick box is not ticked.
Autocorrect options Delete "..." from the list is removed from Excel‟s default Autocorrect settings whereby "..."
is replaced by the symbol "...".
Datastream Navigator options
The Server field enables you to define the location of the server from which you would like to run Datastream
Navigator.
Symbol Input
Section Symbol Input helps to specify whether the series input codes being used are Datastream supported
ones - DS, ISIN, SEDOL, etc or Thomson ONE codes. Click on the option buttons to specify the input.
Sample Sheet
Samples URL: This specifies the URL from where AFO Samples can be downloaded.
Download Path: The download path for the AFO Samples file can be specified here.
Page 22 of 38
Using Excel with Datastream Advance for Office
3 USING LISTS
CREATING A LOCAL LIST FROM A SET OF CODES (DATASTREAM, ISINS, SEDOLS,
ETC) IN EXCEL (FOR EXAMPLE FROM A BACK OFFICE SYSTEM)
To create a local list:
1.
Select Create List from the Datastream>Tools menu.
2.
The Datastream List Creation dialog is displayed.
3.
Select the Code Range from the Code Range field.
4.
Enter the list description in the List Description field.
5.
Enter the file name in the List File Name field.
6.
Select the Store List Locally, or create a User Created Index by selecting to upload as an X# list.
7.
Click OK.
When you have saved your list, the list is held locally on Datastream, or on the mainframe system, and is
available for immediate use.
Note
Page 23 of 38
The local list facility in the Request Table enables a range of codes to be linked to a local or user
list on the central system and to be regularly updated.
Using Excel with Datastream Advance for Office
4 USING EXPRESSIONS
THE EXPRESSION PICKER
You use the Expression Picker to select expressions. Click the Expression Picker button, to display the
Expression Picker dialog.
The Expression Picker dialog
Show:
Use the Show: drop down box to display: all, local, or global expressions.
Search
Type either the first few letters of the title, or expression in the Find: field.
New Expression
Click the New Expression button to display the Expression Builder, which you use to create new expressions.
Edit
Click the Edit button to edit an expression you have created in the Expression Builder. You cannot edit a
Datastream global expression, but you can use it as a starting point for making a new local expression.
Refresh
Click the Refresh button to up-date the list of expressions held on Datastream.
The Grid Last Downloaded: date and time tells you when the list was last downloaded.
A list of all the expressions available is displayed in the Expression Picker dialog. Each time you create a new
expression this list is automatically updated. When new Datastream global expressions are created, you need to
download them from Datastream using the Refresh facility.
USING THE EXPRESSION BUILDER
You can create and edit your own expressions using Datastream‟s Expression Builder, where you can select the
individual components that make up your expressions.
The Expression Builder dialog
The left window is the work area where you build your expression. Each element of the expression, for
example, a series, is shown as an individual line, which you can edit. Each line element is described in the
adjacent window.
Use the buttons on the toolbar, left of the work area, to enter the individual elements (e.g. series, datatypes,
numbers) that make up your expression.
The work area cursor draws a rectangular box around line elements that are logically grouped. For
example, inserting the function LAG# into the expression also inserts a symbolic series X and a time
period. If you delete LAG#, you will also delete the series and time period that belong to it.
As you build up an expression (max. 78 characters), the expression formula is displayed in the Expression
field for checking.
Expert users can type their expressions in the Expression field - pressing ENTER then expands the
expression into the work area, which can then be edited.
The description you type in the Expression Title field (max. 30 characters) will be saved along with the
expression details and displayed in the Expression Picker for identification.
Page 24 of 38
Using Excel with Datastream Advance for Office
Tools available in the Expression Builder
Function
The Select a Function dialog is displayed. Select a specific Datastream function, the function and its
parameters (e.g., start and end dates) are inserted into the workspace area.
Existing expression
The Expression Picker dialog is displayed. Select an existing Datastream global expression or local expression
to add to your expression. For example, if you want to nest one expression into another. Only expressions with
no symbolic substitution are allowed.
Find Series
Datastream Navigator is displayed. Select a „static‟ or „symbolic‟ series to add to your expression. You can use
the Change Filter facility to select a simple or an extended series filter.
Number
The Enter Number dialog is displayed. Add a number to your expression. A number occupies its own line in the
workspace area, typically after a math operator. Double click the displayed number to enter another value.
Datatype
The Datatype Selection dialog is displayed. Add a datatype after a „static‟ or „symbolic‟ series. You can use the
Datatype dropdown list and mnemonic search to select and add a specific datatype.
Currency
The Currency dropdown list is displayed. Select a different display currency for a „static‟ or „symbolic‟ series.
The currency you select is used for the new expression until you modify it.
Dates
Edit the start and end dates for a selected function. The work space cursor must be positioned over a date
variable line. You have the same start and end date options as you have for normal requests.
Math Operator
Add parenthesis or math operators to your expression. Position the workspace cursor at the insertion point and
click an operator button.
Delete
Delete parts of your expression. For example, details contained within parenthesis. Position the workspace
cursor at the point of deletion and click this button to logically delete expression details.
Undo
Undo your last action in the expression builder workspace. For example, undo the last series added to the
workspace.
Page 25 of 38
Using Excel with Datastream Advance for Office
5 USING THE REQUEST MANAGER
You can create and embed any number and type of data and chart requests in a single worksheet. For example, a
worksheet could contain an embedded time series data request, a static data request, a company accounts data
request, and an embedded Datastream chart all for the same series and time period. If you want to change the
time period for one request, you would need to search through the worksheet to find the required request and
use the right-mouse click Edit option. The Request Management facility, however, enables you to quickly
pinpoint the required request and edit, refresh, autorefresh, or delete its details.
The Request Manager dialog, displayed by selecting Request Management>Request Manager from the
Datastream menu, displays details of all embedded requests within an Excel workbook. To edit, refresh, or
delete a request, click on the request‟s detail line and click the appropriate button.
EDITING AN EMBEDDED CHART
The charts embedded in Excel can be edited back in Datastream. All aspects of the chart can be changed. Here
the series, time period and display can be changed. Line Styles, Text Styles and Fill Styles are a part of display
properties of the chart. They can be customised and saved as schemes. When you create a chart next time, you
can directly apply the saved scheme to the chart.
To edit an embedded chart in Datastream:
1.
Open the worksheet with the chart you want to edit.
2.
Right click on the chart and select Edit Chart option. The chart is displayed in Datastream.
Page 26 of 38
Using Excel with Datastream Advance for Office
3.
To change the time period, click on Time Period button.
To change display properties, Right click on the chart in Datastream and select Properties option. The
Default Chart Properties dialog will appear. Customise the display for your chart by selecting the options
available.
Page 27 of 38
Using Excel with Datastream Advance for Office
4.
Right click on the chart and click Update Chart to transfer the updated chart back to Excel in the same
place.
CHANGING THE PROPERTIES OF A CHART USING VBA
Experienced users can use Excel‟s VBA Design Mode to access and edit the properties of embedded charts the
Properties dialog. On the ChartControl Properties dialog you can change the request description, request
string, autorefresh selection and chart dimensions.
To change the properties of a chart using VBA:
1.
Right-click on the Excel toolbar and select Visual Basic.
2.
Click the Visual Basic Design Mode button on the Visual Basic toolbar.
3.
Click on the chart that you want to edit.
4.
Right-click on the chart to display the Excel menu and select the DatastreamChart>Properties option.
The ChartControl Properties dialog is displayed:
5.
Change the properties as required, click Apply to confirm your changes and click OK to exit the
Properties dialog.
Refresh the chart for the new properties to take effect.
Page 28 of 38
Using Excel with Datastream Advance for Office
6 USING THE REQUEST TABLE
WHAT IS THE REQUEST TABLE?
If your use of Excel involves building models using several requests for data from Datastream, you can use the
Request Table to administrate and edit these refreshable data requests. The request table is an Excel template
with additional facilities for entering request parameters as individual Excel rows.
These parameters include:
Creating and storing regularly used Datastream data or chart requests in the form of a table enables you to:
Enable/disable individual requests when they are required/not required.
View the details of all requests in one glance.
Reference request input parameters from other worksheets.
List requests in the table in the order they need to be processed (to use returned values as input
parameters in subsequent requests).
Specify different cell and worksheet references for individual requests.
Schedule the request table to be processed in the future and „out of hours‟.
Continue processing, even if a datatype within a list of datatypes is invalid.
Add a description against each row in the table.
Copy a code button onto work sheets to access the series/datatype lookup.
Link to charts and data.
YES or NO allow you to set request to YES or NO rather than toggle from Yes to No.
Functionality to update mainframe L# lists in the same way as Datastream Equity Screening.
Request Table and UCTS templates merged to allow existing RT sheets to be converted to merged
template.
Page 29 of 38
Using Excel with Datastream Advance for Office
CREATING A SET OF REQUESTS
To create a set of requests in a Request Table:
Note: You can insert the resulting data, using Data Destination, into several worksheets within the same or
different workbooks.
1.
Select the New Request Table option from the Datastream >Request Table menu.
2.
You are now prompted to save the request table under a new name. Click Yes, supply the Request Table
name and directory location, and click Save.
Note
It is important that you do not overwrite the default Request Table template (Adv_xl.xlt) as this
will form the basis for all your Request Table generation. We recommend that you make a back
up of the template which is installed with Datastream in the location: C:\Program
Files\Datastream\Datastream Advance.
The next stage in creating a set of data or chart requests is to enter the request parameters as a single row in
the worksheet labelled Request Table. To create other rows (i.e. data requests), repeat the following steps for
each request you wish to add.
1.
Click on the worksheet tab labelled Request Table. An empty Request Table is displayed.
2.
Click the Y, Y/N or N button to select the YES option - that is, refresh this request. This option can be turned
off by clicking the Y/N button again, where the cell contents will change to NO.
3.
Select a Request Type by clicking the appropriate button. The buttons are:
○ S = Static data request
○ TS = Time series data request
○ TSL = Time series list data request
○ CAF = Company accounts data request
○ CH = Chart request
○ SCH = Search list format
4.
Select a Format layout type from the dropdown list. You can select:
Format options
Worksheet codes
No headings
X
Row and column headings
RC
Titles with row and column headings
RCH
Titles with row headings
RH
Row and column data transposed with no
headings
T
Row and column data transposed with row
headings
TR
Row and column data transposed with
column headings
TC
Row and column data transposed with row
and column headings
TRC
Data annualised for company accounts data A
items
In addition to the above formats, you can display the currency of the series selected in your request table. This
format option is selected by clicking the Always Include Currency check box on the Options dialog. See
Page 30 of 38
Using Excel with Datastream Advance for Office
Request Table options. This feature is primarily intended to provide compatibility with earlier versions of the
Request Table. If the Always Include Currency option is selected, any format options selected will have the
currency symbol ($) appended to the worksheet code; for example RC$.
5.
Select series or lists (i.e. Local Lists, Datastream mainframe lists and constituent lists) using the Series
Lookup buttons. If the Request Type you selected is S or TS, click the Series Navigation button to display
the Series Selection screen (see Selecting Series). You can select any number of series. If the Request
Type you selected is TSL, click the List Picker button to display the List Picker (see Selecting lists).
6.
Select a datatype, expression, company accounts format or search format (created in the Datastream
interface) by clicking the appropriate button. If you have selected Request Type S, you can select
datatypes (see Selecting Datatypes) and expressions (see Selecting Expressions). If you have selected
Request Types TS and TSL you can only select datatypes. If you have selected Request Type CAF, you
can select company account formats (see Creating company accounts data requests). If you have
selected Request Type SCH, you can select the search format (see Datastream Getting Started Guide).
7.
Place the cell cursor in the next adjacent cell, e.g., G7, and enter either a fixed start date in the form
dd/mm/yy, a relative start date in the form -nY (that is n years ago from the End Date), or -nYE to retrieve
accounts data for n year ends. For static data requests, this field is used to specify the date for which the
data is to be requested. When requesting latest values for static data for company accounts items (i.e.
104) and economic codes, you must enter a space in the Start Date field.
8.
Place the cell cursor in the next adjacent cell, e.g., H7, and specify an End Date in either a fixed date or
relative end date format. This date is only needed for time series and company accounts requests and
can be left blank to specify previous day values.
9.
Place the cell cursor in the next adjacent cell, e.g., I7, and select a data frequency from the dropdown list.
The options are:
○ Daily
○ Weekly
○ Monthly
○ Quarterly
○ Yearly
10.
Place the cursor in the next adjacent cell, e.g., J7. The next step is to specify where the result of the data
request is to be inserted. This can be a specific cell location in any new worksheet within the same
workbook, or a specific cell location in a different workbook. To specify a cell location in a worksheet
within the same workbook:
○ Insert a new worksheet from the Insert menu.
○ Click on the Request Table tab
○ With the cell cursor at J7, click the Data Destination button. The Create Destination Reference screen
is displayed. Click on the required worksheet tab and then click on the required cell location to
automatically paste the cell reference into the dialog, for example:
○ Click OK to insert the cell reference into the request table.
If you want to specify a cell reference in another workbook, simply click the Data Destination button, open
the required workbook, activate the required cell and click OK on the Create Destination Reference screen.
11.
You must now choose whether you want the data destination cell location to be displayed as either plain
text reference or as a dynamic Excel formula. If you select the Display Destination as Excel Formula
option, this enables the position of the data results to be moved in the worksheet (e.g. after inserting a
Page 31 of 38
Using Excel with Datastream Advance for Office
new row or column). If you select this option, any future processing of the Request Table will take into
account the new cell location. If you do not select this option, the data will always be inserted at the
same cell location.
If the destination reference is to a closed external workbook, you must ensure that the Display
Destination as Excel Formula check box is selected to enable the request table to open the workbook.
This is particularly important if you are scheduling the Request Table to be refreshed „out of hours‟ and
the Request Table contains references to external workbooks that will be closed when the process is
run.
12.
Skip the cell column for Status as this is used by Datastream to inform you of the status of the latest
update of this request. OK indicates the update has been successful.
13.
Place the cursor in the next adjacent cell, e.g., L7, and enter a short (optional) description for the request.
14.
To add a chart request to the table, click the CH button. This displays all charts in open workbooks.
Select the chart required and the request string will be entered in the Series Lookup cell and the nearest
cell entered in the destination cell. Note the series used in the request string can be linked via a cell
reference.
15.
From the Excel File menu, select Save to save the details of your Request Table.
The request is now ready to be processed.
REQUEST TABLE OPTIONS
The Request Table can be configured to always display the currency of the selected series and show your own
entered text (e.g, N/A) where data is not available from Datastream. The Always Include Currency option is
provided to ensure compatibility with data tables created with previous versions of the Request Table, i.e.,
DSDDE tables. Selecting this option makes it possible to use DSDDE tables where the currency is always
returned. You are also able to define which AFO Index you would like to add your table to.
To configure these options, click the Options button to display the Options dialog.
Select your Request Table options and click OK.
Page 32 of 38
Using Excel with Datastream Advance for Office
UPLOAD LIST BUTTON
The Upload List button in the request table can be copied to a sheet that has back office codes to upload.
There are two modes that can be configured by right clicking on the button and selecting the list option.
You can create either local or mainframe lists using the Create a new list option, Click here for more details.
Or you can use the same mainframe user list (L#XXXX) each time the back office list in the spreadsheet is
amended by using the Update a Mainframe List option.
Double click the button to display the list details and to update the list.
THE SERIES NAVIGATION BUTTON
You can link the Series Navigation button
to a cell in the Request Table, giving you access to the
Datastream series selection dialogs (for all series including user lists). Double click on the Series Navigation
button on the spreadsheet to select a different series.
Page 33 of 38
Using Excel with Datastream Advance for Office
PROCESSING AND SCHEDULING REQUESTS
You can choose to either process your Request Table straight away or schedule the processing at some date
and time in the future.
To process your Request Table straight away, click the Process Table button. This will launch the DSAPI which
will pass the request details to Datastream in the order that they appear in the list. Requests that fail, for
example the datatype is not suitable for the request, will not prevent the whole batch of requests from being
processed. Only the Status field will be updated for failed requests.
The progress of the update process can be monitored via the DS Access Monitor. You can set
up the DS Access Monitor to be automatically displayed during processing by using the
Configure Communications, accessed by right-clicking the lightning symbol in the system tray. Refer the
Reference chapter of the Datastream User Guide for more details.
To schedule the Request Table for processing out of hours, click the Schedule button. The Request Table
Scheduler dialog is displayed. Enter a date and time in an Excel date format, for example:
You can process the Request Table later TODAY by entering just a time. Click OK to confirm the scheduled date
and time. The Scheduled Update display window in the request table is automatically updated to indicate that
the Request Table has been scheduled.
The message Next Update Scheduled for: DD/MM/YY HH:MM:SS will also appear on the Excel status bar.
Note, you must ensure that Excel is running and the relevant Request Table is open prior to the scheduled date
and time, for the requests to be processed. The destination workbooks do not need to be open as the main table
will open all relevant worksheets provided Display Destination as Excel Formula has been selected for the
relevant requests.
THE AFO INDEX
The AFO Index spreadsheet enables you to schedule several request tables to run at a preset time and date.
These tables are opened, updated, and closed when the AFO Index is run.
Using the AFO index with a 3rd Party scheduler
You can use a 3rd party scheduler to run the requests in the AFO index. For example, Schedule Tasks installed
with Internet Explorer 5.
To use the AFO Index:
Click the Run on startup box and Close down after processing box. This opens the AFO index at the
preset time, runs the requests, and closes the table on completion.
If you want to stop the AFO index from updating the specified request tables after you have opened it, you
have 5 seconds to uncheck the Run on startup box.
Note
Page 34 of 38
The AFO Index only works with request tables.
Using Excel with Datastream Advance for Office
USER CREATED TIME SERIES
This workbook also includes a Request table to enable series to be downloaded manipulated - and then
uploaded these series back to Datastream to be charted.
A user time series is a series of values (data) for different points in time created by you and uploaded for storage
on Datastream. The values can be daily, weekly, monthly, quarterly, or yearly and you can save the series in
management groups to help you organise them. You can use these series in Datastream and AFO charts and
reports. You can combine them with Datastream maintained series and use functions and expressions to
manipulate them. An Excel template is used to create and edit your time series. You can download an existing
series to form the basis of a new one.
THE USER CREATED TIME SERIES TEMPLATE:
Name
The series name (up to 64 characters).
Code
The series code. Use this to retrieve your series in Datastream and AFO.
This must start with TS followed by 6 characters, eg TSUKRPI1.
Mgmt. Group
Management group. 1 - 10 characters. You can have up to 200 series in a group, eg UK.
Decimals
The number of decimal places for your values.
As %
No indicates the series are actual values. Yes indicates the series are expressed as
percentages.
Freq. Conv.
Determines the adjustment to make when you use a series at a lower frequency than it is
stored. For example, using series stored with daily values in a request for weekly values.
Sum
Sum all values for a calendar period. Avg - Average all values for a calendar period. End The value at the end of a calendar period. Act - The actual value at the calendar intervals.
Date align.
For data adjusted for frequency, select where in the calendar period to align the data for
plotting.
Page 35 of 38
Using Excel with Datastream Advance for Office
1st - Plot data from the beginning of the calendar period.
Mid - Plot data from the middle of the calendar period.
End - Plot data from the end of the calendar period.
Carry ind.
For null values. You can leave the values blank or carry forward the previous value.
Yes - carries the previous value. No - leaves the value at null.
Upload type
When editing a series, you can upload only the values that have changed.
Full - uploads all the values in the series.
Partial - uploads the values that have changed.
Set date range
This is used to set the start and end dates, and the frequency for new series. Use this to
change the end date when extending the series.
Optional:
Units
A qualifying unit for your data. For example: tons, U$ millions, index.
Currency
Select a currency for series with monetary values.
Other fields:
Start date
The start date for the series data.
End date
The end date for the series data. Note, you can change this for Partial uploads - only data
after the end date is uploaded.
Frequency
The frequency of values: daily, weekly, monthly, quarterly, or yearly.
CREATING A USER CREATED TIME SERIES
To create a time series:
1.
Select New UCTS table from the Datastream menu>User created time series menu and save the
workbook.
2.
Type a name for the series.
3.
Type the series code. This must start with TS followed by 6 characters, example TSUKRPI1.
4.
Type the management group you want the series to belong to (up to 10 characters) example UK.
5.
Select the number of decimal places for display. Type the number, or select from the drop down box and
click the Add button.
6.
Type the units, (optional). This is a qualifying unit for your data. For example: tons, U$ millions, index.
7.
Select As %. No indicates the values are actual values. Yes indicates the values are expressed as
percentage. Used in the Latest Values and % change over 3 periods report.
8.
Select the type of Frequency conversion. This determines how the series is handled if you use it a lower
frequency than it is stored.
9.
Select the Date alignment for data adjusted for frequency.
10.
Select a Currency for monetary values (optional).
11.
Select the Upload type. Select Full to upload all the values.
Use Partial to upload only the values that have changed when editing a series.
Page 36 of 38
Using Excel with Datastream Advance for Office
12.
Set the date range. Click the Date range button and type the start and end dates.
Select the frequency of the data: Daily, weekly, monthly, quarterly, or yearly.
The dates are displayed in the date range column, ready for values to be added.
13.
Type your values against the dates displayed.
14.
Click the Upload button to save your series. Note the cursor must be in the Code field to upload the
series. You can highlight more than one series to upload several series at the same time.
You can now use this series in Datastream or AFO requests.
EDITING AN EXISTING USER CREATED TIME SERIES
To edit a user created time series:
1.
Select New UCTS table from the Datastream menu>User created time series menu and save the
workbook.
2.
Click the Select code button. Note the cursor must be in the Code field.
Datastream navigator is displayed with the series set up on your Datastream ID.
3.
Search for and select the series you want to edit.
The selected series mnemonic is displayed in the Code field.
4.
Click the Download button. Note the cursor must be in the Code field.
5.
If you want to add new values, click the Set date range button and type a new end date.
6.
Make your changes and select the Upload type.
Use Full upload to overwrite all existing values.
Use Partial upload to update only the new values and change the date in the End date field to indicate
the new values to upload.
Note: see tick box in Options dialog.
7.
Click the Upload button to save the series. Note the cursor must be in the Code field.
To delete a time series:
1.
Place the cursor in the Code field of the series you want to delete.
2.
Click the Delete button to delete the series.
To add a new worksheet to the workbook:
If you want to download or upload a series with an earlier start date or a different frequency, add a new
worksheet.
1.
Click the New sheet button.
A new worksheet is displayed.
To configure the template:
1.
Click the Options button.
The Options dialog is displayed.
2.
Tick the Overwrite all values if series already exists box to overwrite existing values.
Note
Page 37 of 38
The server for Navigator is configured via the Datastream >Options menu.
© 2009 Thomson Reuters. All rights reserved.
Republication or redistribution of Thomson Reuters
content, including by framing or similar means, is
prohibited without the prior written consent of Thomson
Reuters. 'Thomson Reuters' and the Thomson Reuters
logo are registered trademarks and trademarks of
Thomson Reuters and its affiliated companies.
For more information
Send us a sales enquiry at
reuters.com/sales enquiry
Read more about our products at
reuters.com/product info
Find out how to contact your local office
reuters.com/contacts