1
US 20090222142A1
(19) United States
(12) Patent Application Publication (10) Pub. No.: US 2009/0222142 A1
Kao et al.
(54)
(43) Pub. Date:
ELECTRICAL MONITORING AND
Related US. Application Data
CONTROL SYSTEM
(75) Inventors:
(60)
Imin Kao, Stonybrook, NY (U S);
Provisional application No. 61/067,693, ?led on Feb.
29> 2008'
Brenda Pomerance, New York, NY
(US); Robert P- Wong, HuntingIOn,
NY
Sep. 3, 2009
Publication Classi?cation
S
(U )
(51) Int. Cl.
Correspondence Address:
G05B 15/02
(200601)
BRENDA POMERANCE
G05B 15/00
(2006.01)
LAW OFFICE OF BRENDA POMERANCE
310 West 52 street, suite 27B
(52)
US. Cl. ...................................................... .. 700/291
NEW YORK, NY 10019 (US)
(57)
(73)
Assignee:
(21)
(22)
BSafe ElectriX, Inc., Manhasset,
ABSTRACT
_
_
_
_
_
NY (Us)
A system for monitoring and controlhng the electrical infra
App1_ NO;
12/380,460
an operating characteristic in the building, and a processor for
Filed;
Feb, 27, 2009
structure of a building includes at least one sensor for sensing
receiving information from the at least one sensor and pre
dicting a future operating characteristic.
600
am
m
sea
58$
set 1T1 e05
setfL1 606
set fA1 607
set i i1 608
SW‘! Samples in
?irculaf bU?Qf 610
store samples in
circular buffer 611
store samples in
circular butler 612
store samples in
circular buffer 613
analyze sample
analyze sample
analyze sample
analyze sample
Window 615
window 616
window 617
window 618
M
620
A
622
yes
A
yes
set fT2
625
623
624
yes
set fA2
>.
.
627
set i i2
BB
628
yes
—>@
Store Samples in
Circular buffer 630
store samples in
circular buffer 631
store samples in
circular butler 632
store samples in
circular buffer 633
analyze sample
analyze sample
analyze sample
analyze sample
window 635
window 636
window 637
window 638
con?dence
1
m
{196ml
640A
Yes
con?dence
1
no
@
fault
641A
yes
i V"
con?dence
A
no
AA
Vi
confidence
fault
no
642A
yes
ll
(9
l W
fault é g
61 3A
yes
V
O
action 660A
combine 670 =
action 6608
action 660C
Patent Application Publication
Sep. 3, 2009 Sheet 1 0f 10
US 2009/0222142 A1
sensor6
sensor 5
display 30
controller 20
25
processor 10
printer 31
comm 40
comm 41
tel net 101
comm net 102
server 110
server 100
Fig.
1
device
50
Patent Application Publication
Sep. 3, 2009 Sheet 2 0f 10
US 2009/0222142 A1
current
Fig. 2
<.___>
time
1 mlcrosec
vo?age
Fig. 3
time
<——-—->
1 microsec
Fig. 4
current
time
Patent Application Publication
Sep. 3, 2009 Sheet 3 0f 10
US 2009/0222142 A1
current
Fig. 5
even?
event2
time
<—>
1 microsec
voltage
Fig. 6
H
H
curveA
WVAVM' RVAAVNANTrT/Tm
curveB
I
|
lillJIllllllllllllll
curveC
H W H MW
l I‘
Patent Application Publication
Sep. 3, 2009 Sheet 4 0f 10
US 2009/0222142 A1
temperature
@
temp ___
red region
__________________________ __ | _
threshold
yellow region
@
green region
-. _+
current
maximum
allowable
current
reference
Fig. 9A
reference
Fig. 9B
Patent Application Publication
Sep. 3, 2009 Sheet 5 0f 10
US 2009/0222142 A1
OO
IN
r_—\
201
21 1
212
231
232
;__/
255
l—__
250
_____I
/—'—'\
241
202
221
242
222
\____J
Fig. 10
Patent Application Publication
Sep. 3, 2009 Sheet 6 0f 10
US 2009/0222142 A1
E
F__—\
301
311
331
312
332
\_—J
355
Fig. 11
I___—
1
350
_._—_|
’—_?
341
302
321
342 |_
322
\—-J
_3__0
319
371
___________________ a
372
[I
_________ ~-
M
[I
0
_
385
386
3:74 377
376
375 _________________________ " 370
M
I]
I]
D
360
Patent Application Publication
Sep. 3, 2009 Sheet 7 0f 10
A o
US 2009/0222142 A1
£02
401
403
470
403 405
412
411
I 432
407
Z
407
m
455
450
480
460
\J
404
406
[I
404
I]
D
408
|_
408
402
490
Fig. 12A
Fig. 128
Patent Application Publication
Sep. 3, 2009 Sheet 8 0f 10
US 2009/0222142 A1
5.0.Q
510
LINE
1
current sensor
511
temperature
sensor 520
light sensor
530
—>
LOAD
550
audio sensor
540
I
I
I
S/H DAC
521
S/H DAC
531
S/H DAC
541
l
I
I
ADC 52
ADC 532
ADC 542
S/H DAC
551
S/H DAC
561
l
l
ADC 552
ADC 562
ground
LOAD
fault
590
sensor
_
H-
1
fL
1
fA
fl
560
v
1
microprocessor 570
506
586
siren
585
NEUTRAL
—D
Patent Application Publication
Sep. 3, 2009 Sheet 9 of 10
US 2009/0222142 A1
600
also
m
@212
m
an
set "1 605
set fL1 606
set 1A1 607
setfi1 608
store samples in
circular buller 610
store samples in
circular buffer 611
store samples in
circular butler 612
store samples in
circular buffer 613
analyze sample
analyze sample
analyze sample
analyze sample
window 615
window 616
window 617
window 618
I
"0
l
l
63
@
set fl‘ 2
625
yes
set 1 i2
628
Store $aml3|e$ in
store samples in
store samples in
store samples in
Circular buffer 630
circular buffer 631
circular buffer 632
circular buffer 633
analyze sample
analyze sample
analyze sample
analyze sample
window 635
window 636
window 637
window 638
confidence
llno
problem
624
640A
fault
confidence
Agull
641A
con?dence
confidence:
llgull
642A
lllo?ult
643A
5
es
:
ey V" ‘
@
V1 1
e
vw
<9
H"
redundant lault analysis 650
"0
ault
no
655A
yes
action 660A
ault
6555
yes
l
action 6608
combine 670 ‘
A
Fig. 14
no
fault
655C
yes
action 660C
Patent Application Publication
Sep. 3, 2009 Sheet 10 0f 10
US 2009/0222142 A1
serial arcing
temperature
normal (no arcing)
time
normal (no arcing)
current
serial arcing
time
normal (no arcing)
FFT(current)
serial arcing
]/
1 00
200
300
\I
frequency
(HZ)
Fig. 17
Sep.3,2009
US 2009/0222142 A1
ELECTRICAL MONITORING AND
CONTROL SYSTEM
equipment” and this includes receptacles, light ?xtures, and
smoke alarms, among other things.
[0009] Beginning January 2008, only “combination type”
AFCIs Will meet the NEC requirement. The 2008 NEC
[0001] This application claims priority from US. provi
sional patent application Ser. No. 61/067,693, ?led Feb. 29,
2008, having common inventors herewith.
BACKGROUND OF THE INVENTION
[0002] The present invention relates to building electrical
system monitoring and control.
[0003] US. Patent Application Publication US 2007/
0155349 (Nelson et al.) discloses a system for selectively
controlling electrical outlets using poWer pro?ling. An elec
trical outlet includes a socket for receiving a plug, an outlet
identi?cation and a signal detector for detecting a signal from
the plug, for sending the signal and outlet identi?cation to a
controller, and for receiving a command from the controller,
such as to reduce or cut poWer to the device plugged into the
outlet When the device’s operation deviates from an opera
tional pro?le for the device. The system may be used With
motion sensors and other environmental components.
[0004] Blemel and Furse, “Applications of Microsystems
and Signal Processing for Wiring Integrity Monitoring”, 2001
IEEE Aerospace Symposium, 12 pages, the disclosure of
Which is hereby incorporated by reference, discuss detection
and prevention of Wiring related problems in aerospace
vehicles. Blemel presents a system in Which sensors in an
aircraft interface With processors; the processors are net
Worked together on an aircraft and are able to communicate
With a central Web server. The processors implement algo
rithms for fault detection, identi?cation, location, prediction
and messaging.
[0005] US. Pat. No. 5,991,327 (Kojori) discloses a control
ler that receives a plurality of sensor readings, including some
extra readings for diagnostic protection, and processes the
readings to predict and control voltages and currents in an
electric arc fumace.
[0006]
An arc fault circuit interrupter (AFCI) is a circuit
breaker designed to prevent ?res by detecting non-Working
electrical arcs and disconnect poWer before the arc starts a
?re. Arc faults in a home are one of the leading causes for
household ?res. AFCIs resemble a GFCI/RCD (Ground
Fault Circuit Interrupt/Residual-Current Device) in that they
both have a test button. GFCIs are designed to protect against
electrical shock, While AFCIs are primarily designed to pro
tect against ?re.
[0007] Starting With the 1999 version of the National Elec
trical Code (NEC, also called NFPA 70) in the United States,
AFCIs are required in all circuits that feed receptacles in
bedrooms of dWelling units. This requirement is typically
accomplished by using a kind of circuit-breaker (de?ned by
UL 1699) in the breaker panel that provides combined arc
fault and overcurrent protection. Not all U.S.A. jurisdictions
have adopted the AFCI requirements of the NEC as Written.
An AFCI detects sudden bursts of electrical current in milli
seconds, long before a standard circuit breaker or fuse Would
trip.
[0008]
In 2002, the NEC removed the Word “receptacle”
leaving “outlets”, in effect adding lights Within dWelling bed
rooms to the requirement. The 2005 code made it more clear
requires installation of combination-type AFCIs in all 15 and
20 amp residential circuits With the exception of laundries,
kitchens, bathrooms, and garage, and un?nished basements.
[0010] Zigbee is a Wireless technology that does not have
the speed or bandWidth of Wi-Fi or Bluetooth, but is designed
for Wireless building controls. ZigBee is based on IEEE Stan
dard 802.154 and creates a self-organizing Wireless netWork
Where any ZigBee-compliant device introduced into the envi
ronment is automatically incorporated into the netWork as a
node. A number of manufacturers are currently developing
devices that incorporate this technology, including sWitches,
thermostats and other common monitoring and control
devices. ZigBee devices are battery poWered, Which means
that they do not need any interconnecting Wiring. These
devices remain dormant until they are activated by an incom
ing signal, so their batteries can last for months or even years
Without replacement.
[0011] ZigBee devices have the ability to form a mesh
netWork betWeen nodes. Meshing is a type of daisy chaining
from one device to another. This technique alloWs the short
range of an individual node to be expanded and multiplied,
covering a much larger area. One ZigBee netWork can contain
more than 65,000 nodes (active devices). The netWork they
form in cooperation With each other may take the shape of a
star, a branching tree or a net (mesh). There are three catego
ries of ZigBee devices: ZigBee NetWork Coordinator. Smart
node that automatically initiates the formation of the netWork.
ZigBee Router. Another smart node that links groups together
and provides multi-hopping for messages. It associates With
other routers and end-devices. ZigBee End Devices. Sensors,
actuators, monitors, sWitches, dimmers and other controllers.
[0012] Z-Wave is an interoperable standard for residential
and light commercial devices, providing reliable, con?rm
able, loW bandWidth, half duplex tWo Way control communi
cations via Wireless mesh neWorking. The Z-Wave develop
ment platform is described at WWW. Zen- sys .com. The Z-Wave
Protocol is for communicating short control messages from a
control unit to one or more slave units. Slave units can for
Ward commands to other slave units. The ZM3102N Z-Wave
Module contains the ZW0301 Z-Wave Single Chip, system
crystal and RF front-end circuitry. The ZW0301 Single Chip
includes an RF transceiver, 8051 MCU core, SRAM, Flash
Memory for Z-Wave Protocol and OEM Application storage
softWare, Triac Controller, and various hardWare interfaces.
[0013] Motorola sells Home Monitoring and Control Sys
tem Wireless Temperature Sensors, namely model
HMTS1050 and model HMSM4150, that are intended to be
placed in a room, and programmed With an upper and/or
loWer limit. When the limit is exceeded, the system sends a
text alert to a cell phone or e-mail.
[0014]
While there is concern about the electrical infra
structure of buildings, including residential and commercial,
there is still room for improvement.
SUMMARY OF THE INVENTION
[0015] In accordance With an aspect of this invention, there
is provided a system for monitoring and controlling the elec
“Article 100 De?nitions” of the NEC as “A point on the
trical infrastructure of a building.
[0016] It is not intended that the invention be summarized
Wiring system Where current is taken to supply utiliZation
here in its entirety. Rather, further features, aspects and
that all outlets must be protected. “Outlets” is de?ned in
Sep.3,2009
US 2009/0222142 A1
advantages of the invention are set forth in or are apparent
from the following description and drawings.
BRIEF DESCRIPTION OF THE DRAWINGS
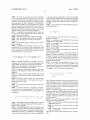
[0017]
FIG. 1 is a block diagram showing the elements of
the present system;
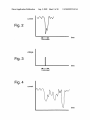
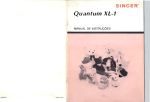
[0018] FIG. 2 is a chart showing instantaneous arcing;
[0019] FIG. 3 is a chart showing how a digital optical sensor
reacts to the signal of FIG. 2;
[0020] FIG. 4 is a chart showing continuous arcing;
[0021] FIG. 5 is a chart showing two instances of single
arcing;
[0022] FIG. 6 is a chart showing how a digital optical sensor
reacts to the signal of FIG. 5;
[0023] FIG. 7 is a chart showing, as “curveA”, the current
versus time for an intermittent contact; as “curveB”, a sam
pling rate that is dynamically changed; and as “curveC”, the
output of a sensor whose sampling rate is dynamically
changed;
[0024]
[0025]
FIG. 8 shows a vectoriZed map;
FIGS. 9A and 9B are curves referenced in explain
ing iFDD;
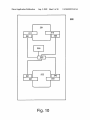
[0026] FIG. 10 is a block diagram showing a faceplate for
sensing operation of a device plugged into an outlet;
[0027] FIG. 11 is a block diagram showing a faceplate for
sensing operation of a device plugged into an outlet, and for
terminating power when an exception condition occurs;
[0028] FIGS. 12A and 12B are block diagrams showing a
back view and a side view of a current tap for sensing opera
tion of device plugged into it;
[0029]
FIG. 13 is a schematic of a circuit according to the
present invention;
[0030]
FIG. 14 is a ?owchart for the circuit of FIG. 13;
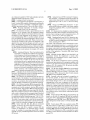
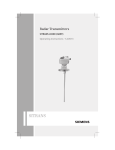
[0031]
FIG. 15 shows temperature vs. time curves for nor
mal operation and serial arcing;
[0032]
FIG. 16 shows current vs. time curves for normal
operation and serial arcing; and
[0033]
FIG. 17 shows FFT frequency spectra for normal
operation and serial arcing.
DETAILED DESCRIPTION
[0034]
FIG. 1 shows sensors 5, 6 coupled to controller 20.
a wall on/ off switch, a wall dimmer, a fusebox, power-carry
ing wires, communications wires and so on. The operating
condition includes environmental conditions such as tem
perature, humidity and so on. The sensing occurs in a manner
suitable for the device, and may include temperature read
ings, voltage readings, power readings, image readings,
acoustic readings and so on. In the case of communication
lines, sensing may include the name and identity of a device,
such as its Internet Protocol (IP) address, and other network
monitoring functions. The sensing may occur in a passive or
an active mode. Sensor 6 is generally similar to sensor 5, but
senses other devices, demonstrating that there are plural sen
sors in the present con?guration.
[0038] For a new installation, sensors 5, 6 may be built-in,
and their location optimiZed according to a procedure. For an
existing installation, sensors 5, 6 can be retro?t via plug-in or
stick-on modules designed to minimize installation dif?culty.
[0039] Sensor 5 may be similar to Tmote Invent, a fully
packaged wireless sensing unit built on Moteiv’s Tmote Sky
wireless module, the follow-on to Moteiv’s Telos sensor.
Moteiv was purchased by Sentilla, and the Tmote Invent is no
longer offered. Tmote Invent, designed for industrial appli
cations including building monitoring and security control,
included integrated sensors for light, temperature, vibration
(2-axis accelerometer) and sound (microphone). Tmote
Invent included a speaker for auditory feedback, headphone
jack for discrete applications, and LEDs for visual feedback.
Included with each Tmote Invent Application Kit was
Moteiv’s robust distribution of the TinyOS open-source oper
ating system. Designed for low-power, long-lived mesh net
working, the distribution allows application developers to
tune and con?gure the system through highly ?exible inter
faces. The result was a customizable yet robust low-power
sensing system. Features included: Low power wireless mesh
technology, Programming and data collection via USB,
Light, Temperature, Acceleration, and Sound sensors,
Speaker, LEDs, and User input buttons, rechargeable battery
that charges through any standard USB port, 250 kbps 2.4
GHZ IEEE 80215.4 Chipcon Wireless Transceiver, Interop
erability with other IEEE 80215.4 devices, 8 MHZ Texas
Instruments MSP430 microcontroller (10 k RAM, 48 k
Flash), Integrated antenna with 50 m range indoors/125 m
range outdoors, Ultra low power consumption.
wireless connection. Local communication network 25
[0040] Sensor 5 is associated with one of a variety of
devices (not shown), such as an electrical receptacle, a face
Sensor 5 uses a wireline connection, while sensor 6 uses a
couples processor 10, controller 20, display 30, printer 31,
plate, a circuit breaker, an air-conditioning unit, a refrigerator,
and communication interfaces 40, 41. Each of processor 10,
controller 20 and communication interfaces 40, 41 may be
and so on. Sensor 5 may have local data analysis capability.
[0041] Multiple characteristics of the same device or line
one or more general purpose computers programmed accord
may be sensed, to provide a variety of readings, possibly
redundant, discussed below.
ing to the present invention.
[0035] Communications interface 40 is coupled via suit
[0042]
Controller 20 receives the sensor readings and stores
able means, such as a wireline or wireless connection, to
them in a storage device (not shown). In cooperation with
public switched telephone network 101, which in turn is
coupled to third party server 110. The third party may be, e.g.,
processor 10, controller 20 processes the sensor readings.
[0043] For example, controller 20 may determine if a sen
sor reading is outside of a range, and then alert processor 10
that emergency processing is needed. If the sensor reading is
within the range, then controller 20 simply stores the reading
a police station, ?rehouse, or other service.
[0036]
Communications interface 41 is coupled via suit
able means, such as a wireline or wireless connection, to
communications network 102, such as the Internet, which is
also coupled to server 100 and device 50. Server 110 is
coupled to server 100, such as directly or via communication
network 102.
[0037] Sensor 5 senses the operating condition of one or
more components, such as a wall receptacle, a plug-in group
of receptacles (also referred to as a current tap or power strip),
so that processor 10 will process it in due course.
[0044]
Processor 10 processes sensor readings to predict
faults and to detect faults. Processor 10 reports status of the
devices and wires being monitored to display 30, printer 31,
and possibly other noti?cation devices such as an audible
alarm. In some cases, processor 10 takes control action on its
own, such as isolating failed devices by eliminating power. In
Sep.3,2009
US 2009/0222142 A1
other cases, processor 10 responds to instructions entered
[0056]
locally by an input device (not shown), or received from a
communication. Generally, sensor readings are sent from
sensor 5 to controller 20, and control information is sent from
remote controlling unit, such as server 100 or 110.
[0045]
Processor 10 may also communicate With conven
tional monitoring systems, such as home security systems via
an interface (not shoWn).
[0046]
Processor 10 also reports status to server 100 and
server 110.
[0047] Server 100 and server 110 can query processor 10
for status. For example, if sensor 5 is a camera, then server
100 can command processor 10 to obtain an image from
Event-triggered sampling relies on bi-directional
controller 20 to sensor 5.
[0057]
Sensors can include current sensors (for example,
Hall-effect sensors), temperature sensors such as a thermo
couple, humidity sensors, optical sensors, spatial thermal
imaging sensors (infrared cameras), other regional sensors,
and so on. Sensors can be analog or digital.
[0058] In one embodiment, the ?rst and second event con
ditions are prede?ned, such as by a person. Prede?ned event
conditions exhibiting a certain pattern over an approximate
sensor 5.
time interval are sometimes referred to as a ?ngerprint or
[0048] Server 100 functions in similar manner as processor
10, except server 100 can run more sophisticated software,
and can combine readings from a Wider variety of sensors and
pro?le. Analysis is typically called ?ngerprint analysis With
pattern recognition.
systems. For example, server 100 may run image processing
[0059] For example, When a device is plugged into a recep
tacle, there may be an immediate burst of current activity,
softWare that is beyond the processing capability of processor
possibly corresponding to sparks on the blades of the plug;
1 0.
this corresponds to a ?rst ?ngerprint. As another example, a
device that is plugged into a receptacle and changed from an
“off” to an “on” condition exhibits a particular pattern of
current activity, corresponding to a second ?ngerprint.
[0060] The analysis softWare determines Whether a normal
[0049] Server 100 can poll processor 10 for its status, and
receive messages from processor 10, either periodically or in
response to events. Server 100 can doWnload updates to pro
cessor 10.
[0050]
Since server 100 communicates With many systems,
it serves as a one-stop point of contact for a user, such as a
homeoWner aWay from home. The user can communicate
With server 100 via device 50, Which may be a personal
computer, cellphone With Internet broWsing capability,
vehicle telephone, or other suitable device. Server 100 may
communicate alerts or other status information to device 50.
[0051]
For example, a third party server (not shoWn) may
be a child location tracking service, and the user can readily
determine, via device 50, Whether the child is near a failed
receptacle.
[0052]
Energy conservation procedures are implemented
When the sensed information is used to control the devices
being sensed.
[0053]
In a fault detection and diagnosis (FDD) process,
sensor readings are obtained and analyZed to detect and/or
predict faults. A “fault” refers to any operation outside a
“normal” operating range, that is, cessation of operations is
not necessarily needed to be in a fault condition. For example,
an electrical outlet With serial arcing is likely to exhibit fault
characteristics. As another example, excessive energy use by
a device may be considered a fault, and the device can be
automatically controlled to reduce its energy usage.
[0054]
Sampling sensors at a loW rate may miss events such
as transients occurring betWeen sampling points. HoWever,
generally, it is not practical to continuously sample many
event is occurring by comparing the duration of activity With
the duration of the knoWn ?ngerprints; if the duration is
outside the ?ngerprint time bounds, then an abnormal event is
occurring and a fault is likely.
[0061] The analysis softWare is further able to determine
Whether a normal event is occurring in a normal manner by
comparing the pattern of actual activity With the patterns of
the knoWn ?ngerprints, and determining abnormal operation
exists When the actual pattern is outside the threshold of the
?ngerprints, and so a fault is likely.
[0062] The system has the capability to learn from neW
information or patterns not previously de?ned, and can con
duct signal-based FDD, and can incorporate such neW pat
terns With a learning tool, such as an expert system, that
expands the knoWledge database for FDD.
[0063]
In another embodiment, event conditions are
learned by the analysis system.
[0064] For example, initially “normal” is de?ned as a par
ticular value, and “Within normal range” is de?ned as a pre
determined difference from the particular value. When the
system detects operation outside of normal range, it produces
an alarm; if a human then accepts the operation regularly,
such as three times, the system adjusts the predetermined
difference to a neW amount, thereby learning the acceptable
behavior of the system.
[0065]
Use cases Will noW be discussed With respect to
arcing.
sensors at a high sampling rate, because (i) a large amount of
[0066]
data Will need to be transmitted, (ii) When comparing data
from different sensors, synchronization becomes dif?cult
With huge volumes of data, and (iii) storage limitations make
it costly to save huge amounts of data; typically only a pre
trons jump across a gap. UnWanted arcs in electrical circuits
de?ned amount of data is saved Which limits historical analy
sis to only the timeframe of predetermined amount of data.
[0055] An event-triggered sampling rate is determined as
folloWs. A ?rst sensor is sampled at a higher data rate than
Arcing refers to an electrical current in Which elec
can cause ?res.
[0067]
The duration of a single arcing event is generally
instantaneous, such as less than one microsecond. The ampli
tude of the instantaneous spike in an arcing event is charac
teriZed by an initial decrease in current folloWed by an
increase in current, as shoWn in FIG. 2. It is helpful to distin
guish betWeen the spikes in a series of single arcing events,
lyZed, and When ?rst event conditions are met, the sampling
rate of other sensors is adjusted, the adjustment occurring
rather than treat a series of spikes as one signal. FIG. 2 shoWs
an instance of a single arcing event.
[0068] FIG. 3 shoWs hoW an optical sensor detects the
during a predetermined time interval or until second event
arcing event of FIG. 2. Generally, the optical sensor’s digital
conditions are met.
output corresponds to the spark that a human observes.
other sensors. The sensor readings from all sensors are ana
Sep.3,2009
US 2009/0222142 A1
[0069]
Continuous arcing signals represent continuous arc
intervals is chosen for ease of illustration; in actuality, the
ing due to, e.g., intermittent contact or an aging connection,
number of intervals is about 50-500 intervals, or an interval
and display a ?ngerprint detectable using FDD and pattern
recognition. Continuous arcing signals are normally beloW
the regular signal amplitude because of the increase in contact
amount determined by a FDD algorithm.
[0080] Use of a dynamic sampling rate increases the chance
that events of interest Will be captured, While reducing the
data rate during “normal” operation, When no events of inter
est are occurring, from a fault detection perspective.
[0081] A vectoriZed map for intelligent fault detection and
resistance, and normally display repeatable patterns useful
for diagnosis. FIG. 4 shoWs a typical continuous arcing signal
pattern. The current initially is at a steady-state level. When
continuous arcing occurs, the current displays a quick drop in
values and jumps up and doWn With a ZigZag pattern. The time
duration is about 0.01-2 seconds.
[0070] Use Case 1: FDD Based on Fingerprint
[0071] FIG. 5 is a chart shoWing tWo instances of single
nates With XY axes. Every tWo sets of data from tWo sensors
can be used to construct a vectoriZed map to represent the
characteristics of faults of a system, in a Way similar to that of
arcing, labeled “eventl” and “event2”. The abscissa (x-axis)
XY Cartesian coordinates With points on the XY space rep
shoWs time While the ordinate (y-axis) shoWs current. In this
example, sensor 5 is an analog current sensor, Whose output,
shoWn in FIG. 5, is provided to processor 10, Which detects
When the signal amplitude has exceeded ?ve times the normal
signal amplitude for less than one microsecond, and deter
mines that this is an arcing event because such behavior ?ts
the characteristics of the arcing ?ngerprint.
[0072] After determining that an arcing event exists, in this
example, processor 10 continues to monitor the signal. One
single arcing event per 5 minutes is de?ned as acceptable.
TWo or more single arcing events per 5 minutes is de?ned as
diagnosis (iFDD) and redundancy Will noW be discussed.
[0082]
A vectoriZed map is akin to the Cartesian coordi
resented by the coordinates (x, y). This type of vectoriZed
map, after calibration, can provide very useful information
for diagnosis. FIG. 8 provides an illustration of hoW this type
of vectoriZed map can be used.
[0083] In FIG. 8, the current is in the horiZontal axis, and
the temperature measured at a prescribed location is in the
vertical axis. Each measurement has its oWn threshold value
above Which a fault can be triggered, as shoWn in the “red
region” area With the arroWs indicating the “max. alloWable
current” and the “temperature threshold”. For example, an
operating situation illustrated by the point “c” indicates such
a possible fault, and processor 10 reports this condition to
situation that requires immediate attention due to the pres
server 100. Four or more single arcing events per 5 minutes is
de?ned as a threat, and processor 10 sends a signal to a circuit
ence of fault. When such tWo signals are plotted on the vec
toriZed map, an intermediate region indicated by the “yelloW
breaker (not shoWn) to shut off the current supplied to sensor
5, and of course, any device that is draWing such current, and
region” does not, by de?nition, exceed the threshold of safety;
hoWever, the combination of marginally safe operation based
processor 10 also reports its automatic shut off to server 100.
on the tWo sensors can present a safety concern if the operat
[0073] Use Case 2: FDD With Redundancy
[0074] FIG. 6 is a chart shoWing hoW a digital optical sensor
reacts to the signal of FIG. 5, and generally corresponds to the
sparks that humans identify as arcing.
[0075] In this example, processor 10 receives the output of
ing parameters are maintained at this level for extended
period of time. The point “b” illustrates such a condition in
this region, Which may cause a fault in due time. The “green
an analog current sensor and a digital optical sensor. When the
[0084] Such vectoriZed map of a pair of sensory data can be
applied to include more pairs of data. If there are n such pairs,
We effectively Will have n Ways of looking at the fault under
consideration. The information rendered by these n different
current sensor senses an amplitude of at least ?ve times nor
mal and the optical sensor turns on, then processor 10 con
cludes that an arcing event has occurred, Without concern for
the duration of time that the analog signal amplitude exceeds
?ve times the normal. Subsequent processing of processor 10
may be as in use case 1.
[0076]
Use Case 3: FDD With Change in Sampling Rate
[0077]
FIG. 7 is a chart shoWing, as “curveA”, the current
versus time for an intermittent contact; as “curveB”, a sam
region” is the region of safe operation, illustrated With a point
a
sources can complement one another and corroborate to ren
der a more reliable diagnosis because of the redundant infor
mation.
[0085] An iFDD system is adopted, Which is capable of
exploiting both time-domain and frequency-domain analysis
to complement each other. Such system provides redundancy
pling rate that is dynamically changed; and as “curveC”, the
in data analysis and can deliver more precise diagnosis
output of a sensor Whose sampling rate is dynamically
because information on both domains are utiliZed and cor
changed.
roborated. Such kind of domain redundancy in analysis can
[0078]
Let it be assumed that curveA represents an analog
signal for a connection that is not secure, i.e., a connection
that exhibits an intermittent contact situation. Assume the
sampling rate is as shoWn in curveB, and that curveC repre
sents What is sampled, such as a sensor that turns on When the
current is beloW a threshold value, shoWn as “threshold”
relative to curveA.
[0079]
Beginning at the left side of curveC, no signal is
produced, so the sampling rate stays at a ?rst loWer rate. Then,
When a signal is produced, the sampling rate is shifted to a
second higher rate creating a smaller sampling interval that
improves the likelihood of capturing critical information. The
sampling rate remains at the higher rate until no signal is
produced in ?ve successive sampling intervals, at Which time
the sampling rate is shifted back to the ?rst loWer rate. Five
be achieved by signal processing algorithms such as Wavelet
analysis.
[0086]
Using multiple sensors: redundancy can also be
established by using multiple pairs of sensory information.
For example, the “VectoriZed Map for iFDD” discussed
above uses a pair of sensory information. When a different
pair of data is employed for FDD, the results can provide
“redundancy” to the ?rst diagnosis. The additional diagnosis
can con?rm the results of the ?rst diagnosis, or to provide
additional insights to the ?rst diagnosis. In either case, the tWo
complements each other and can enhance the accuracy of the
diagnosis. As a result, the con?dence level of FDD is
increased.
[0087] The “redundancy” referred to above is a result of
having more sensors than the minimum set (in this case, one
Sep.3,2009
US 2009/0222142 A1
set of data pair) needed for FDD. Such redundancy provides
[0098] Analog Devices AD590 2-Terminal lC Tempera
additional bene?ts in the process of FDD.
[0088] Learning Will noW be discussed.
ture Transducerian integrated circuit that produces an
output current proportional to absolute temperature, at
[0089] Event-triggered iFDD depends on the detection of
events. A system that is capable of learning and modifying the
recognition of events is desirable to intelligently adapt to
temperatures up to 150° C. (316° F.). See WWW.analog.
different operating conditions. This can be done as folloWs:
[0090] Recognize ?ngerprint: for example, refrigera
com.
[0099] Omega.com 44000 Series ThermistoriA ther
mally sensitive resistor available in tWo types: negative
temperature coe?icient (NTC), or positive temperature
coe?icient (PTC).
torituming off and on of the compressor.
[0091] The transition Will emit a signal Which has its oWn
[0100]
?ngerprint. As an example, When the ?ngerprint changes
resistance and reduce their resistance With increases in tem
suddenly, a fault is likely to be developed in the system. The
recognition of such ?ngerprint and its changes is a reliable
Way of implementing iFDD. As another example, shoWn in
FIGS. 9A and 9B, the reference ?ngerprint is shoWn in solid
perature. Epoxy coatings are used for temperatures from —50
to 150° C. (—58 to 316° F.). See WWW.omega.com.
[0101] Betatherm BetaLinear 36K53A1 thermistor, pro
viding up to 400 times the output of a thermocouple With
line from the operation Without fault. When a fault is devel
no need for junction temperature or lead Wire compen
sation, operating at 0 to 100° C.
The output of the temperature sensor element 231 is trans
mitted, at predetermined intervals, to a controller, such as
oped (in this a leakage in the system), the ?ngerprint of the
signal for the same operation changes and can be used for
iFDD. The ?ngerprint (in solid lines) of reference is the same,
but the response from different sources of fault can be differ
ent. This can also be utiliZed as information for FDD. The data
shoWn are from Wavelet analysis (for example, cD3 Wavelet
data).
[0092]
Learning of behavior: This is best understood by
an example. Let’s take the air-conditioner as an example,
With a compressor for the heat exchange cycle. When the
compressor has been operating normally for a While, a
certain reference operating performance is established.
At some point, a WindoW in the room Was left open
Which causes the unit to operate harder and turn on for
longer period of time, deviating from the nominal oper
ating behavior. If this persists, a Warning can be issued to
the use to check the surrounding and check if WindoWs/
doors are to be closed to bring the air-conditioner back to
normal operations. This learning behavior can save
energy by using the aforementioned iFDD algorithm.
[0093] A faceplate for an electrical receptacle Will noW be
discussed. The faceplate has a sensor for sensing operation of
the device plugged into the electrical receptacle.
[0094] FIG. 10 shoWs an embodiment Where the sensor is
on the backside of the faceplate. An embodiment Where the
sensor is on the front side of the faceplate is contemplated, but
not shoWn. As used herein, front side is the side that is visible
When the faceplate is installed over an electrical receptacle.
[0095]
FIG. 10 shoWs faceplate 200 having apertures 201,
202. In a standard receptacle, there are tWo receptacles, a top
receptacle and a bottom receptacle. Aperture 201 surrounds
the top receptacle, While aperture 202 surrounds the bottom
receptacle. Faceplate 200 also has sensor strips 211, 212, 221,
222, each of Which is formed of a heat conducting material,
such as used to dissipate heat from computer chips, described
for example in European Patent EP0696630, “Heat conduc
tive material and method for producing same”, Feb. 14, 1996,
the disclosure of Which is hereby incorporated by reference.
The Width of each sensor strip is such that its inWard edge,
relative to the aperture is determined so that the inWard edge
contact a blade of a plug that is plugged into the receptacle.
[0096] Sensor strips 211, 212, 221, 222 are constructed
similarly. For brevity, only sensor strip 211 is discussed.
[0097] Sensor strip 211 is coupled to element 231 that
converts its temperature to an electrical signal. Coupling
occurs, for example, by connecting element 231 to sensor
strip 211 via epoxy. Suitable temperature sensors for element
231 include:
NTC thermistors have a highly non-linear change in
processor 10. Speci?cally, the output of the temperature sen
sor element is provided to transmitter element 250, such as
the ZM3102N Z-Wave Module, described in the background
section of this application. Transmitter 250 obtains poWer
from battery 255.
[0102] Although faceplate 200 has been described in an
embodiment Wherein the temperature is sensed, other
embodiments are contemplated, such as Where current or
other characteristic is sensed.
[0103] FIG. 11 shoWs a faceplate that senses an operating
condition and, upon detection of an exception condition, cuts
off poWer to the electrical receptacle and noti?es an external
processor. FIG. 11 is similar to FIG. 10, and only the differ
ences are discussed for brevity.
[0104]
FIG. 11 shoWs faceplate 300 that ?ts over receptacle
380. Transmitter element 350 also is connected to sWitch
elements 360, 370, Which are similar to each other; only
sWitch element 370 is discussed in detail. SWitch elements
360, 370 are torus (doughnut) shaped.
[0105] Generally, Wires can be coupled to receptacles via
the side-Wire method, in Which Wire is Wrapped under a
screWhead, the back-Wire method, in Which Wire is inserted
from behind through a hole or slot and clamped under a
clamping plate as the screW is tightened, or the push-Wire
method, in Which a Wire is simply pushed into a terminal and
clamped by a spring-loaded brass member inside the termi
nal. The push-Wire method causes many loose connections,
and is not favored for this reason. FIG. 11 shoWs receptacle
380 adapted for side-Wire connection. ScreWs 385, 386 are
non-conductive screWs, such as plastic, rather than the typical
metallic screWs.
[0106]
SWitch elements 360, 370 are placed betWeen the
contacts on the side of receptacle 380 and the household
Wiring (not shoWn), the household Wiring being held in place
by tightening screWs 385, 386. ScreWs 385, 386 respectively
insert through the toroidal centers of sWitch elements 360,
370.
[0107]
SWitch element 370 is has conductive plates 375,
376, such as brass or copper alloys, on either side, to ensure
conduction betWeen the household Wiring and the side of
receptacle 380, respectively. Plates 375, 376 are connected to
Wires 377, 373. Movable Wire 372 is controlled by control
Wire 371 to connect betWeen Wire 377 and either Wire 373 or
ground 374.
Sep.3,2009
US 2009/0222142 A1
[0108]
During normal operation, movable wire 372 is con
nected between wire 377 and wire 373, so that power ?ows
through receptacle 380. When transmitter element 350
[0118] Audio sensor 540, such as a microphone (e. g.,
Knowles Acoustics part MD9745APA-l), is located at a con
venient place in or on the receptacle. Sensor 540 produces a
sensed audio signal, and supplies the sensed audio signal to
detects that the sensed temperature exceeds a predetermined
temperature, transmitter element 250 sends a signal along
control wire 371 to switch movable wire 372 to ground 374,
thus cutting off power to receptacle 380. In other embodi
SHDAC 541 that operates in similar manner as SHDAC 521.
ADC 542 operates in similar manner as ADC 522 to supply a
ments, controller 10 commands transmitter element 350 to
control switching elements 360, 370 to cut off power to recep
tacle 380.
[0109] FIG. 12A shows a back view current tap 400. FIG.
12B shows a side view of current tap 400. Generally, current
(e.g., Functional Devices Inc. part RIBX420 or Eaton Cutler
Hammer part EACl420SP) and senses the line current sup
plied to load 590. Sensor 550 produces a sensed current
digitiZed sensed audio signal to microprocessor 570.
[0119]
Current sensor 550 is a Hall-effect current sensor
signal, and supplies the sensed current signal to SHDAC 551
tap 400 has a top pair of prongs 403, 405, top ground prong
407, a bottom pair of prongs 404, 406, and bottom ground
prong 408, for respectively plugging into a household outlet.
Current tap 400 also provides receptacles 470, 480, 490, each
that operates in similar manner as SHDAC 521. ADC 552
operates in similar manner as ADC 522 to supply a digitiZed
having two slots for the prongs of a device plug, and also each
having an opening for a ground prong of a device plug.
fault trip signal, and supplies the ground fault trip signal to
sensed current signal to microprocessor 570.
[0120] Optional ground fault sensor 560 produces a ground
Top prongs 403, 405 provide power to receptacles
SHDAC 561 that operates in similar manner as SHDAC 521.
ADC 562 operates in similar manner as ADC 522 to supply a
470, 480, 490. Prongs 403, 405 are in conductive contact with
digitiZed ground fault trip signal value to microprocessor 570.
elements 411, 412, that function similarly to elements 211,
212 discussed above with regard to faceplate 200.
[0111] Bottom prongs 404, 406 provide power to trans
[0121] Microprocessor 570 is a general purpose micropro
cessor programmed according to the present invention, and
[0110]
former 460.
includes suitable memory (not shown). Microprocessor 570
receives the digitiZed values from ADCs 522, 532, 542, 552,
[0112] During normal operation, transmitter element 450
derives power through bottom prongs 404, 406. However,
interrupt the line current, generates control signal 581 for
when an exception condition occurs, or when commanded by
processor 10, transmitter element 450 switches to battery 450
for its power.
[01 13] In other embodiments, sensors are provided for each
of receptacles 470, 480, 490.
[0114] FIG. 13 is a schematic of circuit 500 according to the
present invention, shown as a receptacle. In another embodi
562, and generates a control signal for controller 511 to
status light(s) 580, which may be one or more light emitting
diodes (LEDs) or other suitable device, generates control
signal 586 for siren 585, which may be a speaker or other
device emitting an audible signal, and generates a communi
cation signal for wireless communication interface 505 that
communicates with controller 20 of FIG. 1. Microprocessor
570 also receives communication signals via communication
interface 505 from controller 20. Microprocessor 570 also
ment, the circuit is a plug-in device, for retro?tting an existing
outlet, lacking sensors 550, 560.
[0115] Line current is supplied to load 590 via switch 510
controlled by controller 511.
respectively supplies these control signals to sensors 520,
[0116]
cessor 570 of FIG. 13.
Temperature sensor 520, such as a thermocouple
(e.g., Omega part 5TC-TT-K-36-36) or thermistor (e.g., Gen
eral Electric part RL503-27.53K-l20-MS), is located next to
the screw (not shown) or other fastener for the line wire, as
this location tends to become hot in a receptacle. Another hot
spot is the blades of a plug. In a plug-in retro?t device, sensor
520 is located near the blade that is plugged into the plug-in
retro?t device. Sensor 520 produces a sensed temperature
signal, and supplies the sensed temperature signal to sample
and hold data acquisition (SHDAC) element 521 (e.g.,
National Semiconductor part ADC1615626) that serves to
latch (preserve in time) the sensed temperature signal, so that
its time reference can be synchronized with other sensed
signals. SHDAC element 521 supplies the latched sensed
temperature signal to analog-to-digital converter (ADC) 522
that operates to convert the analog sensed temperature signal
to digital data, and supplies the digital sensed temperature
signal to microprocessor 570.
[0117]
Light sensor 530, such as a photodiode (e.g.,
Advanced Photonix Inc. part PDB-Cl58F) or infrared cam
era, is located near the screw (not shown) or other fastener for
the line wire. Sensor 530 produces a sensed light signal, and
supplies the sensed light signal to SHDAC 531 that operates
in similar manner as SHDAC 521. ADC 532 operates in
similar manner as ADC 522 to supply a digitiZed sensed light
signal to microprocessor 570.
generates sampling frequency control signals fl“, fL, fA, ? and
530,540,550.
[0122]
[0123]
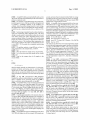
FIG. 14 is a ?owchart for the operation of micropro
At step 600, microprocessor 570 is turned on, such
as by receiving power, or is reset by a reset button (not shown)
in the receptacle or plug-in retro?t device containing circuit
500.
[0124]
Microprocessor 570 then simultaneously executes
?ve processes 680-684 respectively corresponding to sensors
520, 530, 540, 550, 560. Processes 680-684 supply problem
signals to fault analysis step 650 that determines whether to
take one or more of a variety of actions, such as interrupting
the line current, activating/de-activating status light(s) 580,
activating/de-activating siren 585, sending a message to con
troller 20 and so on.
[0125]
Process 680 will now be described. Process 680
includes steps 605, 610, 615, 620, 625, 630, 635, 640A-640C.
[0126] At step 605, microprocessor 570 sets sampling fre
quency control signal fT to a ?rst value ff 1, such as 100 HZ,
and supplies control signal fT to temperature sensor 520.
[0127]
At step 610, microprocessor 570 receives values
from ADC 522 at the rate determined by signal fl“, in this
example, 100 samples per second, and stores them in an
internal circular buffer or storage such that only the most
recent values are stored. For example, if the buffer siZe is 1000
samples, then the most recent 10 seconds of sensed values are
stored.
Sep.3,2009
US 2009/0222142 A1
[0128]
At step 615, Which occurs periodically such as every
30 seconds, microprocessor 570 analyzes the stored values to
produce an analysis result.
[0129] The analysis at step 615 analyZes the sensed tem
perature signals in vieW of the type of problem being detected
second, and stores them its internal circular buffer or storage
such that only the most recent values are stored. For example,
if the buffer siZe is 1000 samples, then the most recent 1000
milliseconds of sensed data are stored.
[0141] At step 635, Which occurs periodically such as every
to produce a con?dence estimate of the problem. For
500 milliseconds or every 100 milliseconds or every 2 sec
example, When the problem being detected is serial arcing,
onds, microprocessor 570 analyZes the stored values to pro
the temperature in the area surrounding the arcing character
duce an analysis result. The analysis at step 635 is similar to
the analysis at step 615 but occurs With more temporal granu
istically rises in a slanted saWtooth curve, as shoWn in FIG.
15.
[0130] Serial arcing is typically found in outlets Which have
aging Wire connections and/or degraded joints. The serial
arcing is caused mainly by intermittent contact due to rusted
Wire and/or rusted screW and/or degraded junction Which
causes accelerated failure of connection. Once serial arcing
begins, the connection continues to degrade until it becomes
haZardous because of the resulting sharp temperature rise
When a load is applied to the outlet. The temperature can rise
to over 200° C. is 10 seconds for a continuous serial arcing
larity due to the higher sampling rate, and instead of a binary
result (problem or normal), the result is a con?dence estimate
of Whether a fault exists. Let 771 be the CONFIDENCE value
for the temperature samples. An example analysis is:
[0142] If (Tn>2T0) then (1151.00)
[0143] else if (Tavg<32° F.) then (111:0)
[0144] else if(32° F. <Tavg< 1 50° F.) then (11 l:(Tn—T0)/T0)
[0145] else (11l:0.97)
buffer, and
[0135] Tavg be the average value of all samples in the
This analysis says that if the most recent temperature sample
is tWice the initial temperature sample, then there is de?nitely
a problem (CONFIDENCE:l00%). If the average tempera
ture of the temperature samples in the circular buffer is at least
1500 F., then the CONFIDENCE that there is a problem is
97%. While the average temperature is betWeen 32° F. and
150° F., then the CONFIDENCE is the normaliZed tempera
ture difference betWeen the oldest and neWest samples. If the
average temperature is under 32° F., then there is de?nitely
circular buffer.
not a fault.
If
[0146] At step 640A, microprocessor 570 determines
Whether the analysis result produced at step 635 indicates
connection.
[0131] The problem analysis at step 615 tries to detect a
rising temperature in the sampled data, as folloWs.
[0132] Let
[0133] T0 be the oldest data sample in the circular buffer,
[0134]
Tn be the most recent data sample in the circular
[0136]
there is a fault. If not, processing returns to step 605. If there
is a fault, processing proceeds to step 650. Continuing With
the above example, if 11 1 is at least 0.5, then there is a problem.
then the samples probably are characteristic of a rising tem
perature and hence serial arcing may be occurring. Other
speci?c tests or values Will be apparent to those of ordinary
skill in the art; an important feature of the test is that it is to
detect the behavior expected to be found When the problem
occurs.
[0137] At step 620, microprocessor 570 determines
Whether the analysis result produced at step 615 indicates
there is a problem. If not, processing returns to step 605. If
there is a problem, processing proceeds to step 625.
[0138] At step 625, Which occurs if a fault is determined at
step 620 or can also occur if problem signal BB is received,
microprocessor 570 sets sampling frequency control signal
fT to a second value fT 2 that is higher than the ?rst value fT 1,
such as fT2:l000 HZ, and supplies control signal fT to tem
perature sensor 520. Microprocessor 570 also generates prob
lem signal BB and supplies it to steps 626, 627, 628 of
processes 681, 682, 683.
[0139] It Will be appreciated that, in this manner, When any
of sensors 520, 530, 540, 550 generates data indicating a
possible fault, all of the sensors then begin to sample at a
higher frequency, enabling analysis in a more time-granular
fashion. That is, When things appear normal, a ?rst loWer
sampling rate is used to reduce poWer consumption, While
When a possible fault occurs, a second higher sampling rate is
used despite the higher poWer consumption to enable detec
tion of transient faults. In embodiments Where poWer con
sumption is not a concern, the second higher sampling rate
may be used constantly.
[0140] At step 630, microprocessor 570 receives data from
ADC 522 at the higher rate, in this example, 1000 samples per
[0147]
It Will be appreciated that the sensed temperature
data can be analyZed in different Ways to detect different types
of fault s. As described above, the fault of serial arcing is
considered. Other faults, such as appliance malfunctioning
(the appliance is load 590) or ?re haZard, may be considered
by analyZing the sensed temperature values in different man
ner. In some embodiments, microprocessor 570 conducts
multiple analyses on the sensed data, and thus has steps 640B,
640C and so on corresponding to the different types of fault
analyses. In this embodiment, if one or more fault s are
detected, processing proceeds to step 650, that is, only if no
fault s are detected does processing return to step 605.
[0148]
Process 681 includes steps 606, 611, 616, 621, 626,
631, 636, 641A-641C. Process 681 is similar to process 680,
and for brevity, only differences Will be discussed. When
serial arcing occurs, the curve of light generated is similar to
the curve of current, discussed beloW, and the light samples
are analyZed similarly.
[0149] Process 682 includes steps 607, 612, 617, 622, 627,
632, 637, 642A-642C. Process 682 is similar to process 680,
and for brevity, only differences Will be discussed. When
serial arcing occurs, the curve of sound generated is similar to
the curve of current, discussed beloW.
[0150]
Process 683 includes steps 608, 613, 618, 623, 628,
633, 638, 643A-643C. Process 683 is similar to process 680,
and for brevity, only differences Will be discussed.
[0151] FIG. 16 shoWs typical current vs. time curves for
serial arcing and for normal current Without arcing. The nor
mal non-arcing current is basically ?at With high frequency
noise. In contrast, the serial arcing curve has a pronounced
W-shaped period.
Sep.3,2009
US 2009/0222142 A1
(FFT) spectra of the current vs. frequency curves for normal
A separate analysis is performed for each type of problem
being considered. Additionally, if the ground fault trip signal
operation and serial arcing. The normal non-arcing FFT spec
indicates a ground fault, then the fault analysis immediately
trum has a lot of energy in loW frequencies and asymptotically
indicates a ground fault so that the current is interrupted to
load 590.
[0168] In one embodiment, the fault con?dence signals are
[0152]
FIG. 17 shows exemplary Fast Fourier Transform
decreasing energy in higher frequencies, With pronounced
spikes at 60 HZ and 180 HZ. The serial arcing curve is similar
but also has pronounced spikes at 300 HZ and 420 HZ. In
different con?gurations, the spikes may occur at different
combined as folloWs:
frequencies, but there Will be additional spikes in the arcing
spectrum relative to the normal operation spectrum.
[0153] At step 618, a test corresponding to FIG. 16 is used.
For the stored current samples in the circular buffer, the
folloWing values are determined:
[0154] Imin?he minimum value of the current samples
[0155] Imax?he maximum value of the current samples
[0156]
Iavg?he average value of the current samples
The test is:
[0157] If (Imin<0.95*Iavg) then serial arcing exists, else no
serial arcing exists.
[0158]
At step 638, a more elaborate version of a test cor
responding to FIG. 16 is used. In other embodiments, other
tests are used. Choose an upperbound Bu, such as [3u:0.3, and
a loWer bound [31, such as [31:003. The con?dence value for
the current samples is 114, computed as:
n
In this example, n:4 since the results of four sensors are
provided at step 650.
[0169] 11 1 corresponds to the CONFIDENCE of the sensed
temperature from process 680.
[0170] 112 corresponds to the CONFIDENCE of the sensed
light from process 681.
[0171] 113 corresponds to the CONFIDENCE of the sensed
audio from process 682.
[0172] 114 corresponds to the CONFIDENCE of the sensed
current from process 683.
The con?dence values 111,112,113,114 are betWeen 0.0 and 1.0.
[0173]
(Imax- Iavg)/Iavg — ,Bl
"4
:
—
(BM - ,6!)
l
>1<O_5
+l
—
(BM - B1)
*0.5
[0159] In another embodiment, at step 618, a test corre
sponding to FIG. 17 is used. The stored current samples in the
circular buffer are subjected to a Fast Fourier Transform.
[0160]
In another embodiment, the problem signals are
Weighted; for instance, the sensed current may be deemed to
(Iavg — Imin)/Iavg — ,Bl
Let v?he magnitude of the frequency spectrum at
an identi?ed arcing frequency, such as 300 HZ.
[0161] Let Amax:a predetermined maximum value for the
magnitude of the frequency spectrum at the identi?ed arcing
be a better indicator than the sensed light, so the sensed
current in?uences the outcome of the redundant fault analysis
more than the sensed light.
[0174] For example, assume con?dence values 11 1:062,
112:0.7l, and 114:0.82 are delivered to step 650; in this
example, there does not seem to be an audio problem perhaps
because of loud ambient noise so no value for 113 is delivered
to step 650, i.e., 113:0. The values are combined as:
frequency.
[0162] Let Amin:a predetermined minimum value for the
magnitude of the frequency spectrum at the identi?ed arcing
frequency.
[0163]
The speci?c values of Amax and Amin are deter
mined by the characteristics of the signals and arcing for
speci?c loads and/or outlets.
The test is:
[0164]
If (v>Amin) then serial arcing exists, else no serial
arcing exists.
[0165] In another embodiment, at step 638, a more elabo
rate version of a test corresponding to FIG. 17 is used. The
con?dence value of a fault based on the current samples is 114,
computed as:
Thus, using three samples increases the overall level of con
?dence dramatically. That is, a fault that manifests simulta
neously in multiple domains, even if it is not so serious in each
domain, gives rise to strong con?dence that a problem truly
exists. It is preferred to use at least three domains, that is,
redundancy in tWo domains.
[0175] At step 655A, corresponding to the problem of serial
arcing, microprocessor 570 determines What action, if any, it
should take. If no action is to occur, processing continues at
step 670. OtherWise, at step 660A, the action is taken. For
example, microprocessor 570 may be programmed to With
114 =
0.5 * [(v — Amin)/(Amax— Arnin)] + 0.4, Amin < v < Amax
0.95,
v z Amax
[0166] Process 684 includes step 624, Wherein a ground
fault trip signal from ground fault sensor 560, as digitiZed, is
simply passed to step 650.
[0167] At step 650, triggered by arrival of a problem signal
the folloWing rule:
[0176] If (nfault>0.98) then (set signal 511 to open sWitch
510 and make status light 580 red)
[0177] else if (0.95<11?mh<0.98) then (make status light
580 blinking and red)
[0178] else if (0.90<11?mh<0.95) then (make status light
580 red)
if the problem has cleared, microprocessor 570 performs
redundant fault analysis by combining the CONFIDENCE
[0179] else if (0.70<11?mh<0.90) then (send an alert mes
sage to controller 20)
Other rules for actions Will be apparent to those of ordinary
values of the problem signals, if any, from processes 680-684.
skill.
and then occurring for one or more subsequent periods to see
Sep.3,2009
US 2009/0222142 A1
[0180]
At step 655B, corresponding to another fault such as
appliance malfunction, microprocessor 570 determines What
[0184] At step 670, if no faults are detected, then normality
signal AA is generated and provided to processes 680-683 so
action, if any, it should take. If no action is to occur, process
that all processes return to a loWer sampling rate.
ing continues at step 670. OtherWise, at step 660B, the action
is taken. For example, microprocessor 570 may be pro
grammed to With the following rule:
[0181] If (11famt>0.95) then (activate siren 585)
[0182] else if (0.80<11?,mt<0.95) then (send an alert mes
sage to controller 20)
Other actions Will be apparent to those of ordinary skill. For
example, if load 590 is an air-conditioner draWing too much
current, the action may be to regulate the voltage or current
and send an alert message to controller 20 to calibrate the
air-conditioner as it is running inef?ciently.
[0183] At step 655C, corresponding to another fault such as
?re haZard, microprocessor 570 determines What action, if
[0185] Although an illustrative embodiment of the present
invention, and various modi?cations thereof, have been
described in detail herein With reference to the accompanying
draWings, it is to be understood that the invention is not
limited to this precise embodiment and the described modi
?cations, and that various changes and further modi?cations
may be effected therein by one skilled in the art Without
departing from the scope or spirit of the invention as de?ned
in the appended claims.
What is claimed is:
1. A system for monitoring and controlling the electrical
infrastructure of a building, comprising:
at least one sensor for sensing an operating characteristic in
the building, and
a processor for receiving information from the at least one
sensor and predicting a future operating characteristic.
any, it should take. If no action is to occur, processing con
tinues at step 670. OtherWise, at step 660C, the action is taken.
*
*
*
*
*