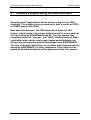
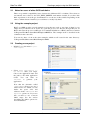
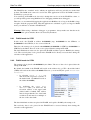
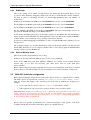
1
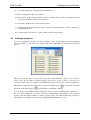
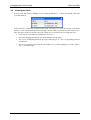
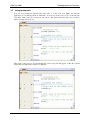
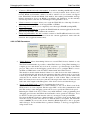
Ride7 for ARM
RAISONANCE Tools for the STRx and STM32
families
Overview and
Getting Started
July 2007
Table of Contents
1. INTRODUCTION
4
1.1
RAISONANCE tools for the ARM family
6
1.2
Third party tools that can be used in conjunction with Ride7 for ARM
6
1.3
List of supported derivatives
7
1.4
Documentation
7
2. CREATING A PROJECT USING THE GNU TOOLCHAIN
8
2.1
Notes for users of other GCC toolchains
9
2.2
Using the example project
9
2.3
Creating a new project
9
2.4
Using and choosing the boot mode
10
2.4.1
FLASH mode for STR7
11
2.4.2
FLASH mode for STR9
11
2.4.3
RAM mode
12
2.4.4
External Memory mode
12
2.5
2.5.1
GNU GCC toolchain configuration
12
LD Linker Options
13
2.5.1.1
General
13
2.5.1.2
Startup
13
2.5.1.3
Scripts
13
2.5.1.4
More
14
2.5.1.5
Libraries
14
3. DEBUGGING WITH THE SIMULATOR
15
3.1
About the simulator
16
3.2
Simulator Options
16
3.2.1.1
Misc.
16
3.2.1.2
Advanced
16
3.3
Launching the simulator
16
-2-
3.4
Using the simulator
18
3.5
Viewing a peripheral
19
3.6
Viewing the Stack
20
3.7
Using breakpoints
21
4. DEBUGGING WITH HARDWARE TOOLS
23
4.1
Selecting hardware debugging tools
24
4.2
RLink-ARM programming and debugging features
25
4.2.1
RLink capabilities
25
4.2.2
Configuring Ride7 for using the RLink
26
4.2.2.1
RLink jumpers
27
4.2.2.2
Instant actions
27
4.2.2.3
JTAG Parameters
28
4.2.3
Hints and Troubleshooting
29
4.2.3.1
Example projects
29
4.2.3.2
Testing USB driver, connections and power supplies
29
4.3
JTAGjet programming and debugging features
30
4.3.1
Signum Systems USB driver installation
30
4.3.2
Installing the Signum Systems USB driver for Ride7
30
4.3.3
Installing the RDI driver for third party debuggers
30
4.3.4
Using the JTAGJet/STR9 trace features (ETM) in Ride7
30
4.3.4.1
The JTAGJet trace window
31
4.3.4.2
The trace IO configuration
31
Introduction
1.
Ride7 for ARM
Introduction
Ride7 for ARM devices is an integrated development environment
(IDE), designed for the development of STRx (STR7 and STR9 ARM
families) and STM32 (Cortex-M3 family) projects from beginning to
end.
Ride7 for ARM can be used with a range of development tools
including the GNU toolchain, the software-based simulator, the
RLink USB to JTAG dongle from RAISONANCE, and (for STRx only)
the JTAGjet USB to JTAG dongle from Signum Systems.
This chapter gives an overview of the various tools that can be used
in conjunction with Ride7 and ARM devices.
-4-
Ride7 for ARM
Introduction
Ride7 for ARM
Ride7 is the RAISONANCE Integrated Development Environment. It features an editor
/debugger/project manager that is common to several ST microcontroller families of ARM cores,
and integrates the GNU GCC toolchain.
The following table shows the set of tools that make up Ride7 for ARM, the development
environment for the STRx and STM32 families of ARM® core-based microcontrollers:
Integrated
Development
Environment
Assembler
Compiler
Linker
Ride7
ARM-elf-as
G
N
U
ARM-elf-gcc
ARM-elf-ld
Simulator
SIMICE STRx
Debugger
RLink - JTAGjet
-5-
Introduction
Ride7 for ARM
For compiling your application source files, Ride7 fully integrates the GNU GCC toolchain (C
Compiler, Assembler and Linker) for ARM® core-based microcontrollers.
Then, when debugging your application, you can use the RAISONANCE SIMICE ARM
simulator capable of simulating some of the ARM peripherals, or connect to your ARM CPU for
programming and debugging with JTAG standard emulators such as RAISONANCE’s RLink or
the JTAGJet from Signum Systems.
1.1
RAISONANCE tools for the ARM family
Ride7 for ARM comes with the following tools from RAISONANCE:
• Ride7: the integrated development environment, which is the interface for all the other
tools, provides an editor, a project manager (no need for a makefile) and a debugging user
interface that can be used either with the simulator or with any of several hardwaredebugging tools.
•
Simulator (SIMICE ARM): simulates the core (including the entire memory space) and
most peripherals. Complex peripherals (USB, CAN) and some less common peripherals
are not simulated. The same user interface is used for the simulator and the hardware
debugging tools (RLink, JTAGjet).
•
RLink-ARM: this JTAG standard emulator with USB interface from RAISONANCE
allows you to program the STRx or STM32 on an application board and debug the
application while it runs on the target. It uses the JTAG protocol. For more information,
refer to the JTAG section of this document. RAISONANCE’s REva evaluation boards
feature an embedded (detachable) RLink.
Note: RLinks have different capabilities for programming and debugging STRx, STM32,
ST7 and uPSD microcontrollers. Your RLink’s capability to program and debug any
Ride7-supported target microcontroller can be reported when Ride7 reads your RLink’s
serial number. For a description of the different debugging capabilities, refer to:
"Debugging with Hardware Tools."
Each tool mentioned above has a dedicated user manual that you can refer to for more details.
Documentation for Ride7, SIMICE ARM simulator and RLink-ARM is available on-line from the
user interface.
1.2
Third party tools that can be used in conjunction with Ride7 for ARM
Ride7 for ARM can be used together with a number of third-party tools including:
• The GNU GCC toolchain for ARM® (ARM-none-eabi-gcc, ARM-none-eabi-as, ARMnone-eabi-ld): they allow you to compile applications in assembler and/or C language.
Ride7 installs and calls the free open-source GNU toolchain. See www.gnu.org for more
information about GNU programs.
•
JTAGjet: this JTAG standard emulator with USB interface from Signum Systems allows
you to program the STRx on an application board and debug the application while it runs
on the STRx. It uses the JTAG protocol. See more information in the JTAG section of this
document. For more information on using the JTAGjet, refer to:
"Debugging with Hardware Tools".
JTAGjet-ETM provides, for STR9 ONLY, powerful real-time trace capabilities.
-6-
Ride7 for ARM
1.3
Introduction
List of supported derivatives
Ride7 for ARM supports most of the existing STRx and STM32 derivatives to various degrees.
The up-to-date list of supported derivatives and the limitations to the software simulation can be
seen in the Target Options in Ride7. At this time, all the derivatives of the STR71x, STR73x and
STR91x sub-families are supported.
1.4
Documentation
This document describes how to get started using Ride7 for ARM to compile and debug your
application or one of the included sample applications. It assumes that you have the prerequisite
knowledge of the C and STRx / STM32 assembly languages.
-7-
Creating a project using the GNU toolchain
2.
Ride7 for ARM
Creating a project using the GNU toolchain
Assembly and C applications can be written using the free GNU
toolchain. This chapter gives an overview of how to create an STRx
or STM32 project with Ride7.
Note about the licenses: The GNU toolchain is under the GPL
license, which makes it free of use without royalties, as are some of
the files written by RAISONANCE and ST. You can assume that
everything under the “arm-gcc” and “GNU” subdirectories of Ride7
installation folder can be freely used, copied and distributed, but
without any warranty and only limited support from RAISONANCE.
The files in the other directories are all under other licenses and are
owned by RAISONANCE, or other companies. They should not be
copied or distributed without written agreement from their owners.
-8-
Ride7 for ARM
2.1
Creating a project using the GNU toolchain
Notes for users of other GCC toolchains
There are potential compatibility issues between the different GCC toolchains. Those that we
encountered were related to the GCC_EXEC_PREFIX environment variable. If you have this
kind of problems, look at the gcc documentation to see the use of this variable. Depending on the
other toolchains that are installed, you could have to modify it by hand.
2.2
Using the example project
Ride7 for ARM provides several example projects that are ready to run. One of them is very
simple and you should look at it first. To open this project, use "Project""Open Project" in
Ride7 and select the project “testR7.rprj”. For standard installations of Ride7, this file is found in
C:\Program Files\Raisonance\Ride\Examples\ARM\Test. The example itself is described in the
comments in the source file.
You can also have a look at the other examples, which are all located in the same directory:
C:\Program Files\Raisonance\Ride\Examples\ARM.
2.3
•
Creating a new project
In Ride7, go to the menu Project>New Project
• Select “New application to
be built”, then your target.
Choose the application name and
the path to the main application
folder. You can click on
“Finish” to generate your
application.
Note that the derivative called
“STR7-TEST” allows you to use a
virtual device for which you can
define the space sizes and
addresses in the “Advanced ARM
Options” options set. If you use
this, you have to use a custom
linker script. See the section
describing the linker options for
more information.
-9-
Creating a project using the GNU toolchain
Ride7 for ARM
Your application project is now created. The Ride7 environment should more or less look like the
one shown on the picture below:
2.4
•
The “Boot Mode” option (visible in the Advanced ARM Options section on the
screenshot above) determines the memory space containing the image of the code that the
target executes after a reset. You can select either “FLASH”, “RAM”, or “External
Memory”. For more information about the boot modes, refer to your device datasheet and
the section “Using and choosing the boot mode” below. For your first try, choose “RAM”.
•
The “Use Thumb Mode” option allows you to choose between the Thumb or ARM
modes, for STRx devices. See the device datasheet for more information. The Thumb2
mode is automatically selected when using a STM32 device. The Interwork option allows
you to select a different ARM/Thumb mode for each source file of the project.
•
Add files to the project, build and debug it as explained in the Ride7 manual (common to
all targets). Click “Help”->”View Documentations” for seeing it.
Using and choosing the boot mode
After a reset, the STRx and STM32 microcontrollers start executing the code at address zero:
For the STR71x and STR75x, this code is an image of one of the other memory spaces – Flash,
RAM, or External Memory. The boot mode is determined by the state of specific pins at reset.
See your device datasheet for more information.
For the STR73x and STR91x, only the Flash can be mapped at 0. However, a pseudo RAM mode
can be managed by Ride: the application is loaded in RAM and the reset vector just jumps to the
RAM segment.
- 10 -
Ride7 for ARM
Creating a project using the GNU toolchain
The FLASH is the “standard” mode, which your application will very probably use in the final
product. The RAM mode cannot be used in the final application because the RAM content is
modified by a power down.
You can debug in FLASH mode, but only 2 breakpoints can be set in the FLASH at a time, so
you will probably prefer using RAM mode for debugging with hardware debuggers.
Therefore, we recommend debugging the application in RAM mode as long as the RAM is large
enough to hold the program. Then, when the application is validated or grows too large for RAM
mode, you will have to switch to FLASH mode.
Warning: When using a hardware debugger or programmer, always make sure that the mode
specified in the options matches the mode selected by hardware.
2.4.1
FLASH mode for STR7
In this mode, the FLASH at address 0x40000000 (resp. 0x80000000 for the STRx3x, or
0x20000000 for the STR75x) is also seen at address 0.
Therefore, the startup code is placed at 0x40000000 (0x80000000 for STR73x, 0x20000000 for
STR75x) by the linker. The rest of the code is placed after the startup in FLASH.
The data initialization values are also placed in FLASH, and then copied to RAM by the startup
code. The read-only data is also placed in the FLASH and is directly accessed there during the
execution of the application.
2.4.2
FLASH mode for STR9
The startup code is placed at 0x00000000 by the linker. The rest of the code is placed after the
startup in FLASH.
By default, the bank0 of the FLASH will reside at the address 0 (e.g. CSX = 0) and the bank1
(32KB) will reside at the address 0x400000. However, you can modify the option “Flash Bank
Selection”:
•
by selecting “bank1 @ 0x0”, you
will invert the respective locations of
the banks 0 and 1 (bank0 will reside at
the address 0x400000),
•
by
modifying the “High Bank
Address” value, you will force the
relocation address of the upper bank
(either bank1 or bank0). This address
must be larger than the size of the bank
at address 0, and must be a multiple of
the size of the other bank.
The data initialization values are placed in FLASH, and copied to RAM by the startup code.
The read-only data is also placed in the FLASH and is accessed directly there during the
execution of the application.
- 11 -
Creating a project using the GNU toolchain
2.4.3
Ride7 for ARM
RAM mode
This is the “debug” mode, which you will want to use during the development phase of your
project for faster hardware debugging. (This mode can also be used with the software simulator,
but then it offers no advantage in terms of download/programming time and number of
breakpoints).
In this mode, the RAM of the STR71x is at 0x20000000 but it is also seen at 0x00000000.
For the STR73x, the RAM is physically at 0xA0000000 but it is also seen at 0x00000000.
For the STR75x, the RAM is physically at 0x40000000 but it is also seen at 0x00000000.
For the STR91x, the RAM is physically at 0x04000000. The reset and interrupt vectors are
placed in the FLASH and jump to some RAM addresses.
In this mode, the linker places the code and data segments in the RAM. The data initialization
values are placed in the FLASH. The final application cannot use this mode because the RAM is
volatile and has to be reloaded at every power-up of the microcontroller.
It can be used while debugging because Ride7 is able to load the RAM at the beginning of every
debug session.
The constants (strings, etc.) and the initialization values for the global variables are still stored in
the FLASH. Therefore, do not be surprised if Ride7 has to erase and program the FLASH when
starting a debug session in RAM mode.
2.4.4
External Memory mode
This mode uses the external memory for booting.
In this mode, the target External Memory space is also seen at address 0.
Some of the ARM microcontrollers (STR711, STR712, etc.) cannot access external memory
because they do not have the necessary pins. This mode will not work with these
microcontrollers.
Ride7 cannot debug nor program using this mode because it would depend on the type of external
memory. But you can still use Ride7 as a project manager and software simulator, in this mode.
2.5
GNU GCC toolchain configuration
Ride7 Options Manager wraps the most important options needed to configure GCC toolchain.
The GNU options are separated in 3 sections: GCC Compiler, AS Assembler and LD Linker.
Only the sections that apply to the selected project node and its children are displayed: for
example:
•
if a C source file is selected, only GCC Compiler section will be visible
•
if the application or project node is selected, all three sections will be visible
Important note: when you modify options on a child node (most probably a source file), you
create a superset of local options for this node and its own children. If you want to globally
modify an option (this is the case most of the time), do not forget to verify that the application
node is selected, and not a child node.
Refer to the tools specific documentation for a detailed description of the options of the GCC
Compiler and the AS Assembler. The Linker options are explained below.
- 12 -
Ride7 for ARM
2.5.1
Creating a project using the GNU toolchain
LD Linker Options
Ride7 provides some libraries. You can choose to
include them or not by (un)selecting the corresponding
options. When you are using the Thumb instruction
set, or Interworked mode, then the libraries used are
the corresponding Thumb libraries. Thumb libraries
have the same name as the non-thumb libraries, with
“_thumb” appended.
2.5.1.1 General
A) Generate MAP file
This makes the Linker produce a map file (.MAP).
B) Warn once for undefined symbols
If this option is checked, only one warning will be
displayed for each undefined symbol, rather than once
per module which refers to it.
C) Remove unused sections
This tells the linker to not link the sections that are not
used. Activate this together with the GCC Compiler
option “Per function sections” in order to have remove
any unused function from the application.
2.5.1.2 Startup
A) Use Default Startup
If you want to keep the default startup file set “Yes”. If you are familiar with the GNU toolchain,
then you will probably want to use your own startup file. In that case set “No” and fill the
“Startup File” box. (or not if your startup is part of the source files)
B) Startup file
If “No” has been set for the “Use Default Startup” option, indicate the path of the startup file that
you want to use. You may also want to see the default startup and linker script files provided by
Ride7, which you can copy and modify. For standard installations of Ride7, you will find these
files in the directory – C:\Program Files\Raisonance\Ride\lib.
2.5.1.3 Scripts
A) Use Default Script File
If you want to keep the default script file set “Yes”. If you are familiar with the GNU toolchain,
then you will probably want to use your own script file. In that case set “No” and fill the “Script
File” box. (You have to use a linker script)
B) Script File
If “No” has been set for the “Use Default Startup” option, indicate the path of the startup file that
you want to use. You may also want to see the default startup and linker script files provided by
Ride7, which you can copy and modify. For standard installations of Ride7, you will find these
files in the directory – C:\Program Files\Raisonance\Ride\lib\ARM.
Note that in the case of the linker script, the above directory only contains partial scripts. The full
script (that includes the partial scripts) is generated just before the link. If you want to see the
script used for a particular device, just link any project using this device and look in the “–
- 13 -
Creating a project using the GNU toolchain
Ride7 for ARM
C:\Program Files\Raisonance\Ride\lib\ARM.” directory for the associated script file. For
example, if your device is the STR712FR2 and you are in RAM mode, the script generated is
called “C:\Program Files\Raisonance\Ride\lib\ARM\ STR71xFx2_RAM.ld”.
Please also note that there is no default linker script for the “STRx-TEST” device. Therefore,
when you use this virtual device, you must use a custom linker script.
C) Limit for Starter-Kit
This option should be used when debugging in RAM with the limited version of the RLink, such
as the RLinks embedded in the REva evaluation boards, and the standard RLinks. Because these
RLinks are only allowed to access the lower 16Kbytes (STRx) or 32Kbytes (STM32) of each
memory area (RAM, FLASH, etc.), the linker must initialize the stack pointer at an address lower
than 16K (32K for Cortex-M3) and not at the very end of the RAM as it would do otherwise.
Also, it will generate a link error if your application uses more than this reduced amount of
RAM. If you are using the simulator, an RLink with the “STRx Pro” capabilities, JTAGJet, or if
you are only programming the ARM’s FLASH (without debugging it), then you should unselect
this option because it greatly reduces the possibilities of the system.
2.5.1.4 More
This option lets you specify options that will be added to the command line. Those options will
be added just before the linker configuration file in the command line. Look at the LD
documentation for more information on the available commands and switches.
2.5.1.5 Libraries
A) Use ST library
When set (by default), this option adds to the application a precompiled library containing a
standard API designed by STMicroelectronics for handling the target peripherals. The library
files are available for every STRx (in thumb and non-thumb mode) and STM32 (thumb2 mode
only) target supported. The sources of the libraries can be found in
“C:\Program Files\Raisonance\Ride\LIB\ARM\<family>_LIB\…”
You can use and distribute them freely.
B) “include UART0 Putchar”
This option adds “io_putchar.a” (or “io_putchar_thumb.a”), which includes standard putchar and
getchar functions using the UART0. It should be used in conjunction with “UART0_stdio.h”
(instead of “stdio.h”). It also redirects the output for functions using stdout, like printf, to the
UART0. The “TEST” example shows how to use it. The sources of the library can be found in
“C:\Program Files\Raisonance\Ride\LIB\ARM\IO_PUTCHAR\…”
You can use and distribute them freely.
C) “Use small printf”
This option adds “smallprintf.a” (or “smallprintf_thumb.a”), which includes a reduced version of
printf. The standard version from libc.a takes about 32Kbytes. The reduced version from
“smallprintf.a” cannot handle floating point numbers but only takes about 6Kbytes. Use the
“Test” example in Ride7 to check the effects of this option. This library has been written by
RAISONANCE but is free and open-source. The sources of the library can be found in
“C:\Program Files\Raisonance\Ride\LIB\ARM\SMALL_PRINTF\…”
You can use and distribute them freely.
- 14 -
Ride7 for ARM
3.
Debugging with the Simulator
Debugging with the Simulator
Ride7 for ARM provides a simulator capable of simulating the STRx and
STM32 cores, and most of their common peripherals. The simulator lets
you check your code and the interaction between your code and the
peripherals before going on to debug with an emulator.
This section shows the basic use of the simulator for STRx and STM32
microcontrollers. However, the interface is the same for all the targets.
The complete documentation about the simulator is found in the Ride7
general documentation.
- 15 -
Debugging with the Simulator
3.1
Ride7 for ARM
About the simulator
Ride7 for ARM supports most of the existing STRx and STM32 derivatives to various degrees.
For the rest of this section, we will use the example project called “testR7,” found in the standard
Ride7 installation directory:
C:\Program Files\Raisonance\Ride\Examples\ARM\Test\TestR7.rprj
This project uses the “General Purpose Input/Output Port 1” peripheral. It consists of a new
empty project to which we added one very simple “main.c” file.
3.2
Simulator Options
3.2.1.1 Misc.
A) Code Exploration
If this option is set to “Yes”, the code will be explored from the loading, to recognize and to flag
the first byte of any instruction (this is a call-tree exploration). Because the instructions have
different sizes, this is needed to display an exact disassembly to the user. If it is set to “No”, the
loading is faster and exploration is not complete; the code would be displayed as “db 0xxh,…”.
In simulation, you should explore progressively (explore command).
This option need to be checked to allow the trace to explore the disassembly code.
B) Value Record
This option allows to record or not additional information at each instruction:
SP: Value of the Stack Pointer after the execution of the current instruction
Expression that you want to be evaluated. Enter a simple expression in the Expression box.
3.2.1.2 Advanced
A) Crystal Frequency
Set the crystal frequency you want to simulate the program.
3.3
Launching the simulator
Before launching the simulator, check the different “Debug Environment” options and more
particularly that the “Simulator SIM-ARM” is selected for “Debug Tool”.
- 16 -
Ride7 for ARM
Debugging with the Simulator
To launch the simulator, type CTRL–D or select Debug -> Start in the main menu. If your project
has not been built, this will be done automatically before launching the simulator. Otherwise the
simulator is launched directly.
You are now in the simulator. Your Ride7 window looks like the following:
1.
The upper part of the Debug tab, which shows the different Data views available on a given
microcontroller. To see a specific view, double-click on its name.
2.
The lower part of the Debug tab, which shows the peripherals available on a given
microcontroller. Most of these peripherals are NOT simulated. To see a specific peripheral,
double-click on its name.
3.
The source file as edited in C or in assembly language. The green circles at the left indicate
lines that contain instructions where you can place breakpoints. The line highlighted in blue
indicates the current PC. That's the next instruction to be executed.
4.
The Disassembly view window, which displays the instruction to be executed by the
simulator. It is a dump of the memory where the code is located (see below for more
information). Note the blue arrow at the beginning of the line indicates the current PC, as in
the source window.
The following columns are available in the Code window:
Address: The address where the instruction is located.
Symbol: The name of the symbol, if a symbol is located at this address.
- 17 -
Debugging with the Simulator
Ride7 for ARM
Code: The byte-code located at this address.
Mnemonic: The mnemonic corresponding to the byte-code.
Code Coverage: The number of times the byte-code at this address has been executed
Last action: The most significant effect of the instruction during its last execution.
5.
The Debug Output window provides feedback on the status of debugging process. Status
information can include errors as well as debugging event logs. Some message lines are
hyperlinked with a PC address, clicking on the PC item will display the Disassembly view
at the PC address where the event occurred.
6.
Data Dumps Views (here Memory View) is only available during a debug session, and
allows you to observe the content of the different memory dumps. The addresses associated
with symbols are highlighted with pink color. A status bar on the bottom of this view
displays the symbols and eventually informs of a read or write access.
You can modify the content of the dump from this view. Select the value you want to alter,
type the new value and press Enter. Double clicking the ASCII value will also let you type
directly the value in ASCII format.
7.
3.4
The toolbar, which allows you to control the simulation (see the next section for more
information).
Using the simulator
The simulation is controlled by the simulator toolbar:
1.
Run Pressing this button launches the application. When the application is running, this
button is grayed, then the Pause button becomes available.
2.
Pause Pressing this button will stop the application.
3.
Reset Pressing this button resets the application.
4.
Step Into On a function call in a line of the C source code, this button steps into the
called function. If it is not a function call, it goes to the next line in the source code.
5.
Step Over On a function call in a line of the C source code, this button steps over the
called function.
6.
Step Out In a function this button gets out of the function.
7.
Run To Run the program until the cursor.
8.
Toggle breakpoint If there is no breakpoint on the current line, Ride7 will set a
breakpoint on it. If there is one, the breakpoint will be removed.
- 18 -
Ride7 for ARM
9.
Debugging with the Simulator
Clear All breakpoints Clear all the breakpoints set.
10. Project Open the “Project” window.
11. Find in files Pressing this button opens the “Find in files” window allowing the search
an expression in files of the project directory.
12. binoculars This will open the search window.
13. Documentation Pressing this button opens the “Documentation” window allowing to
open Help html files.
14. Toolbar Options Allows to Add or Remove buttons in the menu.
3.5
Viewing a peripheral
To view a peripheral, you must open it by clicking on the corresponding item in the peripheral
tree. For example, to view the Port 1, double click on the “IOPORT1” icon. The Port 1 view will
appear:
This view shows the state of each of the port’s pins. Green indicates a value of one and red a
value of zero. It is possible to connect each pin of the port to a Net, to VCC, to Ground or no
connection. This is done by clicking on the LED. The registers also let you control the peripheral.
With the test application described above, click on the Run button
and click on the Pause button
to launch the execution
. You will then see the LEDs counting.
Note: Currently, only UART is fully simulated in order to provide “putchar/printf” capabilities.
For the other peripherals, the views provide a comprehensive presentation of the internal
registers, but the dynamic behavior of these registers exists only when running the program on
real hardware via a JTAG connection (see “Debugging with Hardware Tools”).
- 19 -
Debugging with the Simulator
3.6
Ride7 for ARM
Viewing the Stack
You can view the stack by clinking “View”->”Debug Windows” ->”View Call Stack”. This will
open this window:
It shows the list of functions currently in the stack, allowing you to trace the calls up to the main
function or the current Interrupt Service Routine. Double-click on a function in the stack view to
place the cursor in the associated source file. There are a few restrictions for using this view:
• It can only be used without optimization. (level zero)
•
It needs debugging information for all the functions in the stack.
•
It does not work during functions prologue and epilogue. (i.e. the very beginning and end
of functions)
•
It does not work properly when the current PC is not on the beginning of a C line. (after a
stop or assembler step)
- 20 -
Ride7 for ARM
3.7
Debugging with the Simulator
Using breakpoints
You can set a breakpoint either in the source file, or in the code view. Make sure that the
application is not running (click on “PAUSE”). You can see in the source code, on the left side
some lines with colored box (red green and yellow). This means that these lines are code lines
where a breakpoint can be set.
Then click on the red box “Toggle Breakpoint” and a red point will appear on this line, which
means that a breakpoint has been set on this line:
- 21 -
Debugging with the Simulator
Ride7 for ARM
Then, click on “RUN” button and the application will stop running when this line is reached:
Please refer to the Ride7 general documentation for more information about the simulator user
interface.
- 22 -
Ride7 for ARM
4.
Debugging with Hardware Tools
Debugging with Hardware Tools
In addition to the RAISONANCE simulator, Ride7 for ARM can be
used with a number of hardware debugging tools. RLink and JTAGjet
are two USB to JTAG emulators from RAISONANCE and Signum
Systems, respectively. From a user interface point of view, basic
debugging functions (setting a breakpoint, single-stepping and
checking memory and registers) are identical whether you are using
the simulator or a hardware debugging tool. This chapter describes
how to use the available drivers and the specificity of each.
- 23 -
Debugging with Hardware Tools
4.1
Ride7 for ARM
Selecting hardware debugging tools
Within Ride7, you can choose your target hardware debugger either in the Project Options
window if it is opened or with the "Options" -> "Project Properties" menu selecting -> Advanced
ARM Options -> "Debug Environment".
From the Debug Tool option you can choose between a list of available tools.
Ride7 ARM supports RLink or JTAGjet for debugging and programming of STRx and STM32
microcontrollers.
Select the tool corresponding to your debugging hardware:
RLink
If you have an RLink connected to the target STRx or STM32 on your
application board via a JTAG connector, or if you are using the REva
evaluation board, which includes an embedded RLink.
JTAGjet
If you have a JTAGjet connected to the target STRx on your application board
via either a JTAG or an ETM connector.
Then, configure the tool using the "Advanced Options.", either under the ARM RLink section or
under the JTAGJet section according to the chosen debugging tool:
- 24 -
Ride7 for ARM
4.2
Debugging with Hardware Tools
RLink-ARM programming and debugging features
RLink is a USB to JTAG interface device designed by RAISONANCE. It allows programming
and debugging of various microcontrollers, including all the STRx and STM32 microcontrollers
supported by Ride7 for ARM.
With the STRx and STM32 microcontrollers, RLink uses the JTAG protocol for debugging and
programming through the standard 20-point connector defined by ARM.
In order to use RLink, be sure that you have installed the associated USB driver. Unless you have
specified otherwise, it is installed along with Ride7. If the USB driver has not been installed,
launch the program RLinkUSBInstall.exe. For standard installations of Ride7 for ARM, it is
located at:
C:\Program Files\Raisonance\Ride\driver\RlinkDrv\RLinkUSBInstall.exe
You can also find it on the installation CD-ROM:
\DRIVER\RLINKDRV\RLinkUSBInstall.exe
After running this program, when you plug an RLink in, Windows will recognize it
automatically. The recognition could take some time on the first connection. The following
connections of the same RLink on the same PC will be faster.
RLink supports all the microcontrollers that are supported by Ride7. See the up-to-date list in the
“Advanced ARM Options” -> “Processor” -> “Processor name”.
The REva evaluation board is a demonstration board that includes an embedded RLink. The
whole board can be powered by the USB through the RLink. The target microcontrollers are on
interchangeable daughter boards so that one evaluation board supports several different targets.
For Ride7, there is no difference between operating the REva and using an RLink with any other
board with the JTAG connector. See the REva documentation for more information.
4.2.1
RLink capabilities
RLinks have different capabilities for programming and debugging of STRx, STM32, ST7 and
uPSD microcontrollers. Your RLink will fall in one of the following categories:
•
Standard RLinks and RLinks in STRx or STM32 starter kits: Are allowed a limited
access to STRx and STM32 microcontrollers. With these RLinks, you can load and
debug up to 16Kbytes (STRx) or 32 Kbytes (STM32) in RAM mode. You can also
program (and execute) the full FLASH memory, but you cannot debug it. They can also
be used with all the other ST targets supported by RLink (ST7, uPSD). Stanbard RLinks
are in a grey plastic box. Starter kit RLinks are embedded in the REva evaluation boards
contained in the STRx REva starter kits. See the REva documentation for more
information.
•
STRx/STM32 Pro RLinks: Permit full access to STRx and STM32 targets without any
limitations. They can also be used with all the other ST targets supported by RLink (ST7,
uPSD) without any limitations. They are in a plastic box for protection.
Your RLink’s capability to program and debug any Ride7-supported target microcontroller can
be reported when Ride7 reads your RLink’s serial number. If you want to verify what kind of
RLink you have, use the “Connect to RLink” instant action in the debug options (see below).
Note that RLink (all categories) and JTAGjet cannot work in External Memory mode.
- 25 -
Debugging with Hardware Tools
4.2.2
Ride7 for ARM
Configuring Ride7 for using the RLink
After selecting RLink ARM as your debugging tool (see the section, "Selecting hardware
debugging tools"), click on the "Advanced Options" button to open the Debug options dialog box
shown below.
To debug your application, make sure that Debug is checked as shown below.
Uncheck the Debug option if you want to use RLink as a simple programmer, e.g. if you want to
try the application on the ARM without debugging it. If the Debug option is unchecked, then
launching the debug session will simply program the code to your STRx or STM32 and start
execution. This is useful when using RLink if you don't have the application source code.
- 26 -
Ride7 for ARM
Debugging with Hardware Tools
4.2.2.1 RLink jumpers
When using a starter kit’s embedded RLink (no plastic casing), ensure that your jumpers are set
correctly on the RLink. To do this, click on "View RLink jumper configuration for STRx". The
following illustrations showing the STRx configuration for the RLink jumpers is displayed:
Note: If the pictures in this document differ from those in Ride7, assume that those shown in
Ride7 are correct.
If you purchased RLink as part of an STRx or STM32 starter kit (such as the REva evaluation
board for STRx), then the jumpers should already be correctly set. For this reason, you should
only need to adjust these jumpers if they were accidentally unplugged, or if you are using an
RLink that was configured for another microcontroller such as ST7.
4.2.2.2 Instant actions
This section of the dialog box allows you to carry out the instant actions listed below without
leaving this dialog box. This is useful for testing connections and retrieving information from the
RLink and your ARM, as well as for programming the ARM and its configuration.
•
“View RLink REva jumpers configuration for STRx” shows you how you must set the
jumpers on RLink for using it for programming and debugging STRx. You must be sure
that the jumpers are correctly set before launching a debug session, or using any of the
instant actions below.
- 27 -
Debugging with Hardware Tools
Ride7 for ARM
•
"Connect to RLink and read serial number" is useful for checking that RLink is working
and properly connected and that the USB driver is correctly installed. It also allows you to
read the RLink serial number, which you will be asked for if you contact our support
team. When Ride7 checks the RLink serial number, the resulting serial number message
includes information about your RLink’s capabilities and limitations for the currently
selected target microcontroller. See “RLink types and capabilities” above.
•
"Check connection to target" allows you to read the JTAG IdCode of the chip. Use this to
test the connections and power of the target STRx or STM32.
•
"Erase target now!" allows you to completely erase the target's FLASH (writing 0xFF).
•
"Write target FLASH now!" programs the FLASH with the current application's hex file
generated by the linker. Then, launches the execution.
•
"Dump target FLASH to hex file" reads the contents of the FLASH and writes it in a file
in hex format whose name is derived from the current application's name with the
extension .hex (<application name>.hex).
4.2.2.3 JTAG Parameters
"Single Device" allows determining if there are several JTAG devices chained or only
one device.
The JTAG standard makes it possible to chain JTAG devices. Using JTAG chaining is a
complex process and should only be done if you have a good knowledge of the JTAG
protocol. This section of the debugging options allows you to configure Ride7 to access
an STRx or STM32 microcontroller that is chained with other JTAG devices.
The checkbox should remain checked if there is no other device in the chain. Otherwise,
you should uncheck it and enter the four parameters that the software needs to access the
correct target in the chain. You need to know how many devices are in the chain, what
order they are in, and the size of the IR register of each of them. Then, you must tell
Ride7 how many devices are before (and after) the target in the chain. You must also tell
it the sum of the lengths of the IR registers of the devices before and after the target.
"Speed of the JTAG clock…" allows determining the clock speed.
If your CPU’s clock is slow, then you must tell Ride7 to use a slow JTAG clock. If the
JTAG clock is too fast compared with the target CPU’s clock, then communication will
fail. This section of the debugging options allows you to specify the JTAG clock speed:
Reducing the JTAG clock does not have very much influence on the programming and
debugging speed because the USB is the bottleneck for most operations. Therefore, don’t
be afraid to use this option and enter the value of your target’s clock speed in KHz.
Note that the RLink clock has a limited number of possible clock speeds. Ride7 will
select the closest possible value that is less than the value you required. The minimum
value is 400KHz. If your clock is slower than this, RLink might not be able to program
and/or debug it. You would then have to purchase JTAGjet, or develop your application
using a faster clock.
- 28 -
Ride7 for ARM
4.2.3
Debugging with Hardware Tools
Hints and Troubleshooting
4.2.3.1 Example projects
The examples in the REva folder of the “Ride” directory are configured for use with the REva
evaluation board, which includes the RLink. For standard installations they are found at
C:\Program Files\Raisonance\Ride\EXAMPLES\ARM\REva. These examples can also be used
with other demonstration and evaluation boards with a standard JTAG connector and the RLink.
Before using an example, look at it and make sure that the jumpers on the REva evaluation board
are set correctly (Enable switches for the LEDs, buttons, SCI, EEPROM, etc). Usually, there is
some important information in comments at the beginning of the main file (I.e. the file that
contains the "main" function).
The examples in the Primer folder of the Ride directory are configured for use with the Primer
evaluation boards, such as the STM32-Primer, which includes the RLink. For standard
installations they are found at:
C:\Program Files\Raisonance\Ride\EXAMPLES\ARM\Primer(\STM32).
These examples can also be used with other demonstration and evaluation boards with a standard
JTAG connector and the RLink. Usually, there is some important information in comments at the
beginning of the main file (I.e. the file that contains the "main" function).
4.2.3.2 Testing USB driver, connections and power supplies
To test the USB driver installation and the operation of RLink, use the "Connect to RLink"
instant action. The RLink appears in Windows' device manager under the "Jungo" section when it
is correctly recognized.
• To test the connections and power of the target board and STRx or STM32, use the
"Check connection to target" instant check. This operation requires RLink to connect to
the target ARM, ensuring that it is powered, correctly connected to RLink, and that the
rest of the application board does not interfere with the communication between RLink
and the STRx or STM32 (see below). It also checks that the JTAG TAP is of the correct
type.
- 29 -
Debugging with Hardware Tools
4.3
Ride7 for ARM
JTAGjet programming and debugging features
Ride7 for ARM also supports the JTAGjet emulator from Signum Systems Corp. Even though
very similar in concept and usage, the JTAGjet is considerably faster than the RLINK and offers
a real-time trace (ETM) capability.
The advanced options for both emulators are the same and have the same functions.
The user interface is also the same.
JTAGjet is allowed full access to the STRx. This means that it can be used for programming and
debugging, in FLASH or in RAM, without limitation.
4.3.1
Signum Systems USB driver installation
The JTAGjet emulator requires installation of the Signum Systems USB driver. The installation
process is different depending on whether you work in the Ride7 environment or use a third party
debugger. In both instances, the driver is the same. You will find the required driver files on the
CD-ROM disk that comes with the JTAGjet.
4.3.2
Installing the Signum Systems USB driver for Ride7
To install the USB driver for JTAGjet:
1.
Insert the Signum Systems CD-ROM into your CD drive.
2.
Plug the JTAGjet into the USB port.
Normally, MS Windows will detect and install the required driver automatically. If, the OS
cannot find the driver, direct it to the SigUSB.sys (SigUSB98.sys on Win98) file in the root
folder of the Signum Systems CD-ROM.
The latest USB driver version is also available from the Download page at www.signum.com.
For information on troubleshooting the USB driver installation process, refer to the “USB 2.0
Driver for JTAGjet and ADM51” installation instructions on the Signum Systems Technical
Documentation web page at www.signum.com/tecdoc.htm.
4.3.3
Installing the RDI driver for third party debuggers
For instructions on installing the RDI driver for use with software tools other than those from
RAISONANCE or Signum Systems, see “RDI Drivers for Third Party Debuggers with JTAGjet
& RLink” installation instructions on the Signum Systems Technical Documentation web page at
www.signum.com/tecdoc.htm. The procedure incorporates the installation of the USB driver.
4.3.4
Using the JTAGJet/STR9 trace features (ETM) in Ride7
For using the trace capability of the STR9 with JTAGJet, you will have to use the ETM
connector instead of the 20-pins JTAG connector. These two connectors are defined by ARM.
See the ARM documentation for more information.
You need a JTAGJet-trace (not all JTAGJets can perform ETM tracing) and a target board
featuring the ETM connector.
The programming and debugging interfaces are the same as with the RLink or the standard
JTAGJet. But you will find additional commands, once the debug session is started, in the menu
“Debug”->”JTAGJet”.
- 30 -
Ride7 for ARM
Debugging with Hardware Tools
If using the REva board with the ETM connector, you MUST remove the enable jumpers for
LEDs D4, D5, D6 and D7, because they would interfere with the trace signals. These 4 LEDs
cannot be used by the application while using the trace.
4.3.4.1 The JTAGJet trace window
Selecting option “Open Trace Window” will enable trace and open the associated window. This
window is designed by Signum, and is the same as the trace window in Signum’s Chameleon
debugger. Please refer to the Chameleon documentation for more information.
4.3.4.2 The trace IO configuration
For operating, the trace uses more pins than the simple JTAG debugging. See the ARM
documentation for more information. These pins have to be configured for trace to work, and the
user (debugged) application should take care not to change this configuration.
When using a JTAGJet with trace capability and a STR9 device, Ride7 will configure the IOs for
the trace as described in a script file. Then, whenever the trace is enabled, and at every execution
of some user code while the trace is enabled, it will check if the configuration has not been
broken by the application. If it has, Ride7 will notify you and ask you if you want it to restore the
configuration for trace, or if you want to disable the trace. If you choose to restore the trace
settings, then Ride7 will reconfigure the IOs according to the data in the script file. This could
affect your application’s behavior.
The script is located in “<Ride installation directory>\bin\STR9_ETM_IO_conf.txt”. It is
designed for the STR9 REva daughterboard, but can be modified if you are using another board.
It consists in a list of entries containing Address, Value, InitMask and CheckMask. At reset,
Ride7 will write the Value of each entry at the associated Address, masked using the associated
InitMask. When enabling the trace or after some user code execution, Ride7 will check the value
in the target device at each entry’s Address against the associated Value, masked using the
associated CheckMask.
Masks have to be used to allow the user application to use some pins other than those used by the
trace but on the same IO port. Be very careful when modifying the script. A wrong script will
prevent you from using the trace, and could prevent you from debugging at all. Always make a
copy of the original script before modifying it. Make sure you have all the necessary information
about ETM from the ARM documentation to avoid any wrong manipulation.
- 31 -