1
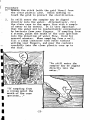
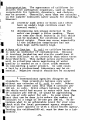
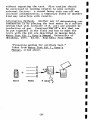
tfiple Assessment
^chniques for Soil and Water
'•?#.
WORKBOOK
1
i)
Environment and Development
Program
*||.o-
8i^i
SIMPLE ASSESSMENT TECHNIQUES
FOR SOIL AND WATER
CODEL
Environment and Development Program
79 Madison Avenue
New York, New York 10016 U.S.A.
CONTENTS
Preface
Introduction
Test #1
Soil pH
Test n
Soil Texture
Test #3
Percolation
Test #4
Dissolved Minerals
Test #5
Sodium in Water
Key for Suitable Irrigation Conditions
Test #6: Coliform Bacteria
Field Practice Data Sheet
Situation Data Sheets
Field Notes
i
PREFACE
This booklet was prepared for a workshop on
"Environmental Factors in Small-Scale Development
Projects" at Lake Mohonk, New York, June 17-19,
1980, by Dr. Timothy S. Wood, then Director of
Environmental Studies, Wright State University,
Dayton, Ohio.
Dr. Wood is now serving in West
Africa with Volunteers in Technical Assistance
(VITA).
The workbook was developed from an initial
draft by Dr. Gus Tillman, Cary Arboretum, which
presented these tests to earlier workshops. Also
involved in early versions were Carol Roever
and Helen Vukasin, CODEL, and Keith Smiley,
Mohonk Consultations on the Earth's Ecosystem, Dr.
Nail Ozerol, Howard University, and Craig Tufts,
National Wildlife Federation.
This draft has been further revised by Helen L.
Vukasin, CODEL, based on technical reviews by Dr.
Ralph Martin, University of Oklahoma, Norman; Dr.
Frederic K. Pfaender, University of North Carolina,
Chapel Hill; Rev. John Ostdiek, Mundelein College,
Chicago; and Dr. August Haffenraffer, Millipore
Corporation, Bedford, Massachusetts.
CODEL welcomes your comments and suggestions on
the usefulness of the booklet. We are particularly
interested in knowing about experience with the
tests in the field.
CODEL Environment and
Development Program
ii
~Z J> ^ ->
"^2^rS2£^^^xSiZ!SS^3^*^^
'A first step toward low technology environment^
analysis."
I
I
I
INTRODUCTION
Among project planners in developing countries,
there is a growing need for reliable environmental
assessment techniques. The most effective methods
are often those which are very simple, using locally
available materials. While they may be primitive
and lack precision, such methods can be extremely
valuable in helping to assure the long-term success
of small-scale development projects.
The techniques described in this booklet represent a first step toward low-technology environmental analysis. What is surprising is how much
useful information can be gained with so little
equipment.
These tests deal with significant
features of soil and water, and with reasonable
care, the results can be meaningful and reliable.
Certainly, such simple tests are not intended
to substitute for detailed, long-term environmental
impact studies. Many problems in soil and water
analysis are complex, requiring the services of
trained and experienced technicians.
Where such
services are unavailable, however, the preliminary
assessment techniques described here can prove
very useful.
I
I
I
I
TEST #1: SOIL pH
Background. One of the simplest and most useful
soil tests is the measure of acidity or alkalinity,
called pH. Not only does it provide important clues
about soil fertility, but it can also help determine
the types of plants best suited for that soil as
well as suggest possible means of improving the
soil for better crop production.
The pH scale ranges from 0 to 14. At pH 7 the soil
is neutral; below that level it is acidic, and above
7 the soil is alkaline (basic). Since pH is based
on a logarithmic function, a change in a single pH
unit indicates a ten-fold change in acidity or alkalinity.
Materials
1
pH indicator paper
Rainwater
Small container, such as a plastic film canister
Soil sample (dry)
Procedure
T. Collect a sample of soil representative of the
field you wish to analyze. The soil should be
dry and loose, without any hard clumps.
2.
Add rainwater to the soil and mix to make a thin,
watery mud.
3. Dip one end of a strip of pH indicator paper
into the mixture and allow water to be drawn
up the paper, which acts like a wick.
1
pH indicator paper is available at laboratories and some pharmacies. It can be ordered
from:
Micro Essential Laboratory, Inc.
4224 Avenue H
Brooklyn, New York
11210 U.S.A.
(Phone: 212-338-3618)
-1-
4. Match the color of the wet paper to one of
the bands on the color comparator chart to
find the approximate pH.l
5. NOTE: The pH paper should not remain in the
mixture for any extended length of time.
After five minutes or so it is possible to
get a false reading, as the rising water
washes out dye at the base of the strip and
concentrates it near the leading edge of the
water column.
Interpretation. A close relationship is found
between soil pH and the nutrients available to
a growing plant. Figure 1 (below) shows the effects of pH on 12 such nutrients, where the wider
the band the greater the availability. Clearly,
strongly acid soils are deficient in many dissolved nutrients, while strongly alkaline soils
have little available phosphate. Like all living things, plant growth depends on that essential nutrient which is available in the least
quantity. Therefore, whether it is one nutrient
or ten nutrients that are unavailable to the
plant, the growth restriction will be the same.
4 0 4 5 50 55 6.0 6.5 7.0 7.5 80 E5 9.0
|
StRONGLY
ALKALINE
c=C_J
L_E
I NEUTRAL*]
(Figure 1 is
from R.E. Lucas
and J.F. Davis,
Department of
Crop and Soil
Sciences, Michigan State
University.)
CALCIUM
X
3C it:
MAGNESIUM
zxzIRON
1'A color
comparator is supplied with the pH
paper.
-2-
xn
n:
If you were to select a pH that would have available the greatest number of plant nutrients, you
would be correct to choose something around 5.5.
Nonetheless, every plant species has its own special pH preferences. Suitable pH ranges for selected
plants are given in Table 1 (below).
Acidic soils can be made more alkaline by the addition of ground limestone, ground seashells, or wood
ashes. Decreasing the pH of alkaline soils is much
more difficult. Traditionally, ammonium sulfate is
used, but composted organic material also helps.
Testing for pH in soils is useful wherever crops
are grown. It is especially important before and
during any program for irrigation, fertilization,
or soil improvement.
•
|
I
*
The pH of water is easily measured, but is has little
significance in agricultural projects. It would be
incorrect to assume, for example, that irrigating
with acid water will create an acid soil. The pH
of water, however, may be of concern for fisheries
projects. So many different factors combine to
establish the soil pH that it usually is better
to just measure the soil pH alone.
I
TABLE 1.
•
•
SUITABLE pH RANGES FOR SELECTED CROPS
Crop
pH
Alfalfa
Apples
Asparagus
Barley
Beans, Lima
Beans, Snap
Beans, Velvet
Blueberries
Buckwheat
Cabbage
Carrots
Clover, Alaska
Clover, Crimson
Clover, Red
6.3
5.7
6.0
5.5
5.5
5.5
5.5
5.5
5.2
5.7
5.7
5.3
5.5
6.0
-3-
-
7.5
7.5
7.0
7.0
6.8
6.5
6.5
5.8
6.5
7.0
7.0
7.0
7.0
7.0
Table 1 (continued)
pH
Crop
6.5
6.0
5.5
5.5
5.5
5.5
5.5
5.3
6.0
5.5
5.5
6.0
5.5
6.0
5.5
5.0
5.0
5.5
5.5
5.5
5.5
6.0
5.5
5.2
5.5
5.7
5.0
5.5
5.5
Clover, Sweet
Clover, White
Corn
Cotton
Cowpeas
Cucumber
Grasses, many kinds
Kale
Lettuce
Mustard
Oats
Onions
Parsnips
Peas
Peppers
Potatoes, Sweet
Potatoes, White
Radishes
Rye
Sorghum
Soybeans
Spinach
Squash
Strawberries
Sudangrass
Timothy
Tobacco
Tomatoes
Wheat
-4-
-
7.5
7.0
7.0
6.5
7.0
6.8
7.0
6.5
7.0
6.5
7.0
6.8
6.8
7.0
6.5
5.8
5.2
6.5
7.0
7.0
7.0
7.0
6.5
6.5
7.0
7.3
6.0
6.8
7.0
TEST #2: SOIL TEXTURE
Background. The expression, "soil texture" refers
to the various sizes of rock particles in the soil.
Traditionally, the spectrum of sizes is classified
into at least three types: sand (0.05 - 2 mm.
diameter), silt (0.002 - 0.05 mm. diameter), and
clay (under 0.002 mm diameter). Most soils are a
mixture of these sizes, but where one predominates,
one can speak of a "sandy soil" or a "silty soil,"
etc.
The following procedure is a simple way to identify
the particle composition of a soil sample. It is
based on the principle that when suspended together
in a jar of water, the larger particles will settle
faster than the smaller ones. The taller the jar
and the greater the settling distance, the better
will be the separation.
Materials
Tall glass jar with lid
Water
Soil sample
Procedure
T. Visual Test
1. Add a loose soil sample to fill approximately
one-third the volume of the jar. There should
be no hard clumps, and preferably no pieces of
leaves, stems, or other organic debris.
2.
Fill the jar nearly to the top with water, cap
it, and shake the mixture to suspend all the
individual soil particles. Then let the jar
stand undisturbed. Most of the particles will
settle within a half hour, although many of the
smallest clay particles will not settle for a
week or more.
3. The settled particles will take on the appearance of distinct bands or layers. While there
is probably a continuum from large to small,
-5-
the rough fraction of each size class can
be estimated.
B.
"Feel" Test
1. Moisten a sample of soil and feel it in
your fingers. Roll the soil between the
thumb, fore and middle fingers. Try to
form a small ball. Check to see if soil
will form a long thin ribbon or ribbon
out. Soils may stick to the hands and
soil them. Determine the textural class
of the soil according to Table II.
Interpretation. By learning the texture of a soil
sample, one can also know some of its chemical and
physical properties.
For example, sandy soil tends to be relatively infertile and vulnerable to drought. However, the
rapid rate of percolation (see Test #3) promotes
good aeration for beneficial soil organisms and
plant roots. Sandy soil can safely accept irrigation with water containing a high concentration of
dissolved minerals, while such water would be unsuitable for "heavier" soils.
Where water is scarce and the soil is sandy, the
addition of organic material before crops are planted-and afterwards as a mulch--can help retain moisture.
A wise choice of irrigation methods will also help
increase the productivity of sandy soil in parched
climates (see Chapter 6 in Environmentally Sound
Small-Scale Water Projects by Gus Tillman (New York,
C0DEL/V1TA, 198 Ij:
Clay soil can hold and retain a larger amount of
water than sandy soil, and it resists the leaching
of nutrients. Unfortunately, low percolation in
clay soil leads to water-logging and poor aeration.
Clay soil exposed to a hard rain often dries with a
hard-baked surface. Further drying causes clay soils
to contract, opening deep cracks which seriously
damage plant roots. These conditions may be improved
by: a) adding sand to the soil, and b) applying a
mulch of organic materials to protect the soil from
driving rain and to prevent complete drying.
"Loam" is a term for a mixture of soil types that
provides a good medium for growing plants. While
there is room for much variation, a good loam may
be approximately 40$ sand, 40% silt, and 20% clay.
With organic material and an adequate water supply,
such soils can become highly productive.
-7-
TABLE
CHARACTERISTICS OF THE
Soil Textural Class
Ability to
Feel (moist) Form Stable Ball1
SAND
Very gritty
No
LOAMY SAND
Very gritty
No
SANDY LOAM
Gritty
Yes (easily
deformed)
LOAM
Gritty
Yes
SILTY LOAM
Velvety
Yes
SILTY CLAY LOAM
Velvety and
sticky
Yes (very
stable)
CLAY LOAM
Gritty and
sticky
Yes (very
stable)
SANDY CLAY LOAM
Very gritty
and sticky
Yes (very
stable)
SILTY CLAY
Extremely
sticky and
very smooth
Yes (very
resistant to
molding)
CLAY
Extremely
sticky with
slight
grittiness
Yes (very
resistant to
molding)
- 8 -
II
MAJOR SOIL TEXTURAL CLASSES
Ability to 1
Ribbon Out
Soils,
Hands
Consistency
Moist
Dry
No
No
Loose
Loose
No
Yes(slight)
Loose
Loose
Yes (dull surface, poorly
formed)
Yes
Very
friable2
Soft
Yes (dull surface, poorly
formed)
Yes
Friable2
Soft
Yes (dull surface, poorly
formed)
Yes
Friable 2
Soft
Yes (shiny surYes
face, well formed)
Friable to
firm
Slightly
hard
Yes (shiny surYes
face,well formed)
Firm
Slightly hard
to hard
Yes (very shiny
surface, well
formed)
Yes
Friable 2
to firm
Slightly hare
to hard
Yes (very shiny
surface, well
- formed)
Yes
Firm to
extremely
firm
Hard to very
hard
Yes (very shiny
surface, well
formed)
Yes
Firm to
extremely
firm
Hard to very
hard
I
I
I
Adapted from Foss, «st al.,
A Laboratory Manual for Soil Science
'See explanation under B. 1.
-Crumbles easily.
- ^9 -
2
1976.
TEST #3: PERCOLATION
Background.
Percolation is the movement of water
through wetted soil. The force behind the movement
is gravitational,^ although some capillary action^
and plant root osmosis^ may also occur. Many factors affect the rate of percolation, such as:
a) Soil texture - water passes more quickly
through large pores in sandy or loam soils
than through heavy silts and clays.
b) Soil structure - fine-structured soils
with stable aggregates^ pass water more
easily than unstructured soils.
c) The amount of water already in the soil in saturated soils there are fewer cracks
and pores through which water can pass
readily.
d) The organic content of the soil - organic
material maintains a loose soil structure
that facilitates percolation.
e) The depth of soil to bedrock, laterite,5
hardpan,6 or other impermeable layers.
•^•The pull toward the center of the earth.
2.Action by which the surface of a liquid
where in contact with a solid is elevated or depressed.
3-Diffusion or absorption through a
membrane.
^'Hard inert rock.
5.Type of rock, red in color with a high
proportion of iron oxides and hydroxide of aluminum.
,
'A compacted layer of soils.
-10-
When soil permits moderate to high percolation, it
is said to be "well drained." Such soil may support
vigorous root growth by allowing excess water to
drain away, leaving air openings through which the
roots can "breathe." In irrigation projects, a
well-drained soil means less chance of waterlogging or salt accumulation.
When water is poured over the surface of dry soil
it will usually soak in rapidly for a while. This
temporary situation is known as infiltration, not
percolation, and it happens only while the water is
filling open spaces in the soil. It is only after
this phase that true percolation occurs - the movement
of water through wetted soil. When conducting a test
for percolation, it is important to avoid this confusion with infiltration.
Materials
"Tin" can with top and bottom removed
Water - equal to the volume of the can
Dipstick - any stick will do
Ruler
Rock - for pounding
Board - about 30 cm. long
Procedure
Y. Sink the can into the soil until its upper rim
projects 8-10 cm. above the surface. Do this
by placing the board across the top of the can
and pounding it down with the rock. It is very
primitive, but it works (unless one encounters
a large rock, in which case try a different
location).
2.
Remove the can from the soil and the soil that
comes with it, leaving a round hole in the ground.
3.
Pour some water into the hole to a depth of
2-3 cm. Allow the water to stand for ten minutes,
then re-fill, if necessary, to the original depth.
This allows time for infiltration. If the soil
is very dry, it may require more time and more
water to complete this initial phase of water
movement.
-11-
4. Measure the depth of water in the hole. Do
it several times to be sure your measurements are consistent. Measure the depth
again one hour later. Calculate the change
in depth during that hour. If time permits,
let the system go for a second or third
hour, and then determine the hourly rate
of percolation.
Measure the depth of water in the hole with a
marked stick placed against a horizontal board
across the hole.
-12-
Interpretation. Percolation rates are generally
classified as follows:
a) Very low: rates of less than 0.25 cm.
(0.1 inch) per hour.
b) Low: rates of 0.25 = 1.25 cm (0.1 - 0.5
inch) per hour.
c) Medium: rates of 1.25 - 2.5 cm.
1.0 inch) per hour.
(0.5 -
d) High: rates greater than 2.5 cm. (1.0
inch) per hour.
Uses. Projects in which testing soil percolation
would be significant include:
a) Fishpond construction, where the desired
percolation rate would be zero, and where
the testing should be conducted at many locations to the maximum depth of the proposed pond.
b)
Irrigation projects, where it is necessary
to know how fast water will sink below the
root zone. Percolation and infiltration
rates should both be considered if there
are to be long, unlined channels conducting
irrigation water to the fields.
c) Construction of latrines, lagoons, or any
other in-ground sewage disposal system.
When percolation rates are high, these
systems can handle a relatively high volume of liquid wastes, but disease-causing
organisms may be carried over 100 meters
through the soil. Soils with low percolation rates present problems with clogging
and low capacity, but the pathogens are
generally contained within 30 meters.
-13-
TEST #4: DISSOLVED MINERALS
Background. Most surface and subsurface waters contain a certain amount of dissolved minerals. Many
of these are essential for plant growth, although
in high concentrations their effects can be harmful. No standards for irrigation water quality are
possible since so much depends on soil drainage,
climate, types of crops, and specific minerals in
the water.
The following test can be considered useful in providing only a rough guide to the mineral content
of water. Combined with other soil information,
the test results can be helpful in planning agricultural projects.
Materials
Glass - flat, smooth, and clean, at least 40 cm.'
in area. A hand mirror or any piece of window glass would be fine
Eyedropper, or any other device that can release
one drop of water at a time (drinking straw,
smooth stick, etc.)
Rainwater - only a very small amount is needed,
but it must be clean. Collect in clear
glass container.
Procedure
T^ Prepare the glass so that it is absolutely clean
and dry. It must be so clean that a drop of
water will bead on its surface.
2.
Place the piece of glass in a level position
where it will not be disturbed.
3. Make 5 separate puddles of water. Start #1
with 4 drops of rainwater for control. For
each of the other puddles combine different
amounts of rainwater and test water as described below:
-14-
Puddle
#1
n
#3
#4
#5
4.
Rainwater
4
3
2
1
0
drops
drops
drops
drop
drops
Water to be Tested
0
1
2
3
4
drops
drop
drops
drops
drops
Allow all puddles to dry undisturbed.
Interpretation. If there is a mark left by the
rainwater alone, it should be only barely discernible; otherwise the test is void and should
be repeated with cleaner rainwater. The remaining water marks should fit one of the following
descriptions:
a)
Marks left by puddles "2-5 are rings in
which the centers are clean. LOW MINERAL
CONTENT (less than 700 mg/1).
b)
Marks left by puddles #2-5 are rings; the
central area is clean in #2-3, but in #4-5
a slight film residue extends throughout
the area. MEDIUM MINERAL CONTENT (7001800 mg/1).
c)
Marks left by puddles #4-5 are not distinct rings, but instead form a more-orless uniform blotch on the glass, often
distinctly granular, sometimes not drying
completely unless heated. HIGH MINERAL
CONTENT (more than 1800 mg/1).
There will, of course, be conditions intermediate
to these descriptions, and these will be subject
to the investigator's best interpretation.
The mineral test by itself does not provide much
useful information. Only when combined with the
infiltration test (Test #3) and specific mineral
tests (such as Test #5) do the results gain significance, especially for irrigation projects.
Examples of how to use combined results of several tests for irrigation projects is illustrated
by the Key for Suitable Irrigation Conditions,
pp. 19-21.
-15-
TEST #5: SODIUM IN WATER
Background. A high mineral content does not necessarily make any water unsuitable for irrigation.
However, if one of those minerals is sodium, the
use of such water for irrigation can cause serious
damage to the soil. A high concent r at ion« of sodium
in the water will break down soil aggregates, sealing the pores and reducing the infiltration rate
to almost zero. In most cases, the changes are irreversible.
The following test is normally used to distinguigh
between hard and soft waters. However, when the
mineral content of the water is known to be high,
the test can be used to assess the relative proportion of sodium ions.
Materials
A small, water-tight container with lid, such
as a plastic 35 mm film canister
Soap or soap solution (but not detergent)
Rainwater or distilled water
Procedure
Y. Make a soap solution by adding some soap flakes
(shaved from a bar of soap with a knife or razor
blade) to some rainwater. Allow the mixture to
sit for several hours, then filter gently through
a cloth to remove any remaining soap particles.
Try not to make suds.
2.
Standardize the strength of your soap solution
as follows: fill the container halfway with
rainwater. Find the minimum number of drops
of soap solution required to maintain frothy
suds for at least five minutes after the mixture has been shaken vigorously for 5 seconds.
This amount of soap solution will be your
"standard dose."
3. Empty, and rinse the container with rainwater.
Re-fill halfway with the water to be tested.
Add the standard dose of soap, close the container, and shake it vigorously for 5 seconds.
-16-
Open the container and note the condition of
the mixture.
Interpretation. The shaken mixture should match
one of the following descriptions:
a)
Suds cover the surface,
a HIGH SODIUM RISK.
b)
The water appears cloudy.
a MEDIUM SODIUM RISK.
This indicates
This indicates
c) A white sum floats on the surface,
indicates a LOW SODIUM RISK.
This
Note that this test must be performed in conjunction with Test #4, Dissolved Minerals. The sodium
test is meaningful only when the dissolved mineral
content is medium or high.
Together, these tests are essential before irrigation projects are undertaken.
upplti Canal
7
\ \
lC$»*-
draws
Border
Irrigation/
From Tillman, Environmentally Sound Small-Scale
Water Projects, op. cit., p. 7.
•17-
-18-
KEY FOR SUITABLE IRRIGATION CONDITIONS
On the following two pages is a key to assist with
an assessment of environmental conditions suitable
for an irrigation project. The key assumes that a
supply of water for irrigation exists and that the
impact of withdrawing the water from its present
source has already been examined.
A key such as this presents a series of choices to
the user in a significant sequence. Begin with
pair #1, select the statement (a or b) whichever
best fits your information, and proceed to the numbered pair of statements indicated by the numeral
on the right. When you encounter a letter in the
righthand column, refer to the box below for an
explanation.
For example:
A.
If you choose #la, go
If you choose #2a, go
If you choose #3a, go
cates that conditions
irrigation.
next to statement #2.
next to statement #3.
next to C which indiare unsuitable for
If you choose #lb, go
If you choose #4b, go
If you choose #5a, go
If you choose #6b, go
If you choose #7b, go
cates that conditions
rigation.
next to statement #4.
next to statement #5.
next to statement #6.
next to statement #7.
next to A which indiare suitable for ir-
-19-
C J •<*
n
o
u ta
vo i n
55
o
H
H
0)
o
i d <U
o
O
OT• H
+» u
O
3°
ti
z
o
H
<u
H
in 6
o
t-» m
W
W
W
OT
in
u
D
in
in g>
si
o o
si
•P H
M-l V
O VI
a) a)
s
o <u
01 (Q
w ta
•rl -H
VI
d)
u
id
id
M H
Q) 0 1
§
H
> >
s»
4J 4J
id n>
1!
I
o
. o
33
•H -rl
<M *M
O O
S
a) <u
o
o
id ra
- o
u
o
Cd 43
M
O
0 a)
+»
U
b
O
43
4J
W
sss.
very
not
w
G
*
o
in w
-H-H
(U 0)
4J-M
id id
u u
ca
o o
TM
<d id
oo
uu
o) 3
CM CM
rt 40
(Nl
- 20 -
cd X)
to
id id
> >
c a
oo
id id
irrig
irrig
s
1m
<M <M
O O
•M -P
§ <D
V +>
a c
oo
oo
Id id
*8
c a
32
<d 43
VD O
O r-»
CO ft.
TJ
o o
rtfc si
4J
W
0)
M
O
a
o
•r4 - H
id
V)
SB
M
0)
M
O
rt
" fl)
o o
s, 4J
O
rH
0)
B
01 01
V)
VI
<D <D
•M +i
<u m
id id
&> t p
•H
H
UK
c c
d
w m
•H rl
VI M
ci
o o
ill nJ
1*
Cd 4 3
88
< mo
id id
C
O
33
88
a) 3
CM
td J 3
o o o
u u o
a.
CdJ3
\o
- 21
-
TEST #6: COLIFORM BACTERIA
Background. The contamination of water supplies with
disease-causing organisms is a serious problem in
many parts of the world. However, detecting such
contamination can be tricky. Water that appears
clean and without taste or odor may, in fact, be
swarming with extremely dangerous bacteria, viruses,
and parasites from human feces.
Fortunately, testing for each individual pathogen is
unnecessary. The common practice is instead to seek
the presence of a relatively harmless bacterium that
is common in the fecal wastes of all warm-blooded
creatures. These so-called coliform bacteria are
represented by a species known as Escherischia coli,
or E. coli, whose presence can be easily detected by
anyone having the proper equipment. The assumption
is that water containing E. coli is contaminated by
by fecal material and could also contain dangerous
pathogens. While several different techniques serve ,
to detect coliform bacteria, one of the simplest
.j
methods uses a simple plastic dip stick with a filter which holds 1 ml. of water. It was developed by i
Millipore Corporation. It is called a Millipore
j
Sampler. Several types with different media for
growing the cultures are available to measure coli- I
form, total bacteria or yeast and mold counts.
I
Materials
Millipore Sampler for Coliform or Coli-Count
Sampler^
Incubator
The skin of or place next to a person
1
j
'
I
-Can be ordered from Millipore Corporation,
Order Service Department, Bedford, Massachusetts,
U.S.A. 01730. Telex: 92-3457, Wire TWX: 710326-1938. Phone: 800-225-13807 or 617-275-9200.
-22-
I
Procedure
1. Remove the stick (with the grid lines) from
the clear plastic case. Allow nothing to
touch the grid to protect the sterilization.
2.
In still water the sampler may be dipped
directly into the water. Alternatively, fill
the clear case to the upper line with a sample
of water to be tested. It is very important
that the water not be inadvertantly contaminated
by bacteria from your fingers. If sampling from
a stream, point the mouth of the case upstream
into the direction of water flow. Hold for
several minutes. When sampling from a well,
fill a clean container with water without
wetting your fingers, and pour the contents
carefully into the clear plastic case up to
the line.
"In still water the
sampler may be dipped
directly into the
water."
I
I
I
I
1
"If sampling from
a stream point the
mouth of the case
upstream..."
-23-
Insert the sampler ail the way into the filled
case, shake several times, and then hold the
case still for 30 seconds. During this time,
the sampler will absorb exactly 1 ml. of water.
Remove the sampler and shake it several times
to remove excess water. Be careful not to contaminate it by allowing it to touch any surface.
Empty the case and shake it to remove excess
water.
Insert the sampler into the empty case. The
whole apparatus must now be placed in an environment that maintains a continuous temperature of 350C. or 98.6°F. for 18-24 hours. If
using a human body to create the incubation environment, the sampler should be taped against
the skin.
After 18-24 hours, examine the paper grid for
signs of coliform bacterial colonies. There
may be many spots on the sampler, but only
those which are raised, shiny, and either blue
or blue-green are colonies derived from single
coliform bacteria. Count the number of colonies.
If there are no colonies visible, see caution
below.
"Count the number of colonies."
-24-
Interpretation. The appearance of coliforms indicates that pathogenic organisms, such as those
responsible for typhoid, dysentery, and cholera,
may be present. Generally, more than two colonies 1
on the sampler indicates water unsafe for drinking.
However:
a)
recently sunk wells or bores will often
have an unduly high coliform count for
several weeks;
b)
decomposing non-sewage material in the
water can prompt a false reading. There
are some non-fecal bacteria in soil which
can be mistaken for coliforms of recent
fecal origin. These may occur especially
if the incubation temperature has not
been kept sufficiently high.
A Note of Caution. E. coli or coliform bacteria
is only an indicator of contamination. Because
it involves incubation and sterile conditions it
is more difficult to do correctly than other tests
described here. This method serves particularly
well in situations where monitoring of water
quality is needed or as a first crude measure
in considering a water project. In some cases
a test by a professional laboratory may be essential. Negative results should not be accepted
I
I
I
I
I
I
1•International agencies disagree on
standards. Some scientists believe only water
without any colonies of E. coli is safe. Others
believe that water with less than 4 colonies per
100 ml. is safe. Still others believe that if
the whole world had access to water with less than
10 colonies per 100 ml. we would be approaching
the aim of safe water for all. In some areas the
best that can be done is to reduce the number of
colonies to a range of 50-100 per 100 ml. To determine what is an achievable level for your area
check with the local government agency responsible for water quality or with a local health agency.
Testing for coliform/100 ml. must be done in a laboratory.
-25-
without repeating the test. Also caution should
be exercised in reading results to note certain
external factors: a recent heavy rain run-off may
increase contamination; a temporary event of another
kind may interfere with results.
Alternative Methods. Another way of determining contamination is by placing the test water in a culture
medium that will indicate if E. coli are present by
production of gas. Construction of a kit that can
be put together in the field and how to make the
tests with the kit are described in George Reid, .
Water Test Kit I, User's Manual, University of
Oklahoma, 1975. $2.00. Available from CODEL.
"Preparing medium for coliform test."
Taken from Water Test Kit I, User's
Manual, cited above.
Rice
Milk
5 mini
-26-
FIELD PRACTICE DATA SHEET
NAME
TEST #1 - SOIL pH.
Soil Sample No.
Soil pH
TEST #2 - SOIL TEXTURE
% sand,
% silt,
% clay
Textural classification:
TEST #3 - PERCOLATION (may be done in groups)
Percolation rate:
per hour.
Test duration:
hours.
TEST #4 - DISSOLVED MINERALS
Water Sample No.
Level of dissolved minerals;
TEST #5 - SODIUM (if applicable)
Water Sample No.
(same as in Test #4)
Sodium risk:
-27-
-28-
I
SITUATION DATA SHEET
Date
Time
Location: County
State
Direction and distance from nearest town post office:
Weather, past 24 hrs.
Current weather
Topography
Ground cover
Color of topsoil
Color of subsoil
Depth
Soil texture classification
% sand,
% silt,
% clay
Other particles
Depth of soil sample
Percolation rates
per hour
Percolation test duration
Soil pH
Evidence and type of erosion
-29-
hours.
WATER.
1
Source of water
|
Color
Transparency
Dissolved solids
DH
•
1
1
1
Sodium risk
Temperature range
Coliforms
per 100 ml.
Sources of possible contamination (sewage, pesticides,
domestic or industrial waste, animals, surface rurjH
off, etc.). Describe nature of contaminant and •
distance from point of water use.
I
1
History of water-borne disease in the region:
cholera
dracontiasis
I
•
1
filariasis
schistosomiasis (bilharzia)
1
1
typhoid
|
malaria
yellow fever
|
other
Reference: Gus Tillman, Environmentally Sound Sma^Scale Water Projects, N.Y., CODEL/VITA, 1981. OrdJfrom VITA, 3706 Rhode Island Avenue, Mt. Rainier,
Maryland 20712.
m
-30-
I
>
FIELD NOTES
-31-
Published with partial support from U.S. Agency
for International Development, Office of Private
and Voluntary Cooperation.