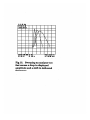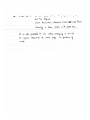
1
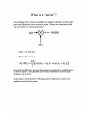
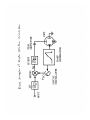
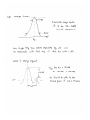
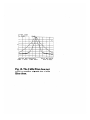
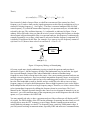
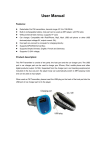
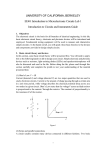
Sweep Time There is a tradeoff that must be made between resolution bandwidth and sweep time. As the bandwidth is reduced, the sweep time must be increased. Filters have finite charging/discharging time constant Risetime of filter = tr = K/RBW where K = 2 to 3 for a Gaussian filter. The time that the signal stays in the passband depends on the span and sweep time (ST): Time in passband = (RBW/span) * ST Thus, to increase the time available to charge the filter, we can either reduce the span or increase the sweep time. Set Time in passband = risetime. Solve for ST ST = K*span/RBW2 Thus, sweep time must be increased with the square of RBW reduction. Most spectrum analyzers link these two parameters automatically, but allow you to override this. If you do, however, the analyzer response may become uncalibrated and you can get both frequency and amplitude errors as shown on the next page. BASICS OF THE SPECTRUM ANALYZER This handout is adopted from: http://www.heitman.ece.ufl.edu/4514l/manual/app_b.pdf 1 Introduction This document contains some general information about spectrum analyzers, and some specific information about the spectrum analyzers you have available in the lab, namely: • Tektronix 2712 • HP 8590 and the HP 8592 Remember that the spectrum analyzers User's Guides are also located in the lab. Like an oscilloscope, a spectrum analyzer produces a visible display on a screen. Unlike an oscilloscope, however, the spectrum analyzer has only one function-to produce a display of the frequency content of an input signal. (But it is possible to display the time waveform on the spectrum analyzer screen with the proper settings.) And also like an oscilloscope, the spectrum analyzer will always produce a picture on the screen; but if you do not know how to properly use the spectrum analyzer, that picture may be completely meaningless. CAUTION: The input of the spectrum analyzer cannot tolerate large signals; before you connect a signal to the input, be sure you know that the signal will not exceed the maximum allowable input rating of the spectrum analyzer. (For example, the Tektronix scope has an RF input power limit of +20dBm, the HP limits at +30dBm. Also keep in mind that if you apply more than one input signal, the maximum allowable amplitude per signal must correspondingly decrease – see the Owner’s Manual for more information.) 2 Signal Acquisition in a Spectrum Analyzer Most spectrum analyzers (including the models in lab) are heterodyne1 spectrum analyzers (also called scanning spectrum analyzers). A heterodyne analyzer is essentially a radio receiver (a very sensitive and selective reciever). Radio receivers, including those based on the heterodyne principle, will be covered later in lecture. For now we will provide a simple description of the basic ideas. Given a voltage signal x(t), we need to somehow extract the frequency content out of it. As we know, the digital storage oscilloscope provides one solution as it can calculate the FFT of the signal from stored samples. Another solution would be to pass x(t) through a long series of very narrow bandpass filters, having adjacent passbands, and then plot the amplitudes of the filter outputs. That is, if filter 1 has passband f1 - BW/2 < f < f1 + BW/2, and filter 2 has passband f 2 -BW/2 < f < f2 + BW/2, where f1 + BW/2 = f2 - BW/2, and so on, and if BW (the bandwidth) is small enough, then the filter outputs give us the frequency components X(f1), X(f 2), . . . and so on . This is, of course, not a practical solution. A better solution is suggested by a simple property of Fourier transforms: recall that if we multiply (in the time domain) a signal by a sinusoid, the spectrum of the signal is shifted in frequency by an amount equal to the frequency of the sinusoid. 1 Heterodyne is derived from a Greek word meaning mixing different frequencies That is, Fourier 1 1 x(t ) ⋅ cos(2πf 0 t ) Transform → X ( f − f 0 ) + X ( f + f 0 ) 2 2 Now instead of a bank of narrow filters, we shall have one narrow filter centered at a fixed frequency, say fI, and we shall scan the signal spectrum across this filter by multiplying x(t) by a sinusoid of varying frequency f0 . See Figure 1. The filter is a narrow bandpass filter at a fixed center frequency, fI, (called the intermediate frequency); in a spectrum analyzer, its bandwidth is selected by the user. The oscillator frequency, f0, is adjustable, as indicated in Figure 1. In an ordinary AM or FM radio, when you tune the receiver you are selecting this frequency so that the desired signal will pass through the filter; in a spectrum analyzer, this frequency is automatically scanned (repeatedly) over a range, which must be selected so that the frequency component X(f) is shifted to fI and passed by the filter. For example, if we want to view the frequency content of x(t) from f1 to f2 , then we must select f0 to scan from f1 + fI to f2 + fI . x(t) Multiplier (Mixer) X Fixed Bandpass Filter ~ cos(2pi f0 t) Figure 1: Frequency Mixing, or Heterodyning Of course, much more signal conditioning is going on inside the spectrum analyzer than is indicated in Figure 1; but the frequency mixing is the fundamental step. In particular, the signal first is passed through a lowpass filter whose bandwidth is chosen to eliminate image frequencies, more on this concept later in the course. Also, most scanning spectrum analyzers are multiple conversion analyzers - they have multiple intermediate frequency stages, at successively lower frequencies. The reason is that we have two conflicting goals to achieve; we would like to have the filter bandwidth as small as feasible, and we would like to be able to scan over large frequency ranges. It is hard to build sharp narrow filters at high frequencies, but it is also hard to build multipliers that will work over large frequency ranges. Therefore, we achieve narrow filters at low intermediate frequencies by shifting the frequency down in several steps. The User’s Manual for the Tektronix Spectrum Analyzer has a nice overview diagram its internals it you are interested – you will learn about many of the components given on this diagram at the end of this quarter, or if you continue with 145B/218B. You may naturally ask why we have a spectrum analyzer if the oscilloscope will display an FFT of a signal. The DSO's display of the FFT has the advantage of capturing one-shot events, as well as being able to store the FFT in memory or on a floppy. But the scanning spectrum analyzer usually holds the advantage over the FFT in frequency range, sensitivity, and dynamic range. If you find yourself working in communications, especially in RF and microwave communications, you will probably find that you will frequently be using a spectrum analyzer for spectral measurements. 3 Spectrum Analyzer Controls In this section we shall describe some of the basic controls on the spectrum analyzer that you will frequently use. More details on these, and descriptions of the more obscure controls, can be found in the user manual. Mainly, you will use the three large buttons labeled FREQUENCY, SPAN, and AMPLITUDE, the various MARKER buttons for making measurements, and the BW/Avg button for selecting the resolution bandwidth. In addition, you will use the control knob, the up and down buttons labeled with large arrows (above the control knob), and the numerical keypad for entering values that will control the display. When you use the spectrum analyzer, always pay attention to the in- formation about the instrument state given in the top, left, and bottom margins of the screen. Calibration There is usually a warm-up time for the analyzer – the Tektronix Manual recommends 15 minutes. When the spectrum analyzer is turned on, it goes through an internal alignment, or selftest, procedure. You will hear clicking and see the alignment screens flash by. This procedure only takes a couple of minutes. The analyzer then continuously runs its alignment check-you will hear occasional noises as this goes on, but it will not interrupt your measurements. You can also manually run the alignment – the Tektronix has a built-in Calibration source that can be selected as the input through the Input Menu → Item 9 (same procedure for turning the calibration source off) – the HP has a Cal Output on the front and would need to be connected through a cable. If you want to play with the controls, the calibration source is most convenient and will never damage the equipment. If you are playing with the controls, you can always get back to a know stage on the HP Spectrum Analyzer by pressing the PRESET button. FREQUENCY Control In normal operation the frequency control selects the range that the variable oscillator in Figure 1 sweeps through. Pressing the FREQUENCY button causes the frequency menu to appear on the screen. You can select the CENTER frequency (CF) and the START and STOP frequencies. You select the numerical values by turning the control knob, pressing the up/down arrows or by entering the value with the numerical keypad. The Tektronix has a frequency range of 9kHz – 1.8Ghz SPAN Control Pressing the SPAN button brings up the frequency span menu. Here you select the frequency span displayed on the screen (as opposed to selecting start and stop frequencies), and you can select span zoom, zero span, and full span. At zero span, or no frequency sweep, the spectrum analyzer will display the time domain input – this is often useful. The Tektronix has a span range from 1kHz/div – 180Mhz/div AMPLITUDE / REF LEVEL Control Pressing this button displays the amplitude menu. Here you select the reference level, whether the amplitude units are power (dBm) or linear (mV), and the scale in dB/division (when using the logarithmic scale). Here is where the spectrum analyzer seems strange compared to an oscilloscope: you measure signal levels from the top of the screen, or down from the reference level. For example, on power-up, the reference level is 0 dBm, meaning that the top line on the screen is at 0 dBm and you measure the amplitudes of lines in the spectrum down from that level. For example, if the REF LEVEL is set to +10dBm, a signal peak that reaches the top of the display is +10dBm. The spectrum analyzer tends to provide more accurate readings when the input signal is placed in the upper two or so divisions of the display. Also, smaller REF LEVEL step sizes will provide more accurate measurements. The Tektronix has a dynamic range of –70dBm - +20dBm Once again, you are cautioned to be careful about applying signals to the spectrum analyzer; it is easy to cause extensive and expensive damage. Resolution Bandwidth Control The resolution bandwidth is essentially the bandwidth of the fixed narrowband filter in Figure 1. (In reality, there are several stages of filtering.) Pressing the BW/Avg button displays the menu from which you can select the resolution bandwidth, the video bandwidth, and associated controls. Note that you cannot select a continuous range of RBW-there is only a finite selection available. The resolution bandwidth determines how close frequency components in the signal spectrum can be and still be displayed as distinct components on the screen. A large RBW may reveal only one signal, say at 900Mhz. However, if the RBW is decreased, another signal at 899.5Mhz may also be present (and thus will show up on the display). The AUTO button allows the spectrum analyzer to automatically select the RBW – manual selection is done with the UP/DOWN arrows – the AUTO button allows you to toggle between auto and manual RBW selection. Video Bandwidth (VBW) is basically a smoothing filter with a bandwidth equal to the RBW. VBW essentially reduces the noise displayed, making the power levels easier to see. VID FLTR button allows you to change the VBW. The sweep control is usually controlled by the spectrum analyzer (the rate at which different frequencies, f0 in Figure 1, are changed) but you can change this by using the arrows under the SWEEP heading. Markers Just as the oscilloscope has markers, the spectrum analyzer has four markers to help you make measurements. You select markers, difference markers, or no markers with the MARKER control buttons and their menus.