1
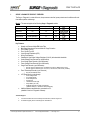
Surge Protector/Power Conditioner/ Diagnostic Software User Manual 120 and 120/230 Volt Models 120V Firmware Revision 1.40 and higher 120/230V Firmware Revision 1.0 and higher Software Revision 2.7 and higher © 2013 Electronic Systems Protection, Inc. / www.surgex.com / UM-Surge+Diagnostic-Rev-B User Manual © 2013 SurgeX / Electronic Systems Protection, Inc. / Technical Support 800.645.9721 / www.surgex.com / 1 User Manual 1. Surge + Diagnostic Product Overview 3 2. Intallation Instructions 4 2.1 2.2 2.3 2.4 3. Surge + Diagnostic Installation ...............................................................................................................4 Surge + Diagnostic PC and Driver Installation ........................................................................................6 Configure PC Settings for COM Port .......................................................................................................7 Diagnostic Software Installation...............................................................................................................8 Hardware 9 3.1 LCD Event Monitor ................................................................................................................................9 3.1.1 Normal Operation .....................................................................................................................9 3.1.2 Wiring Fault ............................................................................................................................10 3.1.3 Abnormal Voltage ...................................................................................................................10 3.2 Clearing Memory .................................................................................................................................11 3.2.1 RST Button .............................................................................................................................11 3.2.2 Diagnostic Software................................................................................................................11 3.3 Data Interface Cable ..............................................................................................................................12 4. Diagnostic Software 4.1 4.2 4.3 4.4 4.5 4.6 4.7 13 How to Connect to Surge + Diagnostic..................................................................................................13 GUI Overview ....................................................................................................................................... 14 Menu Items ..........................................................................................................................................16 Voltage Limit Selection ..........................................................................................................................18 Cycle Power Command .........................................................................................................................18 Enhanced Logging Mode .......................................................................................................................19 Graph Overview & Control .....................................................................................................................20 5. Troubleshooting .24 5.1 Surge + Diagnostic .................................................................................................................................24 5.2 Diagnostic Software................................................................................................................................24 6. Specifications © 2013 SurgeX / Electronic Systems Protection, Inc. / Technical Support 800.645.9721 / www.surgex.com / 25 2 User Manual 1. SURGE + DIAGNOSTIC PRODUCT OVERVIEW The Surge + Diagnostic is a state-of-the-art, microprocessor-controlled, power protector and conditioner with realtime data acquisition and storage. Models: This manual applies to the following Surge + Diagnostic models: Model Number Voltage (AC RMS) Current (AC Amps) LCD SX-HS-15-R 120 15 Yes Outlet Size 1 RU SX-HS-20-R 120 20 Yes SX-HS-L530-R 120 30 No x1 2 RU SX-HS-L630-R 120/230 Split Phase 30 Yes x1 2 RU SX-HS-L630-RDB 120/230 Split Phase 2 x 30 Yes x2 2 RU x8 x6 x2 1 RU Key Features: Normal and Common Mode EMI Noise Filter Multi-Stage Normal and Common Mode AC Surge Protection Zero-Voltage Turn-On Zero- Current Turn-Off Inrush Current Elimination (ICE®) Wiring Fault Detection Catastrophic Over/Under Voltage Shutdown (CouVS®) with selectable thresholds Under-Voltage Event Recorder (up to 999 events) Over-Voltage Event Recorder (up to 999 events) Power Outage Event Recorder (up to 999 events) Surge Event Recorder (up to 999 events) o o Records surges in all three modes: Line-Neutral, Line-Ground, Neutral-Ground (120V) Records surges in all three modes: Line1-Line 2, Line1-Ground, Line2-Ground (120/230V) Event Timestamp Recorder (up to 60 events) LCD Event Monitor cycles through: o o o o o o o o Records time between events Under-Voltage Events Over-Voltage Events Power Outage Events Surge Events Last Recorded Event Type Output Status (On or Off) Additional information in certain circumstances (detailed in Section 3.1: Hardware/ LCD Event Monitor) Additional features available when connected to a PC (detailed in Section 4: Diagnostic Software) Technical Support: To download software and access further product information, visit www.surgex.com For technical support, please contact SurgeX at 1-800-645-9721 © 2013 SurgeX / Electronic Systems Protection, Inc. / Technical Support 800.645.9721 / www.surgex.com / 3 User Manual 2. INSTALLATION INSTRUCTIONS 2.1 Surge + Diagnostic Installation: a. Rack Mount: Designed to be installed in a 19 inch equipment rack and require one or two units (1RU, 2RU) of rack space, depending on model. Use the four thumbscrews (included) to secure the rack ears to the rack rails. These screws can be tightened by hand and do not require tools. b. Connect Equipment: Connect the AC power cords of the equipment to be protected into the receptacles on the rear panel of the Surge + Diagnostic. Make sure that the total amperage of all equipment plugged into the Surge + Diagnostic does not exceed the maximum branch circuit rating. Please Note: Exceeding the branch circuit rating will cause the branch circuit breaker to trip. © 2013 SurgeX / Electronic Systems Protection, Inc. / Technical Support 800.645.9721 / www.surgex.com / 4 User Manual c. Connect Surge + Diagnostic to Outlet: Plug the input power cord into a properly grounded and compatible branch circuit outlet. Please Note: Do not plug the Filter into a re-locatable power tap. i. If the branch circuit outlet is correctly wired and the magnitude of the line voltage is acceptable (between 105 and 130 VRMS for 120V products, or between 190 and 250VRMS for 120/230V products), power will be connected to the outlets of the Surge + Diagnostic and the Green “System On” LED will illuminate. Your equipment is now protected and installed correctly. You may now turn all connected equipment back on. ii. If the branch circuit outlet is incorrectly wired, the Red ‘Wiring Fault” LED will illuminate and the LCD Event Monitor will display specific wiring fault information. If this occurs, contact a licensed electrician to correct the outlet wiring. Refer to Section III: Hardware/LCD Event Monitor, for display details. iii. If neither “System On”, nor the “Wiring Fault” LED illuminates, there is either no voltage at the receptacle or the magnitude of the line voltage is not acceptable (less than 105 VRMS or above 130 VRMS for 120V products, or less than 190 VRMS or above 250 VRMS for 208/230V products). If the magnitude of the line voltage is not acceptable, specific information will be displayed on the LCD Event Monitor. If this occurs, contact a licensed electrician to trouble-shoot the abnormal voltage condition. Refer to Section III: Hardware/Surge + Diagnostic, for LCD Event Monitor display details. 1. You may also need to verify that the Filter is operating properly. To test, plug Surge + Diagnostic into a known properly functioning outlet. If the “System On” LED still does not illuminate in the functioning outlet, contact ESP at 1-800-645-9721. CAUTION – Do not install this device if there is not at least 10 meters (30 feet) or more of wire between the electrical outlet and the electrical service panel. La PRUDENCE - n’installe pas cet artifice s’il n’y a pas au moins 10 mèters (30pieds) ou plus de fil entre l’issue èlectrique et le comitè de service èlectrique. © 2013 SurgeX / Electronic Systems Protection, Inc. / Technical Support 800.645.9721 / www.surgex.com / 5 User Manual 2.2 Surge + Diagnostic PC and Driver Installation Please Note: The Surge + Diagnostic unit may be accessed by a PC while connected to AC power and equipment, or while disconnected from AC power and equipment. If accessed by a PC while connected to AC power: For best protection, it is recommended that the power cord of the computer is plugged into an available receptacle on the Surge + Diagnostic. Connecting the unit to a PC allows for the availability of the following features: Import data stored in the Surge + Diagnostic device memory Import data from a stored data file Export data to a data file Export data to a report in PDF format Set over and under-voltage shutdown thresholds Clear device memory Real-time AC voltmeter Enhanced Logging Mode Equipment required for PC communication: Surge + Diagnostic unit Data Interface Cable Diagnostic Software (Revision 2.7, available at www.surgex.com) PC running Windows XP or later with a USB port and a minimum screen resolution of 1024x768 a. Plug the USB end of the Data Cable to an available USB port on your PC. b. Automatic Driver Installation (requires Internet connection) When you plug the USB into your PC, Windows will automatically detect the cable. i. When the “Found New Hardware” pop-up box appears, be sure to select “Yes, this time only” option for the device driver installation ii. This installation could take a few minutes to search and download the driver files. Once the files are found, follow the on-screen instructions to install. iii. Please Note: The drivers will first install the USB serial converter, and will then install the USB serial port drivers separately. c. Manual Driver Installation In the event that the automatic driver installation does not function or there is no internet connection, select “Install Drivers” during software installation. © 2013 SurgeX / Electronic Systems Protection, Inc. / Technical Support 800.645.9721 / www.surgex.com / 6 User Manual 2.3 Configure PC Settings for COM Port *Note: The COM Port Settings procedure has been automated in software version 2.7. See Section 2 – 2.4 – C for details. a. Open Device Manager i. Windows XP 1. Click on Start and then select Run. 2. Type the following command in the “Open:” text box: devmgmt.msc 3. Click on the OK button. 4. Device Manager will display. ii. Windows Vista / 7 / 8 1. Click on Start button 2. Type the following command in the “Search:” text box: devmgmt.msc 3. Click on the OK button. 4. Device Manager will display. b. In the Device Manager, Expand “Ports (COM & LPT)” i. ii. iii. Locate the entry labeled “USB Serial Port (COMx)”, where x refers to the COM port number assigned by Windows. Right-click on “USB Serial Port (COMx)” and click “Properties”. USB Serial Port Properties pop-up box will display c. In the USB Serial Port Properties pop-up box: i. Click the “Port Settings” tab, and then click the “Advanced” button. 1. If the “COM Port Number” is not between 1 and 9, change the assigned value to a value between 1 and 9. Make a note of the COM Port Number. It will be needed to configure the Diagnostic Software (as noted in Section 2 – 2.4 – C: Select COM Port.) 2. In “USB Transfer Sizes”, change both the “Receive” and “Transmit” values to 512. 3. In “BM Options”, change the “Latency Timer” value to 4. 4. Leave all other settings at default. 5. Press “OK”, and then press “OK” again. d. Close Device Manager. © 2013 SurgeX / Electronic Systems Protection, Inc. / Technical Support 800.645.9721 / www.surgex.com / 7 User Manual 2.4 Diagnostic Software Installation a. Install Software: b. Starting the program: Open the “ESP Next Gen PCS” Software on your PC (located under “Programs”). When you first open the program, it will look like the following. c. Select COM Port: i. Download Software Installer from www.surgex.com. ii. Unzip and run the installation utility. iii. Follow on-screen instructions to complete installation of the Diagnostic Software i. Specify which COM port the Diagnostic Software should communicate through by navigating to “Setup/COM Port”. ii. In the window that appears, use the drop box to select the appropriate COM port, and press “Save”. 1. 2. 3. Be sure to use the same COM port number that was selected in Section 2 – 2.3 – f: USB Serial Port Properties pop-up box The correct COM port number may be automatically detected by pressing the “Auto Detect” button while the Surge + Diagnostic and Data Interface Cable are connected to the computer. The COM Port Settings may be automatically configured by pressing the “Auto Configure” button. Windows Vista/7/8 users: For proper operation of this feature, right-click on the application shortcut and choose “Run As Administrator”. Your PC is now set up correctly to communicate with the Surge + Diagnostic Product Line. © 2013 SurgeX / Electronic Systems Protection, Inc. / Technical Support 800.645.9721 / www.surgex.com / 8 User Manual 3. HARDWARE 3.1 LCD Event Monitor The LCD EVENT MONITOR displays useful information related to data collection, device status, and troubleshooting. 3.1.1. Normal Operation a. When the Surge + Diagnostic is plugged into a branch circuit outlet with correct wiring and acceptable line voltage, the LCD Event Monitor will cycle through the following information: i. Number of recorded Under-Voltage events: vi. Number of recorded Over-Voltage events: iii. Number of recorded Power Outage events: iv. Number of recorded Surge events: vi. Last recorded Event type: vi. Outlet Status (On or OFF): © 2013 SurgeX / Electronic Systems Protection, Inc. / Technical Support 800.645.9721 / www.surgex.com / 9 User Manual 3.1.2. Wiring Fault When connected to an incorrectly wired branch circuit outlet, in addition to the illumination of the Red LED, the LCD Event Monitor will display the following information: 3.1.3. Abnormal Voltage When the magnitude of the branch circuit outlet voltage is not acceptable*, the Surge + Diagnostic will disconnect power to its outlets and display the following information on the LCD Event Monitor (*above the over-voltage shutdown threshold or below the undervoltage shutdown threshold; refer to Section 4: Diagnostic Software for more information): 3.2 © 2013 SurgeX / Electronic Systems Protection, Inc. / Technical Support 800.645.9721 / www.surgex.com / 10 User Manual 3.2 Clearing Memory The Surge + Diagnostic is able to timestamp the 60 most recent power quality events (information stored in microcontroller non-volatile memory). The microcontroller memory contents can be cleared at any time by following one of these two methods: 3.2.1 RST Button There is a recessed push button located on the front panel. a. Follow these steps to clear the device memory: 1. Unplug the input cord of the Surge + Diagnostic from the branch circuit outlet. 2. Using a paperclip or small screwdriver, press and hold the RST button. 3. Plug the input cord of the Surge + Diagnostic into a properly grounded and compatible branch circuit outlet, while continuing to hold the RST button. 4. Wait approximately 3-5 seconds; the LCD Event Monitor will now display “cLr”; release the RST button and the device microcontroller memory will now be cleared. 3.2.2 Diagnostic Software The device microcontroller memory may alternately be cleared from within the Diagnostic Software in the following location: “Tools/Clear Device Memory”. See Section 4– 4.3- C: Tools Menu, for details. © 2013 SurgeX / Electronic Systems Protection, Inc. / Technical Support 800.645.9721 / www.surgex.com / 11 User Manual 3.3 Data Interface Cable a. The Data Interface Cable consists of a USB connection on one end, and an RJ-11 connection on the opposite end. b. The USB connection plugs into an available USB port on your PC. The RJ-11 connection plugs into the RJ-11 “OUT” Jack (labeled “Data Port”) on the Surge + Diagnostic, which is the jack closest to the LCD Event Monitor and RST button. c. Instructions for Data Retrieval i. Connect the Surge + Diagnostic Data Interface Cable into the USB port on your PC. ii. Connect the Surge + Diagnostic Data Interface Cable into the RJ-11 Jack labeled “Data Port” on the front panel. iii. Open Diagnostic Software. © 2013 SurgeX / Electronic Systems Protection, Inc. / Technical Support 800.645.9721 / www.surgex.com / 12 User Manual 4. DIAGNOSTIC SOFTWARE 4.1 How to Connect to Surge + Diagnostic a. Starting the Program: Open the “ESP Next Gen PCS” Diagnostic Software (located under “Programs” on your PC Start Menu). b. Please Note: A shortcut to this manual will also be located in this location on your PC for future reference and troubleshooting. i. Connecting the Software: 1. Make sure that the USB Data Cable is connected to both the Surge + Diagnostic and your PC (for instructions on how to connect USB Data Cable, refer to Section 3 – 3.3 - c : Hardware/USB Data Interface Cable/Instructions for Data Retrieval – listed above) 2. Press the red button beside “Status” to connect to the Surge + Diagnostic. The Connection Status will change to Green and the top of the screen will indicate that Filter is Connected. © 2013 SurgeX / Electronic Systems Protection, Inc. / Technical Support 800.645.9721 / www.surgex.com / 13 User Manual 4.2 GUI Overview: After connecting successfully, several pieces of information gathered from the Surge + Diagnostic will now be displayed on the Diagnostic Software Graphical User Interface. a. Connection Status: The current connection status is displayed to the right of the Connect/Disconnect button. b. Disconnect: Pressing the green button beside “Status” will terminate communications with the Surge + Diagnostic. c. Location Textbox: The text entered in the textbox is included with data that is exported to a file. d. Voltmeter: A real-time AC Voltmeter is displayed in the upper center, which displays the line voltage both numerically and as an analog meter. © 2013 SurgeX / Electronic Systems Protection, Inc. / Technical Support 800.645.9721 / www.surgex.com / 14 User Manual e. Outlet Status: Outlet Status is displayed below Connection Status. The current state of the outlets is displayed (either On or Off), and pressing the On/Off button will manually turn the output On and Off. When connected to the Surge + Diagnostic during an abnormal voltage condition (power outage, under-voltage, or over-voltage), wiring fault (Reverse Polarity [Live/Neutral reversed], or Missing Ground), the On/Off outlet control is not available, and the corresponding abnormal voltage/wiring fault condition will be displayed beside the outlet status. *A ground connection may be made through the computer connection. It is recommended to determine the outlet wiring status with the Surge + Diagnostic before connecting the Surge + Diagnostic Data Interface Cable, or to use a laptop computer with its charger disconnected. f. Recorded Data Display: The lower portion of the screen is a display of the data recorded and stored in the Surge + Diagnostic internal memory. Power quality event totals are listed in the “XG Memory Totals” table. The events are listed in the “XG Time Stamps” table in order of occurrence (with the most recent events at the top) with their corresponding estimated date and time of occurrence. The events are also graphically displayed on the “Power Quality Events By Estimated Date/Time” graph in order of occurrence by estimated date and time (the Surge + Diagnostic does not currently record the duration of a power outage event). If additional power quality events are recorded while connected to the Surge + Diagnostic, the data display will automatically update with the new information. The Surge + Diagnostic Microcontroller can record up to 999 occurrences of each of the following: i. ii. iii. iv. g. Over-Voltage Events Under-Voltage Events Power Outage Events Surge Events Timestamps: In addition to the Recorded Data events, the Surge + Diagnostic microcontroller also timestamps up to 60 recorded events. i. The timestamp is a record of the elapsed time (up to 99 Days, 23 Hours, 59 Minutes, and 59 seconds) since the last recorded event – this is the time difference between subsequent events, not the elapsed time from an initial starting point. Please note: The amount of elapsed time during power outages is not recorded. ii. The Surge + Diagnostic Software estimates the actual date and time of each event occurrence based on the recorded time difference between events, and the current date and time of the connected computer. iii. The graph uses the values of 0%, 50%, 150%, and 600% for graphical display of power outages, under-voltages, over-voltages, and surge events, respectively; the actual voltages during these events are not recorded and probably differ from the graphical values (0%, 50%, 150%, and 600%) shown. © 2013 SurgeX / Electronic Systems Protection, Inc. / Technical Support 800.645.9721 / www.surgex.com / 15 User Manual 4.3 Menu Items: a. File Menu: i. Import Data From XG: Manually import data stored in the Surge + Diagnostic internal memory. ii. Import Data From File: Import data from a previously stored data file. Does not require Surge + Diagnostic connectivity. iii. Export Data To File: Exports the currently displayed data to a data file, which can be imported for future viewing. The data file may be saved as text (.txt) or comma-separated (.csv, suitable for viewing in MS Excel). Including the Enhanced Logging Mode data is optional. iv. Save Report: Saves a summary report of the currently displayed data in PDF format. v. Save Image: Saves a screenshot of the program as an image (.bmp) file. vi. Print: Prints a screenshot of the program. vii. Exit: Terminates connectivity with any connected Surge + Diagnostic and exits the program. b. Setup Menu: i. COM Port: Selects which COM port the PCS program should connect through. The COM port selection is saved to a configuration file, and does not need to be chosen again the next time the program is run (unless a new Surge + Diagnostic Data Interface Cable is used). ii. Logging Interval: Allows for the selection of the logging time interval between acquired line voltage data points when using the Enhanced Logging Mode feature. The logging time interval selections available are: 1 second, 2 seconds, 4 seconds, 10 seconds, and 30 seconds. When the line voltage is changing rapidly, additional data points will be recorded, regardless of the time interval selection. iii. Actions: Allows for the selection of which new event(s) will result in the sending of an email. This feature is only available when the Surge + Diagnostic is connected to a PC with an internet connection and the Surge + Diagnostic software running. © 2013 SurgeX / Electronic Systems Protection, Inc. / Technical Support 800.645.9721 / www.surgex.com / 16 User Manual iv. Voltage Limits: Displays the over-voltage and under-voltage shutdown thresholds currently in use, and allows for the selection of alternate values. *When Under-Voltage Shutdown is Disabled, the Surge + Diagnostic will not actively shut off connected equipment during an under-voltage event. However, the Surge + Diagnostic power relays will drop out and disconnect equipment around 40V. This is because there is not enough voltage available to keep the relays latched. v. Email: Allows for the configuration of email settings. The software is pre-loaded with “courtesy account” settings that may be used for testing purposes. The email feature is only available when the Surge + Diagnostic is connected to a PC with an internet connection and the Surge + Diagnostic software running. This feature may not work with certain Internet Service Providers that block outgoing SMTP communications – check with your ISP for compatibility. Please contact your IT staff for assistance when configuring custom email settings. c. Tools Menu: i. Cycle Power: Commands the Surge + Diagnostic to perform a Power Cycle. ii. Clear Device Memory: Permanently erases the events and timestamps contained in the Surge + Diagnostic microcontroller memory. Clearing the device memory does not affect Voltage Thresholds. iii. Enhanced Logging Mode: Puts the Surge + Diagnostic into Enhanced Logging Mode. d. Help Menu: i. Help Topics: Launches the Surge + Diagnostic Help, which includes troubleshooting information for the Surge + Diagnostic product and software, FAQ, and general information about Power Quality. ii. Manual: Launches the Surge + Diagnostic Manual that is installed with the software package. iii. About: Displays the software revision of the Diagnostic Software program, the firmware revision of the microcontroller in the connected Surge + Diagnostic, the unique chip ID of the microcontroller in the connected Surge + Diagnostic, and ESP’s telephone number for technical support. © 2013 SurgeX / Electronic Systems Protection, Inc. / Technical Support 800.645.9721 / www.surgex.com / 17 User Manual 4.4 Voltage Limit Selection a. b. Navigate to “Setup/Voltage Limits” in the menu. The Voltage Limit selection screen will appear with the currently active limits selected: c. d. To change the limits, check the boxes beside the desired values and press “Save Limits”. When the new limits have been successfully saved in the Surge + Diagnostic, the following message will be displayed: Press “OK” to complete the voltage limit selection process. e. 4.5 Cycle Power Command a. In addition to basic On/Off outlet control, the Surge + Diagnostic Software includes the ability to execute a power cycle. b. When commanded, the outlets will turn Off, then back On, after a 90 second delay time. c. To perform a power cycle, navigate to “Tools/Cycle Power” in the menu. The software will explain that performing a power cycle will turn off power to connected equipment for 90 seconds. Press “Ok” to continue, or “Cancel” to cancel. d. During the cycle, a progress bar will appear which will indicate the time until the outlets are turned back On: e. While the Surge + Diagnostic is performing a power cycle, its LCD Event Monitor will display “cYc” instead of “On” or “OFF”: © 2013 SurgeX / Electronic Systems Protection, Inc. / Technical Support 800.645.9721 / www.surgex.com / 18 User Manual 4.6 Enhanced Logging Mode a. The Enhanced Logging Mode function of the Diagnostic Software extends the logging and monitoring capabilities of the Surge + Diagnostic while a PC is connected. b. Enhanced Logging Mode can be started by navigating to “Tools/Enhanced Logging Mode”. i. The additional features available with the Enhanced Logging Mode are: 1. Logging of individual line voltage measurements a. The magnitude of the line voltage of each data acquisition point is recorded. b. The date and time of each data acquisition point is recorded (based on Windows system time). c. Adjustable logging interval. The time interval choices are 1, 2, 4, 10, or 30 seconds between data acquisition points. d. If the line voltage is changing rapidly (faster than 2V/0.2 seconds), new data points will be recorded, regardless of the logging interval selection. e. The line voltage is displayed visually, graphed against the current date and time (based on Windows system time). 2. Date and Time stamping of new events recorded by the Surge + Diagnostic a. The date and time of each new power quality event recorded by the Surge + Diagnostic microprocessor is recorded (based on Windows system time). 3. Graph Display a. The graph displaying the power quality events recorded by the Surge + Diagnostic will be replaced by a graph of the line voltage (“Line Voltage History”) b. The table (“XG TimeStamps”) displaying the time stamps of the power quality events recorded by the Surge + Diagnostic will be replaced by a table (“ELM TimeStamps”) displaying the power quality events recorded by the Surge + Diagnostic while in Enhanced Logging Mode. © 2013 SurgeX / Electronic Systems Protection, Inc. / Technical Support 800.645.9721 / www.surgex.com / 19 User Manual 4.7 Graph Overview & Control a. Graph Control i. The graphs used to display the recorded power quality events (normal mode) and line voltage (Enhanced Logging Mode) contain Zoom, Cross Hair, and Drag functions that are useful when analyzing data: Legend: Press the L icon to display the Graph Legend to show the values of the Time Stamped data. Pressing the icon again toggles the legend off. Zoom: Press the magnifying glass icon to enable Zoom mode. Pressing the icon again stops Zoom mode, and restores the graph to its full display scale. Cross Hair: Turns the cross hair on and off. Drag: Enables/Disables Drag mode. When in Drag mode, press and hold the left mouse button somewhere on the graph, and move the mouse. The graph will be dragged in the corresponding direction. ii. Several control buttons are available below the graphs, depending on which mode is active: 1. G1/G2: Toggles between Graph 1 (recorded power quality events) and Graph 2 (line voltage). Available after entering Enhanced Logging Mode. 2. **/--: Toggles the data display of Graph 2 (line voltage) between linear and discrete data points. Available when Graph 2 is visible. 3. Stop: Stops Enhanced Logging Mode. Available after entering Enhanced Logging Mode. b. Graph Data i. Power Quality Events Graph 1. The recorded power quality events graph displays the time-stamped power quality events (up to 60) recorded and stored in the Surge + Diagnostic internal memory. The events are plotted as individual data points. 2. While the events are time-stamped in the Surge + Diagnostic internal memory by the elapsed time since the previous recorded event, they are plotted on the graph with an estimated date and time, based on the connected computer’s Windows system time. The duration of a power outage is not recorded, so the date and time of events prior to and including the most recent power outage may not be accurate. Events with an accurate estimated date and time are plotted with a red circle; events with a possibly inaccurate date and time are plotted with a black circle; the time the computer was connected is plotted with a blue square. © 2013 SurgeX / Electronic Systems Protection, Inc. / Technical Support 800.645.9721 / www.surgex.com / 20 User Manual 3. All events recorded while a computer is connected to the Surge + Diagnostic will have an accurate date and time stamp, since the computer will supply power to the Surge + Diagnostic microcontroller in the event of a power outage (as long as the computer stays on). 4. The graph uses the values of 0%, 50%, 150%, and 600% for graphical display of power outages, under-voltages, over-voltages, and surge events, respectively; the actual voltages during these events are not recorded and probably differ from the graphical values (0%, 50%, 150%, and 600%) shown. 5. Zoom Function: The recorded power quality events graph may be zoomed along the X (time) axis. To zoom in on an area of the graph, press the magnifying glass icon, press and hold the left mouse button somewhere on the graph, then drag the cursor either left or right to define the zoom selection, and then release the left mouse button. The graph will now display the selected area. Press the magnifying glass icon again to restore the original full display. © 2013 SurgeX / Electronic Systems Protection, Inc. / Technical Support 800.645.9721 / www.surgex.com / 21 User Manual 6. Cross Hair Function: The cross hair tool is useful when determining the estimated date/time of an event, as well as the type of the event. Pressing the cross hair icon will place a cross hair on one of the graph’s data points, and the corresponding date/time and type of that event will be displayed when the mouse pointer hovers over that point. To move the cross hair to a different data point, simply position the mouse pointer over the data point of interest. 7. Enhanced Logging Mode Line Voltage Graph The Enhanced Logging Mode line voltage graph displays the recorded line voltage in a strip chart style. Each voltage measurement is a discrete data point containing the magnitude of the line voltage and the date and time (based on Windows system time) of the measurement. Data points are acquired at a time interval determined by the selection made in “Setup/Logging Interval”. The choices are 1 point per second, 1 point per 2 seconds, 1 point per 4 seconds, 1 point per 10 seconds, or 1 point per 30 seconds. If the line voltage is changing rapidly (faster than 2V in 0.2 seconds), data points will be recorded at a faster rate, regardless of the interval selection. a. Point/Line (**/-- button) Toggle: The style of the graph can be toggled between individual data points and linear by pressing the “**/--” button. © 2013 SurgeX / Electronic Systems Protection, Inc. / Technical Support 800.645.9721 / www.surgex.com / 22 User Manual 8. Zoom Function: The line voltage graph may be zoomed along both the X (time) and Y (Voltage) axes. To zoom in on an area of the graph, press the magnifying glass icon, press and hold the left mouse button somewhere on the graph, drag the cursor to define the zoom selection, and then release the left mouse button. The graph will now display the selected area. Press the magnifying glass icon to restore the original full display. 9. Cross Hair Function: The cross hair tool is useful when determining the magnitude and date/time of a line voltage measurement. Press the cross hair icon to place a cross hair on one of the graph’s data points, and the corresponding date, time, and magnitude of that data point will be displayed when the mouse pointer hovers over that point: To move the cross hair to a different data point, simply position the mouse pointer over the data point of interest. © 2013 SurgeX / Electronic Systems Protection, Inc. / Technical Support 800.645.9721 / www.surgex.com / 23 User Manual 5. Troubleshooting: The Surge + Diagnostic and Data Interface Cable contain no user-serviceable parts. Do not attempt product disassembly, as this will void the product warranty. 5.1 Surge + Diagnostic Symptom Possible Cause What To Do Red LED On, Green LED Off, No power at output. Incorrectly wired branch circuit outlet. The LCD Event Monitor will display the nature of the wiring fault. Contact a licensed electrician to correct the branch circuit outlet wiring. Red LED Off, Green LED Off, No power at output. No voltage or unacceptable voltage at branch circuit outlet, or Surge + Diagnostic output manually turned Off. If the LCD Event Monitor is not on, there is no power at the wall receptacle. If the voltage is unacceptable, the LCD Event Monitor will display the type of voltage condition. Use the Diagnostic Software to measure the voltage at the wall receptacle. Contact a licensed electrician to troubleshoot the wall receptacle. Use the Diagnostic Software to manually turn the outlets On. Alternately, press and release the RST button once to manually turn the outlets On. Red LED Off, Green LED On, No power at output. Defective product. Contact ESP for product replacement at 800.645.9721. 5.2 Diagnostic Software Symptom Possible Cause What To Do Receive error related to .ocx or .dll file when attempting to start software. ActiveX control not installed. Refer to Section 2: Installation Instructions/Diagnostic Software Installation and Section 4: Diagnostic Software for instructions on re-installing the Surge + Diagnostic Software. Part of the program screen is not visible on the computer monitor. The computer’s screen resolution is set too low. Set the computer’s screen resolution to a minimum of 1024x768. Software will not connect to Surge + Diagnostic. Correct COM port is not selected, Surge + Diagnostic Data Interface Cable is not connected, Serial-USB drivers are not installed, or Surge + Diagnostic Data Interface Cable is connected to wrong port on Surge + Diagnostic. Verify all connections and set the correct COM port, as detailed in Section 2: Installation Instructions. Software will not send email. Email settings are incorrect, computer does not have an internet connection, ISP blocks outgoing SMTP communications. Verify that email settings are correct. Verify that the computer is connected to the internet. Contact ISP regarding policies on outgoing SMTP communications. © 2013 SurgeX / Electronic Systems Protection, Inc. / Technical Support 800.645.9721 / www.surgex.com / 24 User Manual 3. Specifications Parameter SX-HS-15-R SX-HS-20-R SX-HS-L530-R SX-HS-L630-R SX-HS-L630-RDB Voltage Protection Rating SX-HS-15-R (VPR) SX-HS-20-R SX-HS-L530-R SX-HS-L630-R SX-HS-L630-RDB Attenuation Normal SX-HS-15-R Mode SX-HS-20-R SX-HS-L530-R SX-HS-L630-R SX-HS-L630-RDB Common SX-HS-15-R Mode SX-HS-20-R SX-HS-L530-R SX-HS-L630-R SX-HS-L630-RDB Power Requirement SX-HS-15-R (no load) SX-HS-20-R SX-HS-L530-R SX-HS-L630-R SX-HS-L630-RDB Under-Voltage Shutdown 120V Models 208/230V Models Over-Voltage Shutdown 120V Models 208/230V Models Internal Memory Capacity Timestamp Accuracy Voltmeter Accuracy 120V Models (Peak Reading Type) 208/230V Models Response Time Over-Voltage Under-Voltage Under-Voltage Record 120V Models Definition 208/230V Models Over-Voltage Record 120V Models Definition 208/230V Models Power Outage Event Definition Surge Event Definition Load Rating Specification 15 Amps at 120 Volts 20 Amps at 120 Volts 30 Amps at 120 Volts 30 Amps at 120/230 Volts Split Phase 2 x 30 Amps at 120/230 Volts Split Phase 330V All Modes Pending 800V Line-Line 500V Line-Ground > 30 dB 80kHz – 50MHz > 30 dB 70kHz – 50MHz > 30 dB 200 kHz – 50MHz 4 Watts 6 Watts Adjustable from 80V to 95 V, or Disabled. Restores at 105V. Adjustable from 140V to 170 V, or Disabled. Restores at 190V. Adjustable from 135V to 160V. Restores at 130V. Adjustable from 260V to 300V. Restores at 250V. 60 Events with timestamp; 999 counts of each event type ± 2.5% ± 2% Typical product accuracy between 40V and 180V ± 2% Typical product accuracy between 100V and 300V 100 msec 150 msec AC Voltage has dropped below 100V AC Voltage has dropped below 180V AC Voltage has risen above 135V AC Voltage has risen above 260V AC Voltage has dropped below 20V Surge + Diagnostic has been exposed to a transient voltage in one of the 3 possible modes (between Live and Neutral, between Live and Ground, between Neutral and Ground) with a peak amplitude of 500V-700V* or higher and a frequency of 20 kHz or higher. *500V-700V surge voltage amplitude applies to IEEE C62.41 Category B Impulse; surge voltage amplitudes necessary for detection of other surge types may vary. © 2013 SurgeX / Electronic Systems Protection, Inc. / Technical Support 800.645.9721 / www.surgex.com / 25 User Manual 6. Specifications (cont’d) Parameter Computer Requirements Dimensions Weight Temperature Range Humidity Range Agency Listings SX-HS-15-R SX-HS-20-R SX-HS-L530-R SX-HS-L630-R SX-HS-L630-RDB SX-HS-15-R SX-HS-20-R SX-HS-L530-R SX-HS-L630-R SX-HS-L630-RDB SX-HS-15-R SX-HS-20-R SX-HS-L530-R SX-HS-L630-R SX-HS-L630-RDB Specification For use with Surge + Diagnostic Diagnostic Software. Minimum 133MHz Pentium processor (or equivalent), minimum 64MB of RAM, minimum 10MB free hard drive space, VGA or higher resolution monitor, keyboard, mouse, minimum screen resolution of 1024x768, Microsoft Windows XP/Vista/7/8. 17.44” W x 12.08” D x 1.71” H (1 RU) 17.44” W x 12.08” D x 3.300” H (2 RU) 16.548” W x 10.670” D x 3.300” H (2 RU) 16.548” W x 17.000” D x 3.300” H (2 RU) 12 lbs. 14 lbs. 15 lbs. 25 lbs. 5C to 35C 5% to 95% R.H. Non-condensing ETL Certified to UL 1449 3rd Edition ETL Certified to UL 1283 5th Edition ETL Certified to CSA 22.2 No. 8-M1986 (R2008) ETL Certified to UL 1449 3rd Edition (Pending) ETL Certified to CSA C22.2 No. 8-M1986 (R2008) (Pending) ETL Certified to UL 1449 3rd Edition ETL Certified to CSA C22.2 No. 8-M1986 (R2008) ETL Certified to UL 1449 3rd Edition ETL Certified to CSA C22.2 No. 8-M1986 (R2008) ** Specifications subject to change without notice ** All listed specifications obtained at an ambient temperature of 25°C © 2013 SurgeX / Electronic Systems Protection, Inc. / Technical Support 800.645.9721 / www.surgex.com / 26